1. Introduction
The issue of global water resource scarcity is becoming increasingly severe, making the assessment and management of water conservation function as a crucial area of ecosystem research. The water conservation functions in the ecological barrier areas of the Yangtze River Basin, a significant water source region in China and globally, directly affect the water resource security of downstream regions. The water conservation functions of the Yangtze River Basin refer to the critical ecosystem services within the basin, including water retention, ecological regulation, and pollutant purification. However, the ecological environment of the Yangtze River Basin is under multiple pressures, including climate change, land use changes, and intensified human activities, leading to an increasingly complex spatial pattern of water conservation functions. Currently, research on the water conservation functions of the Yangtze River Basin remains relatively fragmented, lacking systematic and comprehensive studies. Therefore, effectively assessing and predicting the spatiotemporal changes in water conservation functions has become a hotspot in ecohydrology research.
Zhang [
1] has explored the application of ecosystem service flows in water security assessments. He [
2] studied the cumulative effects of watershed ecological compensation. Mengist [
3] examined the response of soil- and water-related ecosystem services to landscape dynamics in the biodiversity hotspot of the Afromontane region in East Africa. Gao [
4] conducted a study on the spatiotemporal heterogeneity of water conservation. Chen [
5] investigated the spatiotemporal impacts of green space morphological patterns on surface temperature. Liu [
6] carried out spatial optimization of land ecosystem services in ecologically fragile areas. Yuan [
7] validated the spatiotemporal characteristics and driving factors of ecosystem service interactions in the Dongting Lake Basin. Wang [
8] researched the driving mechanisms of land use and landscape patterns due to ecological restoration projects in the mountainous regions of Guizhou. Wang [
9] also studied the impact of human activities and land use on ecosystem services in the mountainous regions of Guizhou. Liu [
10] explored the spatiotemporal evolution of ecological environmental quality and its dynamic relationship with landscape patterns in the Zhengzhou metropolitan area. Zhong [
11] researched the spatiotemporal patterns of embodied carbon emissions in steel stocks along the Belt and Road countries. Wu [
12] studied the spatiotemporal patterns of glacier mass balance in the interior regions of the Tibetan Plateau over the past 40 years. Mao [
13] investigated the spatiotemporal changes and trade-off synergistic relationships of ecosystem services under ecological water replenishment in Baiyangdian Lake. Yi [
14] researched the spatiotemporal changes in plankton communities in different water bodies of the Yellow River. Zeng [
15] studied the scale effects and differential mechanisms of ecosystem service trade-offs and synergies in the Lishui River Basin.
Fractal theory, as a mathematical tool for analyzing the complexity of natural phenomena, has increasingly been applied in ecosystem research in recent years. Based on a multiscale perspective and the concept of self-similarity, it effectively captures the complex spatial structure characteristics of ecosystems. The introduction of fractal theory provides new ideas for understanding and simulating spatial patterns of water conservation. In terms of applying fractal theory, some scholars have successfully used it to assess the visual complexity of the built environment using a method based on fractal dimension, demonstrating its effectiveness in image analysis. Ma [
16] applied fractal dimension to measure heterogeneity in visual complexity. Chen [
17] utilized fractal theory for mineralization prediction in the Duobaoshan area of Heilongjiang. Lv [
18] researched the relationship between soil structure and hydrological characteristics in the permafrost regions of the Tibetan Plateau. Moreover, several studies have shown that climate change and human activities profoundly impact the dynamic changes in ecosystem services related to water resources.
At the same time, modeling methods have become increasingly sophisticated in ecohydrology research. The InVEST model (Integrated Valuation of Ecosystem Services and Tradeoffs), as a spatially explicit tool for ecosystem service assessment, can quantify and map the spatial distribution of ecosystem services such as water conservation, soil retention, and carbon storage. It relies on the integration of multi-source data, offering high flexibility and applicability. The SWAT (Soil and Water Assessment Tool) model, known for its powerful hydrological process simulation capabilities, is widely used for watershed-scale hydrological assessments. Coupling with machine learning methods, such as the BiLSTM (Bidirectional Long Short-Term Memory model), can further enhance the model’s predictive accuracy and spatiotemporal dynamic simulation capabilities. For instance, Liu [
19] studied the impact of land use changes on watershed runoff by coupling the SWAT and BiLSTM models. This combination not only aids in capturing complex nonlinear hydrological processes, but also potentially offers real-time dynamic assessments of water conservation functions. In China, research on water conservation often focuses on large river basins like the Yangtze and Yellow Rivers. Researchers widely use the InVEST model to evaluate the impact of land use changes on water conservation capacity. An [
20] improved the dynamic vegetation growth module for eco-hydrological simulation. Ersoy Mirici [
21] assessed the economic valuation of terrestrial carbon dynamics and ecosystem services in the Mediterranean region. Particularly in the Yangtze River Basin, field observations and numerical simulations have revealed the regulatory effects of different land cover types on water resources. Additionally, the SWAT model is extensively used for simulating watershed hydrological processes. Nie [
22] used the SWAT model to study the asymmetry of blue and green water changes in the Yangtze River Basin. Perera [
23] employed the SWAT model to investigate the hydrological response to land use changes in tropical watersheds in Sri Lanka. Li [
24] analyzed the spatial variation in ecological environmental quality in the Min River Basin using species distribution models. The integration of the latest machine learning algorithms, such as BiLSTM, has improved model accuracy. For example, Yao [
25] researched the dynamics of ecosystem services in the Hainan Tropical Rainforest National Park. Shrestha [
26] evaluated ecosystem service values in the Eastern Himalayas. Long [
27] assessed soil and water conservation using an improved SWAT-Terrace model. Qi [
28] evaluated water resource vulnerability using an enhanced SWAT+ model. Lee [
29] compared the efficiency of the SWAT model and deep learning models in nitrate load estimation. Karki [
30] utilized the SWAT-3PG model to simulate hydrological and water quality processes in forested watersheds. Ding [
31] examined the impact of land use changes on water resource protection in the Songhua River Basin. Jiang [
32] integrated WRF model precipitation data into the SWAT model to improve hydrological simulations. Zhou [
33] studied the seasonal changes in ecosystem services in the Guanting Reservoir Basin. Lei [
34] conducted sensitivity analysis of flow and water quality using the SWAT model with uncertainty generated by the SoLIM model. Li [
35] predicted atmospheric particulate matter concentration using a BWO-BiLSTM and CNN composite model. Ma [
36] conducted EHA degradation prediction using a CNN-BiLSTM-attention-based model. Ghannam [
37] compared deep learning methods for predicting short-term urban water demand. Li [
38] performed multi-step lake level predictions using deep learning models. Wang [
39] used an improved attention mechanism for dissolved oxygen depletion prediction in Chaohu Lake. Wu [
40] developed a novel hybrid prediction model for forecasting precipitable water vapor. Bi [
41] utilized a bidirectional LSTM model with attention mechanisms for water quality prediction. Jamshidzadeh [
42] proposed a new model for predicting water quality parameters. Raj [
43] employed a CNN-BiLSTM model for predicting significant wave heights in Australia. Lei [
44] used an evolution deep learning model based on BiLSTM for building energy consumption prediction.
In the study of the Min River Basin, scholars have revealed the spatiotemporal dynamics of water conservation services in the basin through complex hydrological simulations and climate model analysis. Zhang [
45] explored the effects of forest harvesting and climate variability on runoff in the upper Min River Basin. Zheng [
46] investigated the spatiotemporal variations in water cycle components in the Min River Basin. Ding [
47] used dynamic time warping algorithms to assess the stability of ecosystems in the Min River Basin. However, domestic research primarily focuses on watershed scales, lacking integrated analysis across multiple scales. Internationally, studies on major river basins such as the Amazon and the Mississippi have revealed the profound impacts of climate change and human activities on water conservation. Foreign scholars utilize models such as InVEST and SWAT, combined with advanced remote sensing technologies and GIS analytical tools, to conduct multi-scale ecosystem service assessments. For instance, the InVEST model is widely used to evaluate ecosystem service functions, with both domestic and international scholars employing it for assessing the ecological impacts of land use changes, achieving significant results. Simultaneously, the SWAT model, as a powerful hydrological model, is capable of detailed simulation of hydrological processes within a basin, offering unique advantages in understanding the spatiotemporal patterns of hydrological processes for water conservation. Many studies focus on analyzing the impacts of spatiotemporal patterns of water conservation using these models. These advancements not only enrich academic research, but also provide scientific support and practical guidance for global climate change response strategies. Despite these numerous advancements, the current study still has some shortcomings. Firstly, in terms of multi-scale integration, existing studies often emphasize single-scale analysis, neglecting the interactions between different scales. Secondly, the ability for dynamic prediction is limited, especially when addressing uncertainties brought by future climate and land use changes, where the accuracy of model predictions needs improvement. Additionally, although fractal theory has been applied in ecological research, its application in water conservation function analysis is still in the early stages, requiring further exploration.
This study fills an academic gap in the research on the water conservation functions of the Yangtze River Basin, which has previously been fragmented and lacking in systematic and comprehensive analyses. By employing a multi-model approach, it offers a comprehensive evaluation of the spatiotemporal variations in water conservation functions. This study aims to integrate fractal theory with the InVEST and SWAT-BiLSTM models to analyze the spatiotemporal patterns of water conservation functions in the MRB. Firstly, fractal theory will be used to analyze the topography and land use patterns of the MRB to understand the mechanisms affecting its water conservation functions. Secondly, the InVEST model will be applied to evaluate the spatial distribution characteristics of water conservation under different land use scenarios. Finally, in combination with the SWAT-BiLSTM model, this study will simulate the hydrological dynamic processes of the MRB to predict changes in water conservation functions under future climate and land use change scenarios.
Through this research, we aim to reveal the spatiotemporal variations in water conservation functions in the MRB and explore the key driving factors influencing these changes. This will not only deepen the understanding of ecosystem services in the MRB but also provide scientific support for the construction of ecological barriers and sustainable development in the Yangtze River Basin. The multi-model approach integrating fractal theory is an effective way to enhance the spatiotemporal simulation accuracy of water conservation functions and has broad application potential.
2. Study Area and Data Sources
2.1. Study Area
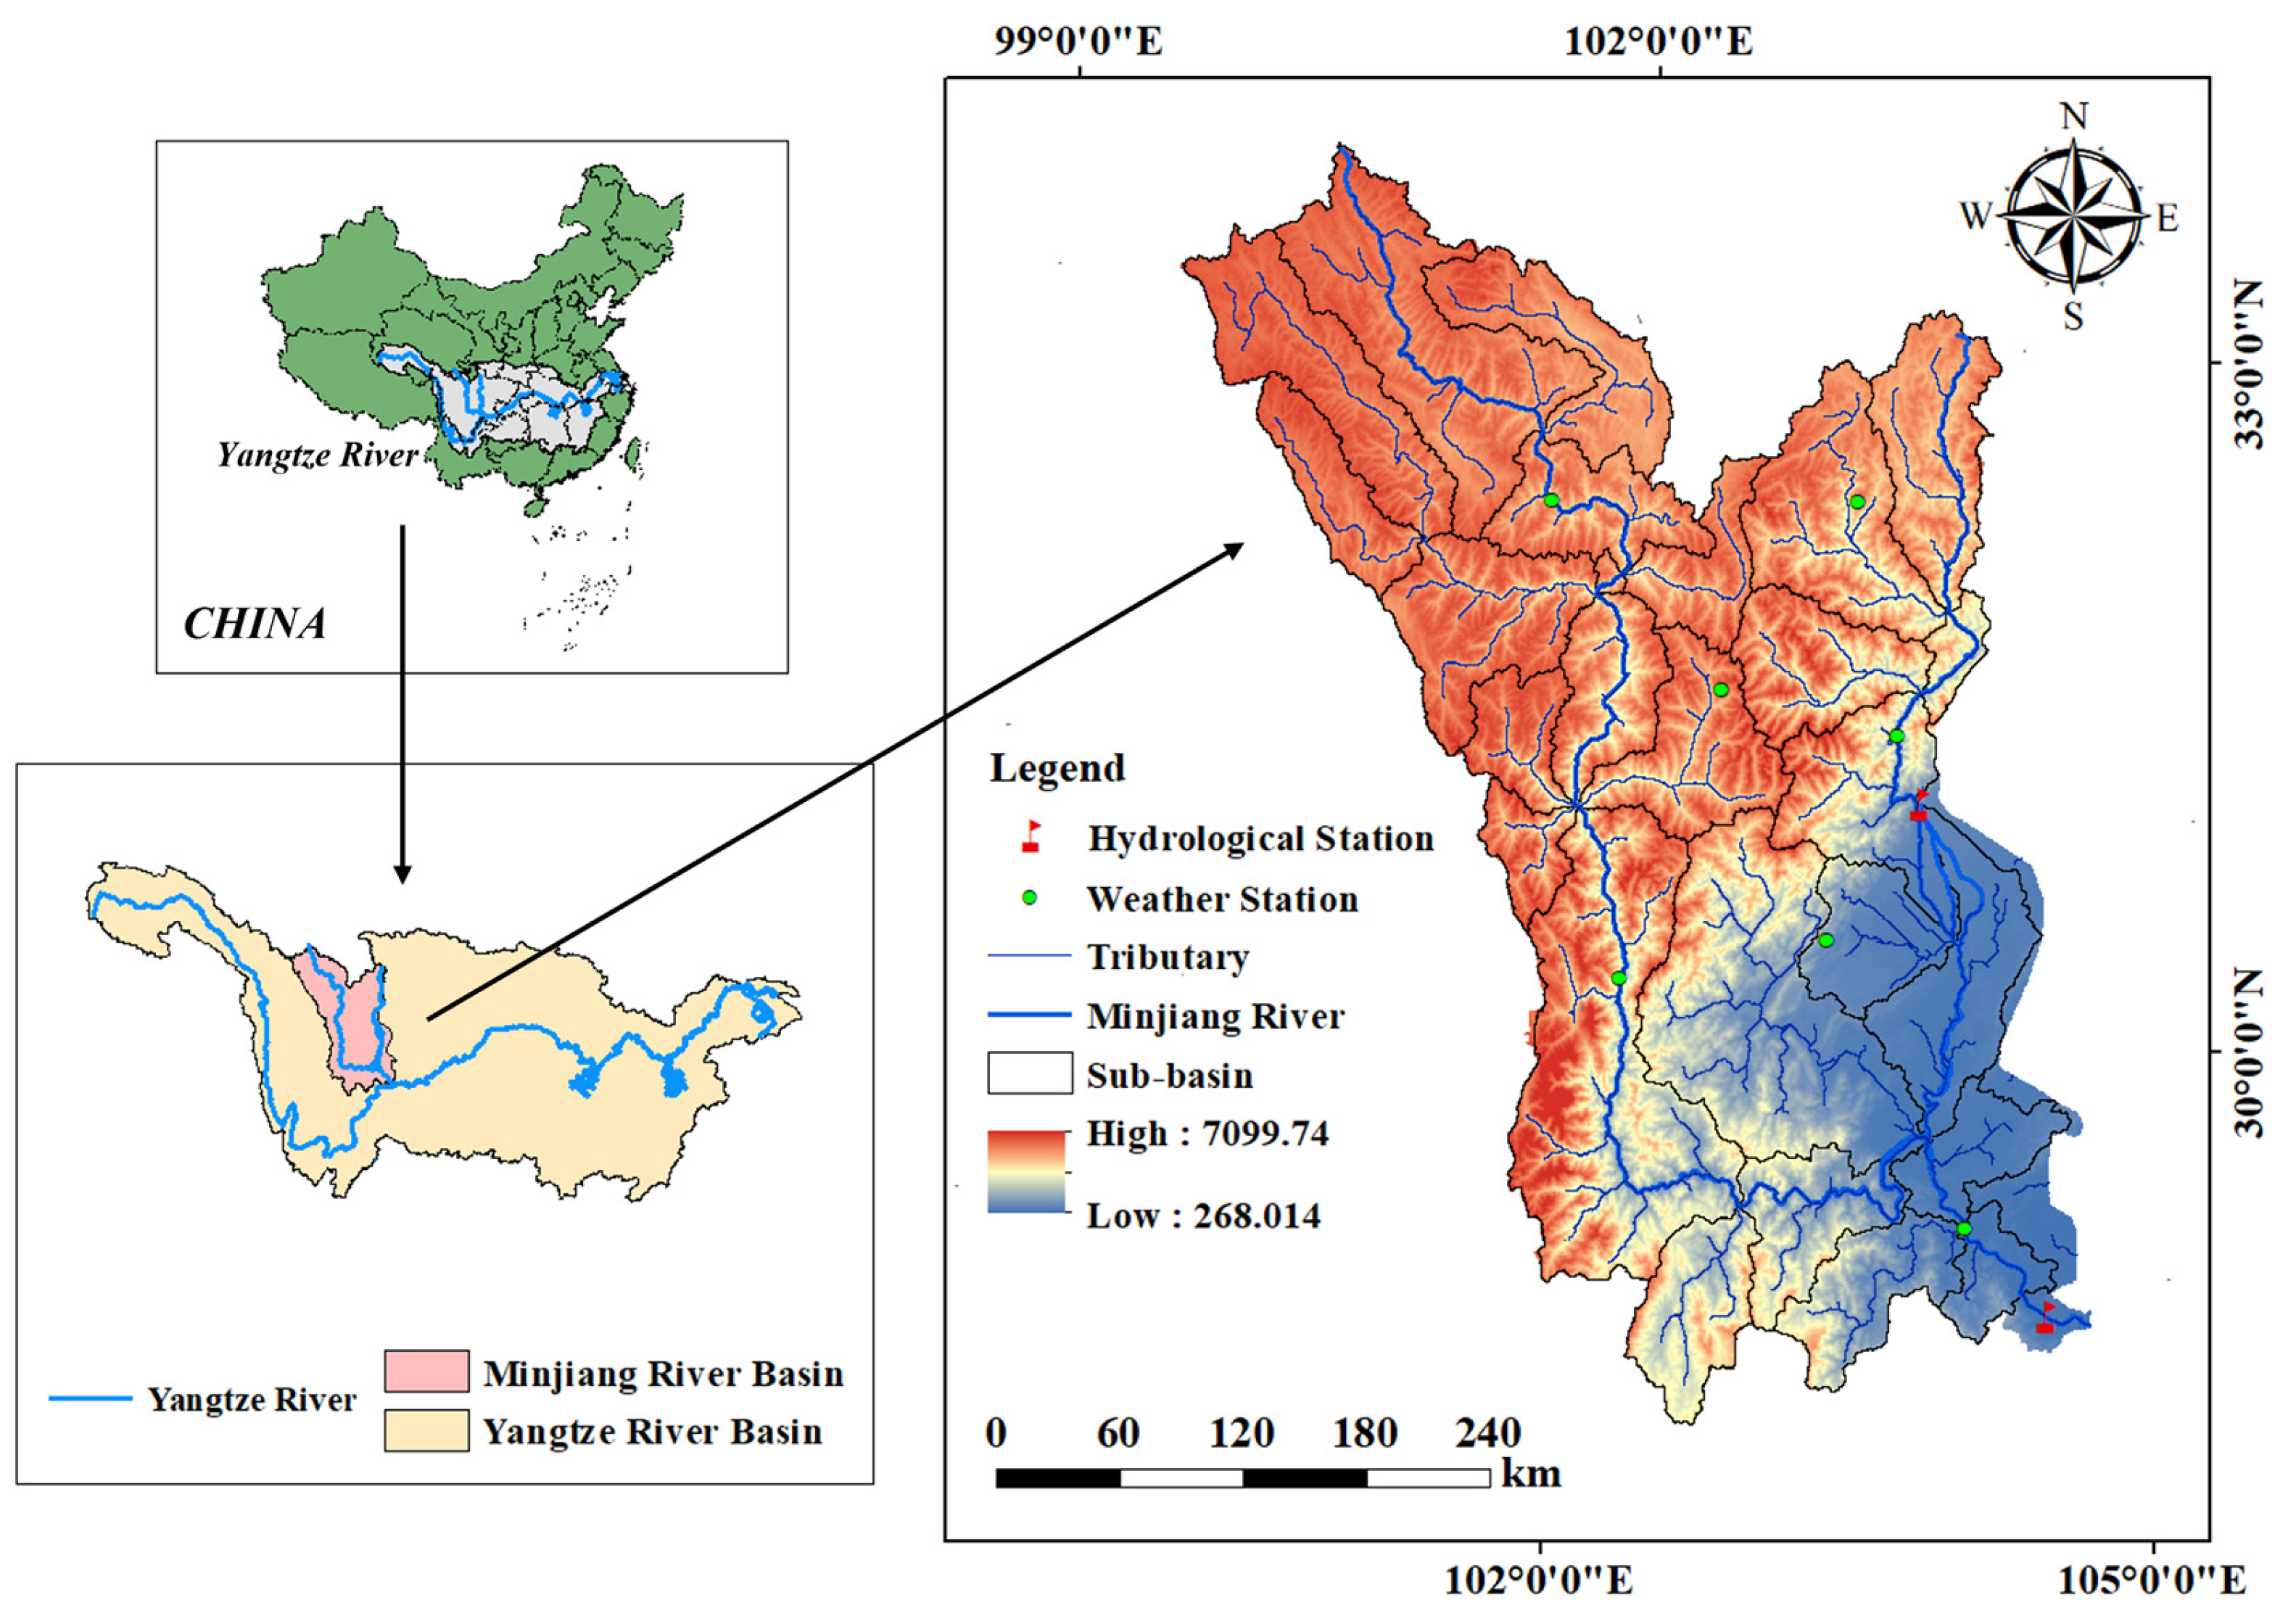
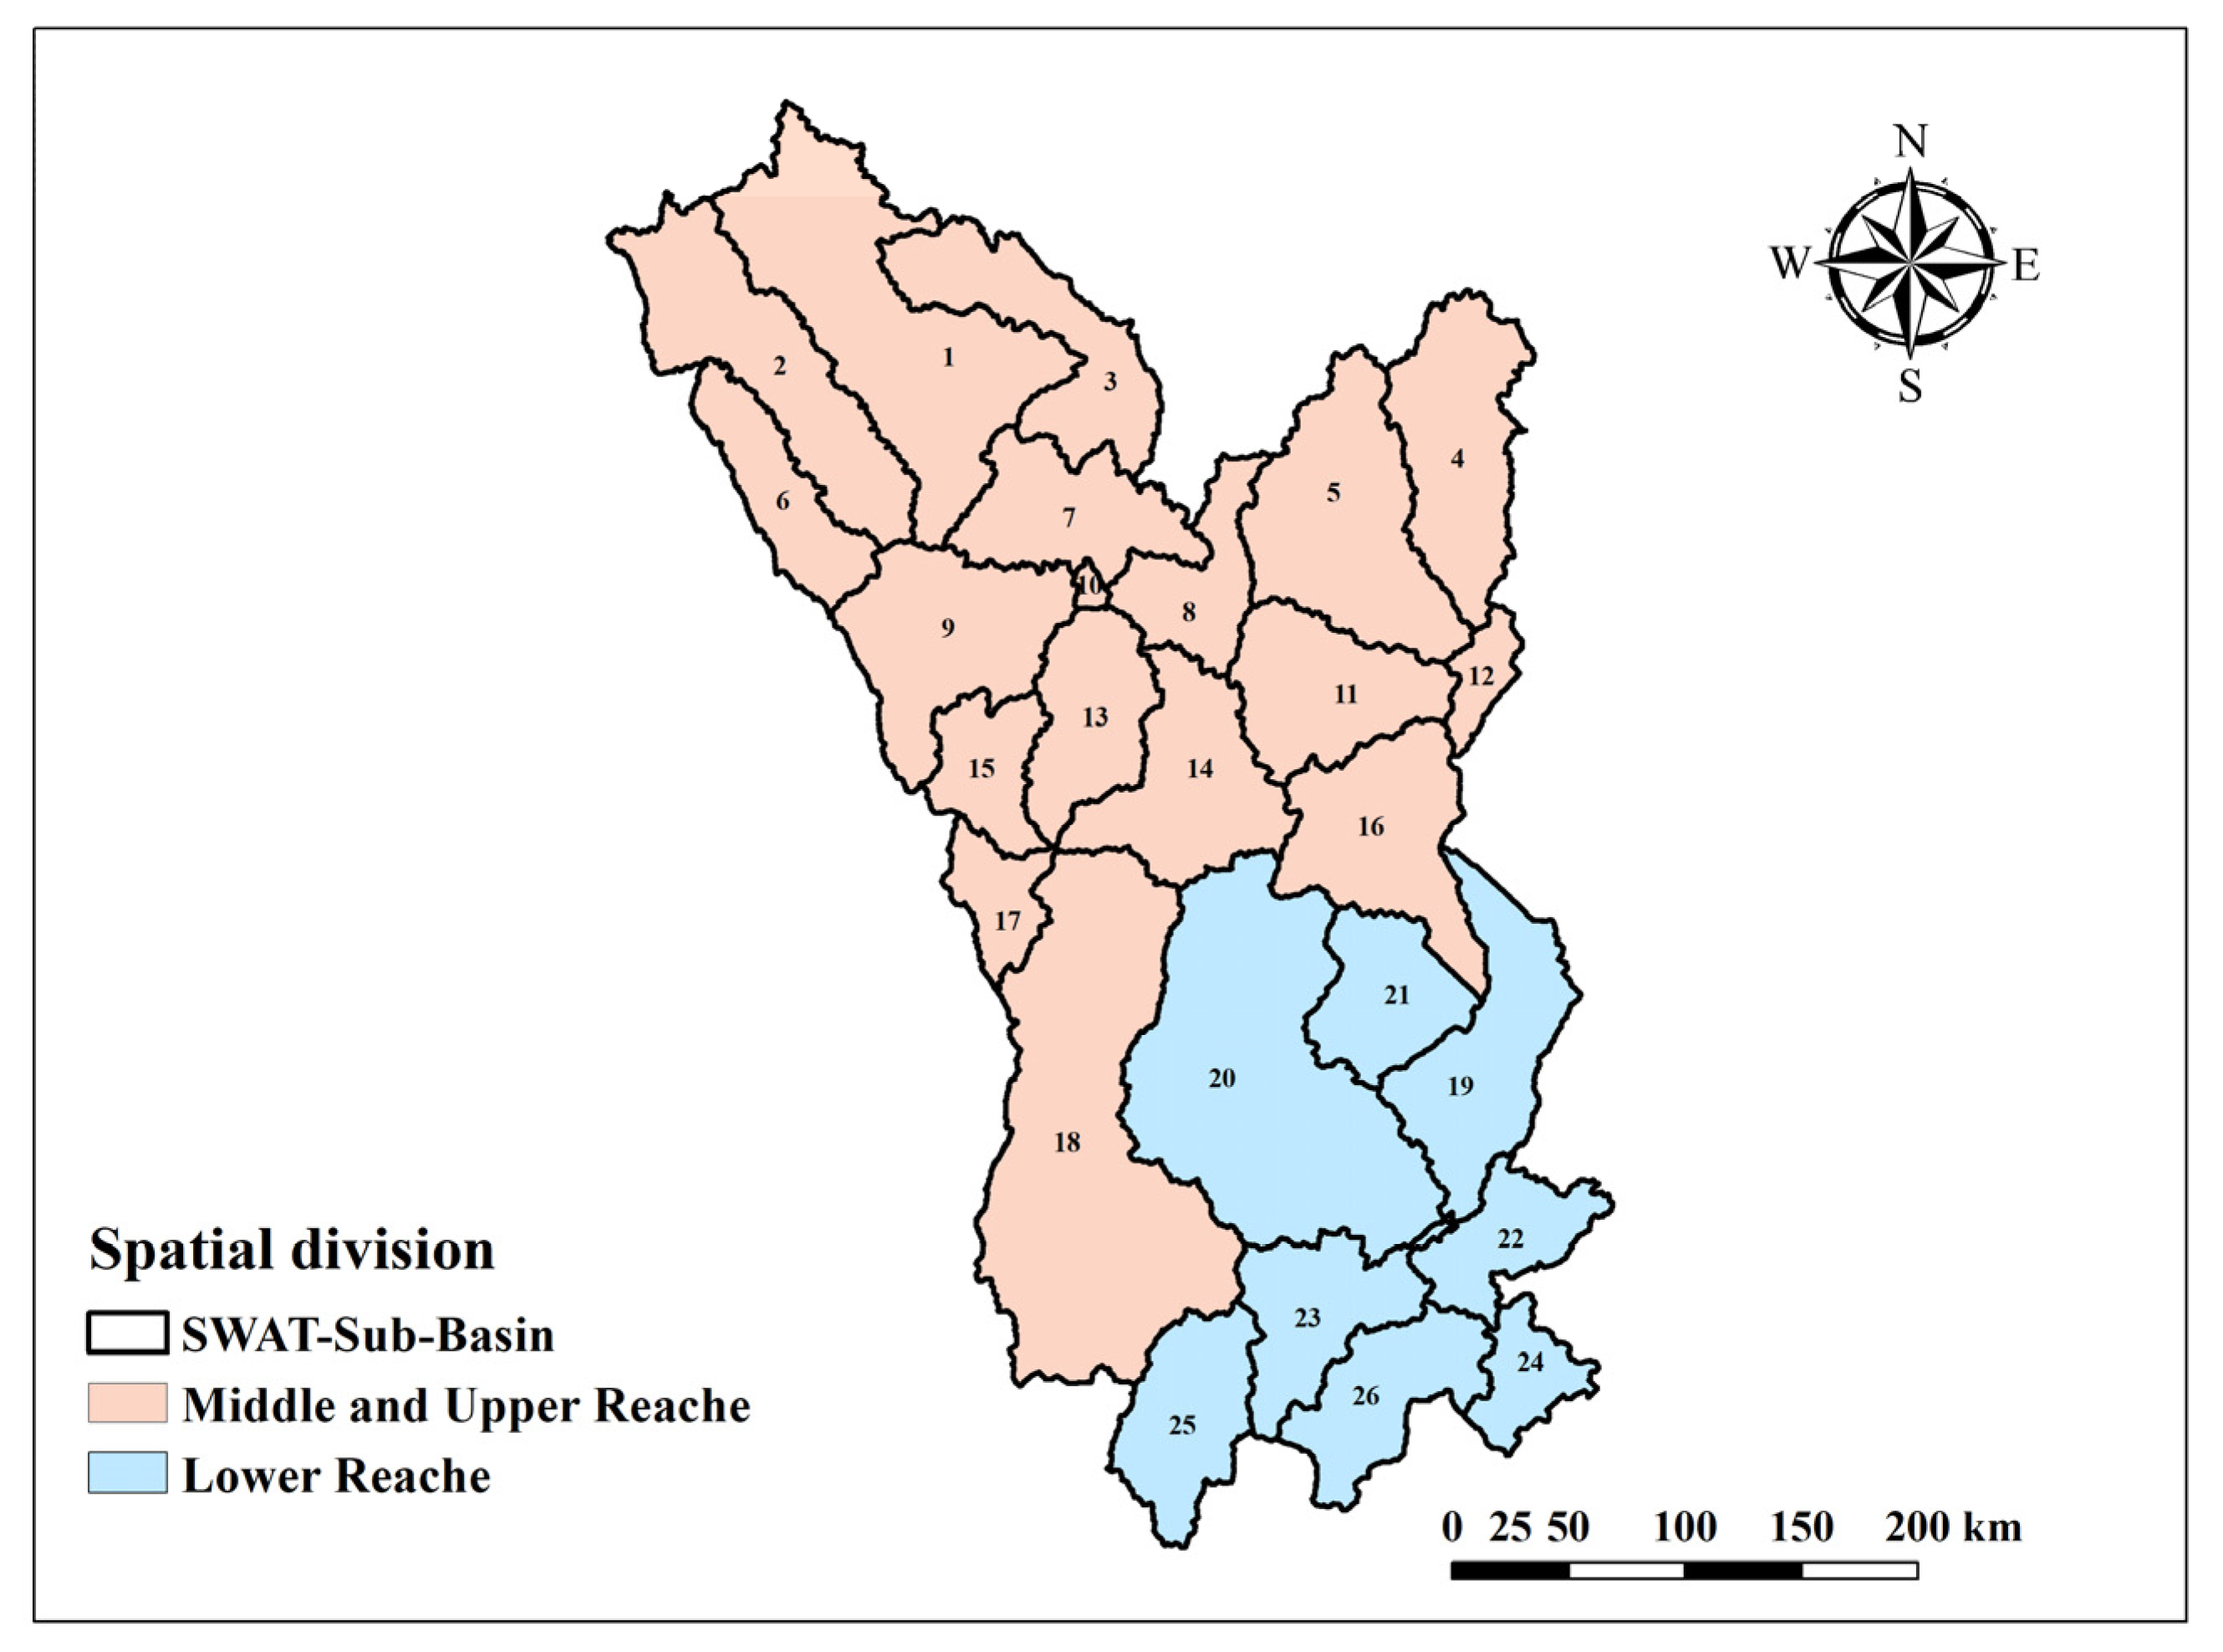
The MRB is located in the southwestern part of Sichuan Province, China (99°42′–104°40′ E, 28°20′–33°38′ N), and is one of the major tributaries of the upper Yangtze River (
Figure 1). Covering a total area of approximately 137,000 square kilometers, the basin extends from the northwest to the southeast, spanning several administrative regions including Zoigê County, the Aba Tibetan and Qiang Autonomous Prefecture, Chengdu, and Meishan. The Minjiang River, with a total length of 735 km, originates from the Min Mountains at the eastern edge of the Tibetan Plateau and flows into the Yangtze River, serving as an important ecological barrier and water source area for the Yangtze River Basin. The climate within the basin is diverse, including plateau, mountainous, and basin climates. The upper reaches of the basin experience cold weather, with relatively low annual average temperatures and uneven precipitation distribution. In contrast, the middle and lower reaches feature a subtropical humid monsoon climate, with an average annual temperature of around 15 °C and annual precipitation exceeding 1000 mm, primarily concentrated in the summer. The ecosystem in the basin varies, with rich flora and fauna resources, making it highly valuable for biodiversity conservation.
Furthermore, as a significant sub-basin of the upper Yangtze River, the MRB, with its unique geographical and climatic conditions, serves as an ideal region for researching water conservation functions. The basin boasts a well-developed water system with numerous tributaries and abundant water resources, playing a crucial role in ensuring water supply for regional agriculture, industry, and urban life. As one of the key economic zones in Sichuan Province, the MRB has a high level of economic development with a diverse industrial structure. It is not only an essential water source for Sichuan Province but also a critical ecological safeguard for the upper Yangtze River. However, in recent years, with the accelerated pace of urbanization, the population density in the MRB has continued to increase, posing severe ecological issues such as soil erosion, ecological degradation, and the unreasonable use of water resources.
As an integral part of the upper Yangtze River, the ecological environment and water resource conditions of the MRB significantly impact the entire Yangtze River Basin. Therefore, analyzing the spatial and temporal patterns of the water conservation function in the MRB can provide a scientific basis for ecological protection and sustainable development in the region. It also aids in understanding the impact of land use changes on the carbon cycle on a larger scale. Such analysis can offer valuable insights for regional ecological management and policy-making, contributing to the formulation of ecological protection strategies for both the MRB and the upper Yangtze River region.
2.2. Data Sources
To elucidate the spatiotemporal variations in the water conservation functions of the MRB and to explore the key driving factors influencing these changes, this study integrates multiple data sources and employs both the InVEST and SWAT models, collaboratively. The primary data sources are listed in
Table 1 (the missing values were handled using the mean imputation method).
- (1)
Land Use Data
The data were sourced from the 30 m land use dataset by Wuhan University’s CLCD. Based on the actual conditions of the study area and in accordance with the national ecosystem classification standards at levels I, II, and III, the ecosystem types were delineated (
Table 2). This study selects the level I classification, which is used for model calculations after field survey and corrections. The land use codes and relevant physical parameters for the InVEST and SWAT models are provided in
Table 2.
- (2)
Watershed and Sub-Watershed Boundaries
The watershed and sub-watershed boundaries were delineated using the DEM data and river vector data of the study area, processed through the SWAT model, and ultimately utilized in the model computations.
- (3)
DEM
The DEM data used in this study have a resolution of 10 m × 10 m, obtained from the Data Center for Resources and Environmental Sciences, Chinese Academy of Sciences.
- (4)
Meteorological Data
This study selects daily meteorological data with a spatial resolution of 0.25° from the V1.1 version of the China Atmospheric Assimilation Driving Datasets for the period of 2008–2016 as input for the SWAT and InVEST models. The SWAT model directly incorporated all meteorological data from the dataset, including daily maximum/minimum temperature, daily cumulative precipitation, daily average solar radiation, daily specific humidity, daily relative humidity, and daily average wind speed. The InVEST model used a subset of the CMADS driving data. Precipitation data were used to compute the multi-year average precipitation at each site, and temperature data were simulated using a mountain climate model to obtain temperature data at different elevation levels. Potential evapotranspiration for each site was calculated using the modified Hargreaves method, as recommended in the model guidance manual. Finally, ANUSPLIN software (Version 4.4), which is specialized in meteorological data interpolation, was used to interpolate the meteorological data, which were then input into the InVEST model.
- (5)
Soil Data
Both the SWAT and InVEST models utilized soil data from the Harmonized World Soil Database (HWSD).
- (6)
Plant Available Water Content
Plant available water content (PAWC) refers to the proportion of water available for plant growth within the soil layers. PAWC is expressed as a decimal between 0 and 1. It is calculated based on the content of sand, silt, clay, and organic matter. The calculation method is as follows:
In this equation, MaxSoilDepth
x represents the maximum soil depth; RootDepth
x denotes the root depth; and PAWC
X stands for the plant available water capacity, which is calculated based on the formula for soil texture:
In the formula, sand represents the soil sand content (%); silt represents the soil silt content (%); clay represents the soil clay content (%); and OM represents the soil organic matter content (%).
- (7)
Crop Coefficient Kc
The plant evapotranspiration coefficient for each type of land use was assigned based on the FAO-recommended crop coefficients and a review of the relevant literature.
3. Materials and Methods
3.1. Fractal Theory
Fractal theory is a mathematical framework for studying geometric shapes, primarily used to describe and analyze irregular and complex natural phenomena. It reflects the ability of fractals to fill space at different scales. Unlike traditional Euclidean dimensions, fractal dimensions can be non-integer, indicating that the extent to which an object fills space lies between two integer dimensions. Fractals are characterized by self-similarity, fractal dimension, and scale invariance. The core concept of fractals is self-similarity, meaning that parts of a structure exhibit similar morphological features to the whole, and this similarity can be observed across different spatial or temporal scales.
Fractal theory can systematically analyze the spatial structural complexity of the water conservation areas in the MRB. By calculating the fractal dimension, it is possible to quantify the heterogeneity of land cover and ecological functions. This quantification helps identify and describe the distribution characteristics of different land types, as well as the functional characteristics of ecological barrier zones. In the analysis of water conservation functions, understanding the interactions between different scales is crucial. Fractal theory provides a framework to effectively analyze how hydrological and ecological processes manifest at different scales. This multi-scale analysis can reveal how the ecological functions of a watershed change across various spatial and temporal scales.
By integrating the InVEST model and the SWAT-BiLSTM model, fractal theory can be used to optimize model parameters. Fractal analysis can identify important self-similar structures within a system, aiding in improving the predictive accuracy of models. For instance, in simulating water conservation, fractal features can be used to adjust parameters to better match actual observational data. Fractal theory helps in understanding the dynamic changes and uncertainties of ecosystems. By identifying fractal characteristics, it is possible to better assess the robustness and vulnerability of ecological functions under different environmental conditions. This has significant implications for watershed management and policy-making, providing predictions and early warnings about system change trends, and offering more comprehensive scientific support and new insights for watershed ecological and environmental protection.
3.2. Integrated Valuation of Ecosystem Services and Tradeoffs (InVEST)
The water yield module of the InVEST (Integrated Valuation of Ecosystem Services and Tradeoffs) model aims to estimate hydrological output under different land use types to support water resource management and planning. The water yield module integrates various hydrological and meteorological parameters to analyze the impact of land use changes on the hydrological cycle. The specific working principles are as follows:
Precipitation Input: The model uses raster data to input regional precipitation information, aiding in determining the total surface water formation.
Evapotranspiration: By combining potential evapotranspiration data with vegetation cover information, the model estimates evapotranspiration amounts for different land use types. It calculates water loss by considering plant transpiration and soil evaporation processes.
Soil Moisture: Utilizing data on soil depth and vegetation available water content, the model assesses water storage capacity under different soil types. This module focuses on soil water retention capacity and infiltration rates.
Surface Runoff: Based on terrain and land use types, the model simulates the surface runoff process after rainfall. It analyzes how precipitation flows on the surface and enters water bodies such as rivers and lakes.
By integrating the above parameters with land use types, the InVEST model calculates the total hydrological output for each land use scenario and generates spatial distribution maps. The model module can input spatial data, including vector data (e.g., watersheds and sub-watersheds) and raster data (e.g., rainfall, potential evapotranspiration, soil properties). This model provides a scientifically sound basis for assessing hydrological output under different land use scenarios, thereby supporting water resource management and planning.
3.3. Soil and Water Assessment Tool (SWAT)
The SWAT (Soil and Water Assessment Tool) model is a continuous-time, distributed hydrological model on a watershed scale, initially developed by the Agricultural Research Service of the United States Department of Agriculture. Its primary functions are to simulate hydrological processes, nutrient transport, and sediment loss under different land use and management practices. Specific functionalities include:
Precipitation–runoff simulation: This simulates the runoff process within a watershed using precipitation data and surface conditions. Evapotranspiration: It calculates both potential and actual evapotranspiration to simulate the water balance of the watershed. Soil moisture: This simulates the processes of infiltration, storage, and runoff of soil moisture. Streamflow: It models the flow and quality processes in rivers, including nutrient transport and sediment deposition. Land use change impact: It assesses the impact of land use changes on hydrology and water quality.
Through this model, it is possible to effectively simulate changes in hydrology and water quality under different land use scenarios, providing scientific evidence for watershed management and environmental protection.
3.4. Bidirectional Long and Short-Term Memory Model (BiLSTM)
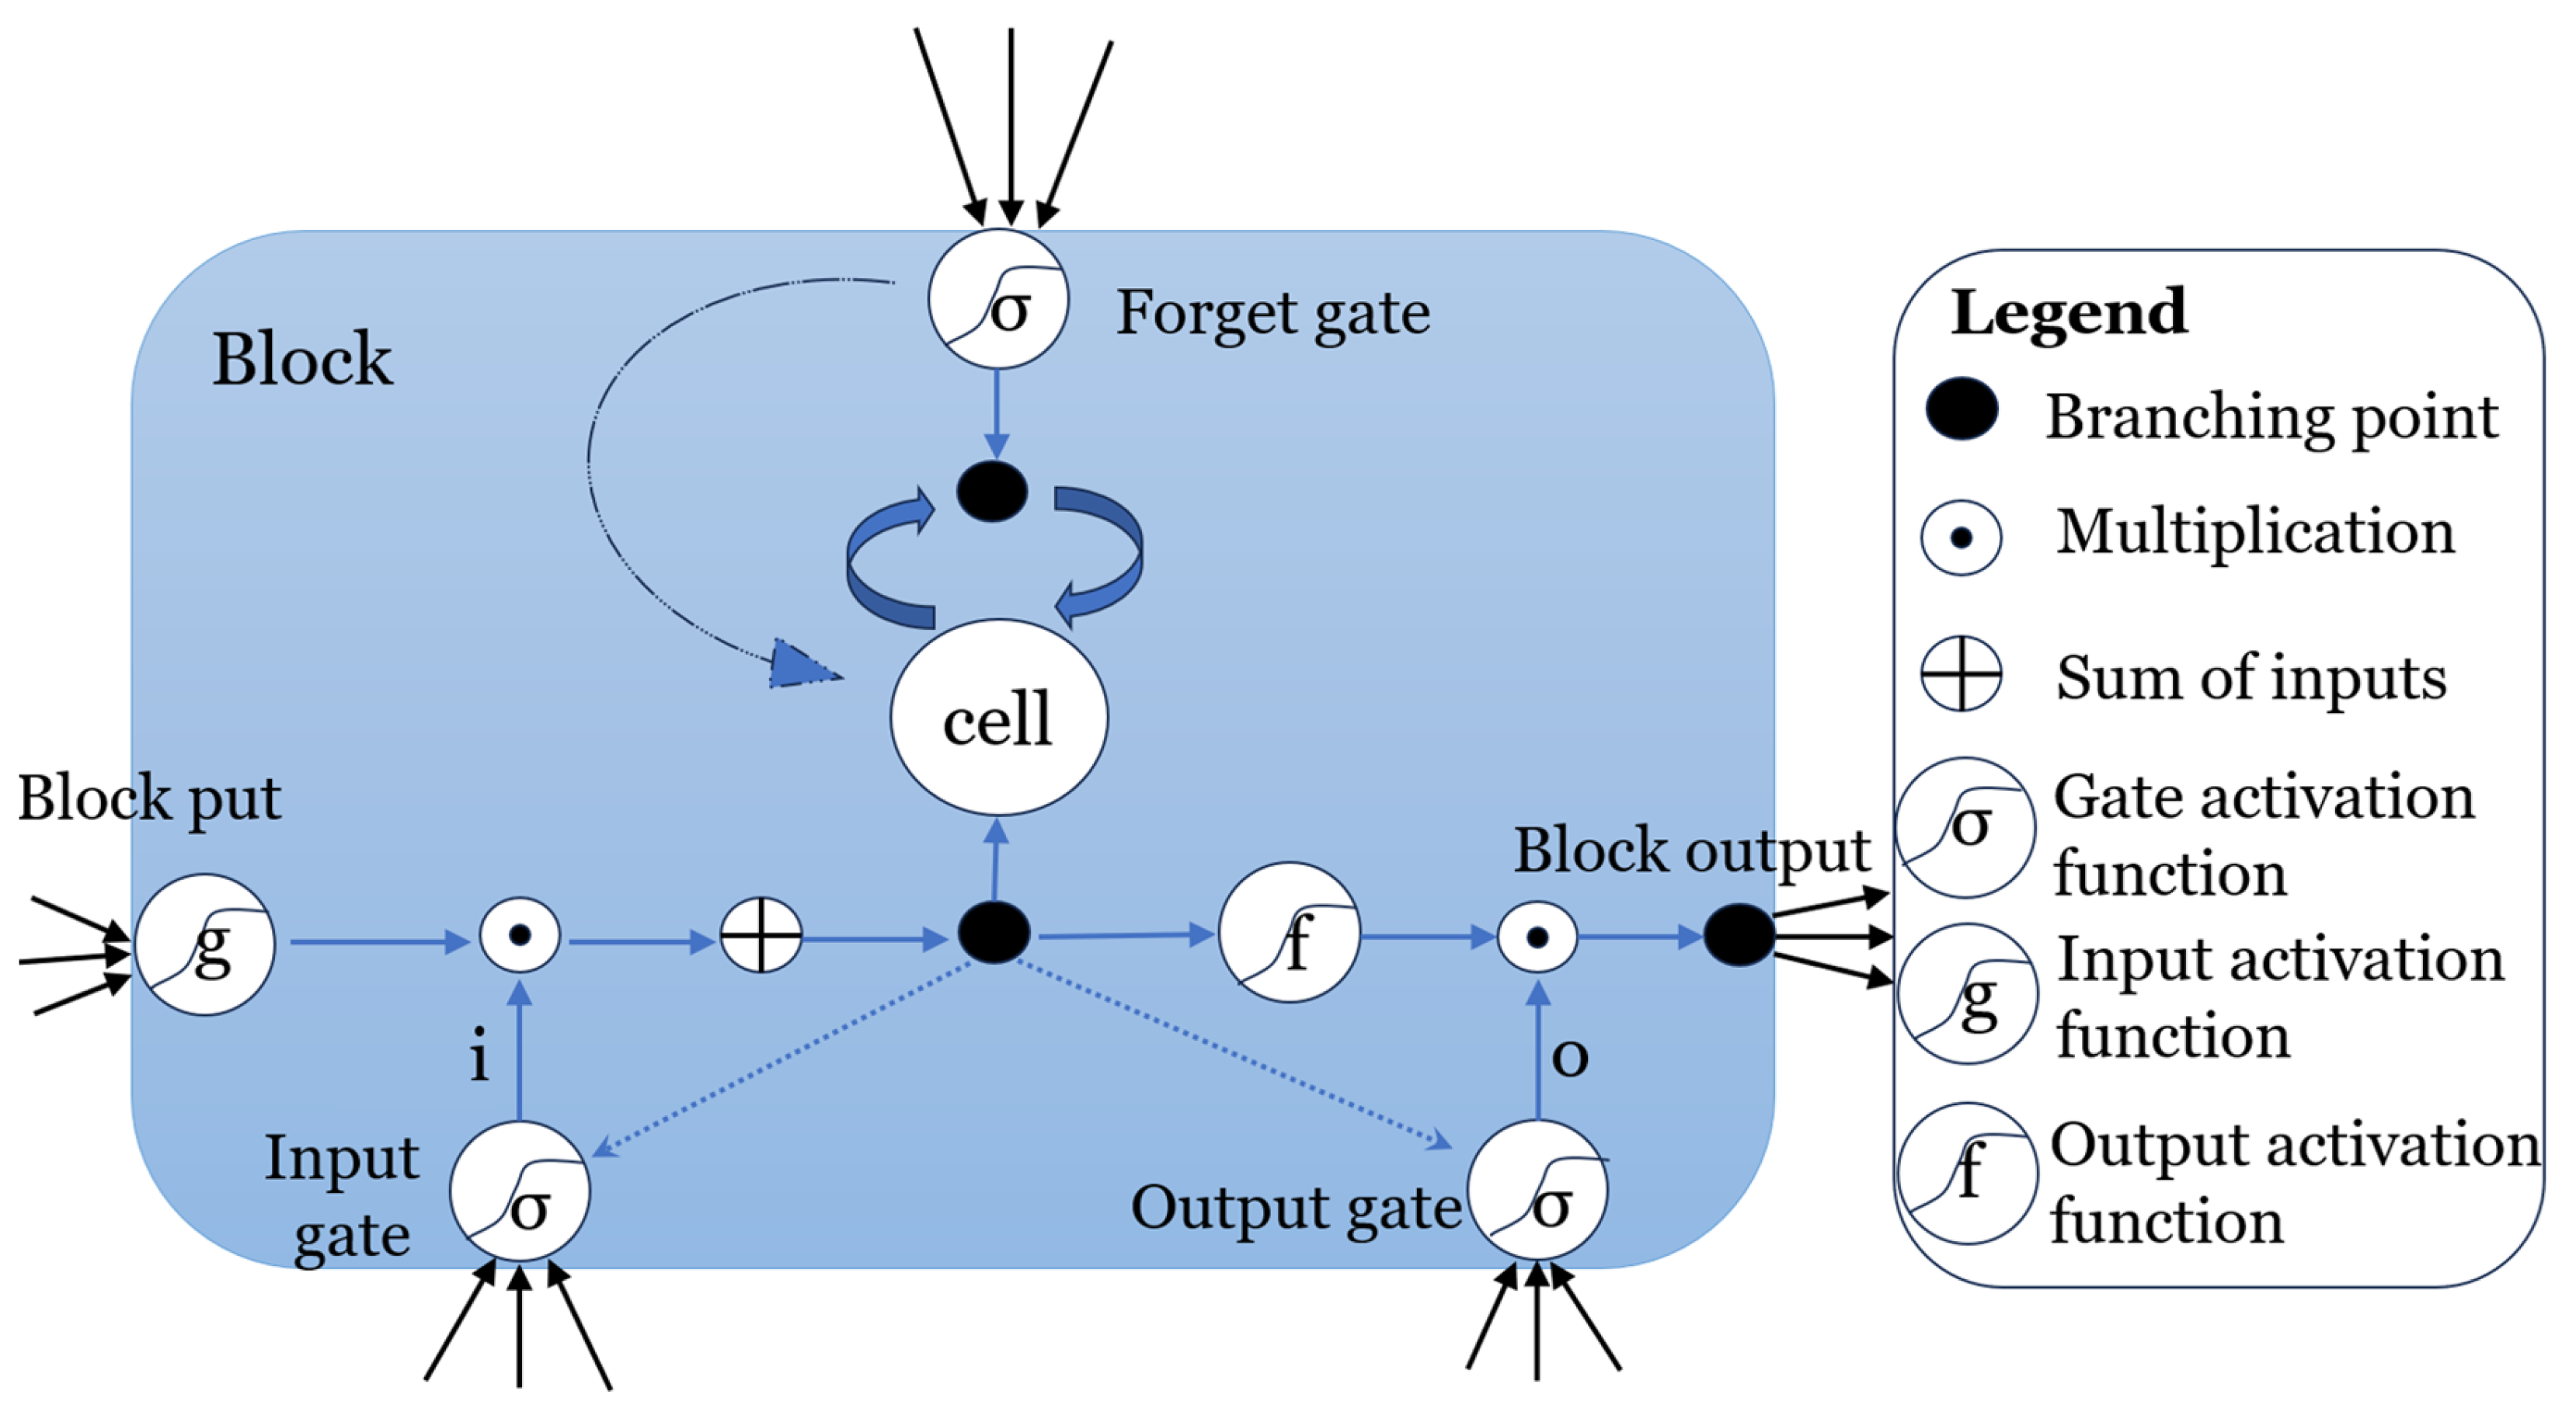
LSTM (Long Short-Term Memory Network) is an advanced deep learning model specifically designed to address the key issues encountered in traditional recurrent neural networks (RNNs), such as the vanishing and exploding gradient problems. These issues are particularly pronounced when dealing with long sequence data. The design of LSTM makes it an effective tool for handling such sequential data, for example, in language processing or time series analysis. As illustrated in
Figure 2, the key innovation of LSTM lies in its internal structure, particularly a mechanism known as “gates”, which control the flow of information. In LSTM, each neuron comprises three types of gates: the input gate, forget gate, and output gate. These gates work collaboratively to determine how to process the input information at the current time step and whether to retain or discard the information from previous time steps. Specifically:
The input gate decides which parts of the new input data are important and should be added to the internal state of the neuron. The forget gate determines which previous information is no longer important and should be removed from the neuron’s internal state. The output gate decides which information from the current neuron’s internal state should be output to the next layer or as the current output. Through this refined information processing mechanism, LSTM can effectively retain and utilize long-term dependencies, thus exhibiting excellent performance in sequence data processing.
The specific formulas for the “gate” mechanisms are as follows:
Forget gate:
Output gate:
It, ft, ot are input, forget, and output gates, respectively; ct is a memory cell; ht is the output of the neuron’s short-term memory at time t; c′t is the memory from the new input; h is a hidden vector; σ is an activation function; W is a weight matrix; b is a bias term; [M,N] is the concatenation of two vectors; and ⊙ denotes the element multiplication.
At a given moment t, a conventional long short-term memory network (LSTM) can only learn from its previous inputs. To overcome this limitation, bidirectional long short-term memory networks (BiLSTMs) have been designed, which allow information to be passed backwards and forwards at the same time by stacking two LSTMs in opposite directions. This structure is able to synthesize the backward and forward contexts of the input information at a given moment t. In particular, BiLSTM tends to outperform unidirectional LSTMs when dealing with time-series data.
3.5. Research Technology Process
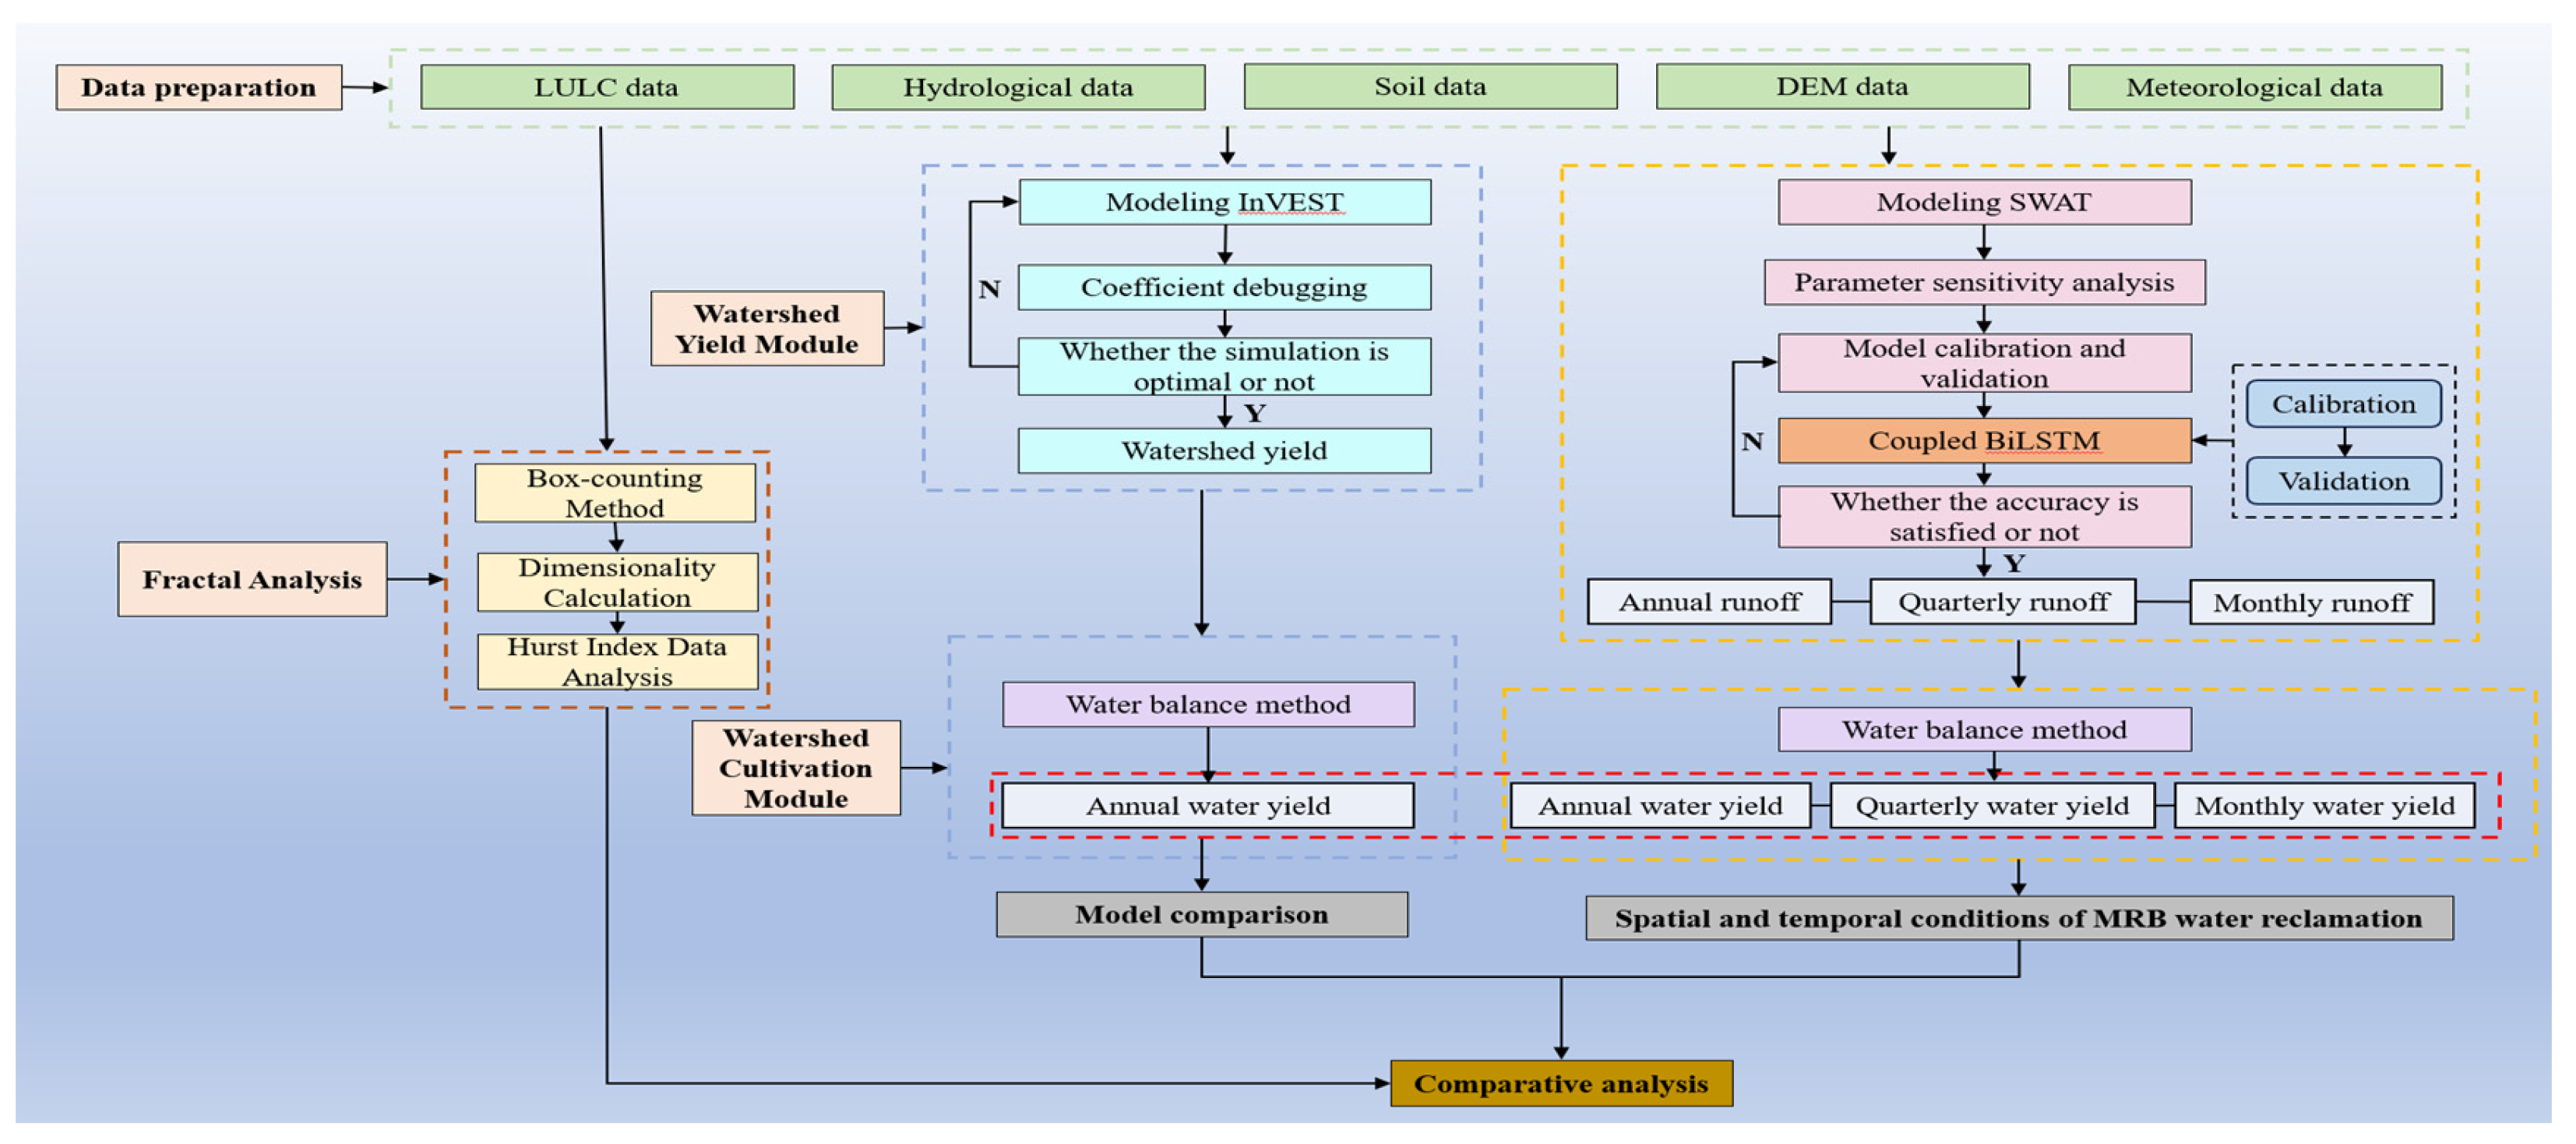
The technical process reveals the complex analysis of the spatiotemporal patterns of water conservation in the MRB, utilizing an innovative multi-model integration approach to elucidate the hydrological dynamics of the ecological barrier area.
Firstly, during the data preparation phase, land use/land cover (LULC), hydrological, soil, digital elevation model (DEM), and meteorological data were collected to lay the foundations for subsequent detailed analyses. In the basin’s water yield module, the InVEST model was employed for simulation, with coefficient adjustments ensuring optimal simulation outcomes, allowing the calculation of the key metric of water yield in the MRB.
Concurrently, through the fractal analysis module, the box-counting method was used to calculate the dimensional characteristics of the basin, and Hurst exponent data were analyzed to reveal the system’s complexity and long-term dependencies. The SWAT model was utilized for parameter sensitivity analysis and calibration validation, and its coupling with the BiLSTM model further optimized accuracy, ensuring the reliability of simulation results, thus allowing detailed assessments of annual, seasonal, and monthly runoff. The water balance method was used to calculate annual water conservation volumes, and quarterly and monthly water conservation data were generated. During the model comparison stage, the performance and accuracy of different models were analyzed.
Finally, through a comprehensive analysis of the spatiotemporal conditions of water resource reutilization in the MRB, the output results of the InVEST model and the SWAT-BiLSTM model were collaboratively analyzed with the basin’s dimensional characteristics calculated by fractal dimensions to provide scientific evidence for sustainable water resource management strategies in the Yangtze River ecological barrier area. This in-depth exploration provides a framework and direction for future research on ecological environmental protection and water conservation. The process is illustrated in
Figure 3.
3.6. Fractal Analysis and Fractal Dimension Calculation of MRB
Fractal analysis is a method used to study the spatial structures of complex geographical and ecological systems. It is particularly suitable for examining spatial heterogeneity and self-similarity characteristics within complex ecosystems, such as the MRB. First, the calculation of the fractal dimension is conducted, which is the core metric of fractal analysis and is used to quantify the spatial dimensions of complex systems. Common methods include the box-counting method and the grid method. In this study, fractal theory, the InVEST model, and the SWAT-BiLSTM model are combined to analyze the spatiotemporal patterns of water conservation in the MRB. This research involves simulation of ecological models, time series analysis, and spatial pattern analysis. Therefore, the box-counting method was chosen for spatial pattern analysis, and the Hurst exponent was used for time series data analysis. The formula is as follows:
In practical calculations, since it is not possible to actually let ϵ converge to 0, it is common to plot in logarithmic coordinates and estimate the fractal dimension by linear fitting:
Herein, D represents the fractal dimension; N is the number of boxes (grids); ϵ is the length of the box (grid) edge.
The study area was divided into grids of a certain scale. At each scale, the number of objects contained within at least one grid was calculated. Based on the variation in the number of grids at different scales, the fractal dimension was determined using logarithmic regression.
Subsequently, self-similarity analysis and spatial heterogeneity analysis were conducted. By analyzing the changes in fractal dimension, the self-similarity characteristics of different regions within the watershed were identified. Additionally, the study examines whether different ecological features within the watershed or region follow the scaling law to confirm their spatial self-similarity.
The MRB was divided into three spatial scales according to elevation and land use changes: upper and middle reaches, lower reaches, and the entire watershed. The three-dimensional fractal dimensions of the corresponding spaces were calculated. Using the fractal dimension and other spatial statistical indicators, such as the coefficient of variation, the spatial heterogeneity of the watershed was assessed. The spatial patterns of ecosystem and land use changes within the watershed were identified to reveal the potential drivers of ecological processes. The land use change is detailed in
Table 3,
Figure 4 and
Figure 5. The spatial division is shown in
Figure 6.
3.7. InVEST Model Construction and Application
The water yield module in the InVEST model, along with the sediment delivery ratio module, was utilized to evaluate the hydrological ecosystem services, specifically water conservation services. The modular design allows for a collaborative assessment of water conservation services, aiding decision-makers in better understanding the water resource supply of a watershed and providing support for ecosystem management and protection. This study primarily employs the water yield module for analysis.
The core principle of the water yield module is to determine the annual average water yield of a watershed by calculating precipitation, evapotranspiration, land use, and soil parameters. Key input parameters include precipitation data, evapotranspiration data, land use types, and soil characteristics. The module integrates these parameters and employs a hydrological model to compute the watershed’s annual average water yield. When setting the parameters and data sources for the water yield module, accurate meteorological data (precipitation and temperature), detailed land use data, and precise soil characteristics data are required. Meteorological data can usually be obtained from weather stations, while land use and soil characteristic data can be acquired using remote sensing technology or from local government agencies. To ensure the model’s accuracy and reliability, parameter calibration and sensitivity analysis are necessary. Parameter calibration involves adjusting model parameters by comparing them with actual observational data to improve the model’s fit and accuracy. Sensitivity analysis helps identify which parameters have the most significant impact on the model outputs, enhancing the understanding of model behavior and ensuring the reliability of the model assessment.
As one of the significant tributaries in the upper reaches of the Yangtze River, the Min River basin is rich in biological resources and biodiversity, playing a crucial role in regional ecosystem and biodiversity conservation. The basin has relatively comprehensive climate, topography, land use, and other data, facilitating model analysis and research. However, with increasing population density and accelerated urbanization, the Min River basin faces severe ecological issues, and there is an urgent need for effective management of water resources and ecosystems.
Initially, data such as precipitation, evaporation, land use, and soil parameters from the Min River basin (as specified in
Table 1 and
Table 2) were imported into the InVEST water yield module. The model parameters were set, and the model was run. The annual average water yield data output by the model was analyzed to explore the spatial distribution and influencing factors of water conservation services. During this process, GIS software (Version 10.7) was used to process the basin’s topographical, land use, and precipitation data to facilitate model analysis. Based on the characteristics of the Min River basin, adjustments were made to the parameters in the water yield module, such as precipitation data, evapotranspiration data, and soil parameters. The model’s accuracy was verified by comparing its results with the measured data and the SWAT-BiLSTM model outputs. The water yield mechanism is illustrated in
Figure 7.
3.8. SWAT-BiLSTM Model Coupling
First, the SWAT model was established using the new open-source Quantum Geographic Information System (QGIS 3.82) interface of SWAT (QSWAT + 2.2.5) to generate the model setup. The model domain was defined by clearly delineating the study watershed using QGIS tools. Various datasets of the watershed, including geographic information, meteorological data, land use data, soil characteristics data, and water quality monitoring data, were imported into QGIS for support. This process primarily involved spatial analysis tasks such as determining watershed boundaries, subdividing into sub-basins, and extracting the river network.
Subsequently, SWAT model parameter setting and calibration were conducted. Parameter settings were based on the collected data and actual conditions, including rainfall-runoff parameters, evapotranspiration parameters, reservoir parameters, and river flow parameters. Model calibration is crucial to minimizing the parameter uncertainty integrated into SWAT to the greatest possible extent. In this study, the SWAT Parameter Estimator (SPE) algorithm was employed for SWAT model calibration. SPE is an updated version of the Sequential Uncertainty Fitting Version 2 (SUFI-2) algorithm in the new version of the SWAT calibration and uncertainty program. Based on previous SWAT-related studies in the MRB and similar regions, 18 commonly used parameters were selected and their ranges determined, covering various aspects of runoff, groundwater flow, and soil data. Eight iterations were performed, with each iteration running 500 simulations to adjust the ranges of these parameters. The calibrated values and associated
p-values are shown in
Table 4.
Due to the unique environmental and climatic conditions of the MRB in China, it is necessary to customize these parameters. Additionally, the complexity of uncertainty issues often involves significant uncertainty when calibrating numerous SWAT model parameters. To balance model simplicity and simulation performance, only four relatively sensitive parameters are employed, which more effectively address uncertainty and enhance the model’s adaptability and accuracy. During sensitivity analysis using the built-in SWAT program, these parameters exhibit
p-values that are several orders of magnitude smaller than the rest, as shown in
Table 5.
Finally, the SWAT and BiLSTM models were coupled to leverage the strengths of both physical models and deep learning models, aiming to improve the accuracy of watershed hydrological process simulations. The time series data output from the SWAT model, along with other relevant meteorological factors, were organized into an input feature matrix. The dataset was divided into training, validation, and test sets. A BiLSTM network architecture was designed, taking into consideration the number of input features and the time steps. Appropriate configurations for LSTM layers, bidirectional mechanisms, fully connected layers, activation functions, etc., were applied. The BiLSTM model was then trained using the training set and observed flow data, with the network weights adjusted through optimization algorithms such as Adam. Finally, optimization and adjustments were carried out.
The SWAT-BiLSTM model simulation involved a warm-up period of three years (1993–1995), followed by a calibration period (1996–2015) and a validation period (2016–2023).
3.9. Model Performance Evaluation
The accuracy of model simulations is crucial in research, and the results of model calibration and validation are key to evaluating its performance. Common metrics used to assess model performance include the coefficient of determination (R
2), Nash–Sutcliffe efficiency coefficient (NSE), relative bias (RB), root mean square error (RMSE), and relative root mean square error (RSR). NSE and R
2 reflect the degree of fit between the observed and simulated values, while RMSE and RSR quantify the errors between them. RB indicates the degree of bias between the simulated and observed values. These metrics play a vital role in streamflow simulation, ensuring that the model accurately reflects observed data and maintains water balance. Model calibration and validation ensure its accuracy throughout the simulation process, meeting all relevant requirements. The formulas for calculation are as follows.
where (
) and (
) denote the observed and simulated flows, respectively; (
) and (
) are the mean values of the observed and simulated flows, respectively.
4. Results
4.1. Fractal Dimension Calculation Results
In the study of the MRB, fractal theory and land use change data were employed to conduct a thorough analysis of the spatial heterogeneity of ecosystems over different periods. The study area includes the source region of Minshan, as well as the downstream areas where the basin flows into the Yangtze River.
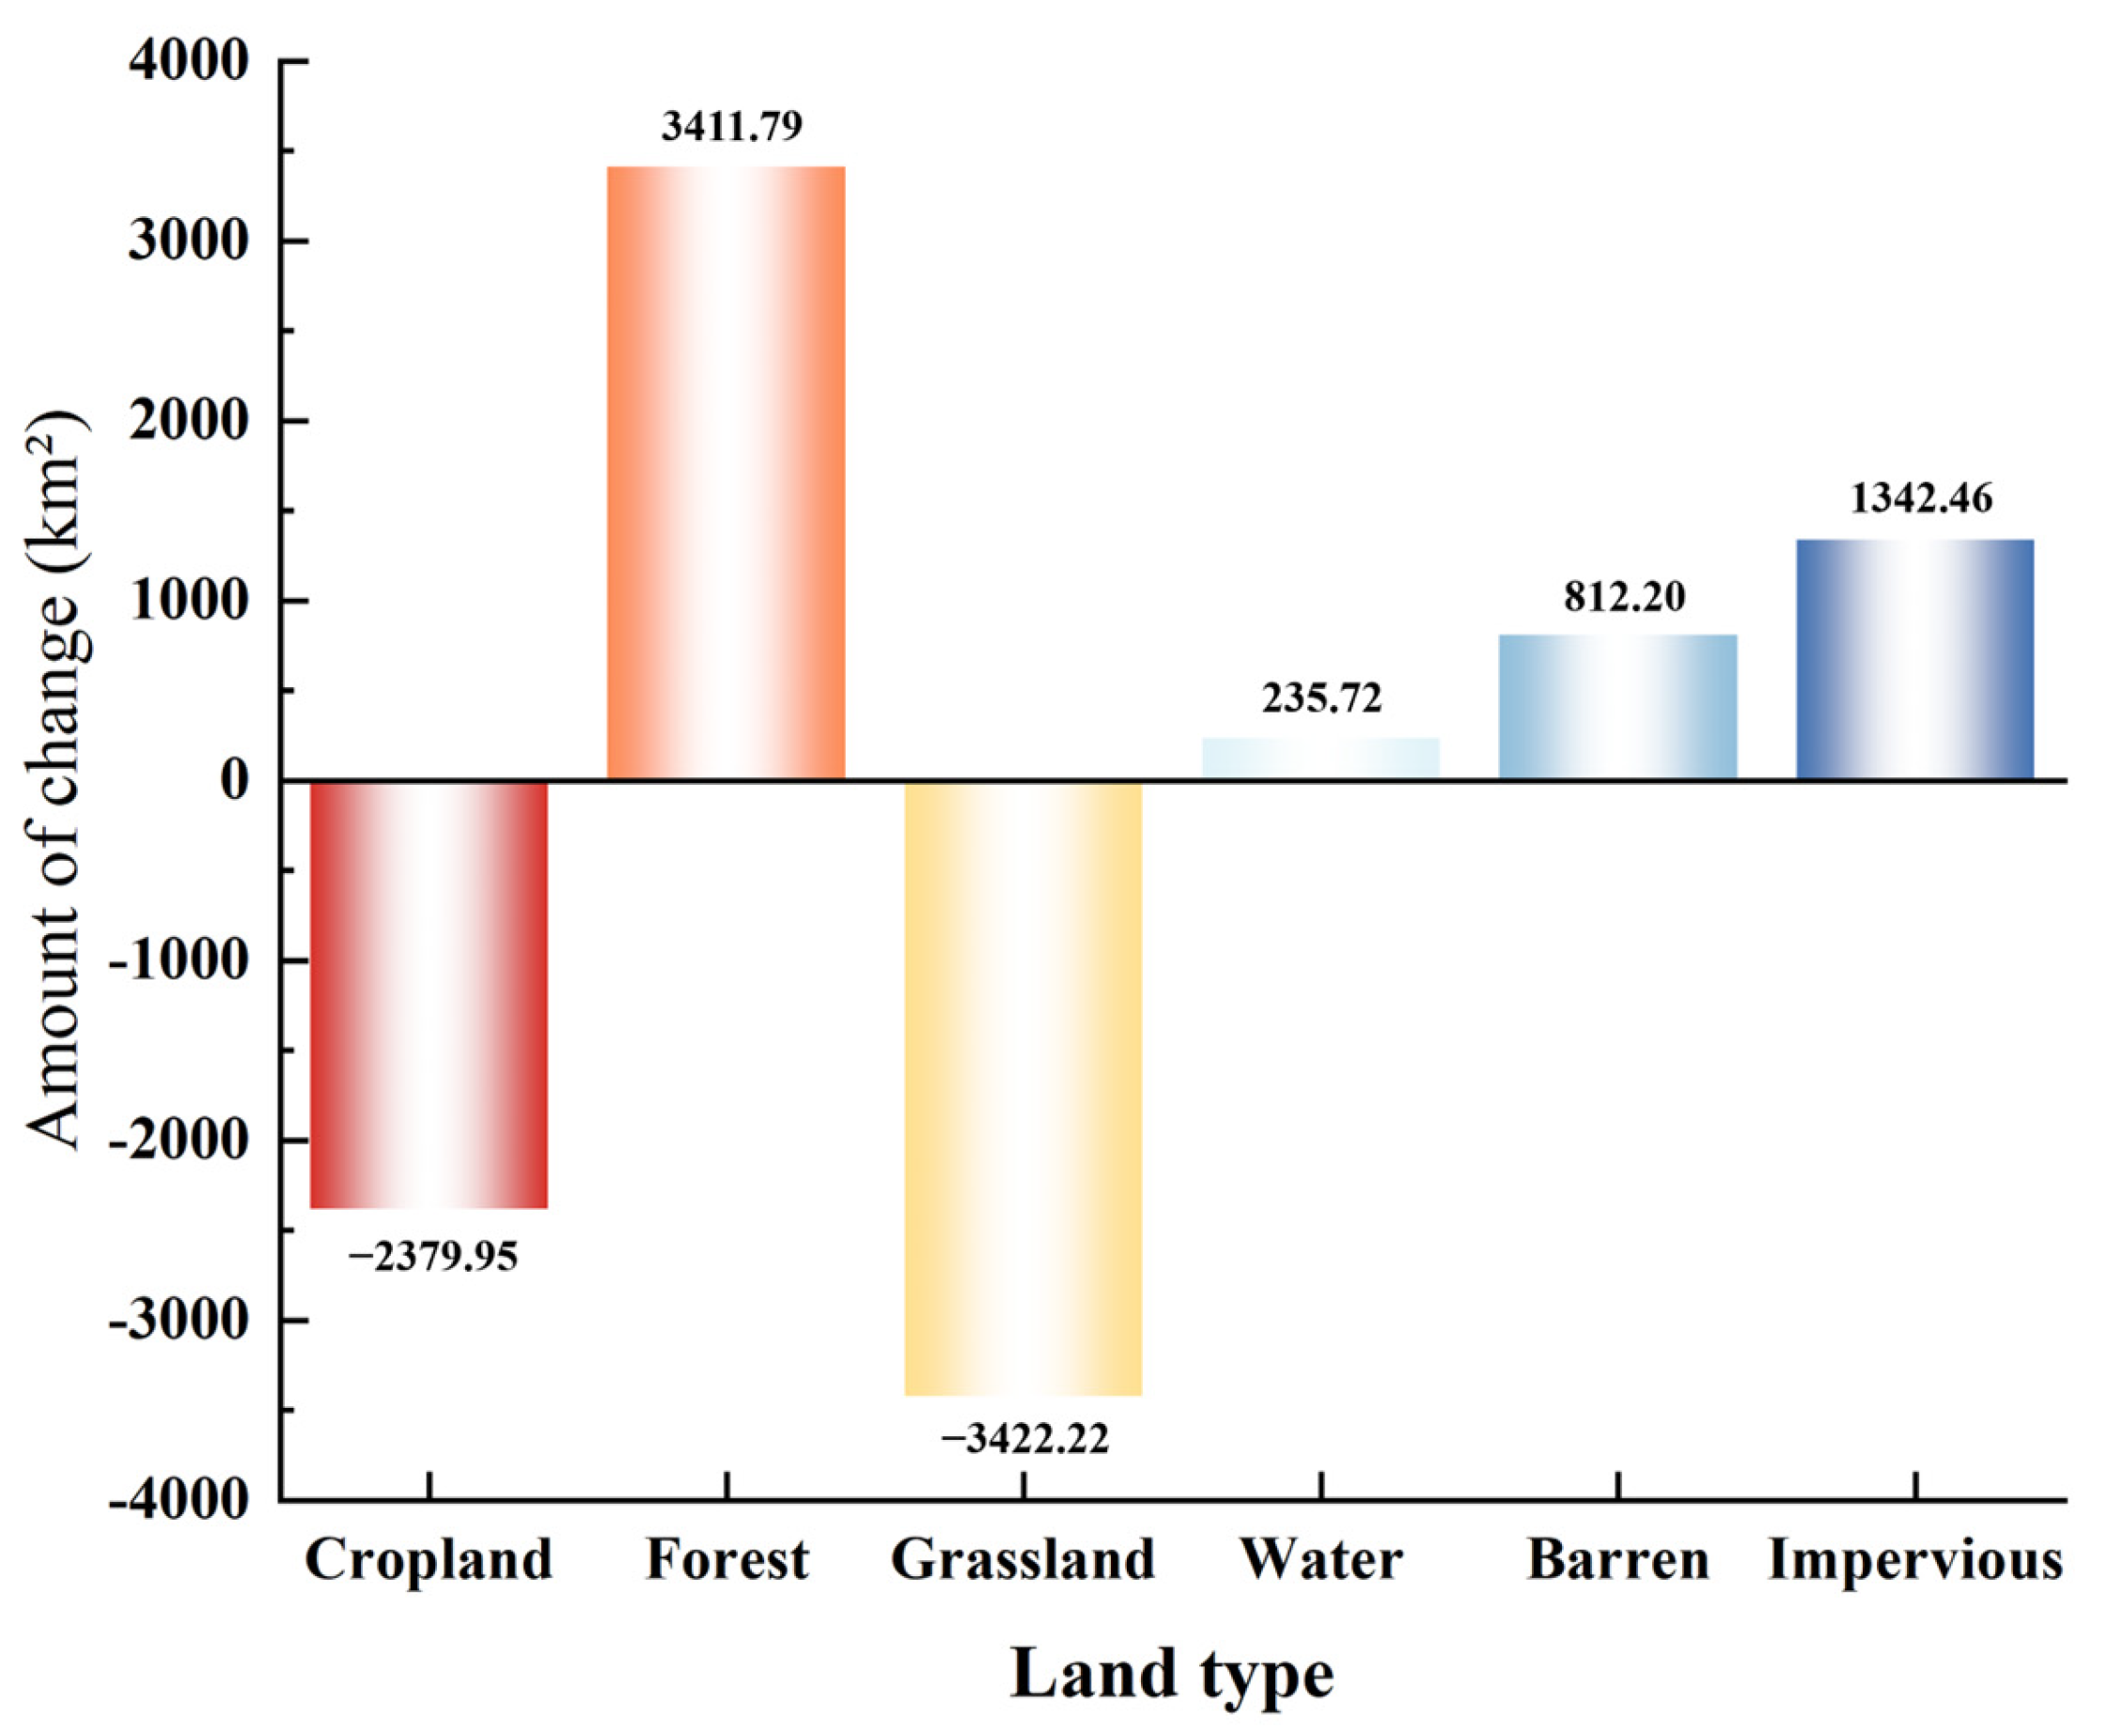
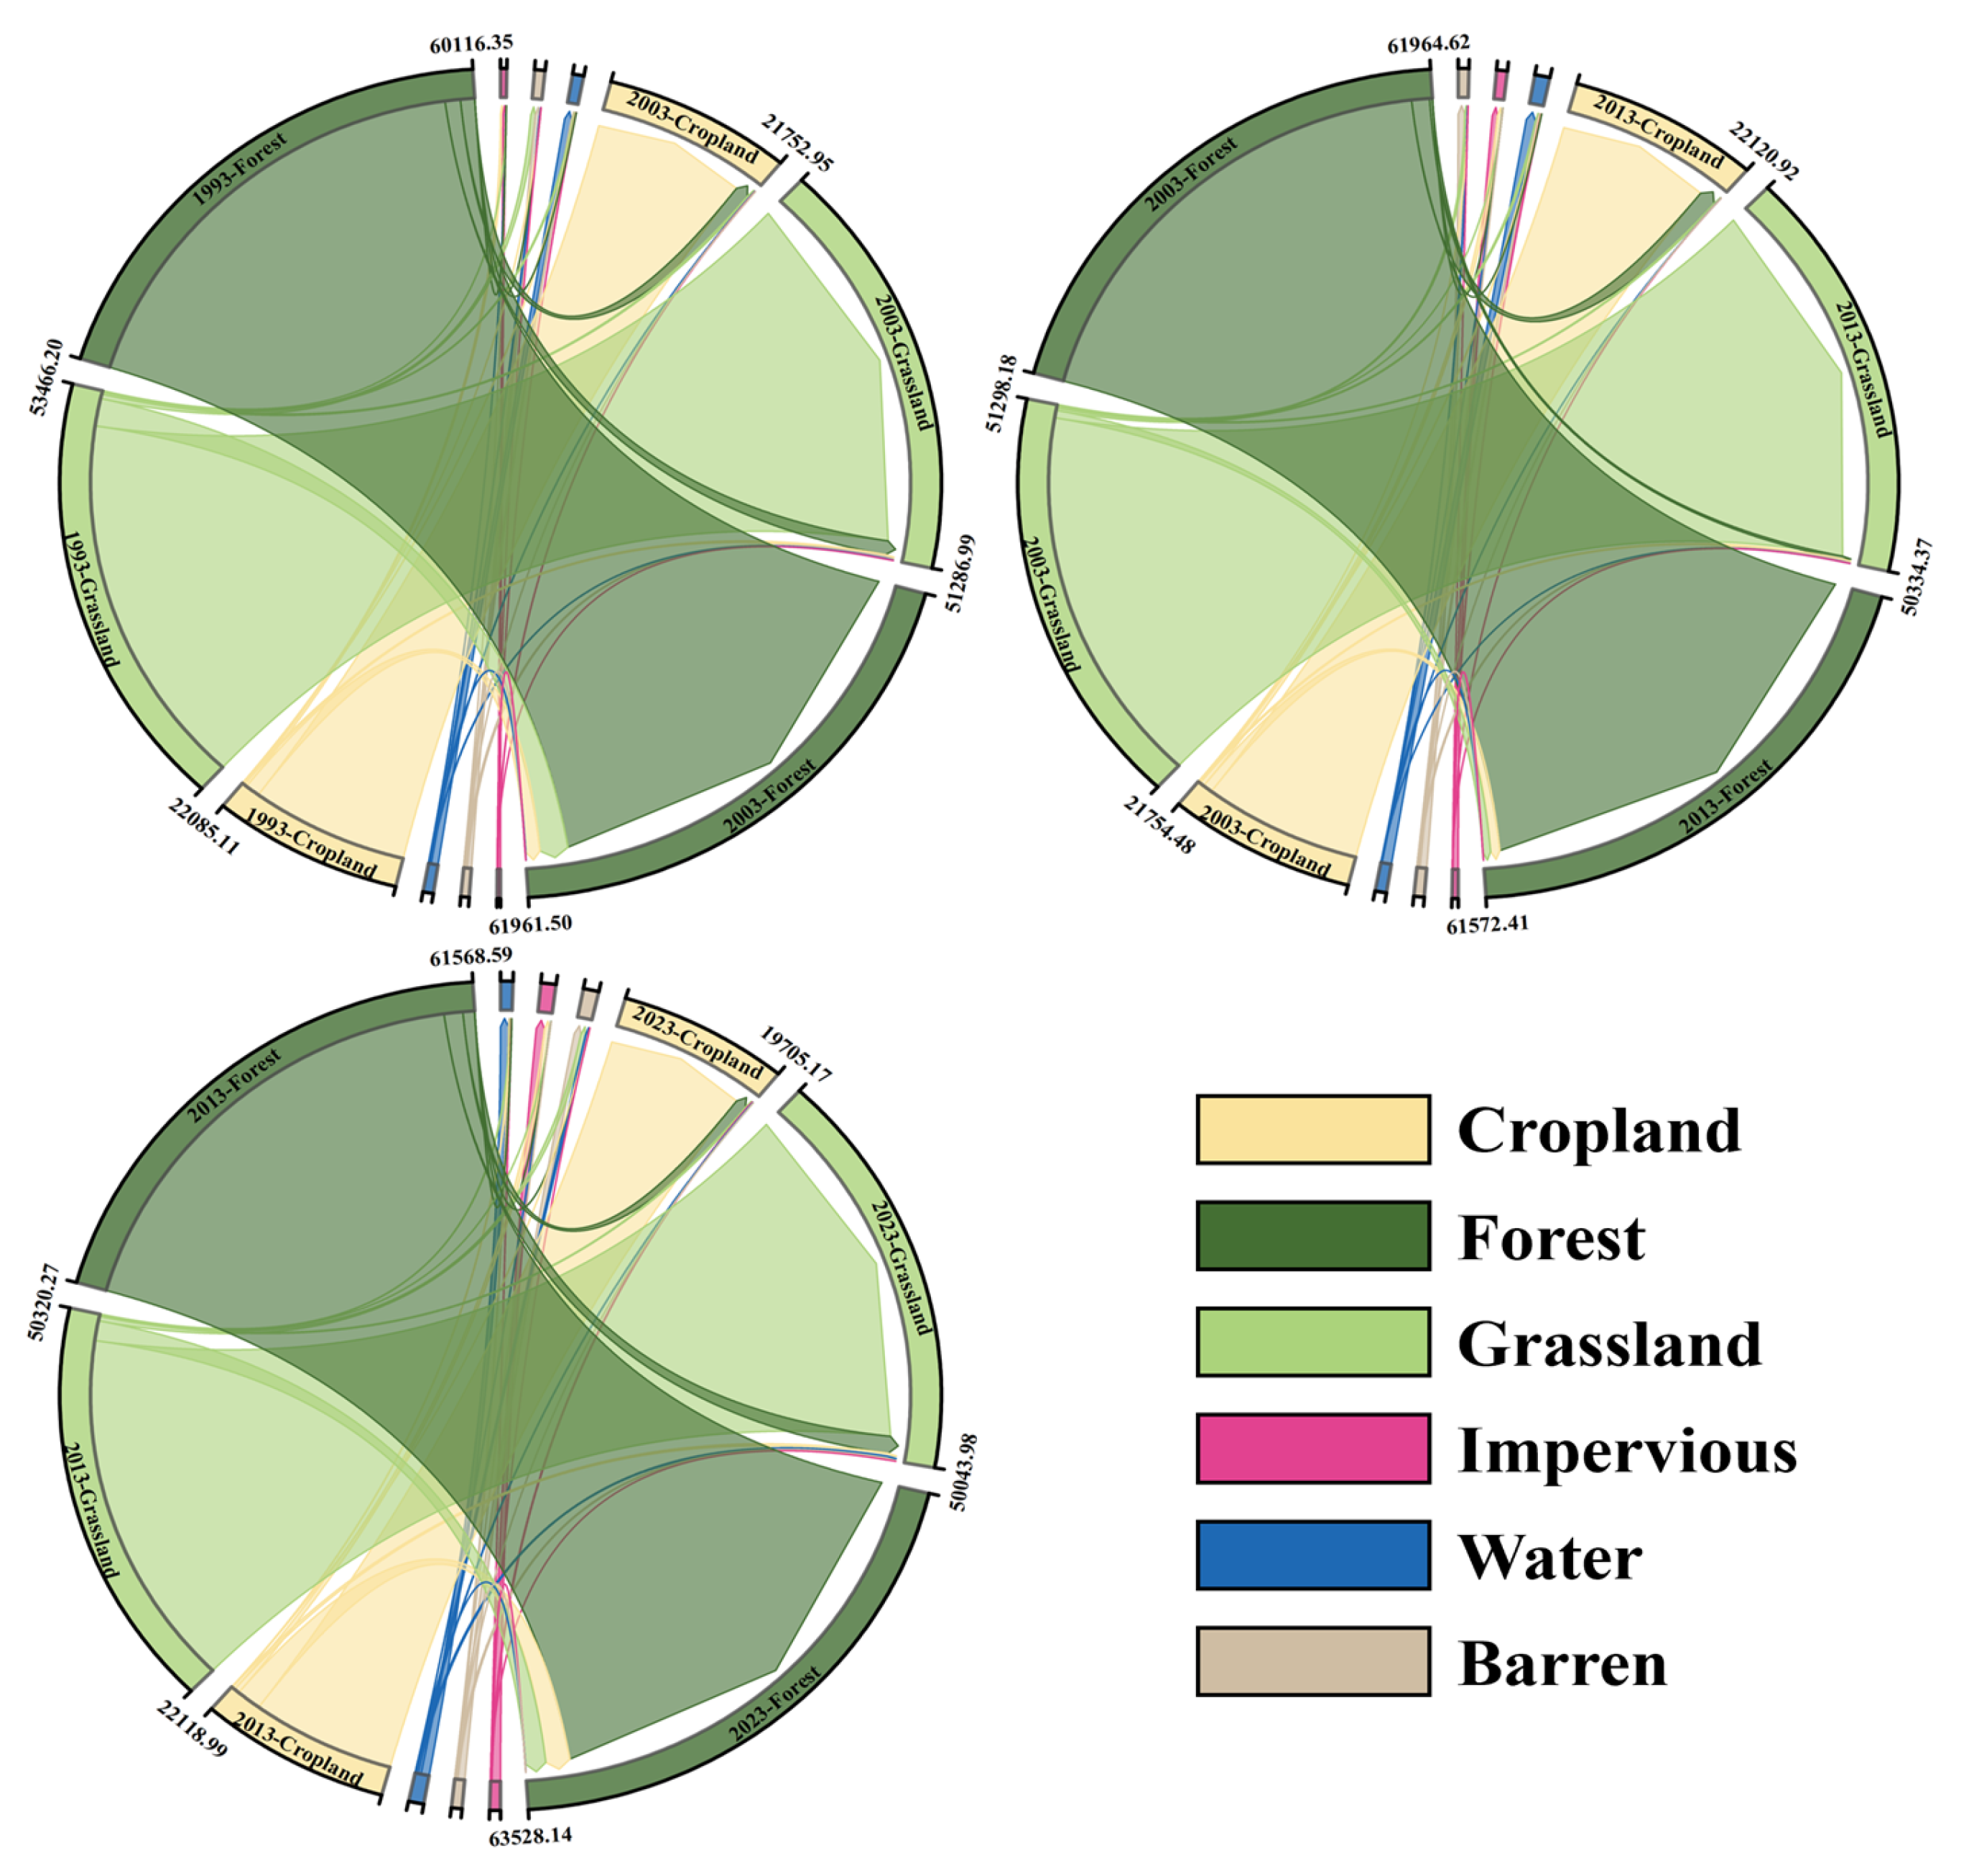
The land use transition matrix from 1993 to 2023 reveals significant trends in land use change within the MRB. During this period, agricultural land decreased overall, with a notable decline between 2013 and 2023, reflecting the impacts of urbanization and ecological conservation measures. Concurrently, forest cover increased significantly, demonstrating the success of vegetation restoration and ecological protection efforts. The area of grassland showed a downward trend, possibly related to human activities and climate change. There were fluctuations in the areas of water bodies and bare land, with a significant increase in bare land, indicating the effects of soil erosion and human development. The area of impervious surfaces increased substantially, particularly between 1993 and 2023, which is closely linked to rapid urbanization.
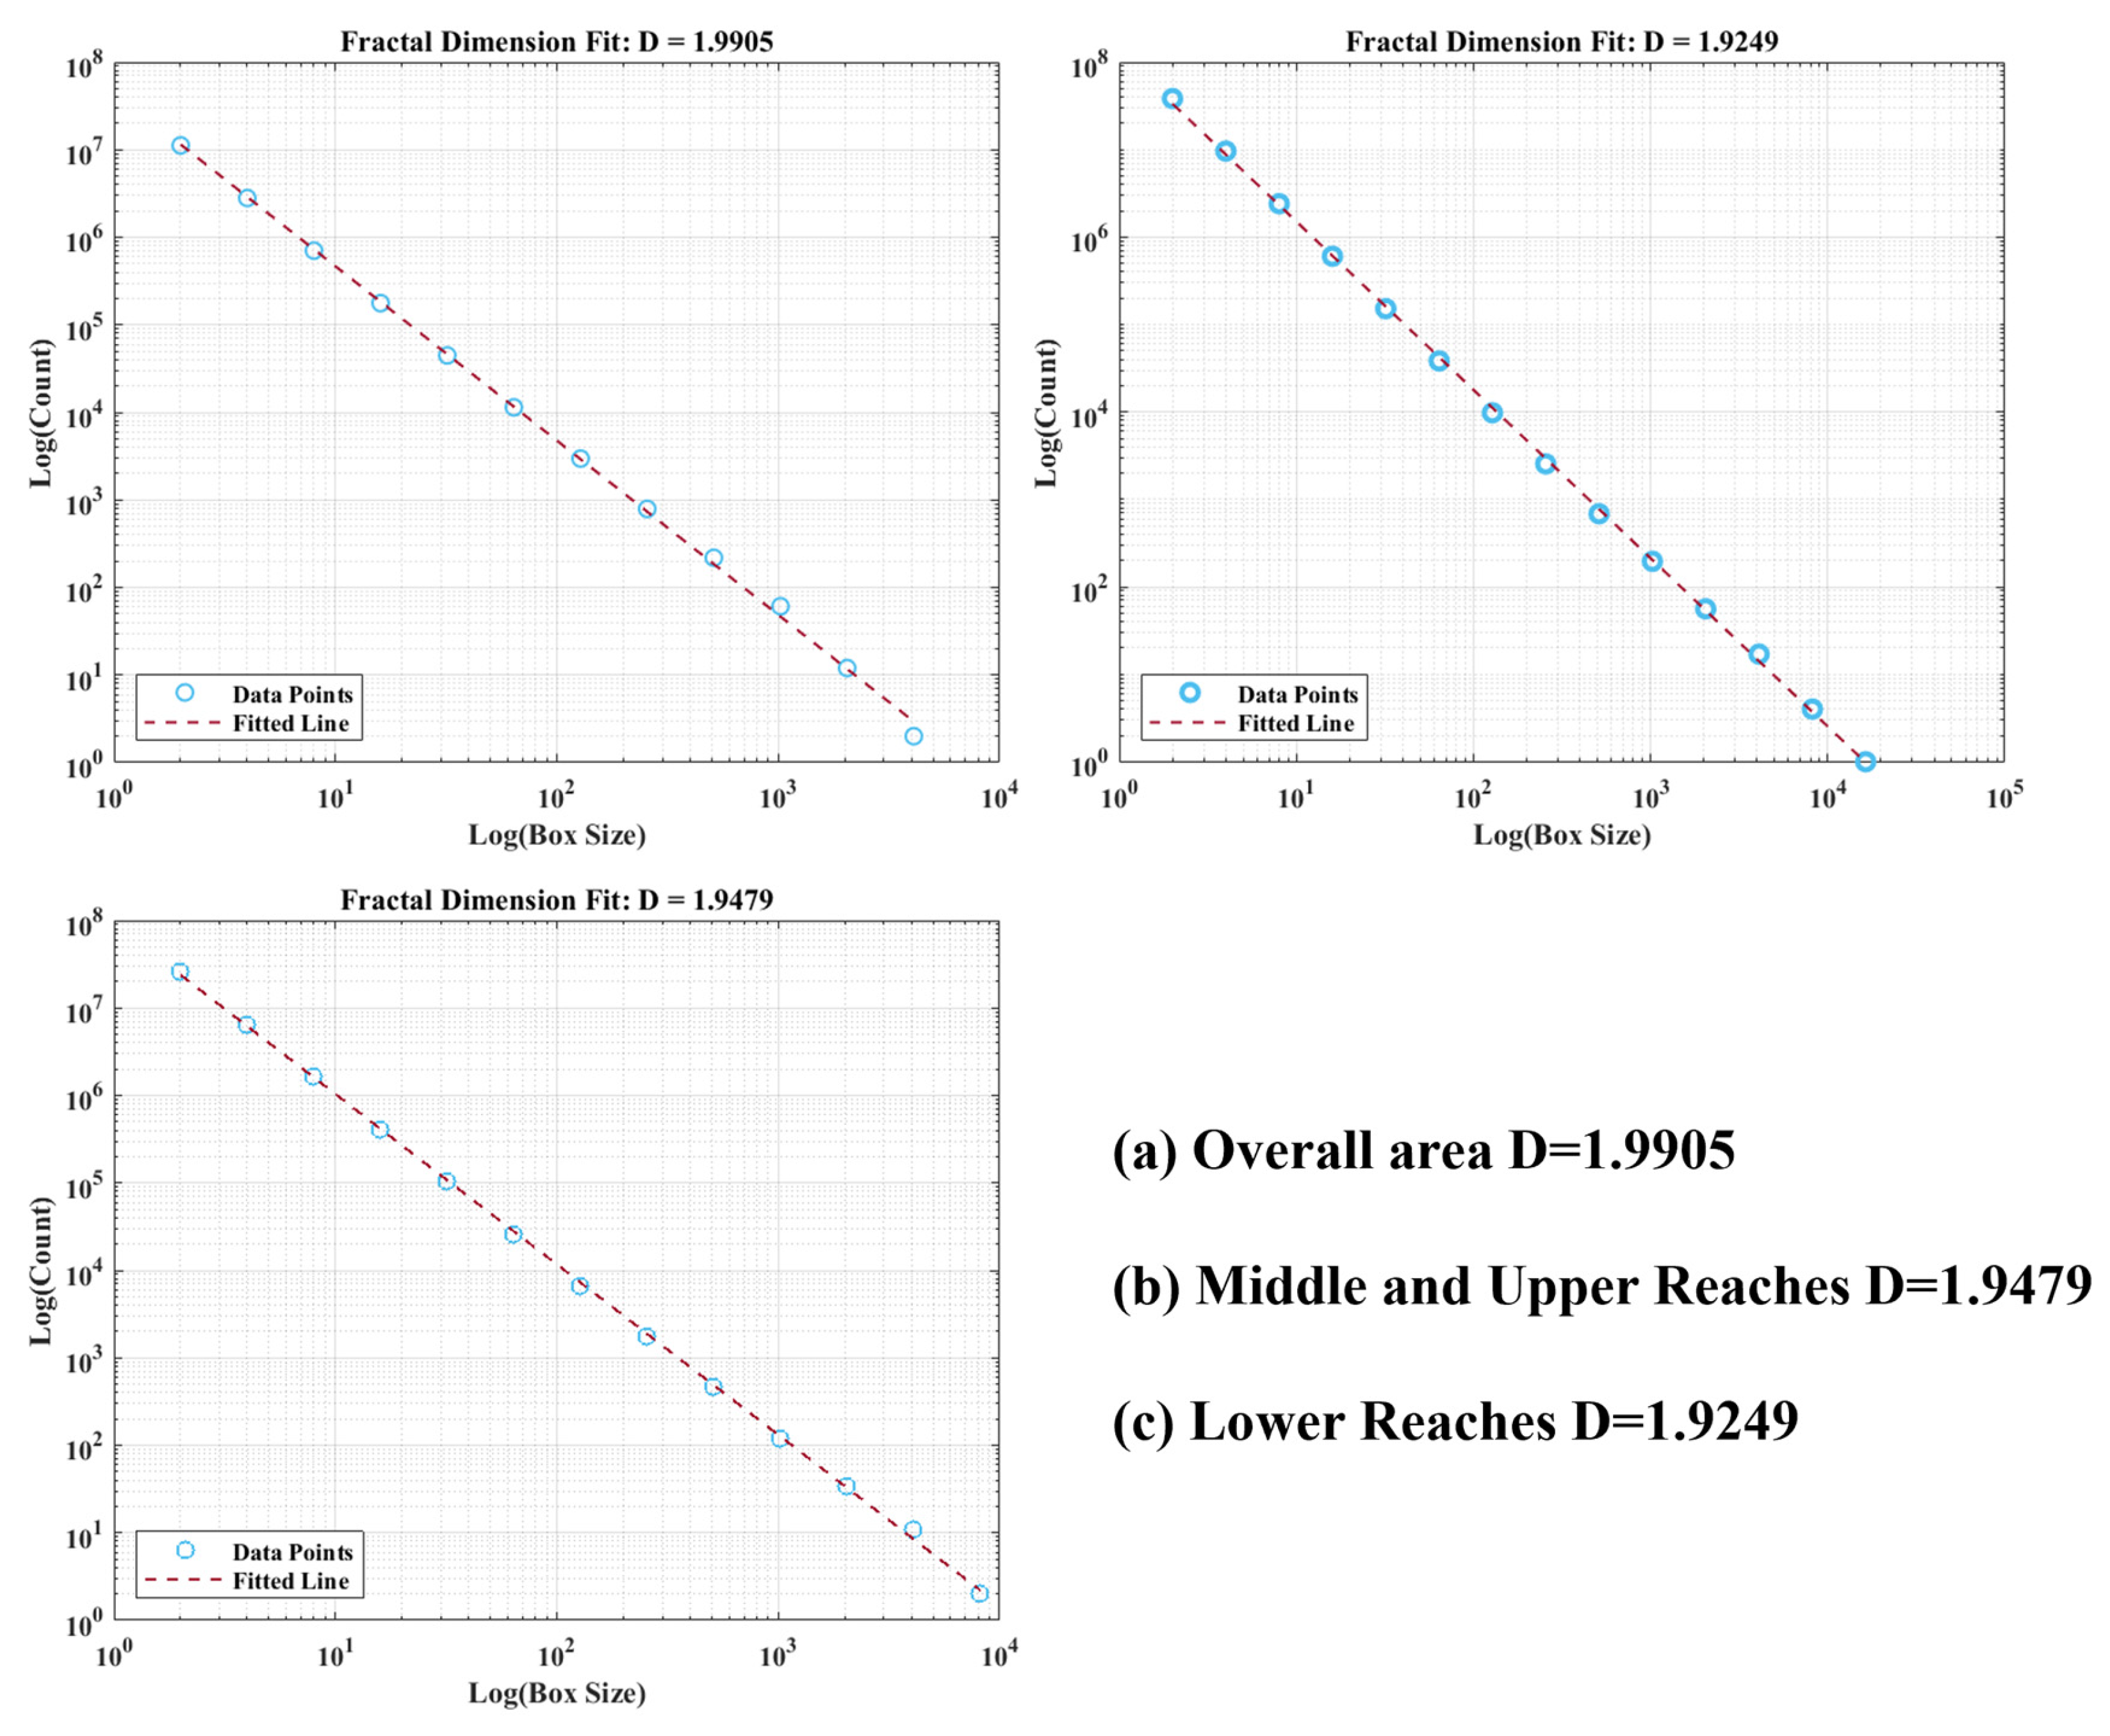
By calculating the fractal dimension, we gained a deeper understanding of the spatial structural complexity of the MRB. As shown in
Figure 8: in the upper and middle reaches, the fractal dimension is 1.9905, indicating complex terrain and the strong self-organizing ability of the ecosystem. The climate and topographical characteristics of this region allow natural factors to play a dominant role in land use changes. The downstream area’s fractal dimension is 1.9249, reflecting lower terrain complexity and highlighting the more significant impact of human activities, such as urbanization and agricultural development, on land use. The overall fractal dimension of the basin is 1.9479, showcasing the integrated characteristics of ecological and land use types, influenced by both natural and human-driven forces.
By integrating fractal theory with land use change data, spatial patterns of ecosystem and land use changes in the MRB were identified. This analysis reveals the ecological processes and driving factors in different regions, including natural conditions, human activities, and policy changes. The diverse ecosystems and climate types within the basin have important implications for regional water conservation. This study not only provides new insights into the ecological dynamics of the MRB, but also offers scientific evidence for formulating sustainable land use policies and ecological protection strategies.
4.2. InVEST Model Construction and Application Results
This study employed the InVEST model to thoroughly investigate the spatial distribution characteristics of water conservation services in the MRB, uncovering significant spatial disparities. These findings provide a crucial basis for developing more precise ecological management strategies.
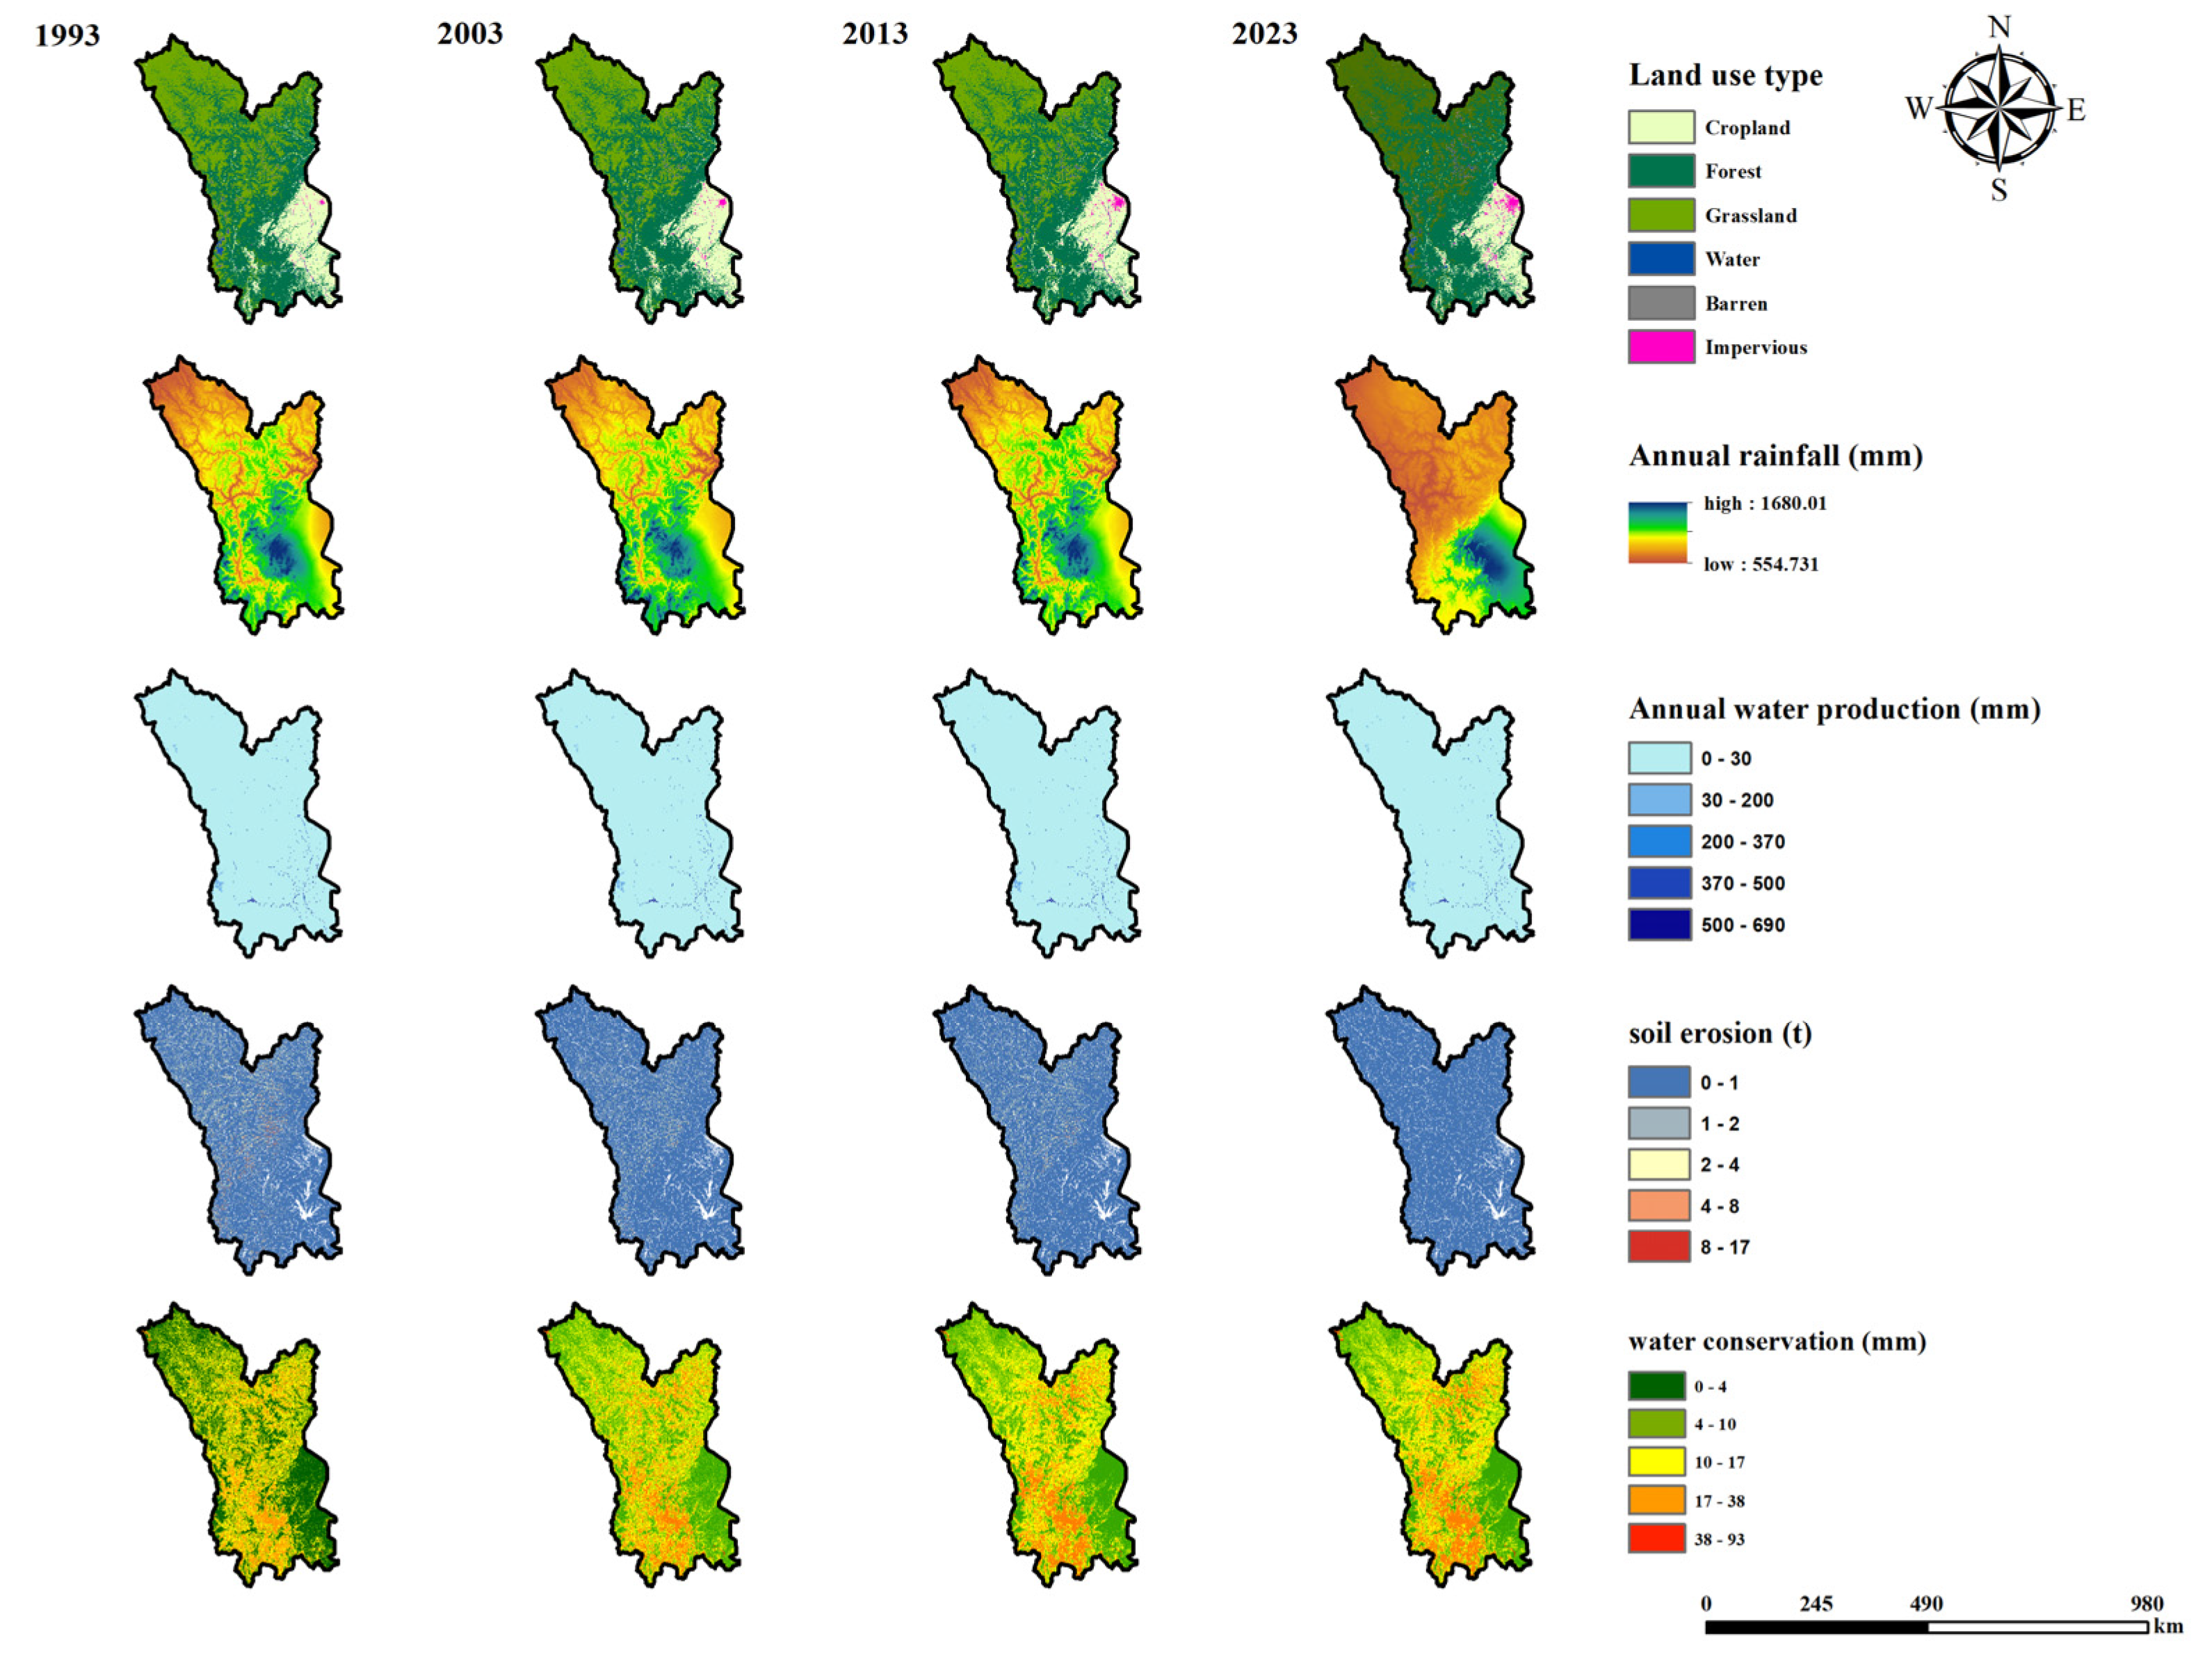
Through spatial variability analysis using the InVEST model, it was found that the upper and middle mountainous regions of the MRB, characterized by steep slopes and high vegetation coverage, serve as the primary water conservation areas. As shown in
Figure 9. The geographical features of these regions endow them with strong precipitation interception and infiltration capabilities, significantly enhancing their water conservation function. In contrast, the downstream plains, due to their flat terrain and insufficient vegetation cover, exhibit lower water conservation capacity. This spatial disparity highlights the necessity for stricter protection and management of the upper and middle regions to ensure the ecological security and sustainable water resource supply of the entire basin.
The critical role of vegetation coverage is highlighted, as it is proven to be one of the primary natural factors affecting water conservation functions. Vegetation not only effectively reduces surface runoff and soil erosion but also regulates the water cycle through transpiration. Research indicates that changes in vegetation coverage have a significant regulatory effect on water conservation capacity. This implies that through vegetation restoration and protection measures, the water conservation function of the basin can be effectively enhanced, thereby improving the quality of ecosystem services.
Model analysis revealed the spatial complexity of the ecosystem structure in the study area. This complexity partially explains the geographical distribution characteristics of water conservation functions.
4.3. SWAT-BiLSTM Model Development Results
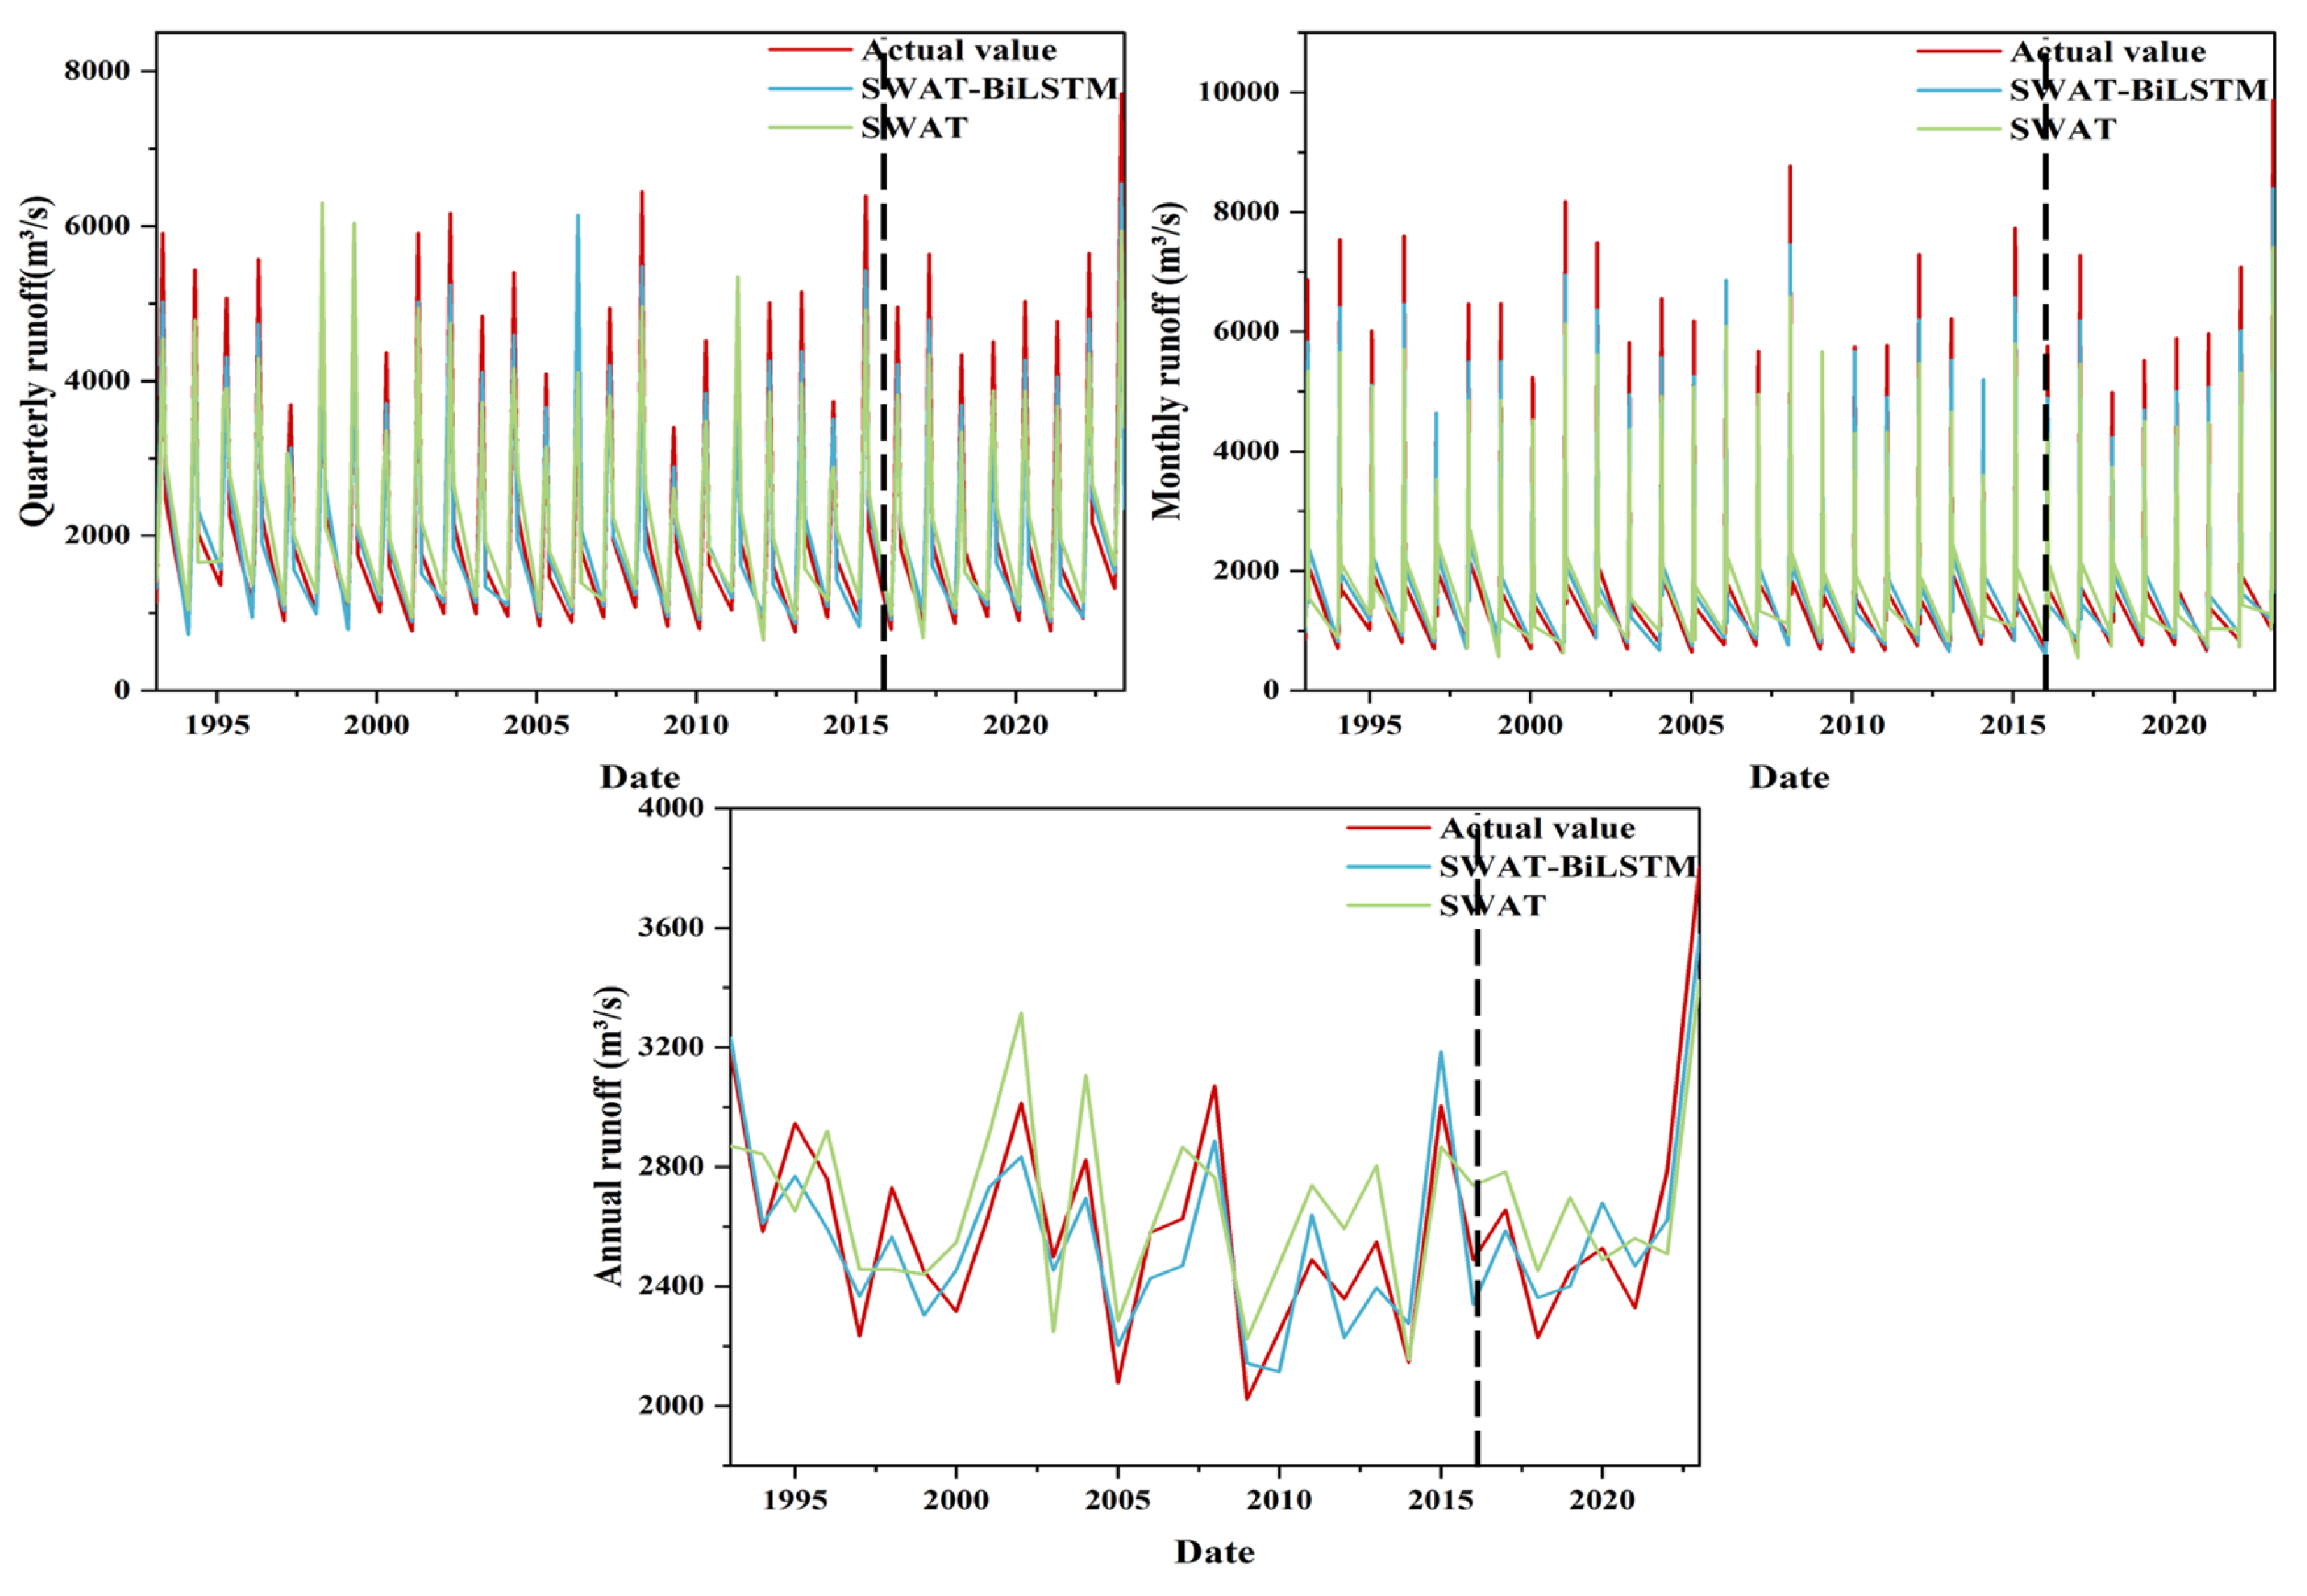
The Gaochang Hydrological Station is a national basic hydrological station, a central flood reporting station, and a control station for the MRB. It has recorded extensive river runoff data, effectively representing the regional hydrological system. The model simulation’s warm-up period spans three years (1993–1995), with the calibration and validation periods covering 1996–2015 and 2016–2023, respectively. The runoff data were simulated, with the results shown in
Figure 10. The simulated results of both the SWAT model and the SWAT-BiLSTM model are largely consistent with the observed data.
In this study, a comparative analysis was conducted on the runoff simulation capabilities of the SWAT-BiLSTM model and the SWAT model across different time scales. The findings are as follows: On a quarterly basis, the SWAT-BiLSTM model shows a high degree of fit with the observed data, accurately capturing seasonal fluctuations and exhibiting excellent performance. Although the SWAT model generally aligns well with the overall trend, it shows discrepancies during certain peak periods. In monthly runoff simulations, the SWAT-BiLSTM model demonstrates higher accuracy, particularly under extreme climate conditions, showcasing strong adaptability. In contrast, while the SWAT model’s trend is largely consistent, it exhibits greater errors during periods of high and low flow. Annual runoff simulation results indicate that the SWAT-BiLSTM model excels in capturing annual variation trends, with more accurate simulations, especially in recent years. Although the SWAT model is generally consistent with observed data, it falls short in terms of refinement.
Therefore, the SWAT-BiLSTM model demonstrates superior simulation capability over the SWAT model across various time scales. Its outstanding performance in fine-scale and extreme value simulations provides a more accurate and reliable tool for water source conservation research in the Yangtze River ecological barrier area.
4.4. Error Results
The errors of the two models during calibration and validation are presented in
Table 6. Based on the calibration and validation results shown in
Table 6, it is evident that the SWAT-BiLSTM model demonstrates excellent performance in runoff simulation across various temporal scales. At the annual scale, the NSE and R
2 values of the SWAT-BiLSTM model reach 0.85 or higher, and even achieve 0.90 during the validation phase, indicating the model’s high fitting accuracy and stability. The RMSE values are low, and the RSR and RB values fall within a reasonable range, suggesting minimal deviation between the simulated and observed values. At the seasonal scale, the SWAT-BiLSTM model also performs exceptionally well, with NSE and R
2 values reaching 0.91 and 0.93 during calibration and validation, respectively. The RMSE and RSR values indicate minimal error during the simulation process, while the RB value is close to zero, indicating minor deviation between the simulation results and actual observed data. The results at the monthly scale further confirm the high accuracy of the SWAT-BiLSTM model, with NSE and R
2 indices achieving 0.94 and 0.93, demonstrating the model’s extremely accurate simulation effect. The low RMSE and RSR values, along with RB values remaining within a reasonable range during both calibration and validation phases, ensure the model’s reliability.
In contrast, the SWAT model performs slightly worse across all temporal scales, particularly at the annual scale, where the NSE and R2 values are only 0.59 and 0.66, indicating significant error. The simulation performance improves at the seasonal and monthly scales, with NSE and R2 values ranging from 0.83 to 0.87, but there remains a considerable gap compared to the SWAT-BiLSTM model. The SWAT-BiLSTM model, with its high accuracy and low error performance across different time periods, significantly outperforms the traditional SWAT model in runoff simulation. This provides a more reliable tool for hydrological simulation studies in the Yangtze River ecological barrier region.
5. Discussions
5.1. Discussion of Fractal Dimension Calculation Results and MRB Fractal Analysis Results
In the study of the Min River Basin, fractal theory and land use change data are combined to deeply explore the spatial heterogeneity of the ecosystem within the basin and its underlying driving forces. This research spans from the source regions of the Min Mountains on the Qinghai–Tibet Plateau to the downstream areas of the basin, comprehensively covering the geographical range of the Min River.
Fractal Dimension and Spatial Heterogeneity Analysis:
Through the calculation of fractal dimensions, we reveal the complexity of the spatial structure of the Min River Basin and its regional differences. In the upper and middle reaches, the fractal dimension is 1.9905, indicating a high level of terrain complexity and the self-organizing capacity of the ecosystem. The complex terrain and climatic conditions suggest that natural factors play a dominant role in land use changes in this area. In contrast, the downstream region has a fractal dimension of 1.9249, reflecting lower terrain complexity and the significant impact of human activities, such as urbanization and agricultural development, on land use types. The overall fractal dimension of the basin is 1.9479, illustrating the combined characteristics of natural and anthropogenic driving forces.
Land Use Change Analysis:
Between 1993 and 2023, the Min River Basin experienced significant land use changes. There is a general trend of decreasing agricultural land, especially between 2013 and 2023, reflecting accelerated urbanization and strengthened ecological protection measures. The increase in forest cover, particularly from 1993 to 2023, demonstrates the effectiveness of vegetation restoration efforts. The reduction in grassland area may be linked to human activities and climate change, while fluctuations in water and bare land areas indicate the effects of soil erosion and human development. Notably, the significant increase in impervious surfaces, especially since 1993, reflects the rapid pace of urban development.
Ecological Driving Force Analysis:
By integrating fractal theory with land use change data, we identify the ecological processes and driving forces in different regions of the Min River Basin. This analysis reveals the influence of factors such as natural conditions, human activities, and policy changes on land use in different areas. The diverse ecosystems and climate types are crucial for water conservation in the basin, directly impacting the maintenance and enhancement of ecosystem services.
Overall, fractal analysis and land use change studies provide a comprehensive perspective for assessing the ecological heterogeneity and driving forces in the Min River Basin. This research offers a scientific basis for formulating ecological protection and sustainable development policies for the basin and helps to understand the potential impacts of land use changes on the overall ecological security of the Yangtze River Basin. By integrating the InVEST and SWAT-BiLSTM models, fractal theory not only optimizes model parameters and improves prediction accuracy, but also provides strong support for developing more effective ecological management strategies. This integrated approach offers an innovative pathway for further ecological protection and management practices.
5.2. Discussion of InVEST Model Construction and Application Results
In this study, the InVEST model’s water yield module was employed to conduct a detailed assessment of the water conservation services in the MRB. By integrating key data such as precipitation, evapotranspiration, land use types, and soil parameters, the model accurately calculated the annual average water yield of the basin. This analysis provides profound insights into the water resource supply status within the basin, aiding in the formulation of effective ecosystem management and conservation strategies.
During the model construction, long-term precipitation and temperature data were first obtained from meteorological stations to ensure the accuracy of climate inputs. These data, combined with land use information acquired through remote sensing technology, provided a detailed overview of surface coverage. Additionally, the acquisition of high-resolution soil characteristic data enhanced the credibility of the model’s output. A series of parameter calibration and sensitivity analyses significantly improved the model’s fit and accuracy. The results were validated for reliability and predictive capability by comparing them with observed data and outputs from other models, such as the SWAT-BiLSTM model.
The model’s output indicates that the annual average water yield of the MRB is primarily concentrated in the middle and lower reaches, and is closely related to local topography and precipitation patterns. Specifically, the middle and lower reaches, due to their gentle topography and abundant rainfall, have significantly higher water yields than the upstream areas. Furthermore, fluctuations in water yield from 1993 to 2023 reflect the impacts of land use changes and climate conditions. Sediment transport ratio analysis further revealed the significant contribution of forests and grasslands to water conservation, while urban areas demonstrated relatively weaker conservation capacity.
The analysis shows that natural factors such as precipitation, topography, and soil characteristics are the primary drivers affecting the distribution of water conservation. Precipitation directly influences water replenishment, while topography affects water movement and aggregation. The permeability and water retention capacity of the soil also play a crucial role in water conservation.
However, human activities, particularly urbanization and agricultural development, have a significant impact on land use changes. During urbanization, large areas of original forests and grasslands are converted into impervious urban surfaces, substantially reducing the region’s water conservation capacity. Agricultural development can lead to overuse of land and destruction of soil structure, further impacting water conservation functions.
It is noteworthy that in recent years, with the implementation of vegetation restoration and ecological protection policies, the area of forests and grasslands within the basin has increased, enhancing the water conservation function of these regions. For example, programs like returning farmland to forests and ecological restoration projects have curtailed soil erosion to some extent, improved soil water retention capacity, and ameliorated the regional microclimate environment. The application of the InVEST model provides a scientific assessment of the spatiotemporal patterns of water conservation services in the MRB, offering a basis for the formulation of ecological management policies in the area. By integrating fractal theory, it provides new perspectives for understanding ecological processes and potential driving forces, promoting a comprehensive understanding of watershed ecosystem management.
5.3. Discussion of SWAT-BiLSTM Model Development Results
In this study, we conducted a comparative analysis of the runoff simulation capabilities of the SWAT-BiLSTM model and the SWAT model across different time scales. The results indicate that the SWAT-BiLSTM model demonstrates superior performance over the SWAT model in runoff simulations at quarterly, monthly, and annual scales. This superiority can be dissected from several aspects:
In quarterly simulations, the SWAT-BiLSTM model is able to closely fit the observed data and accurately capture seasonal fluctuations. This capability primarily stems from the bidirectional information processing characteristics of the BiLSTM neural network, which allows it to simultaneously capture past and future information during various periods, thus enhancing its sensitivity to seasonal changes. Although the SWAT model can reflect overall trends, it exhibits certain deficiencies in capturing complex changes during peak periods due to its parameterization method based on physical processes.
For monthly runoff simulations, the SWAT-BiLSTM model demonstrates higher accuracy, particularly under extreme climatic conditions. By leveraging the powerful predictive capabilities of deep learning, the BiLSTM model can handle nonlinear and complex impacts of climate change, especially adjusting better during high and low flow periods. This enables it to maintain high precision, even when extreme climate events are frequent. In contrast, the SWAT model shows greater errors under these extreme conditions, primarily because its parameterization process struggles to dynamically respond to rapidly changing environmental conditions.
At the annual scale, the SWAT-BiLSTM model also excels in capturing long-term change trends. Its advantage lies in its ability to utilize long short-term memory networks to retain distant temporal data, providing more in-depth trend analysis. This memory capability allows the model to maintain consistency and reliability when handling long-term time series data. Although the SWAT model generally aligns with observed data in long-term trends, its reliance on fixed physical parameters results in less flexibility and slightly lower precision.
It is noteworthy that although the SWAT-BiLSTM model demonstrates excellent predictive performance, both the SWAT-BiLSTM and SWAT models exhibit a tendency to underestimate peak flow values compared to the actual observations.
The SWAT-BiLSTM model’s excellent performance across various time scales, particularly its outstanding ability in fine-tuning and extreme value simulation, provides a more accurate tool for water source conservation research in the Yangtze River ecological barrier region. Its success lies in integrating the advantages of data-driven and physical processes, fully utilizing the predictive potential of deep learning alongside the physical basis of traditional models, thereby offering more solid scientific support for ecosystem management and water resource planning.
5.4. Error Section Discussion
In this study, the SWAT-BiLSTM model demonstrated exceptional performance in runoff simulation, showcasing its advantages of high accuracy and low error across various time scales. At the annual scale, the SWAT-BiLSTM model achieved NSE and R2 values of 0.85 and above, with validation phases reaching as high as 0.90, indicating its high fitting accuracy and stability. The low RMSE values, along with RSR and RB values within reasonable ranges, suggest minimal deviations between simulated and observed values. This high precision is primarily attributed to the bidirectional long short-term memory capability of BiLSTM, which effectively captures complex nonlinear relationships in time series data, thereby enhancing the overall accuracy of the model.
The superiority of the SWAT-BiLSTM model is even more pronounced at the seasonal and monthly scales. During seasonal simulations, NSE and R2 values reached 0.91 and 0.93 during calibration and validation phases, respectively, with low RMSE and RSR values indicating the model’s strong capability in capturing seasonal fluctuations. In monthly simulations, NSE and R2 values were 0.94 and 0.93, further confirming its high accuracy and reliability at refined time scales. The RB values were close to zero across all phases, demonstrating minimal bias between the simulation results and actual observed data.
In contrast, the traditional SWAT model showed relatively inferior performance across all time scales. At the annual scale, NSE and R2 values were only 0.59 and 0.66, reflecting significant errors. While there was some improvement in seasonal and monthly simulations, with NSE and R2 values ranging from 0.83 to 0.87, a significant gap remained when compared to the SWAT-BiLSTM model. This discrepancy in error is mainly due to the limitations of the SWAT model in handling complex nonlinear dynamic changes, as its physically based parameterization approach struggles to adapt to rapidly changing environmental conditions. The SWAT-BiLSTM model, with its high accuracy and low error performance, significantly outperformed the traditional SWAT model, providing a more reliable tool for hydrological simulation research in the Yangtze River ecological barrier area. This not only enhances the accuracy of predictions, but also improves the model’s adaptability and stability under complex climate conditions.


