Abstract
Focusing on the mining-induced fracture development characteristics of Weakly Cemented Overburden (WCO) in Ultra-Thick Coal Seam (UTCS) extraction, this study, based on the 1101 first mining face in Xinjiang’s Zhundong Coalfield, systematically investigates the dynamic evolution law of the water-conducting fracture zone (WCFZ) in WCO by employing similarity simulation, quantitative characterization using Fractal Dimension (D), and surface borehole exploration and borehole imaging technology. The results show that existing prediction equations for the WCFZ have poor applicability in the study area, with significant fluctuations in prediction outcomes. Similarity simulation reveals that Thick Soft Rock Layers (TS) guide and control fracture development, with the D exhibiting a “step-like” evolution. After the first rupture of TS1, the peak D reaches 1.49, stabilizing between 1.36 and 1.37 after full extraction. The height of the WCFZ increases non-linearly with the advance of the working face, reaching a maximum of 189 m, with a fracture-to-mining ratio of 10.5. Based on D fluctuations and extension patterns, the fracture development is divided into three stages, initial development, vertical propagation, and stabilization, clarifying its spatial evolution. Field measurements indicate a WCFZ height ranging from 161 to 178 m, with a fracture-to-mining ratio of 9.73–12.18, showing only a 6.2% error compared to the simulation results, which verifies the reliability of the experiment. This study reveals the evolution mechanism of the WCFZ during mining in UTCS and WCO in the Zhundong area, providing a theoretical basis and practical guidance for mine disaster prevention and control, as well as safe and efficient mining.
1. Introduction
Weakly cemented geological conditions are globally prevalent in numerous coal-bearing regions and continue to pose persistent engineering challenges. Under specific geological settings such as interbedded rock strata, weak cementation characteristics, and great mining depths [1,2,3,4,5], mining activities often induce more complex fracture propagation. These fractures not only readily penetrate overlying aquifers and propagate continuously upward to the surface, but also trigger water inrushes, sand inrushes, and surface subsidence [6,7,8]. Consequently, investigating the failure mechanisms of weakly cemented overburden (WCO), the evolution of mining-induced fractures, and the characteristics of the resulting water-conducting fracture zone (WCFZ) has become an important research direction in international mining rock mechanics.
WCO refers to loose, soft rock strata characterized by low strength, high porosity, poor cementation, frequent intersection by structural planes, significant weathering effects, or abundance of expansive clay minerals [9]. Its failure mechanisms and deformation patterns distinctly differ from those of ordinary soft rock, exhibiting greater structural instability and complexity. Wang et al. [10] quantified the microstructure of weakly cemented sandstone and mudstone through regression analysis. They found that the strength of sandstone is inversely proportional to quartz content, while the brittleness of mudstone exhibits a positive correlation with quartz content. Meng et al. [9,11,12,13] analyzed the mineral composition and microstructural characteristics of weakly cemented rock. Through triaxial compression tests, they revealed the post-peak dilatancy deformation and strain softening mechanisms of weakly cemented rock. Based on these findings, a constitutive equation for large dilatancy deformation in weakly cemented rock was established. Zhang et al. [14] systematically investigated the mechanical strength and failure characteristics of weakly cemented sandstone under hydrostatic compression, uniaxial compression, and triaxial compression conditions, based on microstructural analysis. Their study revealed a non-linear stress–strain response in weakly cemented sandstone. Wang et al. [15,16] and Zhao et al. [17] analyzed the failure modes of weakly cemented sandstone specimens from typical western Chinese mining areas under uniaxial compression, triaxial compression, and triaxial cyclic loading-unloading conditions. The results indicate that under uniaxial compression, weakly cemented sandstone primarily exhibits two failure modes: single-inclined-plane shear and X-shaped conjugate failure. Under triaxial compression, the plastic deformation of the rock mainly depends on the loading path. In mining-induced strata movement research, Sun et al. [18] investigated the movement patterns of WCO through similarity simulation and numerical simulation. They established a fracture evolution model for overburden strata in large mining height faces within weakly cemented formations. Sun et al. [19] comprehensively analyzed the maximum height of the WCFZ in the study area using empirical equations and numerical simulation. Ma et al. [20] established a creep-erosion coupled water inrush model for weakly cemented fault rock mass. Their study revealed the spatiotemporal evolution patterns of creep-erosion characteristics in weakly cemented surrounding rock during water inrush events. Ma et al. [21] investigated the fracture and fissure development laws of mining-induced overburden in WCO through similarity simulation experiments. The permeability evolution of overburden was quantitatively analyzed using fluid-solid coupling technology. Fan et al. [22] compared and analyzed the development of surface fractures in high-intensity mining areas with WCO in western China through remote sensing interpretation and field investigations.
Studies show that fracture networks often exhibit distinct fractal characteristics [23,24]. Similarity simulation, capable of effectively reflecting the spatiotemporal evolution characteristics of overburden structure during mining and visually demonstrating the formation process of the “WCFZ” and fracture connectivity, is often combined with fractal theory to characterize the evolution of mining-induced fractures. Liu et al. [25] investigated the evolution and fractal characteristics of fracture networks induced by multi-layer backfill mining through similarity simulation and fractal dimension (D) analysis. They established a quantitative relationship between fracture fractality and overburden deformation, and demonstrated exponential correlations among fracture network development stages, D, and the height of the WCFZ. Ran et al. [26] employed similarity simulation to analyze the overburden collapse characteristics and the evolution of fracture parameters (frequency, angle, width) under repeated mining in steeply inclined coal seams. They further investigated the variations in D and the connectivity of fractures. Liang et al. [27] and Xing et al. [28] employed 3D/2D similarity simulations and D to qualitatively classify fracture fields. They established a fractal-permeability model for fractured rock masses, revealing the fractal permeability characteristics during overburden fracture reconstruction. Zhao et al. [29,30] revealed the three-stage sequential evolution pattern (“activation-construction-stabilization”) of fractures in broken rock masses adjacent to goafs under layered mining disturbance in ultra-thick coal seams. They proposed a dynamic zoning method based on D, providing a theoretical basis for targeting gas extraction areas. Song et al. [31] applied elastic thin plate theory and key stratum theory to quantitatively describe the subsidence of overlying strata above goafs. They investigated the distribution characteristics of mining-induced fractures and derived an approximate equation for the porosity in the regular movement zone based on relative subsidence.
Current research on mining-induced effects under WCO conditions remains limited. Existing studies primarily focus on overburden movement patterns, with relatively fewer investigations into fracture evolution characteristics. There is a notable lack of systematic analysis regarding internal void characterization and fracture development height in overburden strata. In recent years, Digital Image Correlation (DIC) technology has become an important tool for revealing overburden failure and fracture evolution due to its non-contact nature and high precision. It has been extensively employed in similarity simulation studies [32]. Based on this context, this study begins by presenting an overview of the research area and strata occurrence characteristics based on field data analysis and borehole detection results. Using mining parameters of the study area and existing empirical equations for weak strata, the height of mining-induced fracture development was predicted. Meanwhile, similarity simulation and quantitative characterization using D were employed to reveal the dynamic development characteristics of mining-induced fractures in the study area. Combined with surface borehole exploration and borehole imaging technology, the development height of the WCFZ was detected. Finally, based on the properties of WCO, the research results were compared and analyzed, providing a theoretical basis and practical guidance for mine disaster prevention and safe, efficient mining.
2. Overview and Strata Occurrence Characteristics of WF 1101
The No. 2 Mine of the Zhundong Coalfield is located 140 km north of Qitai County, Xinjiang Uygur Autonomous Region. The main mining target, the B1 coal seam, is a stable mineable layer with an average thickness of 53.8 m, belonging to the Xishanyao Formation. It is extracted using the layered fully mechanized top-coal caving method. The 1101 first mining face had a dip length of 240 m and a strike length of 2570 m. The average extracted coal thickness was 18 m, consisting of a 4.5 m mining height and a 13.5 m caving height, with a mining-to-caving ratio of 1:3. The average dip angle was 2. The coal seam burial depth ranges from 510 to 544 m. The roof lithology primarily consists of fine-grained sandstone, siltstone, and argillaceous sandstone. The overburden structure comprises multiple thick, weakly cemented interbedded sandy and muddy layers. The overall overburden exhibits weak mechanical properties. Borehole data reveal three thick soft rock layers (TS): TS-1 (50.56 m thick, 35.56 m above coal seam), TS-2 (59.45 m thick, 101.91 m above coal seam), and TS-3 (25.44 m thick, 180.9 m above coal seam). The WF layout and overburden distribution are shown in Figure 1.

Figure 1.
Layout plan and overburden distribution map of 1101 WF.
3. Theoretical Height Prediction of the “WCFZ” in Thick Coal Seam Mining
The accurate identification of the WCFZ is critical for mine safety and environmental protection. To improve prediction accuracy, researchers have refined these equations through statistical analysis based on region-specific geological conditions, incorporating different influencing factors and discrimination criteria [33]. Based on the background parameters of the 1101 WF, this paper compares modified empirical equations for weak overburden conditions with typical empirical equations, with results summarized in Table 1 and Figure 2. Among them, Equations (1)–(4) address the height prediction of the caving zone [11,12,13,15], while Equations (5)–(12) target the height prediction of the WCFZ [12,13,14,15,16,17,21].

Table 1.
Statistical prediction of “WCFZ”.
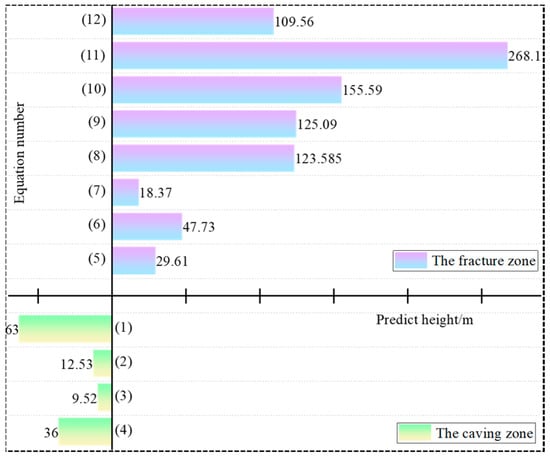
Figure 2.
Calculation results from predictive equations.
As shown in Figure 2, the calculation results of statistical equations for specific conditions or similar types of conditions exhibit significant variability and limited generalizability. This is primarily due to the distinct characteristics of the study subject, which involve the mining of an Ultra-Thick Coal Seam (UTCS) (18 m) and the unique mechanical behaviors of weakly cemented soft rock structures, such as low strength, high porosity, and susceptibility to softening. These properties differ considerably from those of conventional geological conditions. Additionally, the stress conditions induced by UTCS mining far exceed those under conventional mining thicknesses, causing the overburden failure mechanism to shift from typical shear failure to a tensile-composite failure. This further exacerbates the discrepancy between theoretical predictions and field measurements [34,35].
To address the limitations of traditional equations in this specific context, this study integrates fractal theory, similarity simulation, and field borehole measurements to investigate the development patterns and dynamic evolution characteristics of WCFZ in WCO during UTCS mining.
4. Similarity Simulation Study on Fractures in WCO During Ultra-Thick Coal Seam Mining
4.1. Physical Model Construction
To reveal the dynamic evolution law of mining-induced fractures in WCO during the working face advancement, this study established a similarity simulation model based on the actual geological conditions of the 1101 working face in the Zhundong No. 2 Mine and in accordance with the similarity theory [36], as shown in Figure 3. Based on the improved key stratum theory, the maximum height of a stable separation zone above the coal seam is approximately 260 m [37,38,39]. To ensure coverage of the core mining-affected zone and key strata, the model height was designed as 265 m. Accordingly, the model dimensions were determined as 4.2 m × 0.2 m × 1.3 m (length × width × height), with a geometric similarity ratio of 1:200 and a unit weight ratio of 1:1.6. A calculated uniformly distributed load was applied to the top to simulate the overburden pressure. The degree of cementation reflects the hardness of rock strata. Numerous studies use material ratios to simulate the hardness of coal and rock layers in similarity simulations [1]. The similar materials for coal and rock layers used fine river sand as aggregate, gypsum and calcium carbonate as cementing materials, with borax added as a coagulant. Beds were simulated using mica flakes. The mixing ratios of aggregate and cementing materials corresponding to coal and rock layers with different mechanical properties are summarized in Table 2. To minimize boundary effects, 0.5 m coal pillars were reserved on both sides of the model. The model was excavated cyclically from left to right, with each cycle advancing 0.05 m and an excavation height of 0.09 m. A high-resolution camera was used to continuously record overburden fracture and deformation during mining advancement. Combined with the XTDIC (version 9.0.0) system [36], surrounding rock displacement was monitored, revealing the damage and deformation characteristics of WCO UTCS mining disturbance.

Figure 3.
Similarity model layout.

Table 2.
Material proportions for a similar model.
4.2. Fracture and Deformation Evolution Characteristics of WCO
Based on the overburden failure patterns, key fracture stages during the WF advancement were selected for analysis, with partial results shown in Figure 4. During the initial mining stage, the immediate roof and lower weak rock layers collapsed simultaneously with coal excavation. As shown in Figure 4a, when the WF advanced to 100 m, vertical fractures developed up to the base of the TS-1. The strata between the coal seam roof and the TS-1 completely collapsed. The large mining height of 18 m prevented the collapsed rock from filling the goaf, resulting in a local unsealed bed separation(BST) 38 m above the coal seam roof. At this stage, the height of the WCFZ reached 38 m, with a height-to-mining ratio of 2.11. As shown in Figure 4b–d, as the WF advanced from 100 m to 150 m, the base of TS-1—which had been suspended for an extended period without continuous and effective support from the fragmented rock below—underwent layered tangential failure from bottom to top when its unsupported span exceeded the critical limit, under the combined effects of mining-induced stress and overburden load. Simultaneously, this process triggered the upward development of BST within the overlying strata. During this process, the WCFZ completely penetrated the TS-1. When the WF advanced to 150 m, the fracture zone height reached the top boundary of TS-1 at 80 m, with a height-to-mining ratio of 4.44. As the rock mass below TS-1′s top boundary fractured, the original BST space opened, forming a crescent-shaped BST fissure at the base of TS-2 (104 m above the coal seam roof).
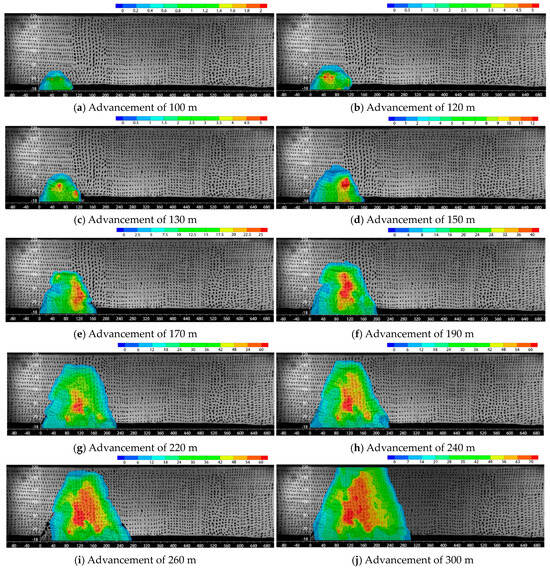
Figure 4.
Entire process of overburden fracture development.
As mining continued, the TS-2 became the dominant stratum controlling overburden deformation and failure. Under the combined effects of overburden load, self-weight, and mining-induced stress, TS-2 exhibited significant bending and subsidence. This caused synergistic deformation fractures in the weak interlayer between TS-1 and TS-2, leading to subsidence, collapse, and compaction. The BST at the base of TS-2 continued to expand. When the WF advanced to 170 m, the height of the WCFZ increased to 104 m, with a height-to-mining ratio of 5.78. The BST assumed a saturated crescent shape, as shown in Figure 4e. As the goaf span increased, the overlying strata above the BST at the base of the TS-2 continued to subside, gradually compressing the separation space. Simultaneously, interlayer separation developed within TS-2, though the rock remained intact without macroscopic fracture. As shown in Figure 4f, when the WF advanced to 190 m, the WCFZ expanded to 115 m, with a height-to-mining ratio of 6.39. A new BST was developed 130 m above the roof. As the WF advanced to 220 m, the unsupported span of the TS-2 continued to increase. Excessive bending moment and tensile stress caused its macroscopic fracture, leading to the rapid development of the WCFZ to 172 m. After the fracture of TS-2, the original BST gradually closed, with broken rock blocks rotating and compacting. This imposed new abutment pressure on TS-3, inducing BST fractures at its base (189 m above the roof), as shown in Figure 4g.
When the WF advanced beyond 260 m, overburden failure entered the fully mined stage. The maximum height of the WCFZ stabilized at 189 m, with a height-to-mining ratio of 10.5. BSTs within the TS-2 and lower strata closed completely due to rotation and compaction of fractured rock blocks, while a large-scale stable BST formed at the base of TS-3, as shown in Figure 4i.
4.3. Evolution Patterns of Overburden Displacement
After excavation, the collected images were imported into digital speckle software for calculation to obtain displacement nephograms of the similarity model. For clarity, the original images of the model were superimposed with the displacement nephograms to visualize overburden displacement at different advancement distances, as shown in Figure 4.
As shown in Figure 4a, after the immediate roof collapsed, the overburden displacement field exhibited a symmetrical arch-shaped distribution, with the maximum subsidence occurring at the center of the goaf. Figure 4b–d indicate that when the WF advanced to 120–150 m, the TS-1 fractured, triggering the first strong weighting. Due to significant subsidence at the goaf center, the displacement field maintained an arch-shaped pattern. The support provided by the coal wall and open-off cut face led to the formation of a crescent-shaped BST within the overburden.
As shown in Figure 4e–h, with further face advancement, the overburden displacement field transitioned from an “arch” to a “trapezoidal” pattern under the controlling influence of TS-2. Following the fracture and compaction of TS-2, overburden displacement increased sharply. BST fractures in the central goaf were progressively compacted, with the compaction zone expanding rapidly. In contrast, displacement near the open-off cut side and WF side remained relatively smaller than in the central goaf, resulting in boundary BST fractures with certain apertures. After the face advanced to 240–260 m, overburden displacement increased slightly before stabilizing. Maximum subsidence concentrated in the central goaf, while areas with smaller displacement on both sides showed more developed fractures. The overburden displacement field exhibited distinct zoning characteristics.
4.4. Fractal Dimension Evolution Characteristics of Fractures in WCO
To quantitatively characterize the development features of mining-induced fractures in WCO UTCS mining conditions, this study employs fractal dimension analysis [40]. The D of overburden fractures was calculated using the box-counting method (Equation (13)). A higher D value indicates more extensive fracture development. Based on planar photos of model fractures captured by a digital camera during similarity simulation experiments, key stages at different advancement distances were selected and processed using Photoshop (2020) for line drawing of the WF [41]. The images were then imported into ImageJ (version 1.51) for grayscale conversion and binarization, where white represented fractures and black denoted the rock matrix. D calculation was performed using the Fractal Box Count plugin [42], the resulting binary images of overburden fractures and their corresponding D values are shown in Figure 5.
where D is the fractal dimension; N(r) denotes the number of grid cells covering the entire fracture network; r represents the side length of the grid cells.
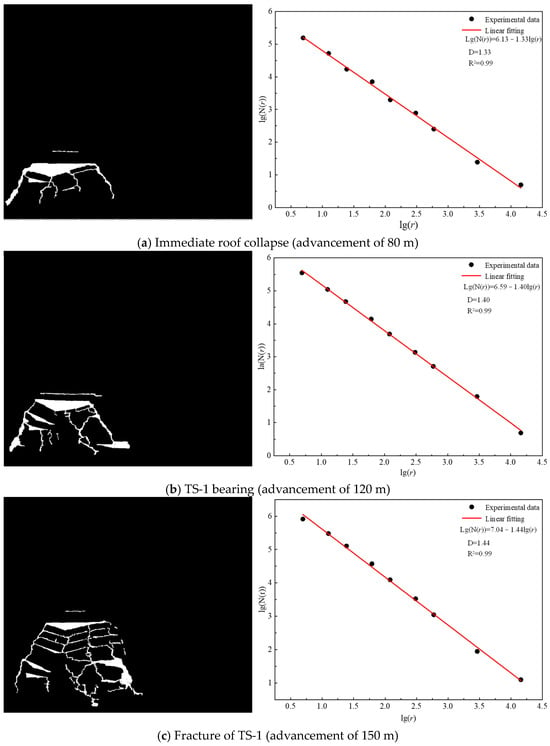
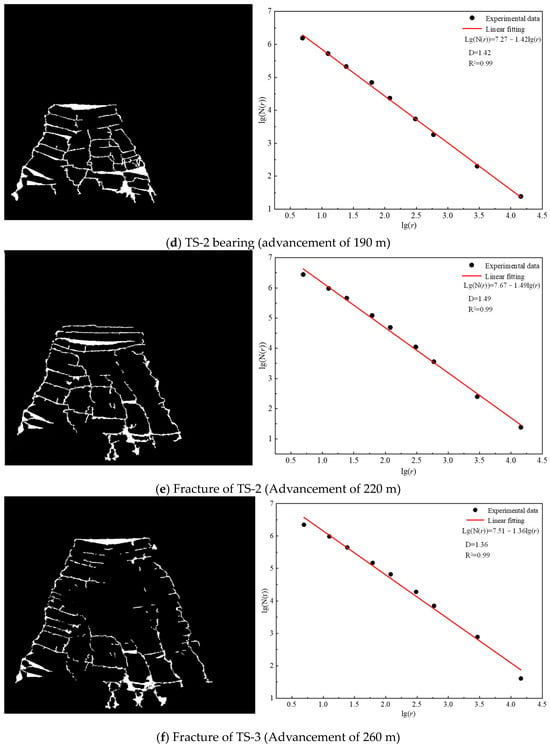
Figure 5.
A sketch and D of overlying rock fractures during the process of advancing the WF.
As shown in Figure 5, the correlation coefficients (R2) for D calculations all exceed 0.96, indicating that the evolution of mining-induced fracture networks in overburden exhibits significant fractal characteristics. During the WF advancement, the presence of multiple TS results in distinct BST features within the overburden. In Figure 5b, due to the load-bearing capacity of the TS-1, the D remains at only 1.33 when the fracture zone develops into its region, with a clear BST space observed below TS-1. As shown in Figure 5c, after the fracture of the TS-1, mining-induced fractures develop markedly, increasing the D to 1.44. At this stage, the fractures extend to below the TS-2.
Owing to the load-bearing effect of TS-2, the mining-induced fractures expanded laterally with the advancement of the WF, accompanied by bending disturbances in TS-2, increasing the D to 1.49 (Figure 5d). After the fracture of TS-2, near-field fractures were compacted, while far-field fractures expanded slightly due to the supporting role of TS-3, reducing the D to 1.36 (Figure 5e). The overburden subsequently reached full mining-induced stability, forming a stable BST space below TS-3, with the D stabilizing at 1.36 (Figure 5f). These results indicate that the D is influenced not only by the advancement distance but also by the structural stability of TS, which fundamentally governs the dynamic evolution of fracture networks.
Figure 6 illustrates the evolution of D at different advancement distances. Due to mining disturbances in the ultra-thick coal seam, the overlying strata undergo sequential collapse and fracture, leading to the interlaced evolution of BST and vertical fractures. This forms a complex fracture network above the WF. The presence of multiple TS results in a step-like dynamic pattern during advancement. The evolution of overburden fractures with mining progress reveals changes in rock mass structure, scientifically characterizing the stability of overlying strata and providing a theoretical basis for rational mining [41,43]. When the WF advanced to 80–100 m, overburden fractures developed below the TS-1, and the D began to gradually increase (1.13). At 130 m of advancement, the D rapidly rose to 1.4, representing a 23.89% increase. Due to the load-bearing effect of the TS-2, the D remained relatively stable during advancement to 170 m, with fractures expanding only laterally. The maximum D of approximately 1.49 was reached at 190 m of advancement. When the face advanced to 220 m, the fracture of TS-2 caused compaction of lower fractures while upper fractures continued to develop, reducing the D to 1.36 (an 8.7% decrease). After the fracture of TS-2, the TS-3 became the dominant controlling stratum. With further advancement, the D slightly increased and stabilized at 1.36–1.37 upon reaching full mining-induced stability, representing only a 0.74% increase.
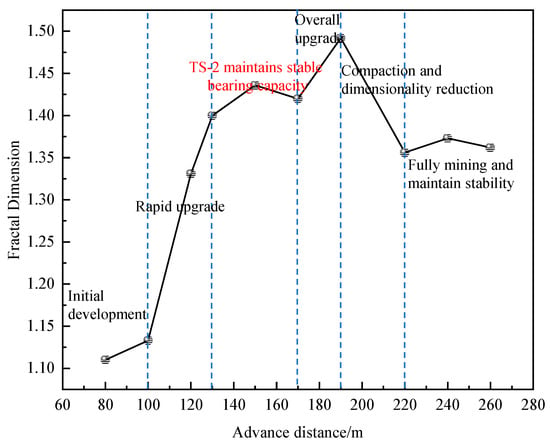
Figure 6.
The evolution law of D of overlying rock fractures during the process of advancing the WF.
4.5. Evolution Patterns of the WCFZ in WCO
Figure 7 shows the evolution of the height of the WCFZ in WCO UTCS mining. The height increases nonlinearly with WF advancement, which is attributed to the inhibitory effect of TS on fracture development [44]. Consequently, the development of the WCFZ progresses gradually during mining. Due to the inhibitory effect and creep characteristics of the near-field TS-1, the development of the WCFZ progressed slowly during the WF advancement from 100 to 150 m, with the height increasing from approximately 38 m to 80 m—a relative increase of 1.11 times. After the fracture of TS-1, the zone rapidly expanded into the interior of the TS-2. When the WF advanced to 220 m, the fracture of TS-2 caused the height to increase from 104 m to 172 m, a relative increase of 0.65 times. With further advancement, the zone extended into the TS-3. Upon reaching full mining-induced stability, the maximum height of the WCFZ reached 189 m, with a height-to-mining ratio of 10.5.
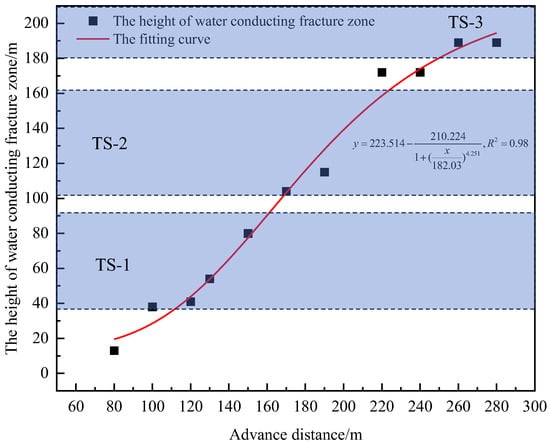
Figure 7.
The evolution law of WCFZ during the process of advancing the WF.
Additionally, after coal seam mining disturbance, the overlying strata fracture and collapse, forming a “three-zone” failure pattern. Within the caved and fractured zones, mining-induced fractures interlace vertically and horizontally, exhibiting active fracture network development. Figure 8 illustrates the correlation between the D of the overburden fracture network and the height of the WCFZ during WF advancement. As shown in Figure 7, overburden fractures began to develop gradually when the WF advanced to 100 m, marking the initial stage of fracture network formation. During the advancement from 100 to 170 m, fractures expanded rapidly in both spatial extent and depth, significantly increasing the complexity of the fracture network. From 170 to 220 m of advancement, the inhibitory effect and creep characteristics of the TS-2 slowed the growth of both D and fracture development. After 220 m of advancement, the complete fracture of TS-2 triggered coordinated failure with TS-1, leading to compaction of near-field collapsed blocks and partial fracture closure. This reduced the complexity of the fracture network and decreased the D. While fractures extended further into the far-field, the confined mining space and controlling influence of TS-3 rapidly stabilized the overburden fractures following the failure of TS-2. Based on the fluctuating evolution trend of the D of overburden fractures, the development of the WCFZ height is divided into three stages (Figure 8b): initial fracture development, vertical expansion, and stabilization. These stages quantitatively explain the developmental patterns and spatial distribution of overburden fractures during WF advancement [41].
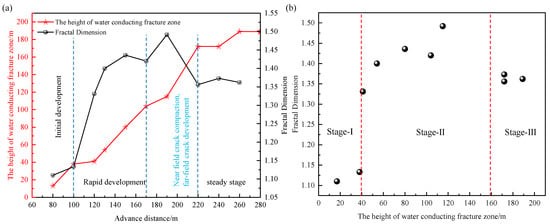
Figure 8.
Evolution characteristics of D of WCFZ height and overlying rock fractures: (a) the synergistic evolution law of D and WCFZ height; (b) the relationship between D and height of WCFZ.
5. Measured Development Height of the WCFZ in WCO
5.1. Borehole Layout and Design for Exploration
To investigate the development of the WCFZ during the mining of the 1101 WF, four surface boreholes (ZK-1, ZK-2, ZK-3, ZK-4) were designed within the study area. ZK-1 and ZK-2 are located 110 m and 60 m from the WF centerline, respectively, while T4 is positioned 400 m away. ZK-3 is situated 35 m inside the auxiliary transport roadway and 145 m behind the WF. The borehole distribution covers the entire development process of the WCFZ: ZK-1 and ZK-2 are in active development zones, ZK-3 is in a fully developed zone, and ZK-4 is in a stable zone. Methods, including borehole flushing fluid consumption statistics, water level observation, and borehole televiser monitoring, were employed to measure the WCFZ development. The specific borehole layout is shown in Figure 1.
5.2. Analysis of Detection Results
Analysis was conducted by correlating the flushing fluid consumption, water level, and televiser observations of each borehole with the corresponding stratigraphic lithology during drilling and monitoring, as shown in Figure 9, Figure 10 and Figure 11. Figure 9 indicates that Borehole ZK-1 exhibited a slight increase followed by a decrease in flushing fluid consumption at depths of 27 m, 63 m, and 76 m, with no significant drop in the water level. Based on borehole televiser observations of the hole wall and the geological column, this was attributed to fluid loss caused by drilling-induced damage in conglomerate and gravel-bearing sandstone layers. When the hole depth exceeded 140 m, the flushing fluid consumption suddenly increased to 1.7 m3/h, accompanied by fluctuating water level declines. Similar phenomena occurred at depths of 162 m, 225 m, 283 m, 302 m, 306 m, and 319 m, with the maximum flushing fluid consumption reaching 2.6 m3/h. Televiser observations revealed multiple large cavities and wall damage within the 140–320 m depth range. Combined with the geological column, these were identified as failures and voids resulting from BST in soft rock layers within the sandstone-mudstone interbeds of the curved subsidence zone. When the hole depth reached 346.5 m, the flushing fluid consumption surged abruptly, accompanied by a complete loss of circulation, and the water level dropped sharply to near the hole bottom. Televiser observations revealed multiple vertical fractures at this depth, confirming the entry into the top boundary of the WCFZ at approximately 164.5 m above the coal seam roof. At a depth of 444 m, the flushing fluid consumption increased again to 4.4 m3/h, accompanied by drill pipe sticking and jamming phenomena, indicating the entry into the top boundary of the caved zone at about 66 m above the coal seam roof.
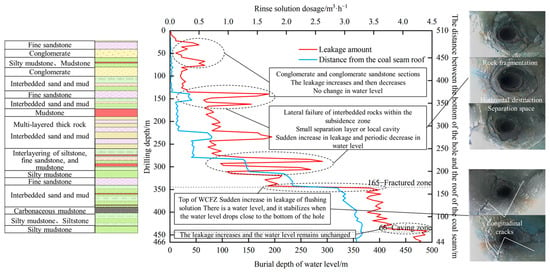
Figure 9.
Observation results of water level and flushing fluid inspection in Borehole ZK-1.
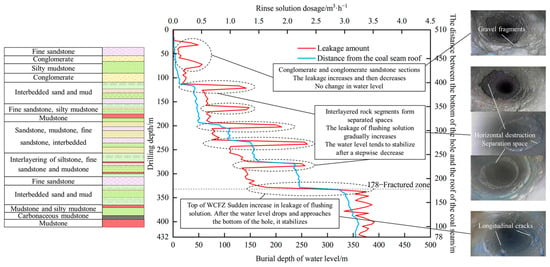
Figure 10.
Observation results of water level and flushing fluid inspection in Borehole ZK-3.
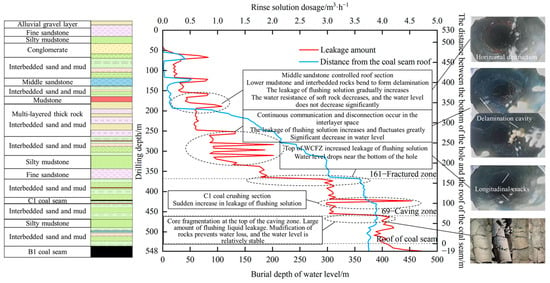
Figure 11.
Observation results of water level and flushing fluid inspection in Borehole ZK-4.
Figure 10 shows that the variations in flushing fluid consumption and water level in Borehole T3 above a 76.5 m depth were consistent with those in ZK-1. Televiser observations and the geological column confirmed that fluid loss in this section similarly resulted from drilling-induced damage in conglomerate and gravel-bearing sandstone layers. Multiple horizontal fractures and BST spaces were identified within the interbedded sandstone-mudstone structure of the curved subsidence zone at depths of 117 m, 162 m, 198 m, 234 m, and 279 m. Between 100 and 300 m depth, flushing fluid consumption exhibited a sharp increase followed by a decrease and gradual rise, peaking at 2.3 m3/h with an average consumption of 0.99 m3/h. The water level declined intermittently before stabilizing. At a depth of 332 m, fluid consumption surged to 3.4 m3/h, and the water level dropped near the hole bottom. Televiser observations revealed vertical fractures, indicating the top boundary of the WCFZ at approximately 178 m above the coal seam roof.
As shown in Figure 11, Borehole ZK-4 was protected by casing within 0–50 m. At 63 m depth, flushing fluid consumption showed a sudden increase followed by a decrease, accompanied by a minor temporary water level decline and subsequent recovery. Borehole televiser observations indicated severe damage and pre-existing fractures in the conglomerate section. Gradual increases in fluid consumption occurred at depths of 121.5 m, 157.5 m, and 184.5 m, with minor water level fluctuations but no significant decline. Based on televiser data and the geological column, this section was identified as coordinated deformation of medium sandstone, sandstone-mudstone interbeds, and mudstone, causing periodic fluid consumption rises while the water level remained stable due to the aquifuge effect of mudstone. At depths of 252 m, 283 m, 297 m, 310.5 m, and 337.5 m within thick sandstone-mudstone interbeds, significant horizontal fractures and BST cavities caused substantial fluctuations in fluid consumption and staged water level drops. At 369 m depth, fluid consumption surged with complete loss of circulation, and the water level dropped to the bottom. Televiser observations revealed vertical fractures, which increased in number and size with depth, confirming the top boundary of the WCFZ at approximately 161 m above the coal seam roof. At 423 m depth, a brief spike in fluid consumption occurred and then stabilized, identified as leakage from the fractured C1 thin coal seam based on the geological column. At 461 m depth, fluid consumption increased again, with loose, fragmented core and severe fractures indicating the top boundary of the caved zone at 69 m above the coal seam roof. As drilling reached the original coal seam roof at 530 m and advanced to the floor at 548 m, leakage gradually increased. The water level fluctuated but remained relatively stable due to the aquifuge effect of mudded, fragmented rock in the caved zone.
In summary, the mining of UTCS in WCO, characterized by low rock strength and an interbedded soft-hard strata structure, predominantly forms interlayer failure zones. This partially inhibits the development height and rate of the WCFZ, resulting in small but numerous, less pronounced fractures with a relatively limited affected area. Within the caved zone, fragmented rocks are prone to mudding and stacking, creating an aquifuge effect that maintains a stable water level above the fractured zone. Based on field measurements (Table 3), the caved zone height in the 1101 WF ranges approximately from 66 to 78 m (with a caving-to-mining ratio of 4.17–5.34), while the fractured zone height ranges from 161 to 178 m (with a fracture-to-mining ratio of 9.73–12.18). The developmental patterns of the “WCFZ” are illustrated in Figure 12.

Table 3.
Detection results of caving zone and fracture zone heights in boreholes.
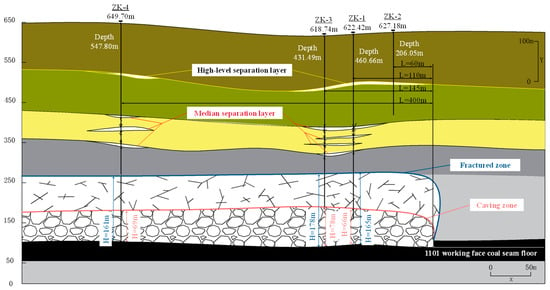
Figure 12.
Schematic diagram of “WCFZ” development.
6. Discussion
Based on empirical equation calculations for weak rock strata, quantitative characterization through similarity simulation, and field borehole measurements, this study investigates the evolutionary characteristics of the WCFZ in WCO under mining disturbance in UTCS in Xinjiang. Using the measured results as a benchmark for error analysis, it was found that the predictions from empirical equations are generally lower than the actual values. The mean error for the caved zone predictions is 61.11%, and for the fracture zone predictions, it is 52.25%. These results (Table 4) indicate that the geological characteristics of the Zhundong mining area in Xinjiang differ significantly from those of other studied regions, and existing prediction equations are not suitable for such engineering contexts.

Table 4.
Comparison of research results by different methods.
The development characteristics of mining-induced fractures are significantly influenced by the strength type of overlying strata. When the lithology is relatively hard, the fracture development height tends to be greater, whereas the presence of thick soft rock layers suppresses overburden failure, resulting in a relatively smaller fracture development height under softer lithological conditions [45,46]. According to mechanical test results (Figure 13), the overlying strata in this working face exhibit a uniaxial compressive strength of 4.5–27.8 MPa (average: 13.4 MPa), a uniaxial tensile strength of 0.48–2.5 MPa (average: 1.39 MPa), and an internal cohesion of 0.62–3.12 MPa (average: 1.64 MPa). Macroscopically, the strata are characterized by low strength, poor cementation, easy weathering, and underdeveloped small faults, joints, and bedding planes, displaying loose, fragmented, and weak properties. These features indicate soft or extremely soft overlying rock behavior, classifying them as typical WCO [1,39]. Therefore, the theoretical prediction equation system still requires extensive field measurement studies to be refined for the specific occurrence characteristics of WCO in Xinjiang mining areas. A comparative analysis of similarity simulation and field measurement results shows that, under the guiding and controlling influence of thick soft rock layers, the maximum height of the WCFZ is 189 m, with a maximum deviation of 11 m from the measured value and a relative error of only 6.2%, demonstrating the reliability of the research findings presented in this paper.
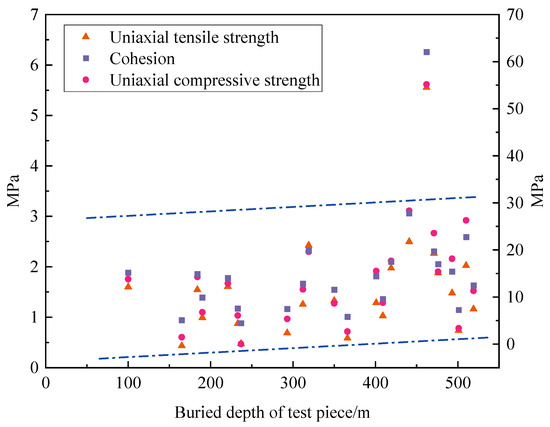
Figure 13.
Variations in uniaxial tensile strength, cohesion, and uniaxial compressive strength with specimen burial depth.
7. Conclusions
This study produced the following conclusions:
- (1)
- TS guides and controls the evolution of mining-induced fractures in WCO. The height of the WCFZ exhibits a non-linear increasing trend with WF advancement, reaching a maximum height of 189 m and a height-to-mining ratio of 10.5 upon achieving full mining-induced stability. BST spaces primarily develop beneath TS and propagate in a jumping manner following the rupture of these strata. The height of both fractures and BST shows a significant positive correlation with the WF advancement distance.
- (2)
- Under the influence of ultra-thick coal seam mining, the overburden displacement field transitions from an “arch-shaped” to a “trapezoidal” pattern in the WF advancement direction, exhibiting symmetrical distribution. Simultaneously, due to compaction effects of the overlying strata, the subsidence on the open-off cut side and WF side is significantly less than that in the central goaf, resulting in distinct zoning characteristics in the displacement field.
- (3)
- The evolution characteristics of mining-induced fractures in WCO were quantitatively characterized using D. Under the guiding and controlling role of TS, the D of overburden fractures exhibited a “step-like” dynamic evolution pattern. The maximum D reached 1.49 after the fracture of the TS-1. Following the fracture of TS-2, near-field fractures were significantly compacted, resulting in dimension reduction. The D stabilized at 1.36–1.37 when the WF reached full mining-induced stability.
- (4)
- Field borehole detection results indicate that the interbedded zones of WCO UTCS mining are prone to failure, which partially suppresses the development height and rate of the WCFZ. The caved zone exhibits high rock fragmentation, with fragmented rock masses showing cementation-like phenomena. At the 1101 WF of Zhundong No. 2 Mine, the measured caved zone height ranges from 66 to 78 m (caving-to-mining ratio: 4.17–5.34), and the WCFZ height ranges from 161 to 178 m (fracture-to-mining ratio: 9.73–12.18).
Author Contributions
Y.D.: conceptualization, methodology, writing—original draft, writing—review and editing, W.P.: conceptualization, methodology and revising, S.L. and B.C.: supervision and conce-ptualization, and K.Z.: investigation and data curation. All authors have read and agreed to the published version of the manuscript.
Funding
This research was funded by the College Students Innovation Training Program of China University of Mining and Technology-Beijing (202411029) and the National Key Research and Development Plan of China (No. 2023YFC2907501).
Data Availability Statement
The datasets generated and analyzed during the current study are available from the corresponding author upon reasonable request.
Conflicts of Interest
The authors declare no competing interests.
References
- Wang, J.; Chen, J.; Pan, W.; Peng, B.; Deng, C. Strong ground pressure mechanism and arched face controltechnology during slicing longwall top coal caving in ultra thickcoal seam. J. China Coal Soc. 2025, 1–18. [Google Scholar] [CrossRef]
- Cai, J.L.; Tu, M.; Zhang, H.L. Deformation and instability mechanism and control technology of mining gateway for Jurassic weak-cemented soft rock roadways. J. Min. Saf. Eng. 2020, 37, 1114–1122. [Google Scholar]
- Sun, L.; Jiang, Z.; Long, Y.; Ji, Q.; Wang, Z.; Fan, Y.; Hao, Y. Influence of mesoscopic parameters of weakly cemented rocks on macroscopic mechanical properties. Sustainability 2022, 14, 13308. [Google Scholar] [CrossRef]
- Zhang, G.; Guo, G.; Wei, W.; Wang, J.; Li, H.; Du, Q. Mechanical properties and failure mechanism of the weakly cemented overburden in deep mining. Minerals 2022, 12, 1276. [Google Scholar] [CrossRef]
- Miao, S.J.; Yang, P.J.; Huang, Z.J.; Wang, H.; Liang, M.C. Effects of confining pressure on failure mechanism of porous and weakly cemented rock and compaction-damage constitutive model. J. China Univ. Min. Technol. 2023, 52, 229–240. [Google Scholar]
- Ghabraie, B.; Ren, G.; Barbato, J.; Smith, J.V. A predictive methodology for multi-seam mining induced subsidence. Int. J. Rock Mech. Min. Sci. 2017, 93, 280–294. [Google Scholar] [CrossRef]
- Wang, S.; Li, X. Dynamic distribution of longwall mining-induced voids in overlying strata of a coalbed. Int. J. Geomech. 2017, 17, 04016124. [Google Scholar] [CrossRef]
- Zhang, B.; Sun, H.; Liang, Y.; Wang, K.; Zou, Q. Characterization and quantification of mining-induced fractures in overlying strata: Implications for coalbed methane drainage. Nat. Resour. Res. 2020, 29, 2467–2480. [Google Scholar] [CrossRef]
- Meng, Q.B. Study on Structure and Mechanical Properties and Constitutive Model of Very Weakly Cemented Rock. Ph.D. Thesis, China University of Mining and Technology, Xuzhou, China, 2014. [Google Scholar]
- Wang, Z.; Li, W.; Wang, Q.; Liu, S.; Hu, Y.; Fan, K. Relationships between the petrographic, physical and mechanical characteristics of sedimentary rocks in Jurassic weakly cemented strata. Environ. Earth Sci. 2019, 78, 131. [Google Scholar] [CrossRef]
- Meng, Q.; Qian, W.; Han, L.J.; Wei, L.; Wang, C.; Zhou, X. Experimental study on formation mechanism and mechanical properties of regenerated structure of very weak cemented rock mass. Rock Soil Mech. 2020, 41, 799–812. [Google Scholar]
- Meng, Q.B.; Han, L.J.; Qiao, W.G.; Lin, D.G.; Wen, S.Y.; Zhang, J. Deformation failure characteristics and mechanism analysis of muddy weakly cemented soft rock roadway. J. Min. Saf. Eng. 2016, 33, 1014. [Google Scholar]
- Meng, Q.B.; Han, L.J.; Qiao, W.G.; Lin, D.G.; Wen, S.Y.; Zhang, J. Elastic-plastic analysis of the very weakly cemented surrounding rock considering characteristics of strain softening and expansion. J. China Univ. Min. Technol. 2018, 47, 760–767. [Google Scholar]
- Zhang, Y.; Shao, J.F.; Xu, W.Y.; Zhao, H.B.; Wang, W. Experimental and numerical investigations on strength and deformation behavior of cataclastic sandstone. Rock Mech. Rock Eng. 2015, 48, 1083–1096. [Google Scholar] [CrossRef]
- Wang, H.; Yang, T.H.; Xu, T. Acoustic emission characteristics and failure patterns of a weak cemented sandstone under uniaxial compression: Xiaojihan coal mine in Shanxi as a case. J. China Coal Soc. 2014, 43, 39–45. [Google Scholar]
- Wang, H.; Yang, T.H.; Yu, Q.L. Constitutive relationship of the sandstone from Yuheng mining area under different confining pressures. J. China Coal Soc. 2015, 40, 320–327. [Google Scholar]
- Zhao, Y.C.; Yang, T.H.; Xiao, F.K.; Wang, H.; Liu, G.; Zheng, X.; Zhou, J.R.; Shen, Z.L. The variation law of plastic strain energy of western weak cemented sandstone during cyclic loading experiment. J. China Coal Soc. 2015, 40, 1813–1819. [Google Scholar]
- Sun, L.H. Structural evolution and rock pressure activity regularity of weakly cemented strata of the large mining height work face in Western China. Chin. J. Rock Mech. Eng. 2017, 36, 1820. [Google Scholar]
- Sun, J.; Liu, J.; Han, D.; Li, N. Prediction of water-flowing fractured zone height in fully mechanized caving mining with extremely weakly cemented overburden. Mine Surv. 2012, 2, 19–21. [Google Scholar]
- Ma, D.; Duan, H.; Zhang, J.; Li, Q.; Li, Z.; Hou, W.; Du, F. Creep-erosion coupling water inrush model of weakly cemented fault rock mass. Meitan Xuebao/J. China Coal Soc. 2023, 48, 2453–2464. [Google Scholar]
- Ma, J.; Tong, X.; Li, C. Study on movement laws and permeability evolution features of mining-induced overburden in weakly cemented strata. Coal Sci. Technol. 2020, 48, 11–16. [Google Scholar]
- Fan, L.M.; Zhang, X.T.; Xiang, M.X.; Zhang, H.Q.; Shen, T.; Lin, P.X. Characteristics of ground fissure development in high intensity mining area of shallow seam in Yushenfu coal field. China Coal Soc. 2015, 40, 1442–1447. [Google Scholar]
- La Pointe, P.R. A method to characterize fracture density and connectivity through fractal geometry. Int. J. Rock Mech. Min. Sci. Geomech. Abstr. 1988, 25, 421–429. [Google Scholar] [CrossRef]
- Hatton, C.G.; Main, I.G.; Meredith, P.G. Non-universal scaling of fracture length and opening displacement. Nature 1994, 367, 160–162. [Google Scholar] [CrossRef]
- Liu, J.; Sui, W.; Duan, Z.; Ma, X. Quantitative correlation between fracture fractal and overburden deformation due to the multiple layers backfill mining. Bull. Eng. Geol. Environ. 2025, 84, 65. [Google Scholar] [CrossRef]
- Ran, Q.; Liang, Y.; Zou, Q.; Zhang, B.; Li, R.; Chen, Z.; Ma, T.; Kong, F.; Liu, H. Characteristics of mining-induced fractures under inclined coal seam group multiple mining and implications for gas migration. Nat. Resour. Res. 2023, 32, 1481–1501. [Google Scholar] [CrossRef]
- Liang, T.; Liu, X.; Wang, S. Fractal study on the crack network evolution and permeability change in mining rock mass. J. China Coal Soc. 2019, 12, 3729–3739. [Google Scholar]
- Xing, J.C.; Liang, B.; Fang, S.J.; Sun, W.J.; Ren, J.; Zhang, S.N. Study on fractal-permeability characteristics under overburden fracture recon-struction. J. China Coal Soc. 2025, 1–13. [Google Scholar] [CrossRef]
- Zhao, P.X.; Pei, W.B.; Li, S.G.; Jia, Y.Y.; Lin, H.F.; Yang, J.S. Fractal sequential evolution mechanism of fractured rock masses in adjacent goaf under layered mining of ultra-thick coal seam. J. China Univ. Min. Technol. 2024, 53, 696–709. [Google Scholar]
- Zhao, P.; Chang, Z.; Li, S.; Shao, Q.; Pei, W. Study on Time-Varying Mechanism of Energy Dissipation Structure in Depressed-Pressure Gas Transport and Storage Area of Inclined Thick Coal Seam Mining. Zhongguo Kuangye Daxue Xuebao/J. China Univ. Min. Technol. 2025, 54, 202–214. [Google Scholar]
- Song, Y.J.; Cheng, G.Q.; Guo, W.J. Study of distribution of overlying strata fissures and its porosity characteristics. Rock Soil Mech. 2011, 32, 533–536. [Google Scholar]
- Mei, F.; Shang, Y.; Kong, D.; Zhang, P.; Zhang, L.; Wu, S. DIC-based similar simulation study on the evolution patterns of mining-induced fracture, displacement and strain in close distance coal seam. J. Min. Sci. Technol. 2024, 9, 519–528. [Google Scholar]
- Cui, X.; Che, Y.; Sun, S.; Li, P.; Sun, H.; Xu, Z.; Yuan, D.; Jiang, J.; Zhao, Y.; Malinowska, A. Some key problems on estimation of height of water-conducting fractured zone for thick coal seam top coal caving. J. Min. Sci. Technol. 2025, 10, 573–583. [Google Scholar]
- Zhang, K.; Long, J.; Wang, X. Experimental study on mechanical properties of clayey mudstone under mining-induced stress paths. Coal J. 2025. [Google Scholar] [CrossRef]
- Ji, H.; Jiang, H.; Song, Z.; Liu, Z.; Tan, J.; Liu, Y.; Wu, Y. Meso-structure evolution and fracture morphology analysis of weakly cemented sandstone during water softening. Coal J. 2018, 43, 993–999. [Google Scholar]
- Li, L.; Kong, D.; Liu, Q.; Cai, H.; Chen, L. Study on law and prediction of surface movement and deformation in mountain area under repeated mining of shallow coal seam. Bull. Eng. Geol. Environ. 2023, 82, 76. [Google Scholar] [CrossRef]
- Guo, W.; Wu, D.; Guo, M.; Hu, Y.; Yang, W.; Wang, B. Multi-bed separation grouting in “three soft” thick coal seams mining and their application. Coal Sci. Technol. 2025, 53, 1–12. [Google Scholar]
- He, J.; Li, W.; Fan, K.; Qiao, W.; Wang, Q.; Li, L. A method for predicting the water-flowing fractured zone height based on an improved key stratum theory. Int. J. Min. Sci. Technol. 2023, 33, 61–71. [Google Scholar] [CrossRef]
- Zhang, C.; Ren, Z.; He, J.; Zhao, X. Fractal Evolution Characteristics of Weakly Cemented Overlying Rock Fractures in Extra-Thick Coal Seams Mining in Western Mining Areas. Fractal Fract. 2025, 9, 531. [Google Scholar] [CrossRef]
- Xie, H.P.; Yu, G.M.; Yang, L.; Zhang, Y.Z. Research on the fractal effects of crack network in overburden rock stratum. Chin. J. Rock. Mech. Eng. 1999, 18, 147–151. [Google Scholar]
- Wang, Z.; Zhou, H.; Xie, H. Research on fractal characterization of mined crack network evolution in overburden rock stratum under deep mining. Rock Soil Mech. 2009, 30, 2403–2408. [Google Scholar]
- Ling, C.; Liu, B.; Zhang, C.; Teng, T.; Zhang, K.; Sun, B.; Zhou, J. Fractal characteristics of overburden rock fractures and their impact on ground fissures in longwall coal mining. Fractal Fract. 2023, 7, 699. [Google Scholar] [CrossRef]
- Zhou, H.W.; Zhang, T.; Xue, D.J.; Xue, J.H. Evolution of mining-crack network in overburden strata of longwall face. J. China Coal Soc. 2012, 36, 1957–1962. [Google Scholar]
- Guo, W.; Lou, G.; Zhao, B. Study on the height of water-conductive fracture zone in alternate overburden of soft and hard with top coal caving mining in Lugou coal mine. J. Min. Saf. Eng. 2019, 36, 519–526. [Google Scholar]
- Li, J.; Wang, D.; Li, L.; Guo, W. Comparative study on development characteristics of high-strength mining fissures in different overburden types. Coal Sci. Technol. 2023, 49, 9–15. [Google Scholar]
- Chen, L.; Wu, B.; Xu, X.K.; Shang, R. Determination of overburden failure height in alternate strata of mudstone and sandstone with fully mechanized caving method. J. Min. Saf. Eng 2017, 34, 431–436. [Google Scholar]
Disclaimer/Publisher’s Note: The statements, opinions and data contained in all publications are solely those of the individual author(s) and contributor(s) and not of MDPI and/or the editor(s). MDPI and/or the editor(s) disclaim responsibility for any injury to people or property resulting from any ideas, methods, instructions or products referred to in the content. |
© 2025 by the authors. Licensee MDPI, Basel, Switzerland. This article is an open access article distributed under the terms and conditions of the Creative Commons Attribution (CC BY) license (https://creativecommons.org/licenses/by/4.0/).