Article

An Improved Rock Resistivity Model Based on Multi-Fractal Characterization Method for Sandstone Micro-Pore Structure Using Capillary Pressure

1
School of Petroleum, China University of Petroleum (Beijing) at Karamay, Karamay 834000, China
2
State Key Laboratory of Petroleum Resources and Prospecting, China University of Petroleum (Beijing), Beijing 102249, China
3
China Petroleum Logging Co., Ltd., Xi’an 710000, China
*
Authors to whom correspondence should be addressed.
Fractal Fract. 2024, 8(2), 118; https://doi.org/10.3390/fractalfract8020118
Submission received: 20 December 2023 / Revised: 10 January 2024 / Accepted: 12 February 2024 / Published: 16 February 2024
(This article belongs to the Special Issue Fractal Analysis and Its Applications in Geophysical Science)

Abstract

:
Micro-pore structures are an essential factor for the electrical properties of porous rock. Theoretical electrical conductivity models considering pore structure can highly improve the accuracy of reservoir estimation. In this study, a pore structure characterization method based on a multi-fractal theory using capillary pressure is developed. Next, a theoretical electrical conductivity equation is derived based on the new pore structure characterization method. Furthermore, a distinct interrelationship between fractal dimensions of capillary pressure curves ( D v ) and of resistivity index curves ( D t and D r ) is obtained. The experimental data of 7 sandstone samples verify that the fitting result by the new pore structure characterization method is highly identical to the experimental capillary pressure curves, and the accuracy of the improved rock resistivity model is higher than the Archie model. In addition, capillary pressure curves can be directly converted to resistivity index curves according to the relationship model between fractal dimensions of capillary pressure curves ( D v ) and resistivity index curves ( D t and D r ). This study provides new ideas to improve the accuracy of pore structure characterization and oil saturation calculation; it has good application prospects and guiding significance in reservoir evaluation and rock physical characteristics research.

1. Introduction

Rock electrical properties are an essential foundation for rock materials, geophysics, geological evaluation, and hydrology research [1,2,3]. The micro-pore structure has a significant impact on the electrical resistivity characteristics of porous rock [4]. In recent years, mechanism analyzations and quantitative characterizations of the impact of micro-pore structures on electrical resistivity become the focus of attention of domestic and overseas rock physicists, geologists, and materials scholars [5,6].
The capillary pressure curve is one of the commonly used pore structure characterization methods [7,8,9]. To calculate pore structure parameters, many mathematical models for capillary pressure are developed [4], such as the mean capillary pressure curve function [10], power function [11], J function [12], and the Brooks-Corey model [13,14]. Since fractal geometry theory was proposed by Mandelbrot [15] in the 1970s, it has been widely used in petroleum geology [16,17,18]. Lots of studies show that sandstone pore structure exhibits fractal characteristics, and the fractal theory can be extended to apply in pore structure characterization method from capillary pressure curve and nuclear magnetic resonance T2 spectrum for porous media of sedimentary rock [19,20,21]. For instance, Gao et al. conducted a fractal analysis of dimensionless capillary pressure function [22]. Liu et al. utilized fractal geometry to develop an improved capillary pressure model for coal rock [23]. Li et al. applied fractal geometry to derive a Brooks–Corey-type capillary pressure model [24]. The fractal geometry provides a new method for pore structure characterization; however, existing studies mainly focus on single-dimension fractal features, and its characterization accuracy for complex pore structures is limited [25].
To improve the accuracy of mathematical models that quantitatively describe rock electrical properties, many researchers analyze and extend the Archie model [26,27]. In addition, many rock conductivity models that consider pore structure are derived [28,29], and the fractal theory-based electrical models attracted a lot of attention [30,31]. Rembert et al. derived a fractal model for the electrical conductivity of water-saturated porous media and analyzed the relationship of Archie’s resistivity index with fractal dimension [32,33]. Shi Y et al. evaluated relative permeability from resistivity data using fractal dimension [34]. Luo et al. developed a capillary bundle model for the electrical conductivity of saturated frozen porous media based on fractal theory [35]. Cai et al. investigated the fractal-based electrical conductivity models in saturated porous media [1]. However, on the one hand, the application of rock conductivity models considering pore structure is limited by the agreement of theoretical and actual pore structure [36]. On the other hand, although fractal-based rock conductivity models are applied widely, they mainly analyze the relationship of fractal dimension with pore structure and rock electrical properties; \ studies investigating fully analytical expressions between electrical conductivity and physical parameters are rare [37].
In this study, a pore structure characterization method based on a multi-fractal theory using capillary pressure is developed; it is mathematically identical to power or J functions for homogeneous porous rock. Next, a theoretical electrical conductivity equation is derived based on the new pore structure characterization method. The proposed model is expressed in terms of the capillary length fractal dimension D t , pore fractal dimension D r , and pore volume S 1 . Parameters c and d are determined from experimental capillary pressure and resistivity data. A distinct interrelationship between fractal dimensions of capillary pressure curves ( D v ) and of resistivity index curves ( D t and D r ) is obtained. Furthermore, the relationship between the fractal dimension ( D t and D r ) and Archie parameters (m and n) is analyzed. A total of seven carboniferous clastic sandstone samples in Junger Basin are selected for model validations. The result shows that the fitting result of capillary pressure by the new multi-fractal characterization method is highly identical to experimental data, and the new resistivity model has higher accuracy than the Archie model. In addition, capillary pressure curves have a similar pattern with resistivity index curves; the fractal feature parameters D v , 1 , D v , 2 , c, and d are strongly dependent on pore structure properties, they have good relationships with K / ϕ , and the pore structure typing result by D v , 1 and c is in accordance with that according to the morphology of capillary pressure curve. Also, the increment of c is an indication of pore structure improvement, and as d increases, pore structure gets poor. Finally, we find that the multi-fractal feature of the pore structure is the main reason for non-Archie resistivity and non-power function capillary pressure relationships.

2. Mathematical Derivations of a Resistivity Model Based on Multi-Fractal Characterization Method for Sandstone Micro-Pore Structure Using Capillary Pressure

2.1. Multi-Fractal Characterization Method for Sandstone Micro-Pore Structure Using Capillary Pressure

We assume that the porous medium is represented as a pore fractal. Applying fractal geometry, the porosity ϕ of the pore fractal is expressed as [38]
ϕ = r min r max 3 D r
where, r ( μ m ) is the diameter of a pore and D r is between 0 < D r < 3 . r min   ( μ m ) and r max ( μ m ) are the minimum and maximum fractal pore sizes, respectively.
According to fractal geometry of porous media and Laplace equation, the relationship between capillary pressure P c and saturation S v is expressed as [21]
S v = P c m i n P c 3 D v
where S v % is the pore volume with the capillary pressure greater than P c , P c m i n ( M p a ) is the displacement pressure, and D v is the fractal dimension of the pore throat size determined by the capillary pressure curve.
Existing analyses show that compared with macro-pore space, which can approximate a circular shape on the plane, micro-pores usually exhibit more complex and tortuous shapes [39]. As rock pore structure complexity and heterogeneity at different pore scales become stronger, the pore fractal displays become a multi-fractal feature [40,41].
Divide rock pores into two geometry types of pores, as shown in Figure 1, and assume each type of pores satisfies the self-similarity characteristics of pore volume distribution, pore size, and pore throat structures. Then, the porosity ϕ is the sum of two-pore fractals, as follows.
ϕ = r min , 1 r max , 1 3 D r , 1 + r min , 2 r max , 2 3 D r , 2
In Equation (3), ϕ 1 = r min , 1 r max , 1 3 D r , 1 , ϕ 2 = r min , 2 r max , 2 3 D r , 2 . Subscript 1 and 2 are for first and second type pores, respectively.
According to Equation (2), for each type of pores, the relationship between capillary pressure P c and saturation S v is expressed as
S v , 1 = P c m i n , 1 P c 3 D v , 1 S v , 2 = P c m i n , 2 P c 3 D v , 2
for S v = S v , 1 ϕ 1 + S v , 2 ϕ 2 ϕ , then
S v = S 1 P c m i n , 1 P c 3 D v , 1 + 1 S 1 P c m i n , 2 P c 3 D v , 2
In Equation (5), S 1 = ϕ 1 ϕ .
Equation (5) is a multi-fractal characterization method for a sandstone micro-pore structure using capillary pressure.
To reduce non-parameters, according to power function, assume only one c satisfies P c m i n , 2 P c 3 D v , 2 = P c m i n , 1 P c c 3 D v , 1 , Equation (5) is simplified as
S v = S 1 P c m i n , 1 P c 3 D v , 1 + 1 S 1 P c m i n , 1 P c c 3 D v , 1
Consequently, in a model constructed of homogeneous porous rock, Equation (5) reduces to
S v = P c P c m i n D
Equation (7) is mathematically identical to power or J functions [11,12]. D is a power function exponent.

2.2. An Improved Rock Resistivity Model Considering Pore Structure

Pores are usually assumed to be curved capillaries with different diameters in seepage and conductivity analysis of pore fluids. According to the fractal theory, the conductivity of water-saturated rock σ 0 is expressed as [38]
σ 0 σ c ϕ 1 + D t 1 / 3 D r
where D t is the capillary length fractal dimension, 1 D t . D r is the pore fractal dimension, 0 D r 3 . σ c is the conductivity of pore water.
We assume non-wetting phase fluids are non-conductive, as non-wetting phase fluids prefer large pore spaces during the seepage process; electrical conductivity σ t is disabled to reflect large pore spaces filled with non-wetting fluids. The electrical conductivity σ t is expressed as
σ t σ c ϕ i 1 + D t 1 / 3 D r
where ϕ i is the residue porosity not occupied by non-wetting phase fluids, and ϕ i = S w ϕ .
At the same time, the conductive tortuosity changes as non-wetting phase fluids enter into pore throats. Equation (9) is rewritten as
σ t σ c ϕ   1 + D t 1 / 3 D r S w 1 +   D t , i 1 / 3 D r
In Equation (10), D t , i is the capillary length fractal dimension under water saturation S w .
Equation (10) can be approximately expressed as
S w σ 0 σ t 1 + D t , i 1 / 3 D r
Comparing Equation (11) with the Archie Model [26],
σ c σ 0 = a ϕ m σ 0 σ t = b S w n
We find the relationship between fractal dimensions and Archie parameters,
m = 1 + D t 1 / 3 D r n = 1 + D t , i 1 / 3 D r
Equation (13) indicates that both m and n strongly depend on the micro-pore structure properties of porous media, the fractal dimension D t and D r . In addition, D t and D t , i can be determined when n, m and D r are known parameters.
Comparing Equations (2) and (11) yields
1 + D t , i 1 / 3 D r = d 3 D v
In Equation (14), according to the similarity between S w and S v , we assume P c m i n P c = σ 0 σ t d . The capillary pressure curve can be directly converted to resistivity curve when d is determined.
Combining Equations (6) and (14), a rock resistivity model considering pore structure is developed.
S w = S 1 σ 0 σ t 1 + D t , 1 1 / 3 D r , 1 + 1 S 1 σ 0 σ t c 1 + D t , 1 1 / 3 D r , 1
The new rock resistivity model can also be written as follow according to Equation (14).
S w = S 1 σ 0 σ t d 3 D v , 1 + 1 S 1 σ 0 σ t c b 3 D v , 1

3. Model Validation

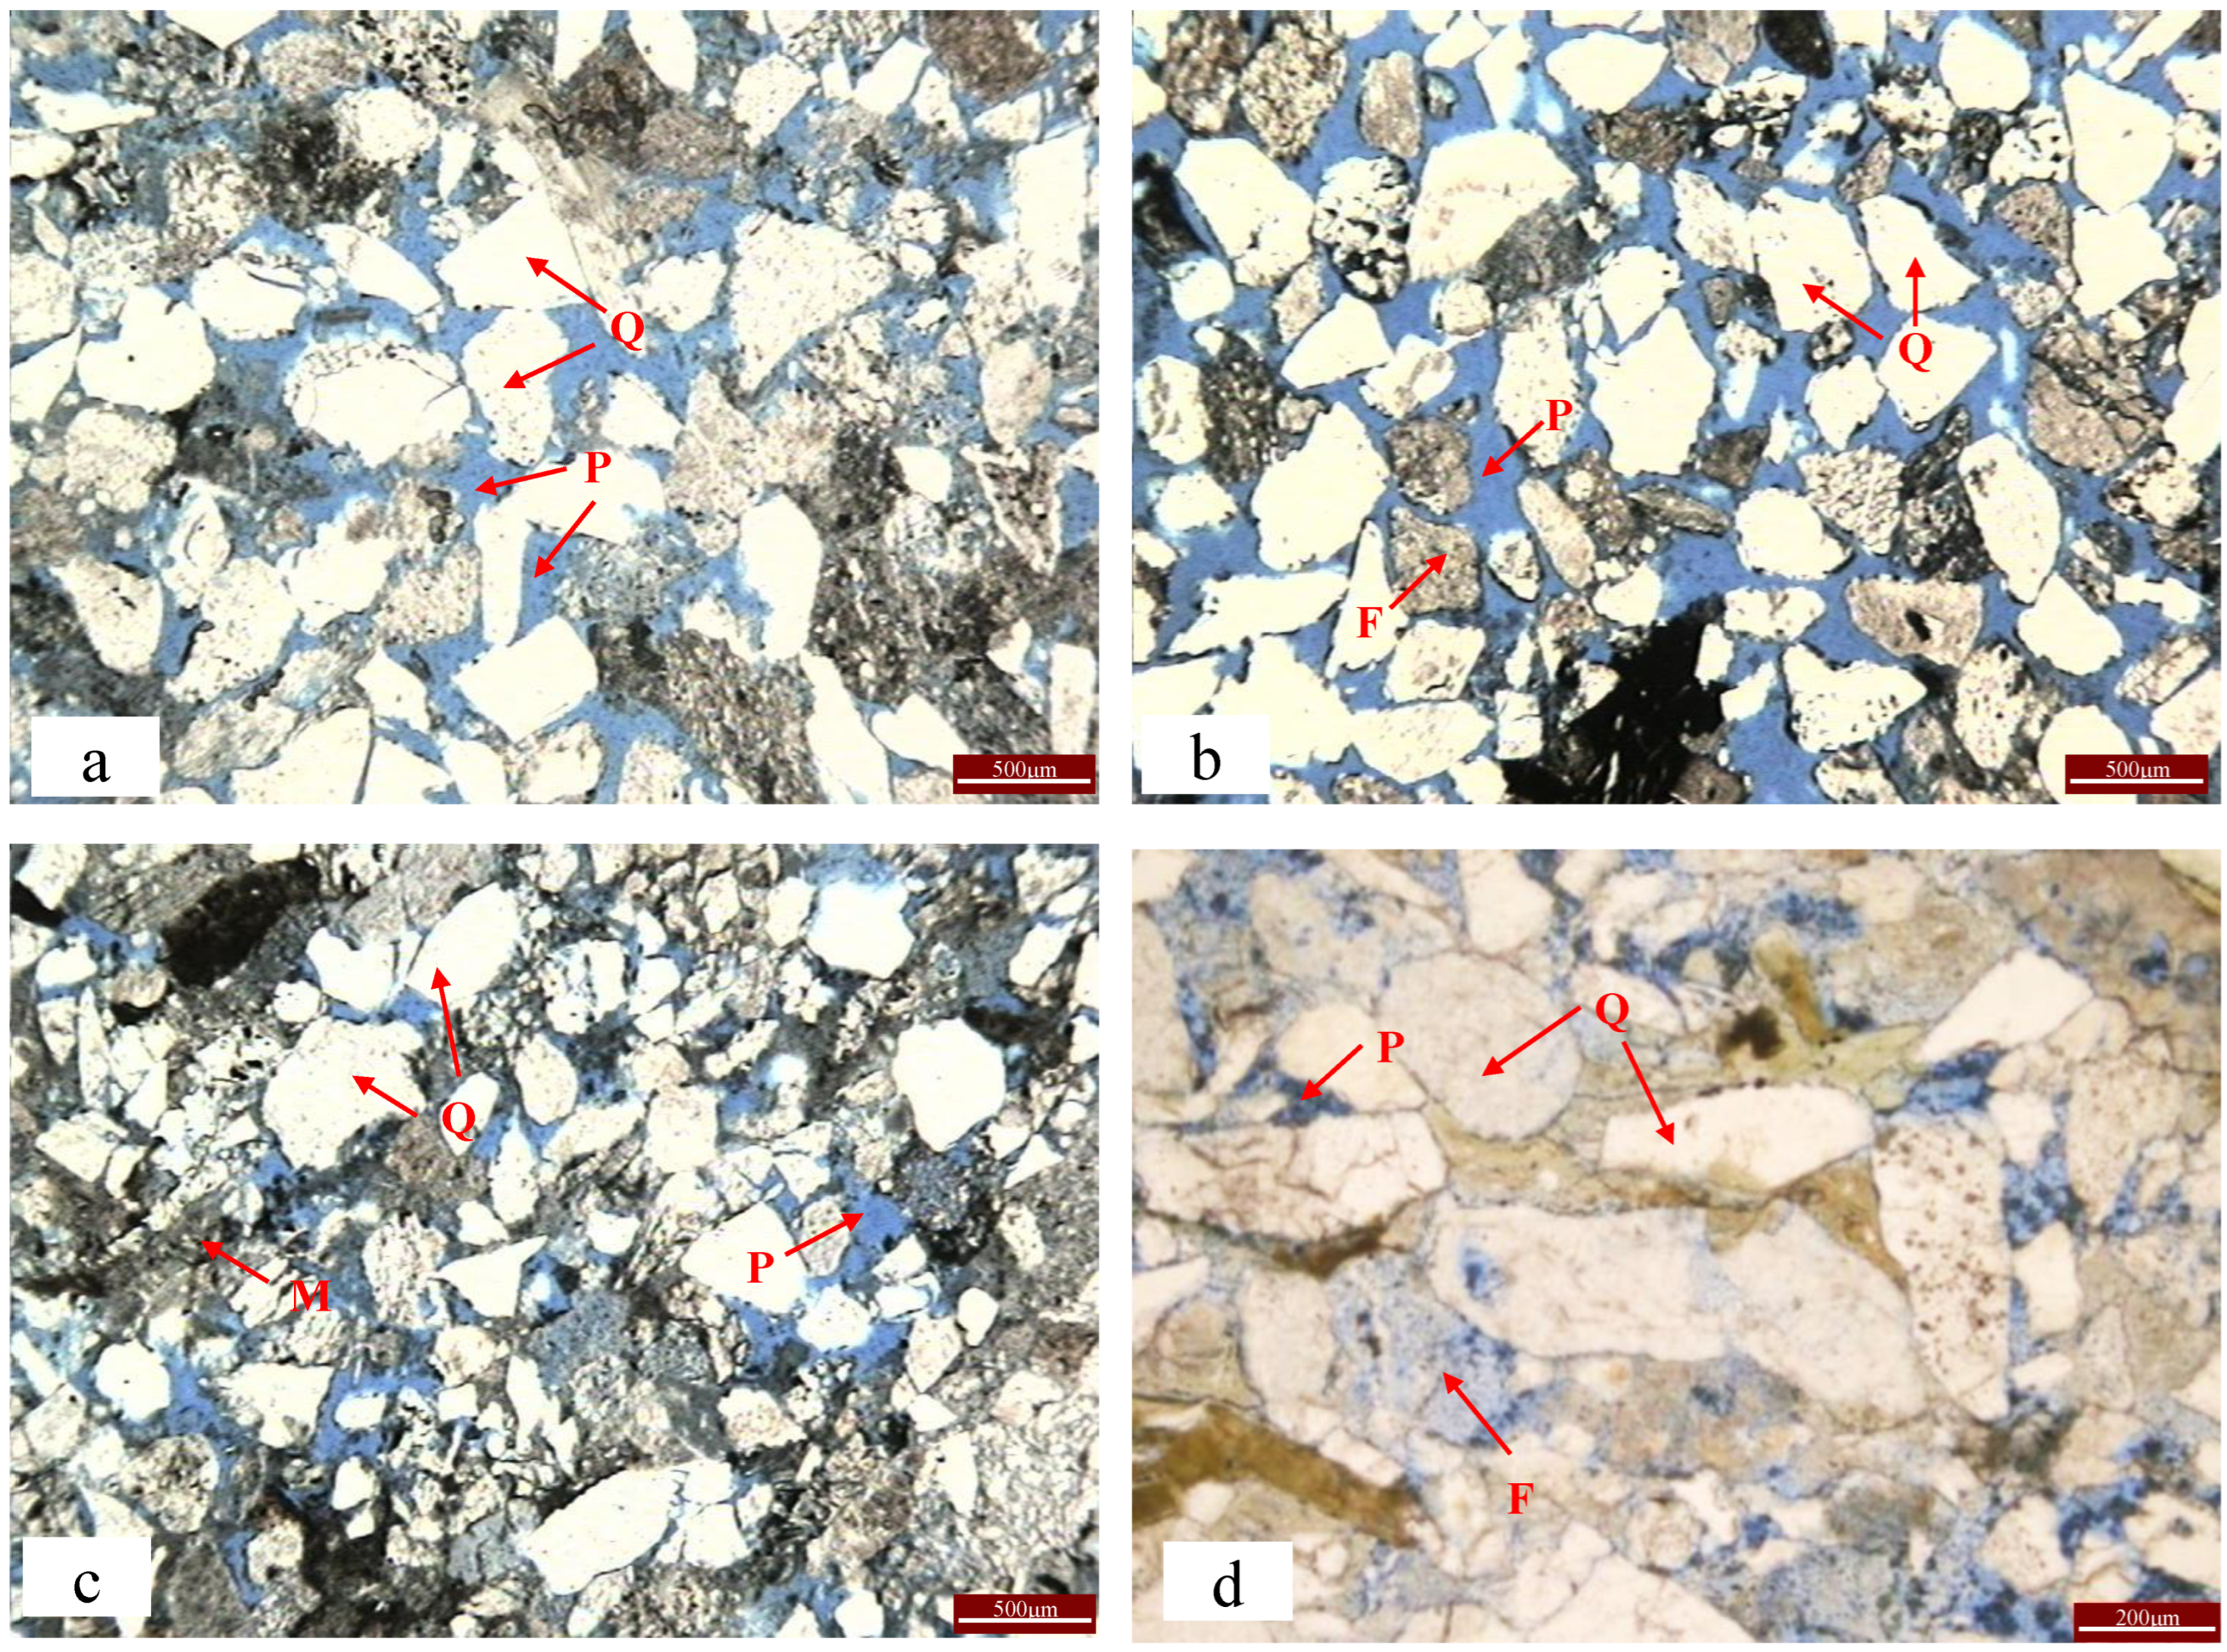
For model validation, a total of seven Carboniferous clastic sandstone samples selected in Junger Basin are taken for porosity, permeability, rock resistivity, and capillary pressure experiments. Figure 2 shows thin-section photomicrographs of dominant lithology in the study area. Figure 2a–d are from samples 1, 2, 5, and 7, respectively. Rock samples belong to medium to high porosity and permeability sandstone; the dominant lithology is quartz and feldspar. Capillary pressure curves and resistivity are measured by mercury intrusion and DC method, respectively.
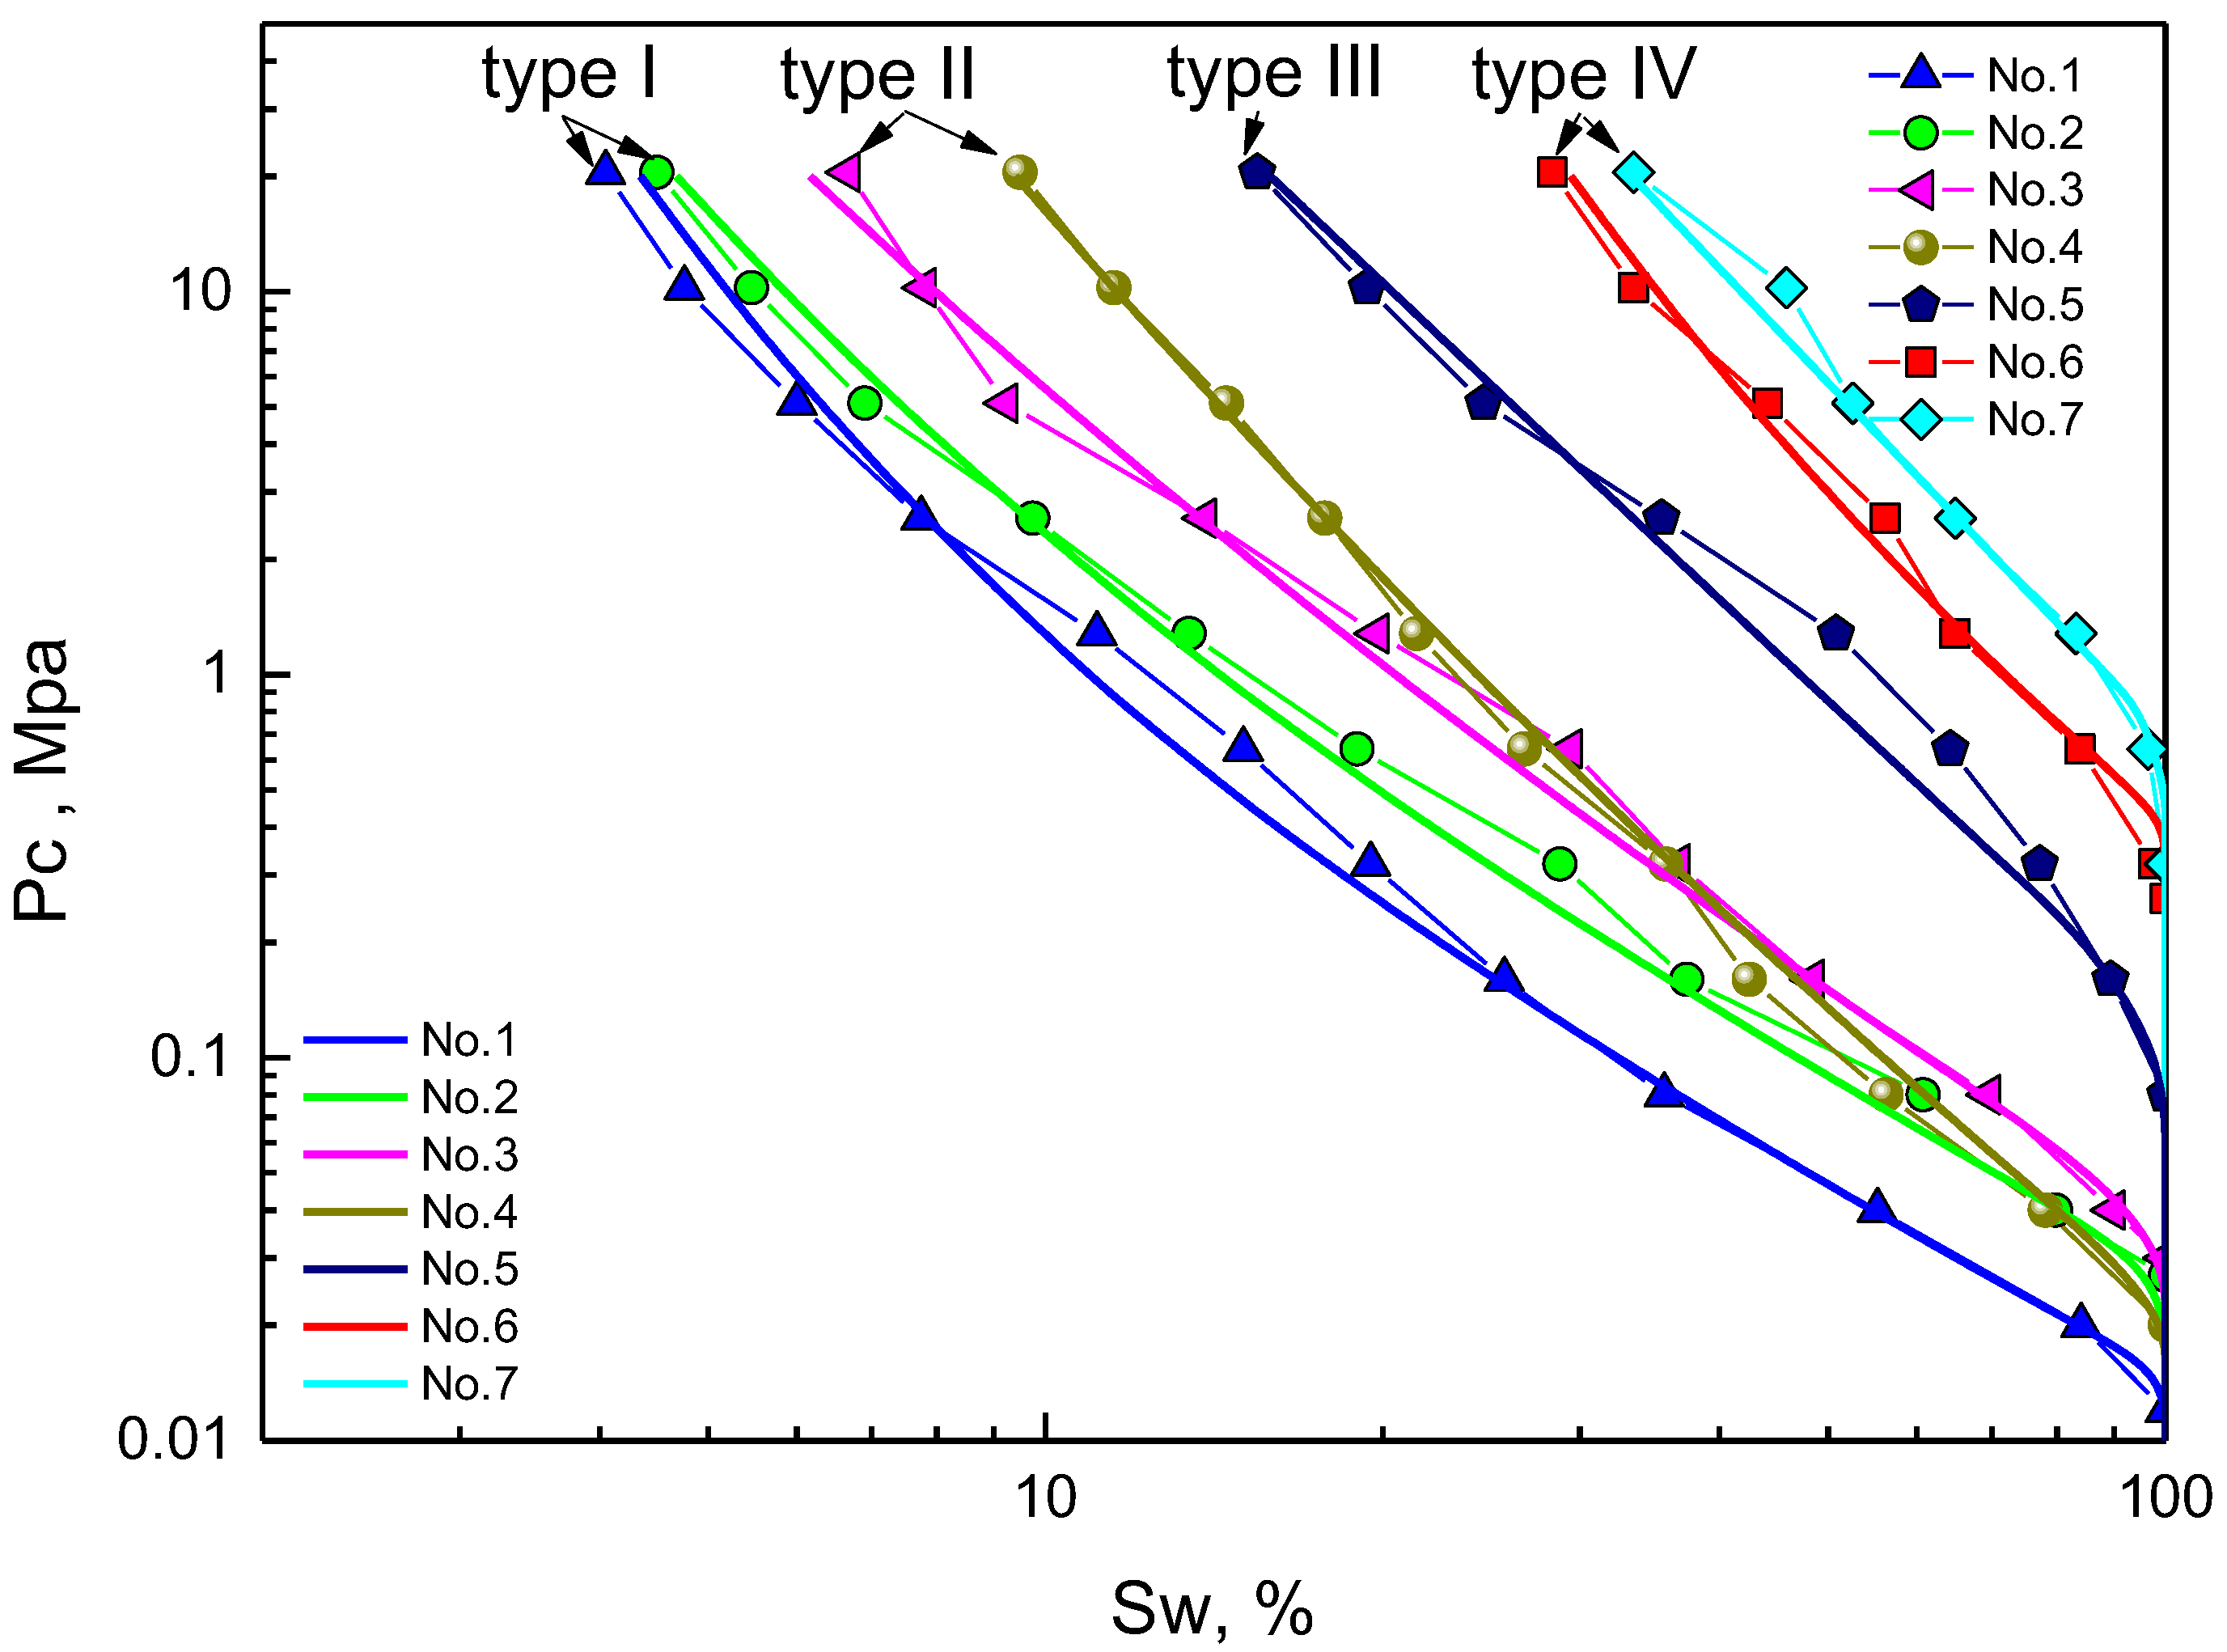
Table 1 shows the specific parameters of all seven samples, capillary pressure under different S w are shown in Figure 3. Clay contents of 7 samples range from 0.01 to 0.05 (v/v) to avoid the clay influence on resistivity. Parameters D1, D2, S1, Pcmin, c, and d are calculated using the least square method with the experimental capillary pressure and resistivity according to Equation (6).

3.1. Multi Fractal Characterization of Pore Structure Using Capillary Pressure

Figure 3 shows the capillary pressure curves of seven rock samples. Fractal dimensions of first- and second-type pores, D v , 1 and D v , 2 , the tubular pore volume proportion S 1 is calculated according to the fitting results of capillary pressure curves of seven rock samples by Equation (6), as listed in Table 1. The result shows that the fitting result by Equation (6) is highly identical with the experimental data; the goodness of fit is 0.9334, and the average relative error is 6.89%.
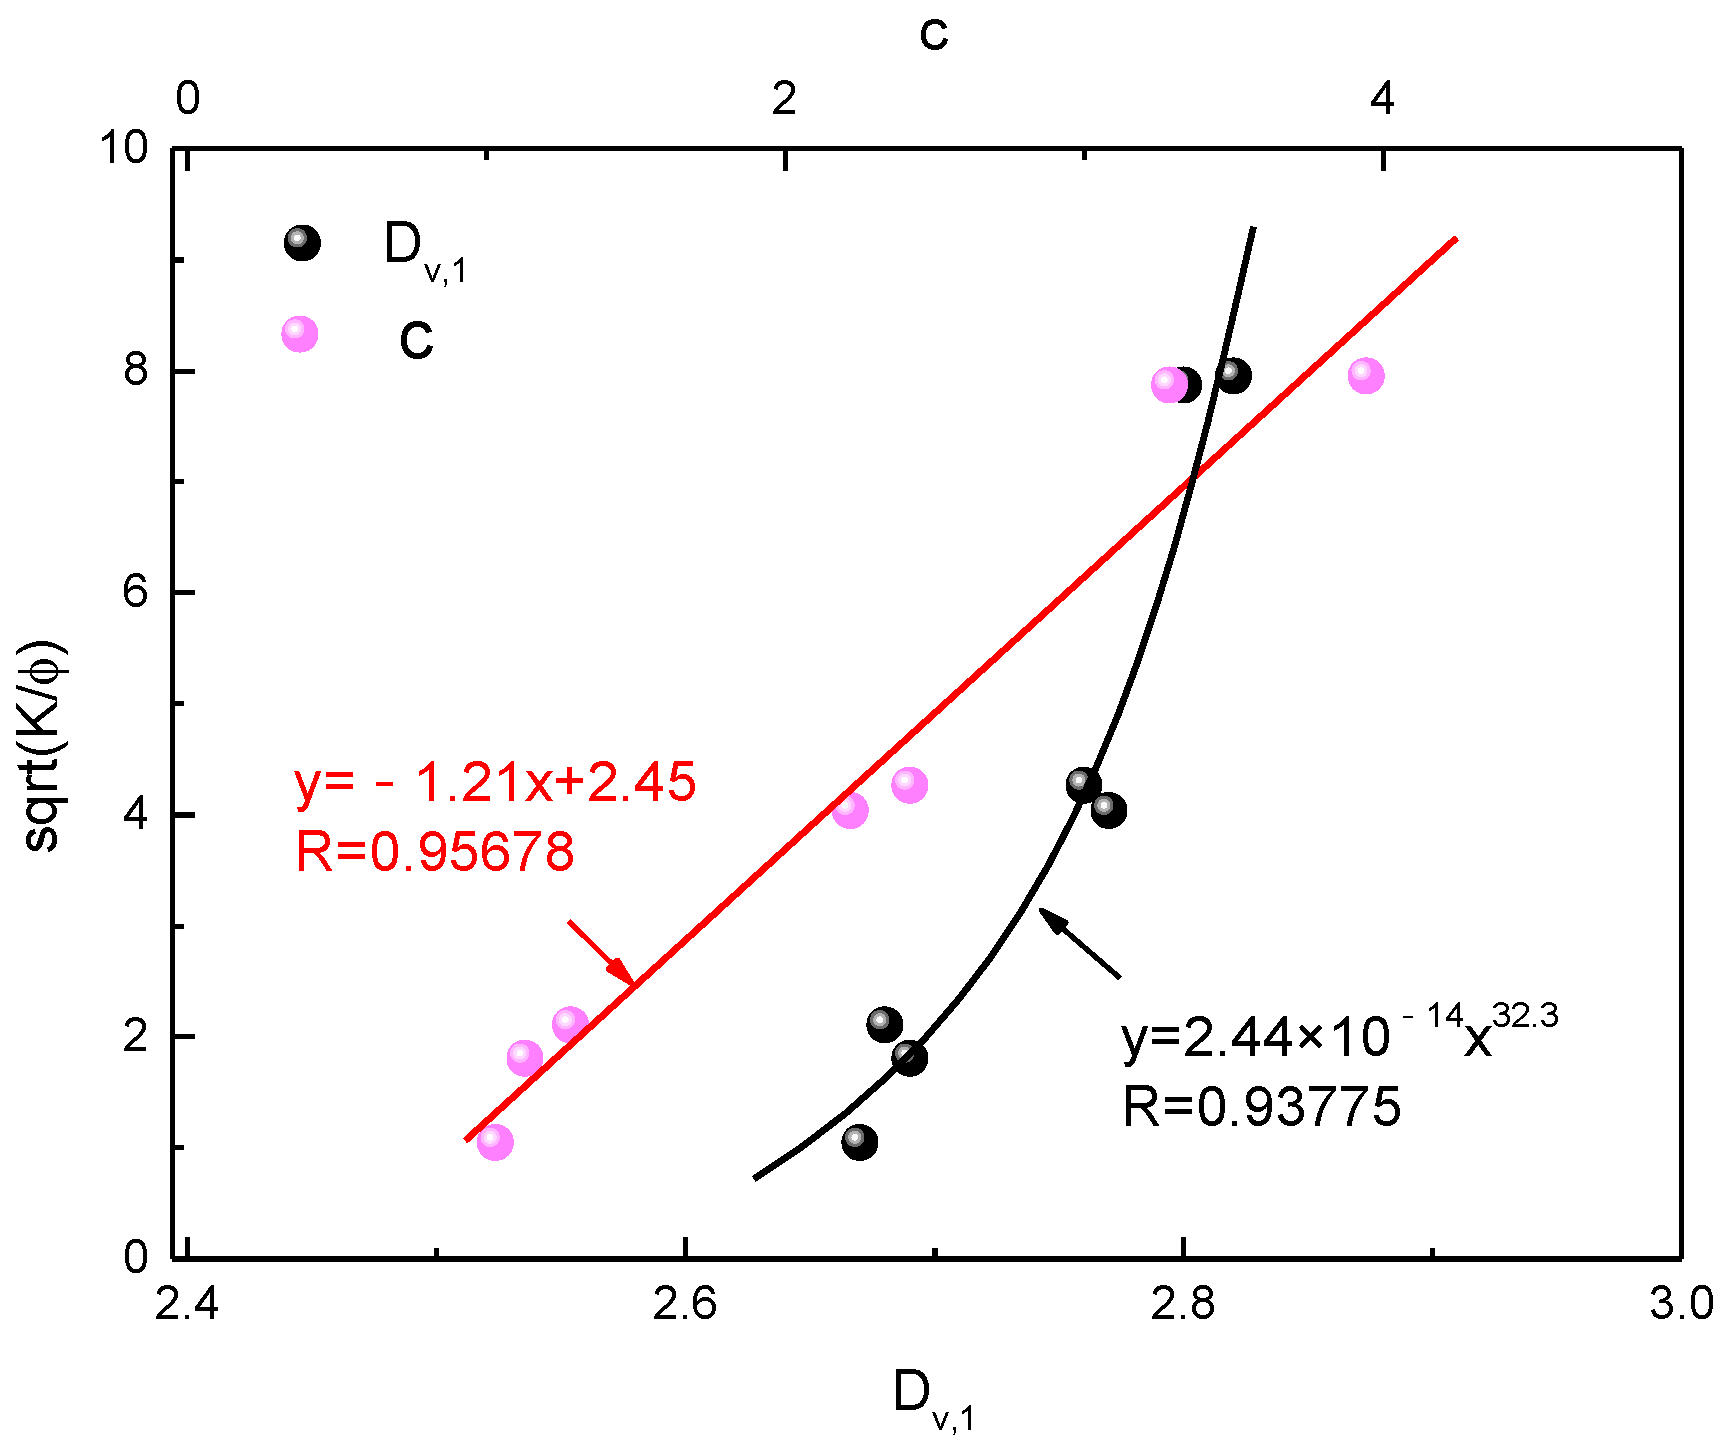
In addition, K / ϕ is a commonly used pore structure characterization parameter. Figure 4 shows the relationship of K / ϕ with D v , 1 and c. Relationship models for K / ϕ and D v , 1 is K / ϕ = 2.44 10 14 D v , 1 32.3 (the goodness of fit 0.93775), and for K / ϕ and c is K / ϕ = 1.21 × c + 2.45 (the goodness of fit 0.95678). The results indicate that D v , 1 and c are closely related to micro-pore structure; the worse the pore structure, the smaller the D v , 1 and c value. When pore structure becomes complex, pore throat size turns small, PCmin increases, and the capillary pressure curve displays a weak dual fractal feature, responding to the decrement of D v , 1 . Additionally, as the difference between D v , 1 and D v , 2 becomes small, c decreases. Thus, D v , 1 and c value can be used for pore structure typing. Figure 5 shows the pore structure typing result by D v , 1 and c; it is in accordance with 4 types of pore structure according to the morphology of the capillary pressure curve.

3.2. An Improved Rock Resistivity Model Considering Pore Structure

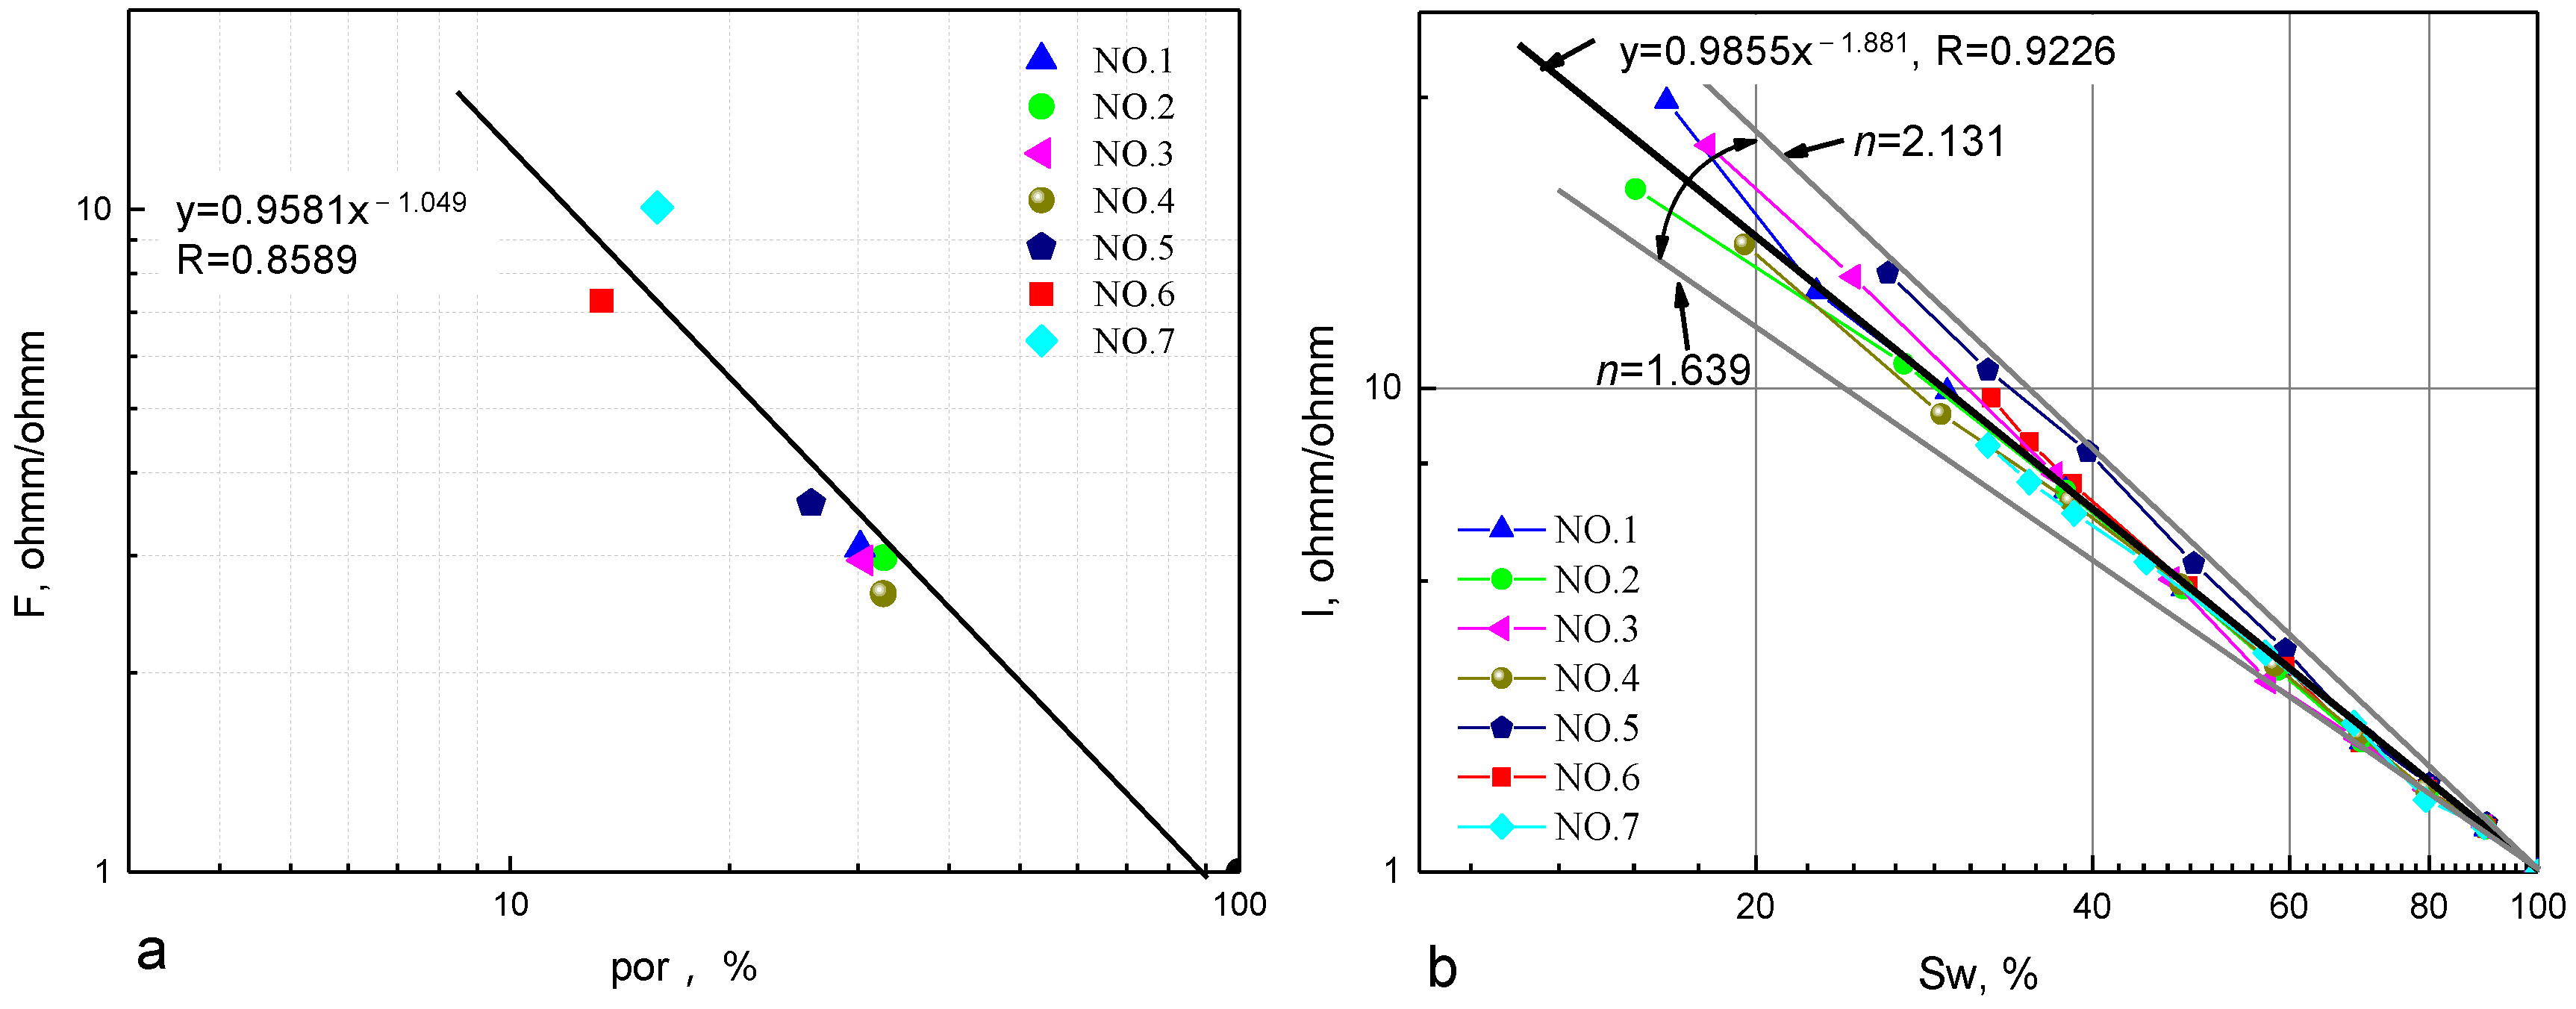
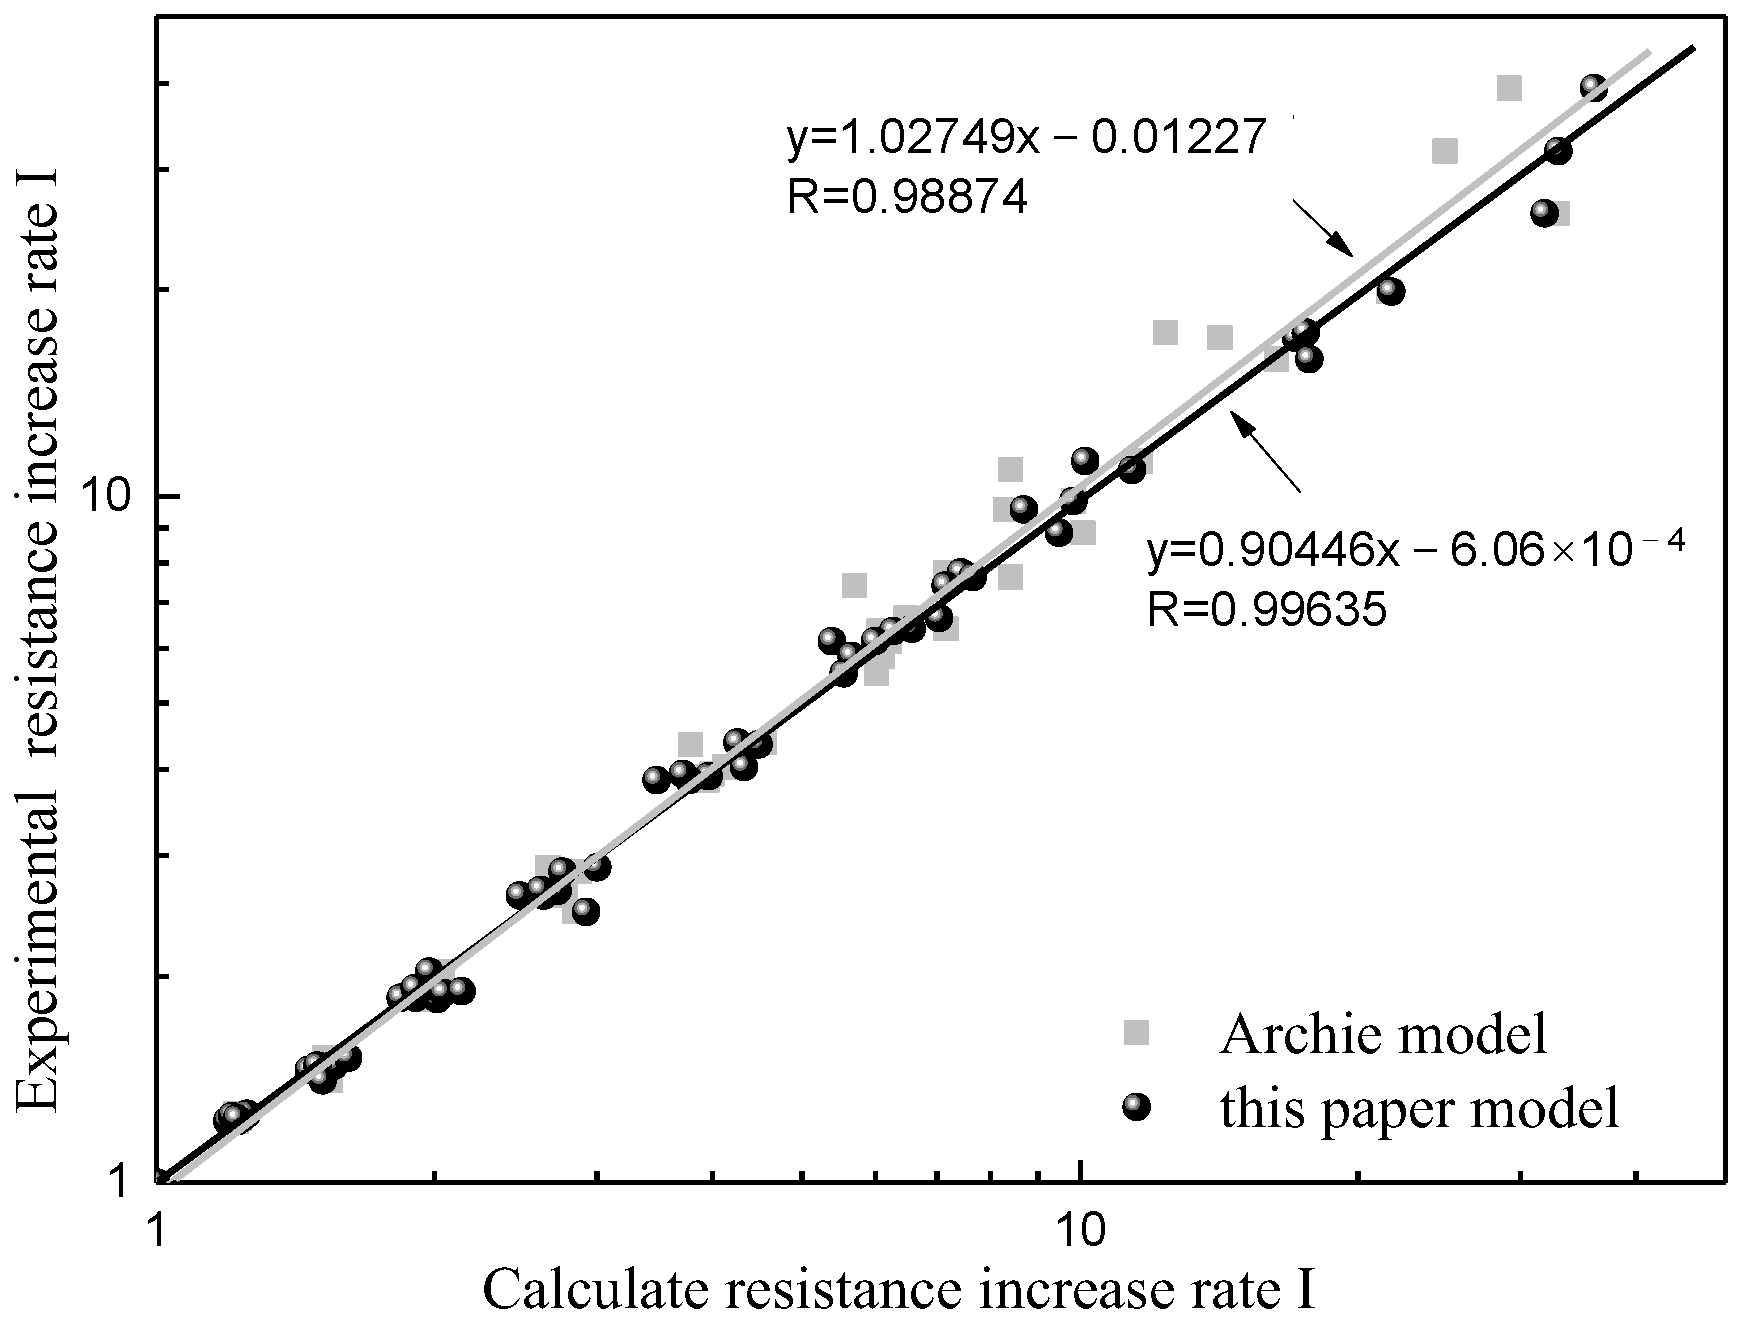
Figure 6a,b show the resistivity experimental data of 7 samples and listed in Table 1. The Archie fitting result is m = 1.049 (the goodness of fit is 0.8589) and n = 1.881 (the goodness of fit is 0.9226). The parameter d is calculated according to Equation (13), as shown in Figure 7 and listed in Table 1. In Figure 8, the comparison results of the experimental resistivity with the calculated resistivity by Archie model and Equation (16) are y = 1.02749 x 0.01227 (the goodness of fit 0.9226, and the average relative error 6.28% by Archie model) and y = 0.99446 x 6.06 × 10 4 (the goodness of fit 0.9874, average relative error 4.06% by Equation (16)), respectively. It shows that the accuracy of Equation (16) is improved than the Archie model.
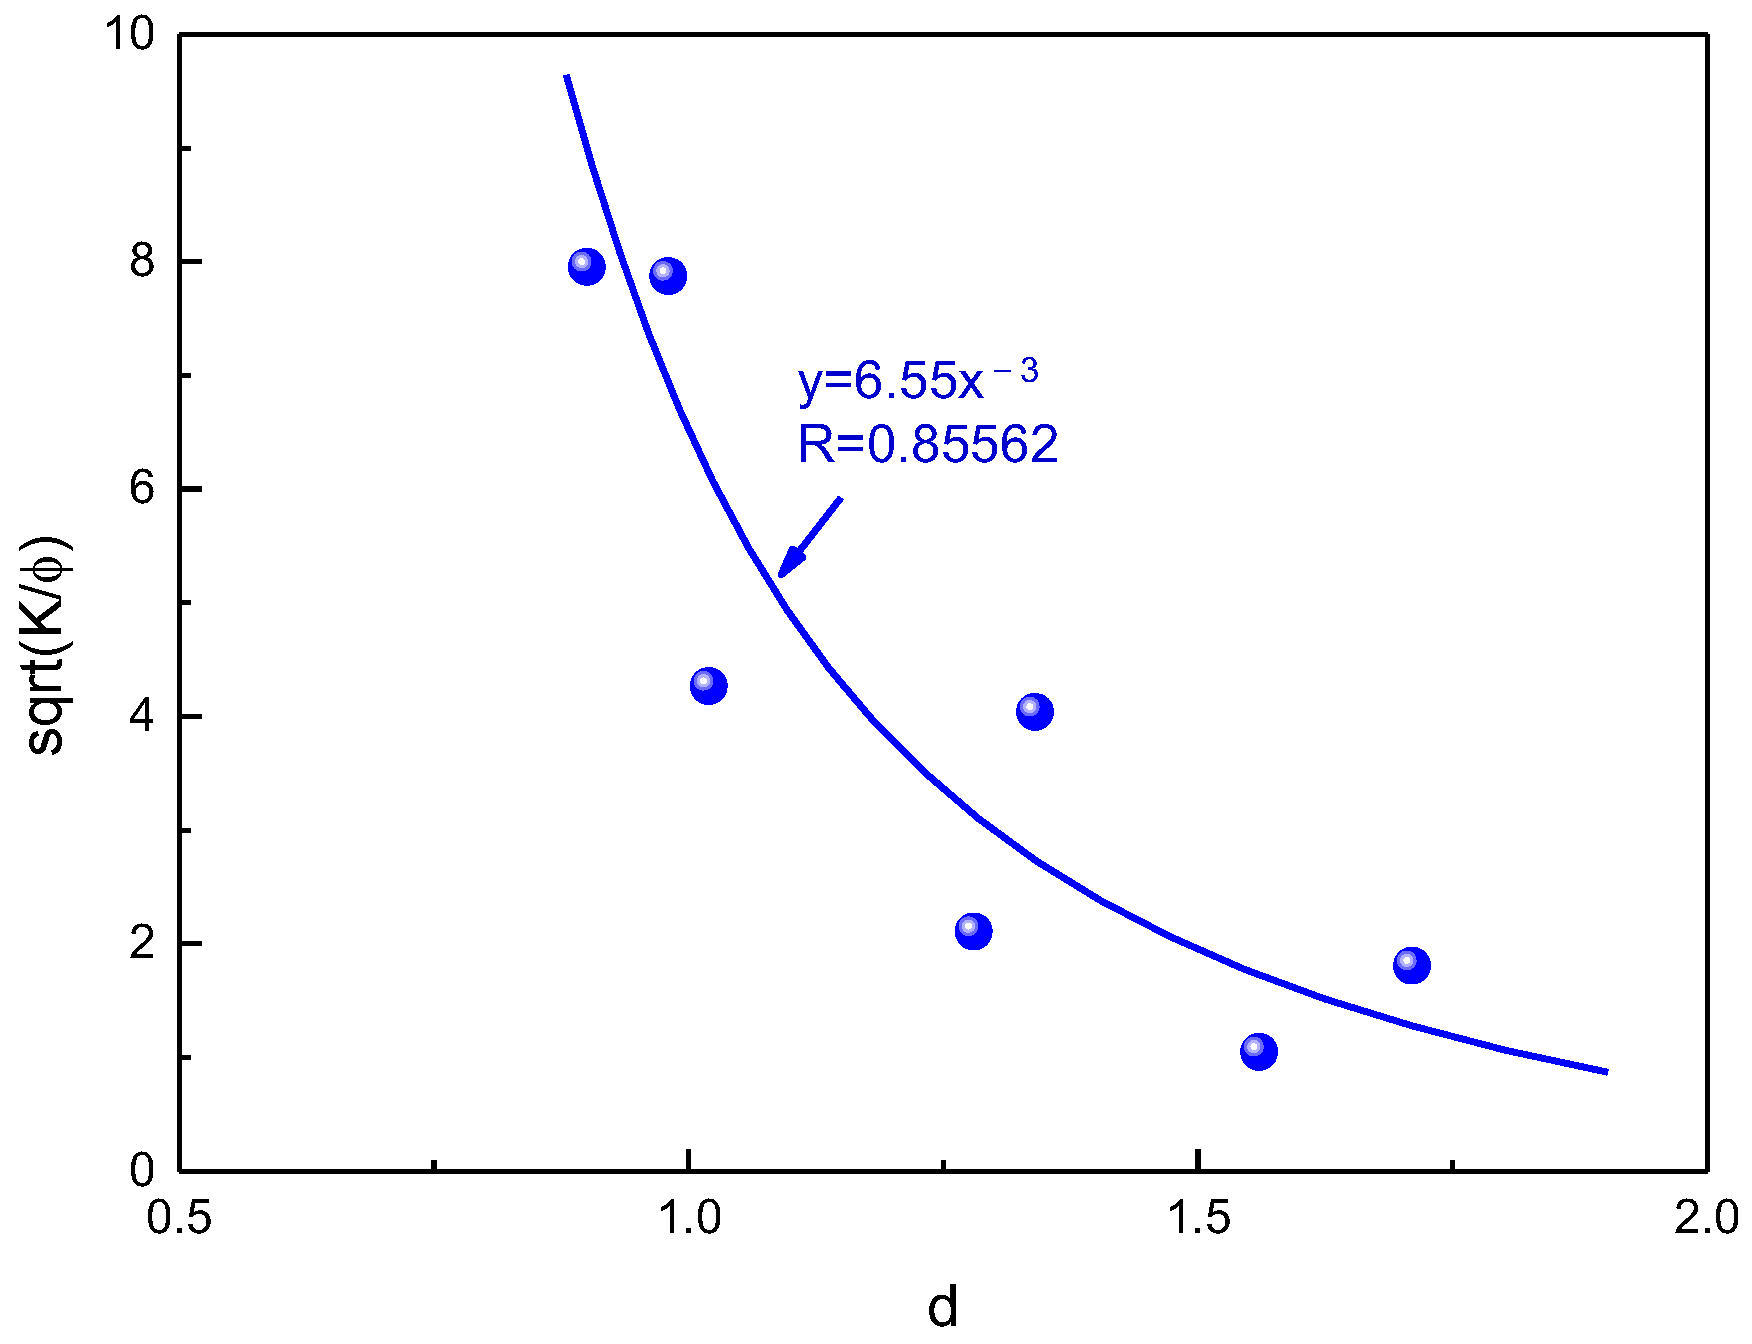
In addition, the relationship model of K / ϕ and d is K / ϕ = 6.55 d 3 (the goodness of fit is 0.85562), as shown in Figure 9. The result indicates that d is strongly depends on micro-pore structure properties.

3.3. The Relationship between Capillary Pressure Curve and Resistivity Index Curve Based on Fractal Theory

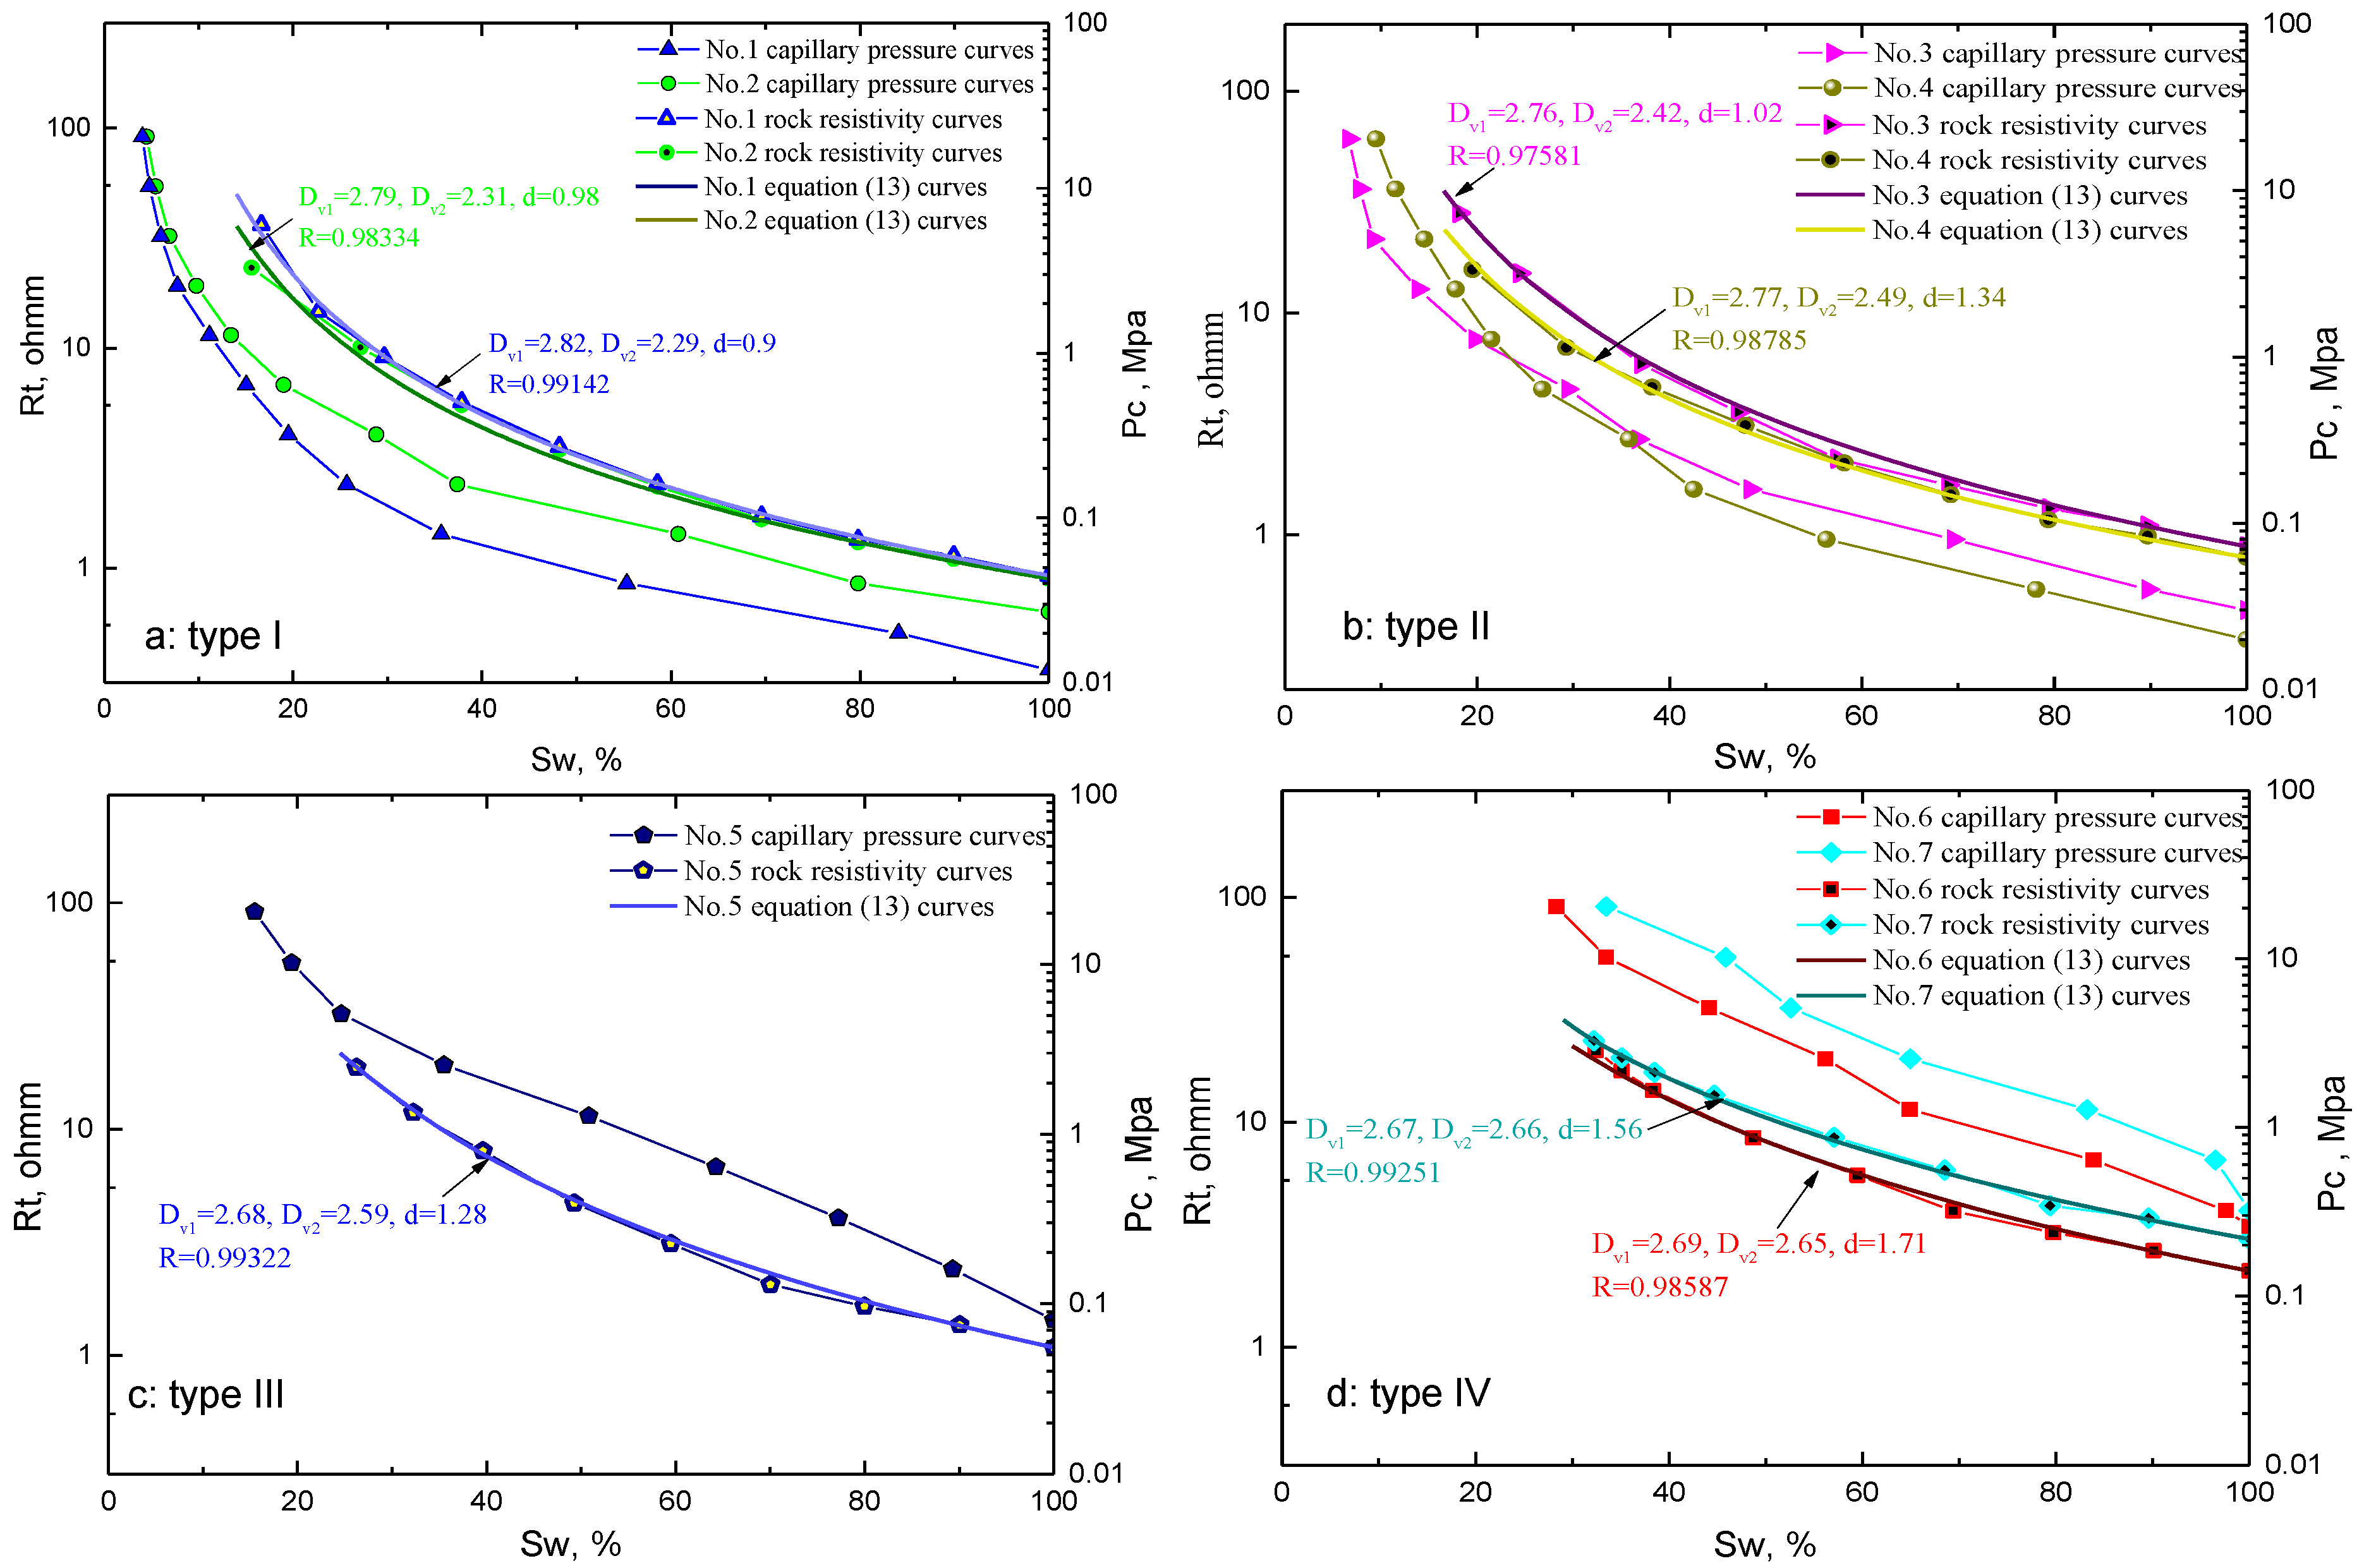
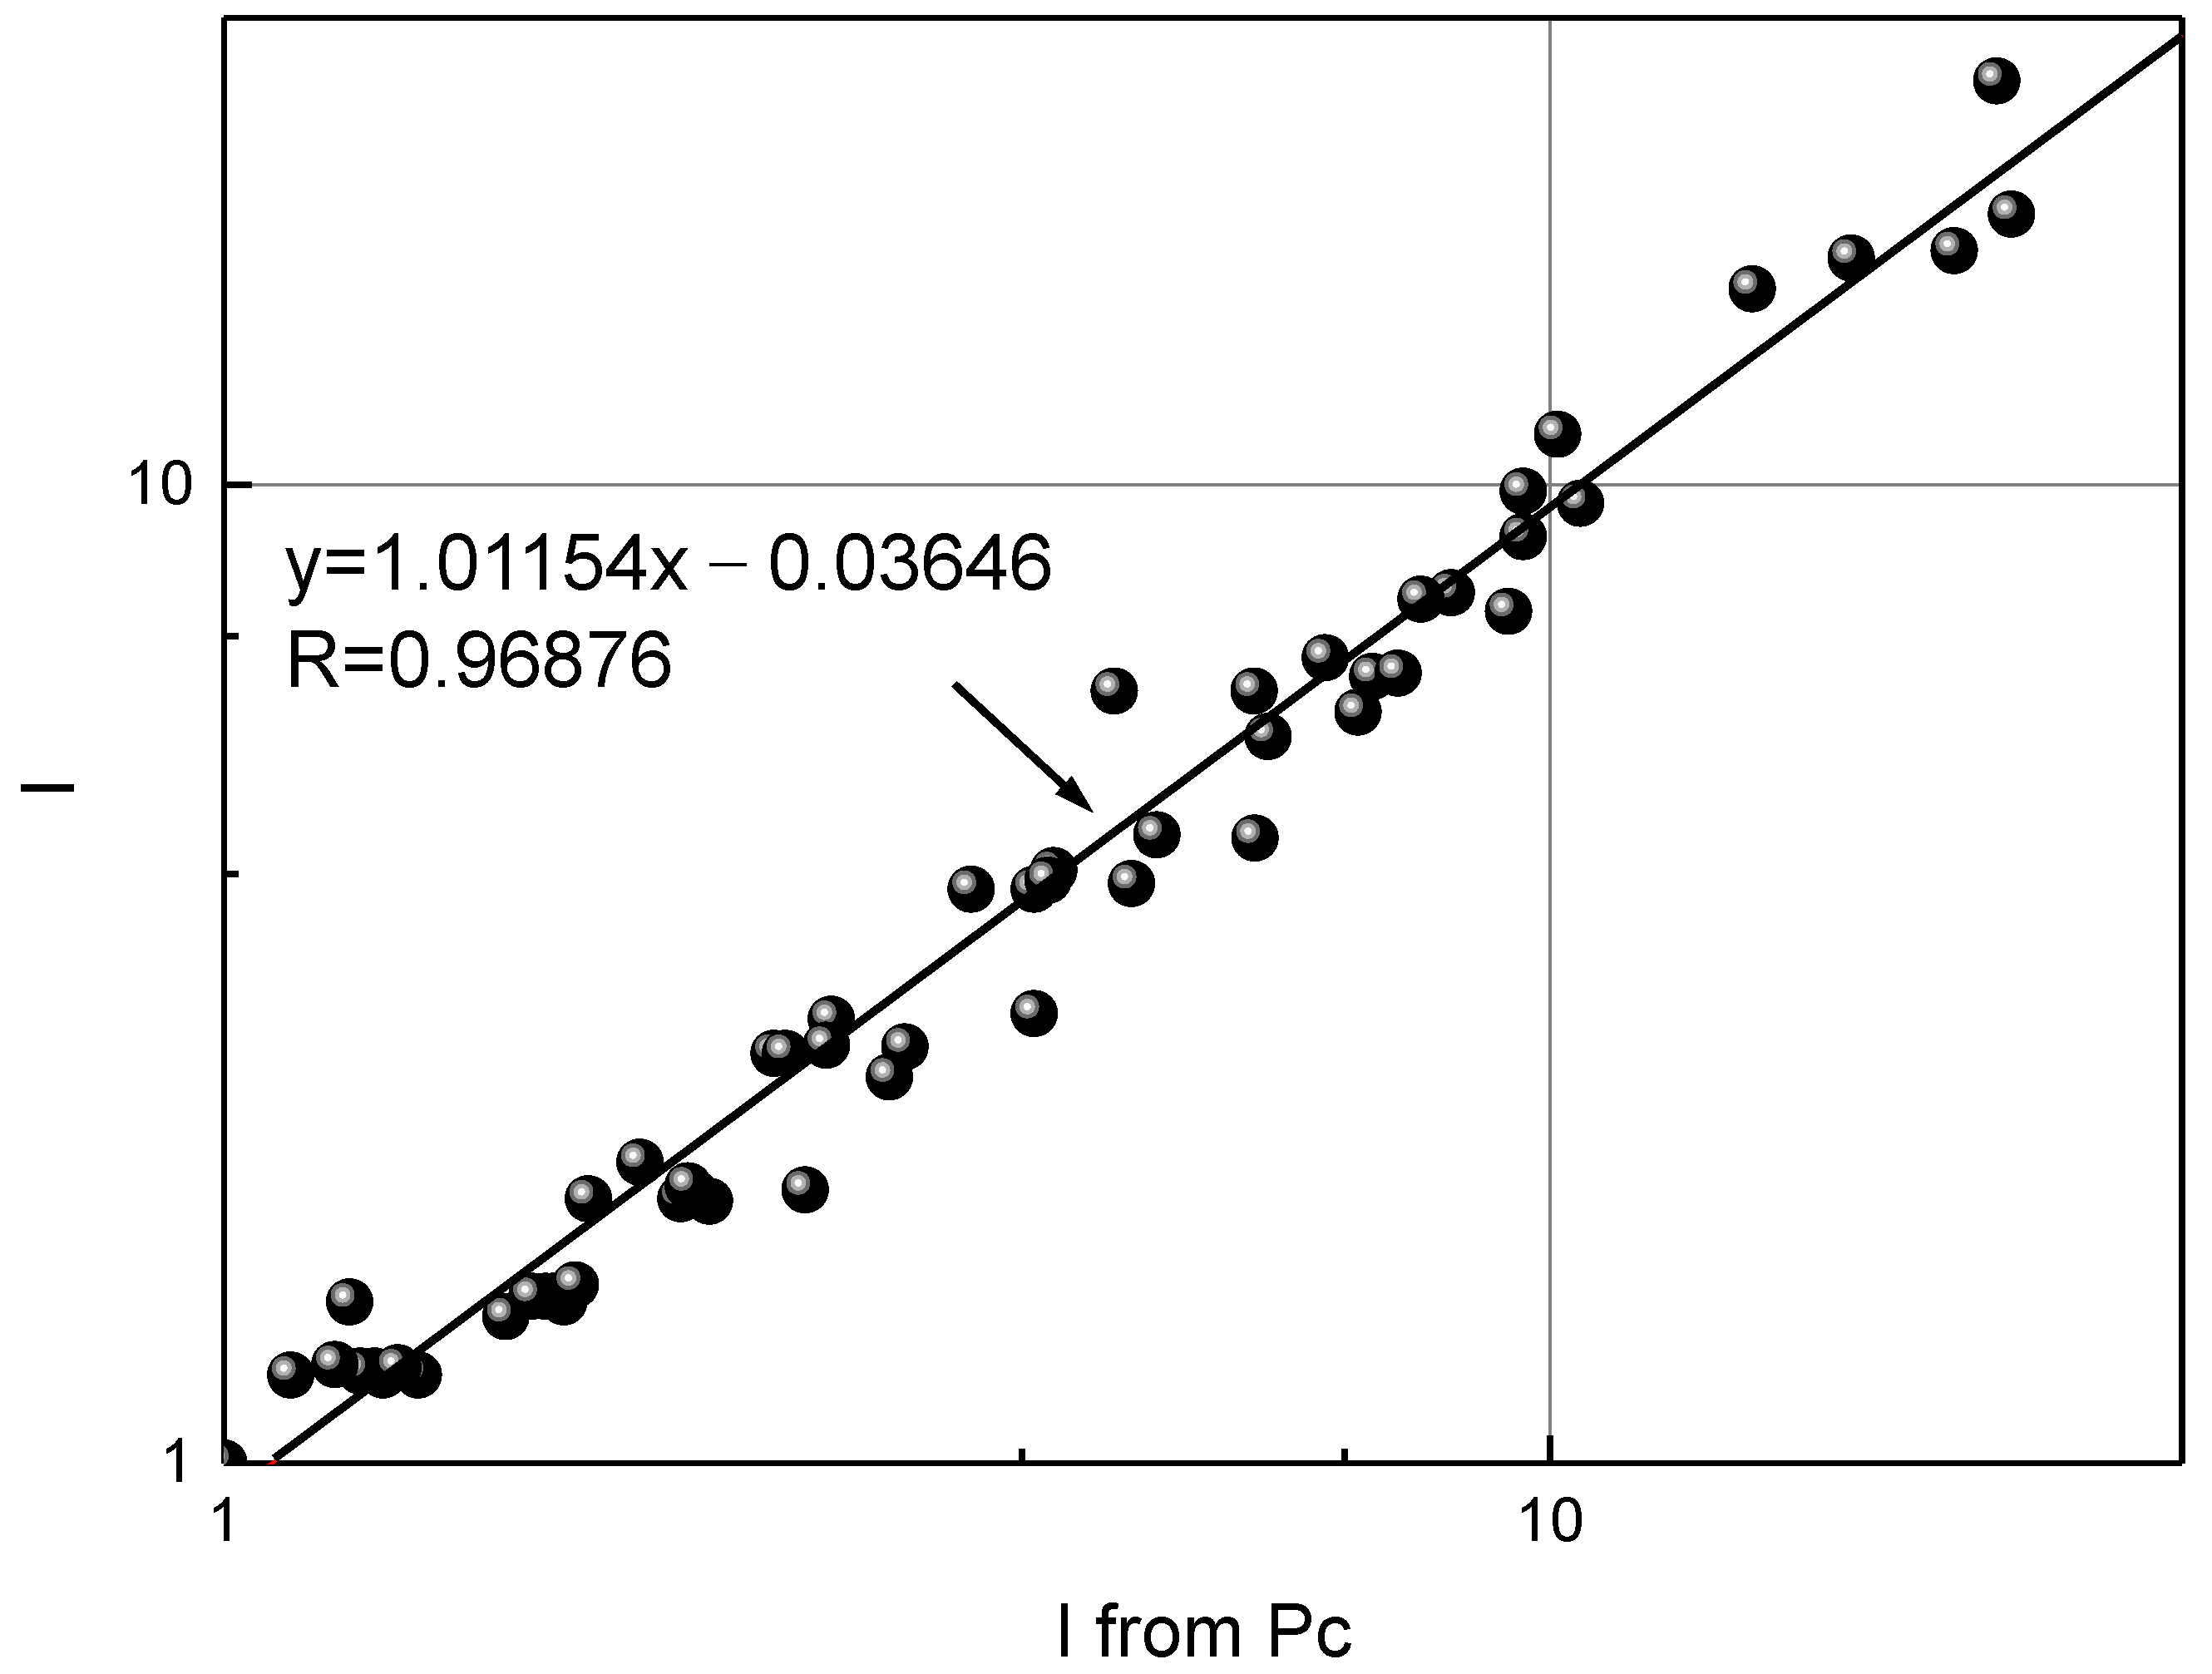
Figure 7 shows the comparison between capillary pressure curves and resistivity index curves for 4 rock types. The result indicates that capillary pressure curves have similar pattern with resistivity index curves. According to Equation (16), capillary pressure curves can be directly converted to resistivity index when d is determined. Figure 10 shows the comparison between the calculated resistivity and experimental resistivity. The relationship model is y = 1.01154 x 0.03646 (goodness of fit 0.98878, average relative error 10%), the result indicates that capillary pressure and resistivity index curves has similar fractal features, both of them are strongly depends on pore structure properties [42]. Equation (16) can effectively compensate for the lack of experimental resistivity data, and be directly used for the study of pore structure influence on rock resistivity.

4. Discussion and Future Work

4.1. Multi-Fractal Based Modeling of Capillary Pressure Curves

(1)
According to Equation (6), the fractal D v , 1 and parameter c can be calculated from permeability and porosity measured in actual formation evaluation. Further, pore structure can be classified according to the fractals D v , 1 , D v , 2 , and parameter c, capillary pressure curve and pore structure characterization can be achieved.
(2)
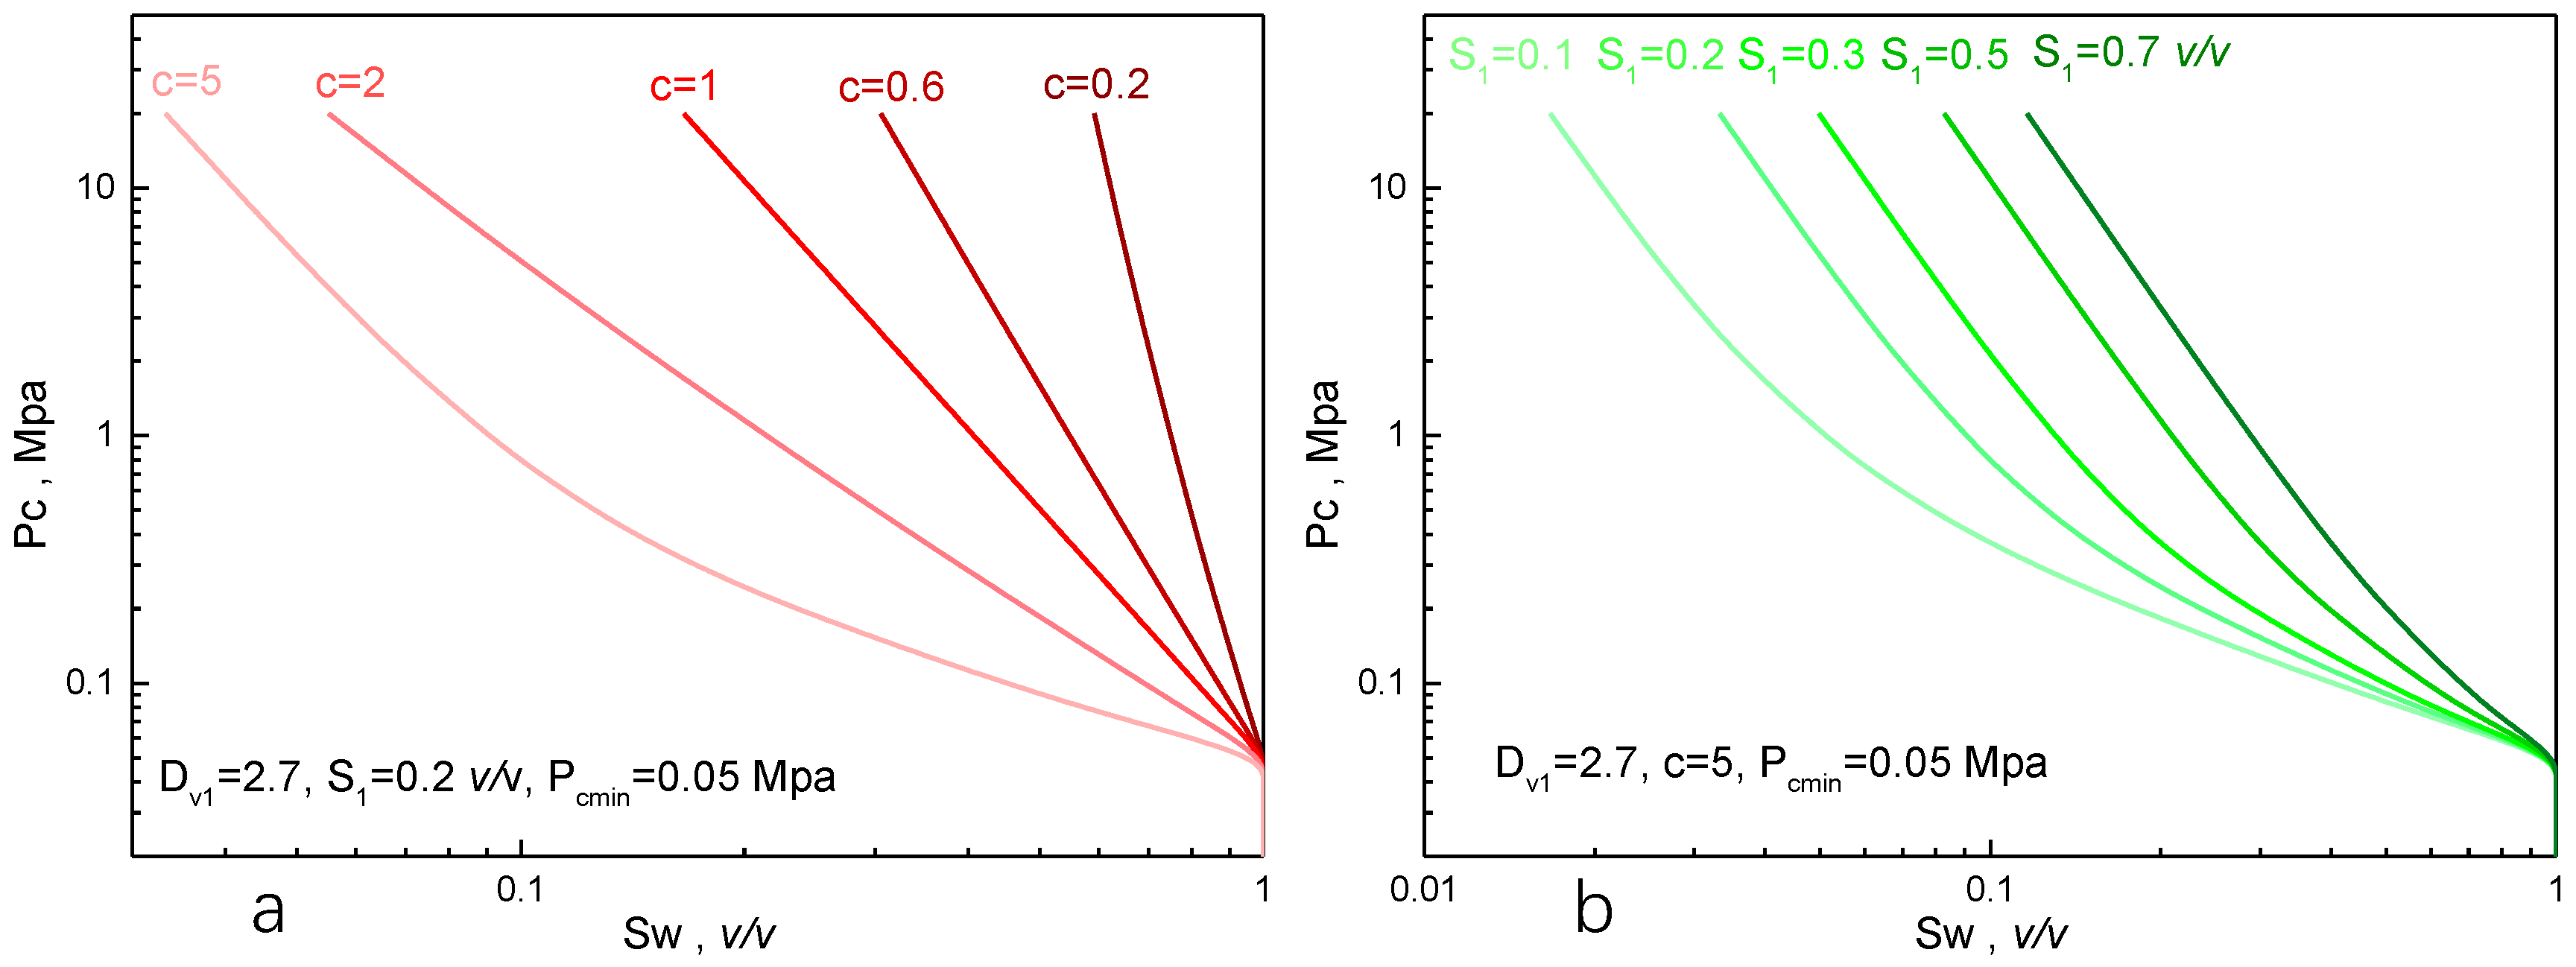
Figure 11 analyzes the affection of D v , 1 , D v , 2 , c, and S 1 on capillary pressure curves according to Equation (6). The simulated capillary pressure curves with different c ( D v , 2 ) and fixed D v , 1 = 2.7 , S 1 = 0.2  v/v, P c m i n = 0.05 Mpa is depicted in Figure 11a. The result shows that as c increases ( D v , 2 decreases), P c under specific water saturation decreases, which is an indication of pore structure improvement, it is identical with that c has a positive correlation with K / ϕ . In addition, the capillary pressure curve exhibits non-power function features (power function exhibits linear feature in a logarithmic coordinate system). The simulated capillary pressure curves with different S 1 and fixed D v , 1 = 2.7 , c = 5 , P c m i n = 0.05 Mpa is depicted in Figure 11b. The result shows that as S 1 increases at large c value, P c under specific water saturation increases, it indicates that the pore structure gets poor.

4.2. Multi-Fractal Based Modeling of Resistivity Index Curves

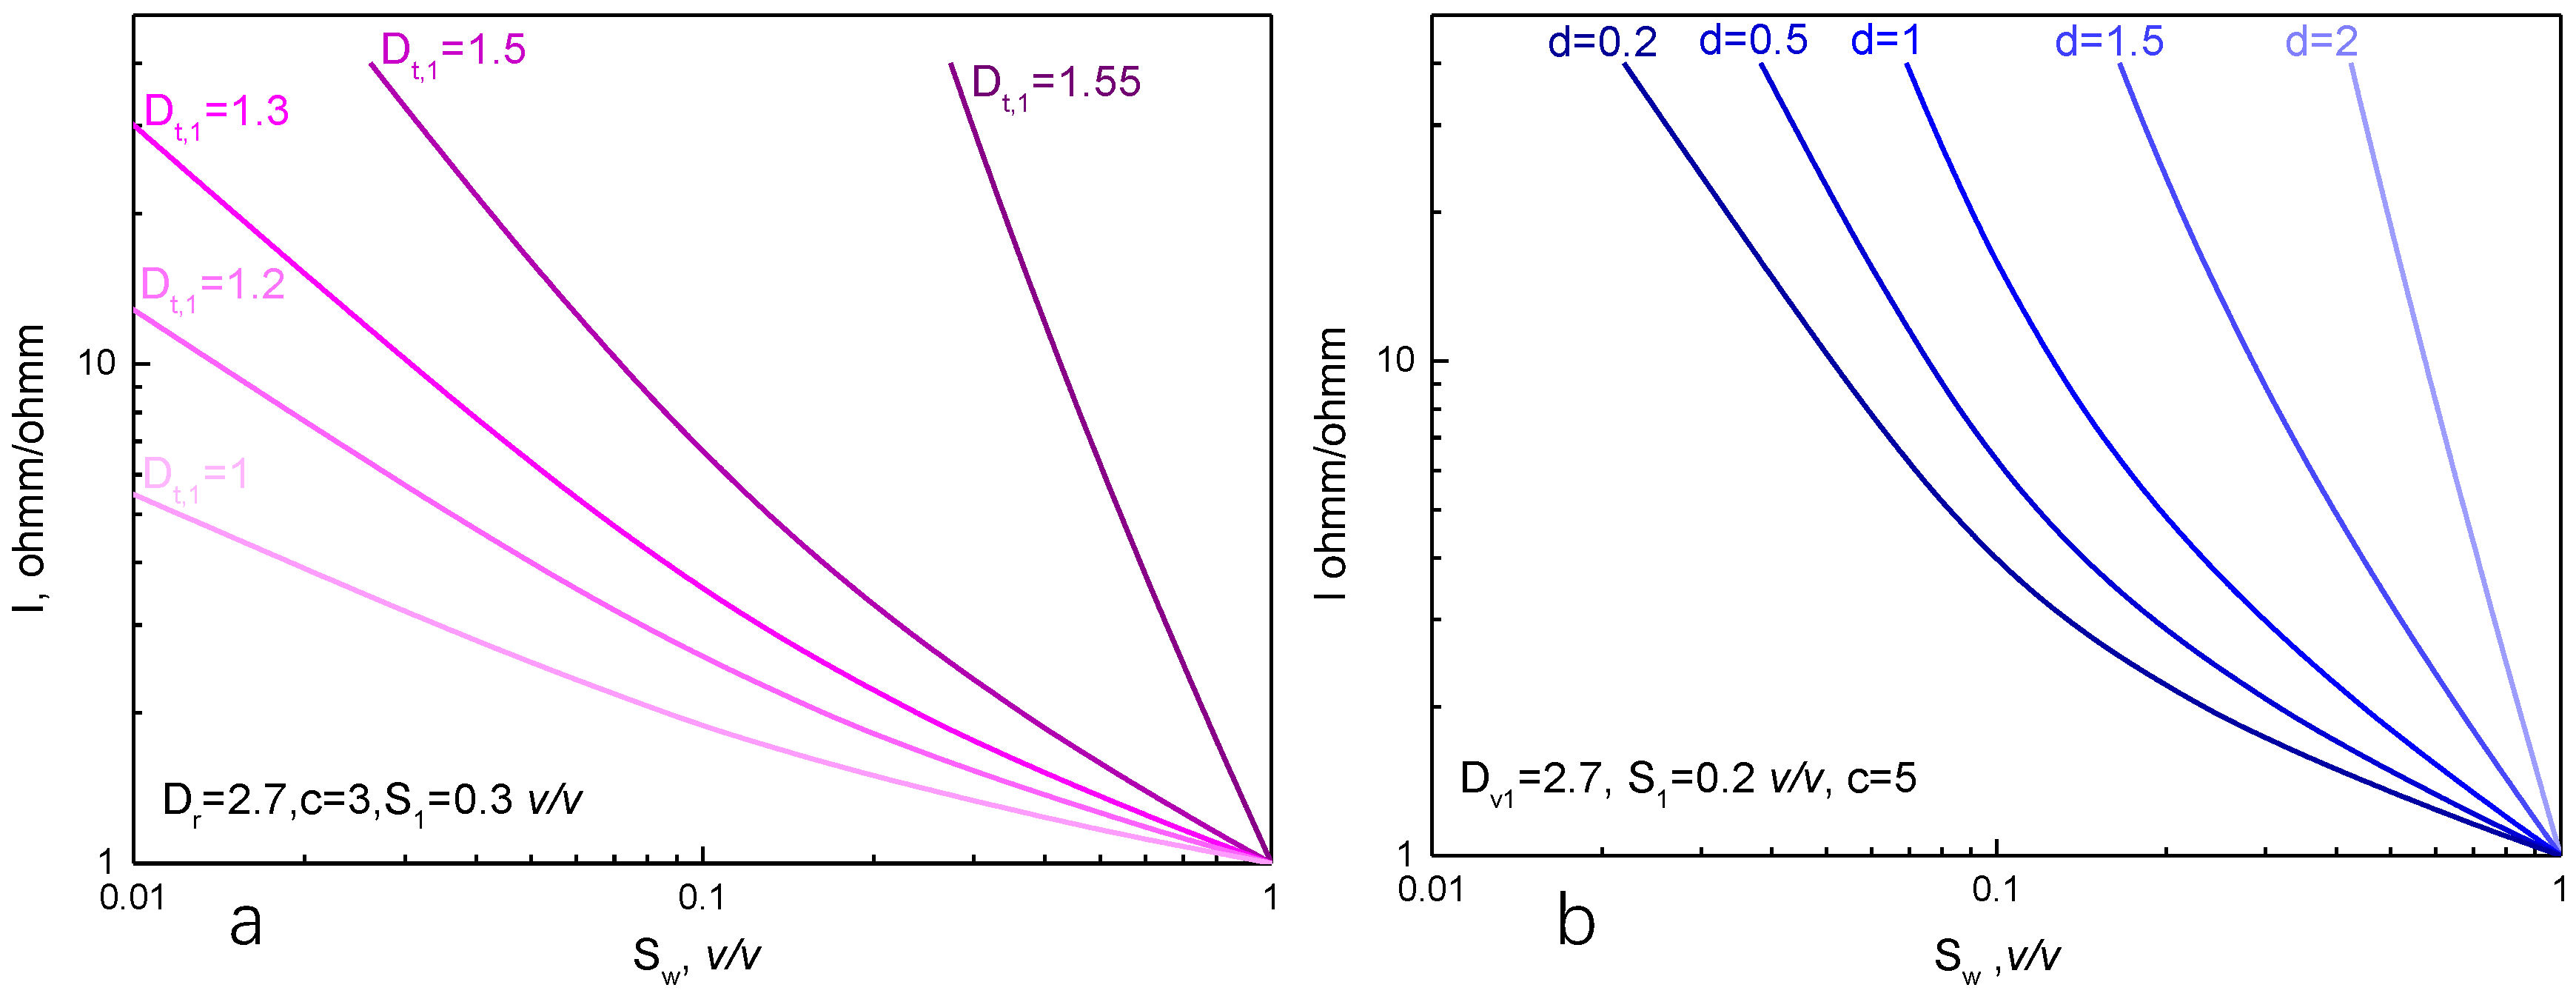
Figure 12 analyzes the affection of d and D t , 1 on resistivity index curves according to Equation (15). The simulated resistivity index curves with different D t , 1 and fixed D r = 2.7 , S 1 = 0.3  v/v, c = 3 is depicted in Figure 12a. The result shows that as D t , 1 increases, rock resistivity under specific water saturation increases, indicating that electric conduction becomes poor as rock tortuosity increases. The simulated resistivity index curves with different d and fixed D v , 1 = 2.7 , c = 5 , S 1 = 0.2  v/v is depicted in Figure 12b. The result shows that as d increases, rock resistivity under specific water saturation increases, indicating that electric conduction becomes poor as micro-pores deteriorate.

4.3. Multi-Fractal Features of Pore Structure

In Section 3.2, non-Archie F-ϕ and I-Sw relationships are seen in Figure 6; that is, as ϕ decreases, the experimental F deviates from the Archie calculated F, and n disperses (ranges from 1.639 to 2.131). According to the multi-fractal-based analysis of capillary pressure curves and resistivity increase rate curves, the multi-fractal feature of pore structure is the main reason for non-Archie resistivity and non-power function capillary pressure relationships. As the difference between the two types of pores becomes stronger, non-Archie and non-power function features become obvious. Therefore, the multi-fractal method can improve the accuracy of pore structure characterization when rock pore structure complexity increases.

4.4. Future Work

  • The capillary pressure curve supplies fundamental data for pore structure characterization methods [43]. According to Equation (6), the pore structure characterization accuracy is improved for porous rock with complex pore structure, for instance, tight rock and shales.
  • Reservoir flow unit division research based on capillary pressure curves is an important way for reservoir pattern studies [44]. According to Equation (6), more accurate reservoir flow unit division can be achieved.
  • Resistivity models are crucial for oil and gas saturation calculation in practical applications [45]. In this paper, the accuracy of Equation (15) is improved than the Archie model. Equation (15) can be further utilized for reservoir estimation and shale organic carbon assessments.
  • Equation (16) describes the relationship between the capillary pressure curve and rock resistivity based on multi-fractal theory. It provides a new idea and an effective way for studying the effect of pore structure on rock resistivity [46], especially for rocks with complex micro-pore structures, such as rock within fractures, shale, and carbonate rocks.
  • As the heterogeneity of pore size and morphology of the study areas increases, single-dimension fractal theory is unable to meet the accuracy requirements. Multi-fractal theory can provide an effective way for pore structure characterization [47], which will be a research focus.

5. Conclusions

(1)
Based on multi-fractal theory, a multi-fractal characterization method for sandstone micro-pore structure using capillary pressure is developed, and its accuracy is improved than the commonly used power function model for the fitting of experimental capillary pressure curves. Based on the multi-fractal characterization method for sandstone micro-pore structure using capillary pressure, a rock resistivity model considering pore structure is developed. The new model is proven to have higher accuracy than the Archie model; it can accurately describe the rock conductivity characteristics and calculate the oil saturation of complex pore structure reservoirs.
(2)
A distinct interrelationship between fractal dimensions of capillary pressure curves ( D v ) and resistivity index curves ( D t and D r ) is obtained. The capillary pressure curve can be directly converted to the resistivity index when d is determined. The fractal feature parameters D v , 1 , D v , 2 , c strongly depend on pore structure properties. Parameters c, d, and D v , 1 have a good relationship with K / ϕ , the pore structure typing result by D v , 1 and c is accordance with that according to the morphology of capillary pressure curve.
(3)
According to the multi-fractal-based analysis of capillary pressure curves and resistivity increase rate, the multi-fractal feature of pore structure is the main reason for non-Archie resistivity and non-power function capillary pressure relationships. As the difference between the two types of pores becomes stronger, non-Archie and non-power function features become obvious. Therefore, the multi-fractal method can improve the accuracy of pore structure characterization when rock pore structure complexity increases.
(4)
This study provides new ideas to improve the accuracy of pore structure characterization and oil saturation calculation; it has good application prospects and guiding significance in reservoir evaluation and rock physical characteristics research.

Author Contributions

Conceptualization and methodology, W.X. and Q.Y.; software, W.X.; validation, J.Z. and F.Y.; investigation, P.Z.; data curation, B.Y.; writing—original draft preparation, W.X. and Q.Y.; writing—review and editing, W.X. and Q.Y. All authors have read and agreed to the published version of the manuscript.

Funding

This article was supported by the Research Foundation of China University of Petroleum-Beijing at Karamay (No. XQZX20230012), the Research Foundation of Karamay, China (No. 20222023hjcxrc0014), “Tianchi Talent” Introduction Plan Foundation of Xinjiang and the National Natural Science Foundation of China (No. 42204113).

Data Availability Statement

Most of the data has been disclosed in the manuscript data table; other data cannot be disclosed due to confidentiality and can be obtained from the author ([email protected]).

Conflicts of Interest

The authors declared that they have no conflicts of interest in this work. We declare that we do not have any commercial or associative interest that represents a conflict of interest in connection with the work submitted.

References

  1. Cai, J.; Wei, W.; Hu, X.; Wood, D.A. Electrical conductivity models in saturated porous media: A review. Earth-Sci. Rev. 2017, 171, 419–433. [Google Scholar] [CrossRef]
  2. Zhu, L.; Wu, S.; Zhang, C.; Misra, S.; Zhou, X.; Cai, J. Characterization of pore electrical conductivity in porous media by weakly conductive and nonconductive pores. Surv. Geophys. 2023, 44, 877–923. [Google Scholar] [CrossRef]
  3. Jin, Y.; Li, S.; Yang, D. Experimental and theoretical quantification of the relationship between electrical resistivity and hydrate saturation in porous media. Fuel 2020, 269, 117378. [Google Scholar] [CrossRef]
  4. Adebayo, A.R.; Isah, A.; Mahmoud, M.; Al-Shehri, D. Effects of foam microbubbles on electrical resistivity and capillary pressure of partially saturated porous media. Molecules 2020, 25, 3385. [Google Scholar] [CrossRef]
  5. Iravani, M.A.; Deparis, J.; Davarzani, H.; Colombano, S.; Guérin, R.; Maineult, A. The influence of temperature on the dielectric permittivity and complex electrical resistivity of porous media saturated with DNAPLs: A laboratory study. J. Appl. Geophys. 2020, 172, 103921. [Google Scholar] [CrossRef]
  6. Sun, Z.; Mehmani, A.; Torres-Verdín, C. Pore-scale investigation of the electrical resistivity of saturated porous media: Flow patterns and porosity efficiency. J. Geophys. Res. Solid Earth 2021, 126, e2021JB022608. [Google Scholar] [CrossRef]
  7. Tian, J.; Wang, L.; Sima, L.; Fang, S.; Liu, H. Characterization of reservoir properties and pore structure based on micro-resistivity imaging logging: Porosity spectrum, permeability spectrum, and equivalent capillary pressure curve. Pet. Explor. Dev. 2023, 50, 628–637. [Google Scholar] [CrossRef]
  8. Saafan, M.; Ganat, T. Inferring capillary pressure curve from 2D rock images based on fractal theory in low-permeability sandstone: A new integrated approach. Fractals 2021, 29, 2150149. [Google Scholar] [CrossRef]
  9. Schmitt, M.; Fernandes, C.P.; da Cunha Neto, J.A.; Wolf, F.G.; dos Santos, V.S. Characterization of pore systems in seal rocks using nitrogen gas adsorption combined with mercury injection capillary pressure techniques. Mar. Pet. Geol. 2013, 39, 138–149. [Google Scholar] [CrossRef]
  10. Hu, Y.; Yu, X.; Chen, G.; Li, S. Classification of the average capillary pressure function and its application in calculating fluid saturation. Pet. Explor. Dev. 2012, 39, 778–784. [Google Scholar] [CrossRef]
  11. Thomeer, J.H.M. Introduction of a pore geometrical factor defined by the capillary pressure curve. J. Pet. Technol. 1960, 12, 73–77. [Google Scholar] [CrossRef]
  12. Xu, W.S.; Luo, P.Y.; Sun, L.; Lin, N. A prediction model of the capillary pressure J-function. PLoS ONE 2016, 11, e0162123. [Google Scholar] [CrossRef]
  13. Corey, A.T. The interrelation between gas and oil relative permeabilities. Prod. Mon. 1954, 19, 38–41. [Google Scholar]
  14. Brooks, R.H.; Corey, A.T. Properties of porous media affecting fluid flow. J. Irrig. Drain. Div. 1966, 92, 61–88. [Google Scholar] [CrossRef]
  15. Mandelbrot, B.B. The Fractal Geometry of Nature; Freeman: San Francisco, CA, USA, 1982. [Google Scholar]
  16. Wang, F.; Yang, K.; Cai, J. Fractal characterization of tight oil reservoir pore structure using nuclear magnetic resonance and mercury intrusion porosimetry. Fractals 2018, 26, 1840017. [Google Scholar] [CrossRef]
  17. Miao, T.; Yu, B.; Duan, Y.; Fang, Q. A fractal analysis of permeability for fractured rocks. Int. J. Heat Mass Transf. 2015, 81, 75–80. [Google Scholar] [CrossRef]
  18. Jafari, A.; Babadagli, T. Estimation of equivalent fracture network permeability using fractal and statistical network properties. J. Petrol. Sci. Eng. 2012, 92, 110–123. [Google Scholar] [CrossRef]
  19. Zhao, X.; Yang, Z.; Lin, W.; Xiong, S.; Luo, Y.; Liu, X.; Xia, D. Fractal study on pore structure of tight sandstone based on full-scale map. Int. J. Oil Gas Coal Technol. 2019, 22, 123–139. [Google Scholar] [CrossRef]
  20. Wang, J.; Jiang, F.; Zhang, C.; Song, Z.; Mo, W. Study on the Pore Structure and Fractal Dimension of Tight Sandstone in Coal Measures. Energy Fuels 2021, 35, 3887–3898. [Google Scholar] [CrossRef]
  21. Xie, W.; Yin, Q.; Wang, G.; Yu, Z. Variable dimension fractal-based conversion method between the nuclear magnetic resonance T2 spectrum and capillary pressure curve. Energy Fuels 2020, 35, 351–357. [Google Scholar] [CrossRef]
  22. Gao, H.; Yu, B.; Duan, Y.; Fang, Q. Fractal analysis of dimensionless capillary pressure function. Int. J. Heat Mass Transf. 2014, 69, 26–33. [Google Scholar] [CrossRef]
  23. Liu, P.; Yuan, Z.; Li, K. An improved capillary pressure model using fractal geometry for coal rock. J. Pet. Sci. Eng. 2016, 145, 473–481. [Google Scholar] [CrossRef]
  24. Li, K. Analytical derivation of Brooks–Corey type capillary pressure models using fractal geometry and evaluation of rock heterogeneity. J. Pet. Sci. Eng. 2010, 73, 20–26. [Google Scholar] [CrossRef]
  25. Li, B.; Liu, R.; Jiang, Y. A multiple fractal model for estimating permeability of dual-porosity media. J. Hydrol. 2016, 540, 659–669. [Google Scholar] [CrossRef]
  26. Archie, G.E. The electrical resistivity log as an aid in determining some reservoir characteristics. Trans. AIME 1942, 146, 54–62. [Google Scholar] [CrossRef]
  27. Yue, W. Pore-scale explanation of the archie’s cementation exponent: Microstructure, electrical anisotropy, and numerical experiments. Geophys. Res. Lett. 2019, 46, 5799–5807. [Google Scholar] [CrossRef]
  28. Xiao, L.; Zou, C.C.; Mao, Z.Q.; Shi, Y.J.; Jin, Y.; Guo, H.P.; Hu, X.X. Estimation of water saturation from nuclear magnetic resonance(NMR) and conventional logs in low permeability sandstone reservoirs. J. Petroleum Sci. Eng. 2013, 108, 40–51. [Google Scholar] [CrossRef]
  29. Shang, B.Z.; Hamman, J.G.; Caldwell, D.H. A Physical Model to Explain the First Archie Re1ationship and Beyond. In Proceedings of the SPE Annual Technical Conference and ExhIbition, Denver, CO, USA, 5–8 October 2004. [Google Scholar]
  30. Nigmatullin, R.R.; Dissado, L.A.; Soutougin, N.N. A fractal pore model for Archie’s law in sedimentary rocks. J. Phys. D Appl. Phys. 1992, 25, 32. [Google Scholar] [CrossRef]
  31. Wright, H.M.N.; Cashman, K.V.; Gottesfeld, E.H.; Roberts, J.J. Pore structure of volcanic clasts: Measurements of permeability and electrical conductivity. Earth Planet. Sci. Lett. 2009, 280, 93–104. [Google Scholar] [CrossRef]
  32. Rembert, F.; Jougnot, D.; Guarracino, L. A fractal model for the electrical conductivity of water-saturated porous media during mineral precipitation-dissolution processes. Adv. Water Resour. 2020, 145, 103742. [Google Scholar] [CrossRef]
  33. Feng, C.; Han, C.; Duan, W.; Wang, W.; Zhong, Y.; Feng, Z.; Zhang, N. Estimation of the Resistivity Index via Nuclear Magnetic Resonance Log Data Based on Fractal Theory. Geofluids 2020, 2020, 8871096. [Google Scholar] [CrossRef]
  34. Shi, Y.; Meng, H.; Liu, T.; Zhang, H.; Wang, C. Evaluation of Relative Permeability From Resistivity Data for Fractal Porous Media. Petrophysics-SPWLA J. Form. Eval. Reserv. Descr. 2020, 61, 303–317. [Google Scholar] [CrossRef]
  35. Luo, H.; Jougnot, D.; Jost, A.; Teng, J.; Thanh, L.D. A capillary bundle model for the electrical conductivity of saturated frozen porous media. J. Geophys. Res. Solid Earth 2023, 128, e2022JB025254. [Google Scholar] [CrossRef]
  36. Hu, S.; Zhou, C.; Li, X.; Li, C.; Zhang, S. A tight sandstone trapezoidal pore oil saturation model. Pet. Explor. Dev. 2017, 44, 827–836. [Google Scholar] [CrossRef]
  37. Cai, R.J.; Tang, S.W.; He, Z. The modeling of electrical property in porous media based on fractal leaf vein network. Int. J. Eng. Sci. 2018, 123, 143–157. [Google Scholar] [CrossRef]
  38. Wei, W.; Cai, J.; Hu, X.; Han, Q. An electrical conductivity model for fractal porous media. Geophys. Res. Lett. 2015, 42, 4833–4840. [Google Scholar] [CrossRef]
  39. Wang, F.; Cai, J. Characterization of petrophysical properties in tight sandstone reservoirs. In Petrophysical Characterization and Fluids Transport in Unconventional Reservoirs; Elsevier: Amsterdam, The Netherlands, 2019; pp. 37–59. [Google Scholar]
  40. Guo, X.; Huang, Z.; Zhao, L.; Han, W.; Ding, C.; Sun, X.; Yan, R.; Zhang, T.; Yang, X.; Wang, R. Pore structure and multi-fractal analysis of tight sandstone using MIP, NMR and NMRC methods: A case study from the Kuqa depression, China. J. Pet. Sci. Eng. 2019, 178, 544–558. [Google Scholar] [CrossRef]
  41. Xie, W.; Yin, Q.; Zeng, J.; Wang, G.; Feng, C.; Zhang, P. Fractal-Based Approaches to Pore Structure Investigation and Water Saturation Prediction from NMR Measurements: A Case Study of the Gas-Bearing Tight Sandstone Reservoir in Nanpu Sag. Fractal Fract. 2023, 7, 273. [Google Scholar] [CrossRef]
  42. Ge, X.M.; Fan, Y.R.; Deng, S.G.; Du, Q.J. Research on correlation between capillary pressure and resistivity index based on fractal theory. J. China Univ. Pet. Ed. Nat. Sci. 2012, 36, 72–76, (In Chinese abstract). [Google Scholar]
  43. Zhou, J.; Liu, B.; Shao, M.; Song, Y.; Ostadhassan, M.; Yin, C.; Liu, J.; Jiang, Y. Pore structure analysis and classification of pyroclastic reservoirs in the Dehui fault depression based on experimental and well-logging data. Geoenergy Sci. Eng. 2023, 224, 211620. [Google Scholar] [CrossRef]
  44. Khurpade, P.D.; Kshirsagar, L.K.; Nandi, S. Characterization of heterogeneous petroleum reservoir of indian sub-continent: An integrated approach of hydraulic flow unit—Mercury intrusion capillary pressure—Fractal model. J. Pet. Sci. Eng. 2021, 205, 108788. [Google Scholar] [CrossRef]
  45. Zhang, G.; Li, H.; Hu, X.; Gao, Y. Study of the method portrayed by a river by calculating the tooth rate of the logging curve. J. Nat. Gas Geosci. 2019, 4, 63–70. [Google Scholar] [CrossRef]
  46. Ghanbarian, B.; Sahimi, M. Electrical conductivity of partially saturated packings of particles. Transp. Porous Media 2017, 118, 1–16. [Google Scholar] [CrossRef]
  47. Song, Z.; Liu, G.; Yang, W.; Zou, H.; Sun, M.; Wang, X. Multi-fractal distribution analysis for pore structure characterization of tight sandstone—A case study of the Upper Paleozoic tight formations in the Longdong District, Ordos Basin. Mar. Pet. Geol. 2018, 92, 842–854. [Google Scholar] [CrossRef]
Figure 1. Multi-fractal feature of micro-pore structure.
Fractalfract 08 00118 g001
Figure 2. Thin section photomicrographs of dominant lithology in the study area. Q: quartz, F: feldspar, M: matrix, P: pore space. (a) Thin section photomicrographs of sample 1, (b) Thin section photomicrographs of sample 2, (c) Thin section photomicrographs of sample 5, (d) Thin section photomicrographs of sample 7.
Fractalfract 08 00118 g002
Figure 3. Capillary pressure curves of seven rock samples and fitting results by Equation (6).
Fractalfract 08 00118 g003
Figure 4. Relationship of K / ϕ with D v , 1 and c.
Fractalfract 08 00118 g004
Figure 5. Pore structure typing result by D v , 1 and c.
Fractalfract 08 00118 g005
Figure 6. Experimental formation factor F and resistivity index I. (a) Experimental formation factor F, (b) Experimental resistivity index I.
Fractalfract 08 00118 g006
Figure 7. Comparison between capillary pressure curve and resistivity index curve for four rock types. (a) Comparison of type 1, (b) Comparison of type 2, (c) Comparison of type 3, (d) Comparison of type 4.
Fractalfract 08 00118 g007
Figure 8. Comparison of experimental resistivity with calculated by Archie model and Equation (16).
Fractalfract 08 00118 g008
Figure 9. Relationship between K / ϕ and d.
Fractalfract 08 00118 g009
Figure 10. Comparison between the calculated resistivity by Equation (16) and the experimental data.
Fractalfract 08 00118 g010
Figure 11. Affection of D v , 1 , D v , 2 , c and S 1 on capillary pressure curves ((a) c effects on capillary pressure curves, (b) S 1 effects on capillary pressure curves).
Fractalfract 08 00118 g011
Figure 12. Affection of D t , 1 , d on resistivity index curves. (a) D t , 1 effects on resistivity index curves, (b) d effects on resistivity index curves.
Fractalfract 08 00118 g012
Table 1. Specific parameters of 7 Carboniferous clastic sandstone samples.
TypeNo.Depth
m
Porosity
%
Permeability
md
FnDv1Dv2S1Pcmincd
I1317.4630.219103.081.8892.822.290.140.0153.950.9
2316.8232.5920202.981.8692.792.310.150.0283.2850.98
II3319.2330.555562.951.9812.762.420.180.0382.421.02
4321.5532.55302.631.8412.772.490.270.0232.221.34
III5322.6925.861153.62.1492.682.590.440.131.281.28
IV6314.5513.3514.77.271.9322.672.660.50.411.031.56
7318.7715.915210.071.7462.692.650.590.691.131.71
F is the Formation factor, and m and n are the Archie model parameters in Equation (12).
Disclaimer/Publisher’s Note: The statements, opinions and data contained in all publications are solely those of the individual author(s) and contributor(s) and not of MDPI and/or the editor(s). MDPI and/or the editor(s) disclaim responsibility for any injury to people or property resulting from any ideas, methods, instructions or products referred to in the content.