Article

Pore Structure Quantification and Fractal Characterization of MSA Mortar Based on 1H Low-Field NMR

1
Institute of Geotechnical Engineering, Southeast University, Nanjing 211189, China
2
College of Resources and Safety Engineering, Central South University, Changsha 410083, China
3
Department of Civil, Environmental and Architectural Engineering, University of Padova, via Ognissanti 39, 35122 Padova, Italy
*
Author to whom correspondence should be addressed.
Fractal Fract. 2024, 8(1), 42; https://doi.org/10.3390/fractalfract8010042
Submission received: 16 December 2023 / Revised: 28 December 2023 / Accepted: 5 January 2024 / Published: 9 January 2024
(This article belongs to the Special Issue Fractal Analysis and Its Applications in Geophysical Science)

Abstract

:
With the gradual depletion of natural sand due to over-exploitation, alternative building materials, such as manufactured sand aggregate (MSA), have attracted much attention. In order to interpret the evolution of pore structure and fractal characteristics in MSA mortar over long-term water saturation, the 1H low-field nuclear magnetic resonance (LF-NMR) relaxation method was used to investigate the temporal evolution of the pore structure in five single-graded MSA mortars and synthetic-graded mortars with small amplitudes in particle size. MSA presents a fresh rock interface characterized by a scarcity of pores, which significantly reduces the porosity of the mortar. The surface-to-volume ratio (SVR) is employed for characterizing the MSA gradation. Through an analysis of parameters, such as total porosity, pore gradation, pore connectivity, and pore fractal dimension of mortar, a correlation model between pore structure parameters and aggregate SVR is constructed. The fractal characteristics of pores and their variations are discussed under three kinds of pore gradations, and the correlation model between fractal dimension and porosity is established. These results demonstrate the high impermeability and outstanding corrosion resistance of synthetic-graded mortar. The fractal model of the pore structure evolution of MSA mortar has a guiding effect on the pore distribution evolution and engineering permeability evaluation of MSA mortar in engineering.

1. Introduction

The durability and permeability of materials such as concrete and mortar are important issues in engineering. They are determined by pore structure at the micro scale, and the study of mortar pore structure and its impact on durability is gaining attention. The pore structure of mortar immersed in water for a long time will undergo complex changes [1,2]. Therefore, the study of pore evolution is necessary to ensure the long-term performance of mortar structure. Additionally, the excessive use of natural sand has led to a growing interest in utilizing manufactured sand as an alternative aggregate in mortar production. This trend is driven by the need to conserve natural resources.
Aggregate gradation plays a significant role in the pore structure of mortar. Considerable progress has been made in studying aggregate gradation [3,4,5,6]. The usage of an aggregate that is too large or too small would adversely impact the uniformity [5], permeability, and microstructure of mortar [4,7]. The size and content of aggregates have a significant impact on porosity and the interfacial transition zone (ITZ) [8]. The overall surface area of the aggregate is determined by the particle size [9], which in turn affects the paste film thickness and water film thickness [10]. A larger aggregate surface area results in a thinner paste film but a thicker water film. The research [11] has shown a correlation between the Talbot gradation and the shear resistance of cemented paste, highlighting the influence of aggregate size on the peak strength of cemented paste [12]. Therefore, it is imperative to investigate the influence of aggregate particle size on the pore structure of mortar [13]. Limited research has been conducted on the quantitative characterization and modeling of pore structure in single-graded MSA (mortar containing small variation amplitudes in aggregate size) mortar, as well as the impact of MSA on the microstructure of mortar using a single variable.
The durability of mortar is influenced by its pore structure [14,15]. The pore structure undergoes changes under the conditions of a water saturation environment or a dry–wet cycle [1]. The hydration and calcium dissolution of mortar contribute to the changes in mortar performance [16]. In addition, the aggregate size also affects the effective water–binder ratio involved in the hydration process in mortar [17], where the water–binder ratio primarily impacts the compactness of the spatial accumulation of hydrated calcium silicate (C-S-H) gel particles [18]. Moreover, the aging of C-S-H gel is accelerated by hot water curing, leading to a significant increase in both the porosity and critical pore size of saturated mortar [19]. Additionally, the pore structure becomes coarser, which in turn enhances water permeability [20]. Currently, there are limited reports available concerning changes in the pore structure of MSA mortar under long-term water saturation.
The fractal method effectively characterizes the state of pore structure. The fractal dimension describes the irregularity of mortar mesh pores, with more complex pore characteristics resulting in a higher fractal dimension [21,22,23]. The complex pore structure in mortar is impossible to effectively describe using traditional geometric methods, but it exhibits self-similarity due to its wide range of pore sizes [22]. Consequently, fractal theory can analyze the complex pore structure with self-similarity [24,25]. Fractal theory is applied to the PSD spectrum obtained by NMR to obtain the fractal dimension pores with different gradations [26], and to quantitatively analyze the pore size characteristics [27]. As a new non-destructive analysis method, NMR has been used to determine the fractal dimension of porous materials such as cement, tailings mortar [28], natural sand aggregate mortar [7], and rock [24,29]. Additionally, the pore fractal dimension characteristics of MSA mortar deserve attention.
This study aims to interpret the evolution of pore structure in MSA mortar at water saturation. Five types of single-graded mortars and a synthetic-graded mortar were prepared. The parameters of mortar porosity, pore gradation, pore connectivity, and pore fractal dimension were analyzed using LF-NMR technology. A correlation model between the pore structure parameters and aggregate SVR was constructed, and the pore fractal characteristics and differences under three pore gradation divisions were explored.

2. Experiments and Theory

2.1. Materials and Experimental Procedures

The procedures for material preparation, specimen fabrication, and testing process are shown in Figure 1.
(1)
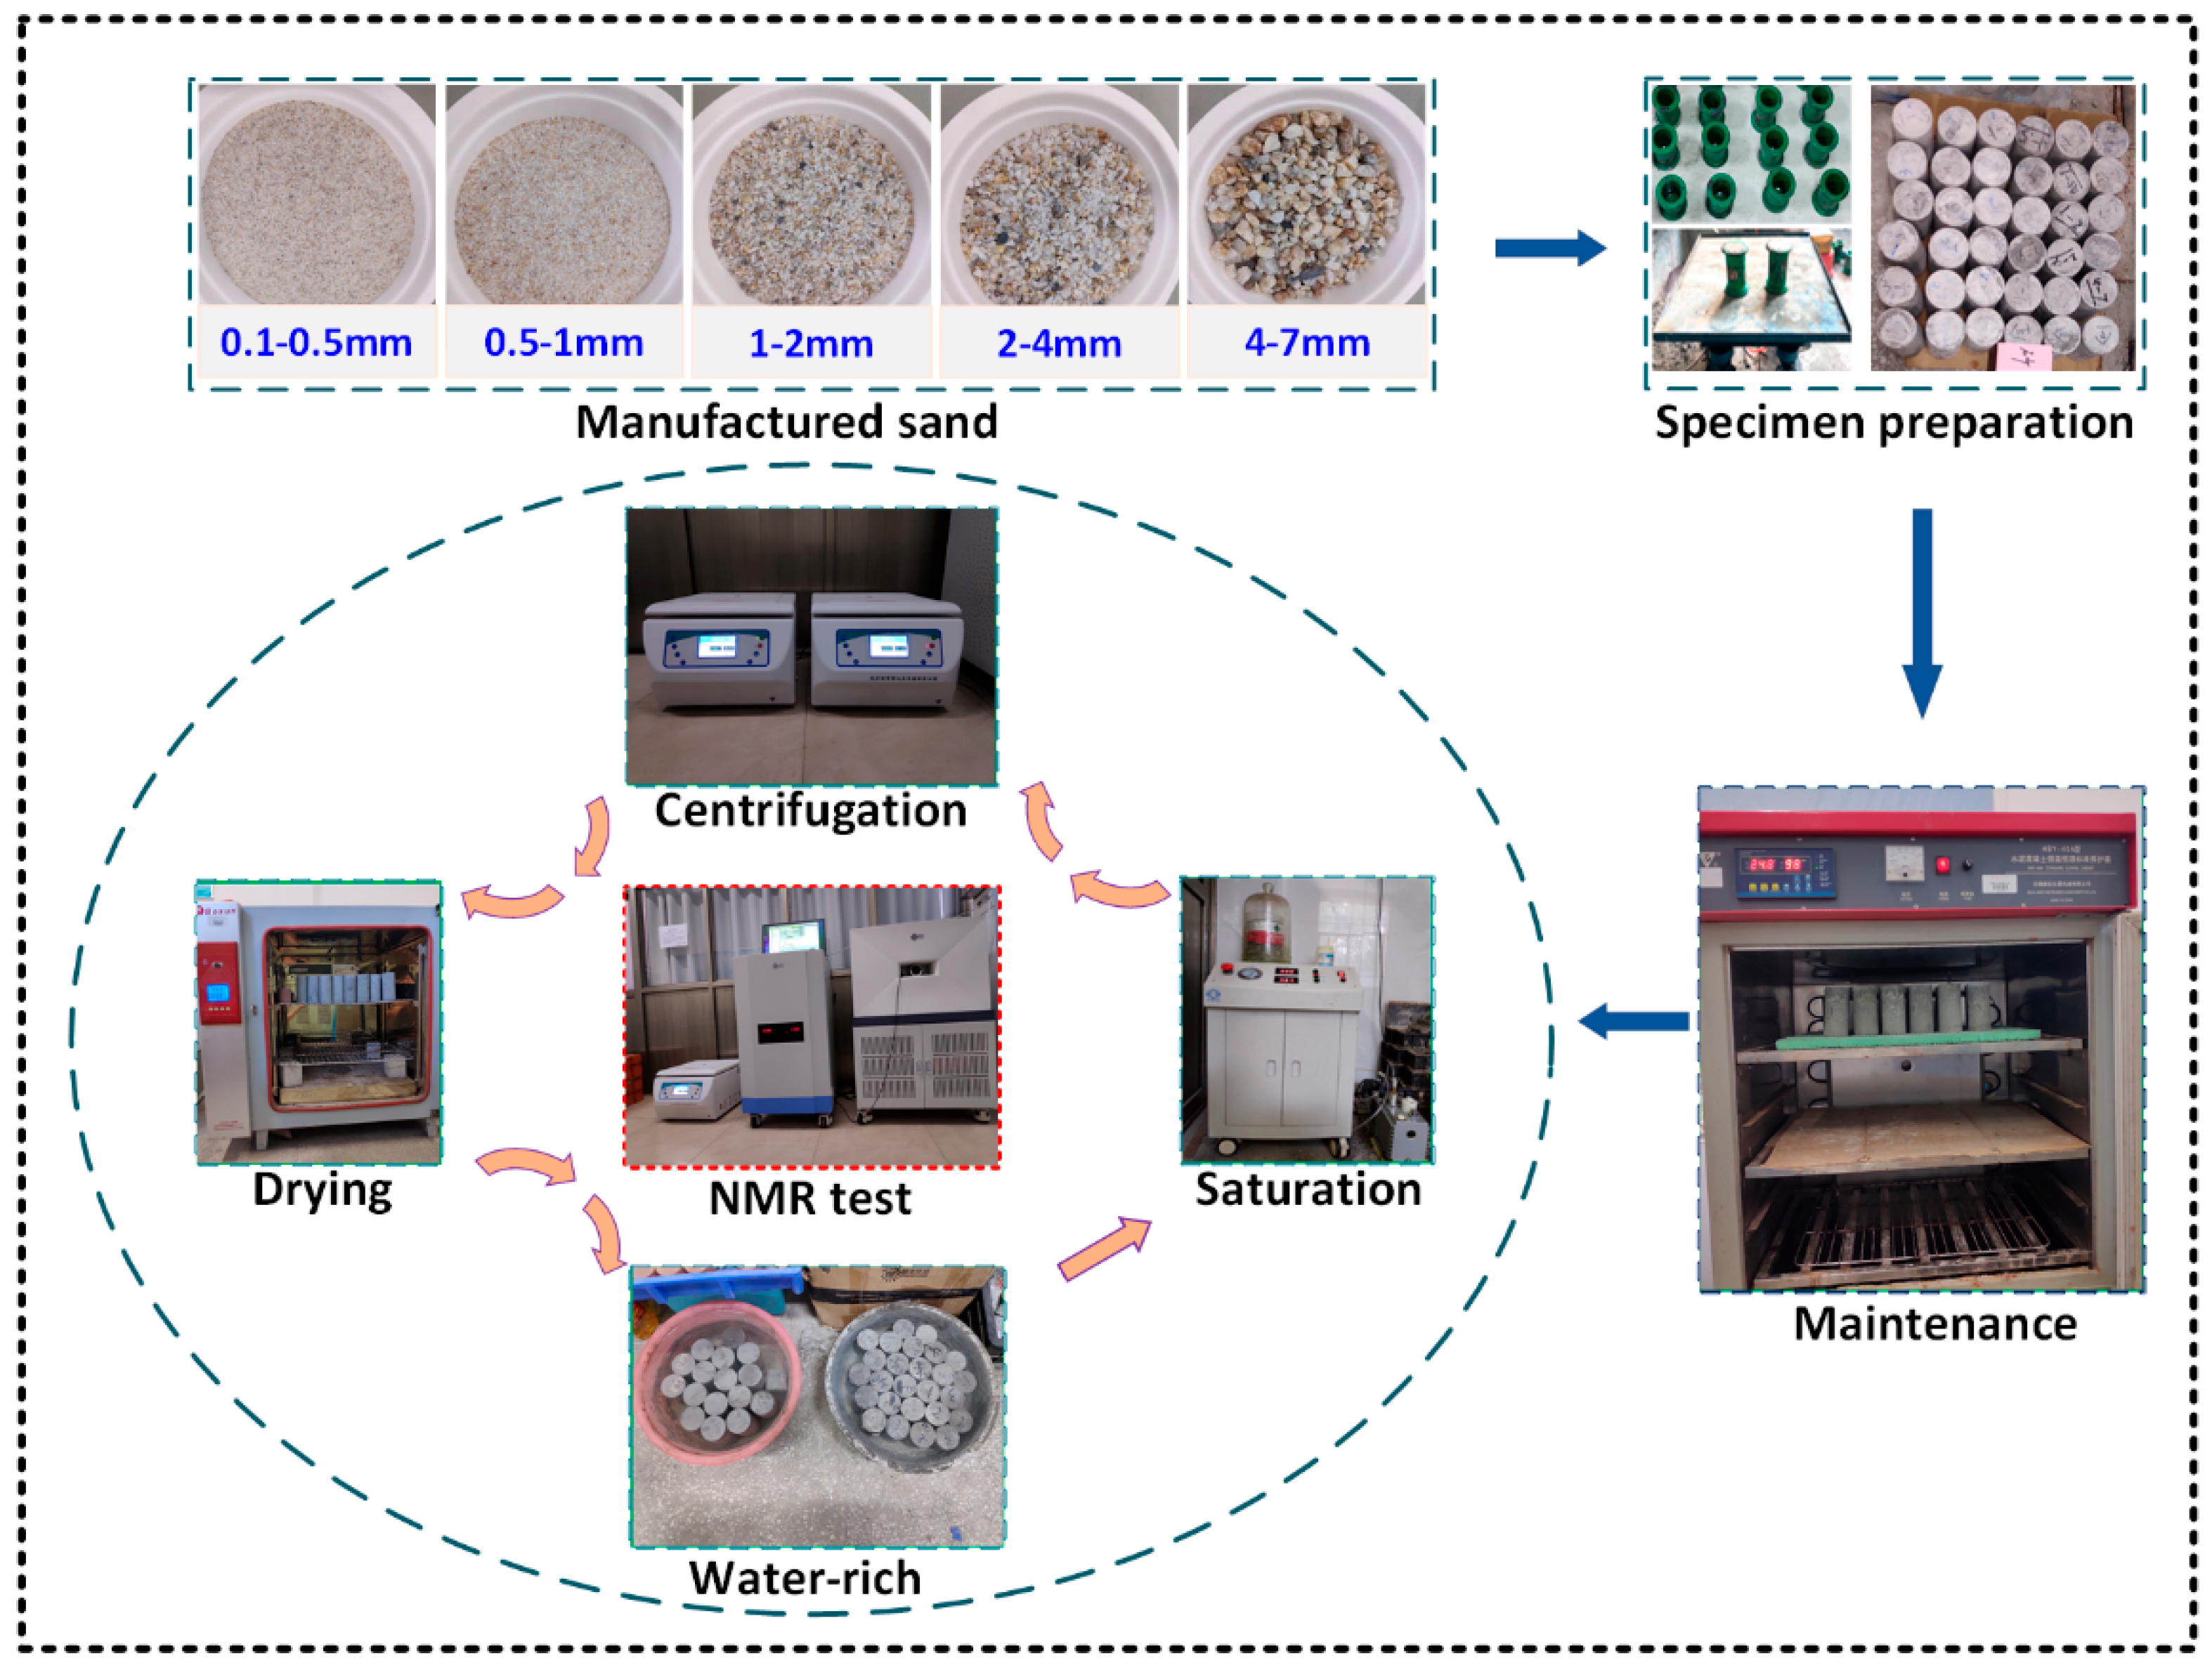
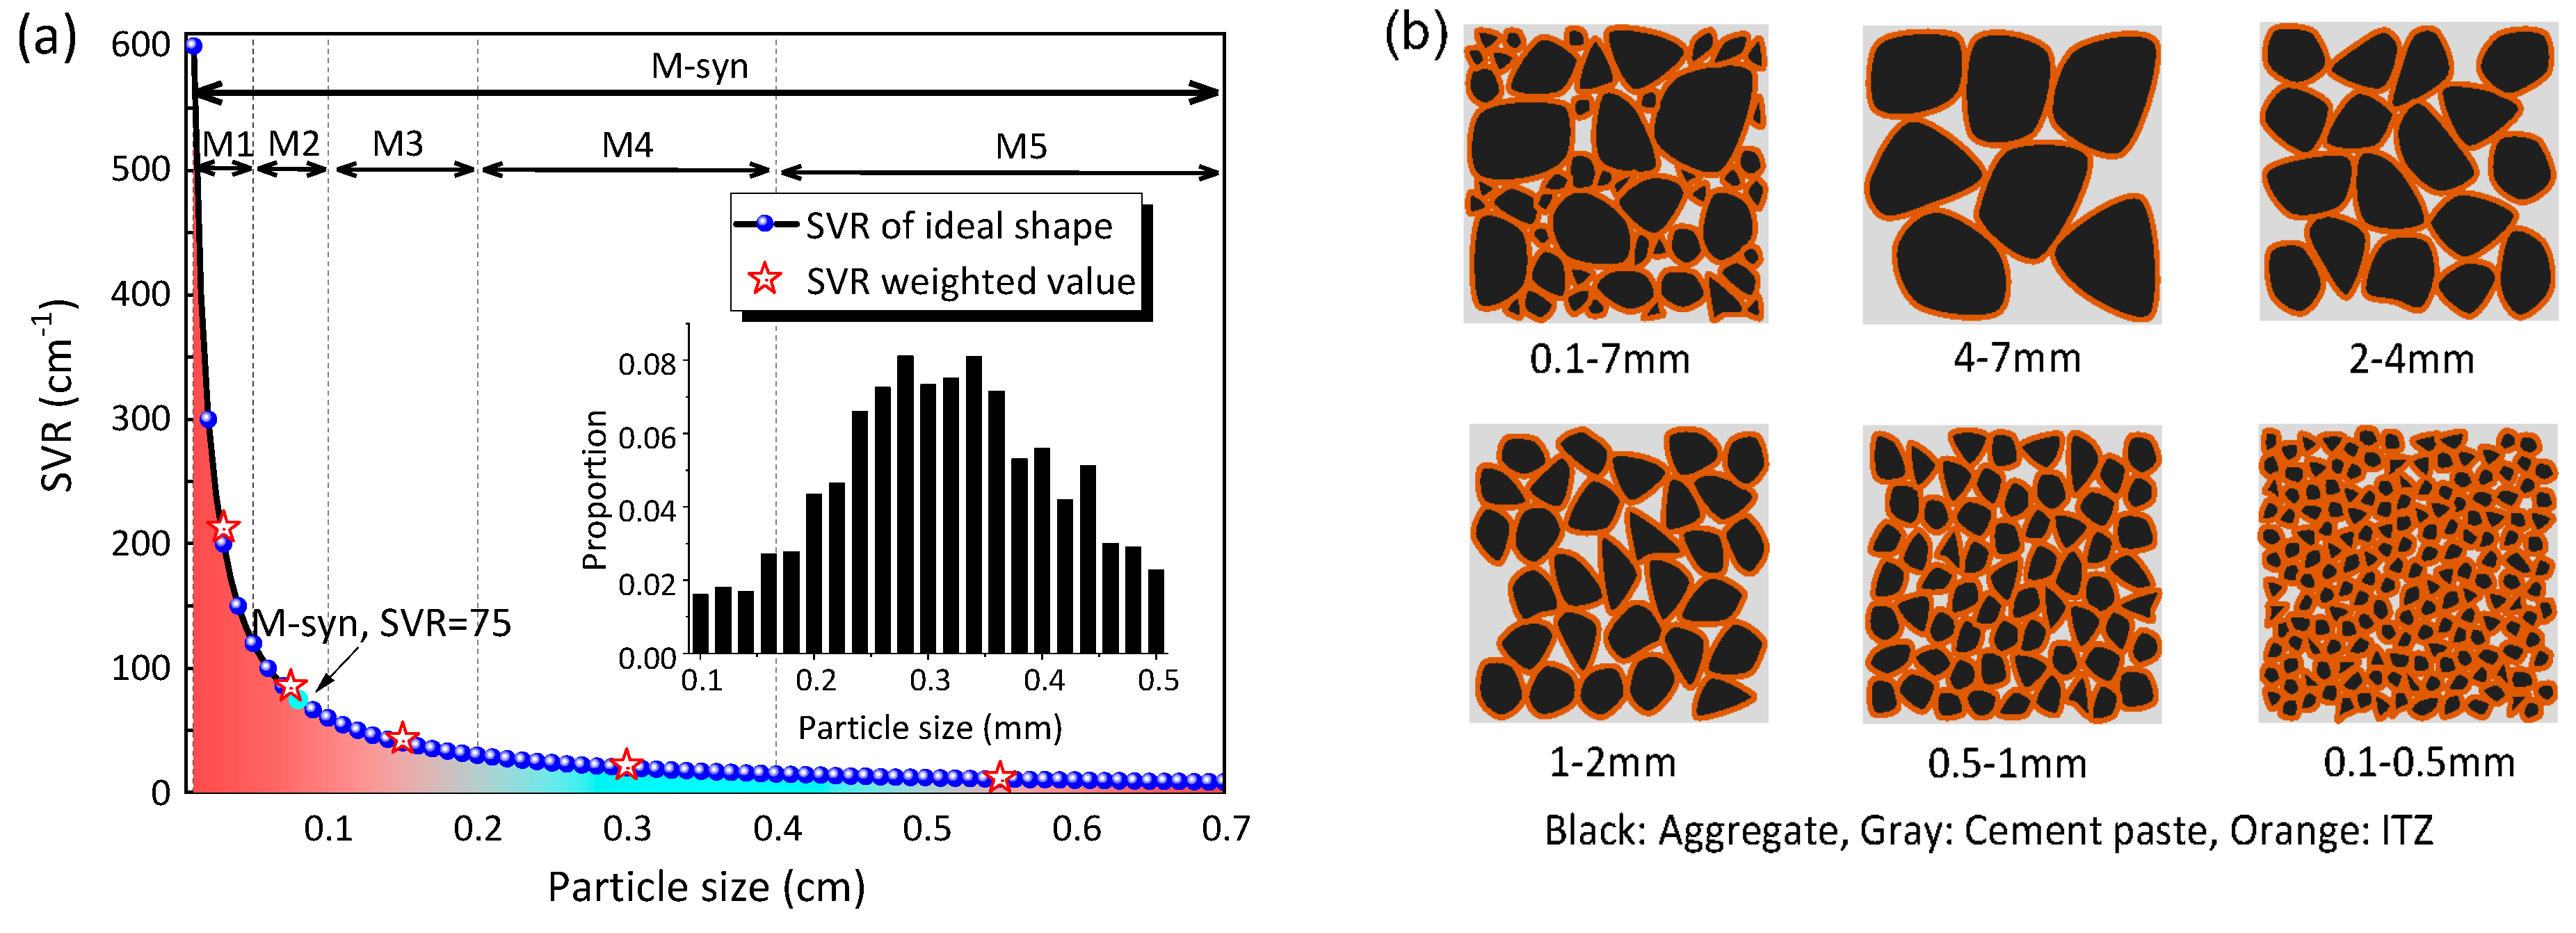
Aggregate preparation. Manufactured sands were obtained by crushing limestone. To investigate the impact of aggregate particle size on the pore structure of mortar, five different graded manufactured sands were used: 0.1–0.5 mm, 0.5–1 mm, 1–2 mm, 2–4 mm, and 4–7 mm, the bulk densities of aggregates were 1334.76 kg/m3, 1346.48 kg/m3, 1358.70 kg/m3, 1362.88 kg/m3, and 1430.82 kg/m3, respectively. Particle size distribution followed a Gaussian distribution. Samples were prepared and marked as M1, M2, M3, M4, and M5 groups with three parallel samples. Additionally, to simulate realistic natural environments or conditions, the five types of aggregates were mixed to form a synthetic-graded aggregate that was used to create the M-syn group. The M-syn group encompassed the entire aggregate size range of the individual M groups (M1, M2, M3, M4, and M5).
(2)
Cement mortar was prepared by mixing pure water, P.O. 42.5 Portland cement, and manufactured sand in proportions of 0.28: 0.77: 1, respectively. The water–cement ratio was 0.36. The composition of the mortar is illustrated in Figure 2b. Specimens were shaped into cylinders with a diameter of 50 mm and a height of 100 mm according to the Rock Test Rules for Water Conservancy and Hydropower Projects (SL/T 264-2020). After filling, tamping, initial curing, and demoulding, mortars were placed in a curing chamber at 22 °C with a relative humidity of 98% for 28 days.
(3)
Water saturation treatment. Prior to conducting the NMR test, a vacuum saturation device operating at a pressure of 0.1 MPa was used to saturate the specimen’s pores with water for a duration of 48 h.
(4)
NMR test. The NMR tests on each specimen were conducted using the AiniMR-150 NMR system manufactured by Suzhou New-market Analytical Instruments Co., Ltd. [30]. The CPMG sequence was conducted with 0.1 ms echo time (TE = 0.1 ms), 3000 echos (NECH = 3000), 1000 ms waiting time (TW = 1000 ms), and 16 scans. NMR tests obtained the T2 distribution and porosity of the pores.
(5)
Centrifugation and drying. Saturated specimens were centrifuged at 4000 rpm for 90 min and then tested for NMR. Next, the specimens were dried at 50 °C for 20 h and tested again for NMR.
(6)
Water saturation curing. The mortars after 28 days of hydration were removed from the curing box and fully immersed in water within a container for 365 days.
NMR tests were conducted following procedures (3), (4), and (5) after 28 days and 365 days of hydration, respectively, to observe the changes in the mortar’s pore structure in a water saturation environment.
The surface-to-volume ratio (SVR) of aggregate particles is the ratio of surface area to volume. This paper is used to quantitatively characterize the gradation of aggregates [30]. The laser particle size analysis shows that the aggregate size distribution under 0.1–0.7 mm gradation conforms to the normal distribution, so the SVR is obtained by weighted average calculation. Figure 1 shows the ideal aggregate SVR distribution curve and the average SVR value obtained by the test. SVR and aggregate size distribution of each group are shown in Figure 2a. A series of tests were carried out on the mortar to obtain the solid density ρ28d, ρ365d and its density loss ∆ρ of mortar, and the porosity Φ28d at 28d and Φ365d at 365d are shown in Table 1.

2.2. Background Theory

2.2.1. NMR Theory

By employing NMR technology, the presence of hydrogen 1H in water molecules within porous materials, such as mortar and concrete, enables the acquisition of pore distribution information and the visualization of pore structure [30,31]. The NMR analysis of saturated mortar provides comprehensive insights into the entirety of its pores [32]. Assuming uniformity in the magnetic field during testing, the contributions of volume and diffusion relaxation of water within the void can be disregarded [30,33]. Consequently, the T2 relaxation rate is solely dependent on the surface relaxation rate, allowing for simplification, as follows:
1 T 2 = ρ 2   ( S V ) = ρ 2   F s 1 r
where T2 is the decay time of transverse relaxation component (ms); r is the pore radius (μm); S/V denotes the specific surface area of the pore (m−1). Fs refers to the pore shape factor (spherical pore, Fs = 3); ρ 2   is the surface relaxation strength of the mortar, primarily influenced by the mineral composition, to be determined as 0.01 μm/ms based on the literature [30,34,35,36]. Therefore, the relationship between r and T2 can be simplified and expressed as follows:
r = 0.03 T 2

2.2.2. Fractal Theory Based on NMR

According to research on fractal theory [22,26,37], it is evident that porous materials like cement and concrete display pronounced fractal characteristics in their internal pore structure, establishing a correlation among T2, pore radius r, and fractal dimension D. The subsequent equations can be employed to determine pore sizes larger than r [30,38]:
N r = r r m a x   f ( r ) d r = a r D
where N r represents the count of pores with sizes exceeding r, r denotes the pore radius in micrometers (μm), r m a x signifies the maximum pore radius in micrometers (μm), a denotes the fractal factor, D represents the fractal dimension, and f ( r ) represent the density function of the pore radius expressed as a percentage (%), given by
f r = d N r d r = D a r D 1
The total volume of pores smaller than r can be calculated using
V r = r m i n r   f ( r ) a r 3 d r = a r 3 D r m i n 3 D
Here, V r denotes the cumulative volume of pores with radii lesser than r in cubic micrometers (μm3), a represents a proportional constant equal to −Da2/(3 – D), and r m i n signifies the minimum pore radius in micrometers (μm). Consequently, the total pore volume V t of the mortar can be obtained from Equation (6):
V t = r m i n r m a x   f ( r ) a r 3 d r = a r m a x 3 D r m i n 3 D
The cumulative volume fraction of pore radius less than r can be obtained by Equations (5) and (6) [30,38].
S v = V r V t = r 3 D r m i n 3 D r m a x 3 D r m i n 3 D
When r m i n is considerably smaller than r m a x , simplification of Equation (7) results in Equation (8). Furthermore, Equation (8) can be further revised as Equation (9):
s v = r 3 D r m a x 3 D = T 2 3 D T 2 m a x 3 D
lg s v = 3 D lg r + D 3 lg r m a x = 3 D lg T 2 + D 3 lg T 2 m a x
If the pores in the mortar exhibit self-similarity and fractal characteristics, Equation (9) establishes a linear relationship between l g r   and l g ( s v ) [39]. A higher fractal dimension D indicates greater complexity in the pore structure and increased heterogeneity in the mortar sample [22].

3. Results

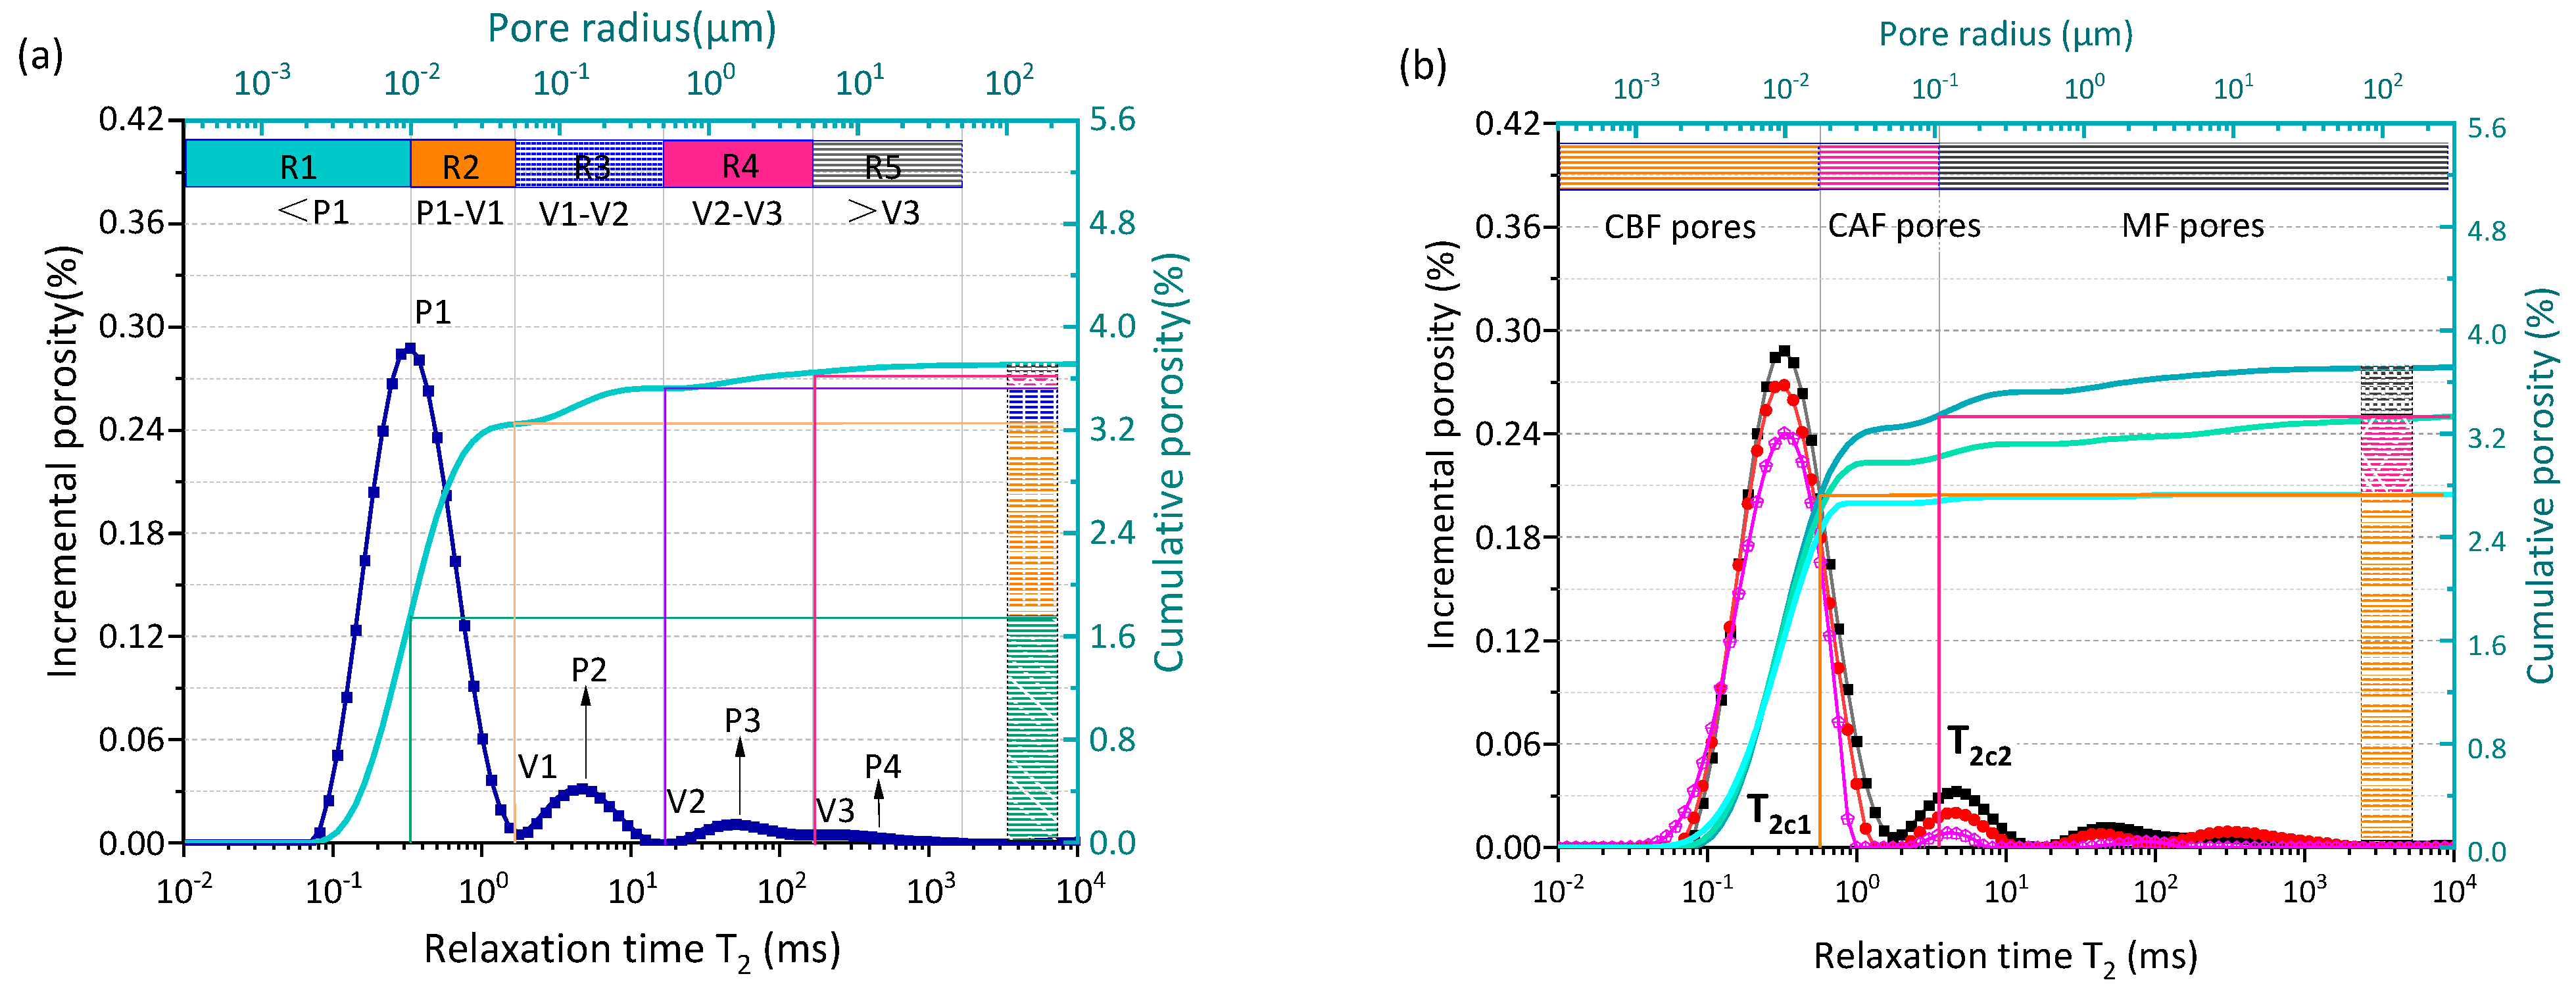
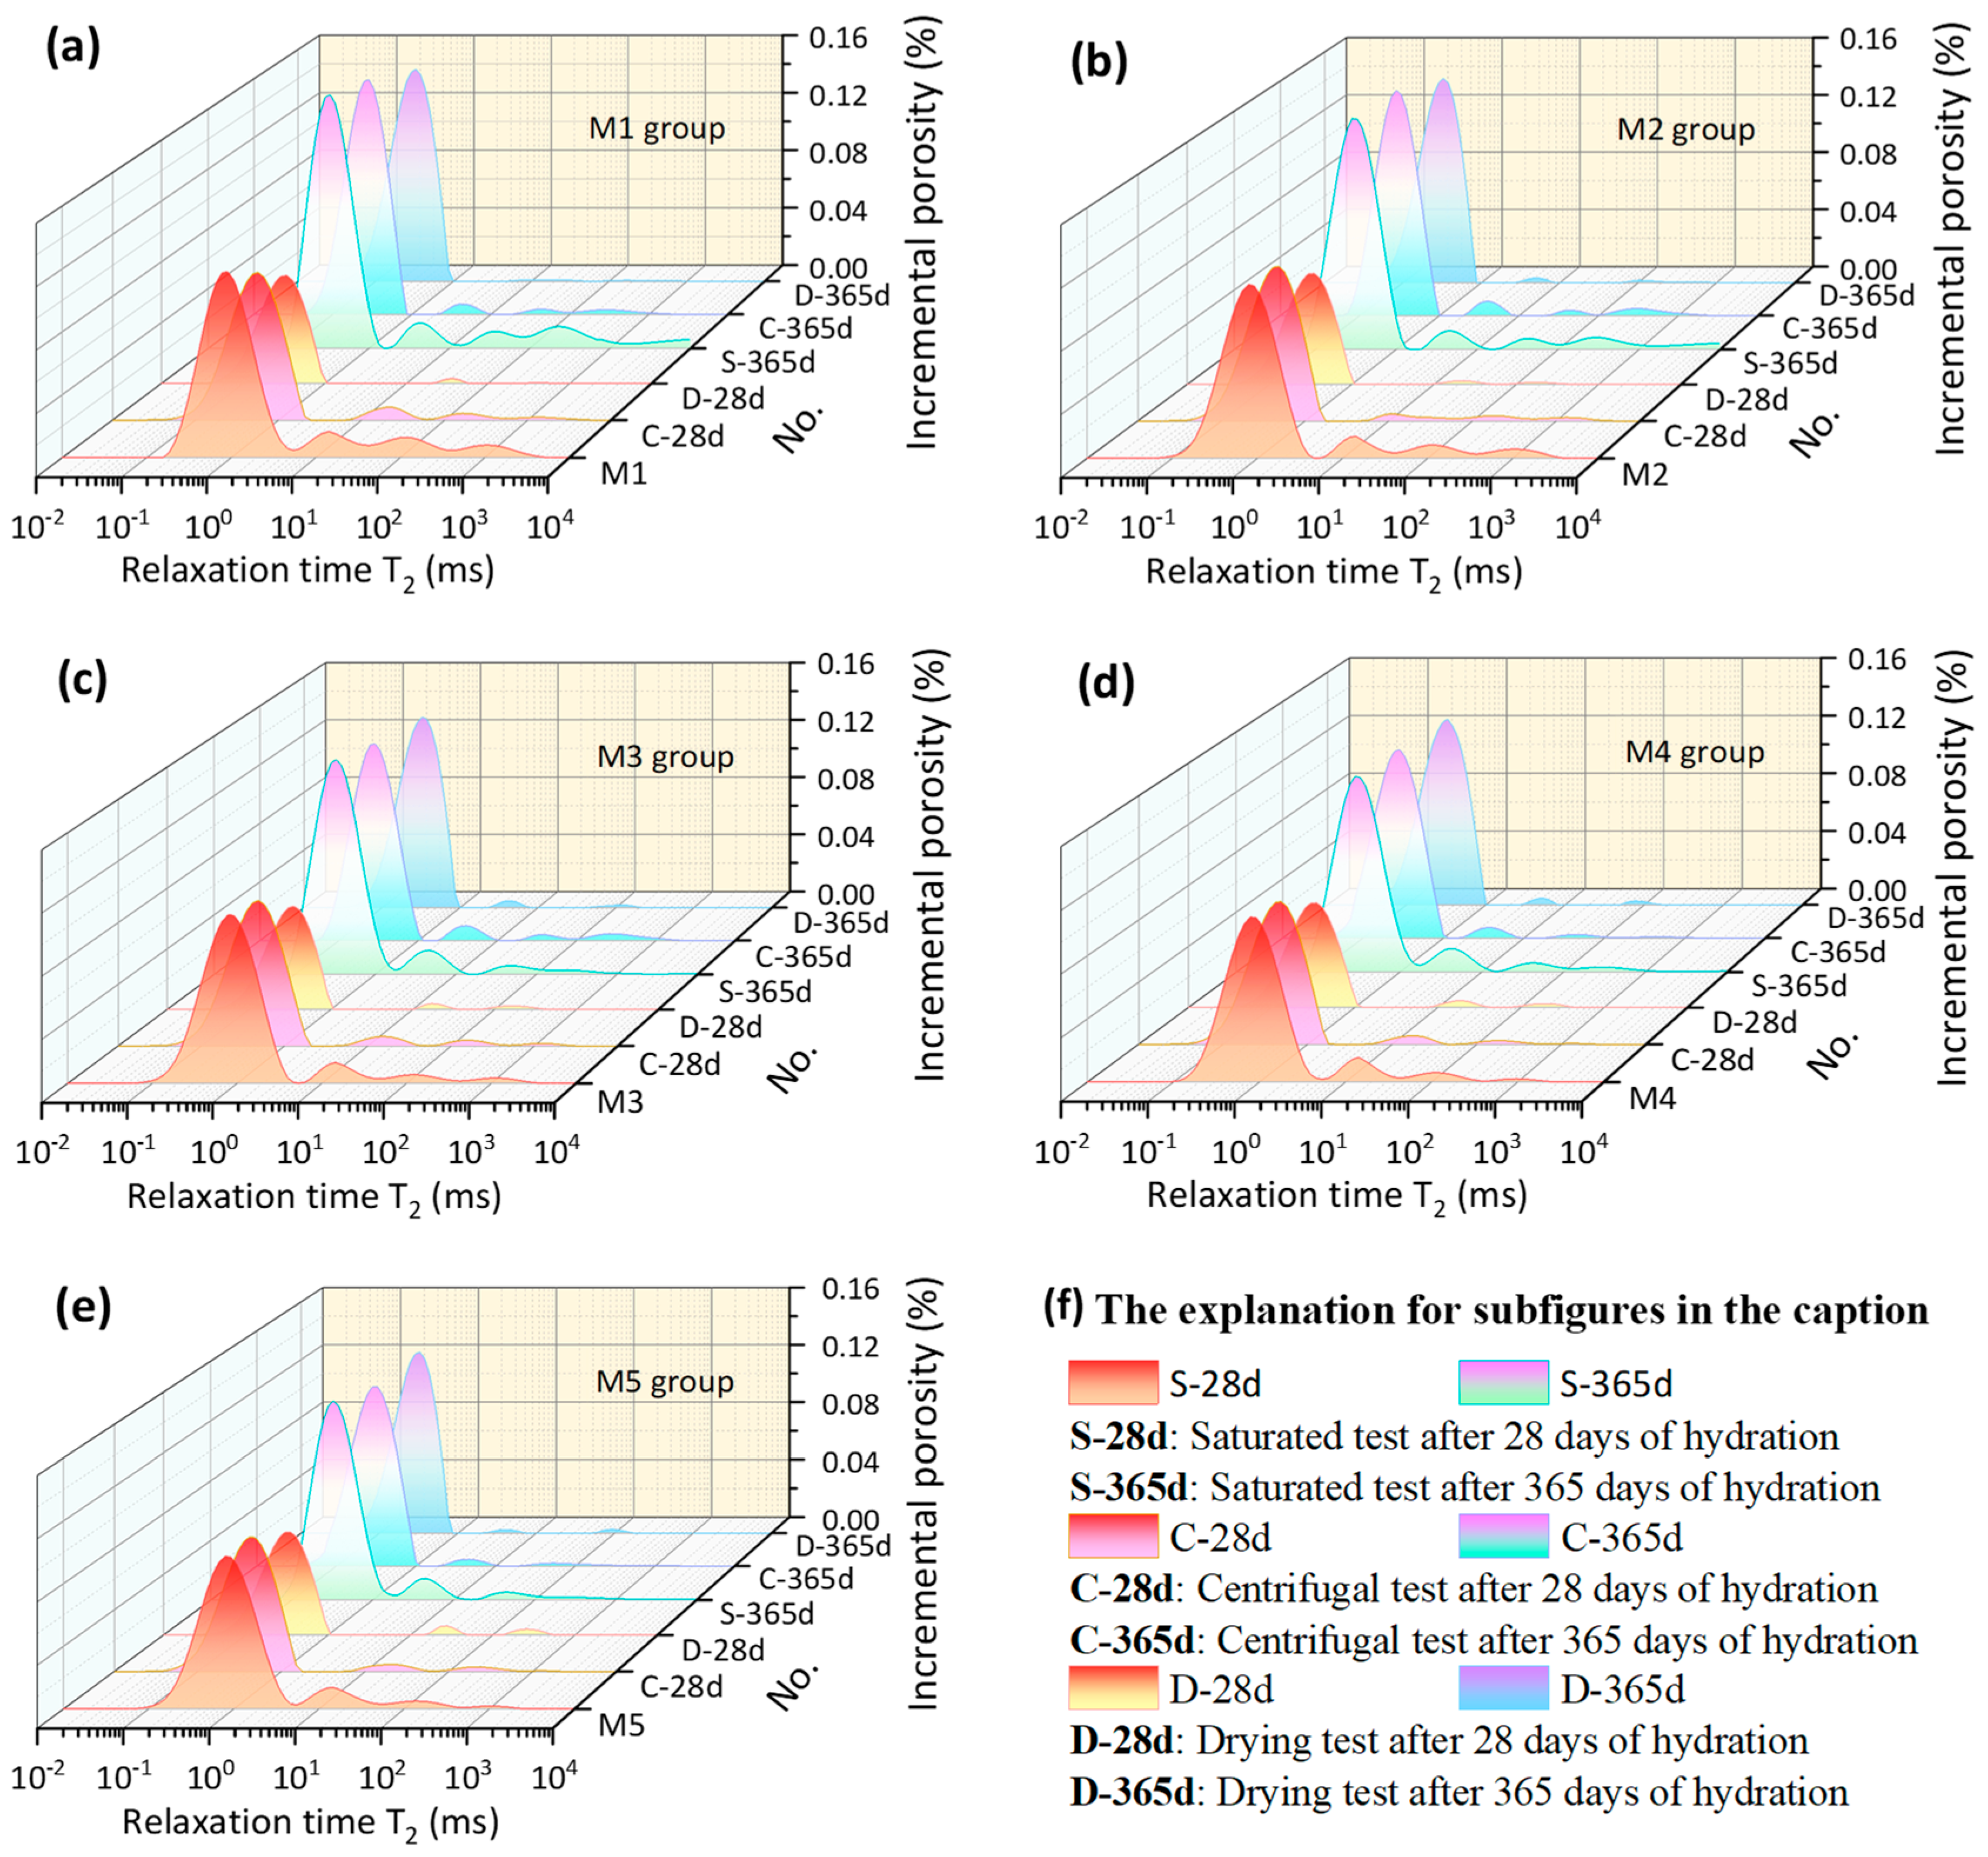
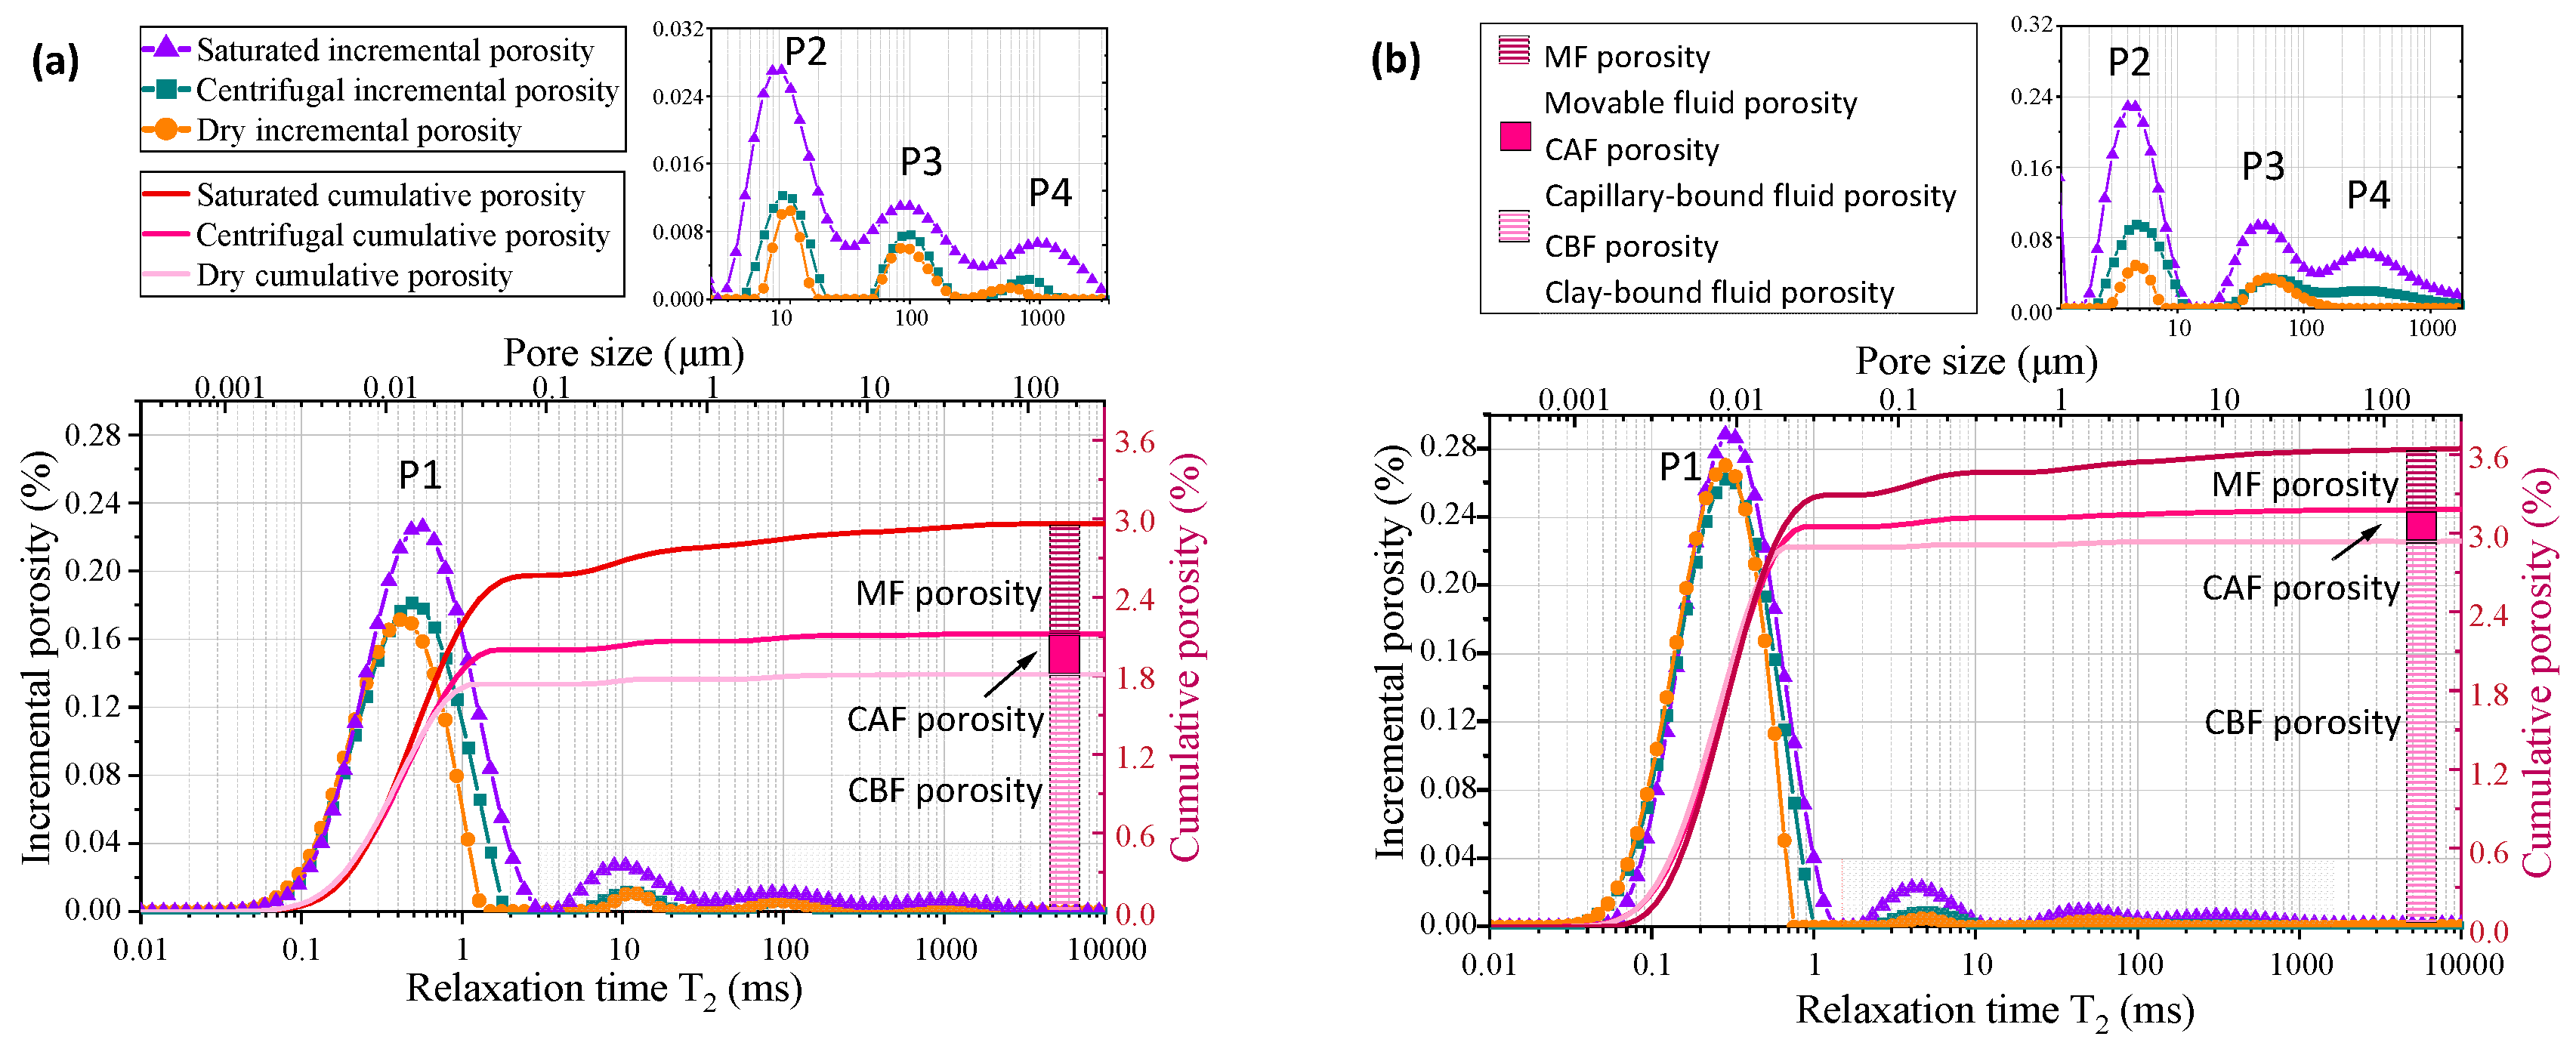
3.1. Evolution of T2 Spectr$um and Porosity

The T2 spectra of three parallel samples had good reproducibility. The PSD of six groups of mortars with different gradations have similar distribution patterns, which have four peaks (P1, P2, P3, and P4) and three valleys (V1, V2, and V3). As shown in Figure 3a, the peak represents the most probable pore size. The method of double T2 cut-off (T2c) value is shown in Figure 3b [30], which is obtained through a procedure of saturation, centrifugation, and drying, and the T2 spectrum distribution is shown in Figure 4.
The double T2c value method reflects the connectivity of pores in mortar [40]. According to the fluidity of water in pores, the pores are divided into clay-bound fluid pores (CBF), capillary-bound fluid pores (CAF), and movable fluid pores (MF). The CBF pores include micropores such as C-S-H interlayer voids, gel pores, and internal hydration pores [41]. The CAF pores are mainly large gel pores. The fluid in these pores is mainly adsorbed by the van der Waals force of the solid matrix. It can be seen that the T2 spectrum of test sequences S-28d and S-365d in Figure 4 characterizes the distribution of full-size pores, the T2 spectrum of C-28d and C-365d characterizes the distribution of CBF and CAF pores, and the T2 spectrum of D-28d and D-365d only contains CBF pores.
In the case of single-graded mortar, mortars with varying aggregate sizes exhibit equal most probable pore radii under identical curing times. Additionally, the porosity fraction of the most probable pore and the maximum pore size are positively correlated with the aggregate SVR [42]. This demonstrates that the aggregate size has an impact on the maximum micron pores and the number of characteristic pores.
The mechanism of the aggregate size affecting the pore structure is as follows: Aggregate with a large SVR has a large amount of water adsorption on the surface, resulting in a decreased effective water–cement ratio [43], and the mortar forms a smaller paste film thickness in the rapid hydration stage (initial setting 2 to 20 h), which will increase the number of C-S-H interlayer pores, gel pores, and hydration pores in the P1 region. In addition, the aggregate SVR is positively correlated with the total volume of the ITZ and incompletely hydrated loose bodies [8], while macropores are mainly produced in the ITZ and loose bodies [9]. Therefore, aggregates with a larger SVR also increased the number of pores in the range from P2 to P4 region, and the pore components of the most probable pores and maximum pore radii also increased [3].
After servicing in water saturation for 365 days, the T2 spectral distribution of each mortar is broadened. Additionally, the most probable pore size of P1 decreased, while their respective components increased by 41.7%, 45.5%, 27.3%, 22.6%, and 30% for groups M1 to M5. The most probable pore radius of P1 decreased from 0.025μm to 0.01μm, indicating that the formation of a dense cementitious structure within the mortar [18]. Despite the decrease in the most probable pore radius of P4 from 35μm to 10μm, pores larger than 120μm were observed.
The T2 spectrum is divided and statistically analyzed according to the method in Figure 3a; cumulative porosity components and their proportions of the spectrum peaks are obtained, as shown in Figure 5. It was found that the pore variation is manifested by the increase in P1 and P4, that is, the increase in hydration micropores and erosion macropores. One of the reasons for this variation is the continuous hydration of the internal unhydrated cement (the peak value of P1 increases). The other reason is that the mortar is eroded by water [33,44] and the calcium hydroxide dissolves [45] (the peak value of P4 increases and produces pores larger than 120μm).

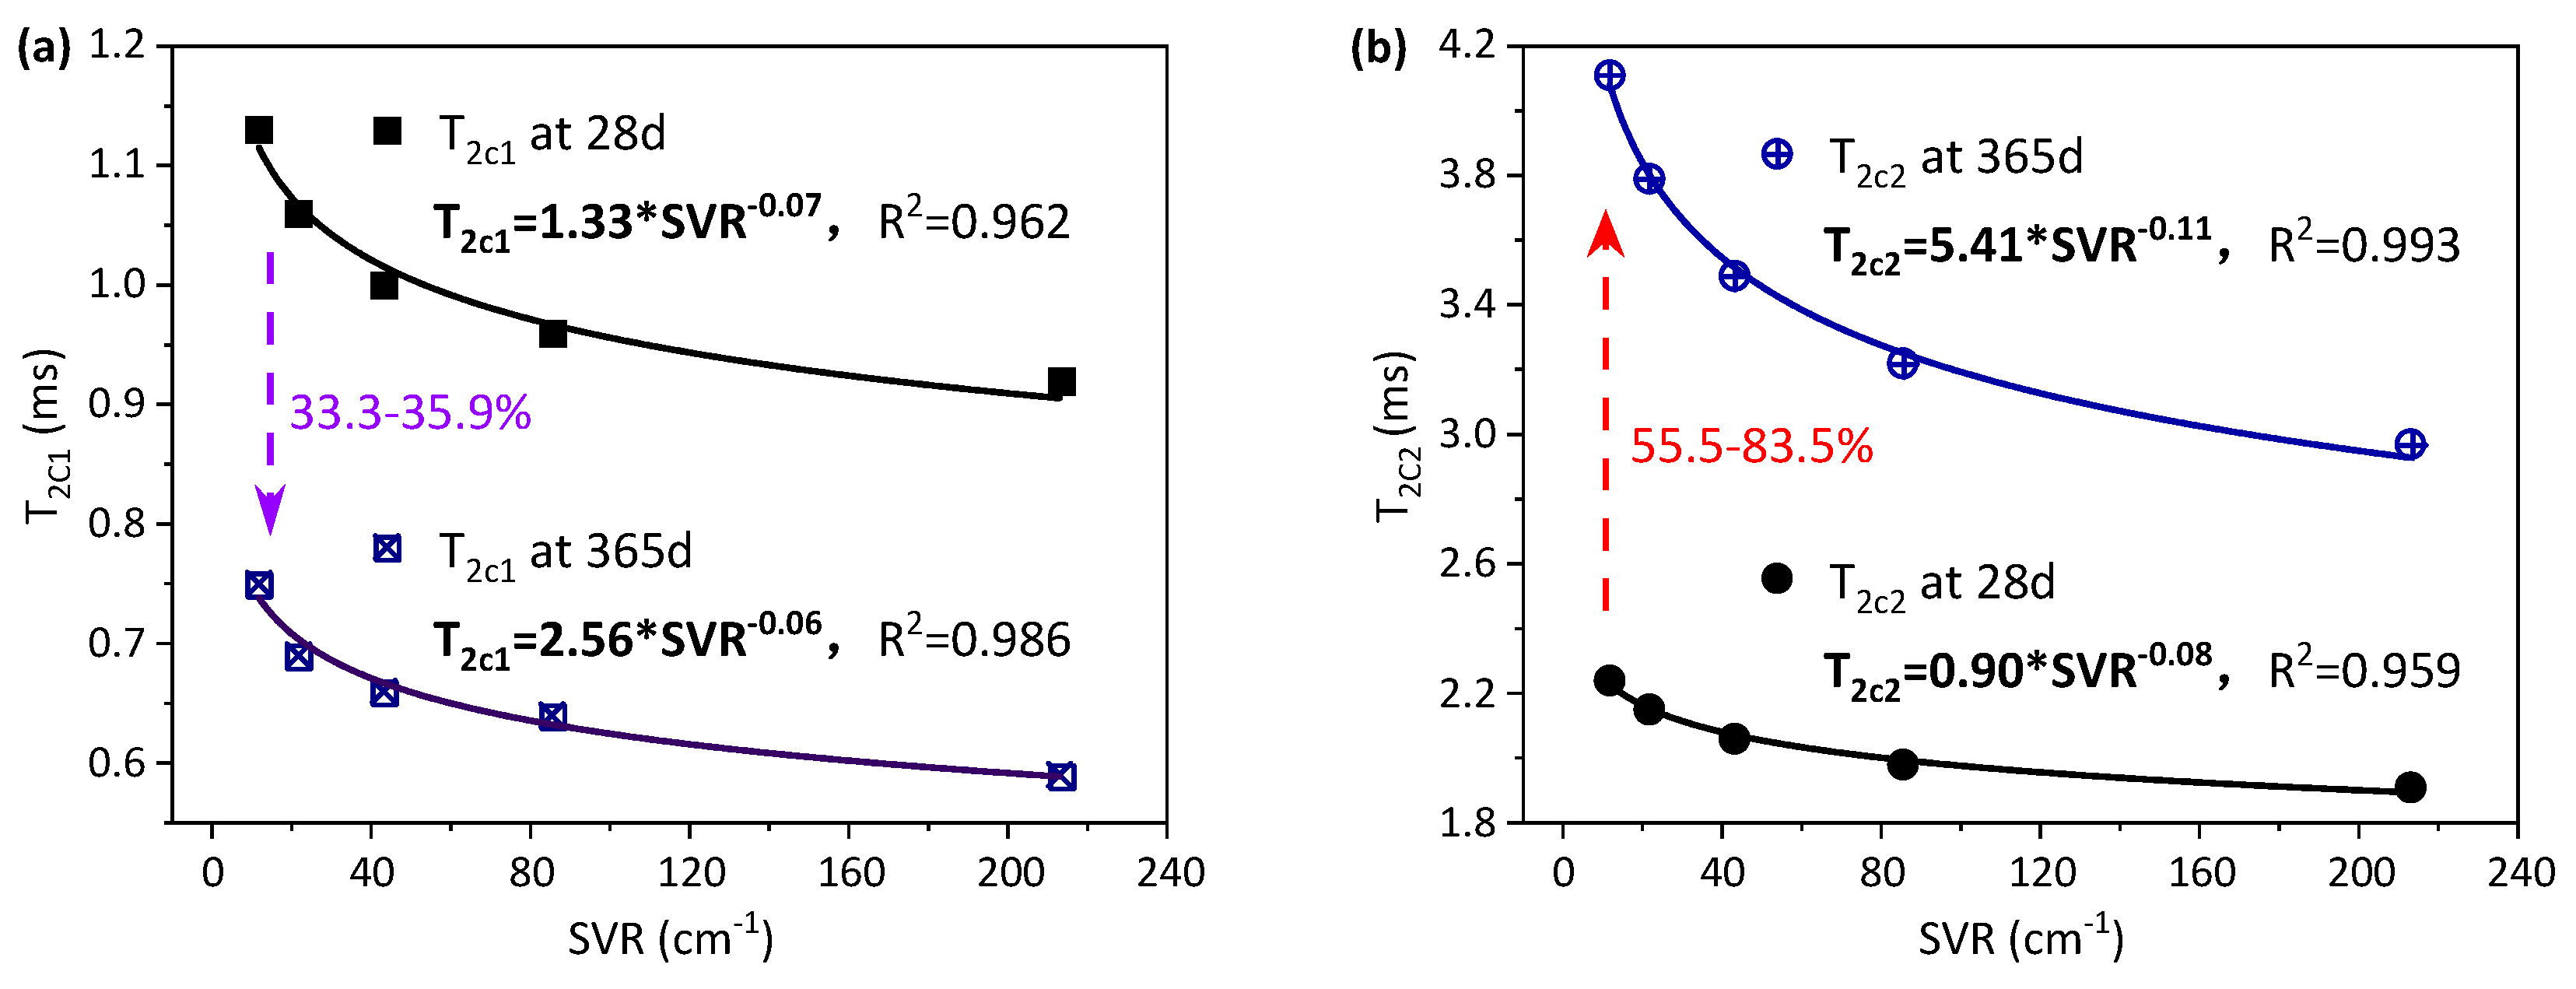
3.2. Evaluation of Pore Connectivity

The double T2c value that characterizes the connection connectivity of mortar is shown in Figure 6, which conforms to the function T2c = a × SVRb with aggregate SVR. T2c1 and T2c2 exhibit a negative correlation with SVR, indicating that the smaller aggregate size of MSA leads to greater pore richness and stronger pore connectivity. These experimental findings are supported by Figure 2b, which illustrates that ITZ dominates the seepage path influencing mortar permeability. The aggregate SVR is proportional to the total volume of ITZ [19]. Therefore, small aggregate (large SVR) makes the mortar form rich pores, resulting in a small T2c value according to the principle of T2c in Figure 3b. In addition, after 365 days of water saturation, T2c1 decreases and T2c2 increases, providing evidence of enhanced connectivity in CBF pores (T2c1 decreases) and weakened connectivity in CAF pores (T2c2 increases) [33]. The cause of this phenomenon is supported by Figure 7, where an increase in CBF porosity and a decrease in CAF porosity confirm that the pore-throat structure connecting the pores primarily consists of CBF pores.
All the pores detected in the saturated mortar included CBF pores, CAF pores, and MF pores. Subsequent centrifugation facilitated the detection of fluid-bound CBF and CAF pores. Upon complete drying, solely small and poorly interconnected CBF pores were observable. Through calculations and the analysis of the PSD spectrum depicted in Figure 4, a connection can be established between aggregate SVR and the presence of CBF, CAF, and MF pores, as indicated in Figure 7. Porosity escalates in tandem with SVR, and its relationship broadly conforms to the power function Φ = a × SVRb. Both parameters a and b exhibited higher values following 365 days of hydration. Evidently, there is an increase in pores and alterations in pore connectivity.
In addition, the MF pores are mainly located within ITZ and unhydrated cementitious material, which is distant from the aggregate [46]. The hydration leads to the densification of ITZ and the hydration of unhydrated material. Hence, the MF porosity in the M1 to M5 groups has a decreasing trend. Once the mortar has been immersed in water for a specific period, the cementitious material becomes fully hydrated. Consequently, hydraulic erosion causes the maximum size of MF pores to incrementally expand over time. Which can be verified by the increase in the maximum pore size in Figure 4. It was also found that needle-like crystal substances appeared on the surface of samples and gradually increased.

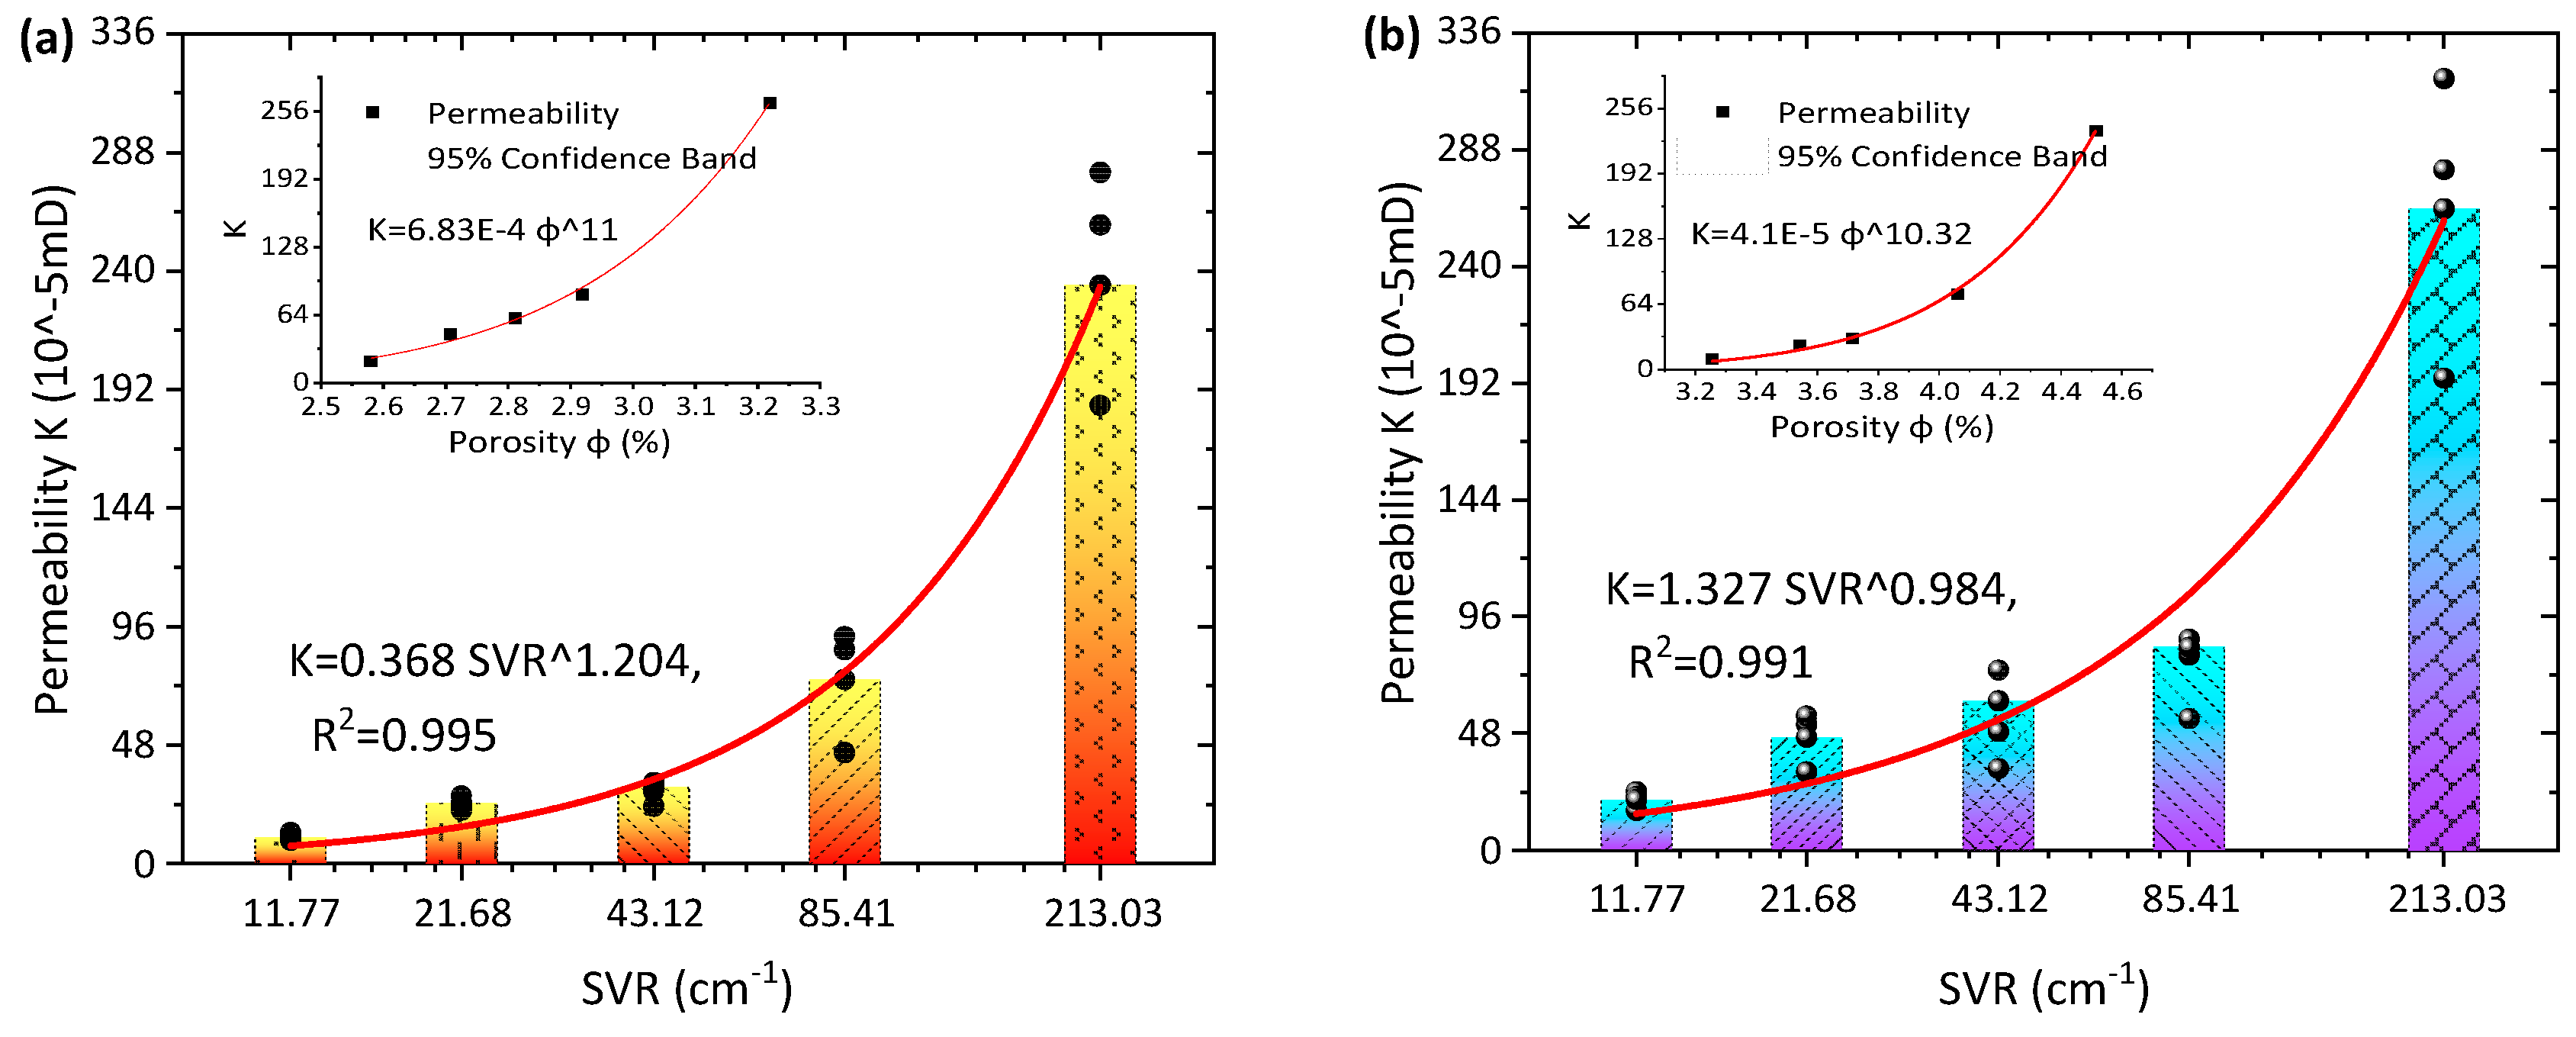
3.3. The Permeability Variation

Permeability characterizes the ability of porous media materials to be passed by liquid, and its size is related to porosity, pore density, and pore connectivity [39,47]. The Coates model is widely used to calculate permeability in the porous media of water-bearing systems. The simplest form of permeability K (mD) is as follows:
K = ( S M S C B + S C A ) n ( Φ C ) m
Among them, Φnmr is the porosity (%) of mortar; m, n, and C are model parameters; and the empirical values are 4, 2, and 10 when the number of samples is insufficient [40,48]. The fraction of CBF pore, CAF pore, and MF pore (vol. %) were determined as SCB, SCA, and SM, respectively. The permeability of mortar with different graded aggregates is shown in Figure 8.
After 365 days in a water saturated environment, the permeability of the mortar increases, which confirms the enhancement of pore connectivity [16]. The permeability change is mainly due to the increase in MF pores, and the CBF pores and CAF pores as pore throats are further increased.
It can be seen from Figure 7 that SCB gradually increases, and SCA and SM gradually decrease. It can be seen that in the process of mortar service to 365 d, the effect of the initial water saturation environment on mortar is mainly to enhance the hydration of mortar. With the continuous saturation time, the unhydrated mortar will be completely hydrated [18], which leads to the densification of the C-S-H structure, and the cumulative hydraulic erosion of mortar will increase, and the mortar with large aggregate SVR is more strongly affected by hydraulic erosion [49].

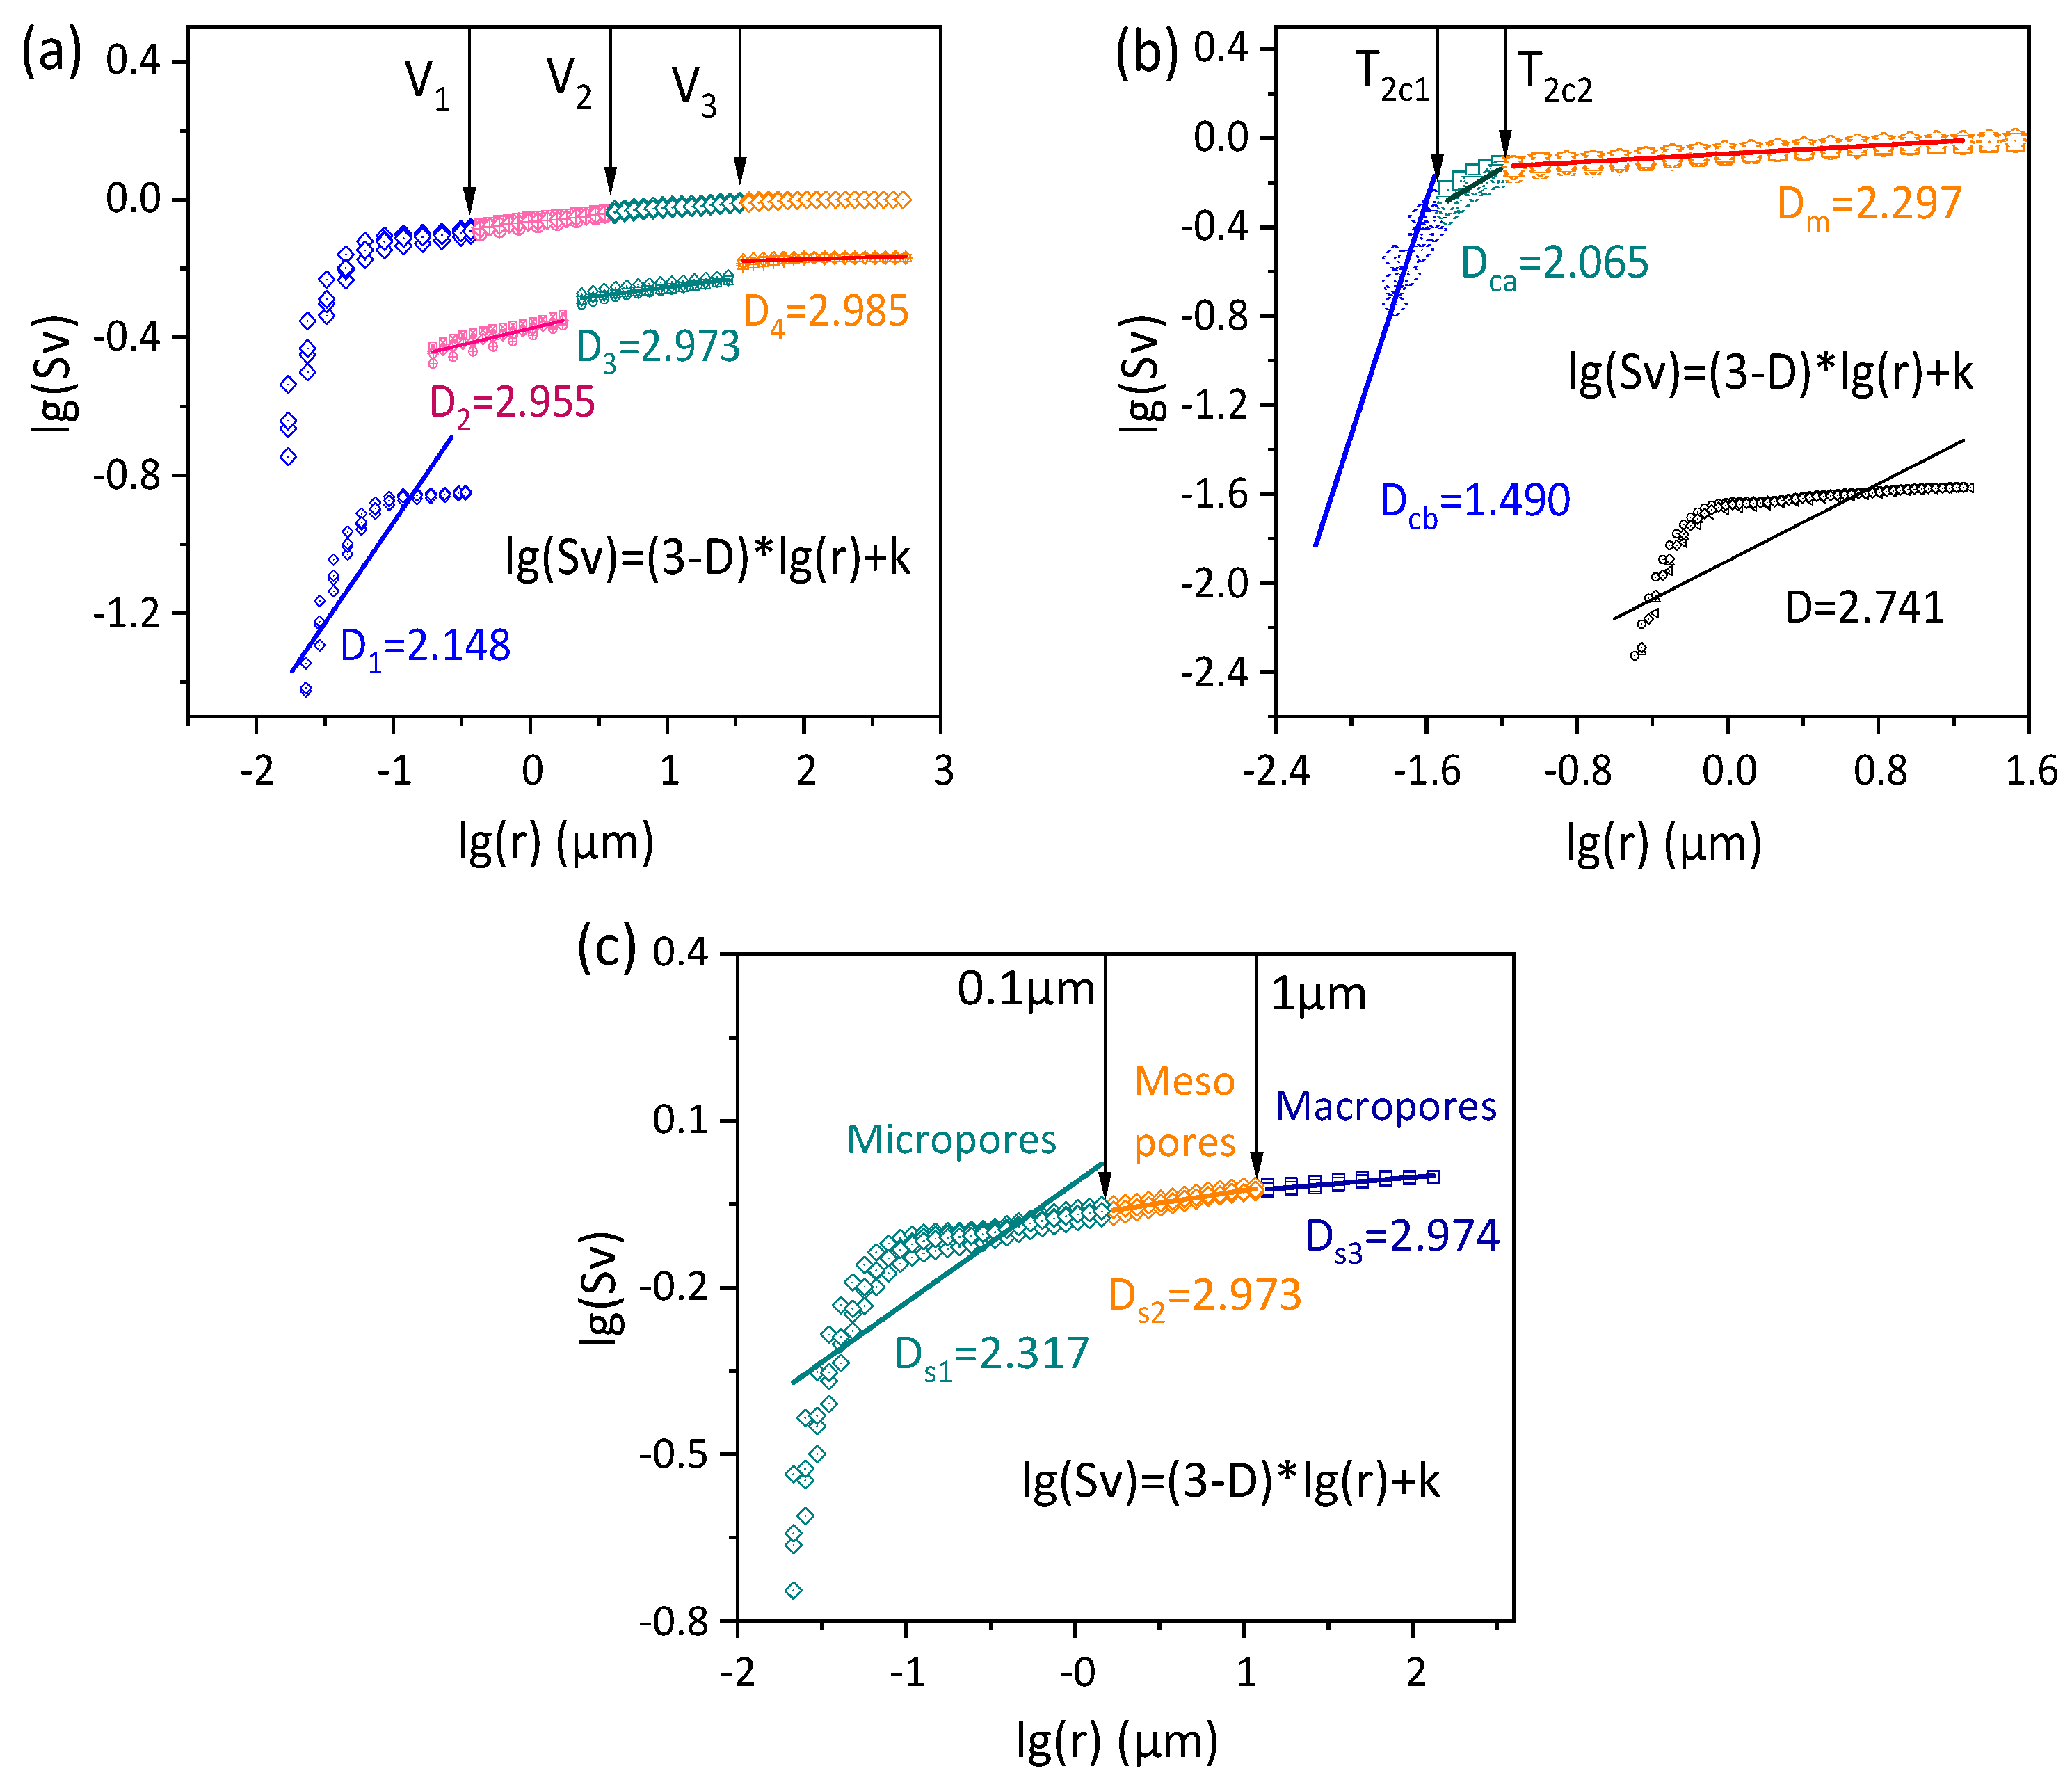
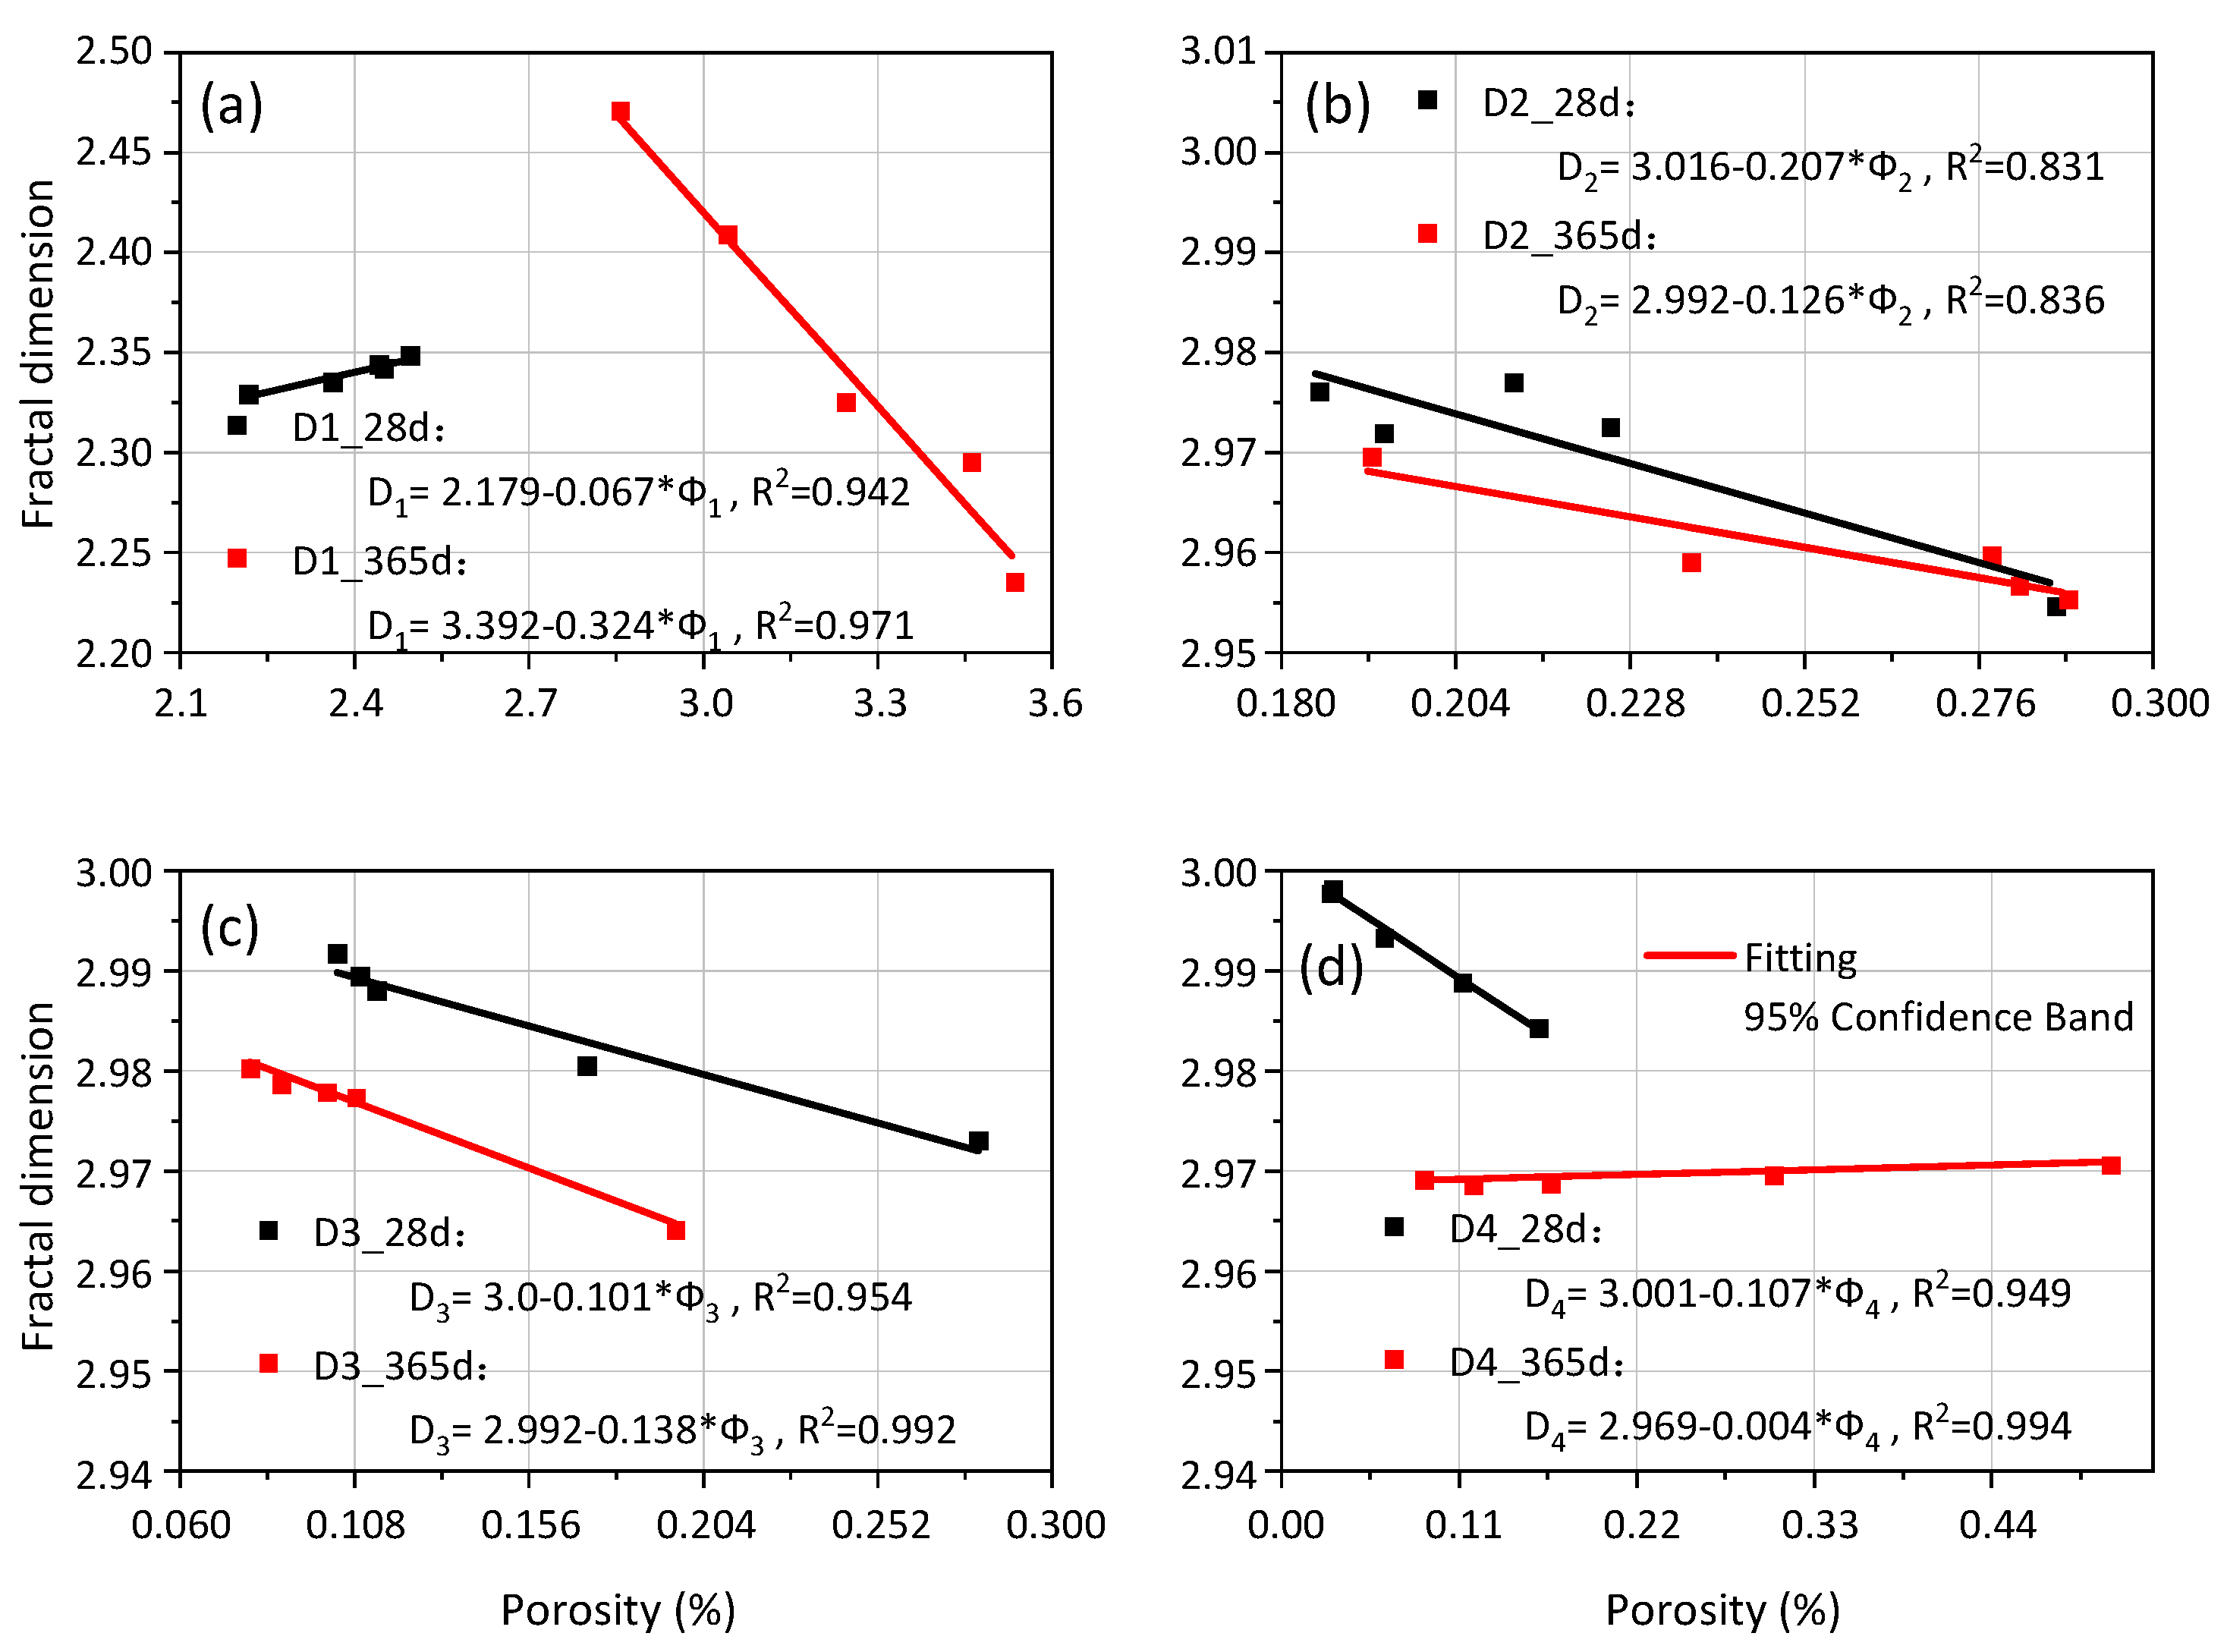
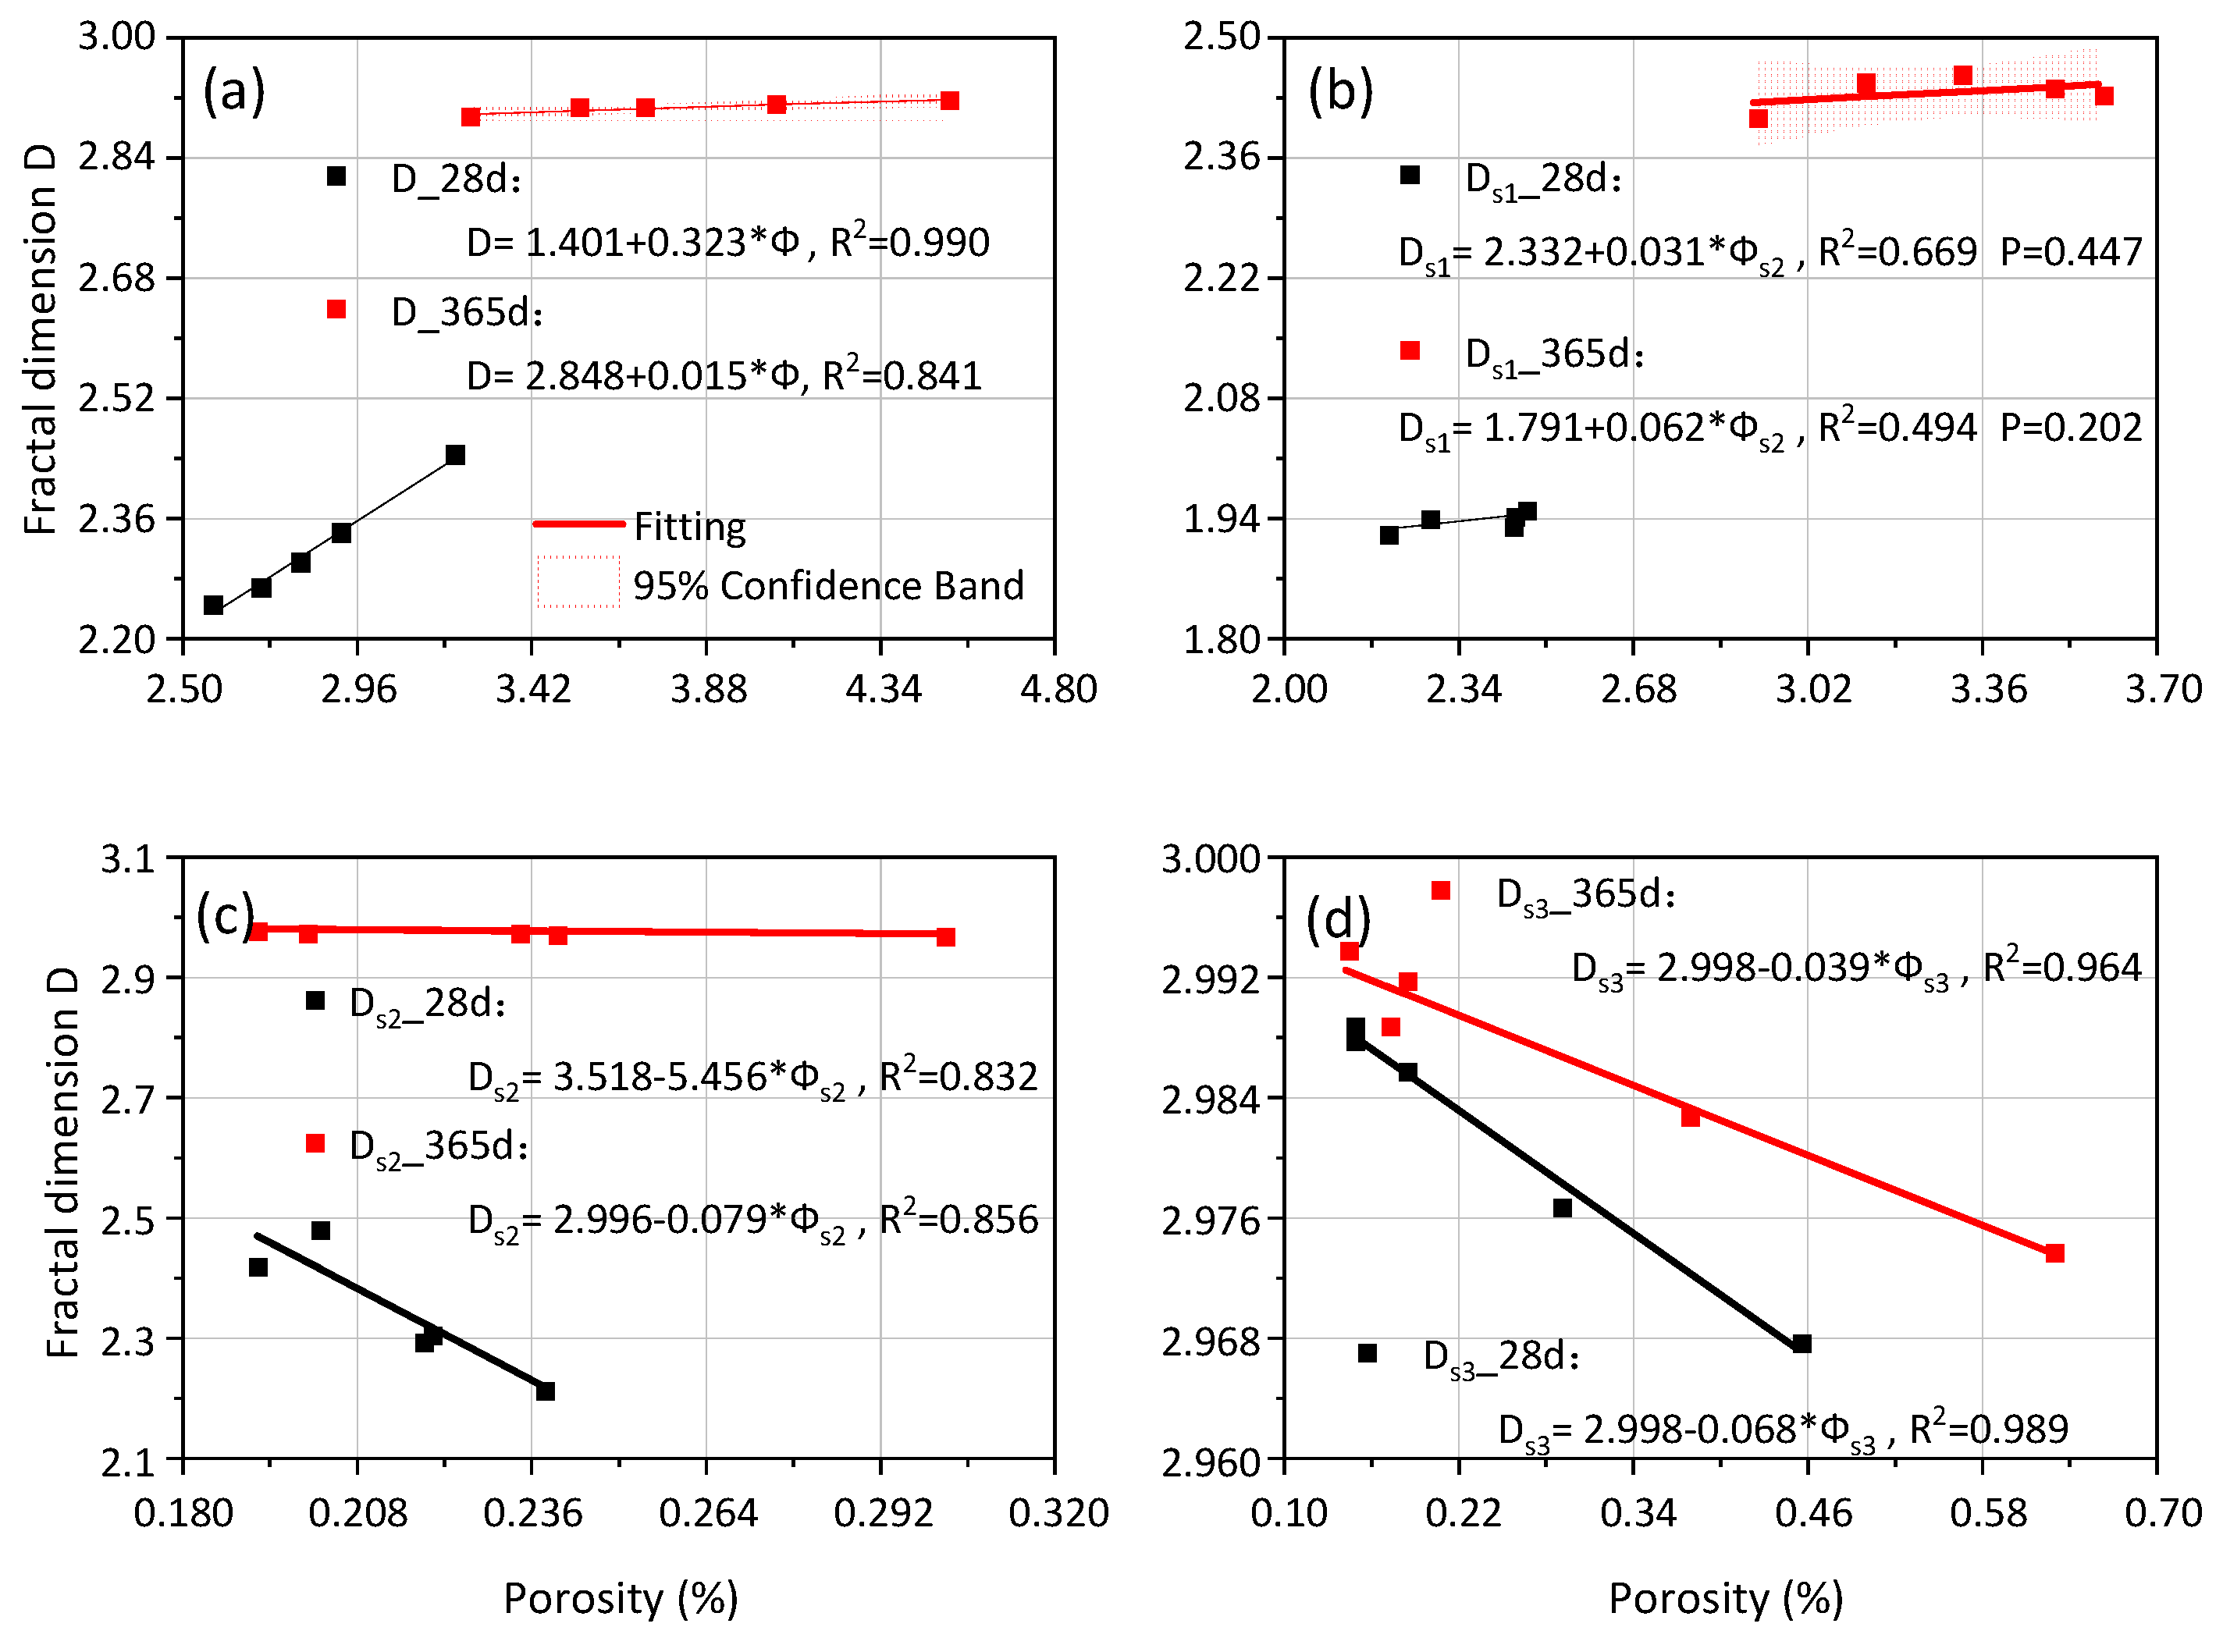
3.4. Fractal Characteristics of Pore Structure

In the NMR-based fractal characterization method [22,26], the fractal dimension is usually calculated according to the pore gradation, but the entire pore range of the cement-based material does not necessarily have fractal characteristics [21]. Pores with each size exhibit a distinct inner surface morphology. Therefore, in this study, three methods, namely, the spectral valley-based pore fractal calculation (F−sv method), the T2c−based pore fractal calculation (F−T2c method) [30], and the pore size-based pore fractal calculation (F−ps method) [23,29], are employed to analyze the fractal characteristics across varying pore gradations (Figure 9).
According to the PSD spectral valley, T2c value, and pore size characteristics, the pore fractal dimensions of five types of single-graded mortars are obtained (see Figure 10 and Figure 11, Table 2). The pore structures of the mortars exhibit favorable fractal characteristics within their respective ranges. The fractal dimension D represents the self-similarity and scale invariance of the pore structure. With D values less than 3 and approaching 3, the pore surfaces demonstrate increased complexity.
The linear relationship between porosity (φ1 to φ4) and the corresponding fractal dimension (D1 to D4) is depicted in Figure 10 according to the F-sv method. Upon saturating the mortar for 365 days, the fractal dimension of each pore gradation generally declines, with the exception of an increase in D1 for the M4 and M5 groups. This observation, in conjunction with Figure 4, highlights the formation of a dense structure resulting from long-term water saturation conditions and cement hydration.
The fractal dimensions D1 and D4 exhibit significant changes; D1 is directly related to the extent of hydration reaction, displaying a higher value when the porosity is greater. After 365 days, the P1 region shifts to the left, reducing the complexity of inner pore surfaces, leading to a decrease in fractal dimension. On the other hand, the P4 region consists of incompletely hydrated material and large pores within the ITZ. During the incomplete hydration at 28 days, the pore size is substantial, and the unhydrated material forms a loosely structured complex inner surface. After 365 days, due to dissolution and leaching of calcium, the complexity of the inner surface remains largely unchanged (indicated by minimal change in the D4 value) but is lower compared with the initial period.
The fractal dimension of the pores in the P2 and P3 zones gradually decreases with the increase in the porosity φ2 and φ3, indicating that the distribution and structural complexity of these pores are slightly reduced. The primary factor contributing to this decrease is the reduction in the most probable pore size. These pores are predominantly transition pores formed during the hydration process [50].
The porosity (φcb, φca, and φm) and corresponding fractal dimensions (Dcb, Dca, and Dm) were determined using the F−T2c method, as presented in Table 2. If D > 3 or D < 2, it is considered non-physical and lacks fractal characteristics from the perspective of surface geometry [51]. The selF−similarity and scale invariance of the mortar pore surface only exist within a specific range. It is evident that CBF pores lack self-similarity; however, after 365 days of water saturation, there is an increase in the fractal dimension, suggesting an enhancement in the self-similarity and scale invariance of CBF pores.
The porosity of CAF pores and MF pores shows a positive correlation with the D at 28d or 365d; φca and φm increase with the increase in SVR. At 365 d of water saturation, the Dca and Dm increased significantly, while φca decreased significantly, which was related to the decrease in T2c1 and the increase in T2c2.
To sum up, after 365 days of water saturation, the internal pores of the mortar experience densification resulting from complete hydration. This process increases the fractal dimension of CBF pores. Conversely, hydration causes a decrease in the porosity of CAF pores and MF pores. Simultaneously, hydraulic dissolution causes calcium precipitation and enlarges the maximum pore size of MF pores, resulting in an increased fractal dimension of both CAF pores and MF pores. The fractal dimension of the pores, obtained through the F−T2c method, is appropriate for evaluating the fractal evolution characteristics of pore connectivity.
According to the F−ps method, Figure 11 illustrates a linear relationship between the fractal dimension and the porosity of total pores and pores at various levels, except for pores less than 0.1 μm. After 365 days of water saturation, the fractal dimension generally increases in each mortar. This can be attributed to the formation of more abundant pores within the mortar under saturated conditions, resulting in a higher density of pore distribution and the formation of interconnected pore structures. Furthermore, it is observed that the change in fractal dimension with SVR remains consistent before and after 365 d of water saturation. Specifically, the fractal dimension of total pores increases as SVR increases, while the fractal dimension of mesopores and macropores exhibits an inverse trend. This indicates that SVR not only influences porosity and PSD but also affects the inner surface of pores. A higher surface area of MSA (larger SVR) leads to a chaotic morphology in aggregate distribution [50], resulting in the formation of more complex micropores and an increase in the inner surface area of the pore.
In summary, the F−ps method differs from the F−sv method and the F−T2c method. The F−ps method employs a fixed pore gradation division approach, whereas the F−sv method and the F−T2c method adopt a variable pore gradation division method, owing to the alteration in spectral peak and T2c value following 365 d of water saturation. These three methods are utilized to analyze changes in the fractal dimension of pore characteristics from various perspectives.

3.5. Pore evolution Characteristics of Synthetic-Graded Mortar

Pore connectivity can be qualitatively evaluated by the magnitude of water displacement in pores by external forces. The T2 spectrum evolution trend of the pore structure in the synthetic-graded mortar is similar to that of the single gradation, and its T2 spectrum components and porosity values are all in the middle of the five groups of single gradation [30]. The most probable pore radius of P1 obtained after centrifugation and drying is significantly reduced but basically unchanged after 365 days. By combining the peaks’ decrease in T2 and the PSD spectrum after centrifugal drying technology, it was found that the pore connectivity in the P1 range is stronger when hydrated for 28 days. However, the pore connectivity in the range from P2 to P4 is stronger when hydrated 365 days. Otherwise, for the synthetic-graded mortar M-syn, the variation trend of the T2c value is the same as that of the single-graded mortar. T2c1 shows a decrease from 0.668 ms to 0.572 ms, while T2c2 decreases from 0.922 ms to 0.756 ms, representing reductions of 14.4% and 18.0%, respectively. The porosity of the synthetic grade increases from 2.957% to 3.646%, representing a 23.0% increase, which is lower than the increase observed in the single-grade mortar as illustrated in Figure 9a.
Figure 12 demonstrates a decrease in the peak value of MF pores in the P4 area after 365 days in water, accompanied by a reduction in the maximum pore size. However, the permeability decreases from 340.8 × 10⁻⁵ mD to 257.6 × 10⁻⁵ mD; synthetic-graded mortar exhibits a decrease in permeability, indicating enhanced impermeability and corrosion resistance. According to Table 3, the change trend in the porosity and fractal dimension of the M-syn group mortar closely aligns with that of the single-graded mortar prior to and after 365 days. The fractal dimension and porosity of the M-syn group mortar fall between the values observed in the M group mortars, close to the value of the M2 group. In comparison with the single-graded M groups, it is evident that the synthetic-graded mortar exhibits superior resistance to hydraulic erosion attributable to its well-structured gradation, resulting in diminished impact on macropores under prolonged water saturation.

4. Discussion

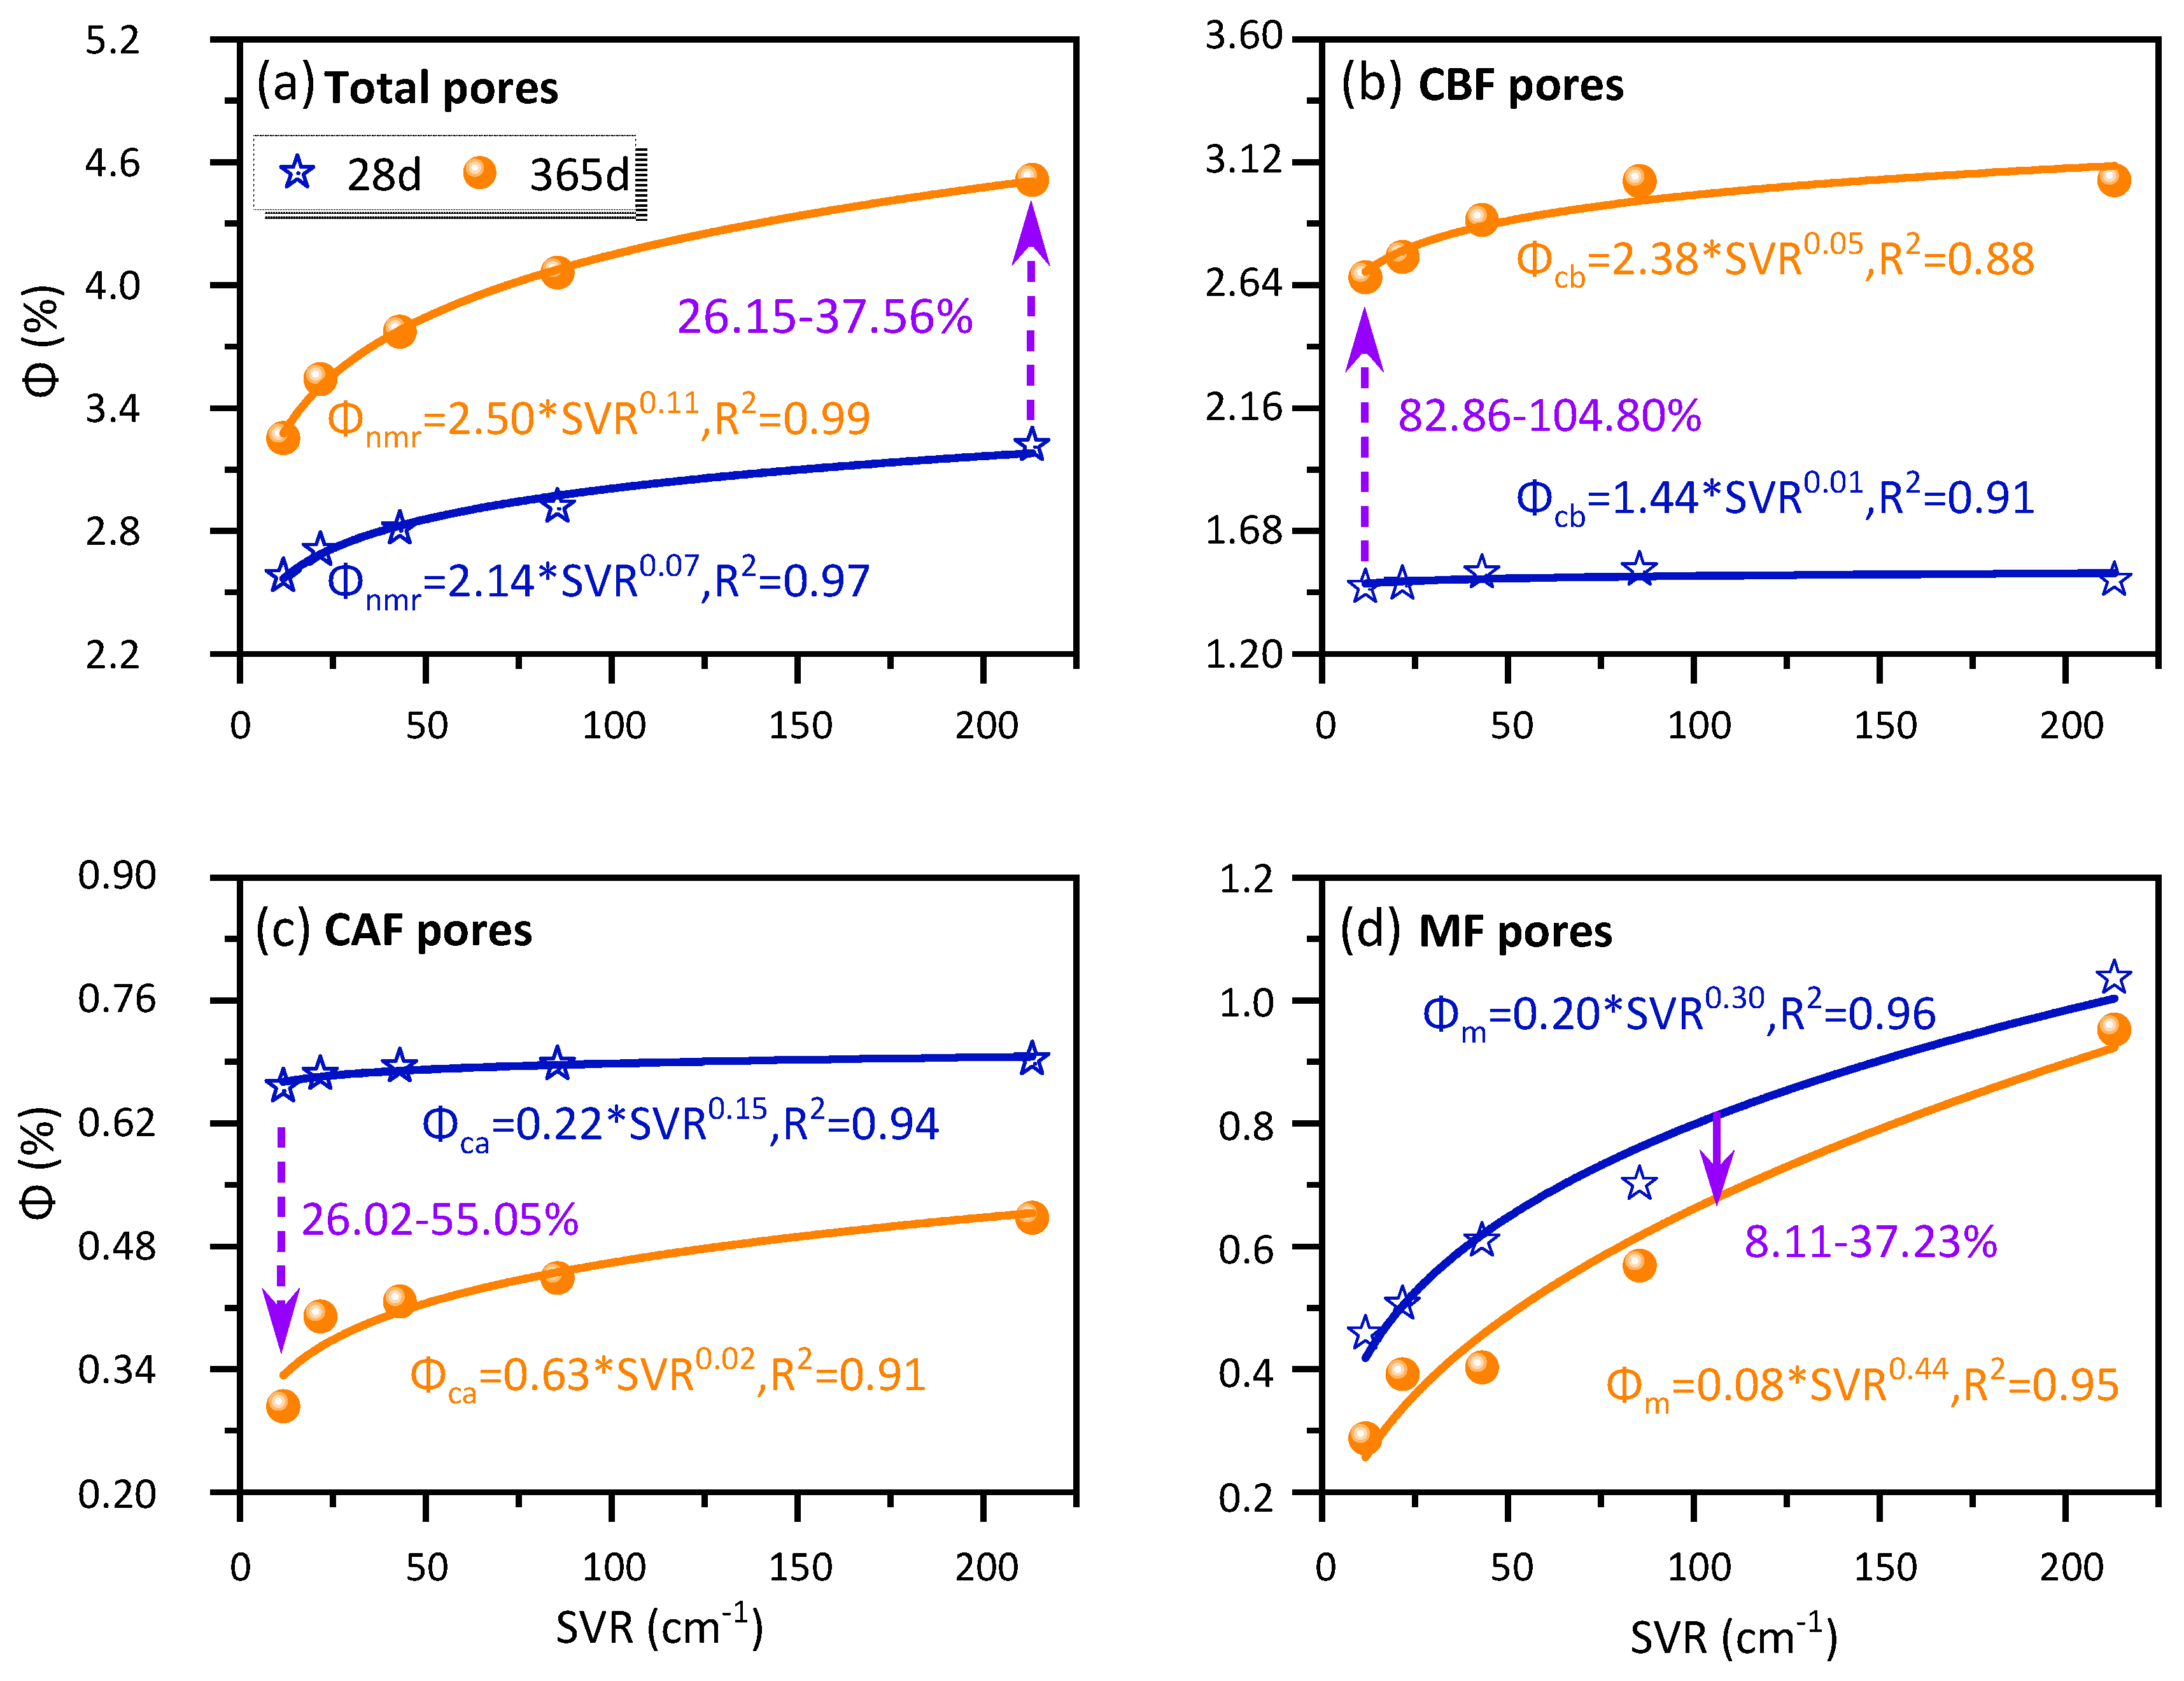
4.1. Porosity Variation Characteristics of Mortar

The aggregate size affects the PSD and pore connectivity in the mortar. The total porosity and the pore φ1 in the P1 zone increase and the variation increases with the positive correlation power function of the aggregate SVR as illustrated in Figure 13a. Similarly, CBF, CAF, and MF pores also have the same change trend as illustrated in Figure 13b. In the PSD distribution of mortar, the pore φ3 in the P3 area has a decreasing trend and the decrease increases with the increase in SVR. It can be seen that the evolution of pores in mortar has been affected by aggregates, and similar studies have been reported [30]. Changes in the porosity of total pores and pores with different gradations result in alterations in the overall pore structure. Consequently, further confirmation is needed regarding the relationship between the change in pore fractal dimension and porosity.

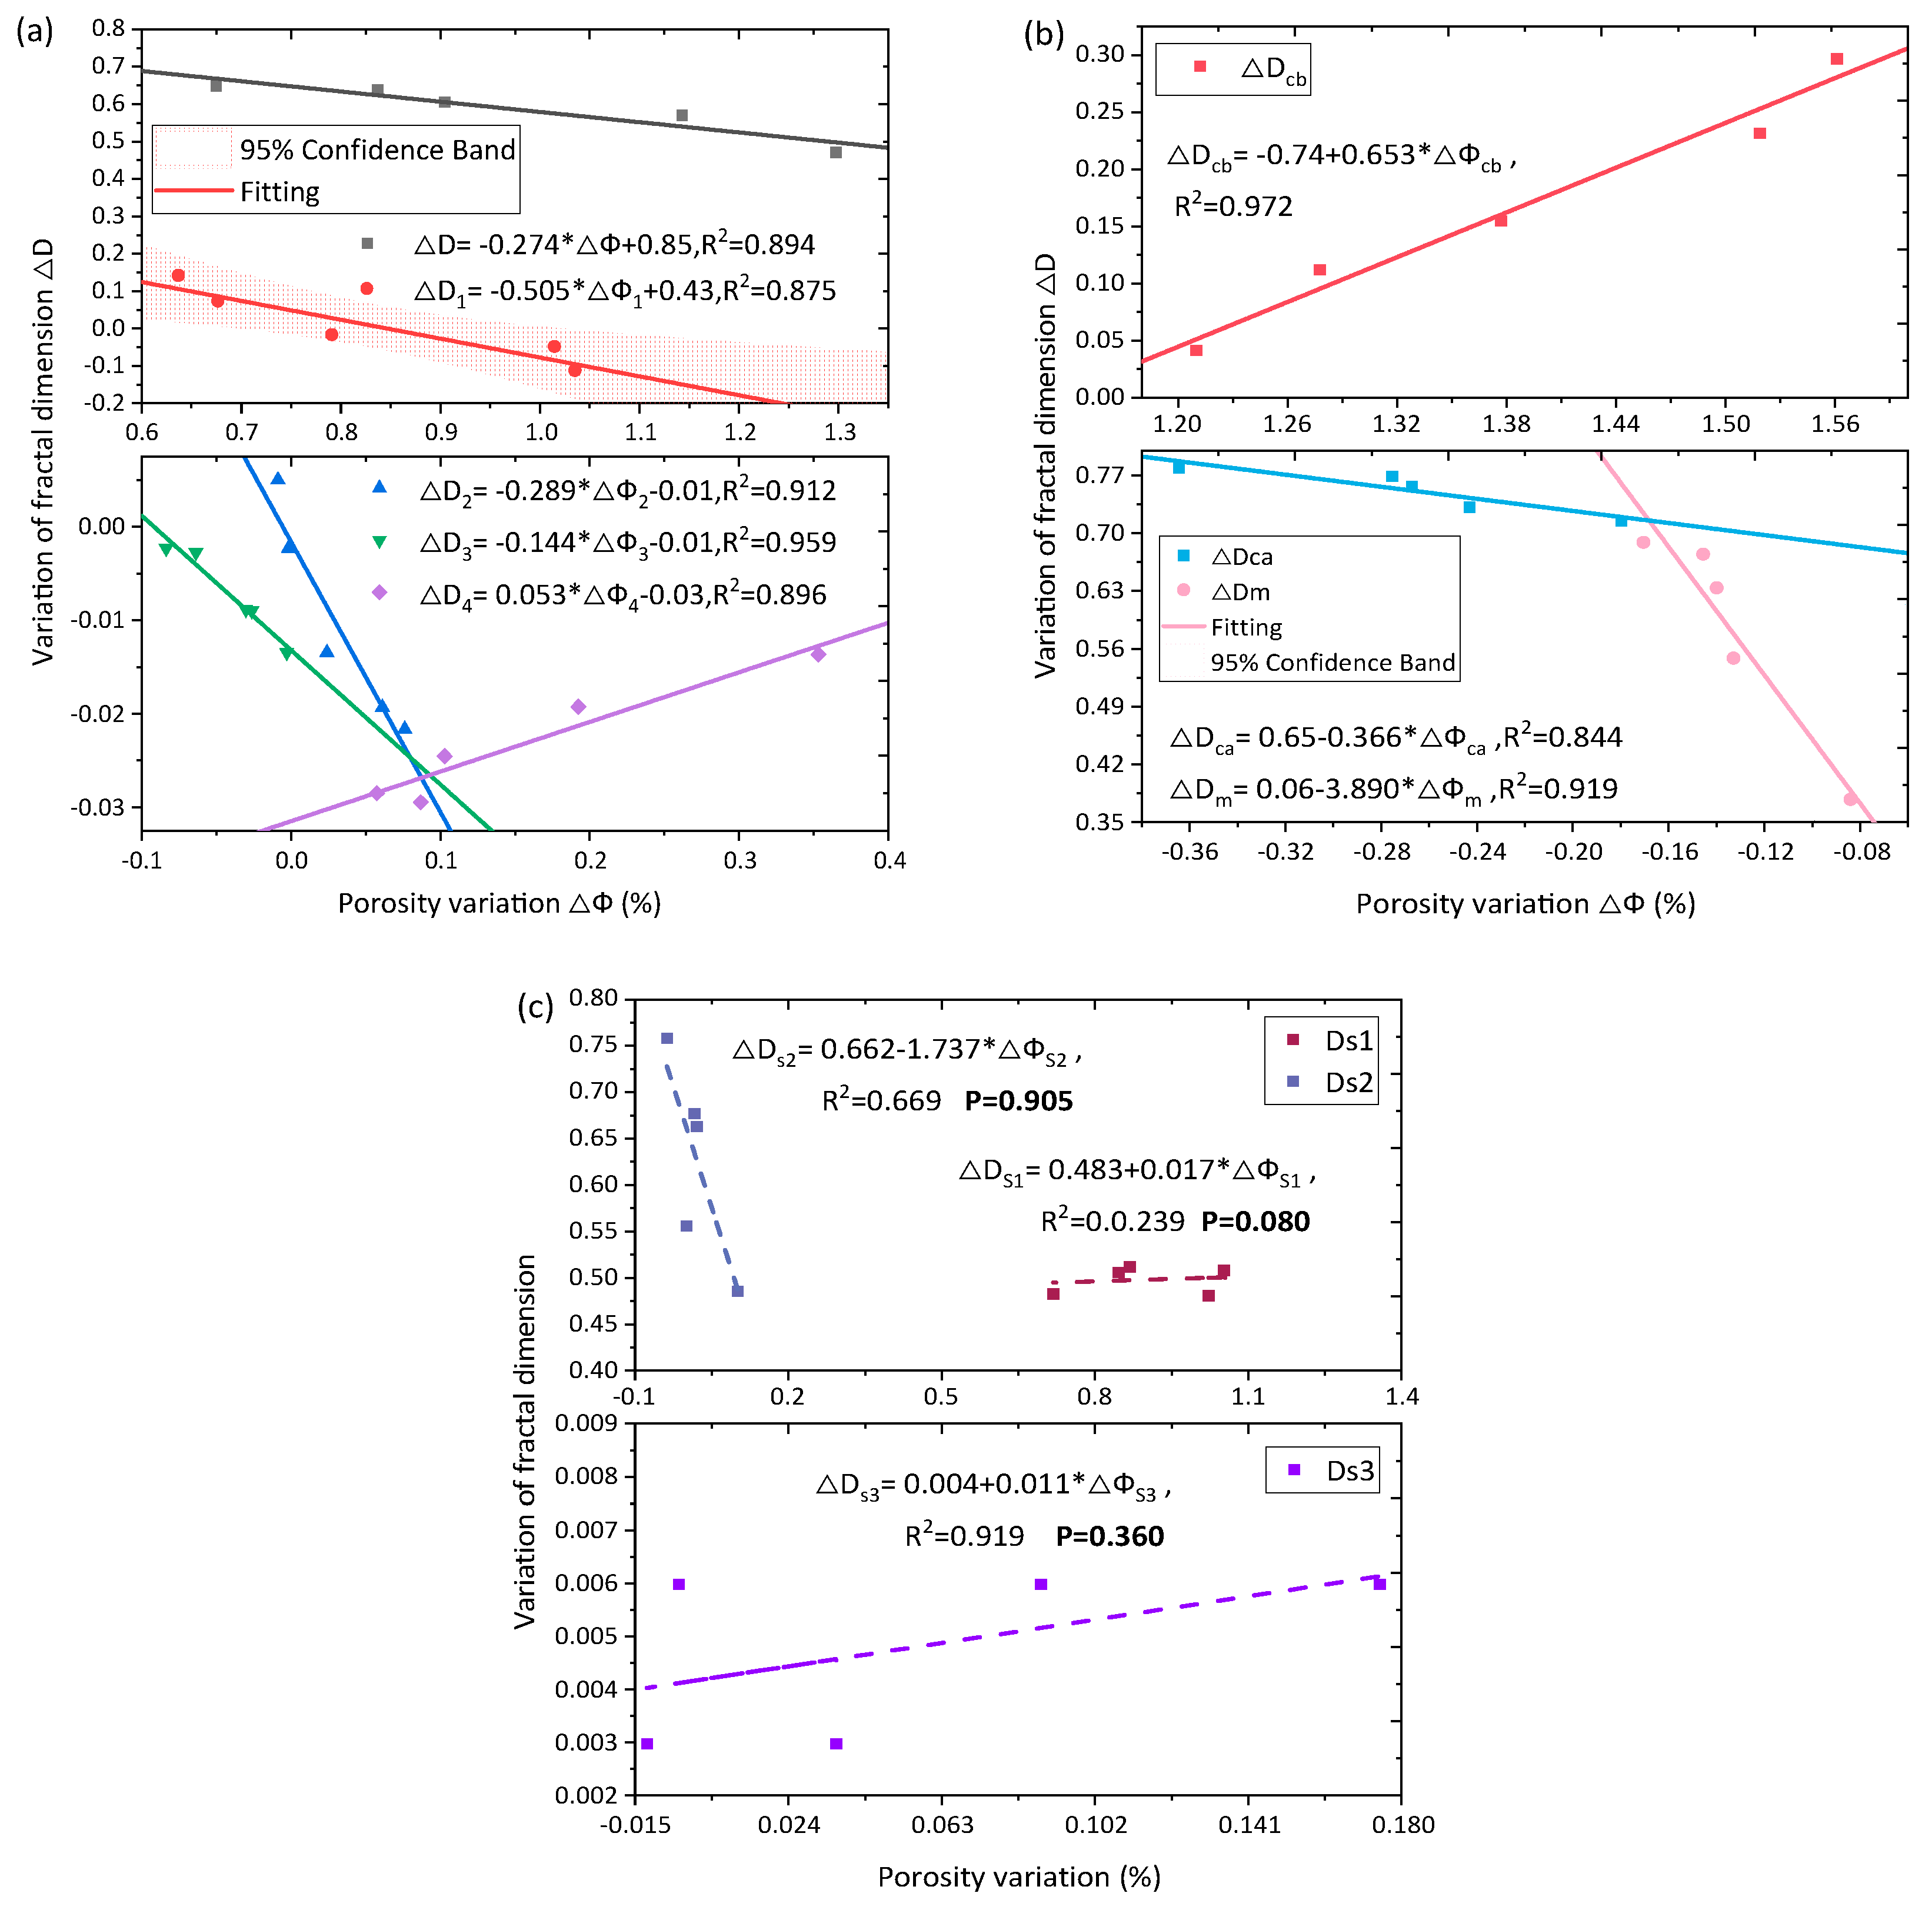
4.2. Fractal Correlation Model of Pore Evolution

A correlation model was constructed to examine the fractal variable amplitude characteristics of pores with different gradations, specifically analyzing the relationship between porosity variable amplitude and fractal dimension variable amplitude. Figure 14 depicts the models of fractal dimension variable value for pores with different gradations under the F−ps, F−sv, and F−T2c methods. The linear relationship between the variable amplitude of fractal dimension and the variable amplitude of porosity can be observed in the F−sv and F−T2c methods, as depicted in Figure 14a,b.
There is no evident correlation between the variable amplitude of fractal dimension and variable amplitude porosity under the F−ps method, as indicated in Figure 14c. At a significance level of 0.05, P>0.05, the slope is not significantly different from zero, and the correlation coefficient (R2) is less than 0.6. The variable quantities of porosity and fractal dimension are deemed to lack a linear relationship.
Under the F−sv and F−T2c methods, which are classification methods based on pore size range, a correlation model between porosity and fractal dimension can be constructed, and a correlation model between the variable amplitude of porosity and the variable amplitude of the fractal dimension can also be constructed. However, the F−ps method only allows obtaining the correlation between porosity and fractal dimension.
The fractal dimension increases with the increasing aggregate SVR, and the fractal dimension decreases with the decreasing SVR, indicated that the inner surface of larger pores is more complex than that of smaller pores [27]. Moreover, the aggregate gradation influences the complexity of the pore structure [23,25]. From the perspective of fractal geometry, aggregates with larger SVR result in increased structural complexity and irregularity.

5. Conclusions

This study employed the LF−NMR relaxation method to analyze both single gradation and synthetic gradation specimens. Additionally, we explored the influence of long-term water saturation on the pore structure. Furthermore, we analyzed the fractal characteristics of pore structure during the hydration process for different gradations of mortar. An established correlation model between pore structure parameters and aggregate SVR is presented, leading to the following conclusions:
  • MSA has a fresh rock surface, which greatly reduces the number of pores in the mortar, especially the number of large pores. MSA mortar exhibits excellent compactness and small porosity.
  • The particle size of MSA significantly affects the pore structure distribution in mortar. The SVR of the aggregate shows a positive power-exponential relationship with mortar porosity, and a strong correlation exists between varying gradations of pores and SVR.
  • Long-term water saturation causes an increase in mortar porosity, primarily manifested by the growth of micropores, indicating further hydration reactions. Additionally, dissolution leads to an upward trend in both the maximum size and porosity of macropores.
  • The permeability of single-graded mortar increases proportionally with SVR, and the permeability increases after 365 days of water saturation. However, synthetic-graded mortar exhibits a decrease in permeability, indicating enhanced impermeability and corrosion resistance.
  • Mortar pores exhibit favorable fractal characteristics. Pore gradation in fractal analysis is determined using the F−sv method, F−T2c method, and F−ps method. All three methods establish a correlation model between porosity and fractal dimension, representing classification based on a variable pore size range, enabling the construction of a correlation model between porosity variable amplitude and fractal dimension variable amplitude.

Author Contributions

Conceptualization, Z.J. and G.T.; Methodology, Z.J. and Y.L.; Software, Z.J.; Validation, H.H. and G.T.; Formal analysis, Z.J.; Investigation, G.T., W.G. and Y.L.; Data curation, G.T.; Writing—original draft, Z.J.; Writing—review & editing, H.H.; Visualization, W.G., Y.L. and Z.P.; Supervision, H.H., G.T. and Z.P.; Funding acquisition, H.H. All authors have read and agreed to the published version of the manuscript.

Funding

This research was funded by the National Natural Science Foundation of China (No. 52008098), the Natural Science Foundation of Jiangsu Province (BK20200405), and the Graduate Research and Innovation Projects of Jiangsu Province (KYCX21_0124).

Data Availability Statement

Data are contained within the article.

Conflicts of Interest

The authors declare no conflict of interest.

References

  1. Liu, F.; Zhang, T.; Luo, T.; Zhou, M.; Zhang, K.; Ma, W. Study on the Deterioration of Concrete under Dry–Wet Cycle and Sulfate Attack. Materials 2020, 13, 4095. [Google Scholar] [CrossRef] [PubMed]
  2. Wang, F.Z.; Yang, J.; Hu, S.G.; Zhang, Y.H.; Liu, Y.P. Research on the Fatigue Behavior of Cement Asphalt Mortar Exposed to Water. Adv. Mater. Res. 2013, 687, 274–281. [Google Scholar] [CrossRef]
  3. Xu, W.; Han, Z.; Tao, L.; Ding, Q.; Ma, H. Random non-convex particle model for the fraction of interfacial transition zones (ITZs) in fully-graded concrete. Powder Technol. 2018, 323, 301–309. [Google Scholar] [CrossRef]
  4. Ke, X.; Hou, H.; Zhou, M.; Wang, Y.; Zhou, X. Effect of particle gradation on properties of fresh and hardened cemented paste backfill. Constr. Build. Mater. 2015, 96, 378–382. [Google Scholar] [CrossRef]
  5. Li, T.; Nogueira, R.; de Brito, J.; Liu, J. Quantitative analysis of the influence of fine aggregate’s grading on mortar’s rheology. J. Mater. Res. Technol. 2023, 25, 310–318. [Google Scholar] [CrossRef]
  6. Wu, J.; Feng, M.; Ni, X.; Mao, X.; Chen, Z.; Han, G. Aggregate gradation effects on dilatancy behavior and acoustic characteristic of cemented rockfill. Ultrasonics 2019, 92, 79–92. [Google Scholar] [CrossRef]
  7. Liu, Q.; Shen, X.; Wei, L.; Dong, R.; Xue, H. Grey Model Research Based on the Pore Structure Fractal and Strength of NMR Aeolian Sand Lightweight Aggregate Concrete. JOM 2020, 72, 536–543. [Google Scholar] [CrossRef]
  8. Yang, C.C.; Su, J.K. Approximate migration coefficient of interfacial transition zone and the effect of aggregate content on the migration coefficient of mortar. Cem. Concr. Res. 2002, 32, 1559–1565. [Google Scholar] [CrossRef]
  9. Lin, J.; Zhao, Q.; Chen, H.; Li, M.; Yuan, L. A numerical framework for the ITZ percolation, effective fraction and diffusivity of concrete systems considering the nonuniform ITZ. J. Build. Eng. 2023, 77, 107429. [Google Scholar] [CrossRef]
  10. Wu, J.; Feng, M.; Han, G.; Ni, X.; Chen, Z. Experimental Investigation on Mechanical Properties of Cemented Paste Backfill under Different Gradations of Aggregate Particles and Types and Contents of Cementing Materials. Adv. Mater. Sci. Eng. 2019, 2019, 9456861. [Google Scholar] [CrossRef]
  11. Huang, W.; Wang, Q.; Ma, Y.; Lai, M.; Ho, J.C.M. Mortar film thickness on the autogenous shrinkage of concrete: Test and simulation. J. Build. Eng. 2023, 66, 105833. [Google Scholar] [CrossRef]
  12. Feng, M.; Wu, J.; Ma, D.; Ni, X.; Yu, B.; Chen, Z. Experimental investigation on the seepage property of saturated broken red sandstone of continuous gradation. Bull. Eng. Geol. Environ. 2018, 77, 1167–1178. [Google Scholar] [CrossRef]
  13. Gao, Y.; De Schutter, G.; Ye, G. Micro- and meso-scale pore structure in mortar in relation to aggregate content. Cem. Concr. Res. 2013, 52, 149–160. [Google Scholar] [CrossRef]
  14. He, H.; Senetakis, K.; Coop, M.R. Stiffness of a recycled composite aggregate. Soil Dyn. Earthq. Eng. 2018, 110, 185–194. [Google Scholar] [CrossRef]
  15. He, H.; Senetakis, K. A study of wave velocities and poisson ratio of recycled concrete aggregate. Soils Found. 2016, 56, 593–607. [Google Scholar] [CrossRef]
  16. Zhang, Z.; Geng, O.; Ma, Z.; Ji, Y.; Xu, Z.; Gao, F.; Zhang, J. Study on the deterioration mechanism of alkali dissolution of concrete mixed with Na2SO4 in external water sources. Constr. Build. Mater. 2022, 356, 129283. [Google Scholar] [CrossRef]
  17. Ren, F.; Zhou, C.; Li, L.; Cui, H.; Chen, X. Modeling the dependence of capillary sorptivity on initial water content for cement-based materials in view of water sensitivity. Cem. Concr. Res. 2023, 168, 107158. [Google Scholar] [CrossRef]
  18. Muller, A.C.A.; Scrivener, K.L.; Gajewicz, A.M.; McDonald, P.J. Densification of C–S–H Measured by1 H NMR Relaxometry. J. Phys. Chem. C 2013, 117, 403–412. [Google Scholar] [CrossRef]
  19. Ning, L.; Zhao, Y.; Bi, J.; Wang, C.; Shen, M.; Li, Y. Effect of aggregate size on water distribution and pore fractal characteristics during hydration of cement mortar based on low-field NMR technology. Constr. Build. Mater. 2023, 389, 131670. [Google Scholar] [CrossRef]
  20. Sakai, Y. Relationship between water permeability and pore structure of cementitious materials. Mag. Concr. Res. 2020, 72, 1235–1242. [Google Scholar] [CrossRef]
  21. Yan, J.; Zhang, S.; Wang, J.; Hu, Q.; Wang, M.; Chao, J. Applying Fractal Theory to Characterize the Pore Structure of Lacustrine Shale from the Zhanhua Depression in Bohai Bay Basin, Eastern China. Energy Fuels 2018, 32, 7539–7556. [Google Scholar] [CrossRef]
  22. Yuan, Y.; Rezaee, R. Fractal analysis of the pore structure for clay bound water and potential gas storage in shales based on NMR and N2 gas adsorption. J. Pet. Sci. Eng. 2019, 177, 756–765. [Google Scholar] [CrossRef]
  23. Zhao, F.; Hu, J.; Yang, Y.; Xiao, H.; Ma, F. Cross-Scale Study on Lime Modified Phosphogypsum Cemented Backfill by Fractal Theory. Minerals 2022, 12, 403. [Google Scholar] [CrossRef]
  24. Deng, H.; Tian, G.; Yu, S.; Jiang, Z.; Zhong, Z.; Zhang, Y. Research on Strength Prediction Model of Sand-like Material Based on Nuclear Magnetic Resonance and Fractal Theory. Appl. Sci. 2020, 10, 6601. [Google Scholar] [CrossRef]
  25. Hu, J.; Zhao, F.; Kuang, Y.; Yang, D.; Zheng, M.; Zhao, L. Microscopic characteristics of the action of an air entraining agent on cemented paste backfill pores. Alex. Eng. J. 2020, 59, 1583–1593. [Google Scholar] [CrossRef]
  26. Wang, F.; Yang, K.; Cai, J. Fractal characterization of tight oil reservoir pore structure using nuclear magnetic resonance and mercury intrusion porosimetry. Fractals 2018, 26, 1840017. [Google Scholar] [CrossRef]
  27. Fu, J.; Wang, K.; Wang, J. Internal pore evolution and early hydration characterization of fly ash cement backfill. J. Build. Eng. 2023, 72, 106716. [Google Scholar] [CrossRef]
  28. Liu, Y.; Deng, H. Study on permeability performance of cemented tailings backfill based on fractal characteristics of pore structure. Constr. Build. Mater. 2023, 365, 130035. [Google Scholar] [CrossRef]
  29. Tian, G.; Deng, H.; Xiao, Y. Correlation Analysis between Microscopic Pore Parameters and Macroscopic Mechanical Properties of Rock-like Materials from the Perspective of Water-Cement Ratio and Sand-Cement Ratio. Materials 2022, 15, 2632. [Google Scholar] [CrossRef]
  30. Jiang, Z.; Cai, G.; Tian, G.; Liu, X. Effect of aggregate particle size on mortar pore structure. Constr. Build. Mater. 2022, 352, 128988. [Google Scholar] [CrossRef]
  31. Holthausen, R.S.; Raupach, M. Monitoring the internal swelling in cementitious mortars with single-sided 1H nuclear magnetic resonance. Cem. Concr. Res. 2018, 111, 138–146. [Google Scholar] [CrossRef]
  32. Korb, J.P.; Monteilhet, L.; McDonald, P.J.; Mitchell, J. Microstructure and texture of hydrated cement-based materials: A proton field cycling relaxometry approach. Cem. Concr. Res. 2007, 37, 295–302. [Google Scholar] [CrossRef]
  33. Fischer, N.; Haerdtl, R.; McDonald, P.J. Observation of the redistribution of nanoscale water filled porosity in cement based materials during wetting. Cem. Concr. Res. 2015, 68, 148–155. [Google Scholar] [CrossRef]
  34. Dalas, F.; Korb, J.; Pourchet, S.; Nonat, A.; Rinaldi, D.; Mosquet, M. Surface Relaxivity of Cement Hydrates. J. Phys. Chem. C 2014, 118, 8387–8396. [Google Scholar] [CrossRef]
  35. Liu, Y.; Yao, Y.; Liu, D.; Zheng, S.; Sun, G.; Chang, Y. Shale pore size classification: An NMR fluid typing method. Mar. Pet. Geol. 2018, 96, 591–601. [Google Scholar] [CrossRef]
  36. Zhao, Y.; Zhu, G.; Dong, Y.; Danesh, N.N.; Chen, Z.; Zhang, T. Comparison of low-field NMR and microfocus X-ray computed tomography in fractal characterization of pores in artificial cores. Fuel 2017, 210, 217–226. [Google Scholar] [CrossRef]
  37. Yang, X.; Li, L.; Dai, H.; Jia, M. Effect of fractal dimension in concrete meso-structure on its axial mechanical behavior: A numerical case study. Fractals 2021, 29, 2140011. [Google Scholar] [CrossRef]
  38. Zang, Q.; Liu, C.; Awan, R.S.; Yang, X.; Li, G.; Wu, Y.; Lu, Z.; Feng, D. Occurrence characteristics of the movable fluid in heterogeneous sandstone reservoir based on fractal analysis of NMR data: A case study of the Chang 7 Member of Ansai Block, Ordos Basin, China. J. Pet. Sci. Eng. 2022, 214, 110499. [Google Scholar] [CrossRef]
  39. Yue, J.; Sheng, J.; Wang, H.; Hu, Y.; Zhang, K.; Luo, Y.; Zhou, Q.; Zhan, M. Investigation on Pore Structure and Permeability of Concrete–Rock Interfacial Transition Zones Based on Fractal Theory. Fractal Fract. 2022, 6, 329. [Google Scholar] [CrossRef]
  40. Xiao, L.; Li, J.; Mao, Z.; Lu, J.; Yu, H.; Guo, H.; Li, G. A method to determine nuclear magnetic resonance (NMR) T2cutoff based on normal distribution simulation in tight sandstone reservoirs. Fuel 2018, 225, 472–482. [Google Scholar] [CrossRef]
  41. Valckenborg, R.; Pel, L.; Hazrati, K.; Kopinga, K.; Marchand, J. Pore water distribution in mortar during drying as determined by NMR. Mater. Struct. 2001, 34, 599–604. [Google Scholar] [CrossRef]
  42. Ramyar, K.; Topal, A.; Andiç, Ö. Effects of aggregate size and angularity on alkali–silica reaction. Cem. Concr. Res. 2005, 35, 2165–2169. [Google Scholar] [CrossRef]
  43. Li, L.; Wang, Y.; An, M.; Yu, P.; Hou, X. The Influence of Rehydration on the Properties of Portland Cement-Based Materials with Low Water/Binder Ratios: A Review of Existing Research. Materials 2023, 16, 970. [Google Scholar] [CrossRef] [PubMed]
  44. Zhang, W.; Zhang, M.; Hou, D. Nanoscale insights into the anti-erosion performance of concrete: A molecular dynamics study. Appl. Surf. Sci. 2022, 593, 153403. [Google Scholar] [CrossRef]
  45. Yang, X.; Feng, Y.; Rong, H.; Liang, J.; Zhang, G.; Huang, Y. The leaching-deterioration properties and leaching mechanism of cement mortar under dry-wet cycles. Constr. Build. Mater. 2023, 400, 132672. [Google Scholar] [CrossRef]
  46. Bao, H.; Xu, G.; Yu, M.; Wang, Q.; Li, R.; Saafi, M.; Ye, J. Evolution of ITZ and its effect on the carbonation depth of concrete under supercritical CO2 condition. Cem. Concr. Comp. 2022, 126, 104336. [Google Scholar] [CrossRef]
  47. Wang, L.; Luo, R.; Zhang, W.; Jin, M.; Tang, S. Effects of fineness and content of phosphorus slag on cement hydration, permeability, pore structure and fractal dimension of concrete. Fractals 2021, 29, 2140004. [Google Scholar] [CrossRef]
  48. Korb, J.P. NMR and nuclear spin relaxation of cement and concrete materials. Curr. Opin. Colloid Interface Sci. 2009, 14, 192–202. [Google Scholar] [CrossRef]
  49. Li, J.; Guo, Y.; Zhang, T.; Gao, P.; Wu, J.; Ren, Q.; Wei, J.; Yu, Q. Clarifying the effects of volume proportion and surface area of aggregate on chloride diffusivity of concrete through microstructural design. Cem. Concr. Compos. 2023, 143, 105248. [Google Scholar] [CrossRef]
  50. Gao, Y.; Gu, Y.; Mu, S.; Jiang, J.; Liu, J. The multifractal property of heterogeneous microstructure in cement paste. Fractals 2021, 29, 2140006. [Google Scholar] [CrossRef]
  51. Zhang, B.Q.; Li, S.F. Determination of the surface fractal dimension for porous-media by mercury porosimetry. Ind. Eng. Chem. Res. 1995, 34, 1383–1386. [Google Scholar] [CrossRef]
Figure 1. Experimental instrument and flow chart.
Fractalfract 08 00042 g001
Figure 2. (a). Aggregate particle size and SVR distribution; (b). Schematic diagram of aggregate size affecting mortar structure.
Fractalfract 08 00042 g002
Figure 3. Pore division based on: (a). spectral valleys, (b). T2c.
Fractalfract 08 00042 g003
Figure 4. Effect of water saturation environment on T2 spectrum distribution of mortar: (a). M1; (b). M2; (c). M3; (d). M4; (e). M5 group; (f). The explanation for subfigures.
Fractalfract 08 00042 g004
Figure 5. Porosity component evolution divided by spectral valleys.
Fractalfract 08 00042 g005
Figure 6. T2c value of single-graded mortar: (a). T2c1; (b). T2c2.
Fractalfract 08 00042 g006
Figure 7. Effect of aggregate SVR on various pores: (a). Total pores; (b). CBF pores; (c). CAF pores; (d). MF pores.
Fractalfract 08 00042 g007
Figure 8. Permeability of single-graded mortar: (a). hydration 28d; (b). hydration 365d.
Fractalfract 08 00042 g008
Figure 9. The fractal dimension based on (a). F−sv method; (b). F−T2c method; (c). F−ps method.
Fractalfract 08 00042 g009
Figure 10. The correlation analysis between porosity and fractal dimension under F−sv method for (a). D1; (b). D2; (c). D3; (d). D4.
Fractalfract 08 00042 g010
Figure 11. The correlation between porosity and fractal dimension under F−ps method for (a). D; (b). Ds1; (c). Ds2; (d). Ds3.
Fractalfract 08 00042 g011
Figure 12. T2 spectrum (PSD spectrum) of synthetic-graded mortar M-syn: (a). hydration 28d; (b). hydration 365d.
Fractalfract 08 00042 g012
Figure 13. The aggregate SVR affects the variation in porosity for (a). F−sv method; (b). F−T2c method.
Fractalfract 08 00042 g013
Figure 14. Correlation model of porosity variation and fractal dimension variation for (a). F−sv method; (b). F−T2c method; (c). F−ps method.
Fractalfract 08 00042 g014
Table 1. Physical parameters of cement mortar.
Gradation of AggregatesAggregate Size/mmSVR
/cm−1
No.Solid Density ρ28d/kg·m−3Solid Density ρ365d/kg·m−3Density Loss ∆ρ/kg·m−3Φ28d/%Φ365d/%
Synthetic gradation
M-syn
0.1–7.075.02M-syn-11395.331421.784.493.123.82
M-syn-21407.871404.413.462.943.42
M-syn-31389.711382.397.322.843.7
M-syn-Ave1397.641402.865.092.963.64
Single gradation
M groups
0.1–0.5213.03M1-11423.031412.3510.693.024.56
M1-21396.311382.6213.693.124.46
M1-31383.241361.0112.063.524.52
M1-Ave1400.861385.3312.153.224.52
0.5–1.085.41M2-11415.081403.6511.432.644.12
M2-21396.161386.539.633.103.84
M2-31406.211389.761.073.004.22
M2-Ave1405.821393.327.382.924.06
1.0–2.043.12M3-11446.551436.619.932.463.64
M3-21412.851406.985.872.883.66
M3-31383.40 1383.65 −1.253.083.84
M3-Ave1414.27 1409.08 4.85 2.823.72
2.0–4.021.68M4-11433.21 1423.19 10.02 2.583.58
M4-21426.27 1421.71 4.56 2.823.54
M4-31407.31 1407.34 −0.032.723.50
M4-Ave1422.26 1417.42 4.85 2.73.54
4.0–7.011.77M5-11401.65 1400.82 0.83 2.643.22
M5-21417.75 1409.93 7.83 2.643.22
M5-31427.52 1422.25 5.28 2.563.40
M5-Ave1415.64 1411.00 4.64 2.623.28
Table 2. The porosity and fractal dimension are divided under the F−T2c method.
No.Hydration TimeCBF PoresCAF PoresMF Pores
ΦcbDcbΦcaDcaΦmDm
M-syn28 d2.1201.4970.4322.7240.4082.976
365 d2.9101.9070.4202.9860.3162.988
M128 d1.4881.4900.6922.2501.0362.590
365 d3.0481.7870.5122.9660.9522.967
M228 d1.5281.6030.6882.2290.7022.432
365 d3.0461.8340.4442.9620.5682.981
M328 d1.5181.6290.6842.1880.6082.351
365 d2.8941.7840.4182.9450.4042.985
M428 d1.4741.6700.6762.1760.5062.309
365 d2.7501.7820.4002.9460.3922.984
M528 d1.4601.7230.6622.1690.4582.297
365 d2.6701.7650.2982.9490.2882.986
Table 3. Porosity and fractal dimension of M-syn group.
Fractal MethodType28 d365 d
ΦDΦD
F−sv methodTotal2.9572.8863.6462.898
Φ1-D12.5742.6173.2902.333
Φ2-D20.2142.9800.1742.972
Φ3-D30.1142.9890.0682.985
Φ4-D40.0582.9950.1142.994
F−ps methodΦs1-Ds12.5582.2643.3282.473
Φs2-Ds20.2182.9560.1532.986
Φs3-Ds30.1812.9870.1652.993
Disclaimer/Publisher’s Note: The statements, opinions and data contained in all publications are solely those of the individual author(s) and contributor(s) and not of MDPI and/or the editor(s). MDPI and/or the editor(s) disclaim responsibility for any injury to people or property resulting from any ideas, methods, instructions or products referred to in the content.

