1. Introduction
The production of construction waste is substantial, and its disposal poses significant challenges [
1,
2,
3]. In response, scholars have attempted to address this issue by crushing and screening construction waste to produce recycled aggregates (RAs) for the preparation of recycled aggregate concrete (RAC) [
4,
5]. To accurately assess the impact of different RA replacement rates and aggregate sizes on crack propagation behavior, and to precisely measure their effects on the compressive and flexural properties of RAC, various methods for testing the strain of cementitious materials have been employed, including radiography, extensometers, resistance strain gauges, and strain gauges [
6,
7,
8]. These testing methods can characterize both local and global deformations in concrete, yet their precision is influenced by the scope of the test. Furthermore, reflecting the deformation of concrete at the mesoscale using these methods is difficult, due to the highly heterogeneous and elastoplastic nature of concrete. Local deformations in concrete are influenced by numerous factors, and the size of the instruments used to measure strain is limited by the dimensions of the structure being tested, preventing the acquisition of deformation at the mesoscale with fine resolution and sensitivity.
Significant strides in digital imaging systems and computer technology have transformed Digital Image Correlation (DIC) technology into a powerful and practical tool for assessing cracks and deformations in concrete components across a wide range of sizes in recent decades [
9]. Thanks to these advancements, DIC has emerged as a reliable and versatile method, enabling researchers to gain a comprehensive understanding of various parameters related to concrete mechanics. Consequently, there has been a surge in the utilization of this technology by the research community. Researchers are now leveraging DIC to meticulously measure crack size, propagation rate, and propagation morphology, offering detailed insights into the fracture behavior of concrete [
10,
11]. Furthermore, DIC enables the precise determination of full-field displacement and strain within concrete structures, providing a wealth of data on the deformation patterns and stress distributions under various loading conditions. This comprehensive dataset allows for a deeper analysis of the mechanical properties and failure mechanisms of concrete, ultimately contributing to the development of more resilient and durable construction materials.
At the macroscopic level, concrete is a composite material composed of aggregates and a cement matrix. The Interface Transition Zone (ITZ) between the matrix and aggregates, along with the pore structure, is a crucial component that affects the mechanical properties of concrete. Stress first arises in a transition zone of a portion of the aggregates and propagates along this zone [
12], subsequently transferring to the transition zones of surrounding aggregates within the mortar. Vertical cracks caused by environmental influences (compression and drying shrinkage) damage concrete structures. When the aggregate content is low and the spacing between aggregates is large, crack propagation under compression can damage the concrete structure [
13]. The mortar surrounding coarse aggregates undergoes shrinkage under external forces. Due to the minimal deformation of aggregates, shear stress parallel to the aggregate surface is imparted to the mortar, leading to the formation of cracks in the mortar.
Fractal dimension theory, a sophisticated mathematical framework, offers an innovative way to quantify the complexity and irregularity of geometric shapes, transcending traditional Euclidean geometry. Fractal dimension theory, a cornerstone within the advanced domain of fractal geometry, offers a profound methodology for quantifying the intricate complexity and irregularity of shapes and patterns in nature. Originating from the late 19th and early 20th centuries through the pioneering contributions of mathematicians such as Weierstrass, Cantor, Peano, Koch, and Sierpinski, this theory has evolved through the work of Hausdorff, Bouligand, Pontryagin, and Besicovitch, leading to the introduction of fractional dimensions that transcend traditional integer-based geometric concepts. The Hausdorff dimension, in particular, measures the size of a set by analyzing how its measure changes with scale, while the box-counting dimension, a more pragmatic approach, estimates fractal dimension by counting the number of small boxes required to cover the fractal object at a specified scale. Other dimensions, including modified box-counting dimensions, packing dimensions, and filling dimensions, provide alternative metrics for assessing fractal complexity. Fractal dimension theory finds extensive application across mathematics, geography, biology, and engineering, where it is utilized to study irregular shapes of coastlines, complex biological structures, and crack propagation in materials [
14,
15,
16]. Calculating fractal dimension necessitates sophisticated mathematical techniques and computational algorithms, often involving iterative methods, numerical simulations, and statistical analyses. By embracing fractional dimensions, fractal dimension theory expands our comprehension of natural phenomena beyond the confines of traditional integer dimensions, revealing a richer tapestry of geometric and topological intricacies across a wide range of interdisciplinary fields, including engineering.
This theory is particularly relevant in fields where natural and engineered systems exhibit intricate and non-linear patterns, such as in the study of concrete cracks. In the realm of concrete crack research, fractal dimension theory has emerged as a potent tool for describing and analyzing the complex morphologies of cracks. The interplay between fractal geometry and crack propagation can be elucidated through a series of sophisticated concepts that underscore the pivotal role of fractal dimensions in elucidating and anticipating crack dynamics within materials.
Initially, the intricate and non-uniform patterns of cracks frequently exhibit fractal attributes. Fractal geometry furnishes a robust analytical framework for quantifying and dissecting these irregular shapes and patterns. Metrics such as the box-counting dimension and the Hausdorff dimension offer precise numerical indices of the complexity and ruggedness of crack surfaces. By harnessing these fractal dimensions, researchers can acquire profound insights into the fractal nature of cracks, which are indispensable for comprehending their growth mechanisms and potential failure modalities within materials. Moreover, fractal geometry can be employed to simulate crack propagation processes. Fractal-based models can replicate the branching and self-similarity characteristics of cracks, capturing their elaborate patterns and growth trajectories over time. These models can integrate various influencing factors, including material properties, stress distributions, and environmental impacts, to forecast crack growth and ultimate failure [
17,
18]. The utilization of fractal models can enhance the precision and reliability of crack propagation predictions, thereby facilitating superior design methodologies and safety assessments of engineered structures [
19,
20,
21,
22,
23].
Additionally, fractal dimensions can serve as indicators of damage severity and fatigue life in materials. By measuring the fractal dimension of crack surfaces, researchers can quantify the degree of roughness and irregularity, which can serve as a proxy for material degradation and impending failure. This information is indispensable for monitoring the structural integrity and performance of engineered systems, enabling timely maintenance and repair interventions to mitigate catastrophic failures. Fractal geometry thereby offers a potent analytical tool for dissecting and modeling crack propagation in materials. By leveraging fractal dimensions and models, researchers can gain profound insights into crack behavior, predict failure mechanisms, and enhance the design integrity and safety of engineered structures [
24,
25,
26]. The fractal perspective provides a novel and invaluable lens through which to view and comprehend the complex and often unpredictable nature of crack propagation.
Concrete cracks often exhibit fractal-like characteristics, with rough and irregular surfaces that defy simple geometric descriptions. By applying fractal dimension theory, researchers can objectively measure the roughness and complexity of these crack surfaces, capturing fine details that might be overlooked with traditional methods [
27,
28]. This analytical approach provides valuable insights into the crack initiation, propagation, and overall failure mechanisms of concrete structures. By understanding the fractal properties of cracks, researchers can gain a deeper understanding of how cracks form and evolve within concrete, and how they impact the mechanical properties and durability of the material. This, in turn, enables the development of advanced materials and methodologies for mitigating crack formation and propagation, thereby enhancing the safety and longevity of concrete infrastructures. Moreover, fractal dimension theory allows for the comparison and categorization of different crack patterns, facilitating a more systematic and rigorous approach to crack analysis. This can lead to the identification of common crack morphologies and their underlying causes, enabling researchers to develop more targeted and effective strategies for crack prevention and repair. Fractal dimension theory thereby represents a significant advancement in the field of concrete crack research, offering a powerful tool for analyzing and mitigating the complex and often unpredictable behaviors of cracks in concrete structures [
29,
30,
31,
32].
The innovation of this research lies in the recognition that the meso-structure serves as a “bridge” connecting the microstructure and macrostructure. The evolution of cracks at the mesoscale is an external manifestation of microstructure degradation and the fundamental cause of macro performance deterioration. This study quantitatively characterizes the crack opening displacement, crack length, and the evolution of the strain field at the crack tip based on the crack propagation morphology changes in RAC captured by DIC under static loading. It also explores the key factors influencing crack propagation behavior in RAC within the fracture process zone. Additionally, fractal dimension theory is employed to investigate the crack propagation behavior and damage mechanisms of RAC. By analyzing the fractal dimension of cracks, this research provides deeper insights into the complexity and irregularity of crack patterns in RAC, further enhancing the understanding of its mechanical properties and durability.
3. Results and Discussion
3.1. Influence of Aggregate Volume Fraction on Crack Propagation Behavior in Recycled Concrete
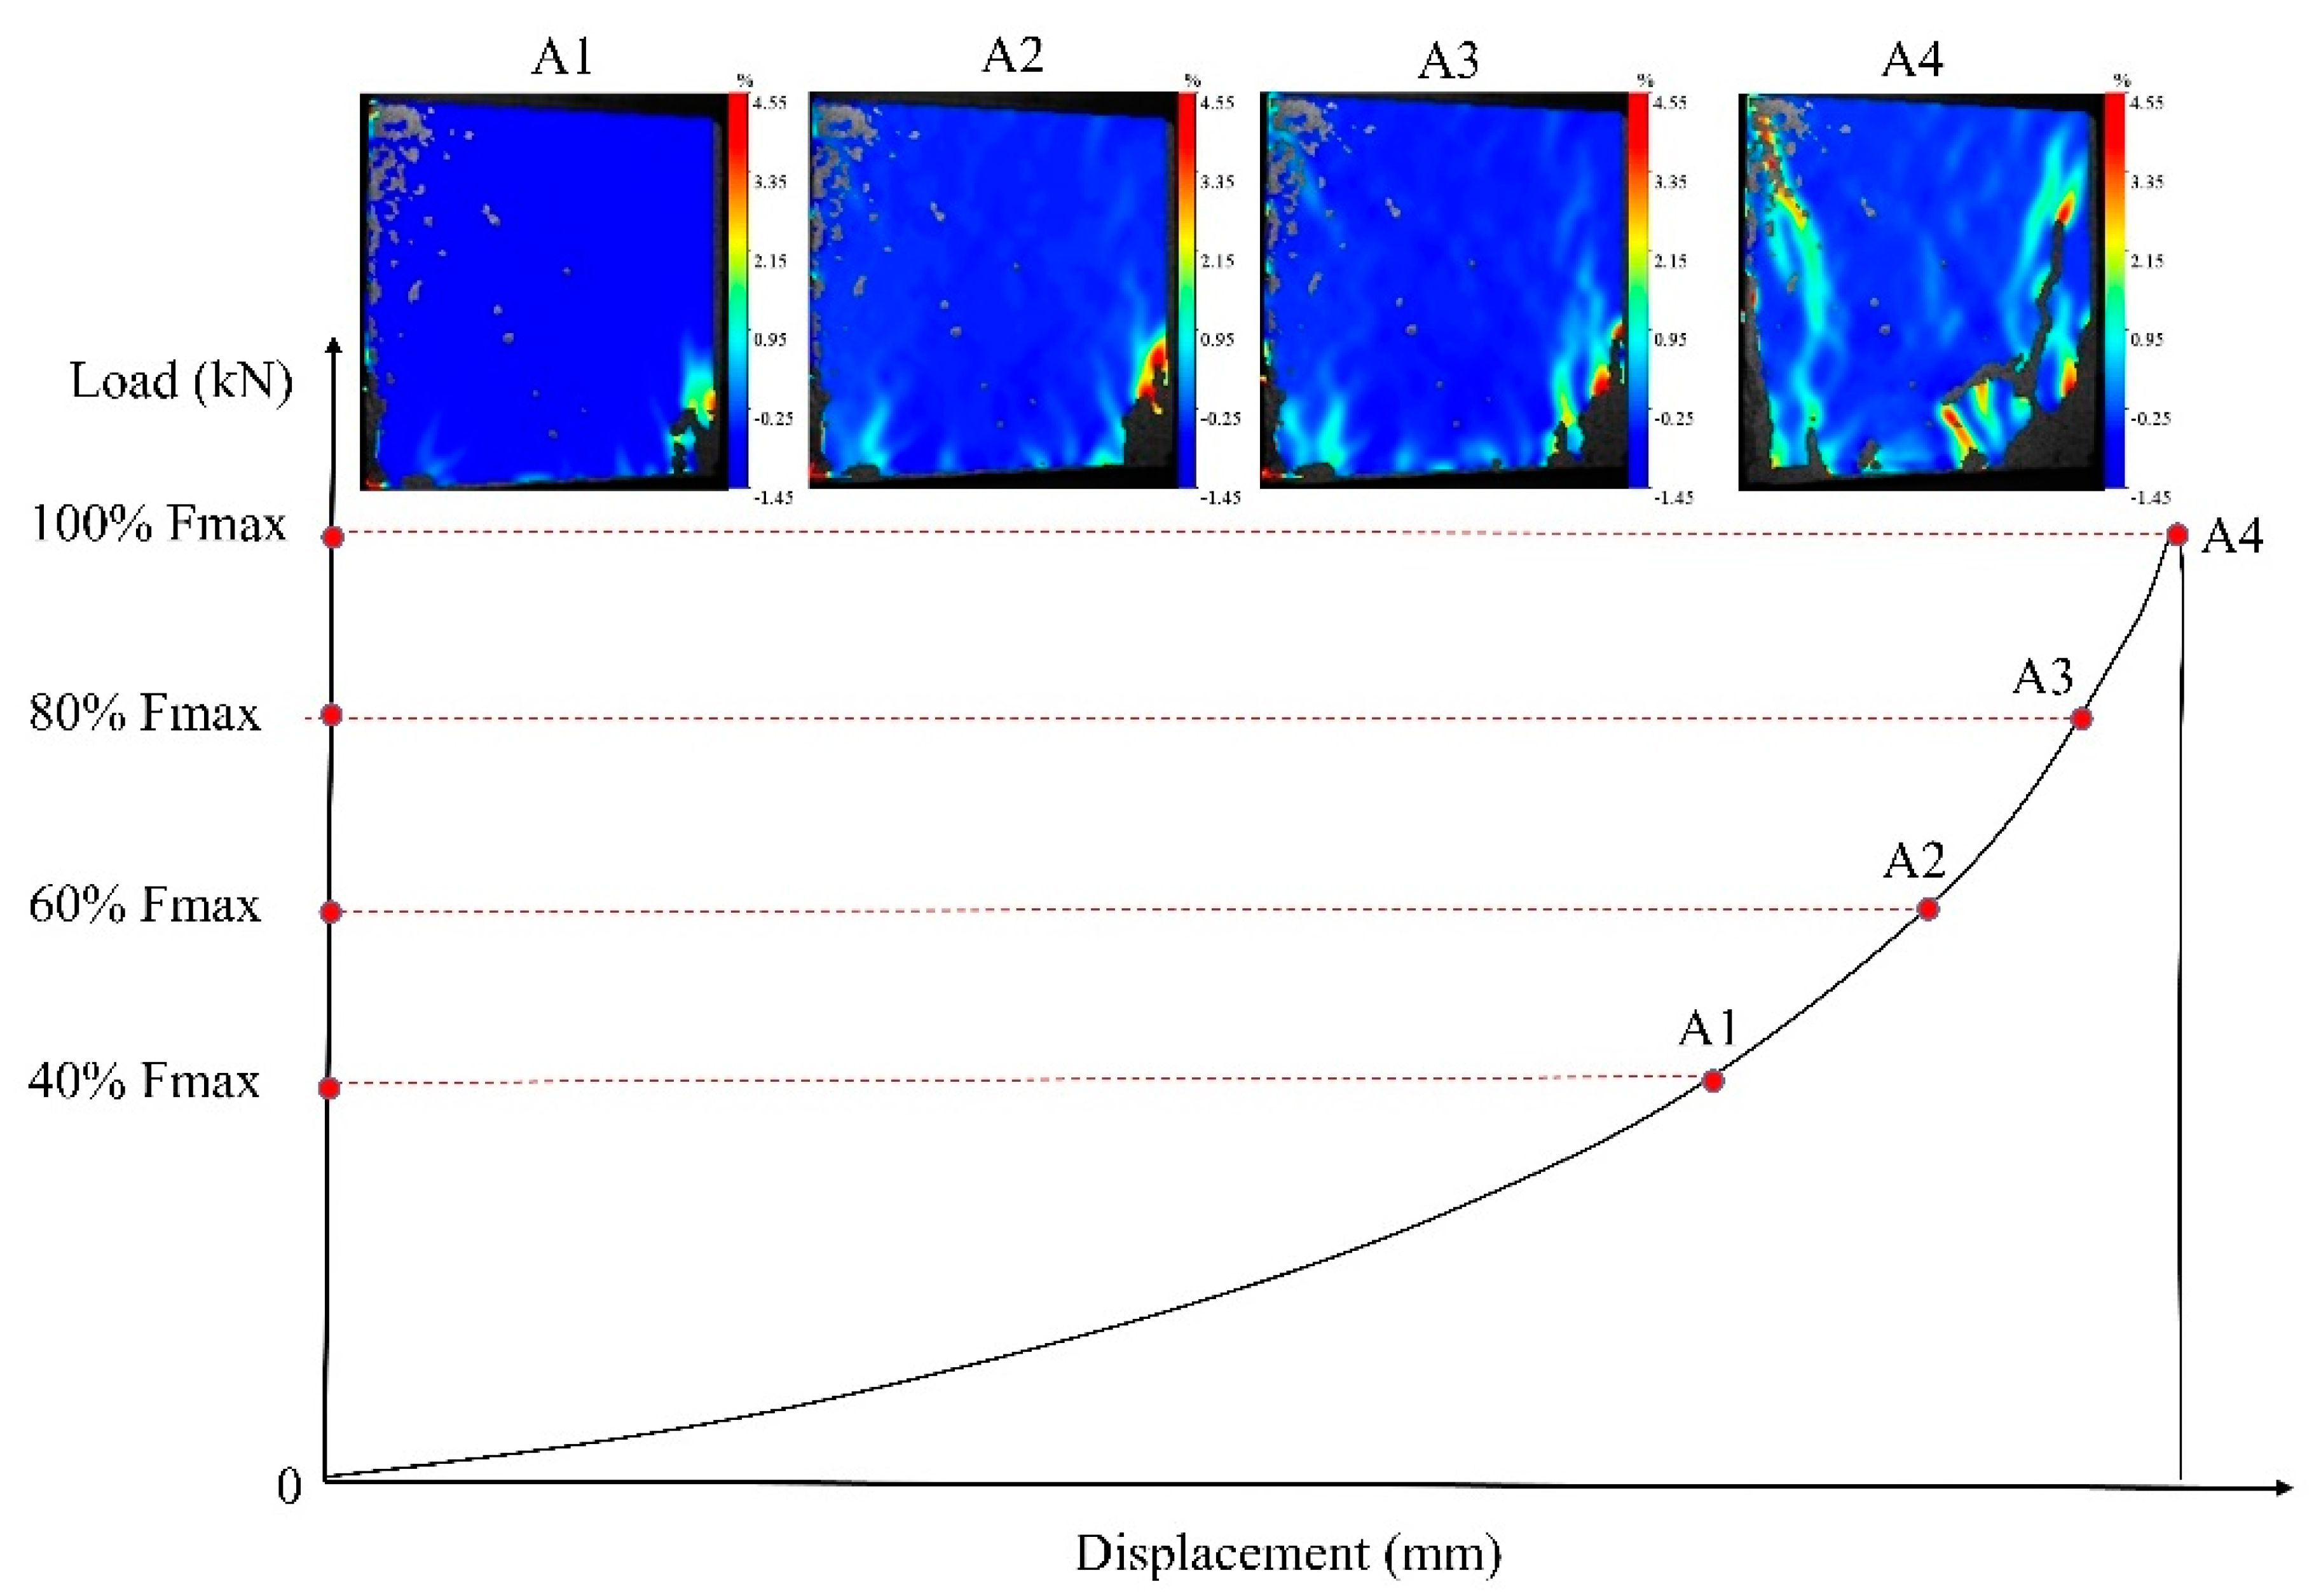
Figure 4 presents the load–displacement curves of recycled concrete under axial compressive loading conditions. Throughout the entire stage from initial loading to failure, Digital Image Correlation (DIC) technology was employed to capture the variations in full-field displacement on the surface of the specimens. To accurately characterize the evolution of crack propagation behavior using DIC technology, four distinct loading stages were selected as the focus of this analysis. As illustrated in the figure, Fmax represents the ultimate bearing capacity of the specimens, while letters A1 to A4 denote four loading points, corresponding to 40%, 60%, 80%, and 100% of the peak load in the pre-peak interval, respectively. For a comparative analysis of strain field variations, a unified color scale (blue, cyan, orange, red) was adopted: cyan and blue hues signify low-strain regions (−1.45% to 2.15%); orange and red hues indicate high-strain areas (2.15% to 4.5%). Furthermore, blank regions in the strain maps represent strain values exceeding the range defined by the color scale. Additionally, factors such as painting errors or excessively bright ambient lighting may impair DIC’s ability to identify certain areas.
Figure 5 illustrates the evolution of crack propagation in recycled concrete with varying volumes of recycled aggregate during loading. At 40% of the maximum load (Fmax), when the volume fraction of recycled aggregate is less than 20%, only minor areas on the specimen surface exhibit a matrix–aggregate slip. However, as the volume fraction of recycled aggregate exceeds 30%, the probability of slip between the aggregate and matrix increases. Even at the initial loading stage, the strain distribution within the specimen is uneven. This is primarily attributed to the heterogeneity of concrete materials, including differences in mechanical properties—particularly stiffness and hardness—between recycled aggregates, the matrix, and the interfacial transition zone (ITZ) [
12], as well as the geometrical asymmetry of these components.
As the external load increases from 60% to 80% of Fmax, the color intensity in susceptible deformation regions deepens, indicating an increase in principal strain values. This signifies higher strains within the ITZ and the occurrence of stress concentration, particularly evident in specimens with recycled aggregate sizes of 5–10 mm and volume fractions of 10%, 20%, and 50%. In the first principal strain field, strain concentration primarily occurs on the sides of aggregates, suggesting that the fracture behavior of concrete is closely related to the composition, strength, and spatial distribution of its internal phases. This phenomenon arises due to significant stiffness differences between aggregates and the matrix, leading to the generation of high tensile and shear stresses at the interface. An increase in the volume fraction of recycled aggregate reduces the spacing between aggregates and increases the likelihood of their mutual contact, thereby enhancing the area of weak zones within the concrete. Compared to specimens with a 30% volume fraction of recycled aggregate, those with 5–10 mm aggregate sizes and volume fractions of 40%, 50%, and 100% are more prone to stress concentration under lower stress conditions. Conversely, specimens with lower volume fractions of recycled aggregate (≤20%) exhibit smaller areas of stress concentration due to their reduced weak zones.
Upon reaching the peak load (100% of Fmax), macroscopic cracks interconnect to form a cohesive failure surface. The regions traversed by these cracks correspond to the stress concentration zones observed during the small stress stage. As the load increases, these stress concentration zones expand and extend into the mortar and adjacent interfacial transition zones. When the volume fraction of recycled aggregate is low, crack propagation paths are unable to extend into distant interfacial transition zones and instead develop within nearby mortar phases, resulting in simpler crack morphologies. As the volume fraction of recycled aggregate increases from 10% to 30%, crack propagation paths become more tortuous. However, when the volume fraction (the volume of recycled aggregate as a proportion of natural aggregate) increases to 40%, 50%, and 100%, the complexity of cracks decreases. The number and area of cracks represent the energy released during concrete failure. Combined with an analysis of compressive strength, it is concluded that the mechanical properties of recycled concrete are determined by the bonding strength between aggregates and the matrix. An increase in the volume fraction of recycled aggregate not only increases the bonding area between old and new mortar, leading to an increase in porosity, but ultimately results in a decrease in the strength of recycled aggregate concrete (RAC). Additionally, the microcracks resulting from the crushing process of recycled aggregate also lead to an elevated porosity, which adversely impacts its strength.
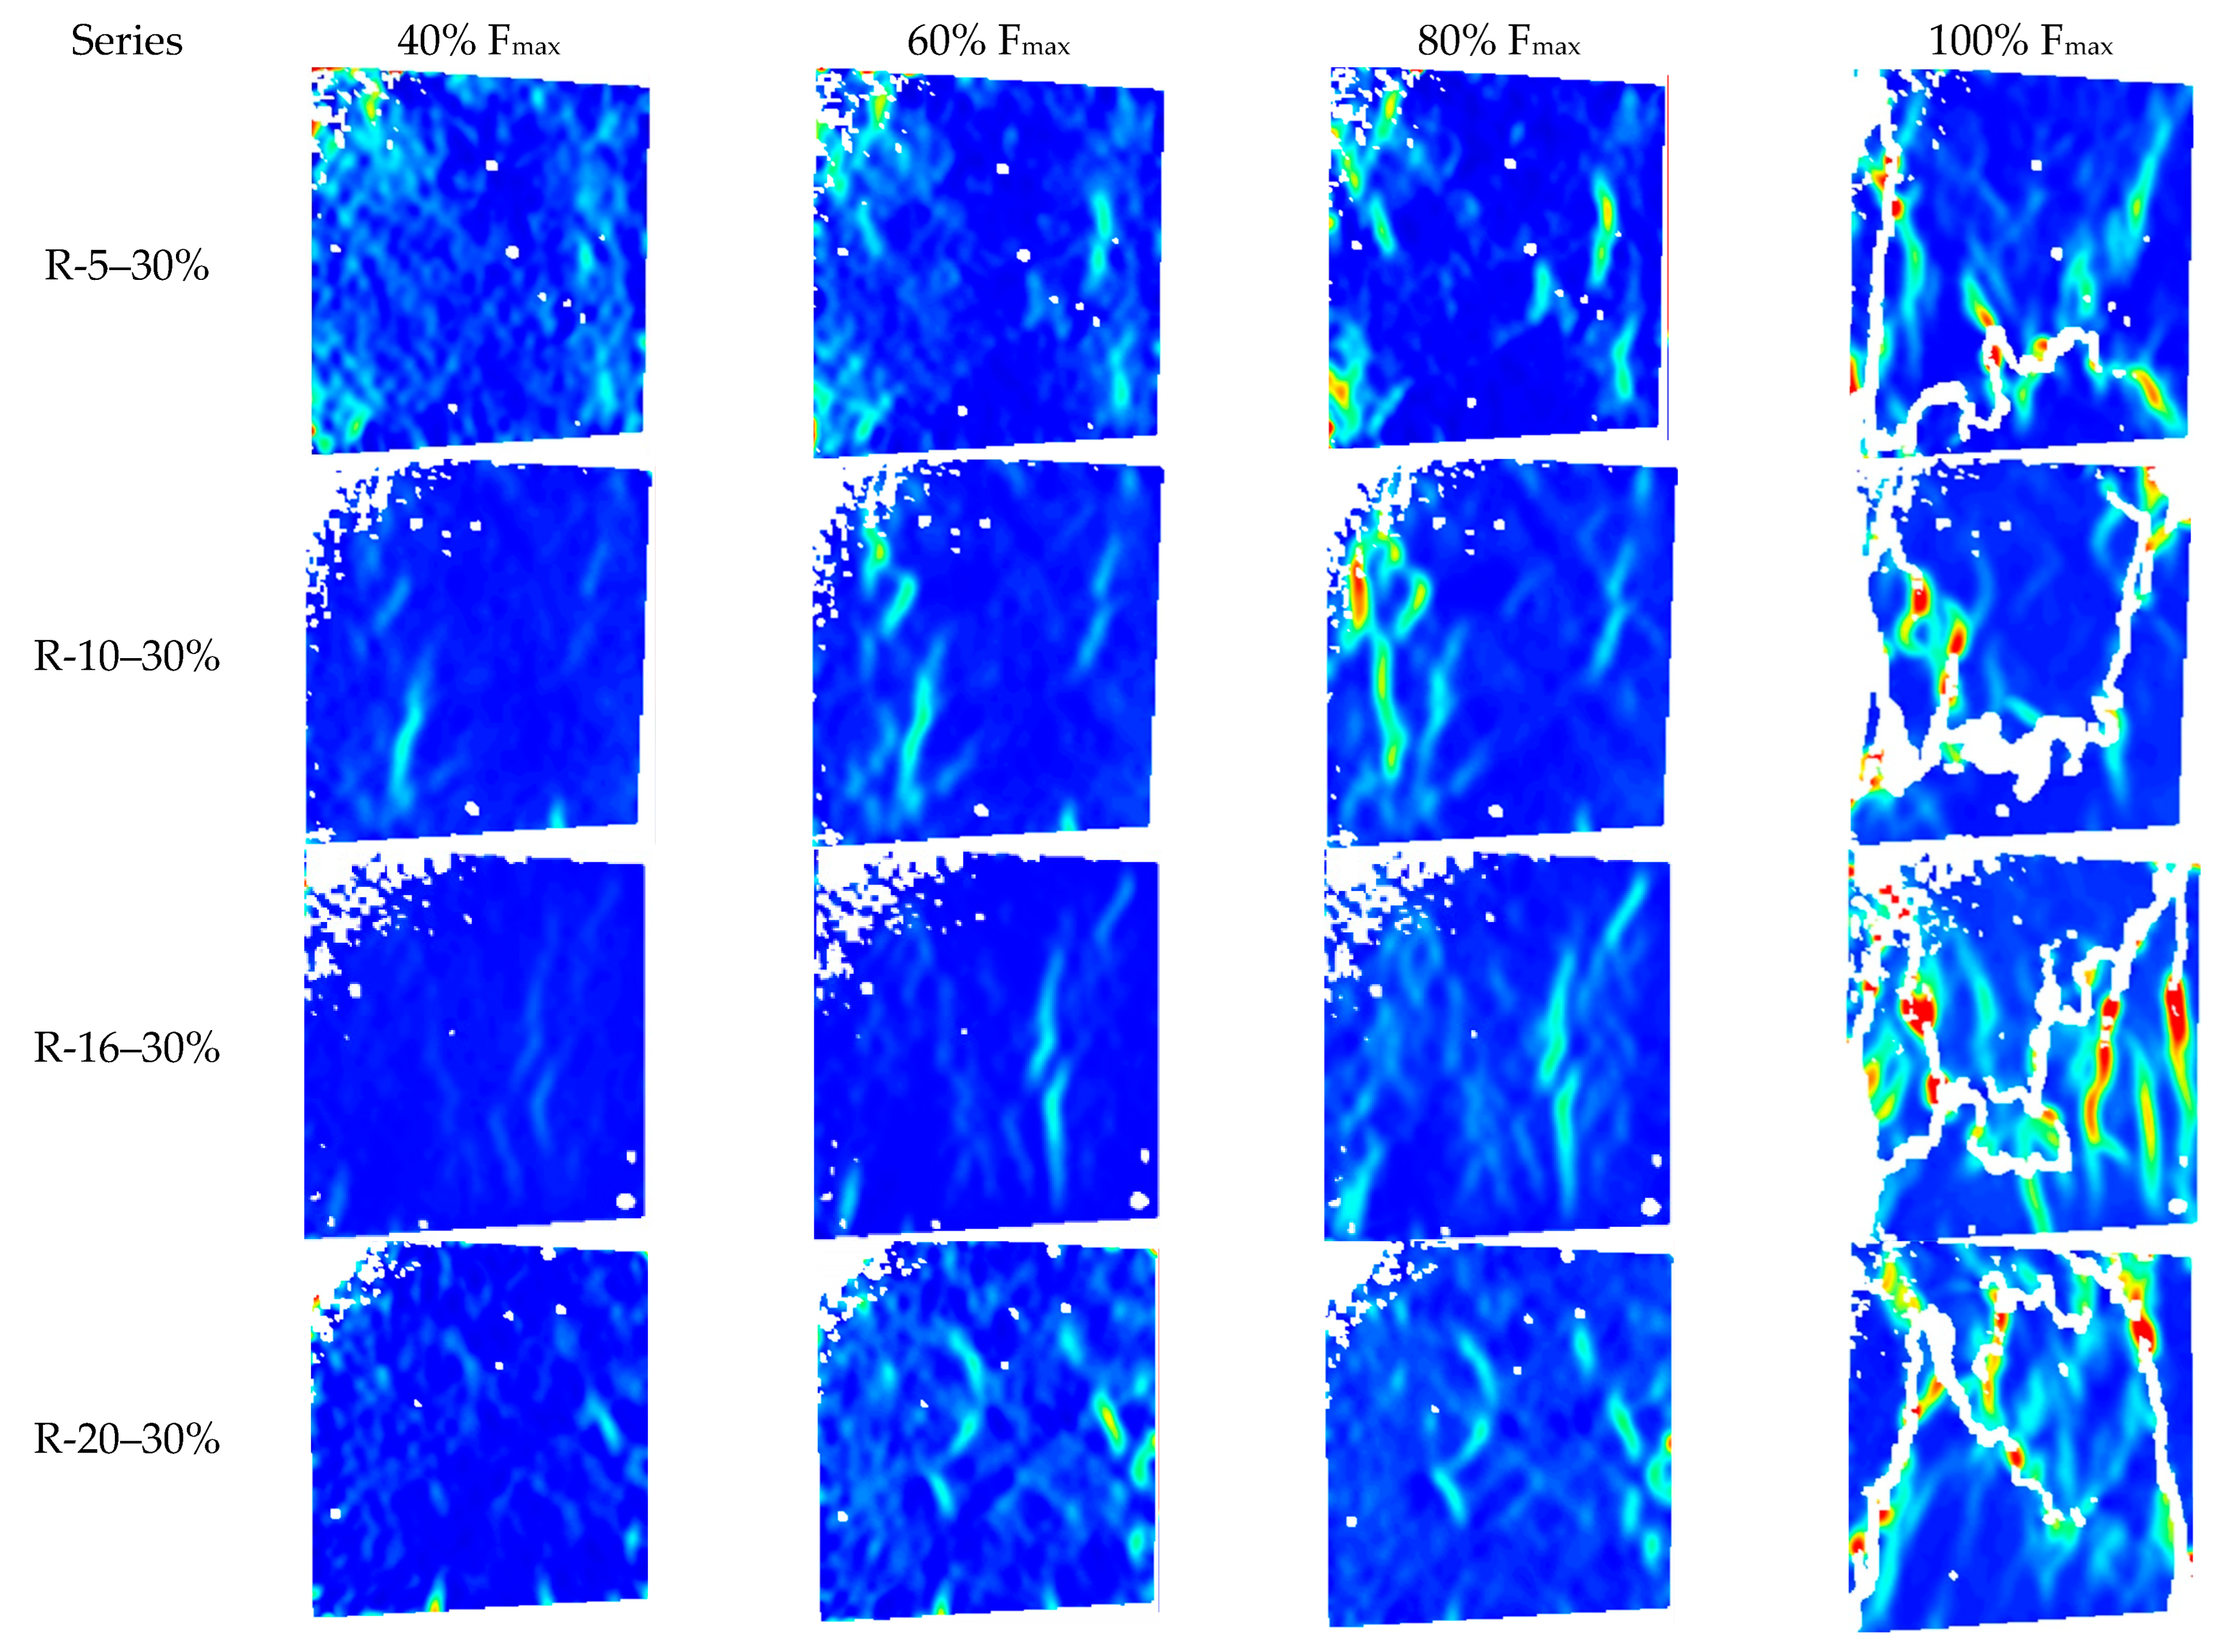
3.2. Influence of Recycled Aggregate Size on Crack Propagation Behavior in RAC
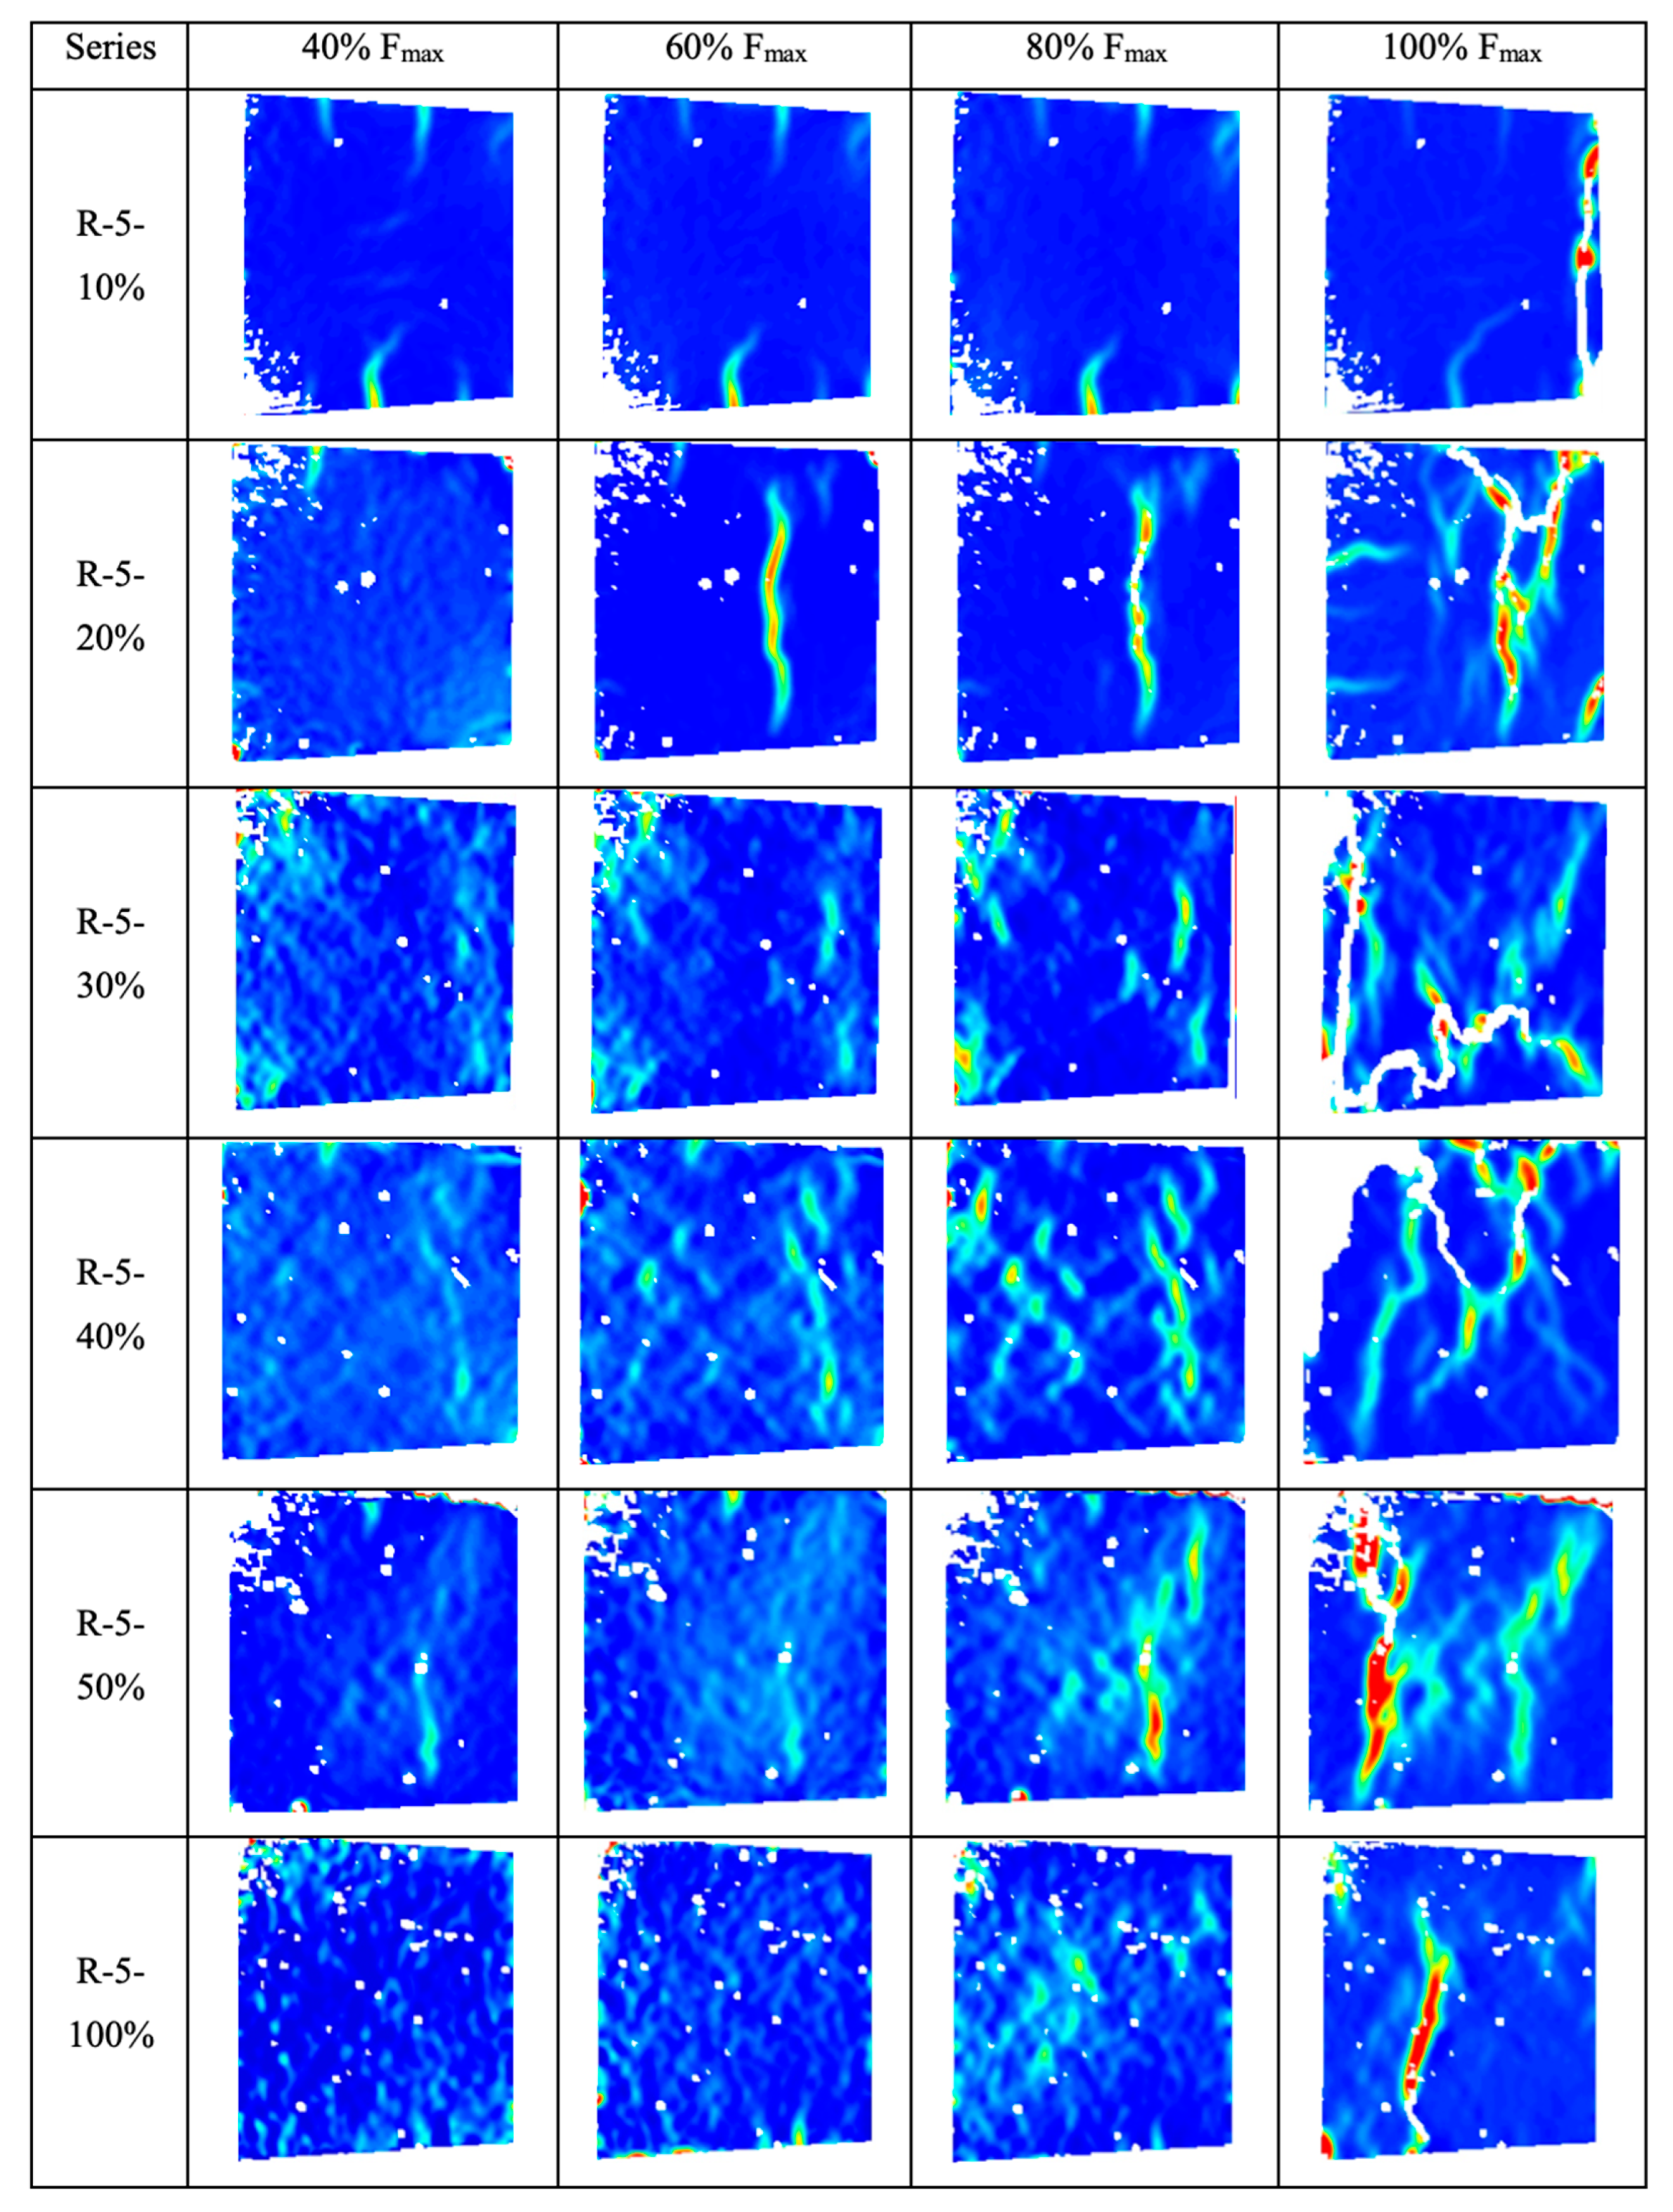
Figure 6 depicts the strain and crack evolution stages of RAC with different aggregate sizes under uniaxial compression. At 40% of the maximum load (Fmax), RAC with aggregate sizes of 5–10 mm exhibits a broader range of detachment between aggregates and mortar, resulting in higher localized stresses. In contrast, specimens R-16–30% and R-20–30% display only mild aggregate slip in localized regions. As the load increases to 60% and 80% of Fmax, strain concentration zones emerge in areas with lower elastic moduli (i.e., the interfacial transition zone, ITZ), characterized by numerous microcracks, particularly in RAC with aggregate sizes ranging from 5 to 10 mm and 10–16 mm.
Upon reaching the peak load (100% of Fmax), all specimens exhibit complex crack morphologies with tortuous propagation paths. Compared to RAC with aggregate sizes of 5–16 mm, specimens R-16–30% and R-20–30% display red hues near the macroscopic cracks, especially at the crack tips, indicating high strains and the presence of numerous microcracks. These regions store significant amounts of energy, leading to further crack propagation and energy release towards the red zones. Smaller recycled coarse aggregate sizes result in a denser distribution of aggregates with smaller spacing and a higher volume fraction of adhered mortar. Consequently, numerous weak zones prone to stress concentration form in the concrete prior to reaching the peak load. This explains the occurrence of numerous aggregate slip zones and large stress concentration areas within specimen R-5–30%, facilitating the development and interconnection of microcracks near these weak zones. In contrast, crack propagation and extension in other regions are relatively slower. As the aggregate size increases, the volume fraction of adhered mortar decreases, and the supporting role of aggregates becomes more significant in enhancing the compressive strength of RAC [
34,
35,
36]. However, when the aggregate size increases to 20–25 mm, due to the high elastic modulus of the aggregates, the crack propagation direction shifts along the aggregate perimeter, requiring more energy and slowing down the crack development speed. Additionally, compared to smaller aggregates, larger aggregates exhibit poorer distribution uniformity, exacerbating the internal stress imbalance in the concrete, and ultimately leading to a decrease in compressive strength.
3.3. Quantifying the Impact of Recycled Aggregates on Concrete Crack Morphology Using Fractal Dimension
Figure 7 illustrates the morphology of surface cracks in recycled aggregate concrete (RAC) with various aggregate volume fractions and particle sizes under axial compressive loading. The complexity of these cracks is quantified using the fractal dimension (D). A combined analysis of
Figure 1 and
Figure 2 reveals that, regardless of aggregate particle size, an increase in the volume fraction (the volume of recycled aggregate as a proportion of natural aggregate) of recycled aggregates (from 10% to 30%) leads to an expansion in the overall surface crack area and a more intricate crack propagation path. Among the different RACs, those with aggregate sizes of 10–16 mm exhibited the most significant increase in complexity (D = 1.24~1.56), followed by those with 5–10 mm aggregates (D = 1.27~1.53), and finally, those with 16–20 mm aggregates (D = 1.40~1.64). Notably, the RAC with 16–20 mm aggregates had the highest fractal dimension (D = 1.64), indicating the most complex crack propagation path and the largest extension range, which effectively dissipates the accumulated elastic potential energy within the concrete.
As the volume fraction of recycled aggregates further increases (to 40%, 50%, and 100%), the degree of concrete damage decreases, with a more pronounced reduction observed at higher aggregate fractions. Stress concentration effects are primarily confined to the vicinity of macro-cracks and regions of low elastic modulus. For RAC with smaller aggregate sizes (5–16 mm), the average reduction in fractal dimension as the volume fraction increases from 30% to 50% is 0.28, which is higher than that for RAC with 16–25 mm aggregates (0.17), corresponding to decreases of 21.88% and 11.49%, respectively (see
Figure 8). This phenomenon can be attributed to the development of non-load-induced cracks within the concrete during the curing process due to variations in temperature and humidity. Smaller aggregate particles have narrower interstices and increased contact possibilities, which exacerbate the risk of internal defects [
37,
38,
39,
40]. Consequently, when RAC is loaded, micro-cracks rapidly connect with surrounding pores, weakening the concrete’s strength. Conversely, larger aggregate particles carry less adherent mortar, exerting a lesser influence on structural defects in the concrete.
The fractal dimension (D) is a parameter that describes the spatial complexity and density. In concrete crack analysis, it reflects the complexity and distribution of cracks. As the incorporation of recycled aggregate increases in concrete, the fractal dimension (D), which measures the complexity and density of crack patterns on the surface, exhibits a trend of first increasing and then decreasing. At lower levels of recycled aggregate content, the introduction of recycled aggregates with attached materials, porosity, and varied bonding strength to the new cementitious matrix may lead to uneven stress distribution within the concrete, enhancing the risk of cracking, particularly at the interfaces between the recycled aggregates and fresh cement paste. Consequently, as the recycled aggregate content rises initially, the cracks within the concrete may become more intricate and dense, resulting in an elevated fractal dimension (D). However, at higher recycled aggregate contents, while porosity and stress concentrations may intensify, the presence of numerous recycled aggregates may somewhat “dilute” or “buffer” the progression of cracks. Additionally, the decrease in overall concrete strength with increasing recycled aggregate content may cause cracks, once formed, to propagate and interconnect more readily, forming larger crack areas rather than more intricate and dense crack networks. Therefore, at higher recycled aggregate contents, although cracks still exist within the concrete, they may become more sparse and regular, leading to a reduction in the fractal dimension (D).
3.4. Influence of Recycled Aggregates on Crack Area and Quantity of Concrete
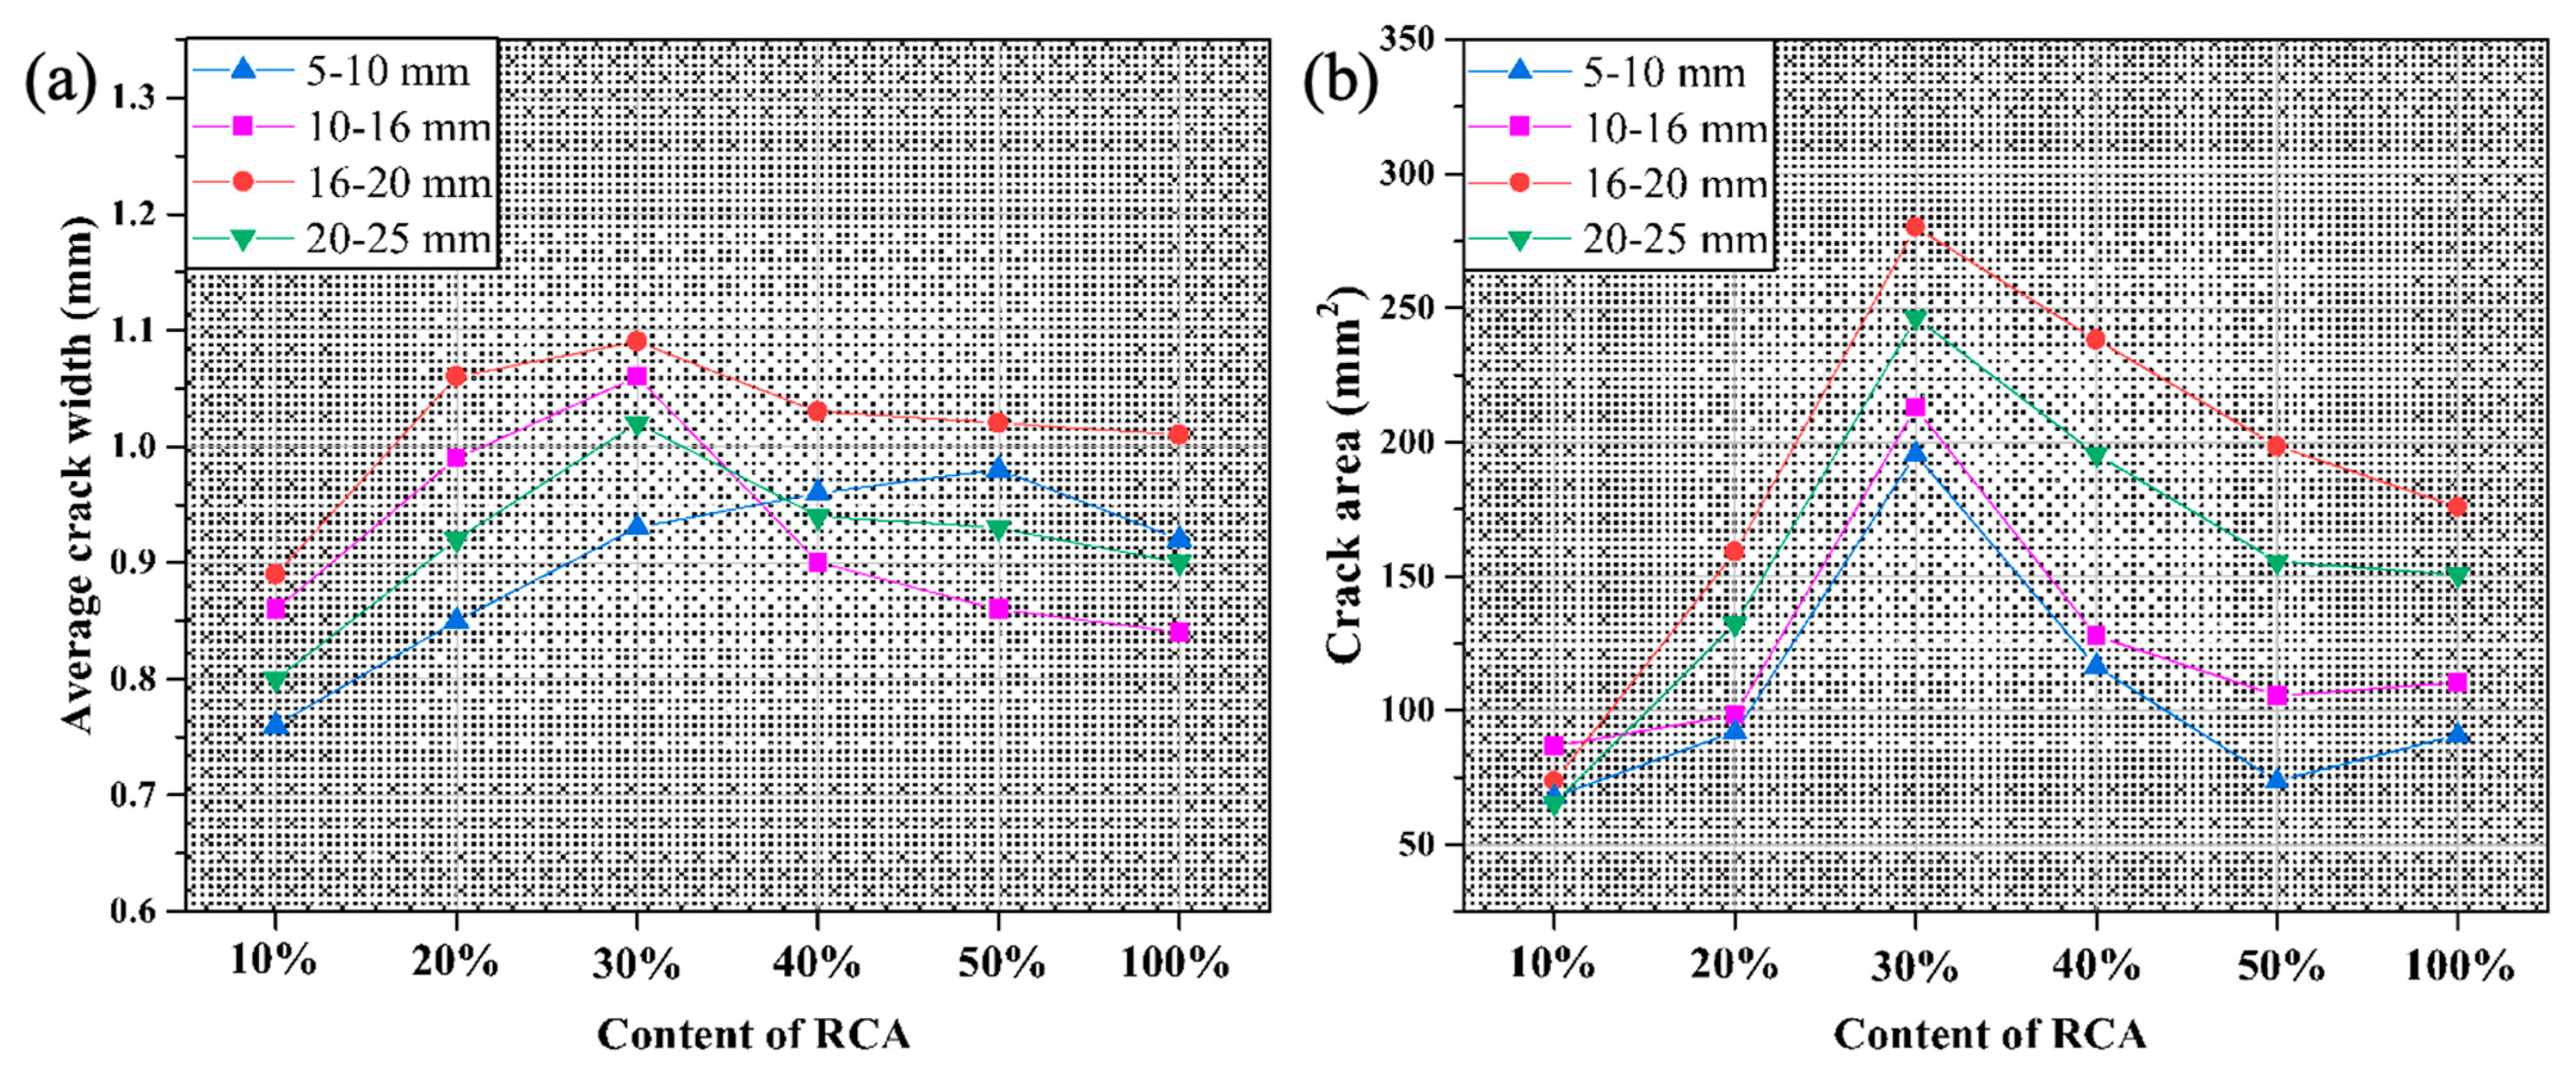
Figure 9 presents a statistical analysis of the average width and area of surface cracks in recycled concrete. Similar to the trend observed in crack complexity, as the volume fraction of recycled aggregates increases from 10% to 30%, the average crack width increases approximately linearly, and the crack area also increases to varying degrees. It can be seen that when the volume fraction (the volume of recycled aggregate as a proportion of natural aggregate) of recycled aggregates is 10%, their impact on concrete cracking behavior is relatively minor, resulting in fluctuations in the corresponding crack area within the range of 60–90 mm
2. In specimens containing 30% recycled aggregates, the difference between the maximum average crack width (1.09 mm) and the minimum (0.92 mm) is 18.49%, and the corresponding crack areas differ by 43.31% (280.07 mm
2 and 195.43 mm
2). This indicates that specimen R-5–30% exhibits relatively poor crack ductility, and the larger crack area reflects, to a certain extent, the complexity of the crack propagation path.
The physical interpretation of the fractal dimension D, in the context of analyzing concrete surfaces with cracks using fractal theory and box-counting algorithms, is a measure of the complexity or “roughness” of the crack pattern on the concrete surface. It provides a quantitative representation of how space is filled or occupied by the cracks, reflecting their intricate distribution and density. The fractal dimension D lies between 0 and 2, where a lower D value indicates a smoother or less complex crack pattern, while a higher D value signifies a more irregular, dense, and complex crack network. In practical terms, D serves as an indicator of the damage level in concrete, reflecting the extent to which cracks have developed and interacted with each other. Regarding its relationship with the aggregate, while the fractal dimension D is directly computed from the crack pattern on the concrete surface, the aggregate within the concrete can indirectly influence D. The quality, size, shape, and distribution of aggregates can affect the overall mechanical properties and durability of concrete, which in turn can impact crack formation and propagation. For instance, aggregates with poor bonding to the cementitious matrix or with irregular shapes and sizes may contribute to increased stress concentrations and weakened zones in the concrete, facilitating crack initiation and growth. These cracks then contribute to the fractal dimension D, reflecting the aggregate’s influence on the crack pattern complexity. The fractal dimension D thereby provides a physical measure of the crack pattern complexity on a concrete surface, while the aggregate within the concrete, through its properties and interactions with the cementitious matrix, can indirectly affect this complexity.
When the volume fraction (the volume of recycled aggregate as a proportion of natural aggregate) of recycled aggregates increases to 40% and 50%, there is no clear regularity in the changes in the average width of RAC cracks. Whether increasing or decreasing, except for RAC with particle sizes of 5–16 mm, the average width of the other cracks changes insignificantly, with variations below 10%. However, RAC with smaller recycled aggregate sizes (5–10 mm and 10–16 mm) experiences a significant decrease in crack area, from 212.90 mm2 to 105.43 mm² and from 195.43 mm2 to 73.52 mm2, respectively. This suggests that increasing the volume fraction (the volume of recycled aggregate as a proportion of natural aggregate) of recycled aggregates expands the area of weak zones in the interfacial transition zone (ITZ). As the loading increases, cracks are more likely to develop and extend from these zones. Some recycled aggregates and mortar fail before reaching their ultimate bearing capacity, preventing these materials from exerting their compressive effects and limiting crack extension into these areas. Therefore, at the instant of loading to 100% Fmax, there is a significant concentration of stress around the macro-cracks and in the weak zones.
As the volume fraction (the volume of recycled aggregate as a proportion of natural aggregate) of recycled aggregates increases to 100%, the average crack width decreases in all specimens, while the variation in crack area is inconsistent. The average crack width and area of recycled concrete with aggregate sizes of 5–10 mm and 10–16 mm increase the most, by 6.5% and 23.34%, respectively. This indicates that small-sized recycled aggregates carry a high content of bonded mortar, and micro-cracks mainly concentrate and develop in the old ITZ. Additionally, the small gaps between recycled aggregates allow adjacent micro-cracks to interconnect and form wider cracks that extend before the specimen reaches its peak load, releasing the strain energy within the concrete.
4. Conclusions
In a comprehensive analysis, it is observed that the crack propagation characteristics and damage severity in recycled aggregate concrete (RAC) are significantly influenced by both the volume fraction and size distribution of the recycled coarse aggregates. Specifically, as the volume fraction (the volume of recycled aggregate as a proportion of natural aggregate) of recycled aggregates escalates from 10% to 30%, the crack propagation paths within the RAC matrix become increasingly intricate, with the most pronounced damage observed in RAC specimens containing recycled aggregates sized 16–20 mm, exhibiting a peak D-value of 1.65. Conversely, a gradual increase in the volume fraction beyond 30%, up to 40%, 50%, and ultimately 100%, leads to mitigation in damage for RAC with recycled aggregate sizes ranging from 5 to 20 mm. An exception to this trend is noted at the 100% volume fraction for RAC with 20–25 mm aggregates, where a slight increase in the D-value is observed. Additionally, maintaining a constant recycled aggregate size while varying the volume fraction reveals that at 10% incorporation, the crack area approximates 80 mm². As the volume fraction augments to 30%, both the average crack width and area augment concurrently. However, further increments to 40% and 50% volume fractions result in a minor fluctuation in average crack width for RAC with 16–25 mm aggregates, whereas a substantial decline in crack area is evident for RAC with 5–10 mm and 10–16 mm aggregates. Ultimately, at a 100% volume fraction, a uniform decrease in average crack width is noted across all specimens, albeit with a non-uniform trend in crack area variation, highlighting the intricate interplay between recycled aggregate characteristics and RAC crack morphology.


