Article

A Closure Contact Model of Self-Affine Rough Surfaces Considering Small-, Meso-, and Large-Scale Stage Without Adhesive

1
College of Mechanical Engineering, Chongqing University of Technology, Chongqing 400054, China
2
Key Laboratory of CNC Equipment Reliability, Ministry of Education, School of Mechanical and Aerospace Engineering, Jilin University, Changchun 130012, China
3
Machinery Industry Key Laboratory of Heavy Machine Tool Digital Design and Testing Technology, Beijing University of Technology, Beijing 100124, China
*
Author to whom correspondence should be addressed.
Fractal Fract. 2024, 8(10), 611; https://doi.org/10.3390/fractalfract8100611
Submission received: 13 September 2024 / Revised: 8 October 2024 / Accepted: 12 October 2024 / Published: 18 October 2024

Abstract

:
Contact interface is essential for the dynamic response of the bolted structures. To accurately predict the dynamic characteristics of bolted joint structures, a fractal extension of the segmented scale model, i.e., the JK model, is proposed in this paper to comprehensively analyze the dynamic contact performance of engineering surfaces and revisit the multi-scale model based on the concept of asperities. The influence of asperity geometry, dimensionless material properties, and the elastic, elastoplastic, and full plastic mechanical models of a single asperity is established considering the asperity–substrate interaction. Then, a segmented scale contact model of rough surfaces is proposed based on the island distribution function in a strict sense. The mechanical contact process of determining rough surfaces is divided into small-scale, medium-scale, and large-scale stages. Moreover, cross-scale boundary conditions, i.e., al1′, al2′, and al3′, are provided through strict mathematical deduction. The results show that the real contact area and contact stiffness are positively correlated with fractal dimension and negatively correlated with fractal roughness. On a small scale, the contact damping decreases with an increase in load. In meso-scale and large-scale stages, the contact damping increases with the load. Finally, the reliability of the proposed model is verified by setting up three groups of modal vibration experiments.

1. Introduction

Contact is one of the most common ways of force transmission, whose mechanical response is extremely meaningful for performance and mechanical system integrity [1,2,3]. Among mechanical properties, contact stiffness and damping are the most common features in various engineering applications, such as biomedical, marine, civil, locomotive-railway, and aerospace engineering. The vast majority of mechanical systems normally operate by combining several independent parts. These interface contact studies span almost all scales, such as nanometer, micrometer, millimeter, and centimeter scales. Therefore, it is necessary to establish a contact mechanics model on a full scale to meet the requirements of academic research and engineering applications.
Long ago, people knew that the nominal smooth surface was rough and included many geometric asperities with random distribution and different sizes, which brought uncertainty and complexity to the research of contact mechanisms [4]. Archard was the first to propose the concept of “asperity on asperity”, which systematically explained that the load and the actual contact area are almost linearly dependent [5]. Greenwood and Williamson made a detailed analysis of non-adhesive rough surfaces based on useful pioneer insights [6]. The first statistical contact modeling method, i.e., the GW model, was proposed by assuming that the asperities’ height conforms to Gaussian distribution, the curvature radius of the asperities is constant, and there is no interaction between asperities. The GW model was later improved and expanded by many scholars to relax the strict assumptions of the GW model [7,8,9,10,11,12,13,14,15,16]. However, the statistical method cannot reflect the multi-scale properties of rough surfaces, which deviates from the original intention of Archard. Moreover, the statistical contact model depends on the sample length and the resolution of the measuring instrument, which challenges the interface contact research [17,18,19].
With the development of precision measurement technology on rough surfaces, people have realized that most engineering surfaces are multi-scale fractals [20]. In 1990, Majumdar and Bhushan proposed a scale-independent fractal contact model, i.e., the MB model [21]. Many fractal expansion models have emerged on this basis, such as the WK model [22], the YK model [23], the LL-2007 model [24], the Zhang model [25], the ZX model [26], the LS model [27], the LJ model [28], and the XZ model [29], etc. [30,31]. Although these models can explain some contact mechanics phenomena, they have obvious shortcomings, such as assuming that a single asperity is completely deformed and unrelated to the applied load, which leads to surprising results in popularization and application. Moreover, Persson [32,33] and Yang et al. [34] have developed a new modeling method for rough surfaces by employing the diffusion theory, which does not depend on fractal roughness or length scale like the GW model. Moreover, applying the developed method in engineering is difficult due to its complexity. In 2010, Morag and Etson [35] first proposed a scale-dependent contact model of single asperity, i.e., the ME model, which solved an important shortcoming of the MB model. Then, Lin et al. [36], Miao et al. [37], Afferrante et al. [38], and Goedecke and Jackson et al. [39,40] extended the ME model to rough surfaces and established the LL model, the Miao model, the AC model, the JS model, and the GJ model, respectively. Recently, Yu et al. [41,42], Chen et al. [43], and Guo et al. [44] proposed a multi-stage contact model of rough fractal surfaces according to the deformation mode of multi-scale asperities.
After much scientific research, the contact mechanics of rough surfaces have been further understood, and some results have been achieved. Standing on the shoulders of giants, we revisit the multi-scale contact theory by first putting forward the concept of subsection scale, such as the small-scale, medium-scale, and large-scale stages. A complete piecewise-scale fractal expansion model, i.e., the JK model, is proposed. The transformation process of asperities on the rough surface from full plastic to elastic-plastic and then to elastic behavior with an increase in the full-scale range load is explained. Compared with other multi-scale models, the model solves the problems of discontinuity in contact mechanics, and is simple to compile and easy to apply in engineering.

2. Single-Asperity Contact Model (JK Model with a Single Asperity)

The contact between rough surfaces is often equivalent to the contact between a rough surface and a rigid, smooth plane, as shown in Figure 1. From the microscopic point of view, the contact process involves many randomly distributed asperities with different geometric shapes, leading to intricate contact mechanisms. In this section, only the contact process of spherical asperities is considered, and the contact mechanism is clarified to standardize and normalize complex problems. Moreover, the complete mechanical process of an asperity, from elastic to elastic-plastic to full plastic deformation, is explored. Lastly, a reliable asperity contact model is established.

2.1. Problem Description

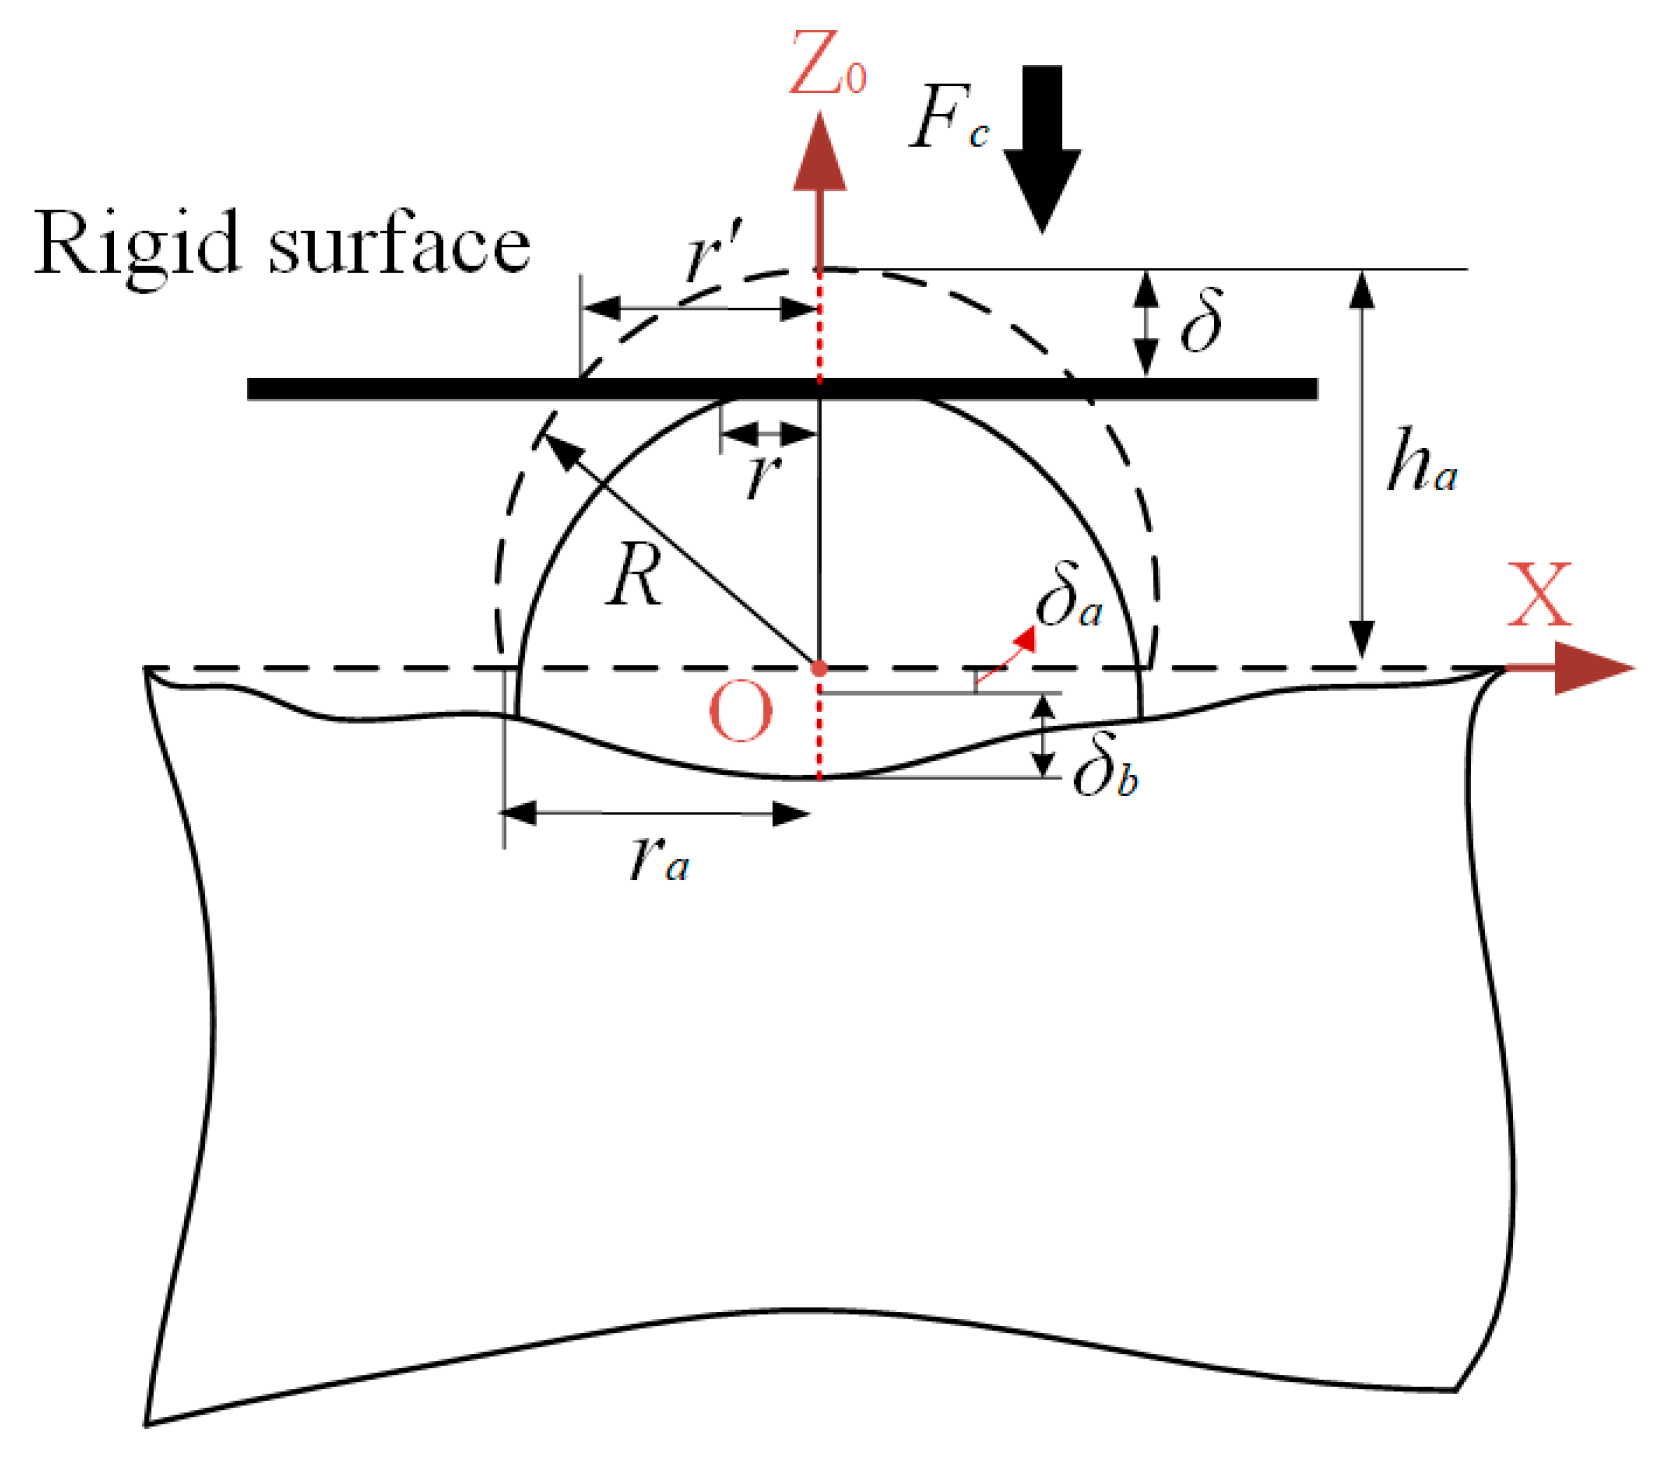
The bolted joints of the heavy-duty CNC machine tool are often subjected to a large pre-tightening force to ensure the reliability of the bolted structures. Only considering the asperity deformation on rough surfaces subjected to large loads is somewhat conservative. Due to Hertz’s stress distribution, it can be seen that the substrate is bound to bear large stress. When the surface is carburized, the asperities tend to be harder than the substrate. The single-asperity model is shown in Figure 2.

2.2. Asperity–Substrate Interaction

Yeo et al. [45] established an elastic contact model considering the interaction between the substrate and asperity. The relationship between δa and δ can be obtained as follows:
δ a = δ 1 + E r ξ δ a
where δ is the applied deformation; δa is the deformation of single asperity; δb is the interface deformation of the substrate; the geometric coefficient ξ = 1.5 R / r a ; and the dimensionless material coefficient Er = Ea/Eb, where Ea and Eb are the elastic moduli of the asperity and the substrate, respectively.
In Equation (1), δa involves the root formula, which can be conveniently applied to the analytical model. Thus, it is approximately discretized as follows:
δ a δ 1 + E r ξ h a   i = λ δ
where hai satisfies the linear distribution of [0, ha] and i represents the number of iterations (0, 1, ..., N); λ = 1 1 + E r ξ h a   i .
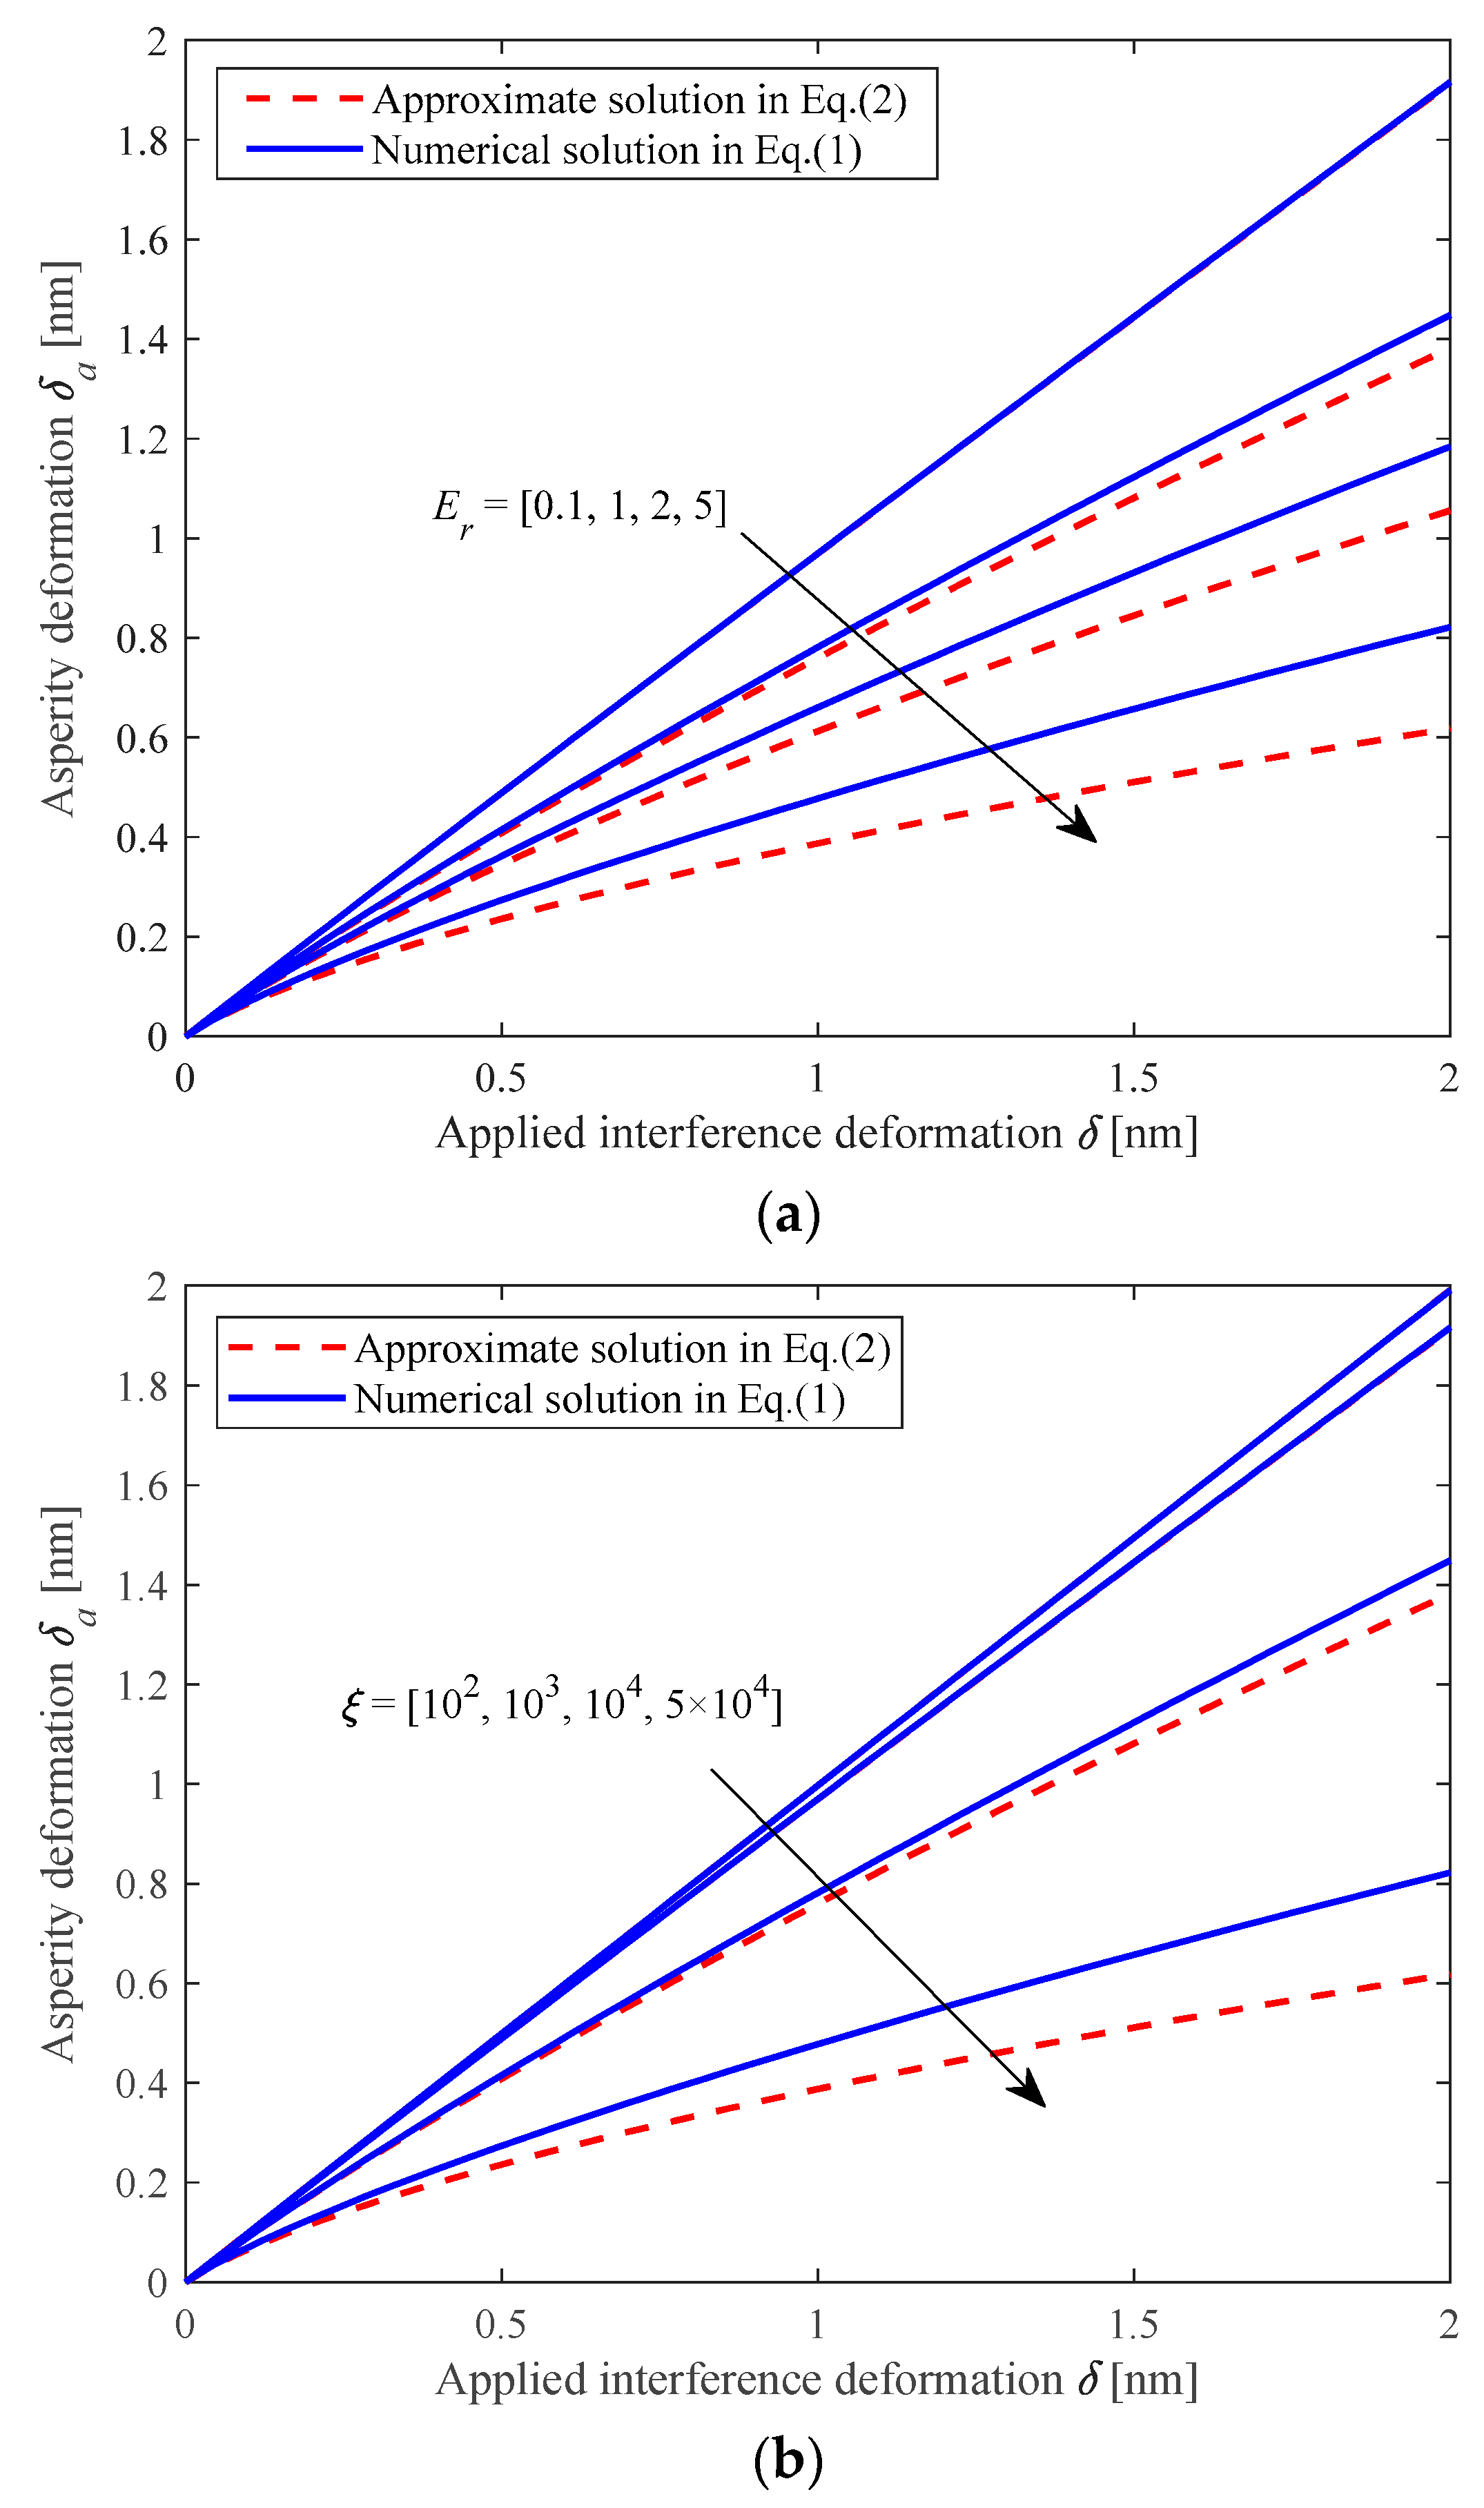
The variation law of the applied deformation δ and asperity deformation δa are described in Figure 3, where there is a non-linear growth trend. The approximate solution agrees with the exact numerical solution. When ξ = 104 m−0.5, the harder the asperity is, the smaller its deformation, with an increase in the value of Er. Therefore, the influence of the substrate is more significant. When Er = 1, the asperity radius is larger, and its height is smaller with an increase in the value of ξ. In other words, the surface is smoother, and the asperity deformation is smaller. Therefore, substrate deformation cannot be ignored. In Figure 3, a relatively large range of Er and ξ is provided, whose values represent the upper limit. The error of approximate and exact solutions is approximately 15%, which is too large. However, in the real physical field, the geometric coefficient ξ << 104 m−0.5 and the approximate solution is almost equal to the exact solution.

2.3. Asperity Contact Modeling in Elastic, Elastoplastic, and Full Plastic Deformation—JK Model

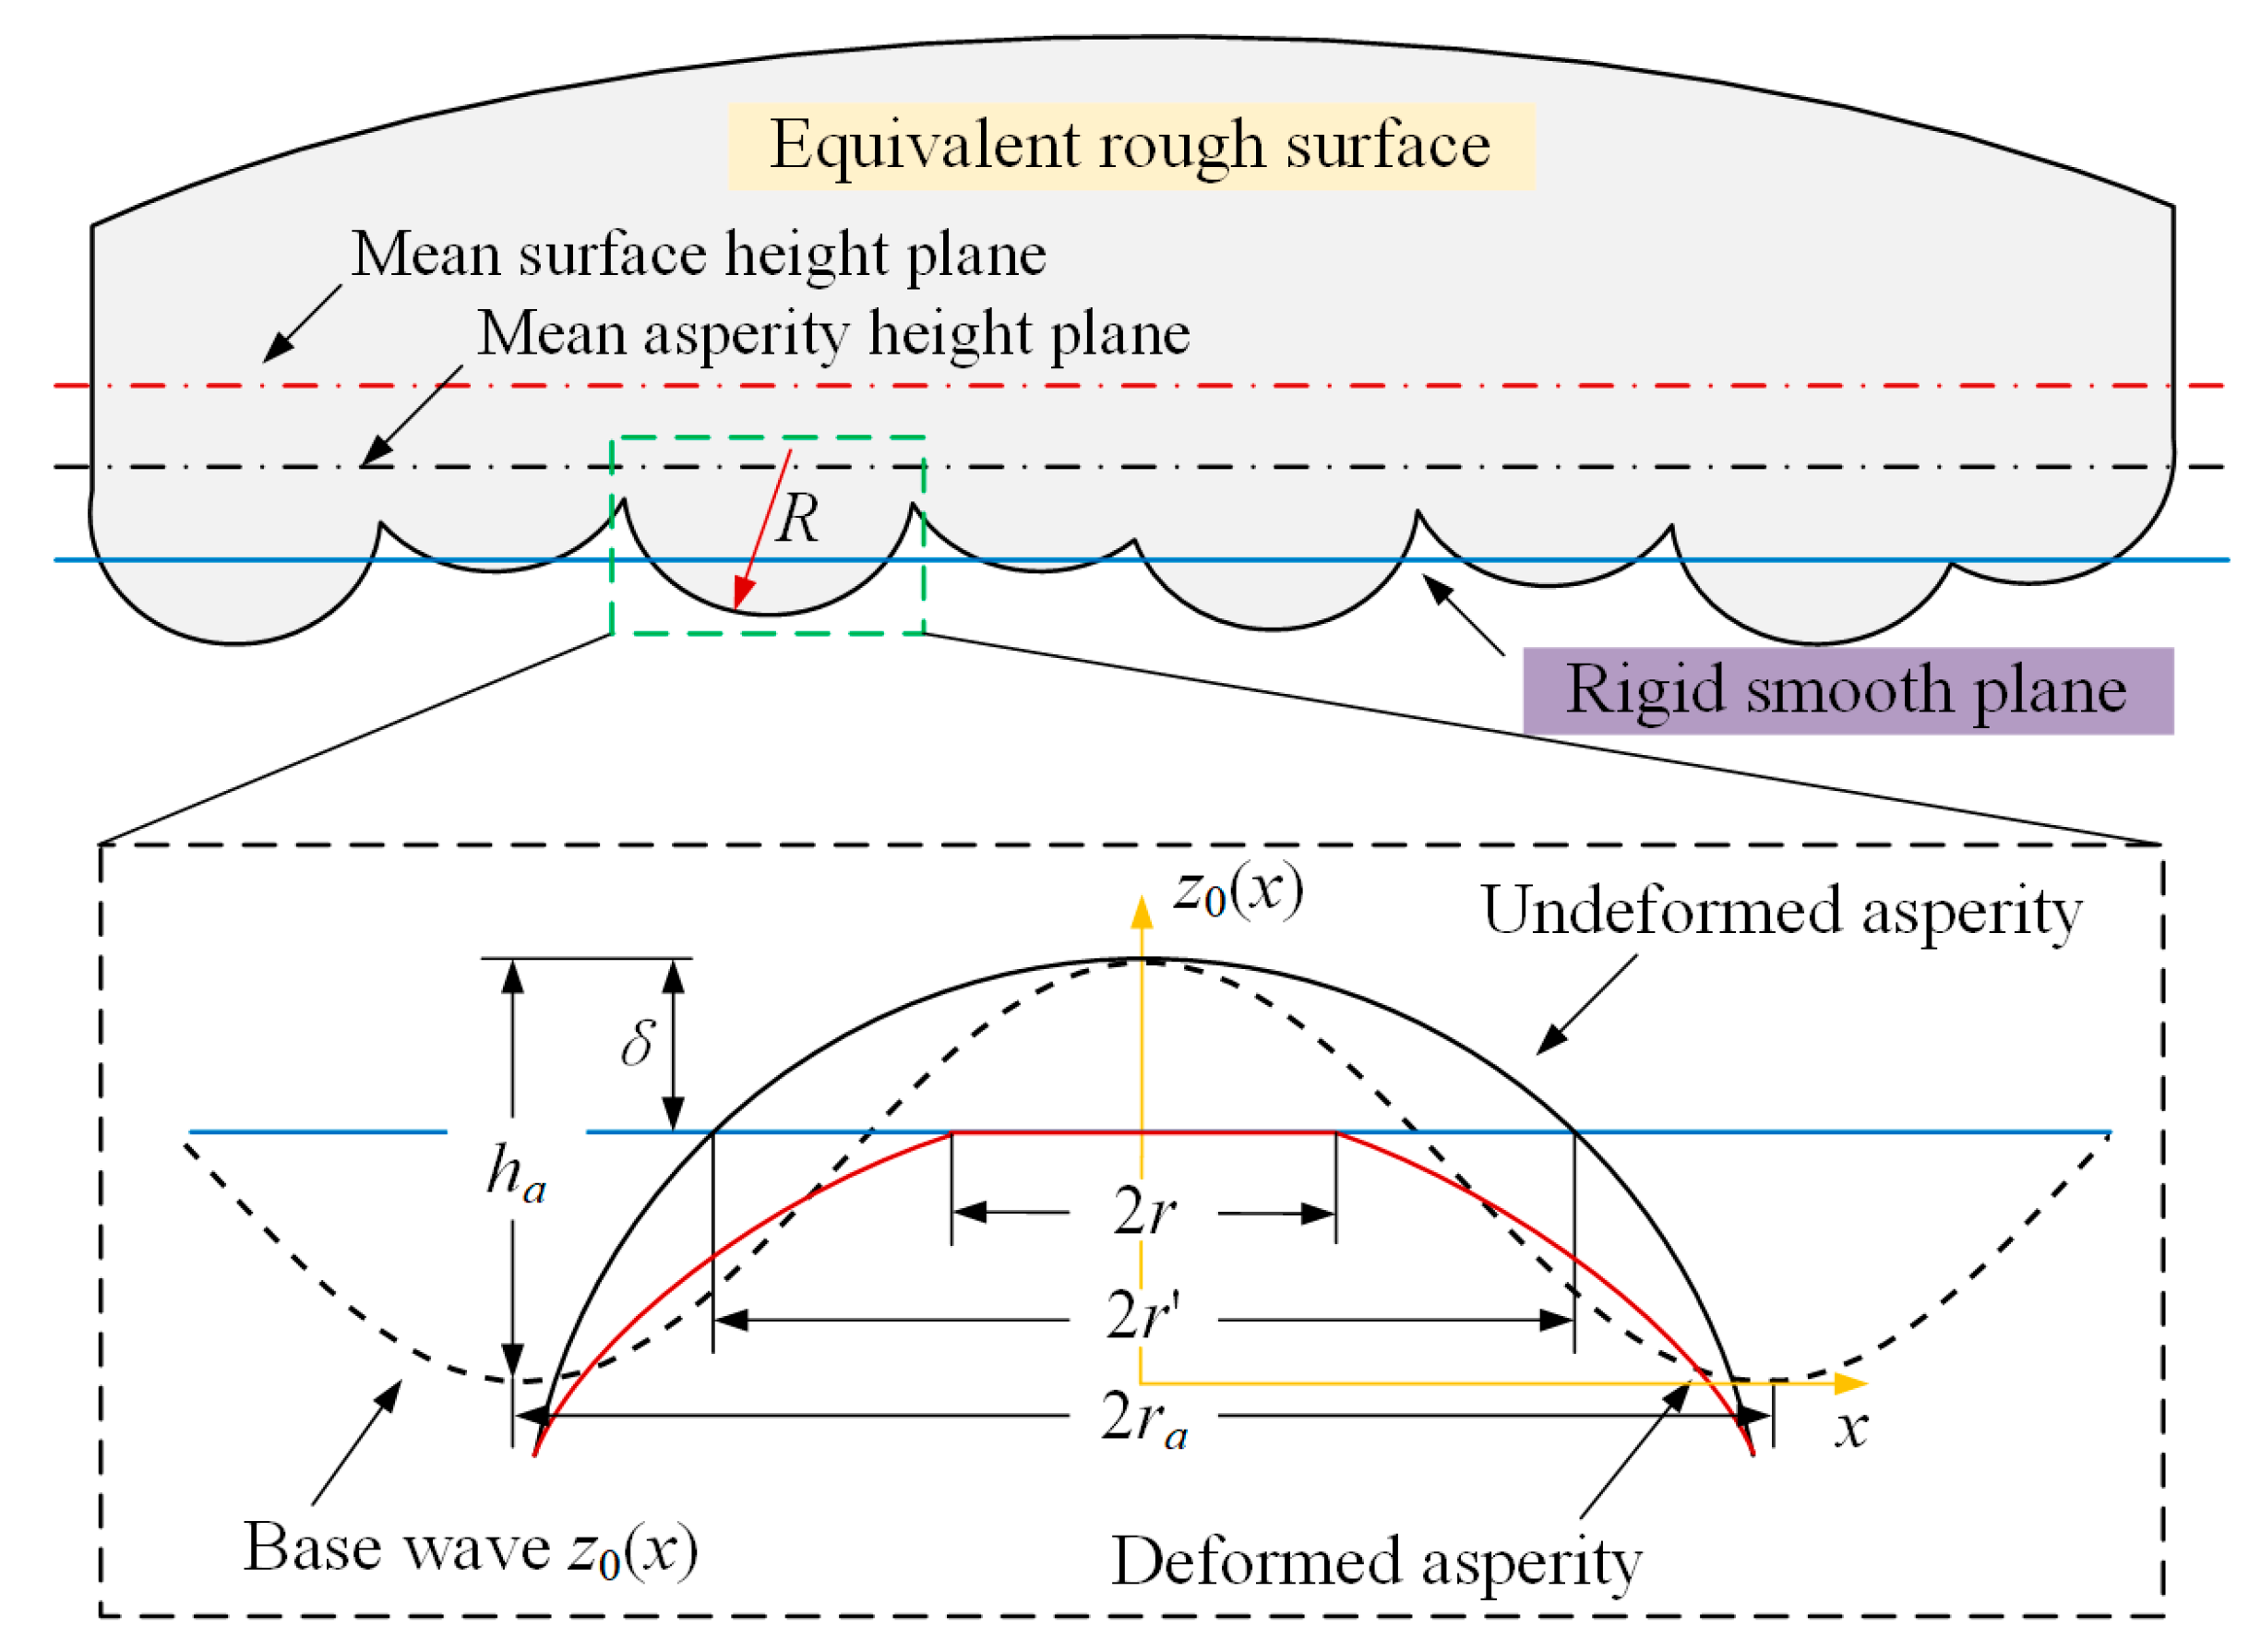
The asperity contact is established by cutting off the rough surface with a rigid plane used for various interferences. According to Figure 4, the rough surface profile can be written as follows [23].
z 0 ( x ) = 2 ( 3 D ) G ( D 2 ) ( ln γ ) 1 / 2 ( r a ) ( 3 D ) cos π x r a
Therefore, ha is the height of an asperity, and can be expressed as follows:
h a = 2 ( 3 D ) G ( D 2 ) ( ln γ ) 1 / 2 ( r a ) ( 3 D )
where D is the fractal dimension equal to D = <Ds> + 1, G is the fractal roughness obtained by the FPENN method (see ref. [46] for details), ra is the truncated radius (or half wavelength), and γ is frequency index, generally 1.5.
Traditional fractal models include the MB model [21], YK model [23], LL model [24], LJ model [28], and ZX model [26]. These models assume complete deformation of the asperity, i.e., δ = ha, which is false. Morag and Etsion [35] proved this point and thought that the deformation δ of an asperity depends on the applied load, which ranges from zero to complete deformation, i.e., 0 ≤ δha. Then, the applied deformation δ can be written as follows.
δ = h a z 0 ( r ) = 2 ( 3 D ) G ( D 2 ) ( ln γ ) 1 / 2 ( r a ) ( 3 D ) 1 cos π r r a
The profile function of the cosine wave is approximately equivalent to a spherical asperity at half wavelength, as shown in Figure 4. The contact point must satisfy the geometric function r a 2 R h a . Thus, the geometric radius of the asperity can be expressed as follows.
R = r a ( D 1 ) 2 ( 4 D ) G ( D 2 ) ( ln γ ) 0.5
The asperity undergoes elastic, elastic-plastic, and full plastic deformation under external load. Therefore, the first critical deformation δ1c, that is, when it comes into the elastic-plastic stage, can be proven as follows:
δ 1 c = ( π K H 2 E * ) 2 R = ( π K H ) 2 r a ( D 1 ) 2 ( 6 D ) E * 2 G ( D 2 ) ( ln γ ) 0.5
where K = 0.454 + 0.41 v ; H is the hardness of the softer material; and E* = E1/(1 − v12). A relatively soft material, E1 = Eb, is chosen if the material yields in a large area (δ > 0.1 ha). If the material yields in a small area or does not yield (δ ≤ 0.1 ha), E1 = Ea.
Note: we assume that E1 is Ea or Eb. However, for the better elastic modulus of coating materials or layered materials, please refer to [47].
The second critical deformation δ2c is proven as follows.
δ 2 c = 76.8 δ 1 c
If only half-wavelength peak contact is considered, Equation (5) is simplified as follows.
1   cos π r r a 1.06 r r a 2
If δmax < δ1c, the first critical truncated area a1c′ of an asperity can be written as follows.
a 1 c = π 3 ( K H ) 2 r a     2 ( D 1 ) 2 ( 9 2 D ) G 2 ( D 2 ) E * 2 ln γ
If δmax < δ2c, the second critical truncated area a2c′ of an asperity can be written as follows.
a 2 c = 76.8 a 1 c
It should be noted that Equations (10) and (11) must satisfy r = 2 R δ .
  • Elastic deformation
If 0 < a′ < a1c′, the normal load fe, real contact area ae, and average contact pressure p ¯ e at elastic deformation of an asperity can be expressed according to the Hertz theory.
f e = 4 3 E * R 1 / 2 δ a     3 / 2 = 2 3 K π R δ a δ a δ 1 c 1 / 2 = ( 1.06 λ ) 1.5 2 ( 9 2 D ) / 2 ln ( γ ) 0.5 E * G ( D 2 ) a l ( 1 D ) / 2 a 3 / 2 3 π ( 4 D ) / 2
a e = π R δ a = 1.06 2 λ a
p ¯ e = f e a e = 4 3 E * π ( δ a R ) 1 / 2 = 2 3 K H ( δ a δ 1 c ) 1 / 2 = 1.06 λ 3 π ( 4 D ) / 2 2 ( 11 2 D ) / 2 G ( D 2 ) E * ln ( γ ) 0.5 a l ( 1 D ) / 2 a 0.5
2.
Elastoplastic deformation
If a1c′ < a′ < a2c′, the normal load fep, real contact area aep, and average contact pressure p ¯ e p at elastoplastic deformation of an asperity can be expressed as follows:
f e p = 2 3 K H π R δ 1 c δ a δ 1 c 1.38 = H g 2 a l 0.38 ( 1 D ) a 1.38
a e p = π R δ 1 c δ a δ 1 c 1.16 = H g 1 a l 0.16 ( 1 D ) a 1.16
p ¯ e p = H 2.8 1.08 ( δ a δ 1 c ) 0.22 = 1.094 λ 0.22 H 0.56 E * 0.44 2.8 π 0.22 ( 4 D ) K 0.44 2 0.22 ( 9 2 D ) G 0.44 ( D 2 ) ln ( γ ) 0.22 a l 0.22 ( 1 D ) a 0.22
where
H g 1 = 1.06 1.16 2 ( 0.44 0.32 D ) E * 0.32 λ 1.16 ln γ 0.16 G 0.32 ( D 2 ) π ( 0.64 0.16 D ) ( K H ) 0.32 ;
H g 2 = 1.06 1.38 2 ( 3.42 0.76 D ) ( K H ) 0.24 ln γ 0 . 38 E * 0.76 λ 1.38 G 0.76 ( D 2 ) 3 π ( 1.52 0.38 D ) .
3.
Full plastic deformation
If a2c′ < a′ < al′, the normal load fp, real contact area ap and average contact pressure p ¯ p at full plastic deformation of an asperity can be expressed as follows.
f p = H a p
a p = 2 π R δ a = 1.06 λ a
p ¯ p = H
An accurate single-asperity model considering asperity–substrate interaction was established by introducing the geometric coefficient of the asperity and dimensionless material coefficient. The abnormal physical process of the contact based on the traditional fractal model was also corrected. Moreover, a comparative study of the classical contact model (KE model [48], LL-2005 model [49], and ZX model [26]) based on the contact research of single asperity will be conducted to verify the reliability and accuracy of the proposed model. Finally, the results will be compared with the finite element simulation. The detailed research is conducted in Section 2.4.

2.4. Analysis and Comparison of Different Single-Asperity Contact Models

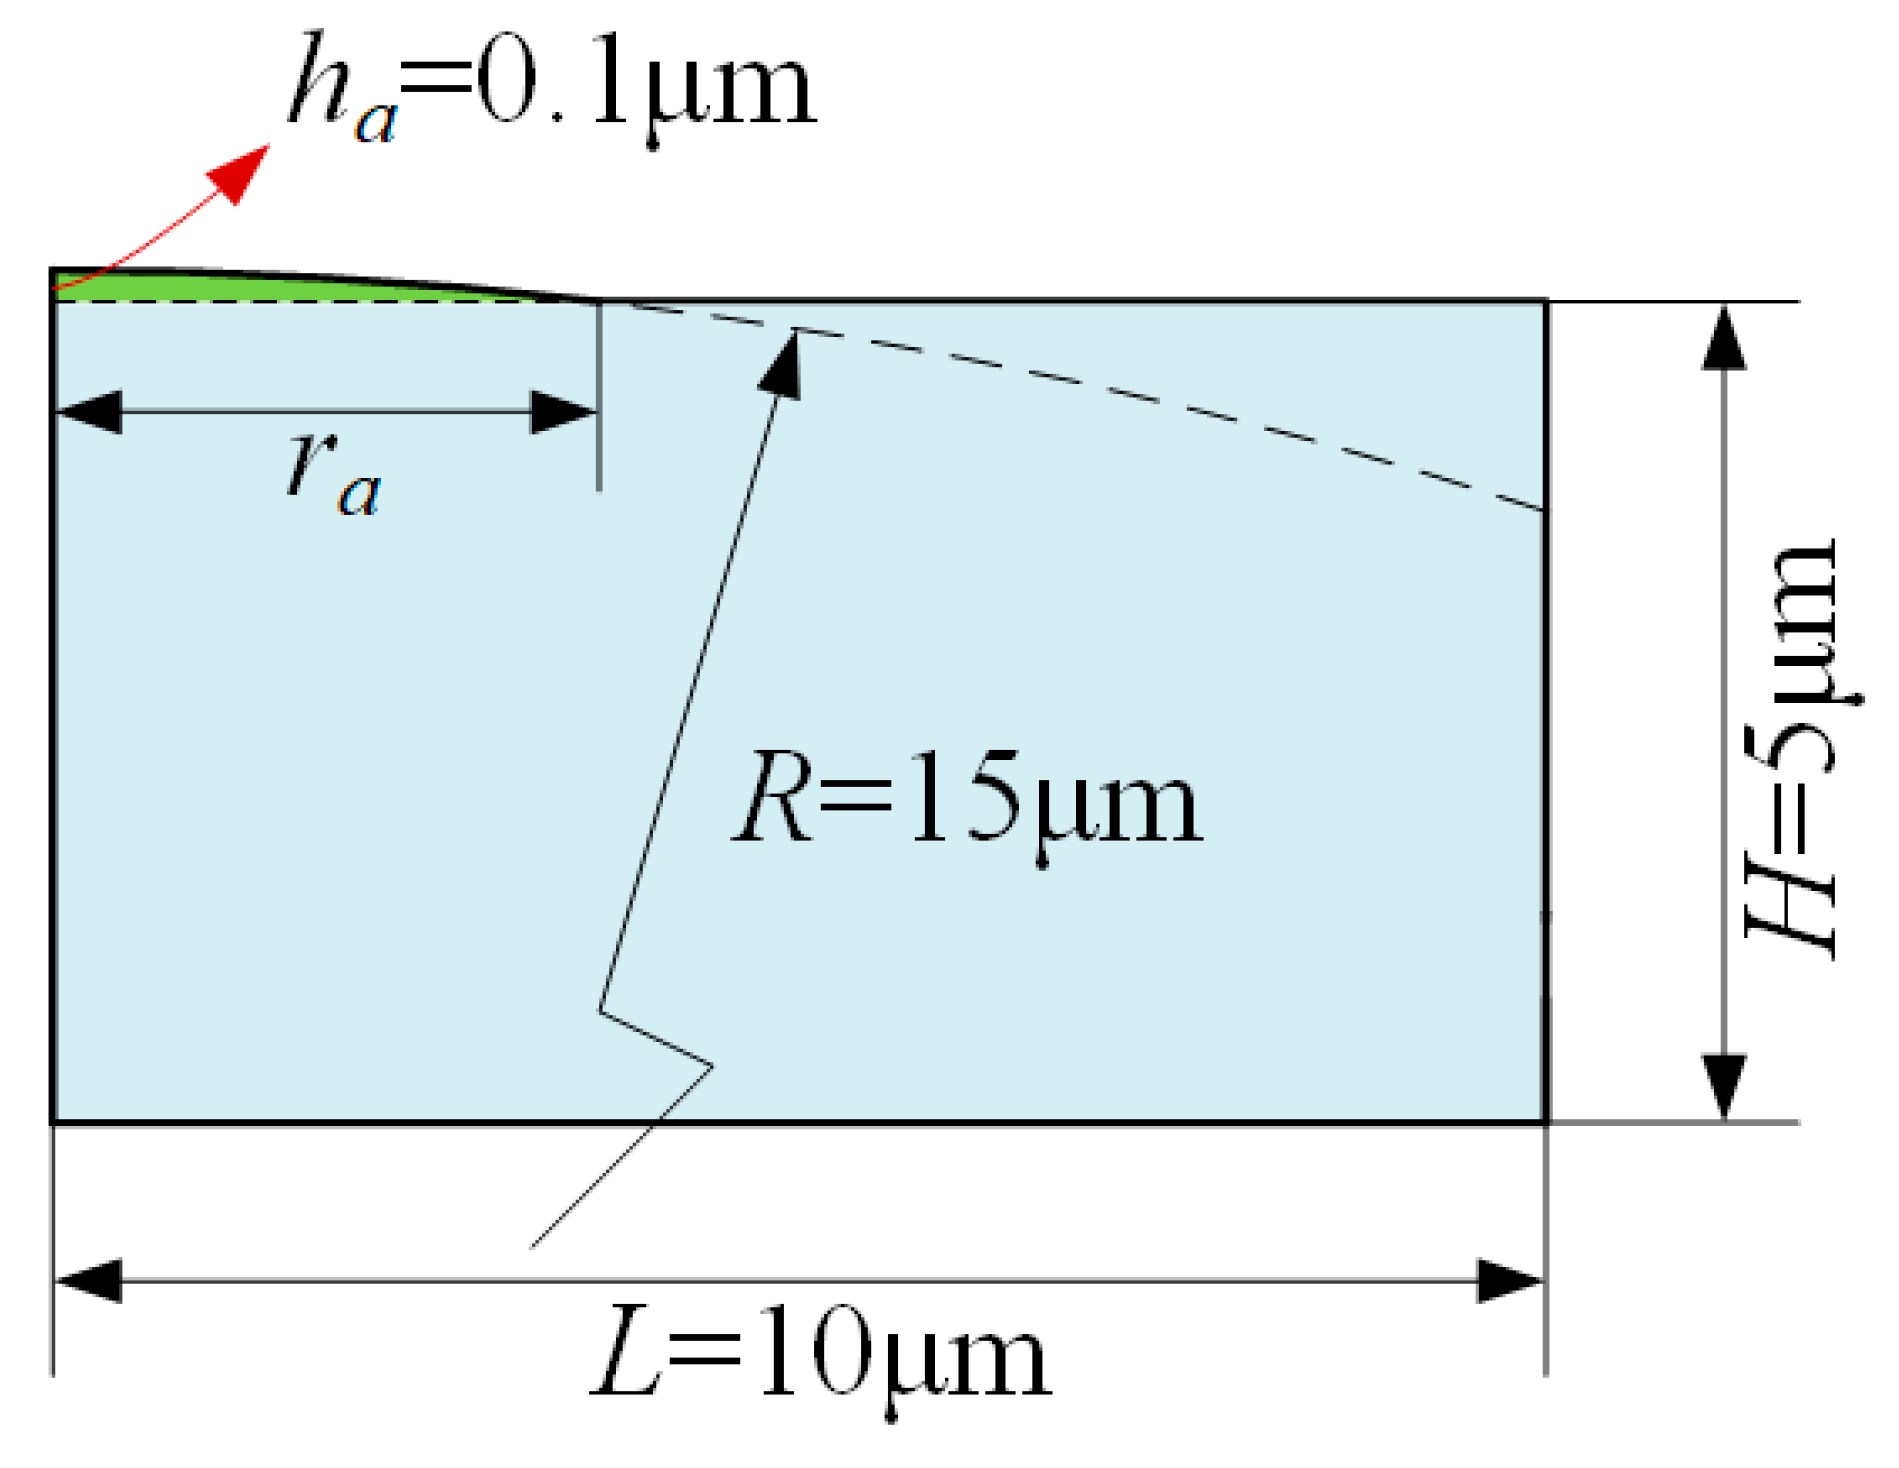
Work with axisymmetric analysis involves a calculation process to ensure the unity of units (MPa, mm, N). The geometric parameters are set as the asperity radius R = 15 μm and height ha = 0.1 μm, as shown in Figure 5. Material parameters are set as the elastic modulus E = 100 Gpa, Poisson’s ratio v = 0.3, and yield strength σs = 355 Mpa.
Parameters R = 15 μm and ha = 0.1 μm are substituted into Equations (4) and (6) to obtain the fractal parameters D and G. Although the inverse solution of the equation is somewhat difficult, the “fsolve” function of the MATLAB toolbox is used to obtain D = 2.9961 and G = 1.5463 × 10⁻⁴ mm. The results conform to the fractal law, i.e., the smoother the surface, the fractal dimension is closer to three. Moreover, the fractal roughness is inversely proportional to the fractal dimension. Lastly, the values of Rv = 15 μm and hav = 0.0997 μm are double-checked.
The following results are dimensionless to compare different models. KE and LL-2005 models are defined as follows.
f ^ = f π R δ H ;   a ^ = a π R δ ;   p ^ = p H ;   δ ^ = δ δ 1 c ;
Furthermore, the dimensionless results of the JK and XU models are defined as follows:
f ^ = f T H ;   a ^ = a T f ^ = f H a / 2 ;   a ^ = a a / 2
where T = 1.06 λ a 2 .
It should be noted that Equation (22) is derived by substituting the corresponding models R and δ into Equation (21).
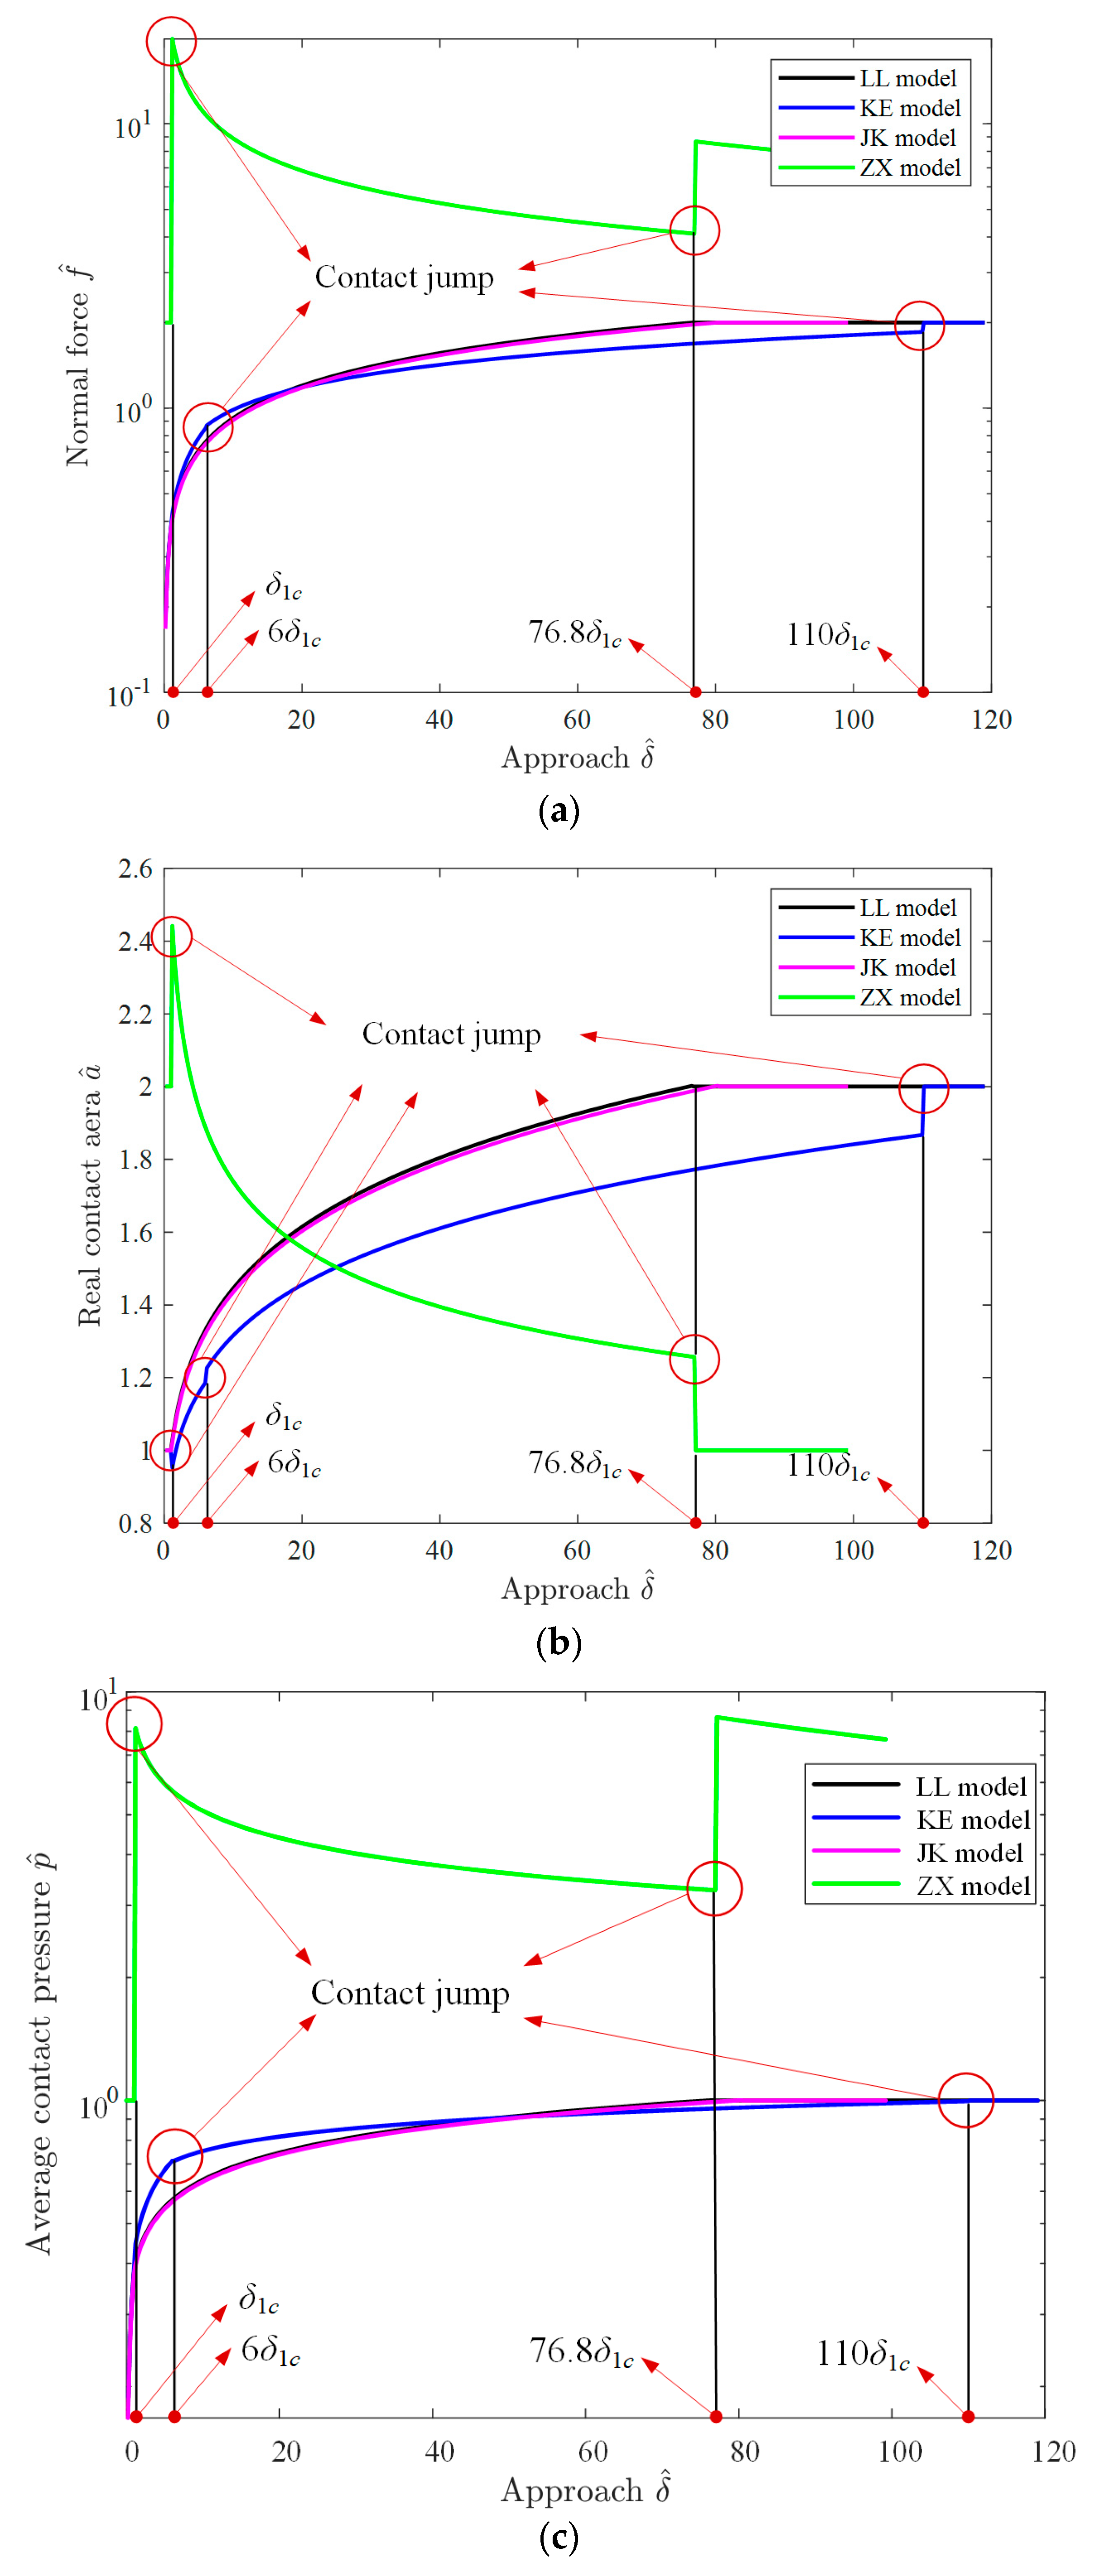
The relationship between the dimensionless load, real contact area, average contact pressure, and applied displacement is shown in Figure 6. The JK model agrees with the LL-2005 model and the KE model. On the contrary, the trend gap of the ZX model is caused by the non-physical phenomenon of the traditional fractal contact model. Moreover, the KE and ZX models demonstrate obvious contact jumping. There are two contact jumping points in Figure 6a, both at the limit boundary of elasticity and full plasticity. However, two or three contact jumping points can be observed in Figure 6b, where the KE model appears in the first elastic limit, first elastic-plastic limit, and second elastic-plastic limit. On the other hand, the ZX model appears at the upper and lower boundaries of the elastic-plastic area. Lastly, since Figure 6c is the same as Figure 6a, it is not described here.
The ZX model is also a brave attempt based on the LL-2005 model. Specifically, there should be no contact jumping phenomena. The fundamental reason is that the ZX model violates Hertz’s theory during single-asperity contact, i.e., the radius of the asperity changes with force, which is also why the early fractal contact model is popular in the contact field. At the same time, the ZX model violates the geometric relationship as follows.
r = 2 R δ   ( δ < < R ) ;
We rewrite Equation (23) as a = 2 π R δ and replace δ with δ1c and δ2c to obtain the following.
a 1 c = 2 π R δ 1 c a 2 c = 2 π R δ 2 c .
The critical truncated area increases with an increase in the applied deformation. This results in unprecedented troubles with the popularization and application of fractal contact theory. The statistical contact model represented by Muser et al. [19] and Greenwood et al. [17] criticizes the fractal contact model. A new fractal contact model (the JK model) with accuracy and reliability is proposed due to many doubts and difficulties. In addition, the real contact numerical solution is also presented and compared with the finite element simulation results in Figure 7.
According to Figure 7, the JK, KE, and LL-2005 models are highly consistent with the finite element results, which proves that the JK model is reliable and characterized by high accuracy. On the other hand, the ZX model error is very large, and there is an obvious contact paradox, which is the shortcoming of most fractal contact models (such as the MB and YK models). The earliest modified contact paradox was provided by Morag and Etsion [35], with Liou et al. [36] expanding their research. However, there are still some shortcomings in the rough surface contact model, especially in the full-scale process, while the mechanical model needs to be improved. Thus, while establishing a more comprehensive mechanical model, the JK model further considers the asperity–substrate interaction and the influence of the dimensionless material coefficient and asperity geometry. The advantages of the JK model are more evident in surface heat treatment or coating.
A comparison between the JK model and the finite element results for an asperity with different radii and dimensionless material coefficients is shown in Table 1. Parameter R varies from 15 to 80 μm, and ha varies from 100 to 6000 nm, corresponding to the extremely smooth surface to the rough surface. A high value of the geometric coefficient ξ represents the smooth nanoscale surface, while the low value of ξ represents the general rough surface, ranging from 106.24 mm−0.5 to 13.96 mm−0.5 (359.7 m−0.5–441.4 m−0.5).
When subjected to the external load, the asperity deformation must undergo a process of elasticity–elastic plasticity–full plasticity. The contact load and the actual contact area are significantly affected by the geometric size of an asperity, i.e., both increased with the geometric size. However, they are hardly affected by the elastic modulus on the rough surface. The reason is that the asperity and substrate yield plastically when the applied displacement is provided.
Some differences can be observed by comparing the two numerical results due to two reasons. First, the material parameter settings in the finite element analysis are simplified, and only the bilinear elastic-plastic material constitutive equation (σs = 355 MPa, kg = 0 MPa) is considered. Second, the critical deformation of the JK model is affected by the coupling of the soft material substrate, thereby affecting the critical truncated area. Compared with the finite element method, the maximum error of the numerical results of this model is approximately 10%, demonstrating the JK model’s accuracy. The advantages of the JK model are demonstrated by comparing it with the LL-2005 and KE models. Thus, the details are omitted here for simplicity purposes.
Note: In 12 groups of cases, especially when the material properties of the asperity and substrate are different, if the materials yield, E* in equations is referred to [47]. The treatment of the equivalent elastic modulus is simplified, similar to the contact mechanics of surface coating materials, which may be an important reason for the obtained error.

3. Contact Model of Rough Surfaces (JK Model with Rough Surfaces)

The contact modeling process of single asperity is analyzed in detail in Section 2. Mapping the mechanical properties of a single asperity to the nominally smooth joint surface requires introducing the “island distribution” function that approximately describes the truncated area distribution of asperities on the rough surface in contact. Then, the complete contact characteristic parameters on the nominal surface can be obtained by integration, including the real contact area, normal contact load, normal contact stiffness, tangential contact stiffness, normal contact damping, and tangential contact damping.
The proposed model is really difficult for engineers to apply in practice. In the future, we will start to develop interface application tools based on the ANSYS platform, which can be applied to a large number of CNC machine tools with joint surfaces, so as to complete the dynamic response research of the whole machine design.

3.1. Island Distribution Function

Mandelbrot used a plane to truncate the islands and found that the number of islands N with > a′ followed the power law [50]. Subsequently, Majumdar et al. introduced this phenomenon to rough fractal surfaces, and creatively proposed the fractal contact model, i.e., the MB model [21]. Then, considering that the contact area is affected by an increase in the contact temperature, Wang et al. [22] introduced the domain expansion coefficient ψ and revised the island distribution function, which was written as follows:
n ( a ) = D 1 2 ψ 3 D 2 a l D 1 2 a ( D + 1 ) 2
where the maximum truncated area of asperities al′ equals al′ = πra2; the domain expansion coefficient ψ is shown in Reference [22].
It should be noted that obtaining the maximum truncated radius ra of asperities is very important.
When the rough surface is determined (the fractal parameters are known), the change in al′ affects a1c′ and a2c′ in Equations (10) and (11). According to Figure 8, the contact between rough surfaces is characterized by a lengthy scale replacement in the range of the full-scale length al′. The range between 0 and al1′ is called the small-scale stage. As the load increases, the asperity undergoes elastic–elastoplastic–full plastic deformation, i.e., full plastic behavior. The range between al1′ and al2′ is called the meso-scale stage. Many asperities undergo full plastic behavior in the small-scale stag and embrace larger asperities. Then, asperities with a rough surface undergo elastic and elastoplastic deformation, i.e., elastoplastic behavior. The range between al2′ and al3′ is called the large-scale stage, where asperities undergo elastic deformation, i.e., elastic behavior.
When al1′ = a2c′, it can be known from Equation (11).
a l 1 = 76.8 ( K H ) 2 2 ( 9 2 D ) π ( D 4 ) E * 2 G 2 ( D 2 ) ln γ 1 / ( 2 D )
When al2′ = a1c′, it can be known from Equation (10).
a l 2 = 76.8 1 / ( D 2 ) a l 1
Moreover, al3′ can be expressed as follows:
a l 3 = A 0 D 1 2 ( 3 D ) ψ ( 3 D ) / 2
where A0 is the nominal contact area A0 = L02 and L0 is the sampling scanning length.
In Figure 9, the truncated area al′ is positively correlated with G and negatively correlated with D. When D and G are in a certain interval, al2′ is already higher than al3′. At this time, the upper integral limit is al3′, regardless of the load change. Therefore, the asperity deformation process of the complete scale on rough surfaces is closely related to the surface properties. A complete contact model of the joint surface in the full-scale process is provided by assuming that al1′, al2′, and al3′ satisfy the increasing relationship.

3.2. Real Contact Area

If 0 < a′ < a1c′, the elastic contact area of rough surfaces, Are, can be obtained by integrating the product of Equations (25) and (13) as follows.
A r e = 0 a 1 c a e n ( a ) d a = 1.06 λ ( D 1 ) 2 ( 3 D ) ψ 3 D 2 a l D 1 2 a 1 c 3 D 2
If a1c′ < a′ < a2c′, the elastic-plastic contact area of rough surfaces, Arep, is as follows.
A r e p = a 1 c a 2 c a e p n ( a ) d a =   H g 1 ( D 1 ) 2 ( 1 . 66 0 . 5 D ) ψ 3 D 2 a l 0.34 ( D 1 ) a 2 c ( 1.66 0.5 D ) a 1 c ( 1.66 0.5 D )
If a2c′ < a′ < al′, the plastic contact area of rough surfaces, Arp, is as follows.
A r p = a 2 c a l a p n ( a ) d a = 1 . 06 λ ( D 1 ) 3 D ψ 3 D 2 a l 0.5 ( D 1 ) a l ( 1.5 0.5 D ) a 2 c ( 1.5 0.5 D )
1. In the small-scale stage (a2c′ ≤ al1′), the real contact area Ars1 is as follows.
A r   s 1 = A re       s 1 0 < a < a 1 c A re       s 1 + A rep     s 1         a 1 c < a < a 2 c A re       s 1 + A rep     s 1 + A rp       s 1   a 2 c < a < a l 1
2. In the meso-scale stage (a1c′ ≤ al2′), the real contact area Ars2 is as follows.
A r   s 2 = A re       s 2     a l 1 < a < a 1 c A r e       s 2 + A r e p     s 2             a 1 c < a < a 2 c
3. In the large-scale stage (a1c′ > al2′), the real contact area Ars3 is as follows.
A r     s 3 = A r e       s 3
In the full-scale range, the real contact area of rough surfaces Ar can be expressed as follows.
A r = A r     s 1 + A r     s 2 + A r     s 3
It should be noted that Equation (35) is determined by al′, a1c′, and a2c′. The asperities with rough surfaces must undergo elastic, elastic-plastic, and full plastic deformation under different small scales of al′. Many asperities embrace larger asperities with an increase in the value of al′. Under the corresponding scale, asperities with rough surfaces undergo elastic and elastic-plastic deformation. With the further increase in al′ (limit: <30% of the nominal contact area), asperities with rough surfaces undergo elastic deformation in the large-scale stage. This observation is consistent with Gao’s et al. research [30], i.e., asperities exhibit fully plastic behavior on a small scale, elastic-plastic behavior on the meso-scale scale, and elastic behavior on a large scale. In addition, the upper and lower boundaries of piecewise functions may not be monotonic and continuous due to scale jumps between different scale stages. Therefore, continuous and strict monotony must be ensured in the numerical solution.

3.3. Normal Contact Load

1. In the small-scale stage (a2c′ ≤ al1′), the normal contact load Fs1 is as follows.
F s 1 = F e     s 1 0 < a < a 1 c F e     s 1 + F e p s 1             a 1 c < a < a 2 c F e     s 1 + F e p s 1 + F p     s 1         a 2 c < a < a l 1
2. In the meso-scale stage (a1c′ ≤ al2′), the normal contact load Fs2 is as follows.
F s 2 = F e     s 2     a l 1 < a < a 1 c F e     s 2 + F e p s 2       a 1 c < a < a 2 c
3. In the large-scale stage (a1c′ > al2′), the normal contact load Fs3 is as follows.
F s 3 = F e     s 3
Thus, in the full-scale range, the normal contact load of rough surfaces F is as follows.
F = F s 1 + F s 2 + F s 3

3.4. Normal Contact Stiffness

1. In the small-scale stage (a2c′ ≤ al1′), the normal contact stiffness Kns1 is as follows.
K n     s 1 = K n e       s 1 0 < a < a 1 c K n e       s 1 + K n e p   s 1 a 1 c < a < a 2 c K n e       s 1 + K n e p   s 1 + K n p       s 1             a 2 c < a < a l 1
2. In the meso-scale stage (a1c′ ≤ al2′), the normal contact stiffness Kn s2 is as follows.
K n     s 2 = K n e       s 2                   a l 1 < a < a 1 c K n e       s 2 + K n e p   s 2 a 1 c < a < a 2 c  
3. In the large-scale stage (a1c′ > al2′), the normal contact stiffness Kns3 is as follows.
K n   s 3 = K n e       s 3
Then, in the full-scale range, the normal contact stiffness of rough surfaces Kn is as follows.
K n = K n   s 1 + K n   s 2 + K n   s 3

3.5. Tangential Contact Stiffness

1. In the small-scale stage (a2c′ ≤ al1′), the tangential contact stiffness Kts1 is as follows.
K t   s 1 = K t e     s 1 0 < a < a 1 c K t e     s 1 + K t e p   s 1 a 1 c < a < a 2 c K t e     s 1 + K t e p   s 1 + K t p     s 1       a 2 c < a < a l 1
2. In the meso-scale stage (a1c′ ≤ al2′), the tangential contact stiffness Kts2 is as follows.
K t   s 2 = K t e     s 2 a l 1 < a < a 1 c K t e     s 2 + K t e p   s 2   a 1 c < a < a 2 c
3. In the large-scale stage (a1c′ > al2′), the tangential contact stiffness Kts3 is as follows.
K t   s 3 = K t e     s 3
Therefore, in the full-scale range, the tangential contact stiffness of rough surfaces Kt is as follows.
K t = K t   s 1 + K t   s 2 + K t   s 3

3.6. Normal Contact Damping

1. In the small-scale stage (a2c′ ≤ al1′), the normal strain energy Wns1 is as follows.
W n   s 1 = W n e     s 1         0 < a < a 1 c W n e     s 1 + W n e p   s 1       a 1 c < a < a 2 c W n e     s 1 + W n e p   s 1 + W n p     s 1           a 2 c < a < a l 1
The normal damping loss factor, ηns1, can be expressed based on the energy dissipation principle.
η n   s 1 = 0   0 < a < a 1 c α W n e p   s 1 W n e     s 1 + ( 1 α ) W n e p   s 1 a 1 c < a < a 2 c α W n e p   s 1 + W n p     s 1 W n e     s 1 + ( 1 α ) W n e p   s 1 a 2 c < a < a l 1
2. In the meso-scale stage (a1c′ ≤ al2′), the normal strain energy Wns2 is as follows.
W n   s 2 = W n e     s 2                     a l 1 < a < a 1 c W n e     s 2 + W n e p   s 2 a 1 c < a < a 2 c
The normal damping loss factor ηns2 is as follows.
η n   s 2 = 0           a l 1 < a < a 1 c α W n e p   s 2 W n e     s 2 + ( 1 α ) W n e p   s 2 a 1 c < a < a 2 c
3. In the large-scale stage (a1c′ > al2′), the normal strain energy Wn s3 is as follows.
W n   s 3 = W n e     s 3
The normal damping loss factor ηns3 is as follows.
η n   s 3 = 0
The normal strain energy Wn and normal damping loss factor ηn of rough surfaces in the full-scale range can be, respectively, expressed as Equations (54) and (55):
W n = W n   s 1 + W n   s 2 + W n   s 3
η n = η n   s 1 + η n   s 2 + η n   s 3
where α is the elastic-plastic load index under a loading–unloading cycle within the range of 0 ≤ α ≤ 1. The lower and upper limits correspond to pure elastic and full plastic load conditions, respectively. Details can be found in Etsion 2005 [51].
Hence, the normal contact damping of rough surfaces Cn can be expressed as follows:
C n = η n M K n
where M is the structure’s mass.

3.7. Tangential Contact Damping

1. In the small-scale stage (a2c′ ≤ al1′), the tangential strain energy Wts1 is as follows.
W t   s 1 = W t e     s 1 0 < a < a 1 c W t e     s 1 + W t e p   s 1         a 1 c < a < a 2 c W t e     s 1 + W t e p   s 1 + W t p     s 1           a 2 c < a < a l 1
Similarly, the tangential damping loss factor ηts1 is as follows.
η t   s 1 = 0   0 < a < a 1 c α W t e p   s 1 W t e     s 1 + ( 1 α ) W t e p   s 1 a 1 c < a < a 2 c α W t e p   s 1 + W t p     s 1 W t e     s 1 + ( 1 α ) W t e p s 1   a 2 c < a < a l 1
2. In the meso-scale stage (a1c′ ≤ al2′), the tangential strain energy Wts2 is as follows.
W t   s 2 = W t e     s 2   a l 1 < a < a 1 c W t e     s 2 + W t e p   s 2 a 1 c < a < a 2 c
The tangential damping loss factor ηts2 is as follows.
η t   s 2 = 0             a l 1 < a < a 1 c α W t e p   s 2 W t e     s 2 + ( 1 α ) W t e p   s 2   a 1 c < a < a 2 c
3. In the large-scale stage (a1c′ > al2′), the tangential strain energy Wts3 is as follows.
W t   s 3 = W t e     s 3
The tangential damping loss factor ηts3 is as follows.
η t   s 3 = 0
In the full-scale range, the tangential strain energy Wt and tangential damping loss factor ηt of rough surfaces can be, respectively, expressed by Equations (63) and (64).
W t = W t   s 1 + W t   s 2 + W t   s 3
η t = η t   s 1 + η t   s 2 + η t   s 3
It should be noted that the elastic-plastic load index α in Equations (55) and (64) is assumed to be the same. Therefore, a detailed study on it was not yet conducted. The index α can be simplified to a constant value (assuming α = 0.2) or satisfy the linear distribution between [0, 1] (related to the contact deformation state).
Thus, the tangential contact damping, Ct, can be expressed as follows.
C t = η t M K t
In conclusion, it can be seen that fractal interface contact mechanics is the result of small-scale, meso-scale, and large-scale comprehensive action, which has a clear and reasonable physical basis. Furthermore, the length scale significantly affects the deformation of asperities, which is the key factor in rough surfaces. Important defects of the traditional fractal theory, such as asperity deformation discontinuity and cross-scale jump, are fundamentally solved in this paper according to proper theoretical derivation and analysis. The proposed model has high accuracy and provides theoretical support for engineering applications.
Additional explanation and the detailed derivation process can be found in the Appendices A–E.

3.8. Numerical Analysis of JK Model on Rough Surfaces

The following simulated physical parameters are set for the analysis: the elastic modulus E = 2 × 10⁵ Mpa, Poisson’s ratio v = 0.3, structural mass M = 1 kg, static friction coefficient μ = 0.25, yield strength σs = 355 Mpa, and sampling scanning length L0 = 4 mm. The dimensionless Equations (35), (39), (43), (47), (56) and (65) are adopted as follows.
F * = F E * A 0 ,   A r * = A r A 0 ,   K n * = K n E * A 0 ,   K t * = K t E * A 0 C n * = C n A 0   0 . 25 M E * ,   C t * = C t A 0   0 . 25 M E *
In engineering surfaces, Jiang et al. [46] have shown that the fractal dimension D is in the range of 2.3–2.6, and the fractal roughness G is in the order of magnitude of 10−12–10−10 m. The influence of fractal parameters on the change law of the real contact area is investigated for a given load determined by the maximum truncated area al′, as shown in Figure 10. The curve of the normal load–contact area agrees with a piecewise linear relationship in different scale stages. When the fractal roughness G is known, the real contact area increases with the fractal dimension D. In addition, the curve slope significantly changes in the meso-scale and large-scale stages, indicating that the elastic action dominates under a certain load in finer surfaces. On the contrary, when the fractal dimension D is known, the fractal roughness G negatively correlates with the contact area in a certain load range. The result is consistent with the common sense of physics because the surface quality is positively correlated with the fractal dimension and negatively correlated with the fractal roughness.
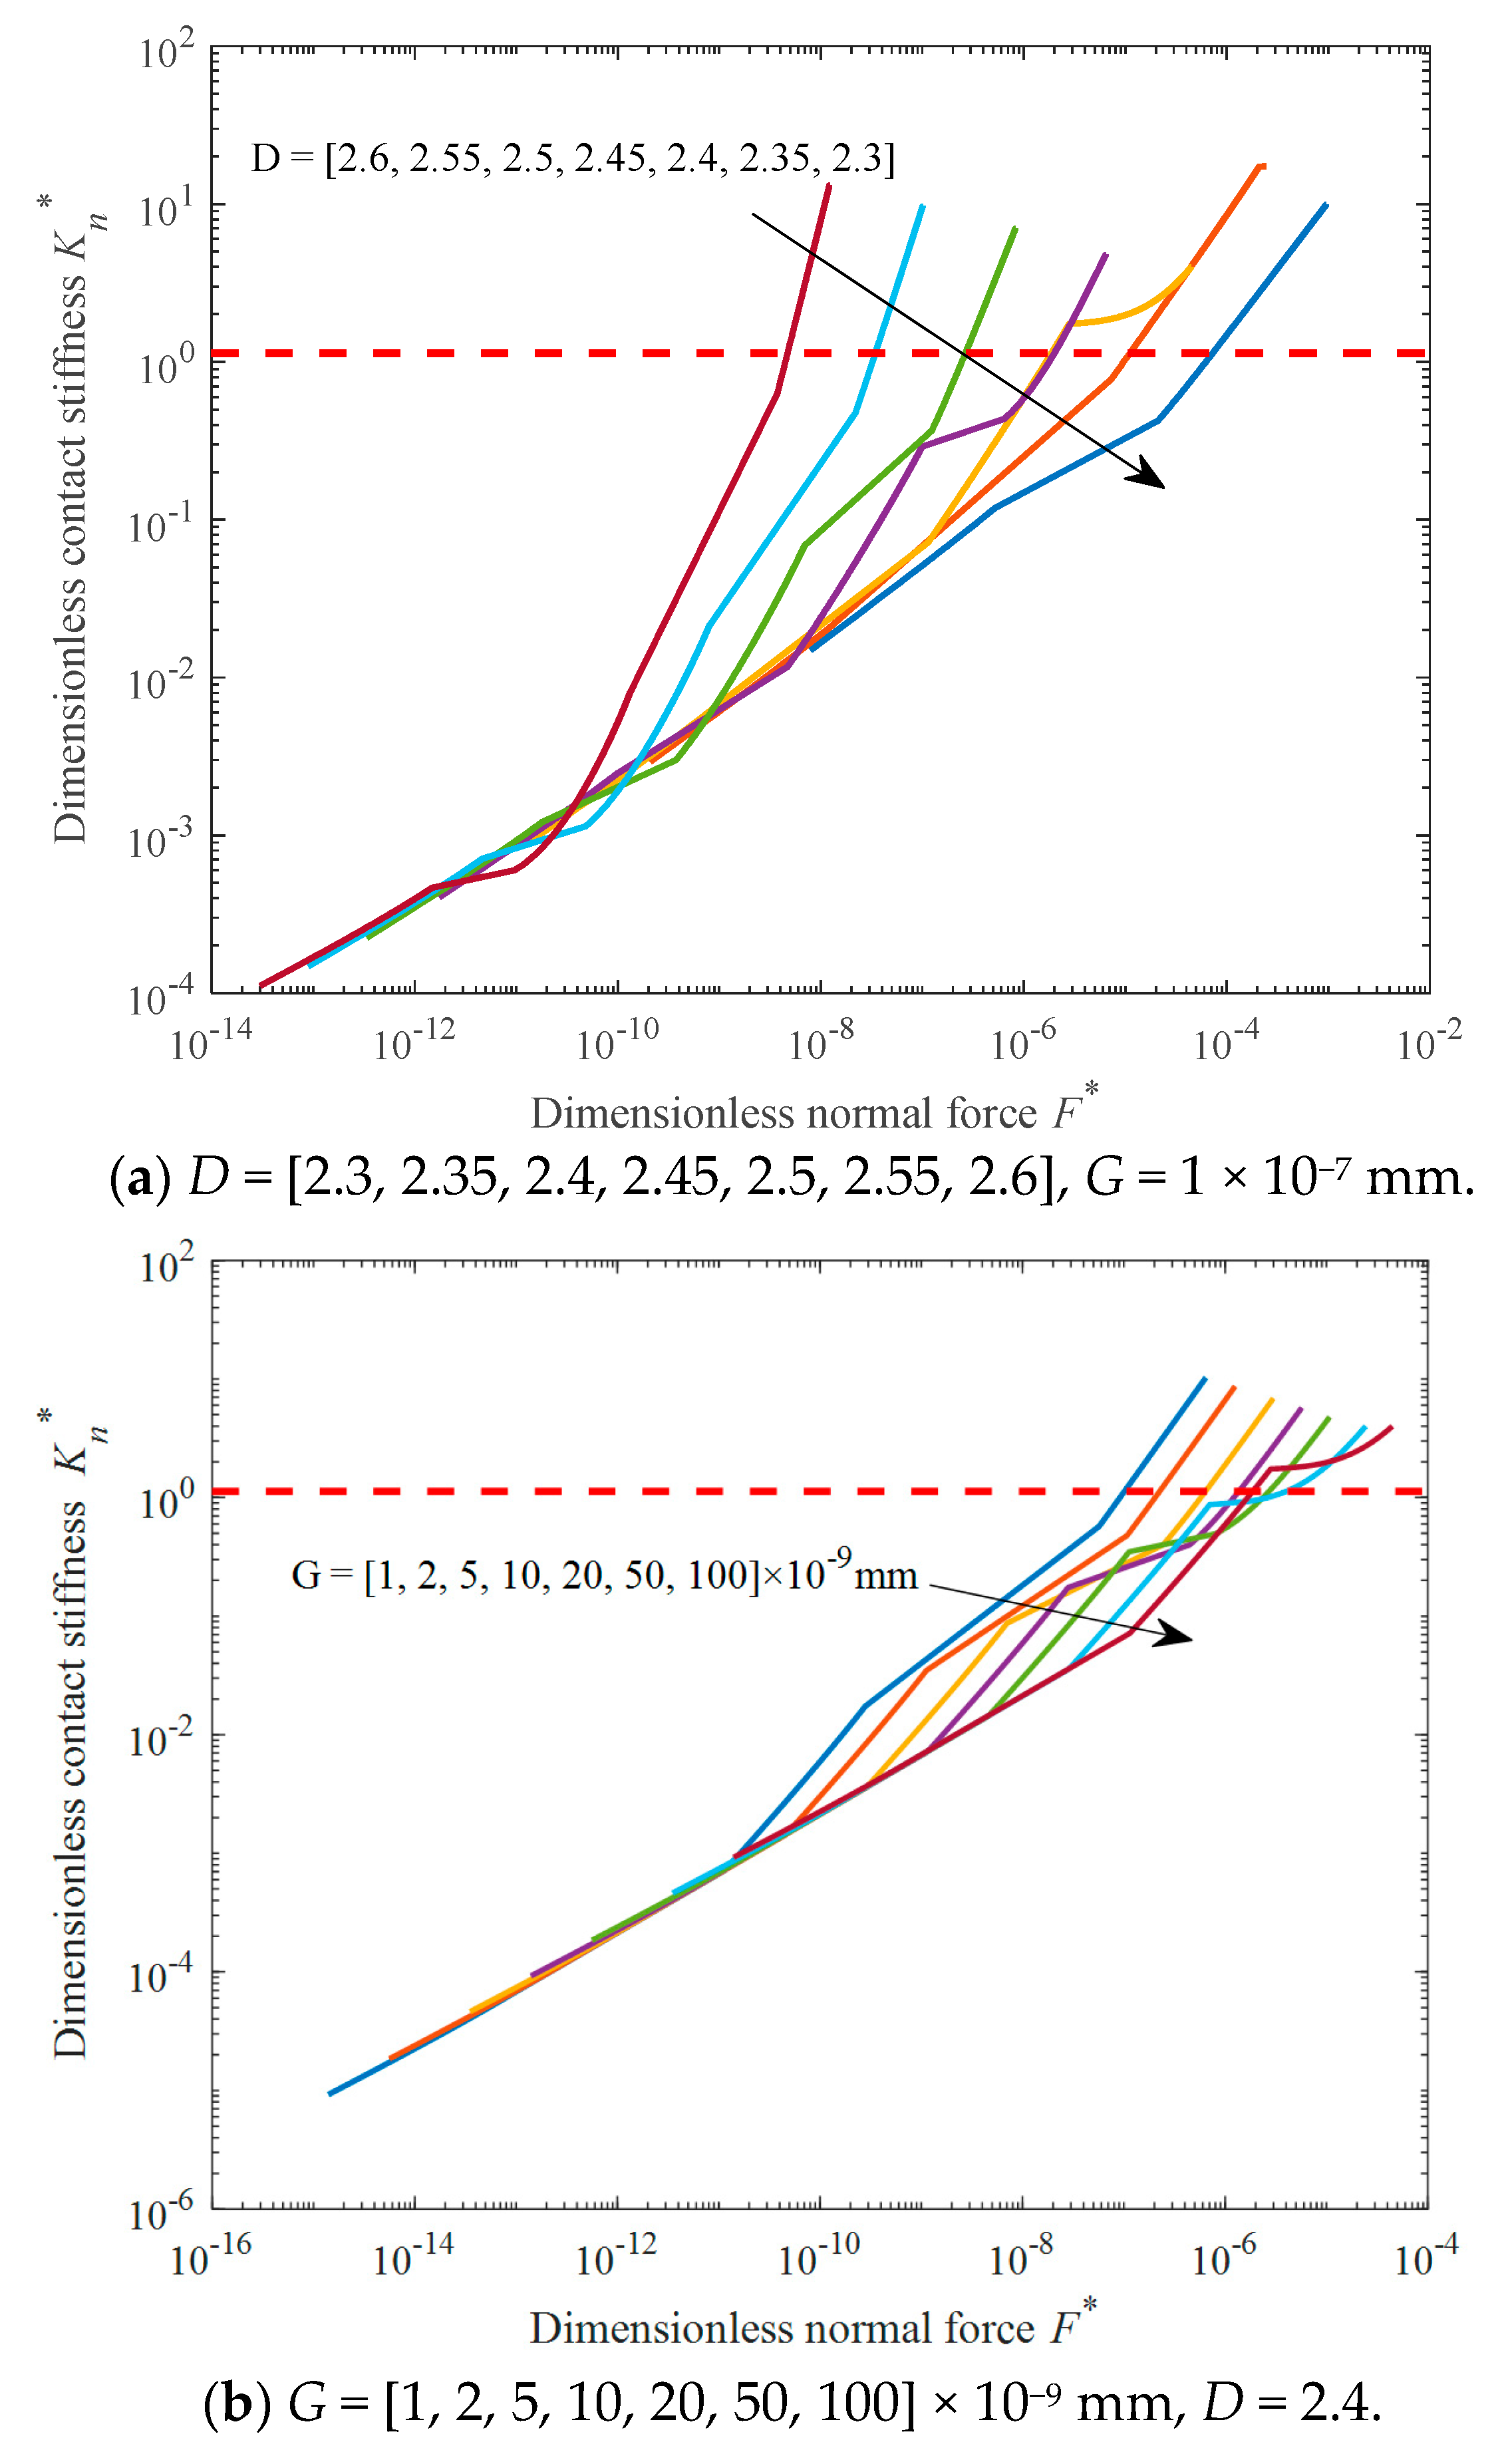
In Figure 11, the load–stiffness curve also conforms to the piecewise linear relationship at different scale stages, consistent with Persson’s research [52]. The contact stiffness is often determined by the longest wavelength roughness, which may be elastic rather than plastic deformation. Furthermore, the larger the fractal dimension D, the smaller the fractal roughness G, i.e., the finer and smoother the surface, and the greater the contact stiffness. In addition, if the contact stiffness is greater than the material’s bulk stiffness, the coefficient is related to the geometry when the load reaches a certain value ( K b = 1.129 E * A 0 [53], as shown in the red line in the figure). Then, the contact stiffness obtained by the proposed model has no practical numerical value. The tangential contact stiffness is similar.
Mindlin provided the stiffness ratio for the axisymmetric Hertz contact as follows [54].
K t K n = 2 ( 1 v ) 2 v ,
According to Equation (67), the tangential–normal stiffness ratio is a function of Poisson’s ratio v. The stiffness ratio is constant for a predetermined material. Putignano et al. [55] further proved that the stiffness ratio depends on the contact zone for all possible contact areas in half space, providing a stiffness ratio limit.
1 v K t K n 1
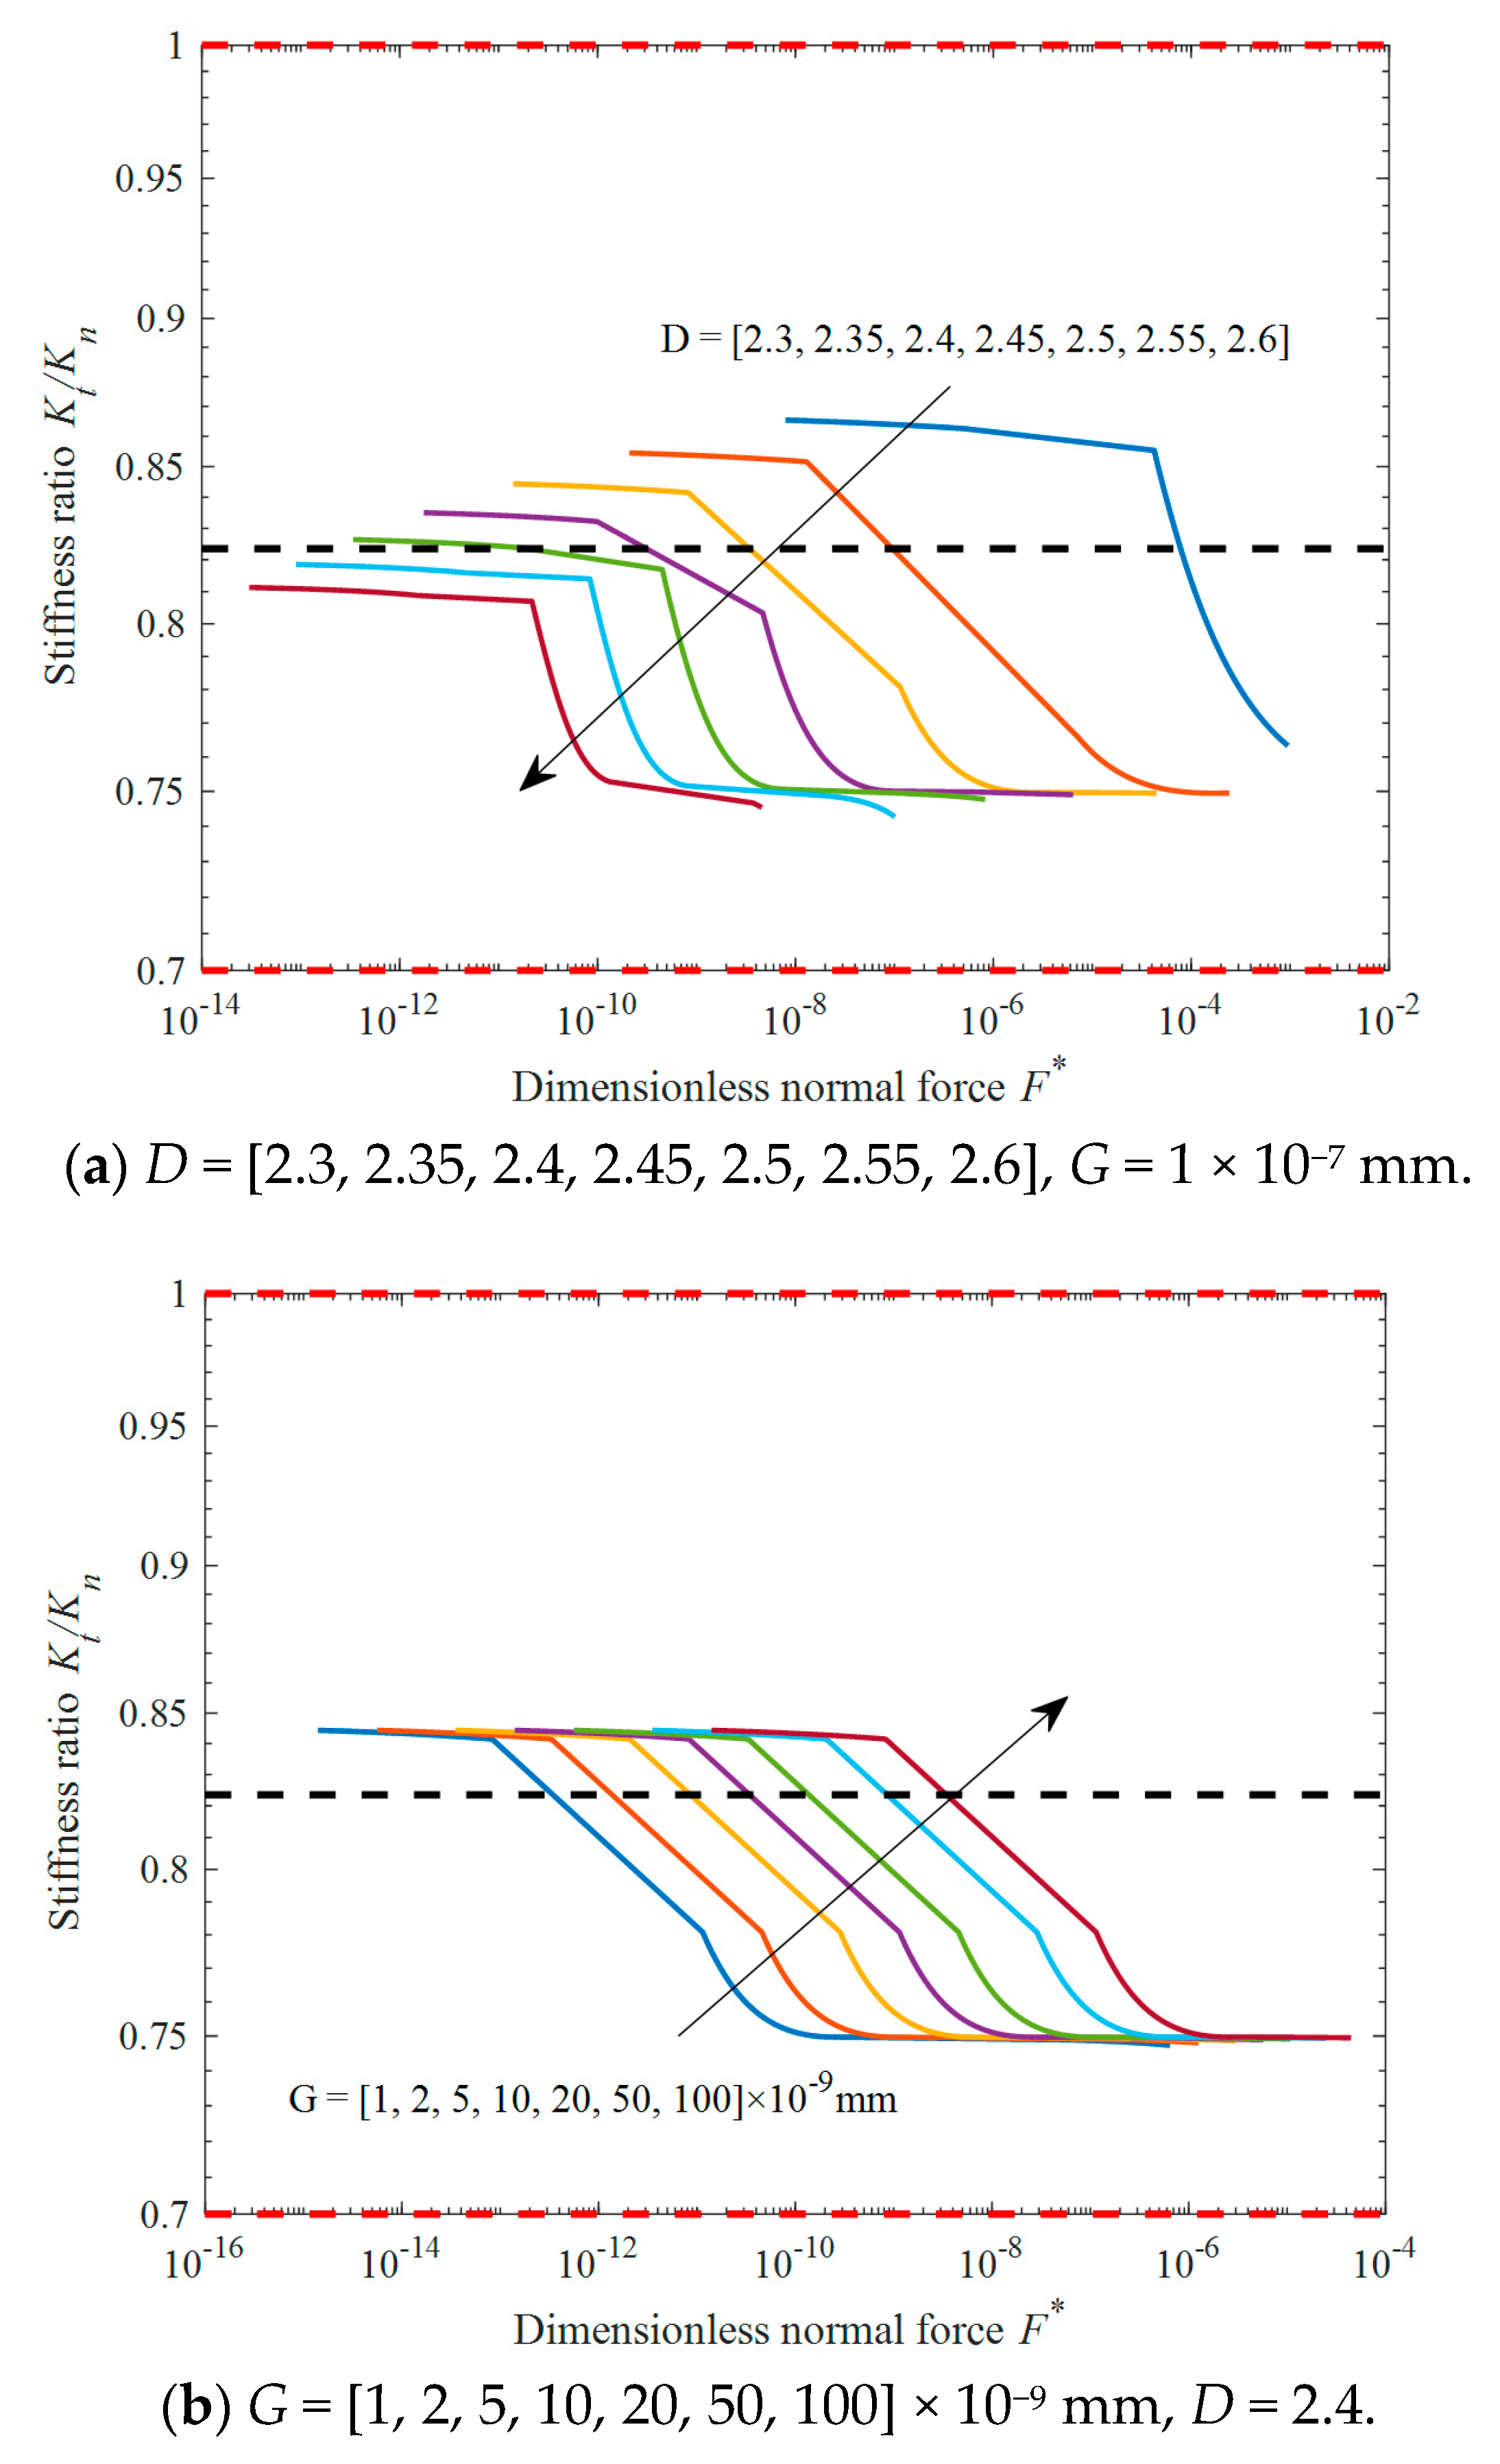
As shown in Figure 12, the stiffness ratio curve is similar to a Z shape. At different scales, the stiffness ratio varies with the load. In small-scale and large-scale stages, the stiffness ratio remains approximately constant. The stiffness ratio significantly decreases in the meso-scale stage. The value ratio accords with Equation (68), while Mindlin’s ratio is the upper and lower limits’ average. In addition, the stiffness ratio is negatively correlated with fractal dimension D and positively correlated with fractal roughness G. Compared with fractal roughness, the fractal dimension is the key parameter affecting the stiffness ratio.
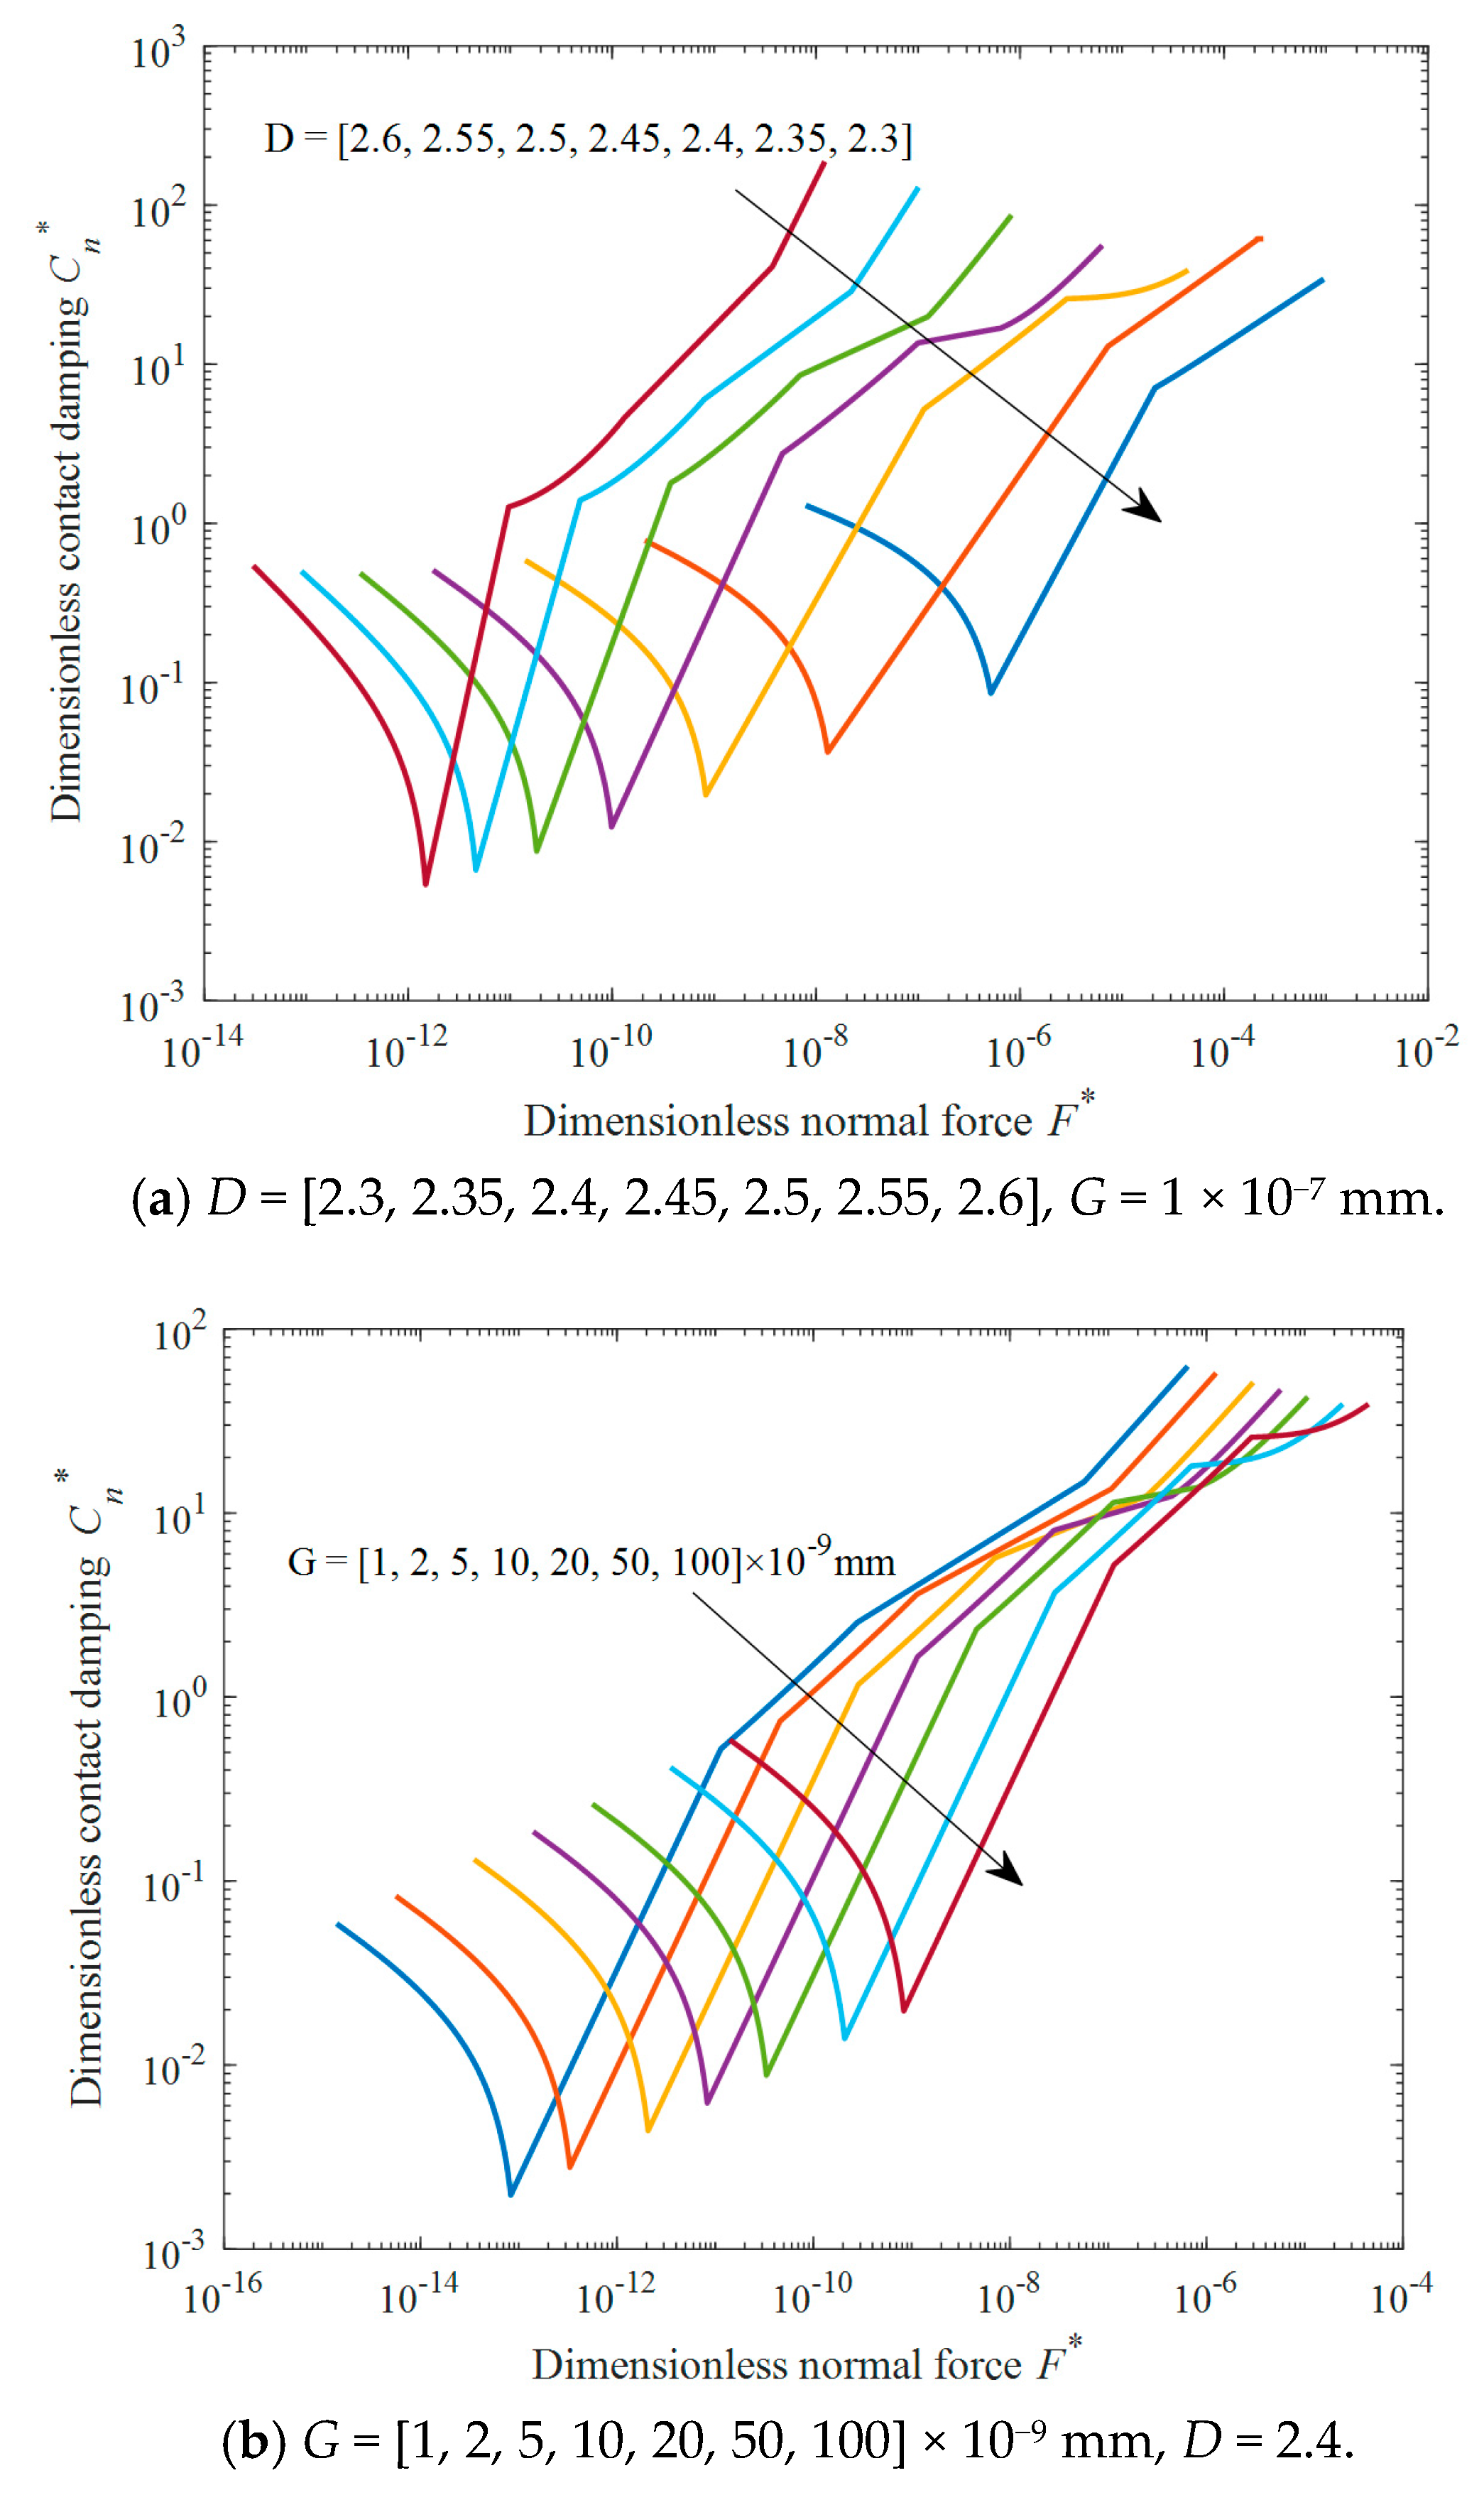
The dimensionless contact damping–load curve is shown in Figure 13. On a small scale, the contact damping decreases with an increase in load. In meso-scale and large-scale stages, the contact damping increases with the load. This observation is consistent with Shi et al.’s research [56], proving that contact damping decreases with an increase in contact load under light load. The main reason is that the asperity has undergone complete mechanical deformation, and the damping loss factor decreases with an increase in the load, as shown in Equation (55).
Furthermore, the elastic-plastic load index is set as a constant (α = 0.2), which affects the result. However, in the meso-scale and large-scale stages, the damping loss factor shown by Equations (51) and (53) remains unchanged. Therefore, the contact damping is proportional to the mean root square of stiffness and increases monotonically with the load. In addition, when the fractal roughness G is determined, the contact damping decreases with an increase in the fractal dimension D in the small-scale stage. In the meso-scale and large-scale stages, the contact damping increases with the fractal dimension D. Once the fractal dimension D is determined, the contact damping increases with the fractal roughness G in the small-scale interval. An opposite effect occurs in the meso-scale and large-scale stages.

4. Analysis and Verification

Natural frequency and mode shape are important parameters in dynamic structural analysis. The dynamic performance of a discontinuous structure is determined by the contact state of the bolted joint surface. First, the surface topography parameters (fractal parameters D and G) can be estimated by the FPENN method used in previous research [46]. These parameters can be introduced into the full-scale and high-precision contact analytical model of rough surfaces. Then, the finite element method is employed to obtain the nodal forces of the nominal smooth surface and fit the nodal contact stiffness and damping values of the joint surface. Finally, the experimental solution is compared against the theoretical solution to complete the mechanical vibration analysis of the bolted structure.
The proposed contact model does not consider the influence of temperature, humidity, and corrosion. These complex environmental factors are coupled with each other, and their influence on interface contact mechanics is uncertain. Therefore, this study will not consider them for the time being.

4.1. Theoretical Analysis

A set of T-type specimens is designed, as shown in Figure 14. The material is 45# steel, whose material properties are shown in Table 2. The joint surface is milled with the nominal roughness Ra = 0.8 μm. Scanning blocks with a size of 20 × 20 × 30 mm are processed in the same way to obtain the fractal parameters of the surface morphology. In Figure 15, the measured surface is an area of 4 × 4 mm. Firstly, the data of this area are obtained by the optical profiler ST400. Then, the fractal parameters Ds = 1.39 and G = 1.53 × 10⁻¹⁰ m are identified by the FPENN method. Thus, the fractal dimension of the measured surface D = Ds + 1 = 2.39.
Firstly, with the help of the ANSYS (version R19.2), the force distribution of the contact nodes on the nominal smooth surface is obtained using static analysis, as shown in Figure 16. Then, each node force is imported into the MATLAB (version R2018) program. The normal and tangential contact stiffness and the normal and tangential contact damping of each node are obtained, respectively, by fitting the load–stiffness curve and the load–damping curve. Thirdly, the Matrix27 element is used to establish the stiffness and damping of the node–node contact. Finally, the frequency and vibration modes of the bolted structure are obtained by modal analysis.
It should be noted that the mesh nodes of the joint surface should correspond one by one during pre-processing. In addition, all nodes need to be renumbered by HYPERMESH (version R2017) to add the stiffness-damping element (Matrix27).

4.2. Experimental Validation

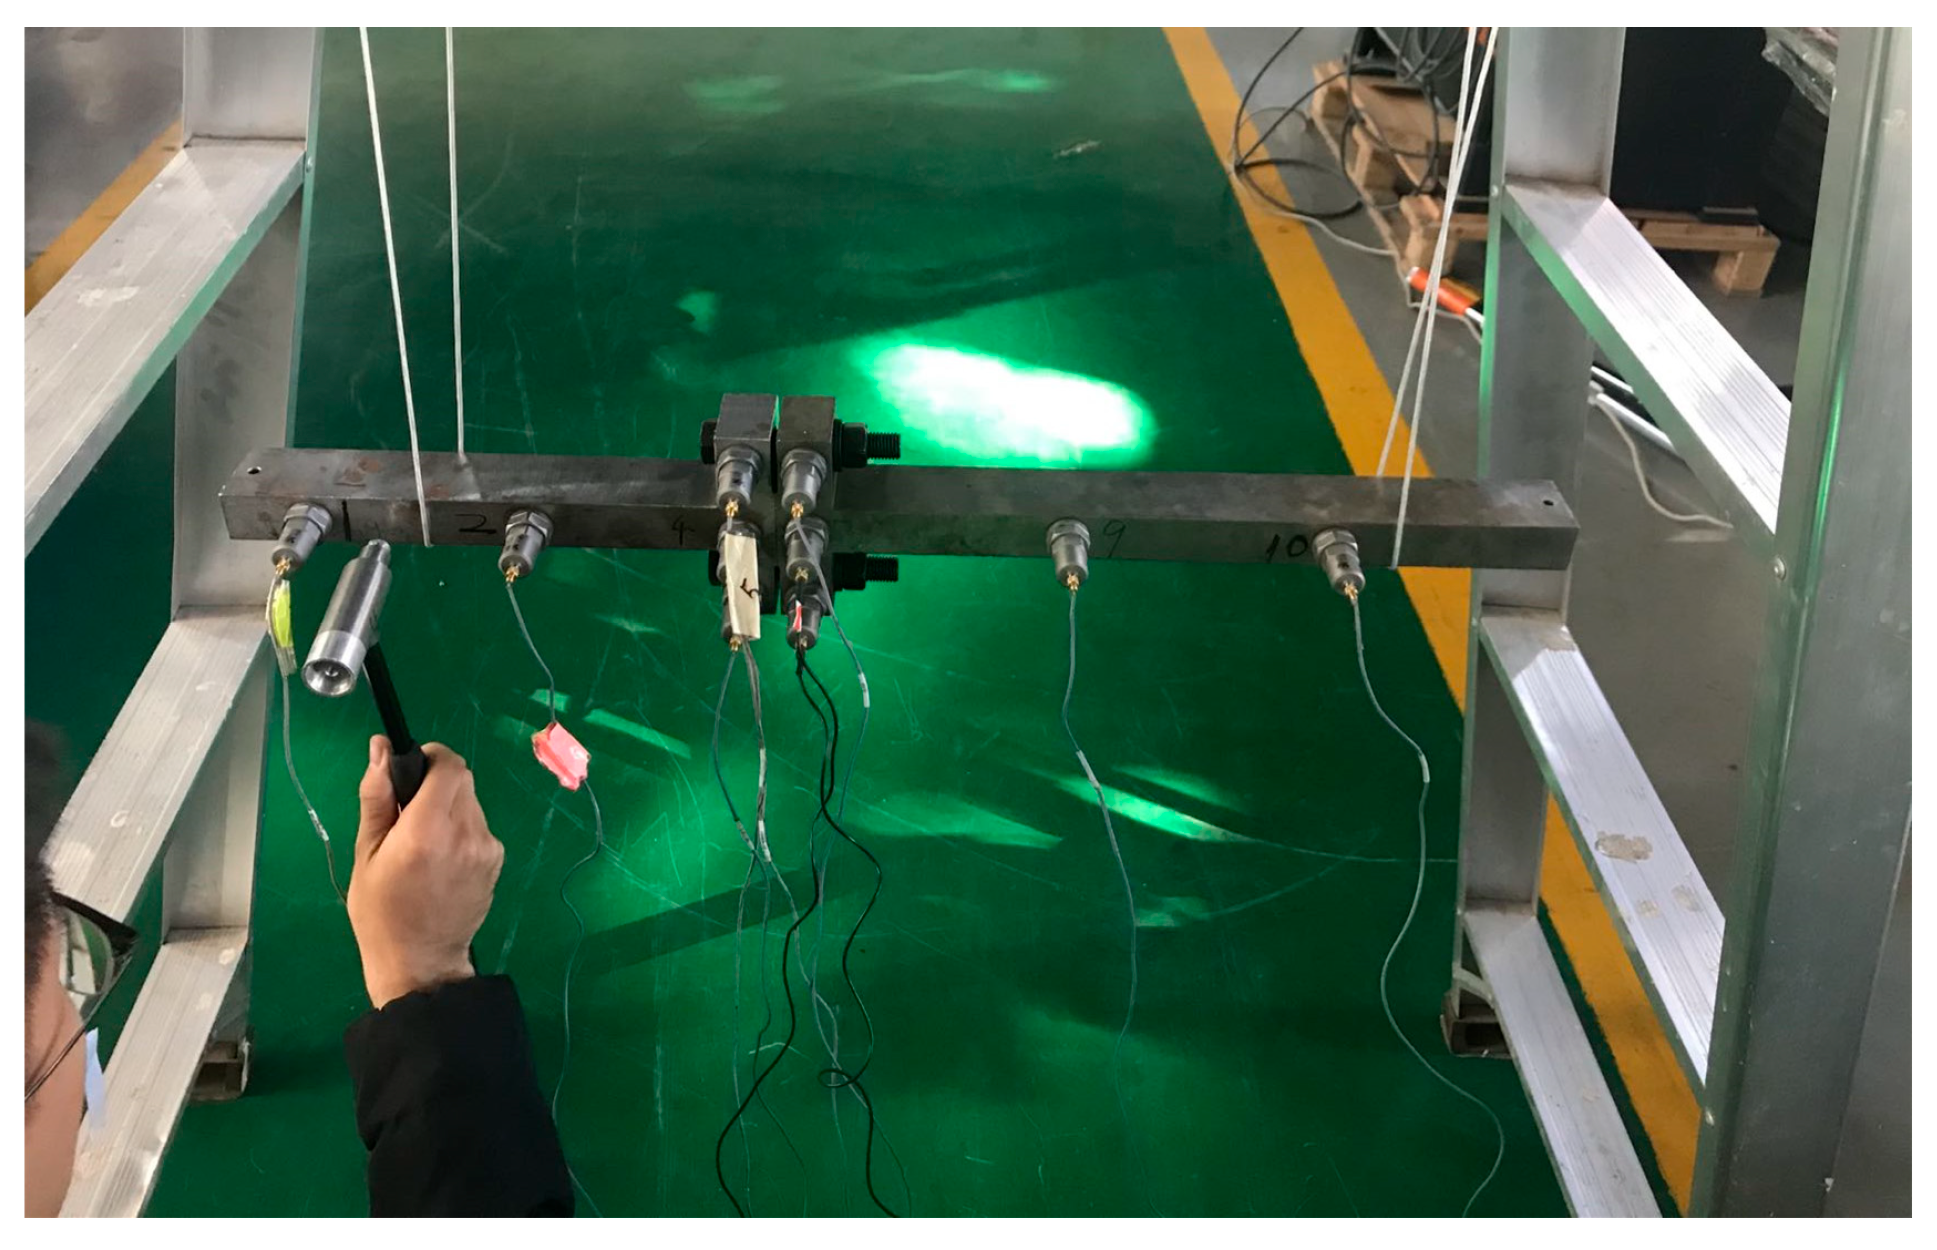
The test device includes the acceleration sensor, force hammer, and LMS vibration test analyzer. The T-type specimen is suspended on the elastic rope, and the PCB acceleration sensor is arranged on the structural surface (number 10 in Figure 17). Then, the force signal is applied by the force hammer to induce vibration. The LMS vibration test analyzer collects the vibration signal. Finally, the frequency and mode shapes of each structure order are obtained.
During bolt pre-tightening, the input torque is slowly applied by a digital torque wrench. The pre-tightening forces are obtained via ultrasonic detection technology as 4 kN, 8 kN, and 12 kN. The hammering test is repeated five times to avoid random operation errors. Note that the modal test is carried out indoors and its duration is limited, so the influence of temperature, humidity, and external interference can be ignored.

4.3. Comparison of the Results

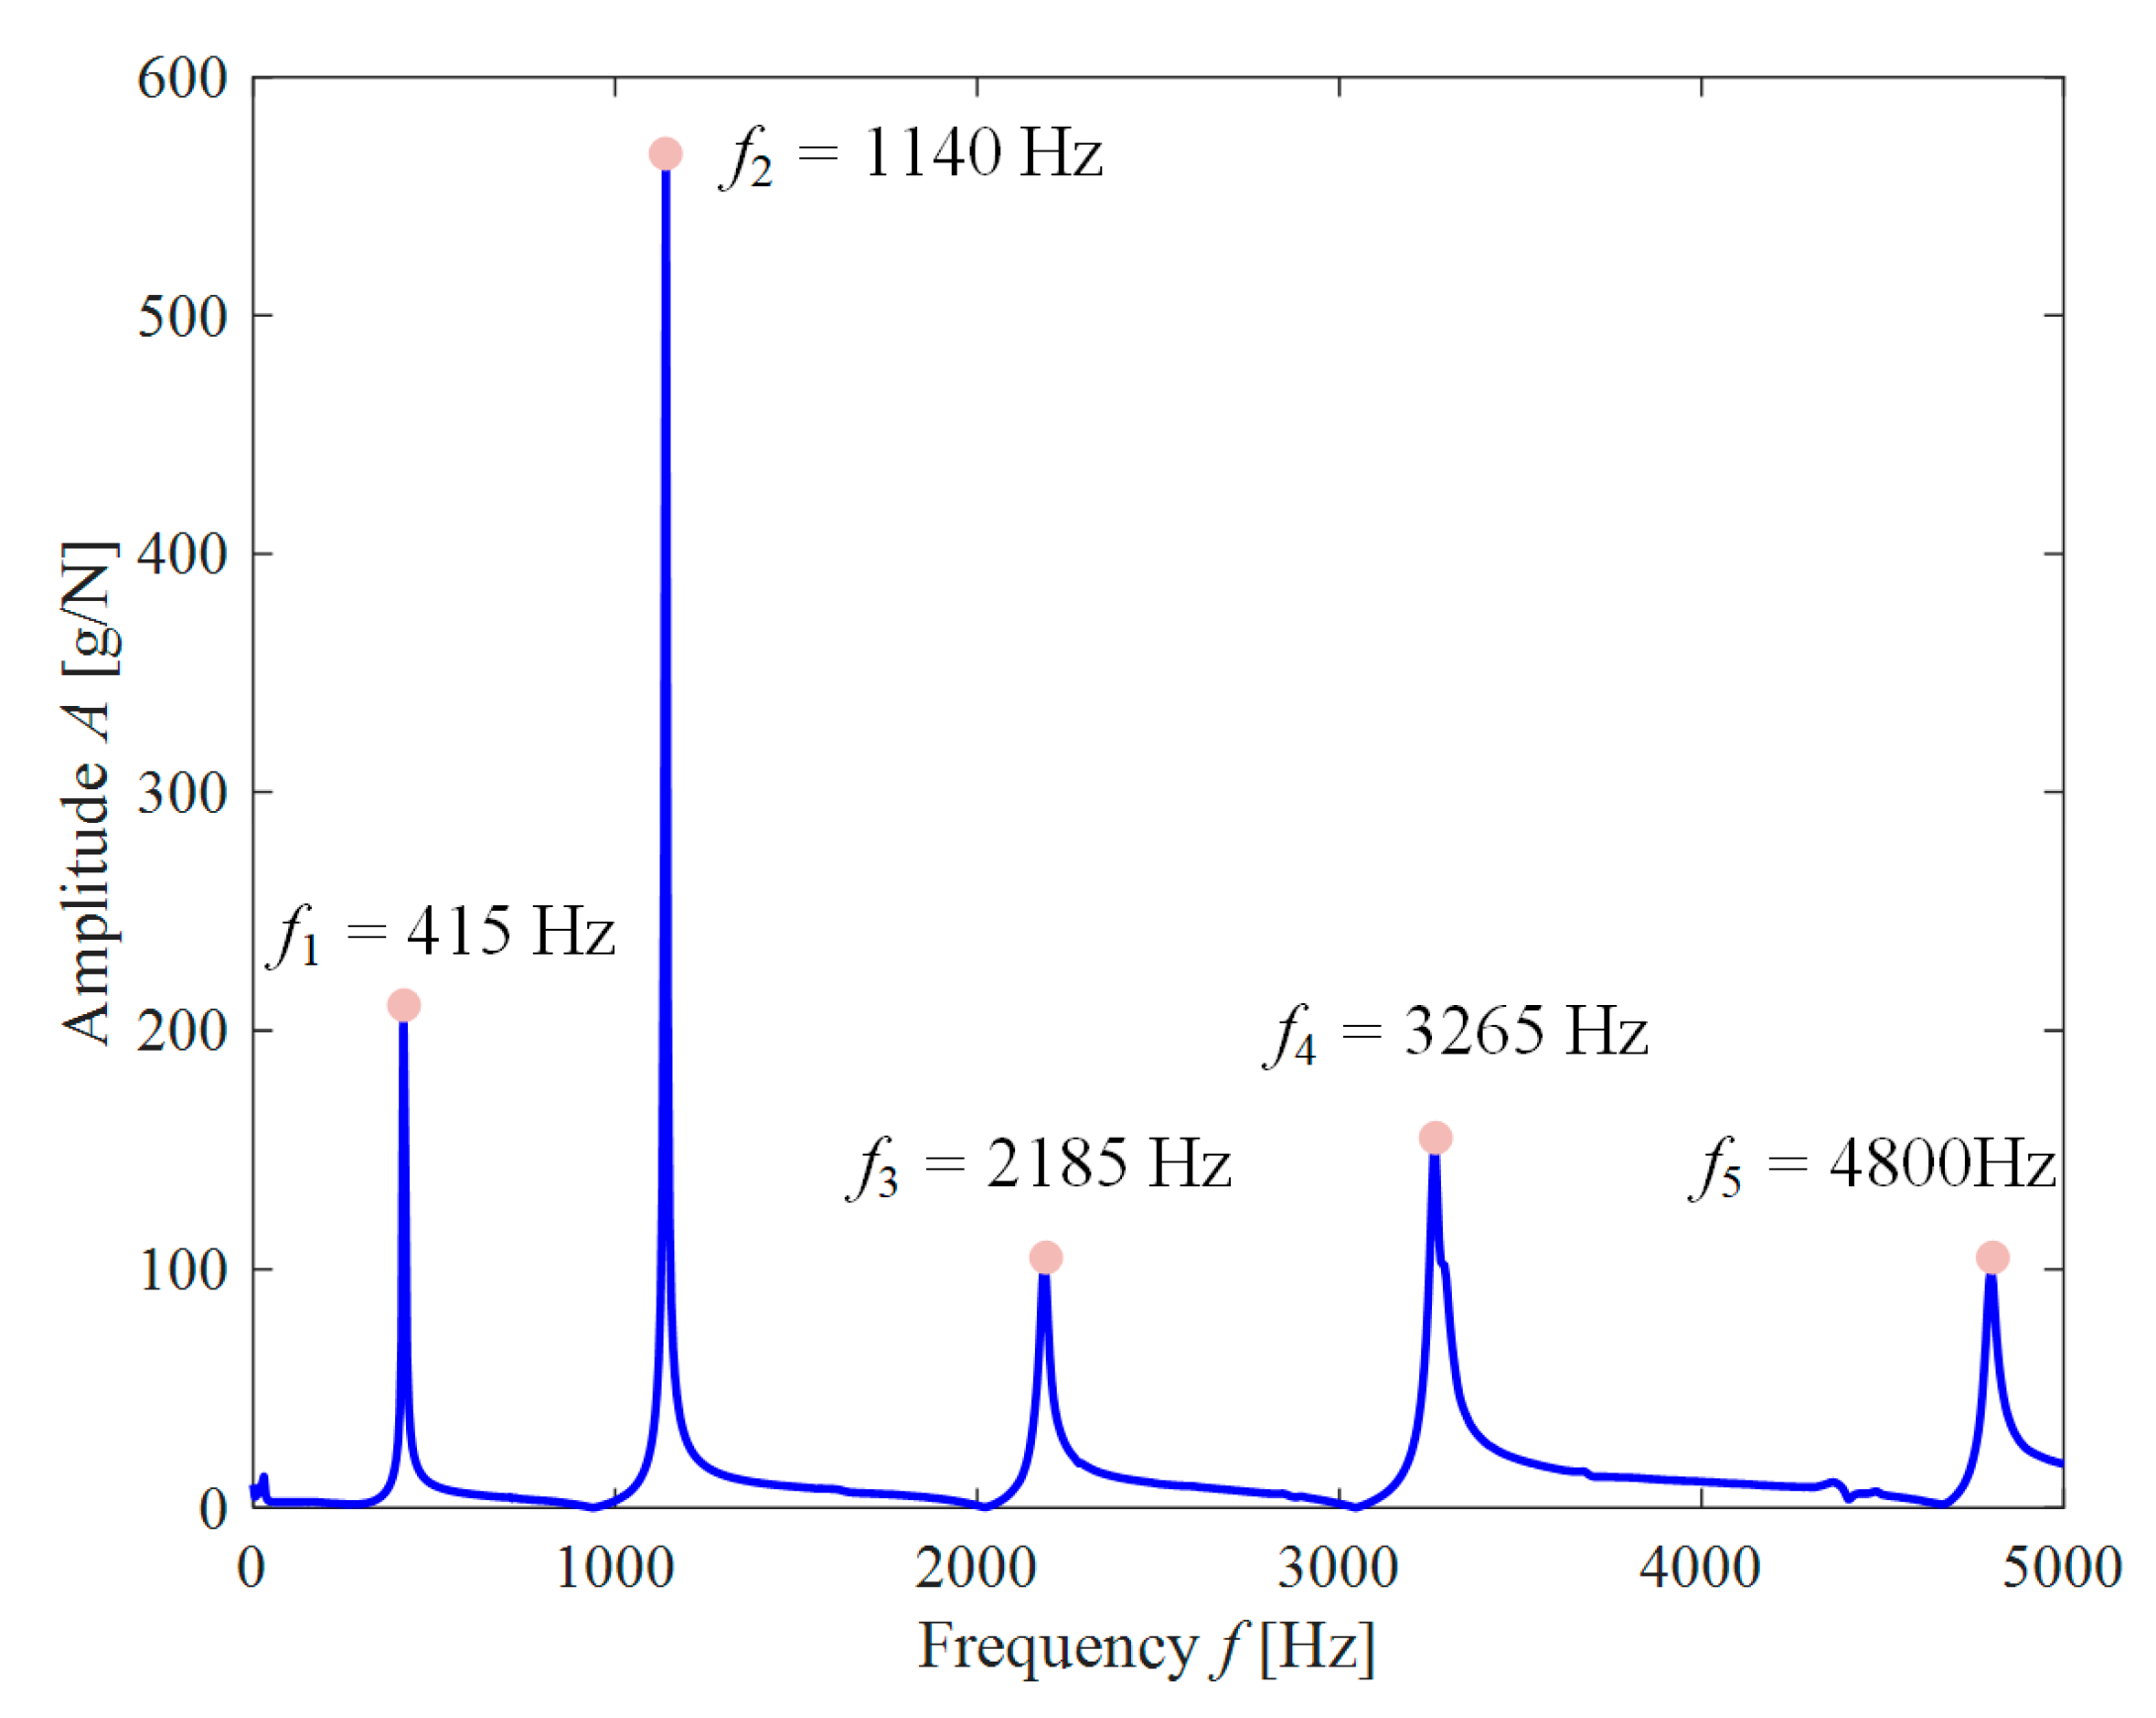
The vibration frequency signal is shown in Figure 18. When hammering, the force signal induces a structural vibration response, while the acceleration sensor records the micro-vibration electrical signal. If the electrical signal has the maximum response, the resonance frequency of the structure can be determined.
The theoretical and experimental modal frequencies are compared in Table 3. The frequencies of each order agree with each other, and the maximum errors are 4.09%, 3.65%, and 2.14% at the 5th mode. The constraint conditions of the flexible rope may greatly influence the high-order mode, which introduces certain errors. Moreover, all frequencies increase with an increase in the pre-tightening force Fp. However, the increase rate is relatively slow. In addition to the coincidence of the frequency, the corresponding vibration modes should also be matched to verify the accuracy of the joint surface’s contact stiffness and damping model. As shown in Figure 19, the vibration modes of each order are completely consistent. Therefore, the accuracy of the proposed contact model is proven.

5. Conclusions and Prospects

In this work, revisiting the multi-scale model, a fractal extension of the piecewise scale model on rough surfaces, i.e., the JK model, was proposed. Firstly, an accurate single-asperity model considering asperity–substrate interaction was established by introducing the geometric coefficient of the asperity and dimensionless material coefficient. Then, according to the island distribution function, we divided the contact mechanics process of rough surfaces into a small-scale stage, a meso-scale stage, and a large-scale stage, and originally deduced the precise scale limit. On this basis, a complete analytical solution was provided for contact mechanics with homogeneous and coating or layered materials by piecewise integration. In addition, we further explained the reasons why small asperities are plastically deformed in the small-scale stage, while medium asperities are elastic-plastically deformed in the meso-scale stage, and large asperities are elastically deformed in the large-scale stage. This paper is the most detailed contact model at present. Compared with most other contact models, it solves the discontinuous monotony problem of cross-scale contact mechanics, and comprehensively analyzes the relationships among load–real contact area, load–contact stiffness, load–stiffness ratio, and load-damping. Finally, we verified the accuracy of the proposed model using a dynamic modal experiment.
Based on the obtained results, hot issues, such as small-scale adhesion, friction, and wear, can be further investigated. Finally, a scientific basis for the popularization and application of the contact model can be provided.

Author Contributions

Writing—original draft preparation, T.Z. and K.J.; software, Y.W. and X.L.; writing—review and editing, K.J.; funding acquisition, T.Z. and K.J. All authors have read and agreed to the published version of the manuscript.

Funding

This study was supported by the National Natural Science Foundation of China (No. 52305522), Natural Science Foundation of Chongqing, China (No. CSTB2024NSCQ-MSX0121), Science and Technology Research Program of Chongqing Municipal Education Commission (No. KJQN202401109), Scientific Research Foundation of Chongqing University of Technology (No. 0119230979), and Opening Project of the Key Laboratory of CNC Equipment Reliability, Ministry of Education, Jilin University (JLU-cncr-202405).

Data Availability Statement

The data presented in this study are available on request from the corresponding author.

Acknowledgments

The authors are very grateful to the referees and to the editors for useful comments and suggestions towards the improvement of this paper.

Conflicts of Interest

The authors declare no conflict of interest.

Appendix A. Derivation of Normal Contact Load

Similarly, if 0 < a′ < a1c′, by integrating the product of Equations (25) and (12), the elastic normal contact load of rough surfaces, Fe, is as follows.
F e = 0 a 1 c f e n ( a ) d a = 2 ( 4.5 D ) ( D 1 ) ( 1.06 λ ) 1.5 3 ( 4 D ) π ( 2 0.5 D ) E * G ( D 2 ) ( ln γ ) 0.5 ψ 3 D 2 a 1 c 4 D 2
If a1c′ < a′ < a2c′, the elastic-plastic normal contact load of rough surfaces, Fep, is as follows.
F e p = a 1 c a 2 c f e p n ( a ) d a = H g 2 ( D 1 ) 3 . 76 D ψ 3 D 2 a l 0.12 ( D 1 ) a 2 c ( 1.88 0.5 D ) a 1 c ( 1.88 0.5 D )
If a2c′ < a′ < al′, the plastic normal contact load of rough surfaces, Fp, is as follows.
F p = a 2 c a l f p n ( a ) d a = 1 . 06 λ ( D 1 ) H 3 D ψ 3 D 2 a l D 1 2 a l ( 1.5 0.5 D ) a 2 c ( 1.5 0.5 D )
According to the scale interval, the normal contact load in different scale stages can be obtained by transforming the upper and lower bounds of the integral.

Appendix B. Derivation of Normal Contact Stiffness

An asperity deformation can be divided into three conditions: elastic, elastic-plastic, and full plastic deformation. Due to the definition of the contact stiffness, the normal contact stiffness of a single asperity during elastic deformation, kne can be expressed as follows.
k n e = d f e d δ a = 2 E * R δ a = 2 . 12 λ π E * a 0 . 5
If 0 < a′ < a1c′, by integrating the product of Equations (25) and (A4), the elastic normal contact stiffness of rough surfaces, Kne, is as follows.
K n e = 0 a 1 c k n e n ( a ) d a = D 1 2 D 2.12 λ π E * ψ 3 D 2 a l D 1 2 a 1 c 2 D 2 e p s 2 D 2
The normal contact stiffness of a single asperity with elastic-plastic deformation, knep, is expressed as follows:
k n e p = d f e p d δ a = H g 3 a l 0.12 ( D 1 ) a 0.38
where eps is Matlab infinitesimal, which can be set to a1c′/100; H g 3 = 1 . 38 ( 1.06 λ ) 0.38 2 ( 0.42 + 0.24 D ) ( K H ) 0.24 E * 0.76 3 G 0 . 24 ( D 2 ) ( ln γ ) 0 . 12 π ( 0.02 + 0.12 D ) .
If a1c′ < a′ < a2c′, by integrating the product of Equations (25) and (A6), the elastic-plastic normal contact stiffness of rough surfaces, Knep, is as follows.
K n e p = a 1 c a 2 c k n e p n ( a ) d a = ( D 1 ) H g 3 ( 1.76 D ) ψ 3 D 2 a l 0.62 ( D 1 ) a 2 c ( 0.88 0.5 D ) a 1 c ( 0.88 0.5 D )
When an asperity is full plastic deformation, the contact stiffness knep is 0. Thus, if a1c′ < a′ < a2c′, the full plastic normal contact stiffness of rough surfaces, Knp, is as follows.
K n p = 0

Appendix C. Derivation of Tangential Contact Stiffness

For the tangential deformation of a single asperity subjected to a tangential load t, δt can be expressed as follows:
δ t = 3 μ f 16 G * r 1 1 t μ f 2 3
where μ is the static friction coefficient; G* is the equivalent shear modulus, 1 / G * = ( 2 v 1 ) / G 1 + ( 2 v 2 ) / G 2 , where G1 and G2 are the shear modulus of rough surfaces; and f is the normal contact load of a single asperity. If 0 < a′ < a1c′, f = fe; If a1c′ < a′ < a2c′, f = fep. If a2c′ < a′ < al′, f = fp; t is the tangential load of a single asperity, t = τ a , where τ is the shear stress of the softer material; r is the real contact radius, r = a / π .
From Equation (A9), the tangential load of a single asperity, t, can be expressed as follows.
t = μ f 1 1 16 G * δ t r 3 μ f 3 2
Therefore, the tangential stiffness of a single asperity can be derived as follows:
k t = d t d δ t = 8 G * r 1 t μ f 1 3 = 8 G * a / π 1 T μ F 1 3
where T F = T e F e = τ A r e F e T e p F e p = τ A r e p F e p T p F p = τ A r p F p .
Note: The tangential contact stiffness in different deformation zones can be obtained by changing the ratio of T/F.
If 0 < a′ < a1c′, by integrating the product of Equations (25) and (A11), the elastic tangential contact stiffness of rough surfaces, Kte, is as follows.
K t e = 0 a 1 c k t e n ( a ) d a = 8 ( D 1 ) 2 D 1.06 λ 2 π G * ψ 3 D 2 a l D 1 2 a 1 c 2 D 2 e p s 2 D 2 1 T e μ F e 1 3
If a1c′ < a′ < a2c′, the elastic-plastic tangential contact stiffness of rough surfaces, Ktep, is as follows.
K t e p = a 1 c a 2 c k t e p n ( a ) d a = 1 T e p μ F e p 1 3 H g 1 π G * ψ 3 D 2 a l 0.42 ( D 1 ) × 8 ( D 1 ) ( 2 . 1 6 D ) a 2 c ( 1.08 0.5 D ) a 1 c ( 1.08 0.5 D ) D 2.16 4 ( D 1 ) ln a 2 c a 1 c     D = 2.16
When an asperity is full plastic deformation, the contact stiffness ktep is 0. Thus, if a1c′ < a′ < a2c′, the full plastic tangential contact stiffness of rough surfaces, Ktp, is as follows.
K t p = 0

Appendix D. Derivation of Normal Contact Damping

Damping can play the role of vibration isolation and vibration reduction. Mechanical systems mainly include the internal damping of materials, structural damping at interfaces, and fluid damping. Compared with structural damping, material damping can be neglected.
Only for elastic deformation, the strain energy of a single asperity wne is as follows.
w n e = 0 δ a f e d δ = 8 15 E * R 1 / 2 δ a   5 / 2 = 2 ( 8.5 2 D ) ( 1.06 λ ) 2.5 15 π ( 3 . 5 D ) E * G 2 ( D 2 ) ln ( γ ) a l ( 1 D ) a 2.5
If 0 < a′ < a1c′, by integrating the product of Equations (25) and (A15), the elastic normal of the strain energy of rough surfaces, Wne, is as follows.
W n e = 0 a 1 c w n e n ( a ) d a = 2 ( 8.5 2 D ) ( 1.06 λ ) 2.5 ( D 1 ) 15 ( 6 D ) π ( 3 . 5 D ) E * G 2 ( D 2 ) ln ( γ ) ψ 3 D 2 a l ( 0.5 0.5 D ) a 1 c ( 3 0.5 D )
Only for elastic-plastic deformation, the strain energy of a single asperity wnep is as follows:
w n e p = 0 δ a f e p d δ = 1 3 . 57 δ 1 c     0.38 K H π R δ a   2.38 = H g 4 a l 0.88 ( 1 D ) a 2.38
where H g 4 = ( 1 . 06 λ ) 2.38 2 ( 5.42 1.76 D ) 3 . 57 π ( 3.02 0.88 D ) ( K H ) 0.24 E * 0.76 G 1 . 76 ( D 2 ) ln ( γ ) 0.88 .
If a1c′ < a′ < a2c′, by integrating the product of Equations (25) and (A17), the elastic-plastic normal strain energy of rough surfaces, Wnep, is as follows.
W n e p = a 1 c a 2 c w n e p n ( a ) d a = D 1 5.76 D H g 4 ψ 3 D 2 a l 0.38 ( 1 D ) a 2 c ( 2.88 0.5 D ) a 1 c ( 2.88 0.5 D )
Only for full plastic deformation, the strain energy of a single asperity wnp is as follows.
w n p = 0 δ a f p d δ = π H R δ a 2 = H ( 1.06 λ ) 2 π ( 1 . 5 0 . 5 D ) 2 ( 2 D ) G ( D 2 ) ln ( γ ) 0.5 a l 1 D 2 a 2
If a2c′ < a′ < al′, the full plastic normal strain energy of rough surfaces, Wnp, is as follows.
W n p = a 2 c a l w n p n ( a ) d a = H ( D 1 ) ( 1.06 λ ) 2 ( 5 D ) π ( 1 . 5 0 . 5 D ) 2 ( 2 D ) G ( D 2 ) ln ( γ ) 0.5 ψ 3 D 2 a l 5 D 2 a 2 c 5 D 2

Appendix E. Derivation of Tangential Contact Damping

For the tangential deformation of a single asperity subjected to a tangential load t, the strain energy wt can be expressed as follows.
w t = 2 π 0 δ t t d δ t = 3 π μ 2 f 2 8 G * r 3 5 1 t μ f 2 / 3 + 2 5 1 t μ f 5 / 3
Only for elastic deformation, the strain energy of a single asperity wte is as follows:
w t e = H g 5 a l ( 1 D ) a 2.5
where H g 5 = μ 2 ( 1.06 λ ) 2.5 2 ( 6.5 2 D ) 3 π ( 2 . 5 D ) G * ln ( γ ) E * 2 G 2 ( D 2 ) 3 5 1 T e μ F e 2 / 3 + 2 5 1 T e μ F e 5 / 3 .
If 0 < a′ < a1c′, by integrating the product of Equations (25) and (A22), the elastic tangential the strain energy of rough surfaces, Wte, is as follows.
W t e = 0 a 1 c w t e n ( a ) d a = D 1 6 D H g 5 ψ 3 D 2 a l ( 0.5 0.5 D ) a 1 c ( 3 0.5 D )
Only for elastic-plastic deformation, the strain energy of a single asperity wtep is as follows:
w t e p = H g 6 a l 0.68 ( 1 D ) a 2.18
where H g 6 = 3 π 1.5 μ 2 8 G * H g 2   2 H g 1     0.5 3 5 1 T e p μ F e p 2 / 3 + 2 5 1 T e p μ F e p 5 / 3 .
If a1c′ < a′ < a2c′, the elastic-plastic tangential strain energy of rough surfaces, Wtep, is as follows.
W t e p = a 1 c a 2 c w t e p n ( a ) d a = D 1 5.36 D H g 6 ψ 3 D 2 a l 0.18 ( 1 D ) a 2 c ( 2.68 0.5 D ) a 1 c ( 2.68 0.5 D )
Only for full plastic deformation, the strain energy of a single asperity wtp is as follows:
w t p = H g 7 a 1.5
where H g 7 = 3 π 1 . 5 μ 2 ( 1.06 λ ) 1.5 H 2 8 G * 3 5 1 T p μ F p 2 / 3 + 2 5 1 T p μ F p 5 / 3 .
If a2c′ < a′ < al′, the full plastic tangential strain energy of rough surfaces, Wtp, is as follows.
W t p = a 2 c a l w t p n ( a ) d a = D 1 4 D H g 7 ψ 3 D 2 a l D 1 2 a l 4 D 2 a 2 c 4 D 2

References

  1. Koshy, C.S.; Flores, P.; Lankarani, H.M. Study of the effect of contact force model on the dynamic response of mechanical systems with dry clearance joints: Computational and experimental approaches. Nonlinear Dyn. 2013, 73, 325–338. [Google Scholar] [CrossRef]
  2. Xie, W.; Liu, C.; Huang, G.; Qin, Z.; Zong, K.; Jiang, D. Trans-scale rough surface contact model based on molecular dynamics method: Simulation, modeling and experimental verification. Eur. J. Mech. A Solids 2023, 100, 105021. [Google Scholar] [CrossRef]
  3. Xiao, H.; Shao, Y.; Brennan, M.J. On the contact stiffness and nonlinear vibration of an elastic body with a rough surface in contact with a rigid flat surface. Eur. J. Mech. A Solids 2015, 49, 321–328. [Google Scholar] [CrossRef]
  4. Bowden, F.P.; Tabor, D.; Palmer, F. The Friction and Lubrication of Solids; Oxford University Press: Oxford, UK, 2001. [Google Scholar]
  5. Archard, J.F. Elastic deformation and the laws of friction. Proc. R. Soc. Lond. Ser. A. Math. Phys. Sci. 1957, 243, 190–205. [Google Scholar]
  6. Greenwood, J.A.; Williamson, J.B.P. Contact of nominally flat surfaces. Proc. R. Soc. Lond. Ser. A. Math. Phys. Sci. 1966, 295, 300–319. [Google Scholar]
  7. Greenwood, J.A. A simplified elliptic model of rough surface contact. Wear 2006, 261, 191–200. [Google Scholar] [CrossRef]
  8. Greenwood, J.A.; Tripp, J.H. The contact of two nominally flat rough surfaces. Proc. Inst. Mech. Eng. 1970, 185, 625–633. [Google Scholar] [CrossRef]
  9. Whitehouse, D.J.; Archard, J.F. The properties of random surfaces of significance in their contact. Proc. R. Soc. Lond. A. Math. Phys. Sci. 1970, 316, 97–121. [Google Scholar]
  10. Bush, A.W.; Gibson, R.D.; Thomas, T.R. The elastic contact of a rough surface. Wear 1975, 35, 87–111. [Google Scholar] [CrossRef]
  11. McCool, J.I. Comparison of models for the contact of rough surfaces. Wear 1986, 107, 37–60. [Google Scholar] [CrossRef]
  12. Ciavarella, M.; Greenwood, J.A.; Paggi, M. Inclusion of “interaction” in the Greenwood and Williamson contact theory. Wear 2008, 265, 729–734. [Google Scholar] [CrossRef]
  13. Ciavarella, M.; Delfine, V.; Demelio, G. A “re-vitalized” Greenwood and Williamson model of elastic contact between fractal surfaces. J. Mech. Phys. Solids 2006, 54, 2569–2591. [Google Scholar] [CrossRef]
  14. Song, H.; Vakis, A.; Liu, X.; Van der Giessen, E. Statistical model of rough surface contact accounting for size-dependent plasticity and asperity interaction. J. Mech. Phys. Solids 2017, 106, 1–14. [Google Scholar] [CrossRef]
  15. Jackson, R.L.; Green, I. A statistical model of elasto-plastic asperity contact between rough surfaces. Tribol. Int. 2006, 39, 906–914. [Google Scholar] [CrossRef]
  16. Carbone, G.; Bottiglione, F. Asperity contact theories: Do they predict linearity between contact area and load? J. Mech. Phys. Solids 2008, 56, 2555–2572. [Google Scholar] [CrossRef]
  17. Greenwood, J.A.; Wu, J.J. Surface roughness and contact: An apology. Meccanica 2001, 36, 617–630. [Google Scholar] [CrossRef]
  18. Barber, J.R. Multiscale surfaces and Amontons’ law of friction. Tribol. Lett. 2013, 49, 539–543. [Google Scholar] [CrossRef]
  19. Müser, M.H.; Dapp, W.B.; Bugnicourt, R.; Sainsot, P.; Lesaffre, N.; Lubrecht, T.A.; Persson, B.N.J.; Harris, K.; Bennett, A.; Schulze, K.; et al. Meeting the contact-mechanics challenge. Tribol. Lett. 2017, 65, 118. [Google Scholar] [CrossRef]
  20. Buzio, R.; Boragno, C.; Biscarini, F.; De Mongeot, F.B.; Valbusa, U. The contact mechanics of fractal surfaces. Nat. Mater. 2003, 2, 233–236. [Google Scholar] [CrossRef]
  21. Majumdar, A.A.; Bhushan, B. Fractal Model of Elastic-Plastic Contact Between Rough Surfaces. J Tribol Trans Asme 1991, 113, 1–11. [Google Scholar] [CrossRef]
  22. Wang, S.; Komvopoulos, K. A Fractal Theory of the Interfacial Temperature Distribution in the Slow Sliding Regime: Part II-Multiple Domains, Elastoplastic Contacts and Applications. J. Tribol. 1994, 116, 824–832. [Google Scholar] [CrossRef]
  23. Yan, W.; Komvopoulos, K. Contact analysis of elastic-plastic fractal surfaces. J. Appl. Phys. 1998, 84, 3617–3624. [Google Scholar] [CrossRef]
  24. Liou, J.L.; Lin, J.F. A new microcontact model developed for variable fractal dimension, topothesy, density of asperity, and probability density function of asperity heights. J. Appl. Mech. 2007, 74, 603–613. [Google Scholar] [CrossRef]
  25. Zhang, X.; Wang, N.; Lan, G.; Wen, S.; Chen, Y. Tangential damping and its dissipation factor models of joint interfaces based on fractal theory with simulations. J. Tribol. 2014, 136, 011704. [Google Scholar] [CrossRef]
  26. Zhao, Y.; Xu, J.; Cai, L.; Shi, W.; Liu, Z. Stiffness and damping model of bolted joint based on the modified three-dimensional fractal topography. Proc. Inst. Mech. Eng. Part C J. Mech. Eng. Sci. 2017, 231, 279–293. [Google Scholar] [CrossRef]
  27. Lan, G.; Sun, W.; Zhang, X.; Chen, Y.; Tan, W.; Li, X. A three-dimensional fractal model of the normal contact characteristics of two contacting rough surfaces. AIP Adv. 2021, 11, 055023. [Google Scholar] [CrossRef]
  28. Liu, Z.; Jiang, K.; Zhang, C.; Zhao, Y.; Tian, Y. A stiffness model of a joint surface with inclination based on fractal theory. Precis. Eng. 2020, 62, 47–61. [Google Scholar] [CrossRef]
  29. Xiong, Y.; Zhou, Z.; Huang, K.; Cheng, Z.; Han, G. An improved fractal model for tangential contact damping of high contact ratio gear considering friction effect. Chaos Solitons Fractals 2021, 153, 111510. [Google Scholar] [CrossRef]
  30. Gao, Y.F.; Bower, A.F. Elastic–plastic contact of a rough surface with Weierstrass profile. Proc. R. Soc. A Math. Phys. Eng. Sci. 2006, 462, 319–348. [Google Scholar] [CrossRef]
  31. Ciavarella, M.; Murolo, G.; Demelio, G.; Barber, J. Elastic contact stiffness and contact resistance for the Weierstrass profile. J. Mech. Phys. Solids 2004, 52, 1247–1265. [Google Scholar] [CrossRef]
  32. Persson, B.N.J. Elastoplastic contact between randomly rough surfaces. Phys. Rev. Lett. 2001, 87, 116101. [Google Scholar] [CrossRef] [PubMed]
  33. Persson, B.N.J. Theory of rubber friction and contact mechanics. J. Chem. Phys. 2001, 115, 3840–3861. [Google Scholar] [CrossRef]
  34. Yang, C.; Tartaglino, U.; Persson, B.N.J. A multiscale molecular dynamics approach to contact mechanics. Eur. Phys. J. E 2006, 19, 47–58. [Google Scholar] [CrossRef]
  35. Morag, Y.; Etsion, I. Resolving the contradiction of asperities plastic to elastic mode transition in current contact models of fractal rough surfaces. Wear 2007, 262, 624–629. [Google Scholar] [CrossRef]
  36. Liou, J.L.; Lin, J.F. A modified fractal microcontact model developed for asperity heights with variable morphology parameters. Wear 2010, 268, 133–144. [Google Scholar] [CrossRef]
  37. Miao, X.; Huang, X. A complete contact model of a fractal rough surface. Wear 2014, 309, 146–151. [Google Scholar] [CrossRef]
  38. Afferrante, L.; Carbone, G.; Demelio, G. Interacting and coalescing Hertzian asperities: A new multiasperity contact model. Wear 2012, 278, 28–33. [Google Scholar] [CrossRef]
  39. Jackson, R.L.; Streator, J.L. A multi-scale model for contact between rough surfaces. Wear 2006, 261, 1337–1347. [Google Scholar] [CrossRef]
  40. Goedecke, A.; Jackson, R.L.; Mock, R. A fractal expansion of a three dimensional elastic–plastic multi-scale rough surface contact model. Tribol. Int. 2013, 59, 230–239. [Google Scholar] [CrossRef]
  41. Yu, X.; Sun, Y.; Zhao, D.; Wu, S. A revised contact stiffness model of rough curved surfaces based on the length scale. Tribol. Int. 2021, 164, 107206. [Google Scholar] [CrossRef]
  42. Yu, X.; Sun, Y.; Wu, S. Multi-stage contact model between fractal rough surfaces based on multi-scale asperity deformation. Appl. Math. Model. 2022, 109, 229–250. [Google Scholar] [CrossRef]
  43. Chen, J.; Liu, D.; Wang, C.; Zhang, W.; Zhu, L. A fractal contact model of rough surfaces considering detailed multi-scale effects. Tribol. Int. 2022, 176, 107920. [Google Scholar] [CrossRef]
  44. Guo, X.; Ma, B.; Zhu, Y. A magnification-based multi-asperity (MBMA) model of rough contact without adhesion. J. Mech. Phys. Solids 2019, 133, 103724. [Google Scholar] [CrossRef]
  45. Yeo, C.D.; Katta, R.R.; Polycarpou, A.A. Improved Elastic Contact Model Accounting for Asperity and Bulk Substrate Deformation. Tribol. Lett. 2009, 35, 191–203. [Google Scholar] [CrossRef]
  46. Jiang, K.; Liu, Z.; Tian, Y.; Zhang, T.; Yang, C. An estimation method of fractal parameters on rough surfaces based on the exact spectral moment using artificial neural network. Chaos Solitons Fractals 2022, 161, 112366. [Google Scholar] [CrossRef]
  47. Xu, H.; Pharr, G.M. An improved relation for the effective elastic compliance of a film/substrate system during indentation by a flat cylindrical punch. Scr. Mater. 2006, 55, 315–318. [Google Scholar] [CrossRef]
  48. Kogut, L.; Etsion, I. Elastic-plastic contact analysis of a sphere and a rigid flat. J. Appl. Mech. 2002, 69, 657–662. [Google Scholar] [CrossRef]
  49. Lin, L.P.; Lin, J.F. An elastoplastic microasperity contact model for metallic materials. J. Trib. 2005, 127, 666–672. [Google Scholar]
  50. Mandelbrot, B.B. The Fractal Geometry of Nature. Am. J. Phys. 1983, 51, 286. [Google Scholar] [CrossRef]
  51. Etsion, I.; Kligerman, Y.; Kadin, Y. Unloading of an elastic–plastic loaded spherical contact. Int. J. Solids Struct. 2005, 42, 3716–3729. [Google Scholar] [CrossRef]
  52. Persson, B. On the Electric Contact Resistance. Tribol. Lett. 2022, 70, 88. [Google Scholar] [CrossRef]
  53. Pharr, G.M.; Oliver, W.C.; Brotzen, F.R. On the generality of the relationship among contact stiffness, contact area, and elastic modulus during indentation. J. Mater. Res. 1992, 7, 613–617. [Google Scholar] [CrossRef]
  54. Mindlin, R.D. Compliance of Elastic Bodies in Contact. J. Appl. Mech. 1949, 16, 259–268. [Google Scholar] [CrossRef]
  55. Putignano, C.; Ciavarella, M.; Barber, J.R. Frictional energy dissipation in contact of nominally flat rough surfaces under harmonically varying loads. J. Mech. Phys. Solids 2011, 59, 2442–2454. [Google Scholar] [CrossRef]
  56. Shi, X.; Polycarpou, A.A. Investigation of Contact Stiffness and Contact Damping for Magnetic Storage Head-Disk Interfaces. J. Tribol. 2008, 130, 021901. [Google Scholar] [CrossRef]
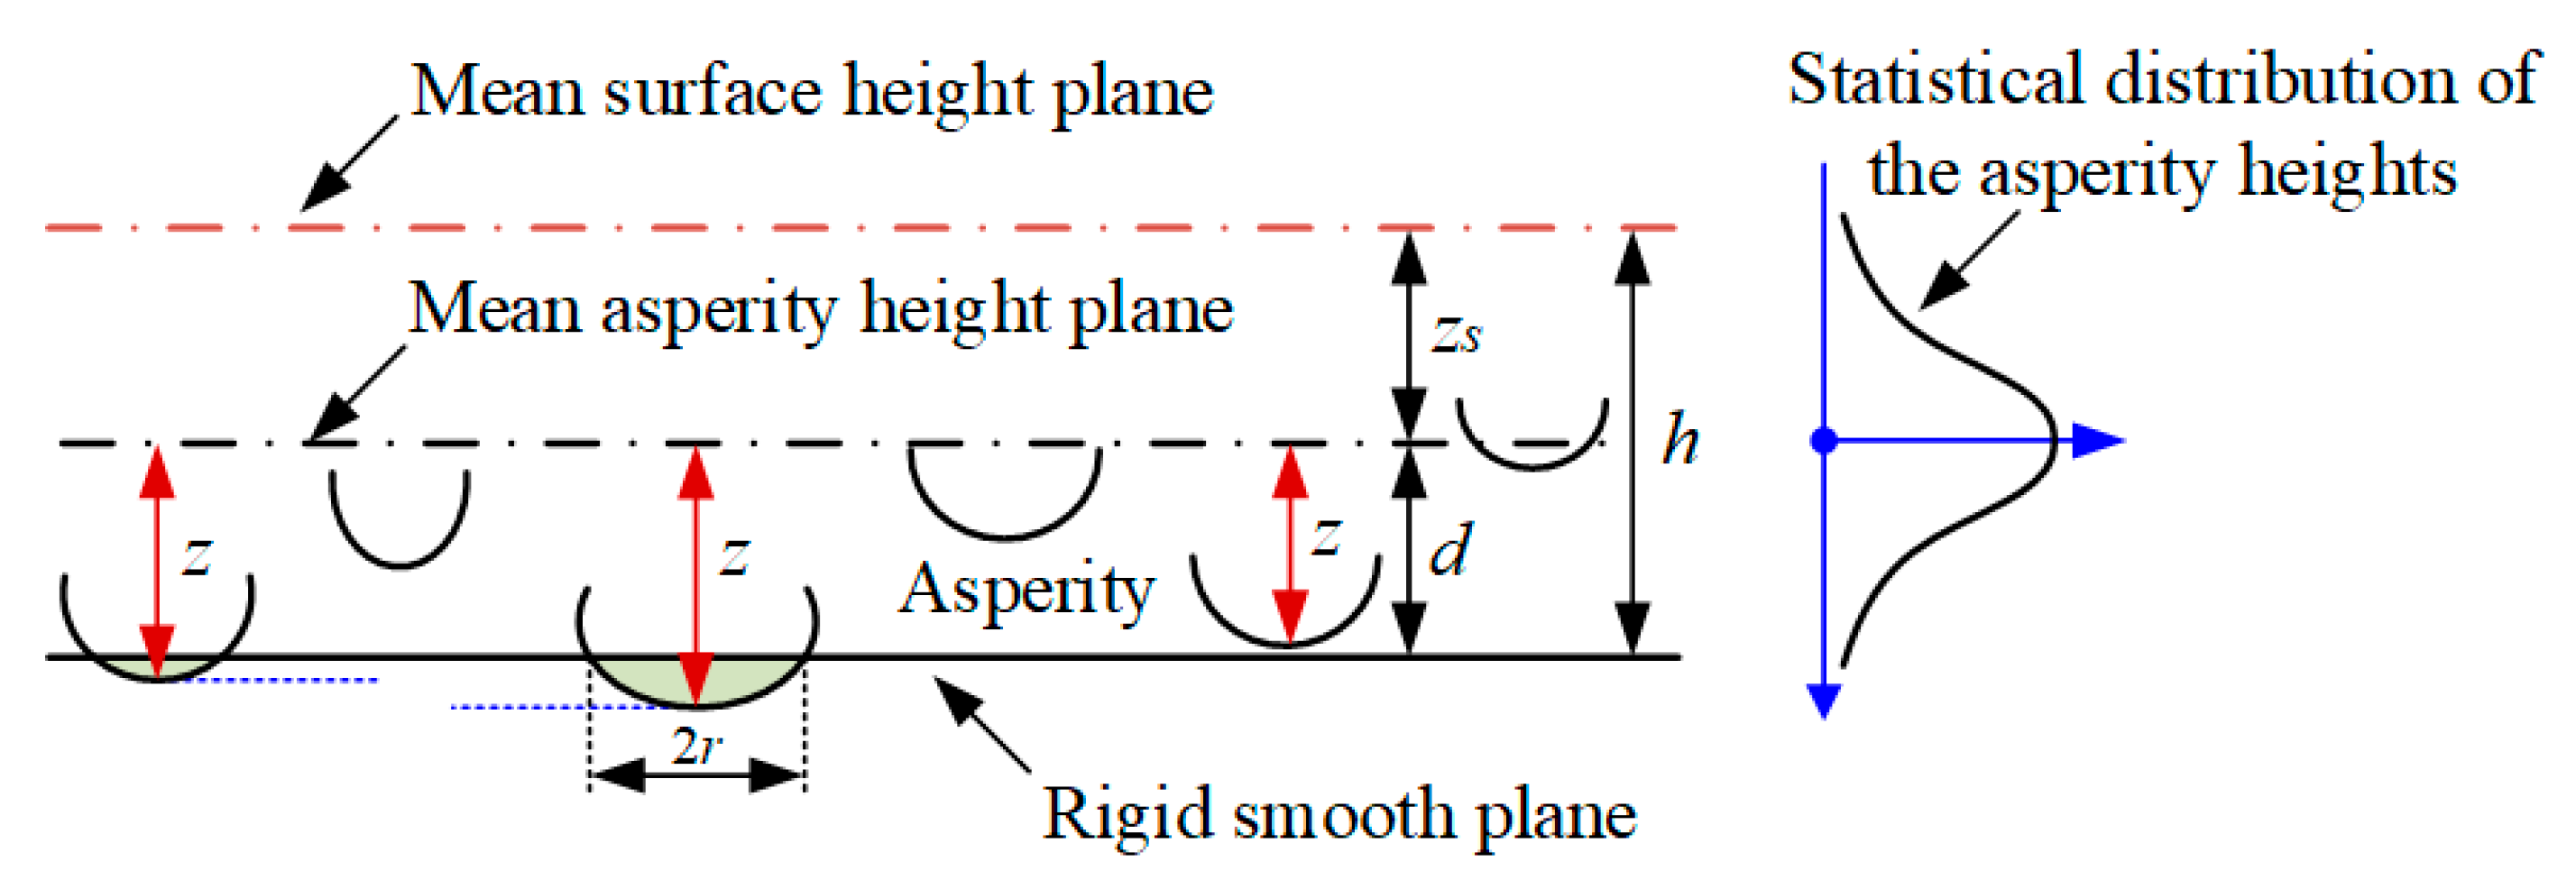
Figure 1. Distribution of a discrete asperity at an equivalent rough interface.
Fractalfract 08 00611 g001
Figure 2. Mechanical analysis of interaction-based single asperity.
Fractalfract 08 00611 g002
Figure 3. Comparison of an asperity deformation with the applied deformation using Equations (1) and (2): (a) influence of the dimensionless material coefficient on asperity deformation; (b) influence of the geometrical coefficient ξ on asperity deformation.
Fractalfract 08 00611 g003
Figure 4. Contact mechanics of an asperity with the cosine profile function.
Fractalfract 08 00611 g004
Figure 5. Geometric model (green area represents asperity and blue area represents substrate).
Fractalfract 08 00611 g005
Figure 6. Comparison of different contact models: (a) the dimensionless relationship between the normal load f ^ and the applied approach δ ^ ; (b) the dimensionless relationship between the real contact area a ^ and the applied approach δ ^ ; (c) the dimensionless relationship between the average contact pressure p ^ and applied approach δ ^ .
Fractalfract 08 00611 g006
Figure 7. Finite element verification.
Fractalfract 08 00611 g007
Figure 8. The relationship between al′, a1c′, and a2c′ (full plastic deformation in the blue area, elastic-plastic deformation in the green area, and elastic deformation in the red area).
Fractalfract 08 00611 g008
Figure 9. The relationship between al′, D, and G.
Fractalfract 08 00611 g009
Figure 10. The relationship between Ar*and F* with different fractal parameters.
Fractalfract 08 00611 g010
Figure 11. The relationship between Kn* and F* (the red dotted line represents the bulk stiffness, K b = 1 . 129 E * A 0 ).
Fractalfract 08 00611 g011
Figure 12. The ratio between the normal and tangential stiffness (Kn, Kt) [the red dotted line is Equation (68), and the black dotted line is Equation (67)].
Fractalfract 08 00611 g012
Figure 13. The relationship between Cn* and F*.
Fractalfract 08 00611 g013
Figure 14. T-type specimen.
Fractalfract 08 00611 g014
Figure 15. Surface topography data acquisition process.
Fractalfract 08 00611 g015
Figure 16. Node force distribution of the joint surface.
Fractalfract 08 00611 g016
Figure 17. Hammer mode test.
Fractalfract 08 00611 g017
Figure 18. Amplitude–frequency curve [12 kN].
Fractalfract 08 00611 g018
Figure 19. Modal shapes [12 kN].
Fractalfract 08 00611 g019
Table 1. Comparison of the JK model and finite element results under different parameters.
NoR [μm]ha [nm]ra [μm]DG [×10−5 mm]ξ [mm−0.5]Ea [Gpa]Eb [Gpa]ErFEAJK Model
F [×10−3 N]A [×10−6 mm2]F [×10−3 N]A [×10−6 mm2]
#1151001.7292.99615.46106.2410010010.410.5890.4050.646
207505.4262.4205.25639.1010010017.438.018.278.94
40300015.202.2742.92019.74100100164.674.175.7176.17
80600030.402.2382.05513.961001001257.7296.3302.86304.69
#2151001.7292.99615.46106.241501001.50.430.5890.4020.629
207505.4262.4205.25639.101501001.57.708.018.709.05
40300015.202.2742.92019.741501001.570.174.275.0775.52
80600030.402.2382.05513.961501001.5279.4296.6300.77302.59
#3151001.7292.99615.46106.2420010020.450.5900.3930.611
207505.4262.4205.25639.1020010027.828.018.929.07
40300015.202.2742.92019.74200100272.674.274.4774.92
80600030.402.2382.05513.962001002290.0296.8298.84300.65
Table 2. Material property.
PropertiesValueUnit
density ρ7800Kg/m3
elastic modulus E2.0 × 105MPa
yield strength σs355MPa
Poisson’s ratio v0.3
hardness H994MPa
static friction coefficient μ0.25
Table 3. A comparison of theoretical values and test results.
FpMethod1st2nd3rd4th5th
4 kNJK model422.91153.22207.63307.74900.6
Experiment 14061126214532494700
Error 13.89%2.35%2.81%1.76%4.09%
8 kNJK model423.61154.12208.83311.74903.9
Experiment 24101135217532854725
Error 23.21%1.65%1.53%0.81%3.65%
12 kNJK model423.91154.62209.33313.784905.0
Experiment 34151140218532654800
Error 32.10%1.26%1.10%1.47%2.14%
Disclaimer/Publisher’s Note: The statements, opinions and data contained in all publications are solely those of the individual author(s) and contributor(s) and not of MDPI and/or the editor(s). MDPI and/or the editor(s) disclaim responsibility for any injury to people or property resulting from any ideas, methods, instructions or products referred to in the content.