Article

Advanced Mathematical Approaches in Psycholinguistic Data Analysis: A Methodological Insight

by
Cecilia Castro
1,
Víctor Leiva
2,*,
Maria do Carmo Lourenço-Gomes
3 and
Ana Paula Amorim
1
1
Centre of Mathematics, Universidade do Minho, 4710-057 Braga, Portugal
2
School of Industrial Engineering, Pontificia Universidad Católica de Valparaíso, Valparaíso 2362807, Chile
3
Centre for Humanistic Studies, Universidade do Minho, 4710-057 Braga, Portugal
*
Author to whom correspondence should be addressed.
Fractal Fract. 2023, 7(9), 670; https://doi.org/10.3390/fractalfract7090670
Submission received: 27 July 2023 / Revised: 17 August 2023 / Accepted: 24 August 2023 / Published: 5 September 2023
(This article belongs to the Special Issue Fractional Models and Statistical Applications)

Abstract

:
In the evolving landscape of psycholinguistic research, this study addresses the inherent complexities of data through advanced analytical methodologies, including permutation tests, bootstrap confidence intervals, and fractile or quantile regression. The methodology and philosophy of our approach deeply resonate with fractal and fractional concepts. Responding to the skewed distributions of data, which are observed in metrics such as reading times, time-to-response, and time-to-submit, our analysis highlights the nuanced interplay between time-to-response and variables like lists, conditions, and plausibility. A particular focus is placed on the implausible sentence response times, showcasing the precision of our chosen methods. The study underscores the profound influence of individual variability, advocating for meticulous analytical rigor in handling intricate and complex datasets. Drawing inspiration from fractal and fractional mathematics, our findings emphasize the broader potential of sophisticated mathematical tools in contemporary research, setting a benchmark for future investigations in psycholinguistics and related disciplines.

1. Introduction and Motivation

The psycholinguistic domain, which is continuously evolving, provides profound insights into cognitive processes and linguistic decision-making. Despite its progress, this domain faces significant methodological challenges, particularly in data analysis [1]. Notably, recent studies have highlighted the presence of complex data structures, similar to patterns in fractal and fractional (FF) mathematics. Efforts to understand these patterns have spurred the use of advanced mathematical methods, especially when dealing with separable spacetime filters [2].
Our research targets a pivotal gap in psycholinguistic knowledge, focusing on participant behaviors, such as confidence and hesitation, which influence the outcomes of a study [3]. Historically, these extra-linguistic behaviors, despite their importance, have been underrepresented. Their role in shaping participant interactions in linguistic assignments is crucial for a complete understanding of psycholinguistic intricacies [4].
Data from psycholinguistic questionnaire studies, especially response times, frequently exhibit skewed distributions. This skewness presents challenges for traditional statistical techniques or methods [5]. Interestingly, other disciplines have adapted to the intricacies of this type of data by adopting innovative models. One example involves the use of the grey seasonal model in natural gas production, which underscores the capabilities of advanced techniques [6]. In contrast, psycholinguistics still predominantly relies on conventional methodologies, which may not adequately cater to the rising complexities in data.
With our approach, we seek to bridge this methodological divide. By examining the nuances of psycholinguistic data, we venture into the domain of FF mathematics. Our study stands out by addressing participant behaviors, previously sidelined, which substantially impact outcomes [3,4].
In response to the challenges posed by skewed distributions in areas like language comprehension, our research champions alternative statistical methods. These include permutation tests, bootstrapping, and fractile regression [7]. Encouragingly, recent academic endeavors have also introduced innovative mathematical frameworks tailored to these challenges [8,9].
To underscore the effectiveness of our methodology, we have conceptualized a sentence comprehension task as our primary case study. Participants assess sentence acceptability across varied categories, forming an ideal backdrop for our methodological exploration [10]. Building upon foundational research [10], our focus is reoriented toward efficiently handling response time data with skewed distributions, leveraging methods like permutation tests, bootstrapping, and fractile regression. These avant-garde techniques promise accuracy across diverse data distributions [11,12,13].
In summary, our objective is twofold: to unveil novel aspects of sentence comprehension and to validate innovative statistical techniques apt for skewed data distributions. By strengthening the methodological groundwork for future psycholinguistic studies, we aim to fortify the psycholinguistic field with a resilient statistical framework, aptly suited for complex data landscapes. The methodology and philosophy that we employ deeply resonate with the following FF concepts:
  • Complexity and non-linearity: Utilizing fractile regression allows us to address the significant asymmetries (skewness) present in the distributions of our data and to embrace their inherent non-linear characteristics [2,6]. This alignment with the complexities is in tune with the FF philosophy of interpreting non-linear patterns [8,9].
  • Data distribution insights: The concept of fractile defines specific points on a probability density curve, which in turn divides the curve based on established proportions. A case in point is the median or the 50th percentile, serving as a fractile and splitting data into two balanced portions. This intricate view of data distribution is consistent with the FF emphasis on detailed and recurrent patterns.
  • Bootstrapping and permutation tests: Through bootstrapping, we create multiple samples from our original dataset, bolstering the reliability of our findings. Concurrently, permutation tests provide an avenue to assess our data devoid of rigid assumptions, directly tackling their complexities. This painstaking and iterative examination echoes FF methods and prioritizes a holistic understanding of the data.
  • Real-world application: Our methodology extends beyond the realm of theory. It offers tangible insights for linguistic research, showcasing the pivotal role of fractile regression and resampling methods in decoding real-world linguistic patterns. Such an application accentuates the relevance of these methods in revealing nuanced patterns, aligning with the FF principles [2,6,8,9].
In sum, our study addresses a plethora of challenges and subjects that harmonize with the FF domain, underscoring its significance to the expansive FF community. Our contributions in this study encompass several key areas within the field of psycholinguistics. Firstly, we introduce innovative statistical methods, namely permutation tests, bootstrap confidence intervals, and fractile regression, which offer a nuanced approach to psycholinguistic data analysis, particularly for skewed distributions. Secondly, we combine these statistical methods with advanced mathematical concepts from FF mathematics, increasing the precision and depth of our analyses. Thirdly, we highlight the importance of considering individual variations in linguistic cognition, providing new insights into cognitive processes underlying reading and response times. Lastly, we lay the groundwork for future software development, aimed at democratizing access to our advanced statistical methods, as well as emphasizing the potential for broader application of our methodology in other fields where data complexity poses challenges.
This paper is structured into four main sections. Section 1 establishes the foundation for our investigation, rooted in psycholinguistics. It provides an overview of the research objectives and emphasizes the importance of examining extra-linguistic variables, as well as the connection of our approach with the FF philosophy. The rest of the paper unfolds as follows. Section 2 includes three subsections, each providing a background for the major statistical procedures used in this study. Section 3, divided into three subsections, presents an overview of the case study, elaborating on the experimental design, introducing the statistical models and considerations, and focusing on the results and subsequent discussion. Then, Section 4 summarizes the key findings of the study, discusses their implications, and suggests potential directions for future research.

2. Methodologies

In this section, we delve into the methodology adopted for this study.

2.1. Fractile Regression

Unlike traditional regression models that primarily focus on mean responses dependent on values of covariates, fractile regression delves into the fractile of a response based on these covariate values. Such an approach offers a more granular perspective of data distributions, capturing the behavior of data across different percentiles. This regression is particularly pertinent when dealing with asymmetrically (skewed) distributed responses.
Since the mean is not always indicative of the central tendency in skewed distributions, the median often serves as a more representative measure. In this context, fractile regression, which inherently models the median, emerges as a superior alternative for analyzing asymmetrically distributed data. Ordinary regression models using the mean response conditional on covariates often fall short, especially when data follow an asymmetric distribution or the focus is on parameters beyond the mean. In such instances, modeling the median response based on covariate values is a more advantageous method. Fractile regression models, originally introduced in [14], offer a broader perspective by encompassing median regression (50th percentile) and describing non-central distribution locations. This method has seen numerous adaptations and applications [15,16,17], making fractile regression preferable for asymmetric response variable distributions.
Parametric fractile regression links the response variable, a parametric component (the modeled fractile of the response), and an error component without requiring distributional assumptions for this error [18]. When assumptions are added, they are better suited to the response variable. Parameters are frequently estimated using the maximum likelihood method due to its advantageous properties [19], similar to generalized linear models (GLM) [20,21,22]. In GLM, the mean is modeled as a parameter of the assumed distribution, mirroring the fractile modeled by regression. Using a parametric distribution enables the application of the likelihood function for estimation, hypothesis testing, and local influence analysis [23].
Statistical modeling necessitates diagnostic analytics, such as global and local influence methods, and goodness-of-fit tests. Goodness-of-fit techniques, like the pseudo- R 2 , randomized fractile (RF) residuals, and generalized Cox–Snell (GCS) residuals [24,25], assess model adequacy relative to the data.
Current investigations on fractile regression and its applications reveal compelling studies such as those focused on extreme air pollution data [26], understanding heterogeneous effects of socio-demographic and economic factors on weight-for-height Z scores of children under 5 in Egypt [27], and the contribution of fractile regression in combating climate change [28], among many others.
Fractile regression has become a comprehensive method for the statistical analysis of both linear and non-linear response models. Fractile regression offers several benefits, including the following:
(i)
It describes the complete conditional distribution of a dependent (response) variable given the covariates.
(ii)
It offers robust estimated coefficients that are non-sensitive to outliers on the dependent variable.
(iii)
It generates more efficient estimators than those from ordinary least squares when the error term is non-normally distributed.
(iv)
It facilitates the interpretation of different solutions at different fractiles as variations in the response of the dependent variable to changes in the covariates at various points in its conditional distribution.
(v)
It allows easy representation of regression coefficient estimation via linear mathematical programming.
   Four equivalent mathematical definitions of fractile regression are stated next.   
(I)
Definition based on the conditional fractile function:
If we denote q p ( y | x ) as the p × 100 -th fractile of the dependent variable Y given X = x , then q p ( y | x ) can be obtained by solving
F ( q p ( y | x ) | x ) = P ( Y q p ( y | x ) | X = x ) = p ,
where F is the cumulative distribution of Y.
(II)
Definition based on the fractile regression model [29]:
Y = x β + ε ,
where the error term ε satisfies q p ( ε ) = 0 . In the traditional linear regression model, the error term is assumed to follow a Gaussian or normal distribution.
(III)
Definition based on a check function [14]:
min β Θ E [ ρ p ( Y X β ) | X = x ] ,
where Θ is the parameter space of β , p is the fractile of interest, and 
ρ p ( z ) = z ( p 1 { z < 0 } )
represents the check function used in fractile regression, with 1 { z < 0 } being the indicator function that takes the value one if z < 0 and zero otherwise.
(IV)
Definition based on the asymmetric Laplace density function [30]:
f ( ε ) exp i = 1 n ρ p ( y i x i β ) ,
where f is the probability density function of the model error.
The quantreg package of R software [31], version 4.2.2, used for fractile regression analysis, is based on the formulation given in [14]. This involves minimizing the check function ρ as presented in Definition III. Mathematically, it aims to find the value of the coefficients β that minimizes the objective function for a given quantile τ stated as
min β Θ i = 1 n ρ τ ( y i x i β ) ,
where y i is the i-th observed response, x i is the i-th observed vector of covariates, β is the vector of regression coefficients, τ is the fractile of interest (between 0 and 1), and  ρ τ ( u ) is the check function, defined as in (1), but with p being replaced by τ and z replaced by u.
The above-mentioned objective function sums absolute residuals, which are weighted by τ for observations above the fractile (that is, when y i x i β > 0 ) and by 1 τ for observations below the fractile (that is, when y i x i β 0 ). The check function ρ τ ( u ) assigns lower weights to residuals of one sign than the other, depending on the fractile τ . The asymmetry in weighting allows the minimization of the check function to estimate the τ × 100 -th fractile of the conditional distribution of the response variable given the covariate values.

2.2. Permutation Tests

Permutation tests, as non-parametric significance tests, are utilized for two or more samples. The premise of these tests is to reshuffle the observed data, compute the test statistic for each permutation, and construct a null distribution.
Permutation testing, a well-established theory, has been emphasized for its relevance in experimental work in the methodological literature [32]. Despite not being prevalent, published research utilizing permutation testing can be cited as the precedent. Examples span from earlier studies such as [33,34], mid-period studies [35,36,37], to more recent investigations [38,39,40,41,42,43]. The application of non-parametric permutation tests in analyzing experimental data is comprehensively surveyed in [44].
Consider T obs as the test statistic computed from the observed data. If the test aims to compare means between two groups, T obs can be the difference in means. The data from all groups are pooled together into one dataset. Group labels are then randomly reshuffled to generate permuted datasets. For each permuted dataset, a new test statistic, T perm , is calculated. This permutation process is typically repeated on the order of 10 4 times, resulting in a distribution of T perm under the assumption that there is no difference between groups. The p-value is determined as the fraction of permutations where T perm is as extreme as or more than T obs . If the p-value falls below a predetermined significance level (often 0.05), this assumption is rejected.
Following this explanation of permutation tests, it is pertinent to introduce the coin package of the R software. This package provides a flexible platform for conducting conditional inference procedures. It offers a variety of independence tests for nominal, ordinal, and numeric variables based on permutation or asymptotic linear rank statistics. The core feature of this package is its unified approach to computing the p-value under a specific assumption, making it applicable even for complex data structures and hypotheses.
Developed with a focus on advanced permutation testing procedures, the coin package expands the scope of traditional permutation tests to a broader range of statistical tests, thereby enabling the contrast of additional hypotheses. Its core functions include independence_test() for a general independence problem and oneway_test() for the one-way layout, with extensive options to control the test statistic type and the standardization method.

2.3. Bootstrap Method

Statistical inference in real data analysis can sometimes be challenging, especially in scenarios of variance estimation of a tricky estimator or when robust variance estimation is needed due to potentially invalid assumptions. The bootstrap method provides an elegant and automatic solution to such scenarios, allowing the calculation of various inferential quantities without requiring their analytical formula [45,46]. Under certain conditions, bootstrap estimators tend to be generally consistent [47] and can provide more accurate estimators than those based on asymptotic approximations [48].
In its early applications, the bootstrap method was often used with small datasets, given the computational limitations. The traditional version of bootstrapping involves resampling a number of observations with replacement from the same number (sample size) of data points corresponding to the original sample.
The bootstrap method is manageable if the sample size is moderate and the computation is executed on a single computer [49]. However, the advent of big data produces a problem as this method is not suitable for modern, large-scale datasets that exceed the main memory capacity of the computer. One recent study [50] provided a novel approach on this problem by developing a framework to find the optimal balance between statistical efficiency and computational costs in modern bootstrap methods. The approach involved maximizing a measure of efficiency subject to a constraint on running time, offering an intuitive procedure to balance these competing demands.
Importantly, for data with highly asymmetric distributions, bootstrap methods offer robust estimation procedures, making them a pertinent choice for complex inferential scenarios. The bootstrap method [45] is a resampling technique to estimate statistical parameters from a dataset sampled with replacement. A  resampling (bootstrap) procedure is presented in Algorithm 1.
Algorithm 1 Bootstrap procedure
Input: Original dataset X = { x 1 , , x n }
Input: Statistic of interest T ( X )
Input: Number of bootstrap samples B (commonly B 1000 )
for  b = 1 to B do
    Draw a sample X * of size n from X with replacement
    Compute the statistic T ( X * ) for the bootstrap sample
    Add T ( X * ) to the bootstrap distribution
end for
Output: Bootstrap distribution of T, used for estimating standard errors, constructing confidence intervals, or performing hypothesis tests
Output: Statistical inference using the bootstrap distribution of T
Owing to its robustness and efficiency, the bootstrap method is widely utilized across diverse scenarios, enabling inference for mean, median, variance, and more. Furthermore, it has found significant applications in machine learning fields [51,52,53]. For instance, in [54], it was employed the bootstrap technique to compute the prediction interval of mortgage rates, both for the traditional regression model and various robust regression models.
Despite its flexibility and no strict requirement for specific distribution assumptions, the bootstrap method may not always offer optimal performance for certain types of data or statistics. For instance, its application can be challenging for extreme percentiles. This emphasizes the importance of understanding the specific characteristics and distributions of the data before blindly applying bootstrap methods, ensuring the chosen method fits the nature of the data.

3. Case Study

In this section, an overview of the case study is provided.

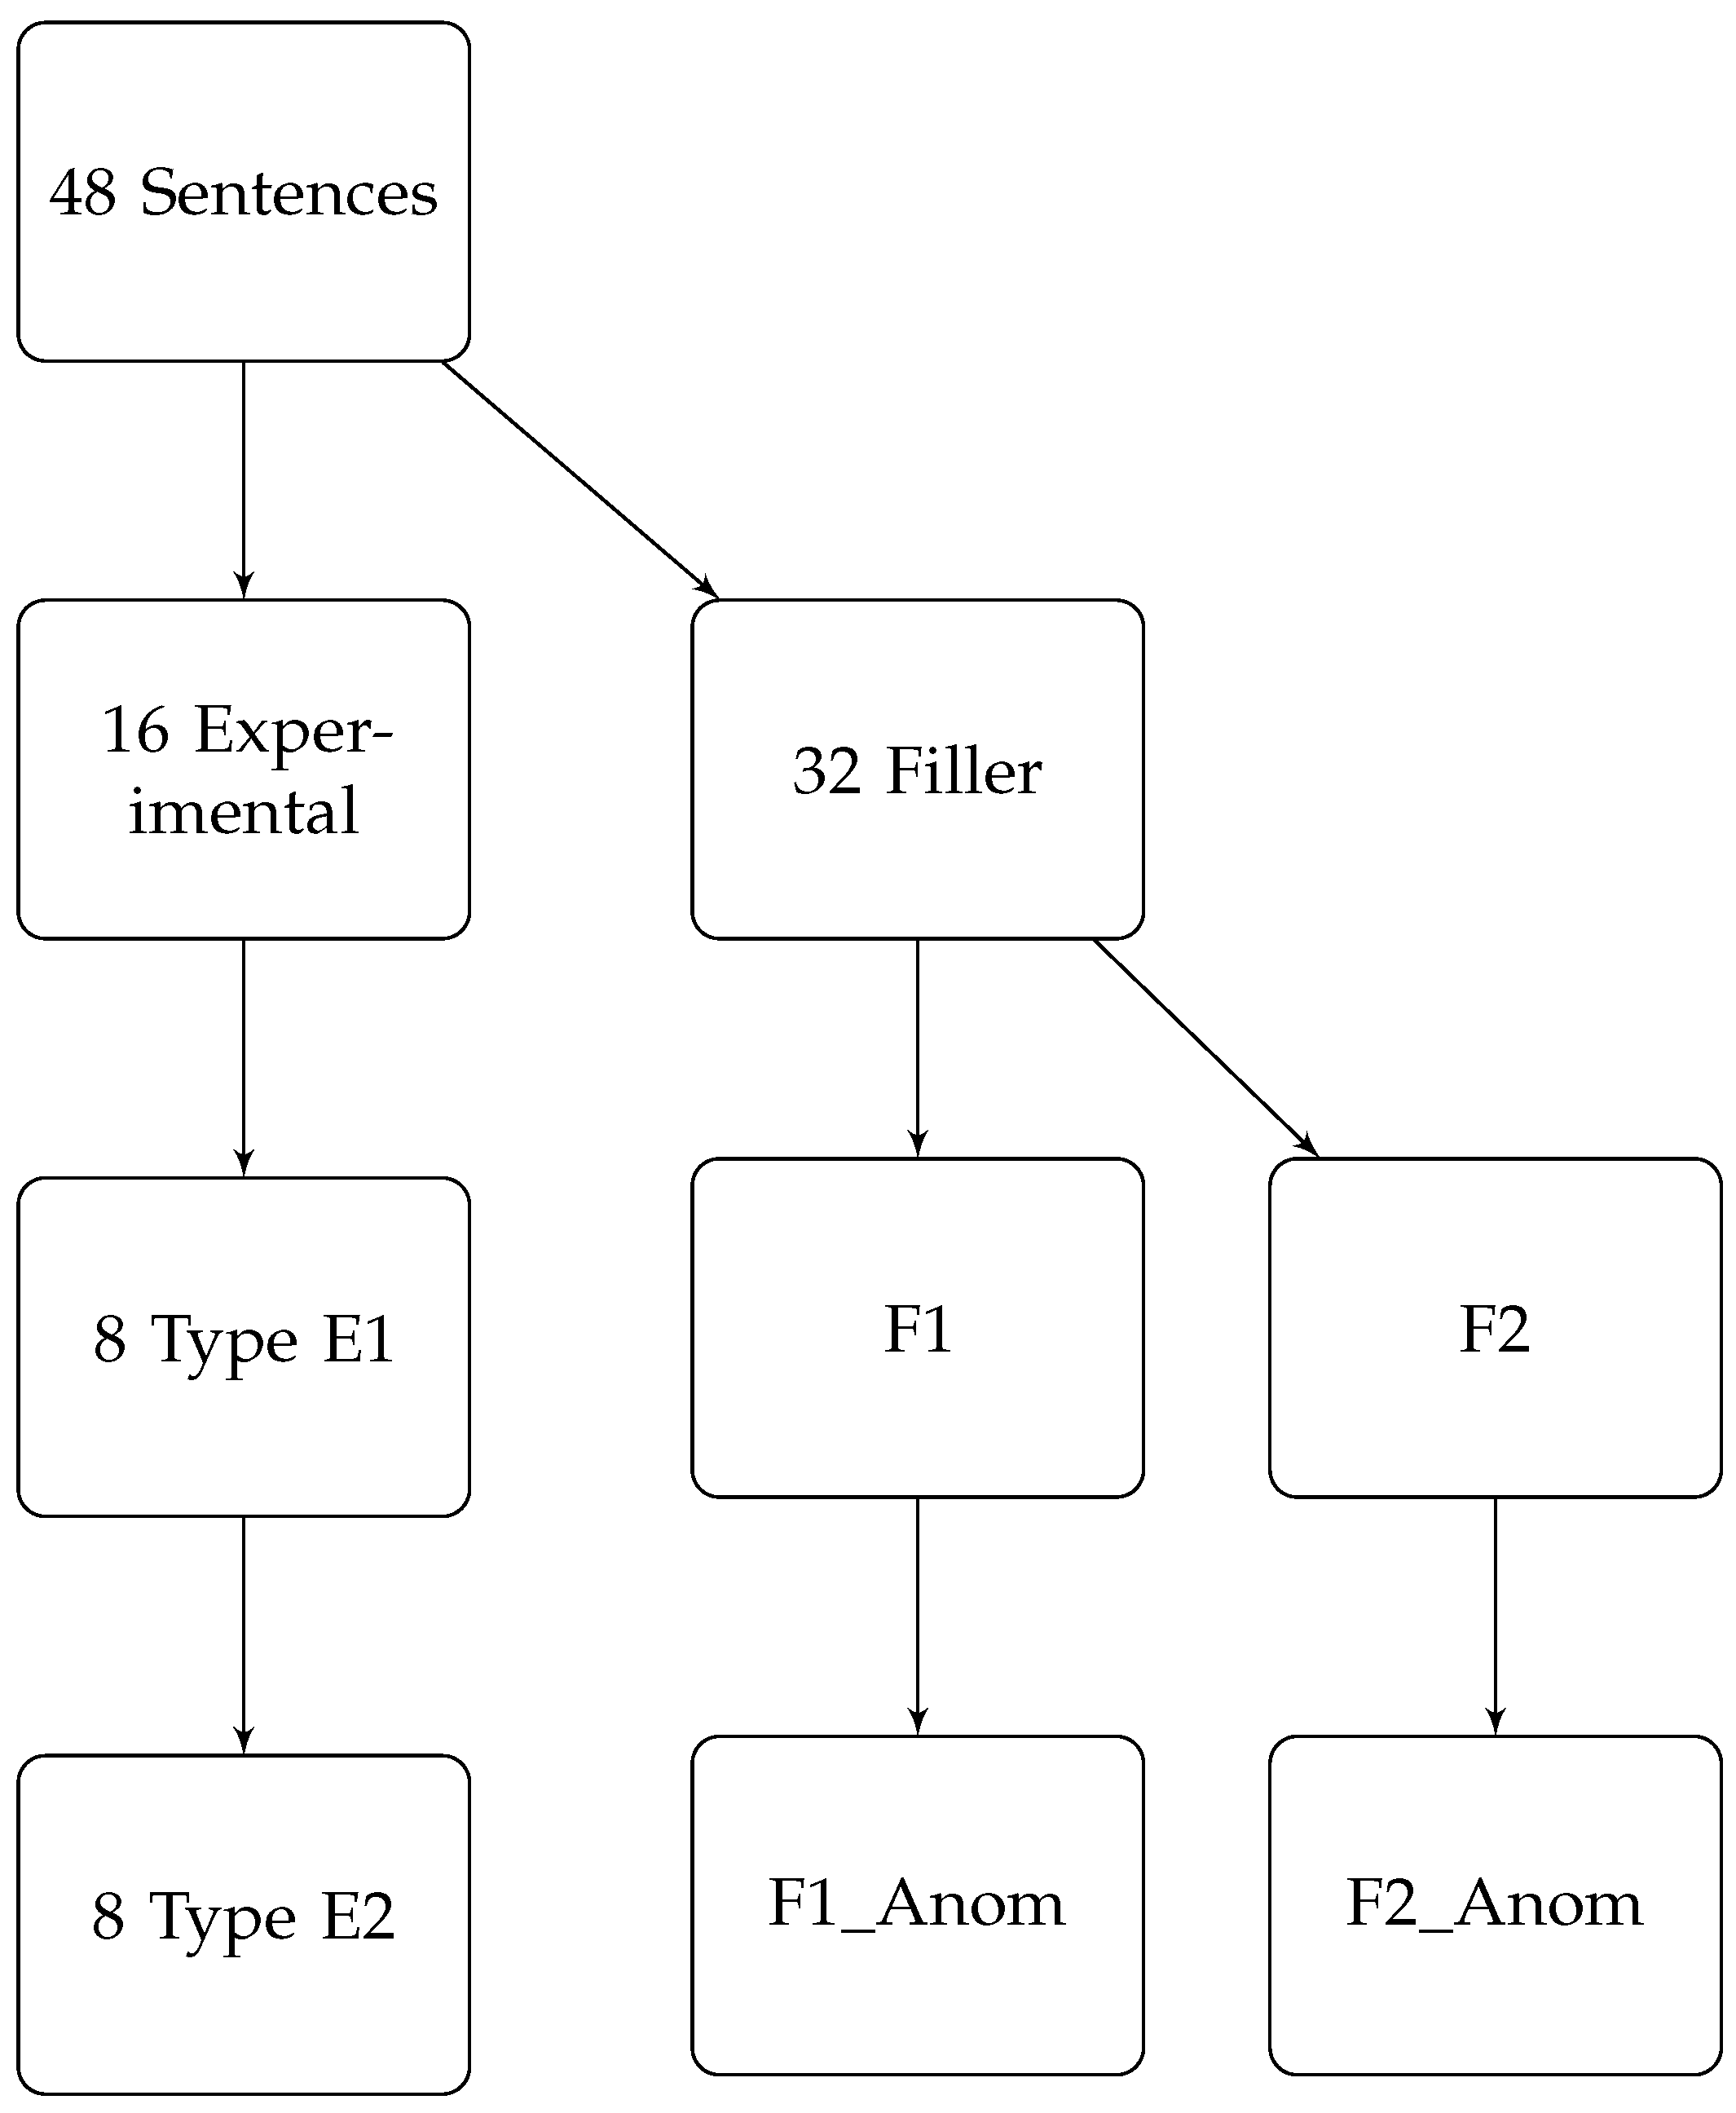
3.1. Experimental Design

The experimental design comprises 48 sentences: 16 are experimental sentences (8 of type E1 and 8 of type E2), while the remaining 32 are filler sentences. These filler sentences are further categorized into four groups: F1, F2, F1_Anom, and F2_Anom. The F1_Anom and F2_Anom groups contain anomalous versions of the F1 and F2 sentences, respectively. It is anticipated that participants will disagree with these anomalous sentences.
The mentioned sentences, both experimental and filler, were constructed based on linguistic parameters pertinent to the research’s objectives. These sentences underwent a preliminary round of validation with a smaller cohort of linguistics experts to ensure their relevance and clarity for the primary study. Based on feedback, necessary modifications were incorporated, ensuring that the selected sentences aptly represented the targeted linguistic phenomena.
The questionnaire was designed based on insights from established psycholinguistic studies to guarantee its reliability. It was pre-tested on a smaller group before the experiment to ensure that the instructions to participants were clear, the items provided were appropriate for the task, and it did not contain any typos or elements that might cause confusion. This allowed for an effective evaluation of participants’ responses.
The sentences were crafted following strict criteria to control variables that might influence measured times, such as sentence length and complexity.
We structured four question lists (L1 to L4) containing varying proportions of non-plausible (NP) filler sentences. Specifically, L1 contains 75% NP filler sentences, L2 has 50%, L3 comprises 25%, and L4 solely incorporates plausible filler sentences.
Participants are required to assess the plausibility of each sentence using a 7-point Likert scale, with 1 being “not at all plausible” and 7 indicating “totally plausible”. A detailed breakdown of the sentence types in the experimental design is depicted in Figure 1.
The questionnaire captures various types of data, including demographic records. The data are recorded using a tool specifically designed for the project [55]. The project received approval from the Ethics Committee for Research in Social Sciences and Humanities at the University of Minho (CEICSH 078/2021). For the scope of this study, we consider the following:
  • Participant ratings on the Likert scale.
  • Any alterations to the initial responses.
  • Frequency of response alterations.
  • Time taken to read the sentence or other stimuli (as an image, for example).
  • Time spent marking responses.
  • Time to submit responses before moving to the next sentence.
All time metrics are represented in milliseconds (ms).

3.2. Statistical Model and Considerations

Participants are randomly allocated to one of the four lists (L1 to L4). Each list hosts different participants. Given that every participant responds to multiple items within the same category and list, our design is of repeated measures. This design implies that data from the same individual are more correlated compared to those from different individuals. To cater this correlation, a mixed-effects model is deployed, more specifically, a fractile regression model incorporating a random effect for the participant. Moreover, the model evaluates interactions between the list and condition, and potential interactions between them and the acceptability rate. It is crucial to mention that the interaction between list and condition is not fully discernible because L4 lacks some condition levels. For the integration of an interaction term in the model, anomalous items are excluded.
The fractile regression was selected due to its proficiency in modeling specific response fractiles, enhancing its resilience against outliers and skewed distributions, which in turn bolsters the dependability and interpretability of our findings. Before deploying the fractile regression model, preliminary tests were conducted to explore potential correlations between our selected time metric and various covariates, such as other time metrics, list, condition, and acceptability. Additionally, we compared the distributions of the selected time metric across these covariates.
In this study, the analytical procedures detailed in the prior sections are demonstrated using a specific data subset. A preprocessing phase was incorporated, focusing on responses from participants who remained consistent in their answers. This was influenced by recent research, which posits that participants who modify their answers display distinct behavioral patterns, thus deserving an independent analysis [56]. Furthermore, the dataset was filtered to only include instances where the response duration was under 6000 ms, and the rating for anomalous sentences was three or less on the Likert scale. These tailored preprocessing stages facilitated the creation of a conducive analytical environment for the succeeding stages.
Subsequent to preprocessing, preliminary tests, like permutation tests and bootstrapping methodologies, were initiated. These tests provided initial insights into relationships of variables, guiding the structure of our advanced fractile regression model. This model compensates for associations unveiled in the preliminary tests, while also adjusting for other variables and addressing the intrinsic correlation of repeated measures within participants. Through these methodologies, we aspire to derive a deeper comprehension of how our variables of interest impact the outcome within our specific context. Upcoming sections will delineate the outcomes of our investigation and their relevance to our research objectives.
It is vital to highlight that, while the preprocessing decisions and initial tests are tailored to our dataset and research objectives, the methodologies applied, including the fractile regression model, are not strictly tied to these decisions and tests. These methodologies can be modified and implemented for various datasets and research scenarios as necessary.

3.3. Results and Discussion

Next, we present and discuss the results of the following analyses:
(i)
Bootstrap confidence intervals for the mean and median of time to respond (TTR) for each list (List), each condition (Condition), and each plausibility rate (Plaus).
(ii)
A test between TTR and time to submit (TTS), based on interaction with List.
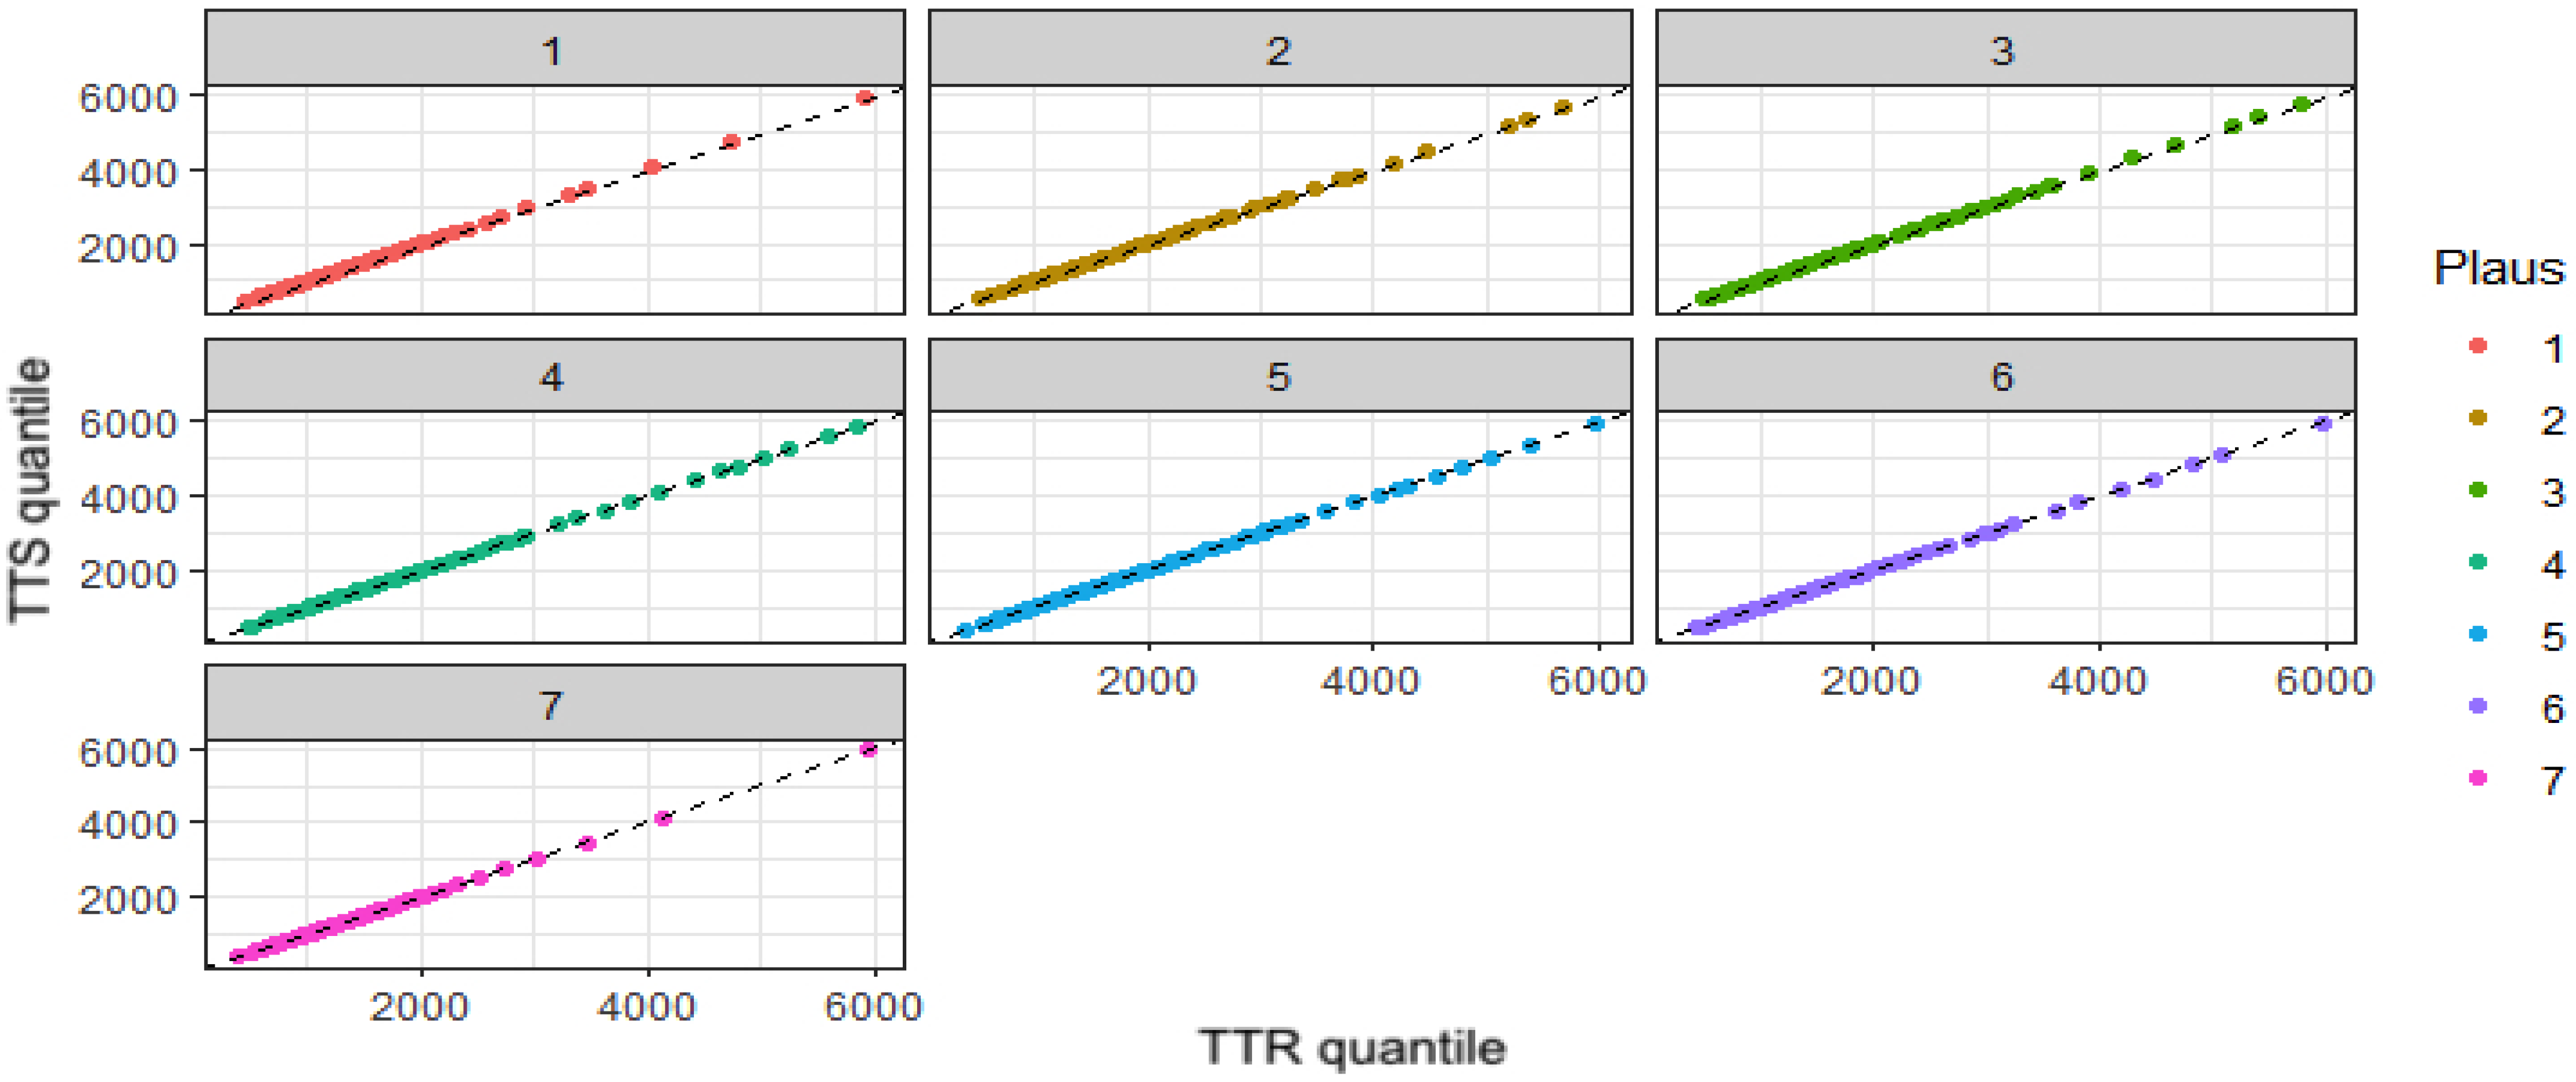
(iii)
Fractile plots to compare distributions of TTR and TTS in each level of Plaus.
(iv)
Fractile regression for the median TTR, including interaction between List and Plaus.
(v)
Fractile regression for the median TTR, including interaction between List and Plaus, with subject as a random effect.
Next, we regard a result as statistically significant if the p-value associated with its corresponding test is less than or equal to a significance level of 0.05 (5%). This level is widely used in many scientific disciplines, striking a balance between the risks of false positives and false negatives.
Our analysis starts with permutation tests to assess the independence between TTR and List, TTR and Condition, as well as TTR and Plaus. The results indicated high significance, leading us to employ bootstrapping when obtaining confidence intervals for the mean and median of TTR for each List, Condition, and Plaus level.
Before presenting the obtained confidence intervals, it is essential to clarify the terminologies used:
  • Mean_L and Median_L denote the lower bounds of the confidence intervals for the mean and median, respectively.
  • Mean_H and Median_H correspond to the upper bounds.
These bounds provide a range within which the true mean or median is likely to fall, given the collected data, with a 95% level of confidence. The confidence intervals are presented in Table 1, Table 2, Table 3, Table 4, Table 5 and Table 6, corresponding to List, Condition, and Plaus levels, respectively.
The relationship between TTR and List, as highlighted in Table 1 and Table 2, is intriguing. List L2, with 50% anomalous sentences, leads to a significantly longer response time, indicating cognitive challenges when processing mixed sentences. Moreover, the distinctions between Conditions E1, E2, F1, and F2, reported in Table 3 and Table 4, suggest the nature of anomalies significantly impacts response times. For instance, the shorter TTR for F1_Anom compared to E1 indicates anomalies in F1 are more straightforward, whereas those in E1 might be subtler. Plausibility ratings, as seen in Table 5 and Table 6, also play a pivotal role. Specifically, a TTR difference is noted when Plaus is 1, 2, 6, or 7. When Plaus is 7 (completely plausible), responses are quicker, aligning with prior knowledge. In contrast, Plaus 1 (highly implausible) takes longer due to cognitive dissonance. For Plaus 6 (mostly plausible with doubts), reconciling conflicting information can elevate cognitive load, leading to longer TTRs. The persistence of interaction between L4 and TTR across conditions, even after accounting for plausibility, hints at the distinct characteristics of L4, warranting further exploration. Additionally, the role of individual variability, seen by the significance of ’subject’ as a random effect, underscores the importance of individual differences in cognitive studies. In summary, the data unveil a complex relationship between list type, anomaly nature, and plausibility on the response times, laying a foundation for future studies on linguistic anomalies. The exact nature and extent of this relationship are further detailed in the ensuing analyses. Our findings include:
  • A notable effect of TTR on TTS, suggesting that as TTR values change, so do TTS values.
  • Variances in the plausibility rating, termed ’Plaus’, significantly influence TTS.
  • An intriguing interaction between TTR and Plaus concerning TTS, suggesting that the impact of TTR on TTS is influenced by Plaus levels and vice versa.
The plots in Figure 2 depict the empirical quantiles of TTS against the empirical quantiles of TTR for each plausibility level from 1 to 7. The near-perfect match of the points to the line y = x in most of the plots indicates a high correspondence between TTR and TTS. This high relationship holds for Plaus 3, 4, and 5 as well, demonstrating the consistency of the association across different levels of plausibility. However, there is an exception for Plaus 1, where the points deviate slightly above the line. This deviation in Plaus 1 may be attributed to the cognitive challenges associated with processing highly implausible sentences, leading to longer times to submit responses.
Pairwise Kolmogorov–Smirnov tests, employed to compare TTR and TTS distributions across various Plaus levels, revealed significant differences at extremes: Plaus levels 1 and 7. Notably, the distributions for these two levels stand apart from other Plaus levels but are not significantly different from each other.
This suggests that extreme plausibility judgments (either highly plausible or highly implausible) have a distinct impact on response times compared to more moderate judgments. Such patterns might be attributed to a common tendency in Likert-type scales, where respondents often gravitate toward extreme responses. Additionally, the cognitive demands associated with processing extreme plausibility judgments might explain the variances in time distributions. Clear-cut judgments, either entirely plausible or implausible, can lead to quicker response times, while ambiguous judgments might necessitate longer contemplation.
We constructed two models to analyze TTR, considering the influence of both List and Plaus as well as their interaction. The first model lacks random effects, while the second incorporates the subject as a random effect. Our analyses reveal the subtleties of adding a subject as a random effect in understanding the relationship between TTR and TTS. When we incorporate the subject as a random effect, certain interactions that were originally deemed significant in the model without a random effect change losing their significance. This change emphasizes the importance of accounting for repeated measures and the inherent correlation structure within subjects, as failing to do so could lead to misleading results. Table 7 provides a detailed breakdown of our findings.
A striking observation is the consistent interaction between List L4 and a Plaus rating of 7. This interaction, while slightly diminished when a random effect is added, remains evident. It suggests a unique relationship between the items in List L4 and responses when sentences are deemed entirely plausible (Plaus 7). Further exploration of this interaction could shed light on the specific factors that contribute to this effect. Additionally, the significance of the Plaus variable in the model, even after adjusting for individual variances, underscores the pivotal role that plausibility plays in determining response times.
Our analysis shows that response times are influenced by a combination of factors, including the nature of item lists, the presence of linguistic anomalies, and the plausibility ratings. The complex interactions among these factors highlight the importance of a multidimensional approach when interpreting the type of data we analyze. Importantly, our results emphasize the role of individual variations in shaping response times, as evidenced by the significance of the subject as a random effect. These insights lay the groundwork for further research into the cognitive processes underlying language comprehension and plausibility judgments.

4. Conclusions

In this section, we summarize the key findings of our study, highlighting our innovative methodology to psycholinguistic data analysis, the implications of our research for both theory and practice, and the potential for future developments in the field.

4.1. Contributions of the Study

Our study provides several important contributions to the field of psycholinguistic data analysis:
  • [Innovative statistical methods] Our study introduces and utilizes advanced statistical methods, including permutation tests, bootstrap confidence intervals, and fractile regression (with and without random effects). These methods offer a nuanced approach to data analysis, especially when confronted with skewed distributions, and they provide a robust understanding of interactions between variables in psycholinguistic experiments.
  • [Blending traditional and advanced mathematical tools] Our research integrates traditional statistical techniques with advanced mathematical tools stemming from fractal and fractional mathematics. Applying these concepts leads to increased precision and reveals intricate patterns in the data previously overlooked.
  • [Comprehensive understanding of language processing]: Our findings delve deeper into the intricacies of language processing, emphasizing the importance of individual variations. These variations, when viewed in light of behaviors associated with decision-making during language tasks, reveal intricate patterns. Such patterns can differentiate between response patterns that originate from specific linguistic processes and those influenced by broader psychological mechanisms.
  • [Future software development] Recognizing the potential of our methodological advances, we are in the process of developing a user-friendly software tailored for linguists and other professionals. Our software will incorporate the advanced statistical techniques presented in this study, enabling more sophisticated and precise analyses of psycholinguistic data. The development aims to democratize access to our methods, making them more accessible to a wider audience.
  • [Potential for broader application] Our research, while focused on psycholinguistic data, offers a versatile methodological approach that could be applied to other domains where data complexity poses challenges. Introducing these techniques in different fields could lead to more comprehensive and nuanced analyses of complex datasets.
In summary, our study significantly contributes to the field of psycholinguistic data analysis by introducing innovative statistical methods, emphasizing the importance of individual variations, and laying the groundwork for future software development and broader applications of our methodology.

4.2. Theoretical and Practical Reflexes and Implications

Our study contributes to the existing knowledge in psycholinguistic data analysis. Traditional statistical methods proved to be inadequate for our needs due to skewed distributions of metric data, specifically the distributions observed in the time individuals spend executing tasks involving reading times, the time taken to respond, and the time taken to submit the response. The depth of our insights demonstrates the importance of methodological precision in extracting meaningful conclusions.
The methods we use bridge traditional techniques with advanced mathematical tools, providing increased precision and capturing nuances previously overlooked. Our study stands out from existing approaches in the literature due to its adoption of sophisticated mathematical tools. Our approach is significantly influenced by the principles of fractal and fractional mathematics, which are known for their ability to address complexity. This underscores the critical role of advanced mathematical tools in dissecting intricate datasets.
The innovation in our study is the transformative power it brings by leveraging permutation tests, bootstrap confidence intervals, and especially fractile regression. Our method offers a fresh perspective on psycholinguistic data and has the potential to redefine best practices in the field. It could prove invaluable for analysts and decision-makers looking to derive richer insight from their data. While our focus is on psycholinguistic experiments, the versatility of our tools suggests their potential application in a wide range of domains, especially where data complexity poses challenges.
Currently, the market is experiencing a growing demand for sophisticated analytical software. Our introduced methodologies have the potential to meet this need by offering more nuanced and detailed insights into psycholinguistic data. However, the complexity inherent in our methods may pose challenges for those new to the field. Then, we have an opportunity to develop software that simplifies these techniques while retaining their analytical power, striking a balance between granularity and interpretability. In doing so, our approach could reshape the landscape of psycholinguistic data analysis tools, ensuring that the allure of complexity does not overshadow the fundamental need for clarity.

4.3. Limitations, Challenges, and Difficulties

While our study provides potential transformative approaches to the practice of analyzing psycholinguistic data, it is essential to acknowledge several limitations, challenges, and difficulties encountered.
One of the primary limitations we faced was the inadequacy of traditional statistical methods for our specific needs, as our dataset contained asymmetric distributions of metric data. This asymmetry was particularly evident in the time individuals spent executing reading tasks, time taken to respond, and time taken to submit responses. Such a limitation prompted our exploration into more advanced statistical techniques, such as permutation tests, bootstrap confidence intervals, and fractile regression. However, while these advanced methods provide a nuanced understanding of our data, they come with inherent complexity. The sophistication of these methods, especially fractile regression, could pose challenges for those new to the field. We find that there is a trade-off between the granularity of the insights these methods offer and their interpretability. Our study incorporates mathematical tools that may be unfamiliar to many researchers in the field of psycholinguistics. The high level of sophistication inherent in our approach can be a significant barrier for those with limited exposure to advanced mathematical concepts, emphasizing the need for efforts to democratize access to these methods, such as through creating intuitive interfaces or user-friendly tools. Furthermore, our research has laid promising groundwork, but there remains room for progression. Future developments in the field should address the challenges posed by the complexity of the methods we introduced. As data continue to evolve in complexity, it will become increasingly urgent for researchers to refine their analytical methods to handle multifaceted data effectively.
In conclusion, while our study introduces innovative methodologies to the field of psycholinguistic data analysis, it is essential to consider the limitations, challenges, and difficulties inherent in our approach.

4.4. Future Developments and Implications

Our findings underline the complex interplay of general and individual processes in language processing. Recognizing the nuances these present, it is imperative that future research in psycholinguistics explores the individual variations, providing insights into the intricate cognitive dynamics at play.
The potential of our methodological advancements led us to initiate the development of a user-friendly software tailored for linguists and professionals alike. Our platform, which presently records responses and response times, is also undergoing enhancement to incorporate the advanced statistical methodologies presented in this study, particularly focusing on reading times, response times, and submission times.
Our adopted methods, while providing deeper insights, come with their own set of complexities. To make these methods more accessible, we emphasize the importance of encapsulating them in intuitive interfaces. Such a democratization of access ensures that a broader audience can benefit without being overwhelmed by the intricacies.
As data continue to grow in complexity, our call for advanced analytical methods becomes all the more relevant. Our plea underscores the need for rigorous mathematical methodologies in scientific exploration, particularly in an era where intricate nature of data presents constant challenges to researchers.

Author Contributions

Conceptualization, C.C., V.L., M.d.C.L.-G. and A.P.A.: data curation, C.C.: formal analysis, C.C. and V.L.: investigation, C.C., V.L., M.d.C.L.-G. and A.P.A.: methodology, C.C., V.L., M.d.C.L.-G. and A.P.A.: writing—original draft, M.d.C.L.-G. and A.P.A.: writing—review and editing, V.L. and C.C. All authors have read and agreed to the published version of the manuscript.

Funding

This research is partially funded by FONDECYT, grant number 1200525 (V.L.) from the National Agency for Research and Development (ANID) of the Chilean government under the Ministry of Science, Technology, Knowledge, and Innovation, and by Portuguese funds through the CMAT—Research Centre of Mathematics of the University of Minho, within projects UIDB/00013/2020 and UIDP/00013/2020 (C.C.). Additionally, research at the Centre for Humanistic Studies (CEHUM) was funded by the FCT-Foundation for Science and Technology, reference CEECIND/04331/2017.

Institutional Review Board Statement

Not applicable.

Informed Consent Statement

Not applicable.

Data Availability Statement

Data and codes are available upon request from the authors.

Acknowledgments

The authors would also like to thank the editors and reviewers for their constructive comments, which improved the presentation of the manuscript.

Conflicts of Interest

The authors declare no conflict of interest.

References

  1. Altman, G.T.M. The language machine: Psycholinguistics in review. Br. J. Psychol. 2001, 92, 129–170. [Google Scholar] [CrossRef]
  2. Li, S.; Chen, J.; Li, B. Estimation and testing of random effects semiparametric regression model with separable space-time filters. Fractal Fract. 2022, 6, 735. [Google Scholar] [CrossRef]
  3. Christianson, K.; Dempsey, J.; Tsiola, A.; Goldshtein, M. What if they’re just not that into you (or your experiment)? On motivation and psycholinguistics. In The Psychology of Learning and Motivation; Academic Press: Cambridge, MA, USA, 2022; Volume 76, pp. 51–88. [Google Scholar]
  4. Qian, Z.; Garnsey, S.; Christianson, K. A comparison of online and offline measures of good-enough processing in garden-path sentences. Lang. Cogn. Neurosci. 2018, 33, 227–254. [Google Scholar] [CrossRef]
  5. Ferreira, F.; Yang, Z. The problem of comprehension in Psycholinguistics. Discourse Process. 2019, 56, 485–495. [Google Scholar] [CrossRef]
  6. Chen, Y.; Wang, H.; Li, S.; Dong, R. A novel grey seasonal model for natural gas production forecasting. Fractal Fract. 2023, 7, 422. [Google Scholar] [CrossRef]
  7. van Doorn, J.; Aust, F.; Haaf, J.M.; Stefan, A.M.; Wagenmakers, E.J. Bayes factors for mixed models. Comput. Brain Behav. 2023, 6, 13–26. [Google Scholar] [CrossRef]
  8. Korkmaz, M.Ç.; Leiva, V.; Martin-Barreiro, C. The continuous Bernoulli distribution: Mathematical characterization, fractile regression, computational simulations, and applications. Fractal Fract. 2023, 7, 386. [Google Scholar] [CrossRef]
  9. Leiva, V.; Mazucheli, J.; Alves, B. A novel regression model for fractiles: Formulation, computational aspects, and applications to medical data. Fractal Fract. 2023, 7, 169. [Google Scholar] [CrossRef]
  10. Vasishth, S.; Yadav, H.; Schad, D.J.; Nicenboim, B. Sample size determination for Bayesian hierarchical models commonly used in psycholinguistics. Comput. Brain Behav. 2023, 6, 102–126. [Google Scholar] [CrossRef]
  11. Kim, I.; Balakrishnan, S.; Wasserman, L. Minimax optimality of permutation tests. Ann. Stat. 2022, 50, 225–251. [Google Scholar] [CrossRef]
  12. Zhao, W.; Liu, D.; Wang, H. Sieve bootstrap test for multiple change points in the mean of long memory sequence. AIMS Math. 2022, 7, 10245–10255. [Google Scholar] [CrossRef]
  13. Zhao, Q.; Zhang, C.; Wu, J.; Wang, X. Robust and efficient estimation for nonlinear model based on composite quantile regression with missing covariates. AIMS Math. 2022, 7, 8127–8146. [Google Scholar] [CrossRef]
  14. Koenker, R.; Bassett, G. Regression quantiles. Econometrica 1978, 46, 33–50. [Google Scholar] [CrossRef]
  15. Hao, L.; Naiman, D.Q. Quantile Regression; Sage Publications: Thousand Oaks, CA, USA, 2007. [Google Scholar]
  16. Davino, C.; Furno, M.; Vistocco, D. Quantile Regression: Theory and Applications; Wiley: Hoboken, NJ, USA, 2013. [Google Scholar]
  17. Koenker, R.; Chernozhukov, V.; He, X.; Peng, L. Handbook of Quantile Regression; CRC Press: Boca Raton, FL, USA, 2018. [Google Scholar]
  18. Sánchez, L.; Leiva, V.; Saulo, H.; Marchant, C.; Sarabia, J.M. A new quantile regression model and its diagnostic analytics for a Weibull distributed response with applications. Mathematics 2021, 9, 2768. [Google Scholar] [CrossRef]
  19. Davison, A.C. Statistical Models; Cambridge University Press: Cambridge, UK, 2003. [Google Scholar]
  20. McCullagh, P.; Nelder, J.A. Generalized Linear Models; Chapman and Hall: London, UK, 1983. [Google Scholar]
  21. Sánchez, L.; Leiva, V.; Galea, M.; Saulo, H. Birnbaum-Saunders quantile regression and its diagnostics with application to economic data. Appl. Stoch. Model. Bus. Ind. 2021, 37, 53–73. [Google Scholar] [CrossRef]
  22. Saulo, H.; Dasilva, A.; Leiva, V.; Sánchez, L.; de la Fuente-Mella, H. Log-symmetric quantile regression models. Stat. Neerl. 2022, 76, 124–163. [Google Scholar] [CrossRef]
  23. Cook, R.D.; Weisberg, S. Residuals and Influence in Regression; Chapman and Hall: London, UK, 1982. [Google Scholar]
  24. Dunn, P.; Smyth, G. Randomized quantile residuals. J. Comput. Graph. Stat. 1996, 5, 236–244. [Google Scholar]
  25. Saulo, H.; Leão, J.; Leiva, V.; Aykroyd, R.G. Birnbaum-Saunders autoregressive conditional duration models applied to high-frequency financial data. Stat. Pap. 2019, 60, 1605–1629. [Google Scholar] [CrossRef]
  26. Saulo, H.; Vila, R.; Bittencourt, V.L.; Leao, J.; Leiva, V.; Christakos, G. On a new extreme value distribution: Characterization, parametric quantile regression, and application to extreme air pollution events. Stoch. Environ. Res. Risk Assess. 2023, 37, 1119–1136. [Google Scholar] [CrossRef]
  27. Abdulla, F.; El-Raouf, M.A.; Rahman, A.; Aldallal, R.; Mohamed, M.S.; Hossain, M.M. Prevalence and determinants of wasting among under-5 Egyptian children: Application of quantile regression. Food Sci. Nutr. 2023, 11, 1073–1083. [Google Scholar] [CrossRef] [PubMed]
  28. Wang, L.; Xia, M. Quantile regression applications in climate change. In Encyclopedia of Data Science and Machine Learning; IGI Global: Hershey, PA, USA, 2023; pp. 2450–2462. [Google Scholar]
  29. Bailar, B.A. Salary survey of U.S. colleges and universities offering degrees in statistics. Amstat News 1991, 182, 3. [Google Scholar]
  30. Yu, K.; Moyeed, R.A. Bayesian quantile regression. Stat. Probab. Lett. 2001, 54, 437–447. [Google Scholar] [CrossRef]
  31. R Development Core Team. R: A Language and Environment for Statistical Computing; R Foundation for Statistical Computing: Vienna, Austria, 2023. [Google Scholar]
  32. Moir, R. A Monte Carlo analysis of the fisher randomization technique: Reviving randomization for experimental economists. Exp. Econ. 1998, 1, 87–100. [Google Scholar] [CrossRef]
  33. Sherstyuk, K. Collusion without conspiracy: An experimental study of one-sided auctions. Exp. Econ. 1999, 2, 59–75. [Google Scholar] [CrossRef]
  34. Abbink, K. Staff rotation as an anti-corruption policy: An experimental study. Eur. J. Political Econ. 2004, 20, 887–906. [Google Scholar] [CrossRef]
  35. Orzen, H. Counterintuitive number effects in experimental oligopolies. Exp. Econ. 2008, 11, 390–401. [Google Scholar] [CrossRef]
  36. Anderson, L.R.; DiTraglia, F.J.; Gerlach, J.R. Measuring altruism in a public goods experiment: A comparison of U.S. and Czech subjects. Exp. Econ. 2011, 14, 426–437. [Google Scholar] [CrossRef]
  37. Sieberg, K.; Clark, D.; Holt, C.A.; Nordstrom, T.; Reed, W. An experimental analysis of asymmetric power in conflict bargaining. Games Econ. Behav. 2013, 4, 375–397. [Google Scholar] [CrossRef]
  38. Nosenzo, D.; Quercia, S.; Sefton, M. Cooperation in small groups: The effect of group size. Exp. Econ. 2015, 18, 4–14. [Google Scholar] [CrossRef]
  39. Rosokha, Y.; Younge, K. Motivating innovation: The effect of loss aversion on the willingness to persist. Rev. Econ. Stat. 2020, 102, 569–582. [Google Scholar] [CrossRef]
  40. Erkal, N.; Gangadharan, L.; Koh, B.H. Replication: Belief elicitation with quadratic and binarized scoring rules. J. Econ. Psychol. 2020, 81, 102315. [Google Scholar] [CrossRef]
  41. Kujansuua, E.; Schram, A. Shocking gift exchange. J. Econ. Behav. Organ. 2021, 188, 783–810. [Google Scholar] [CrossRef]
  42. Stephenson, D.G.; Brown, A.L. Playing the field in all-pay auctions. Exp. Econ. 2021, 24, 489–514. [Google Scholar] [CrossRef]
  43. Schram, A.; Zheng, J.D.; Zhuravleva, T. Corruption: A cross-country comparison of contagion and conformism. J. Econ. Behav. Organ. 2022, 193, 497–518. [Google Scholar] [CrossRef]
  44. Holt, C.A.; Sullivan, S.P. Permutation tests for experimental data. Exp. Econ. 2023. [Google Scholar] [CrossRef] [PubMed]
  45. Efron, B. More efficient bootstrap computations. J. Am. Stat. Assoc. 1990, 85, 79–89. [Google Scholar] [CrossRef]
  46. Efron, B.; Tibshirani, R.J. An Introduction to the Bootstrap; CRC Press: Boca Raton, FL, USA, 1994. [Google Scholar]
  47. Van Der Vaart, A.W.; Wellner, J.A. Weak Convergence and Empirical Processes; Springer: New York, NY, USA, 1996. [Google Scholar]
  48. Hall, P. Methodology and Theory for the Bootstrap. In Handbook of Econometrics; Springer: Berlin/Heidelberg, Germany, 1994; Volume 4, pp. 2341–2381. [Google Scholar]
  49. Booth, J.G.; Hall, P. Monte Carlo approximation and the Iterated Bootstrap. Biometrika 1994, 81, 331–340. [Google Scholar] [CrossRef]
  50. Ma, Y.; Leng, C.; Wang, H. Optimal subsampling bootstrap for massive data. J. Bus. Econ. Stat. 2023. [Google Scholar] [CrossRef]
  51. Huang, A.A.; Huang, S.Y. Increasing transparency in machine learning through bootstrap simulation and shapely additive explanations. PLoS ONE 2023, 18, e0281922. [Google Scholar] [CrossRef]
  52. Michelucci, U.; Venturini, F. Estimating neural network’s performance with bootstrap: A tutorial. Mach. Learn. Knowl. Extr. 2021, 3, 357–373. [Google Scholar] [CrossRef]
  53. Kouritzin, M.A.; Styles, S.; Vritsiou, B.H. A bootstrap algorithm for fast supervised learning. arXiv 2023, arXiv:2305.03099. [Google Scholar]
  54. Wang, D.; Sun, R.; Green, L. Prediction intervals of loan rate for mortgage data based on bootstrapping technique: A comparative study. Math. Found. Comput. 2023, 6, 280–289. [Google Scholar] [CrossRef]
  55. Lourenço-Gomes, M.C. Assessing Participants’ Actions and Time in Performing Acceptability Judgment Tasks through a Dedicated Web-Based Application; Institute of Arts and Humanities/Center for Humanistic Studies, University of Minho: Braga, Portugal, 2018. [Google Scholar]
  56. Lourenço-Gomes, M.C.; Castro, C.; Amorim, A.; Bezerra, G. Tracking participants’ behaviour when performing linguistic tasks. In Proceedings of the 13th International Conference of Experimental Linguistics, Paris, France, 17–19 October 2022; pp. 113–116. [Google Scholar]
Figure 1. Schematic representation of the sentence types in the experimental design.
Fractalfract 07 00670 g001
Figure 2. Empirical quantiles of TTS against the empirical quantiles of TTR for each plausibility level from 1 to 7.
Fractalfract 07 00670 g002
Table 1. Bootstrap confidence interval TTR (mean) per List.
ListMeanMean_LMean_HSD
L1_751383.141346.251422.52792.37
L2_501598.691551.431645.61927.27
L3_251486.081441.981530.81909.35
L4_zero1398.591360.871437.72873.09
Note: ‘Mean_L’ and ‘Mean_H’ represent the lower and upper bounds, respectively, of the confidence interval for the mean.
Table 2. Bootstrap confidence interval TTR (median) per List.
ListMedianMedian_LMedian_H
L1_751175.851151.001204.63
L2_501351.851308.441397.82
L3_251227.501189.501261.21
L4_zero1144.001115.001171.60
Note: ‘Median_L’ and ‘Median_H’ represent the lower and upper bounds, respectively, of the confidence interval for the median.
Table 3. Bootstrap confidence interval TTR (mean) per Condition.
ConditionMeanMean_LMean_HSD
F1_Anom1330.411277.141385.07747.47
F2_Anom1569.761497.161642.31912.62
E11532.531482.331583.64906.10
E21476.831426.651527.69874.30
F11463.031417.421505.14905.98
F21415.801371.791459.10875.93
Note: ‘Mean_L’ and ‘Mean_H’ represent the lower and upper bounds, respectively, of the confidence interval for the mean.
Table 4. Bootstrap confidence interval TTR (median) per Condition.
ConditionMedianMedian_LMedian_H
F1_Anom1148.601118.001188.90
F2_Anom1296.751244.101349.30
E11532.531217.581313.32
E21476.831178.291262.92
F11463.031164.501250.50
F21415.801145.101202.75
Note: ‘Median_L’ and ‘Median_H’ represent the lower and upper bounds, respectively, of the confidence interval for the median.
Table 5. Bootstrap confidence interval TTR (mean) per Plaus.
Plaus_RateMeanMean_LMean_HSD
1 11380.461344.201423.82787.18
2 21805.981708.421909.951021.01
5 31735.591622.371851.051088.45
7 41842.681718.021968.541133.61
6 51850.341750.321950.061131.18
4 61602.791536.411669.83987.20
3 71278.971253.891306.40683.59
Note: ‘Mean_L’ and ‘Mean_H’ represent the lower and upper bounds, respectively, of the confidence interval for the mean.
Table 6. Bootstrap confidence interval TTR (median) per Plaus.
Plaus_RateMedianMedian_LMedian_H
1 11184.101155.701209.35
2 21417.001357.001539.40
5 31432.401327.071579.05
7 41515.801442.501617.00
6 51455.001372.401552.50
4 61277.001208.201335.10
3 71115.001096.301136.60
Note: ‘Median_L’ and ‘Median_H’ represent the lower and upper bounds, respectively, of the confidence interval for the median.
Table 7. Fractile regression model for TTR.
p-Value ( β )
Fixed (No Random) EffectRandom Effect
L3: Plaus70.028 ( β ^ = 144.0 )
L4: Plaus70.002 ( β ^ = 232.9 )0.082 ( β ^ = 309.5 )
Plaus2 0.009 ( β ^ = 367.3 )
Plaus3 0.015 ( β ^ = 474.7 )
Plaus4 0.075 ( β ^ = 327.2 )
Plaus5 0.001 ( β ^ = 600.6 )
Plaus6 0.001 ( β ^ = 194.2 )
Disclaimer/Publisher’s Note: The statements, opinions and data contained in all publications are solely those of the individual author(s) and contributor(s) and not of MDPI and/or the editor(s). MDPI and/or the editor(s) disclaim responsibility for any injury to people or property resulting from any ideas, methods, instructions or products referred to in the content.

