1. Introduction
The unprecedented COVID-19 pandemic shocked global financial markets, including cryptocurrency, commodities, and related crude oil energy markets. Numerous studies have studied the impacts of the COVID-19 outbreak, especially on cryptocurrency markets (e.g., [
1,
2,
3]) and equity markets (e.g., [
4,
5]), commodity markets (e.g., [
6]), crude oil markets ([
7,
8]), foreign exchange (FX) markets ([
9,
10]), and macroeconomic policy ([
11,
12]). Given the evidence, many mainstream studies have investigated the potential shock of the COVID-19 pandemic.
Elgin et al. [
13] have documented the sustainable volatility driven by the turmoil of the pandemic and the subsequent increases in global markets. The recent literature has also investigated the performance of cryptocurrencies post-COVID-19 pandemic. Lahmiri et al. [
14] have pointed out that the Bitcoin market showed irregularity, larger instability, and the characteristics of long memory and multifractality during the pandemic. Sarkodie et al. [
15] have explored the implication of the COVID-19 pandemic on the price volatility of several major cryptocurrencies. However, the empirical relationships between cryptocurrency, global sustainable financial markets and the COVID-19 pandemic have been under-investigated. For the purpose of identifying research gaps, the major scope of this study provides fresh evidence that the persistence level in the Bitcoin and sustainable financial markets experienced adverse reactions to the COVID-19 outbreak. Additionally, few studies have taken wavelets into consideration to distinguish co-movements between Bitcoin and sustainable finance in the frequency and time dimensions. Notably, our work highlights the important matter of conducting long-range dependence and fractal analyses of the Bitcoin and sustainable financial markets during economic shocks and turmoil periods, such as the COVID-19 disturbance and climate extremes. In the relevant literature review, Jalan et al. [
16] and Yarovaya et al. [
17] found evidence that crashing cryptos do not recover or bounce back during times of crisis when there is much disturbance caused by an extreme external event, such as the COVID-19 pandemic outbreak. It was found that cryptocurrencies have a volatile and unpredictable nature, and these cryptocurrencies are also highly risky in non-crises eras concerning the unpredictability of returns (e.g., [
18]). Contrastingly, the evidence of long memory and fractal connectivity and their implications for market efficiency resembles that of [
19,
20,
21]. The authors investigated the market efficiency or inefficiency of crypto-assets, employing long-rang dependence methods. Other studies, such as that of Keshari Jena et al. [
22], provide evidence that Bitcoin is the third most inefficient cryptocurrency, while DASH and NEM have been found to be the most inefficient cryptocurrencies.
Loosely speaking, gold, in particular, is considered a dominant safe haven property for market participants and portfolio managers during crisis times [
18,
23,
24]. On the other hand, there is a question as to whether Bitcoin and sustainable financial markets may play the role of a safe haven asset amid concerns due to pandemic turmoil. This study aims to answer this question.
Additionally, the rapidly growing literature on climate finance has identified that green bonds and ESG assets can be effective hedging tools against climate risk [
25]. Moreover, both green bonds and clean energy equities can offer diversification benefits for market participants with energy equities [
26,
27]. As concern over the systemic risk of global warming and climate change continues, attention is being drawn to reducing the idiosyncratic risk of carbon assets. To achieve the objective of promoting ESG transparency, S&P Dow Jones Indices LLC provides four carbon exposure metrics for world carbon-efficient indices to aid investors in measuring, recognizing, and administrating carbon risk.
According to the S&P Dow Jones Indices, the carbon exposure metrics are as follows:
- (1)
Carbon footprint: The primary and operational supply chain carbon footprints of the index components per USD one million in investment are aggregated.
- (2)
Weighted average carbon intensity: The intensity-weighted mean of the individual corporate intensities, weighted as proportions of each component of the index.
- (3)
Carbon efficiency: The primary and operational supply chain carbon footprints of index components per USD one million in revenues are aggregated.
- (4)
Fossil fuel reserves: The possible carbon footprint that may result from the feasible and proven fossil fuel reserves of the index components being burned, for every USD one million invested.
Additionally, this work ultimately builds upon previous studies in several important ways, and offers the following three major contributions.
First, the existing literature on nonlinear dependence and causality volatility in price behaviour only utilizes stationary time series. To fill this gap, an approximate entropy methodology is utilized, which does not require any stationary assumption.
Second, unlike previous studies, we pay attention to providing insightful evidence regarding the safe haven capacity of risk exposures, and then observe the potential information of approximate entropy among Bitcoin, sustainable finance, and fears regarding the impact of COVID-19.
Third, we fill a significant research gap; scarce literature considers wavelet analysis for exploring Bitcoin and sustainable finance co-movements in frequency and time dimensions.
As far as we know, this is the first article to uncover information linkages between Bitcoin, sustainable finance, and the impact of COVID-19. Subsequently, we analyse whether Bitcoin and these sustainable financial assets can be regarded as safe haven assets amid fears regarding the COVID-19 crisis. From a practical viewpoint, and in the context of the fight against climate change, our findings suggest that sustainable financial assets may play a better safe haven role during periods of turmoil such as the COVID-19 pandemic.
The paper is laid out in four sections.
Section 2 presents our empirical design and econometric model.
Section 3 presents the research data.
Section 4 presents the research methodology and analyses estimation results, and
Section 5 concludes the article.
2. Research Methodology
2.1. Long Memory Tests for Fractal Time Series
Financial markets have a potentially fractal nature, especially regarding the relative tendency of a time series to revert strongly to the mean or cluster in a nonlinear characteristic; thus, the Hurst exponent is commonly introduced to capture fractality (e.g., [
28]). In addition, the Hurst exponent (HE) and rescaled range (R/S) analyses are generally applied to measure the long memory of a time series (see [
29,
30] among others).
Motivated by the above discussion, and to examine the long memory of these series, we use the HE as computed via rescaled range statistics. Then, HE is used to categorise a time series, and offers a statistical measure for the fractal geometry of the time series and long-term correlation memory. The memory is also called long-range dependence, implying the existence of interdependence between the observed periods of time series, even though these are separated periods.
The long-term memory statistics of a rescaled range (R/S) fractal analysis are described below. In this study, we consider the logarithmic returns of cryptocurrency to be sustainable financial assets denoted as the time series X = , , …, , and the steps of the R/S analysis can be summarized as follows.
Step 1: Determine the profile of subsample means. The mean of the
m value is computed as follows:
Step 2: The demeaned return return (deviate) mean adjusted series
Y is computed as the following Equation (2).
Step 3: Regarding the cumulative sum of diminished returns, the cumulative deviate series
can be computed:
Alternatively, Equation (3) can be written as .
Step 4: The subsample range is computed as the max minus min of the cumulative deviate, based on the following equation:
Step 5: Compute the standard deviation of the S series as follows:
Step 6: Calculating the rescaled range (
R/
S) series, it is easy to infer the following definition:
where
denotes the mean across the districts, and can be described as the average over all the partial time series, until
where
m = floor(
n/
t), assuming that there is a time series with
n observations for equal intervals of time. The observations are divided into
m floor (sub-periods) with the same number of observations t, such as
m ×
t =
n. Accordingly,
m = floor(
n/
t).
Eventually, the Hurst exponent indicates that (R/S) scales are estimated by fitting the power law as the time grows, which can be shown as follows.
In this scenario,
c refers to a constant, and t represents
n observations in the sub-periods.
H is termed the HE (Hurst exponent), and taking the logarithm for Equation (6), the HE can be expressed.
The HE is the Hurst exponent, and characterizes the long memory dependence. The different scenarios have been classified as follows:
- (1)
H = 0.50 shows the given time series that follows a random walk governed by standard Brownian motion. The recent time will not affect the upcoming future direction.
However, if H ≠ 0.5, the related time series shows evidence of long-term correlations.
- (2)
0 ≤ H < 0.50, the time series have the properties of a state that is ergodic or anti-persistent.
- (3)
0.50 ≤ H < 1.00 indicates that the time series exhibits persistent or trend-reinforcing behaviours, also called persistent memory.
Importantly, it should be noted that the R/S analysis does not require the underlying values to follow the normal distribution; this only applies to independent values. Therefore, the Hurst exponent
H ranges between 0 and 1, whose value implies some features of the process, see [
28,
31].
2.2. Approximate Entropy (ApEn) Approach
To provide a focused analysis of the potential information transmission patterns of Bitcoin, sustainable finance, and the impact of COVID-19, we employ an approximate entropy approach to capture the unique features of these assets. The ApEn model acts as the joint behaviour of the series introduced by [
32,
33] during the turmoil of the pandemic. The ApEn is related to information theory, a useful measure that allows one to easily estimate the amount adequate entropy in order to classify finite, noisy, and chaotic systems [
34]. To address the limitations of the information reduction carried by the signal, and uncover such signals containing random noise, approximate entropy can quantify regularity and complexity. The entropy is utilized to characterize persistent diversity patterns, and evaluates the level of irregularities (random fluctuations) through extraction of disturbances from a finite time series of length
N. An algorithm for computing the approximate entropy (briefly denoted as ApEn) of financial time series data is summarized as follows.
First of all, to compute the ApEn, a finite time series is considered, and a defined series of data with length
N sampled at time intervals (Ts) can be described in the following form:
where length
N represents a respective time scale
=
NTs for a given stochastic variable (
). The ApEn algorithm is conducted, and it will contain the given two parameter values. Here, the embedding dimension (
m) is the length of a pattern, and the tolerance level (
r) represents the likelihood that resemblance exists between these patterns. Typically, we introduce parameter selection as
m = 2 and
m = 3 to estimate the values of ApEn, given the data length of
N = 2110.
Then, we consider the two
m-vectors [i.e.,
,
], which can be obtained with the following step:
where
i ≠
j, 1 ≤
i and
j ≤
N −
m+1, and
m is the number of vectors.
In Step 2, using a tolerance factor
r, we compute the distance between the two sequences. The distance between these two sequences is described as the maximum difference between
and
, as follows:
where 0 ≤
k ≤
m−1.
In the same way, the scalar corresponding to the distances in the respective scalar is compared with a template match between and . In case the distance between the corresponding scalar compositions (Equation (10)) is less than r, the two embedded vectors maintain similarity.
In the third step, we account for the probability of the data
which means there exists a degree of tolerance of
for each observation, 1 ≤
i ≤
N −
m+1. The step supposes that the data points [
] of the
series can capture the extent of its similarity to the
series. In this way, the relative frequency probability used to detect a vector
within the specified tolerance level (
r) of
is given by
where
captures the degree of difference between the two respective vectors:
Therefore, taking logs (or ln) of
, the mean sum of information linkages is given:
Or, equivalently:
where the embedding dimension is extended to
m+1, and the two average frequencies,
(r) and
describe the level of similarity between the specifications of
and
within the degree of the specified tolerance.
Eventually, for finite
N, the relative magnitude of the ApEn algorithm between the specifications can be estimated using statistics, as follows:
Additionally, the approximate entropy is estimated using the statistics in Equation (13), and can also be transformed to the following chi-square test:
The approximate entropy (ApEn) proposed by [
35] can be interpreted using the algorithm for calculating the entropy value of the financial time series. At this point, ApEn measures the (un)predictability of fluctuations within the time scale
t. Thereby, the larger value of ApEn (
m,
r,
N) reflects more irregularity and complexity (i.e., more unpredictability), while a lower value of ApEn implies greater regularity and less randomness.
In this way, the high entropy reflects a greater likelihood of indicating of informational efficiency. On the other hand, higher entropy suggests that a higher level of randomness is present in the market returns, and thus there exists a greater extent of informational efficiency. (see [
36,
37]).
It is noted that the window size will impact the value of entropy. Since the entropy is not normalized, it increases when the window size grows. Ortiz-Cruz [
38] documented that the larger the entropy, the more difficult it is to predict ongoing price dynamics, which implies that a market with high entropy levels is much more irregular than a market with low entropy levels.
In this study, we consider lower entropy levels, and using a sliding window size of Nw, we selected Nw = 41 trading days (about 1.5 months) for entropy computations, which are commonly used in applications.
An algorithm for ApEn computation for financial time series data is conducted by using the daily logarithmic returns of BTC and DJSW, Green Bond, Carbon, and Clean Energy. In the study, the values of ApEn are close to those of [
39], which showed a time-dependent entropy of the Australian dollar (AUD) at a time scale of τ = 1 business day for a window size of 100.
2.3. Wavelet Entropy
Wavelet entropy (WE) is a novel tool with the ability to analyse the transient characteristic of nonstationary signals. The entropy and wavelet analysis is incorporated to estimate the extent of order or disorder associated with a signal that includes a high time–frequency analysis. The wavelet function has the benefit of affable localization considering time and frequency. A wavelet family
subdivides time series into elementary functions that can be induced by a translation-invariant admissible mother wavelet
ψ(t), and can be given by
where
a,
b 0, denoting the dilated and translated parameters with the time t. Hence, the signal of the continuous wavelet transform (CWT) and a wavelet
is reflected into the examined series
. The CWT and its replications, being within the family wavelet for each a and b, are expressed as follows:
where
*(.) denotes a complex conjugate of
(.). More specifically, the series is decomposed into frequencies using the continuous wavelet transform, and CWT can reconstruct the original sequences without loss of information.
Given the binary dilation and position of parameters,
=
and
=
k, a selected mother wavelet function ψ(t) coped with the integers, i.e.,
j,
k ∈
Z, and the wavelet family can be expressed as follows:
Loosely speaking, the discrete wavelet transform is used to map functions as a sum of basic functions called wavelets. These basis functions, also called scaling functions, have the distinguishing feature that the two main categories of wavelets (the father wavelet and the mother wavelet) may be described by dilating and translating. The discrete wavelet transform (DWT) of signal
can be given by
where the dilation or level is defined as the index
j, while the index
k is the translation for any suitable function. In this fashion, the wavelet energy at decomposition
j may be expressed as follows:
where
is the wavelet coefficient.
3. Research Data
In this study, the daily closing price of Bitcoin and the four world indices of sustainable finance are utilized, within the sample period from 1 January 2015 to 20 February 2023. The four sectoral indices are the Dow Jones Sustainability World Index (DJSW), S&P Green Bond Index (Bond), S&P Global 1200 Carbon Efficient Index (Carbon), and S&P Global Clean Energy Index (Clean Energy). These data are obtained from the S&P Dow Jones Indices LLC’s data and analytics system, see
https://www.spglobal.com/ (accessed on 25 February 2023). After removing non-trading days, the integrated dataset filtered in regular trading days between Bitcoin and sustainable financial indices, thereby generating a final series and yield a total of 2110 trading days in each market. These series are summarized as:
The DJSW represents a broad-based index that measures the performance of equities meeting certain sustainability criteria related to ESG factors, while remaining analogous to entire industry group weights as their underlying indices.
- 3.
S&P Green Bond Index (briefly denoted as Green):
This index aims to track the world’s green bond markets. This pioneering index remains a rigorous criterion for covering only those bonds whose proceeds are allocated to financing environmentally friendly programs.
- 4.
S&P Global 1200 Carbon Efficient Index (briefly denoted as Carbon):
This pioneering index (the carbon exposure metric is measured as in
Section 1) is described as measuring the performance of firms in this index, while overweighting or underweighting those firms that generate lower or higher levels of greenhouse gas emissions, per unit of revenue according to S&P Global Trucost data. In other words, the data analysis determines the carbon exposure of the firms in these indices, and calculates these metrics using the S&P Global Trucost analysis, which includes 14,000 firms, accounting for 99% of global market cap.
- 5.
S&P Global Clean Energy Index: Bloomberg Ticker: SPGTCED
The S&P Global Clean Energy Index is described as measuring the performance of firms in world clean energy-related companies from emerging or developed markets, with a target component count of 100.
Source: S&P Dow Jones Indices Limited Liability Company (LLC).
4. Empirical Result and Discussion
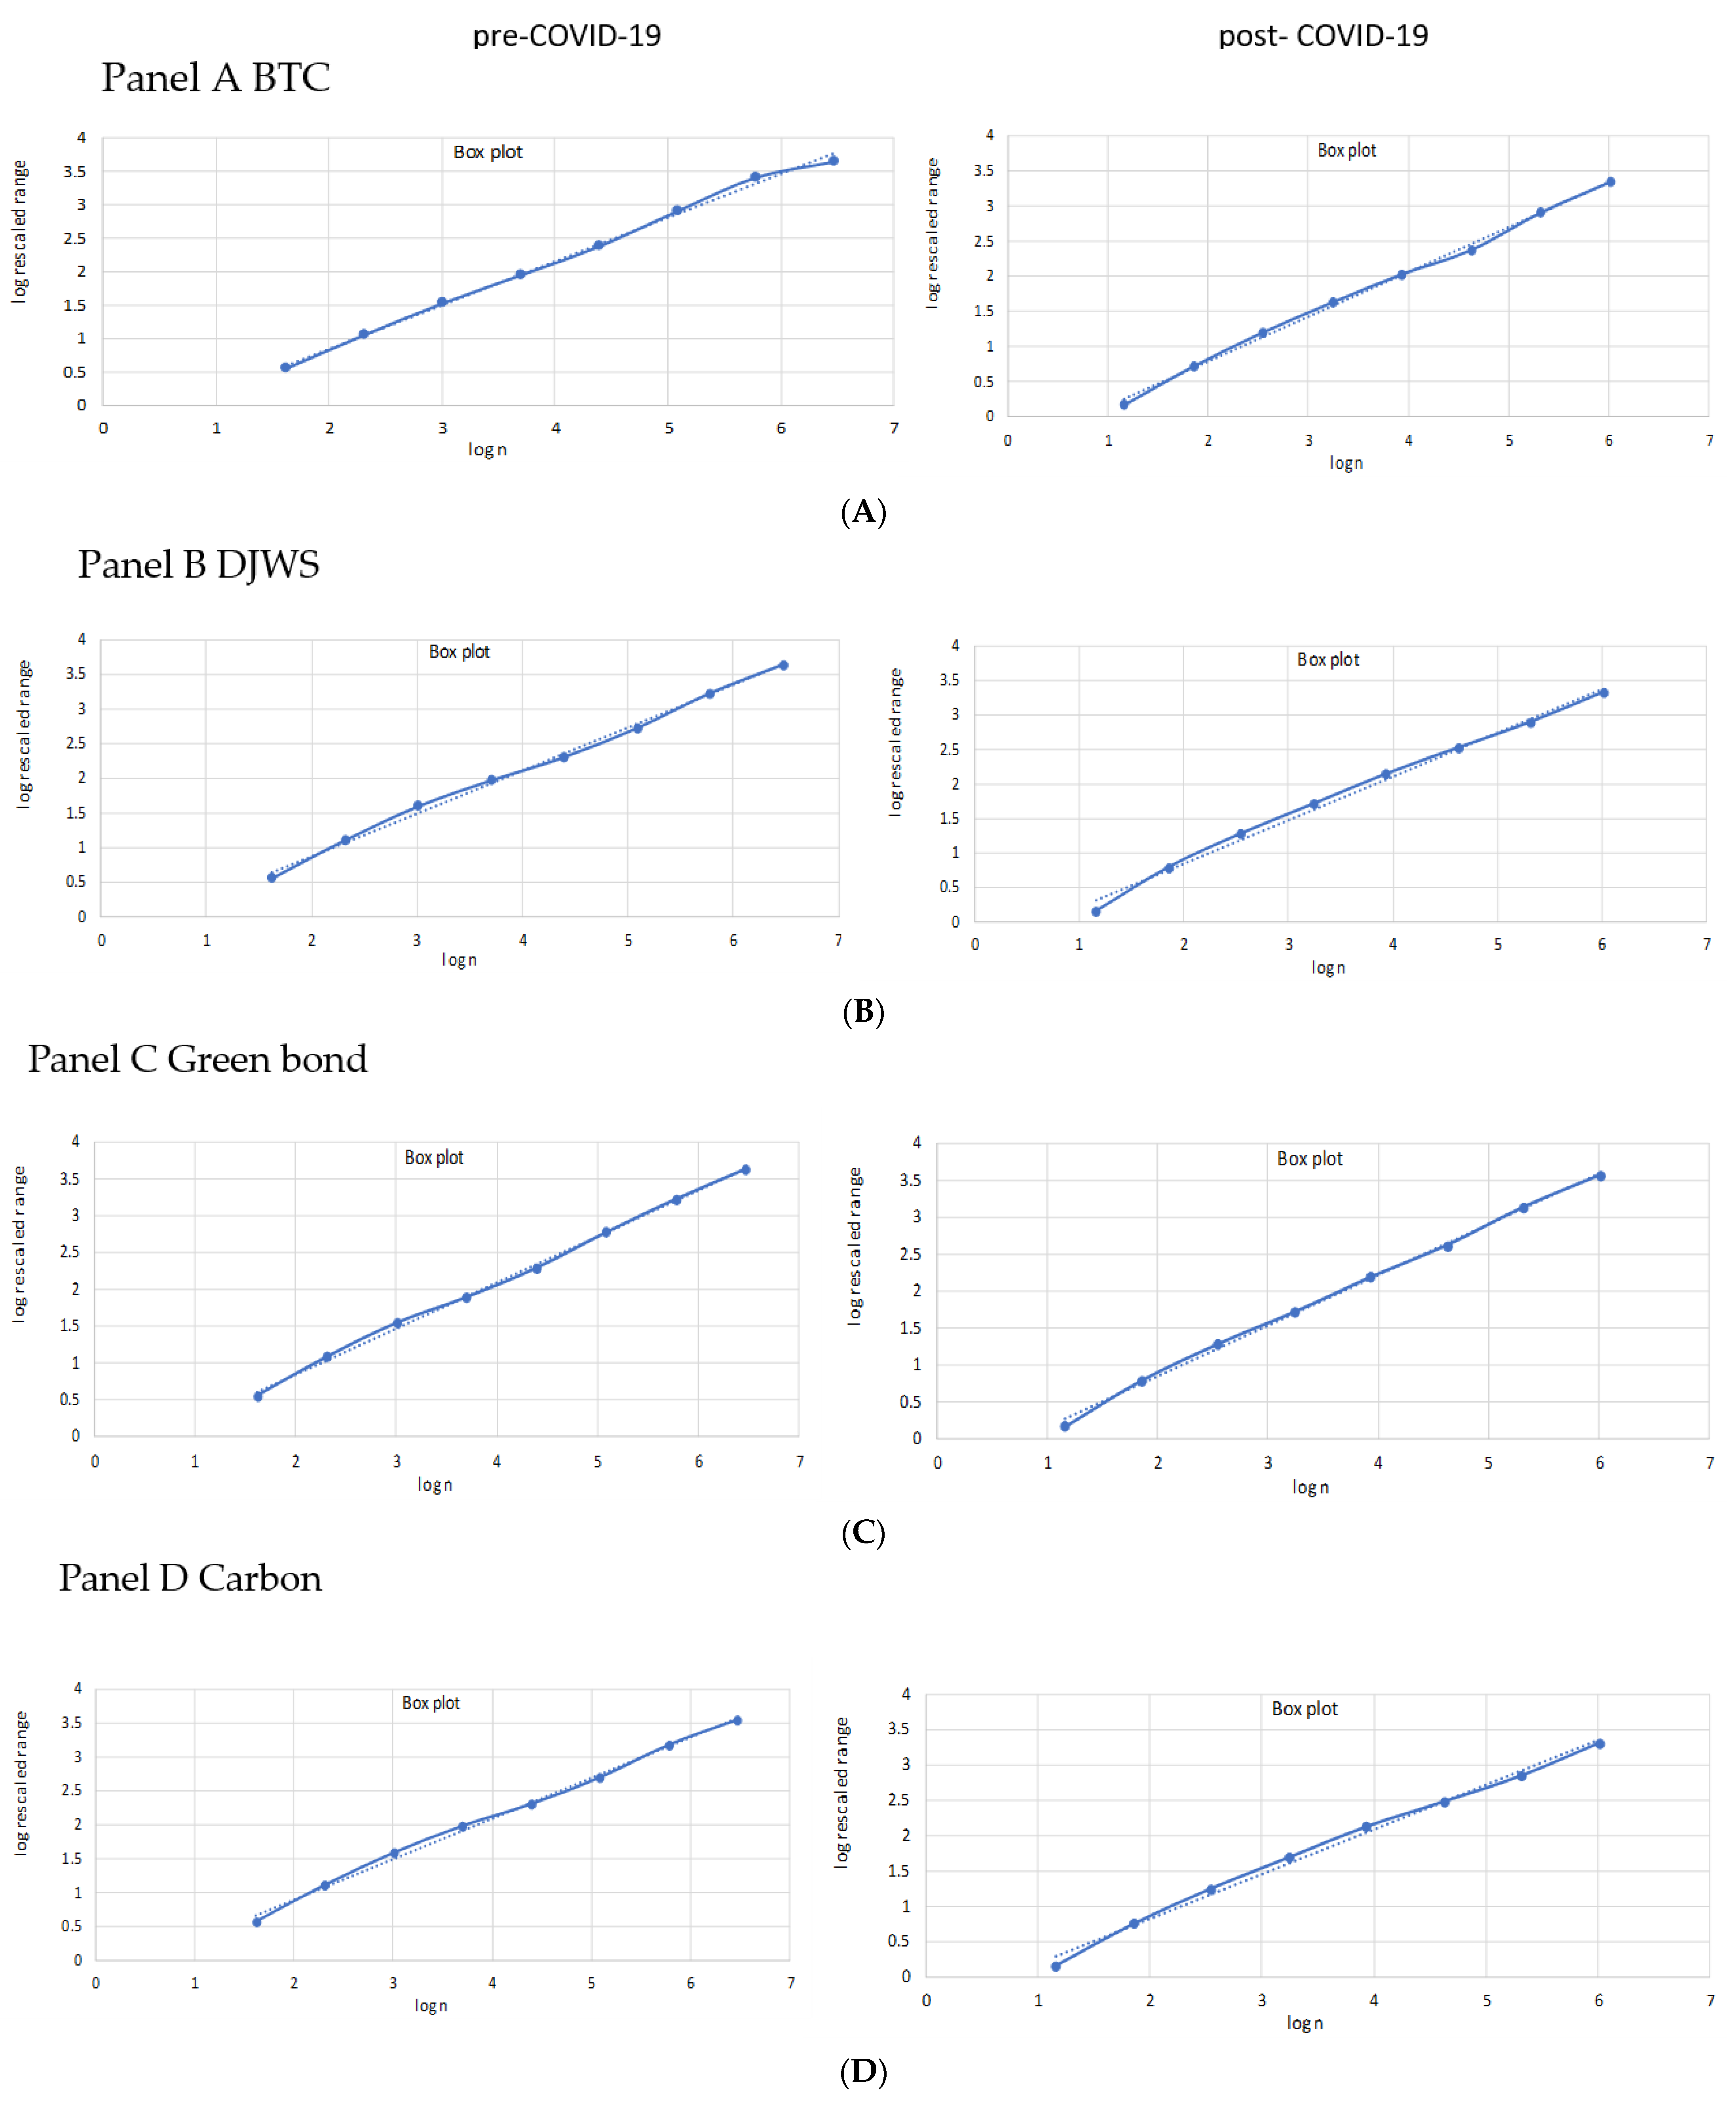
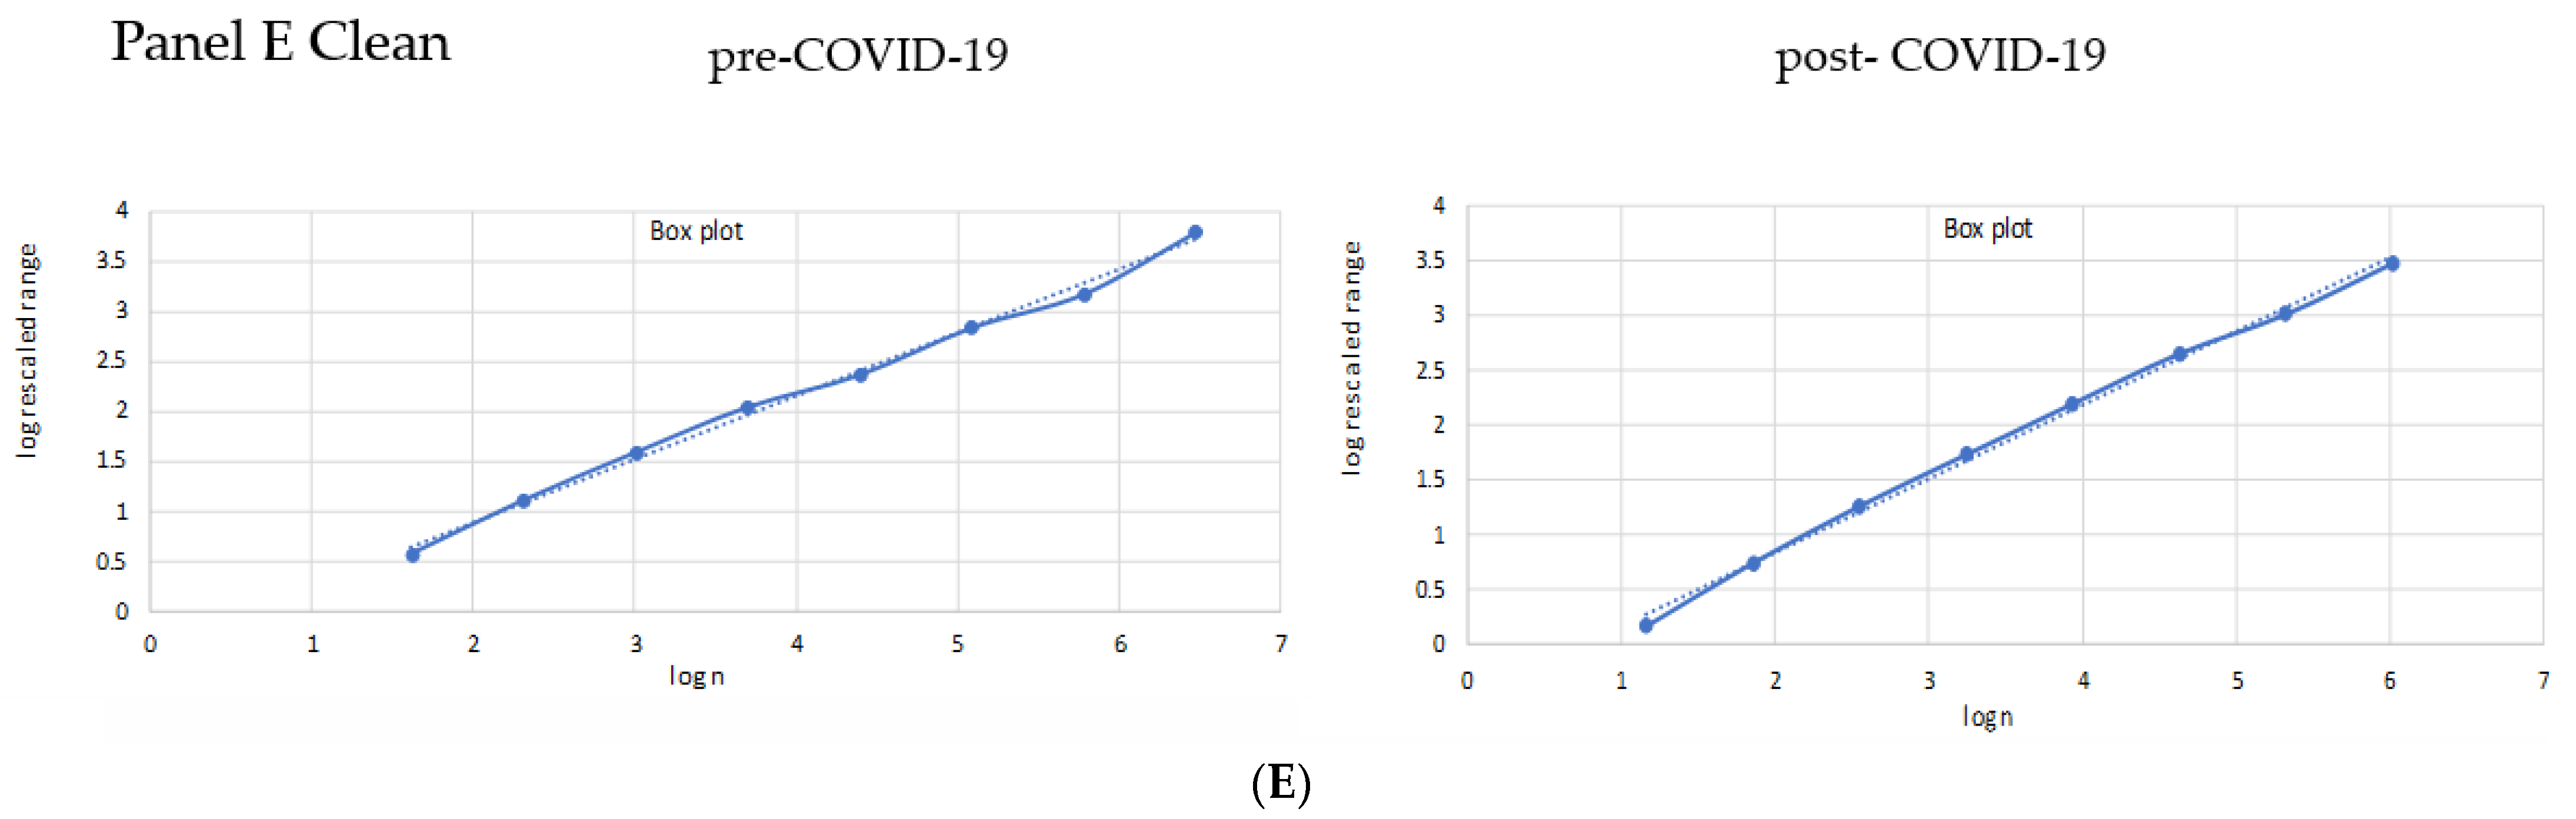
The Hurst exponent of the Bitcoin and sustainable financial assets of the DJWS, Green Bond, Carbon, and Clean Energy markets are computed, respectively, using R/S analysis. As shown in
Table 1, the Hurst exponent is 0.635, 0.632, 0.686, 0.6288, and 0.671 for the returns series of Bitcoin, DJWS, Green Bond, Carbon, and Clean Energy during COVID-19, respectively. When examining the existence of long-term memory for all asset classes, we employ log-return as a common proxy for daily information arrival, following [
28]. Using the Hurst–Mandelbrot R/S methodology, as presented in
Table 1, the R/S statistics cannot reject the null hypothesis of the non-existence of long-range dependence in return series. The findings demonstrate that the daily log-return series for Bitcoin, DJWS, Green Bond, Carbon, and Clean Energy exhibit a long memory process, with
p-values already significantly less than 0.1%. In this sense, this infers that the returns of the five markets do follow a non-random walk, but have the persistent property. Besides that,
Figure 1 depicts the boxplots of log(
n) and log(R/S) in the five markets, with
n ranging from 1 to N. A common feature is present in
Figure 1; the scatter diagrams depict that while the sequence has exhibited a downward/upward trend in the past, it will still fall/rise in the future. In addition, the sources of its natural fractality have changed since the outbreak of COVID-19. The findings of this review may have major implications for investment strategies, asset allocation, and risk monitoring.
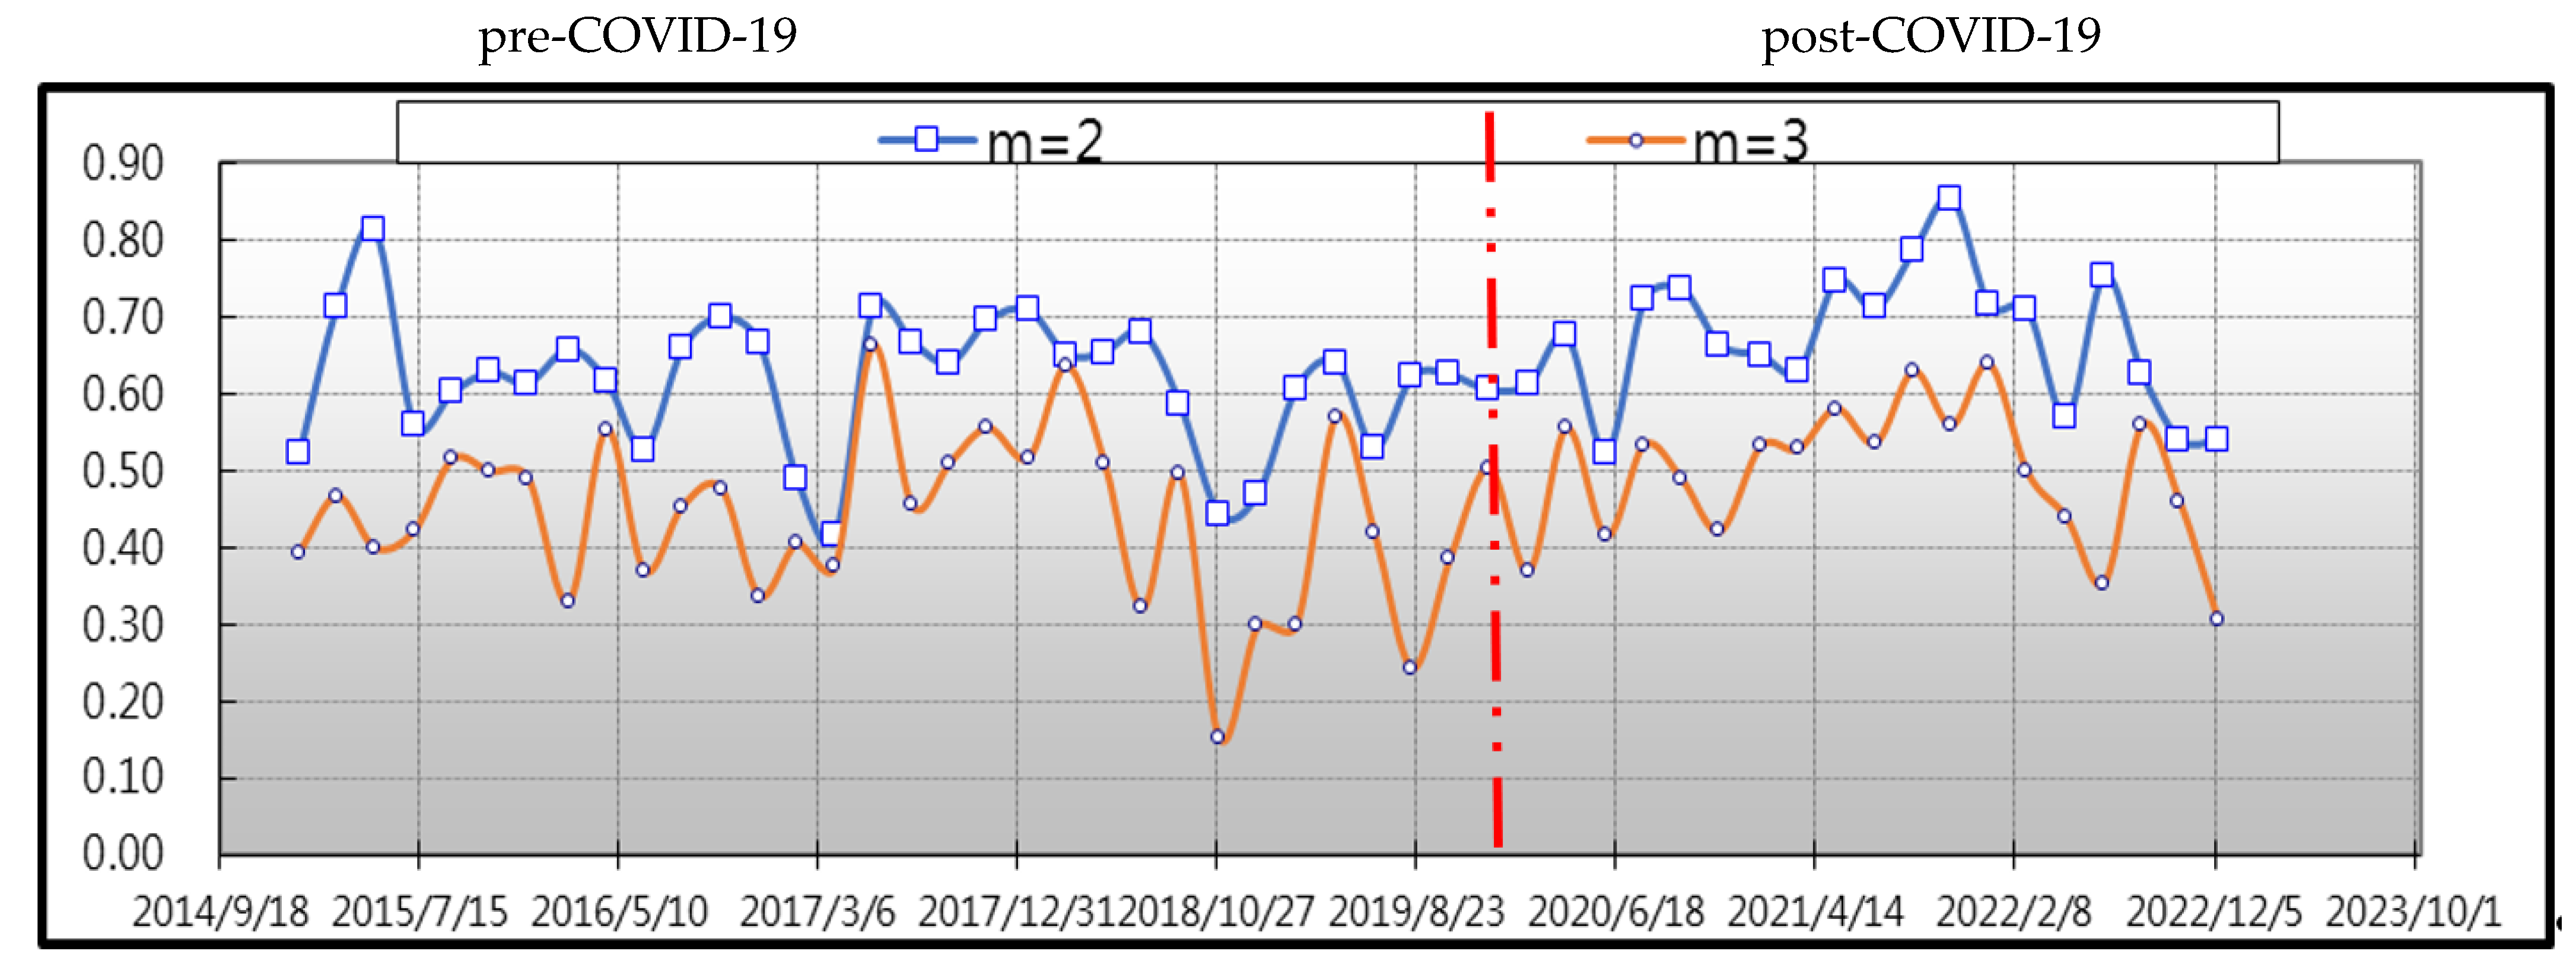
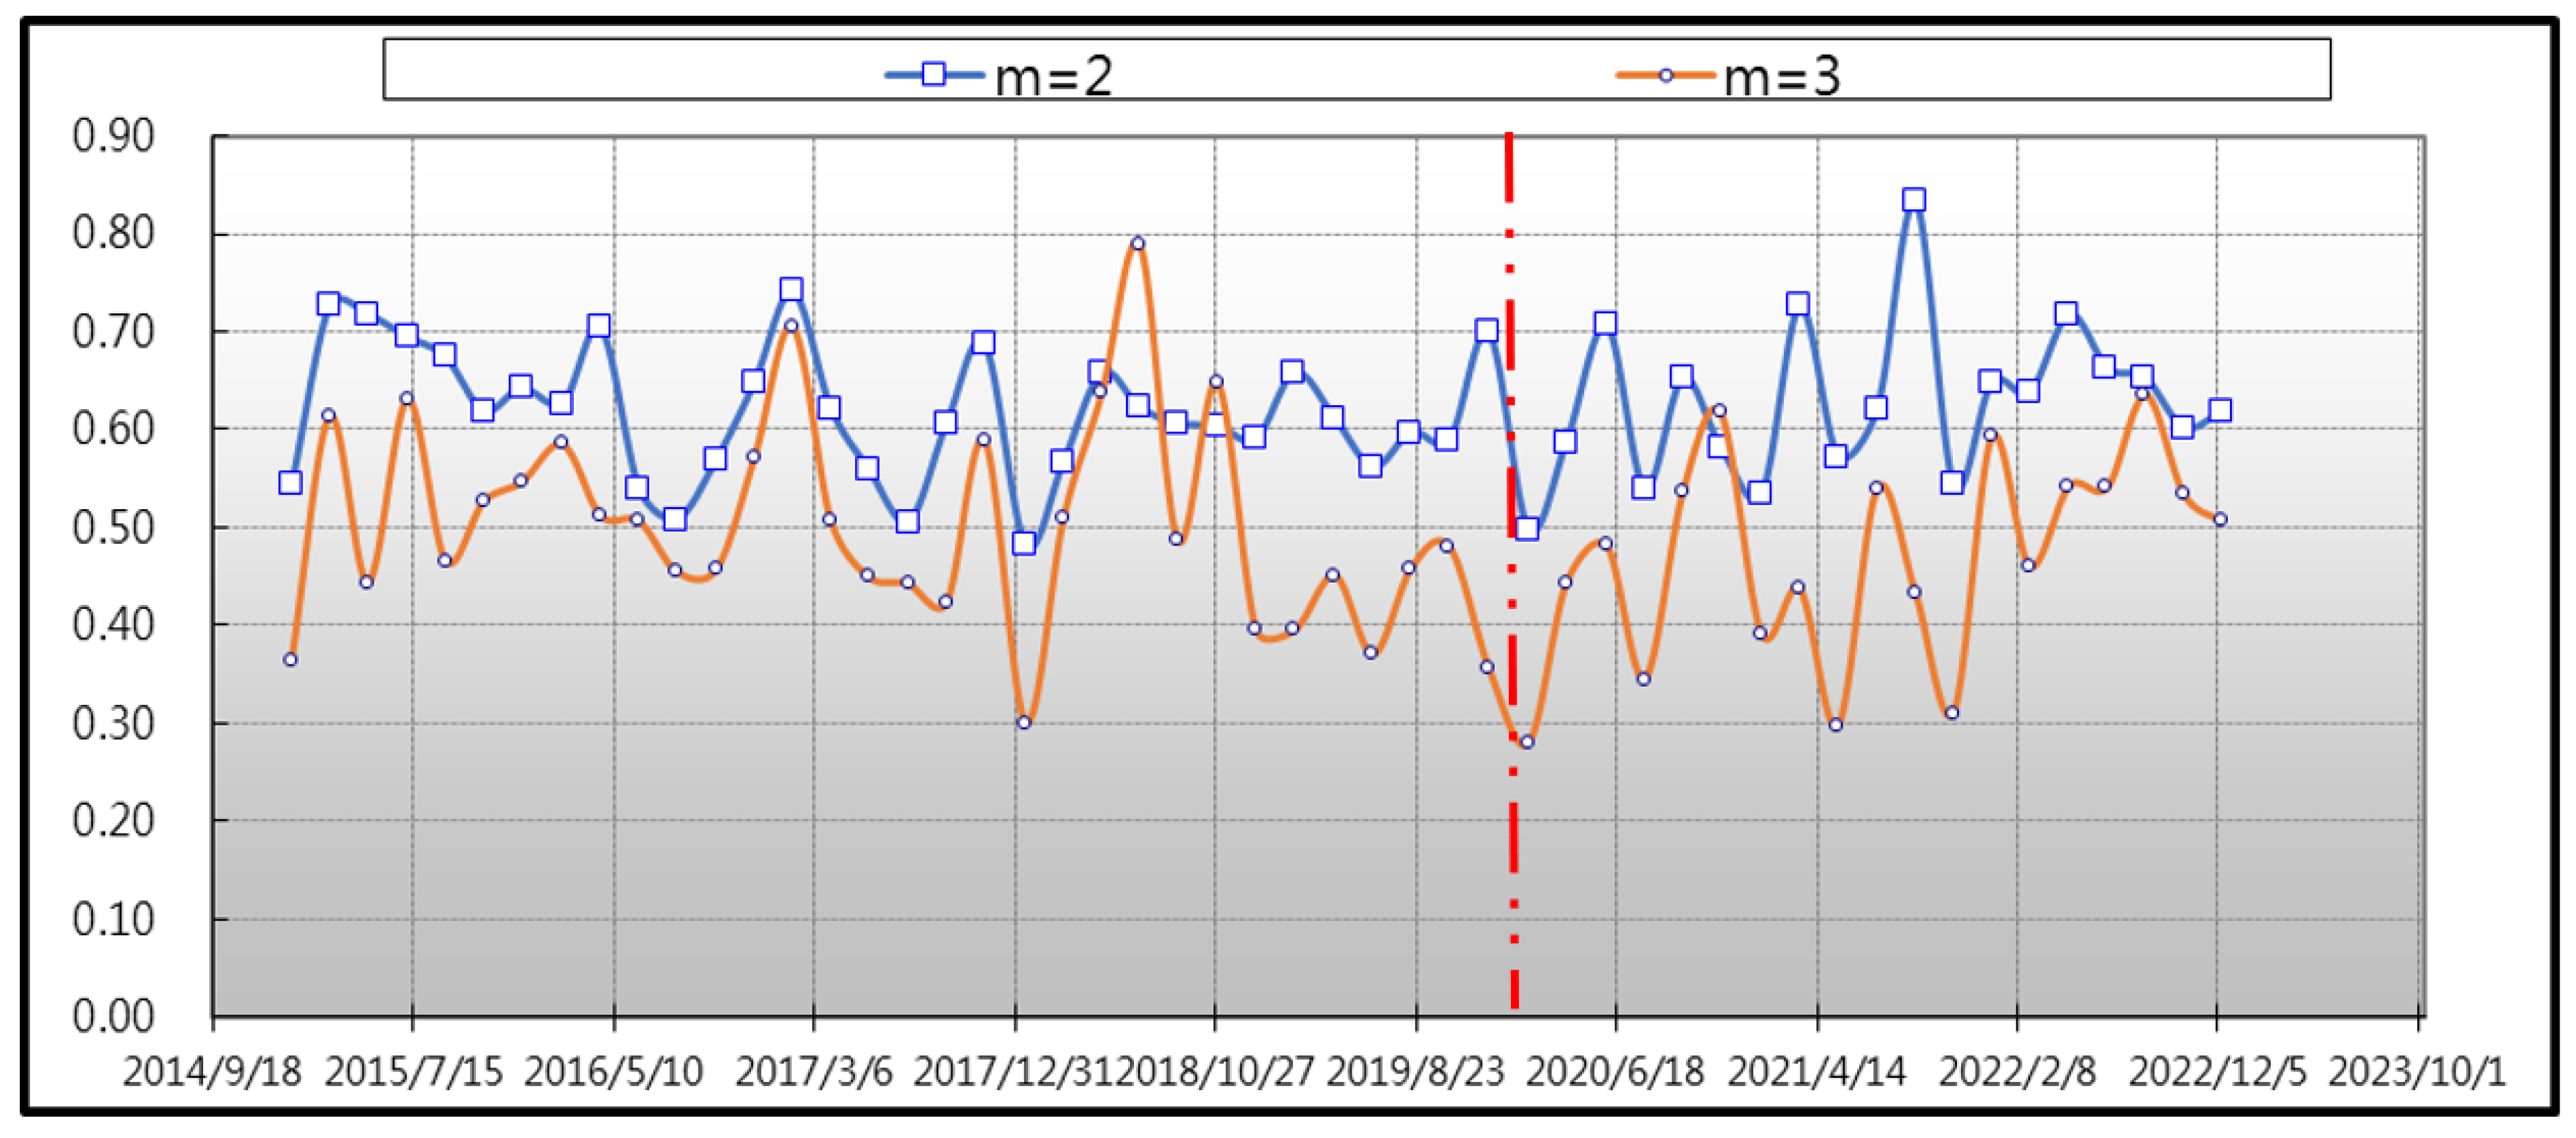
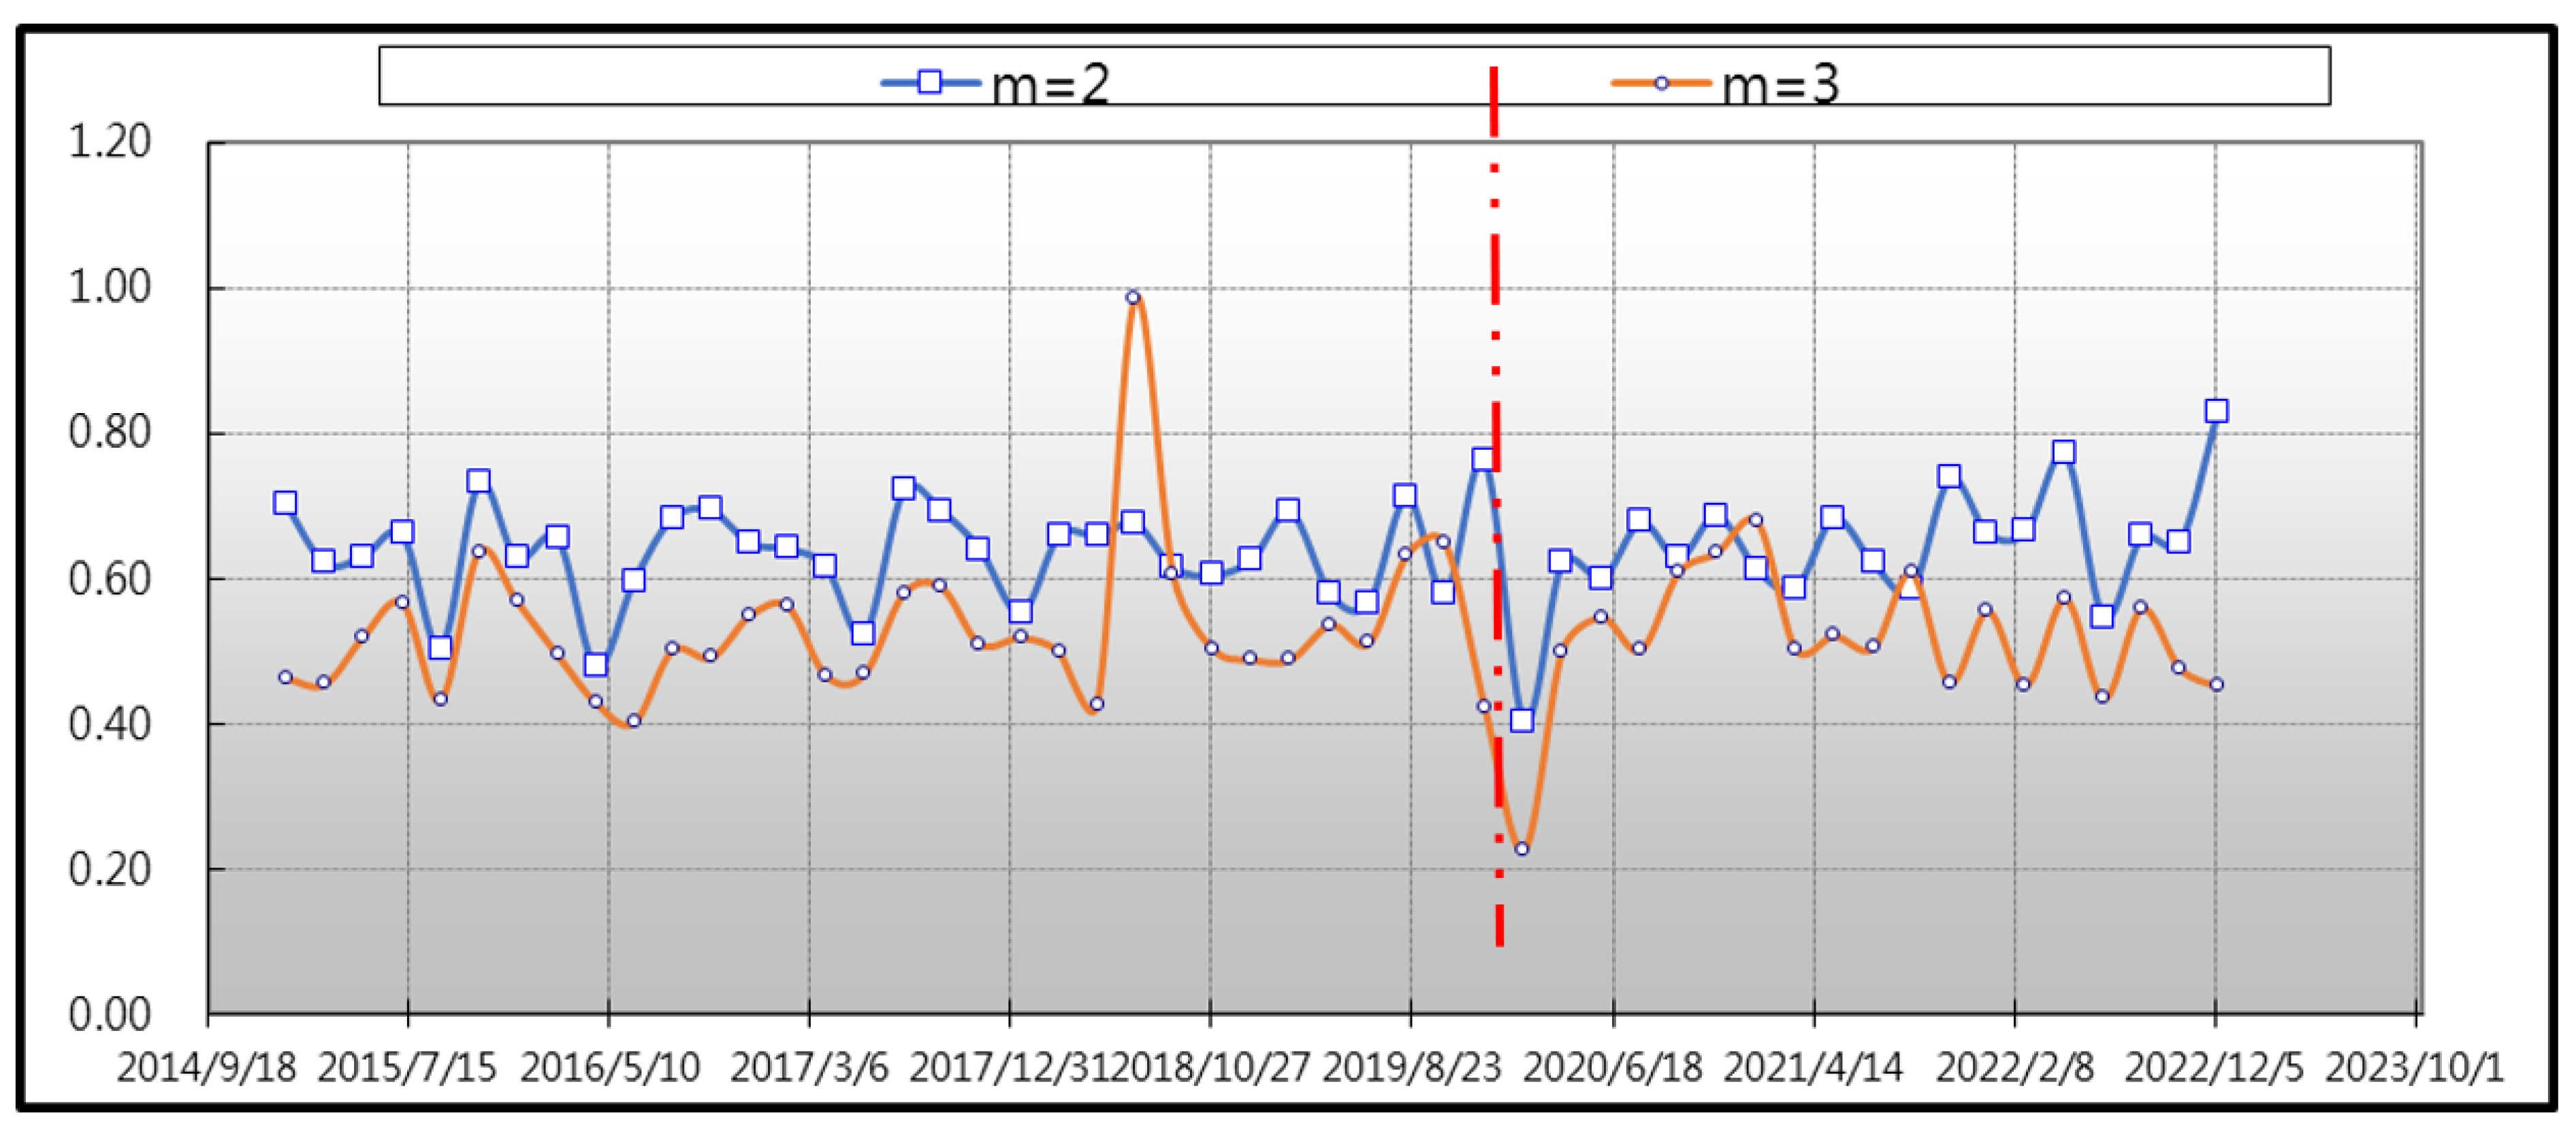
To evaluate the complexity patterns in Bitcoin and sustainable financial markets trigged by COVID-19, we found the approximate entropy between the periods before and after the COVID-19 pandemic. As reported in
Table 2, the estimates of approximate entropy for both periods infer considerable irregularity, since most of the average estimates are larger than 0.5. Comparing the
p-value of the T test before and after the COVID-19 outbreak, as shown in
Table 2, we suggest that the two sample periods (before versus after the COVID-19 pandemic) are significantly different, with a
p-value of 0.04 in the case of Bitcoin. Interestingly, this is different from the preceding result, obtained using sustainable financial indices, which shows that the accuracy of Bitcoin forecasts may not be adequate during the COVID era. More specifically, our results also evidence that the average ApEn value for the pre-COVID-19 pandemic era is less than the mean of the post-COVID-19 era. The result implies the level of irregularity augmented in the Bitcoin market during the pandemic. This finding is analogous to those found by [
40], but is different from those evidenced by [
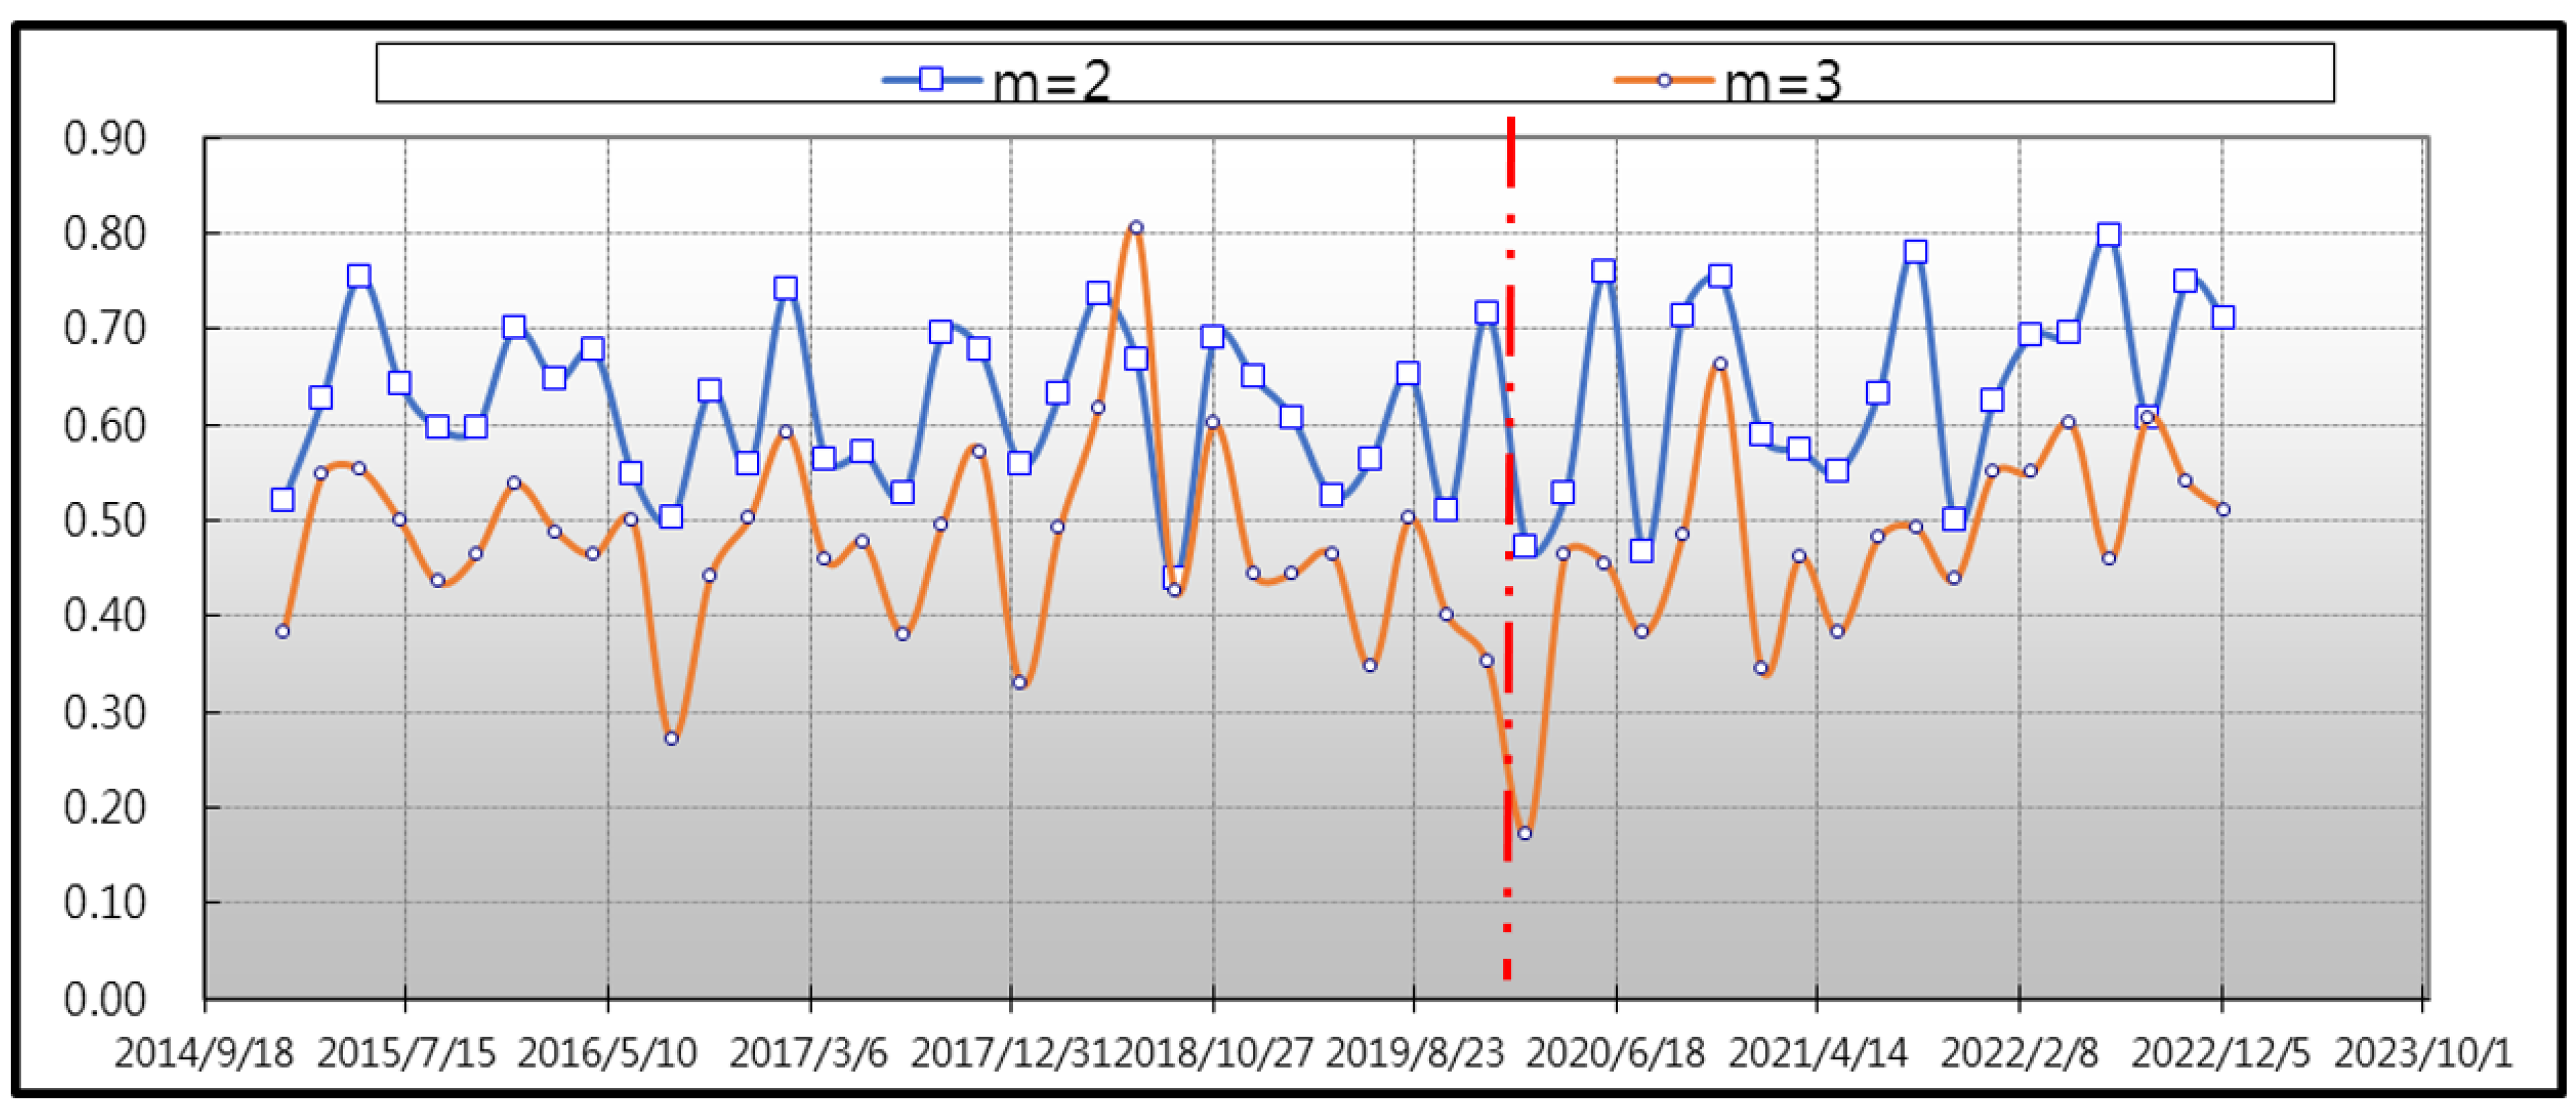
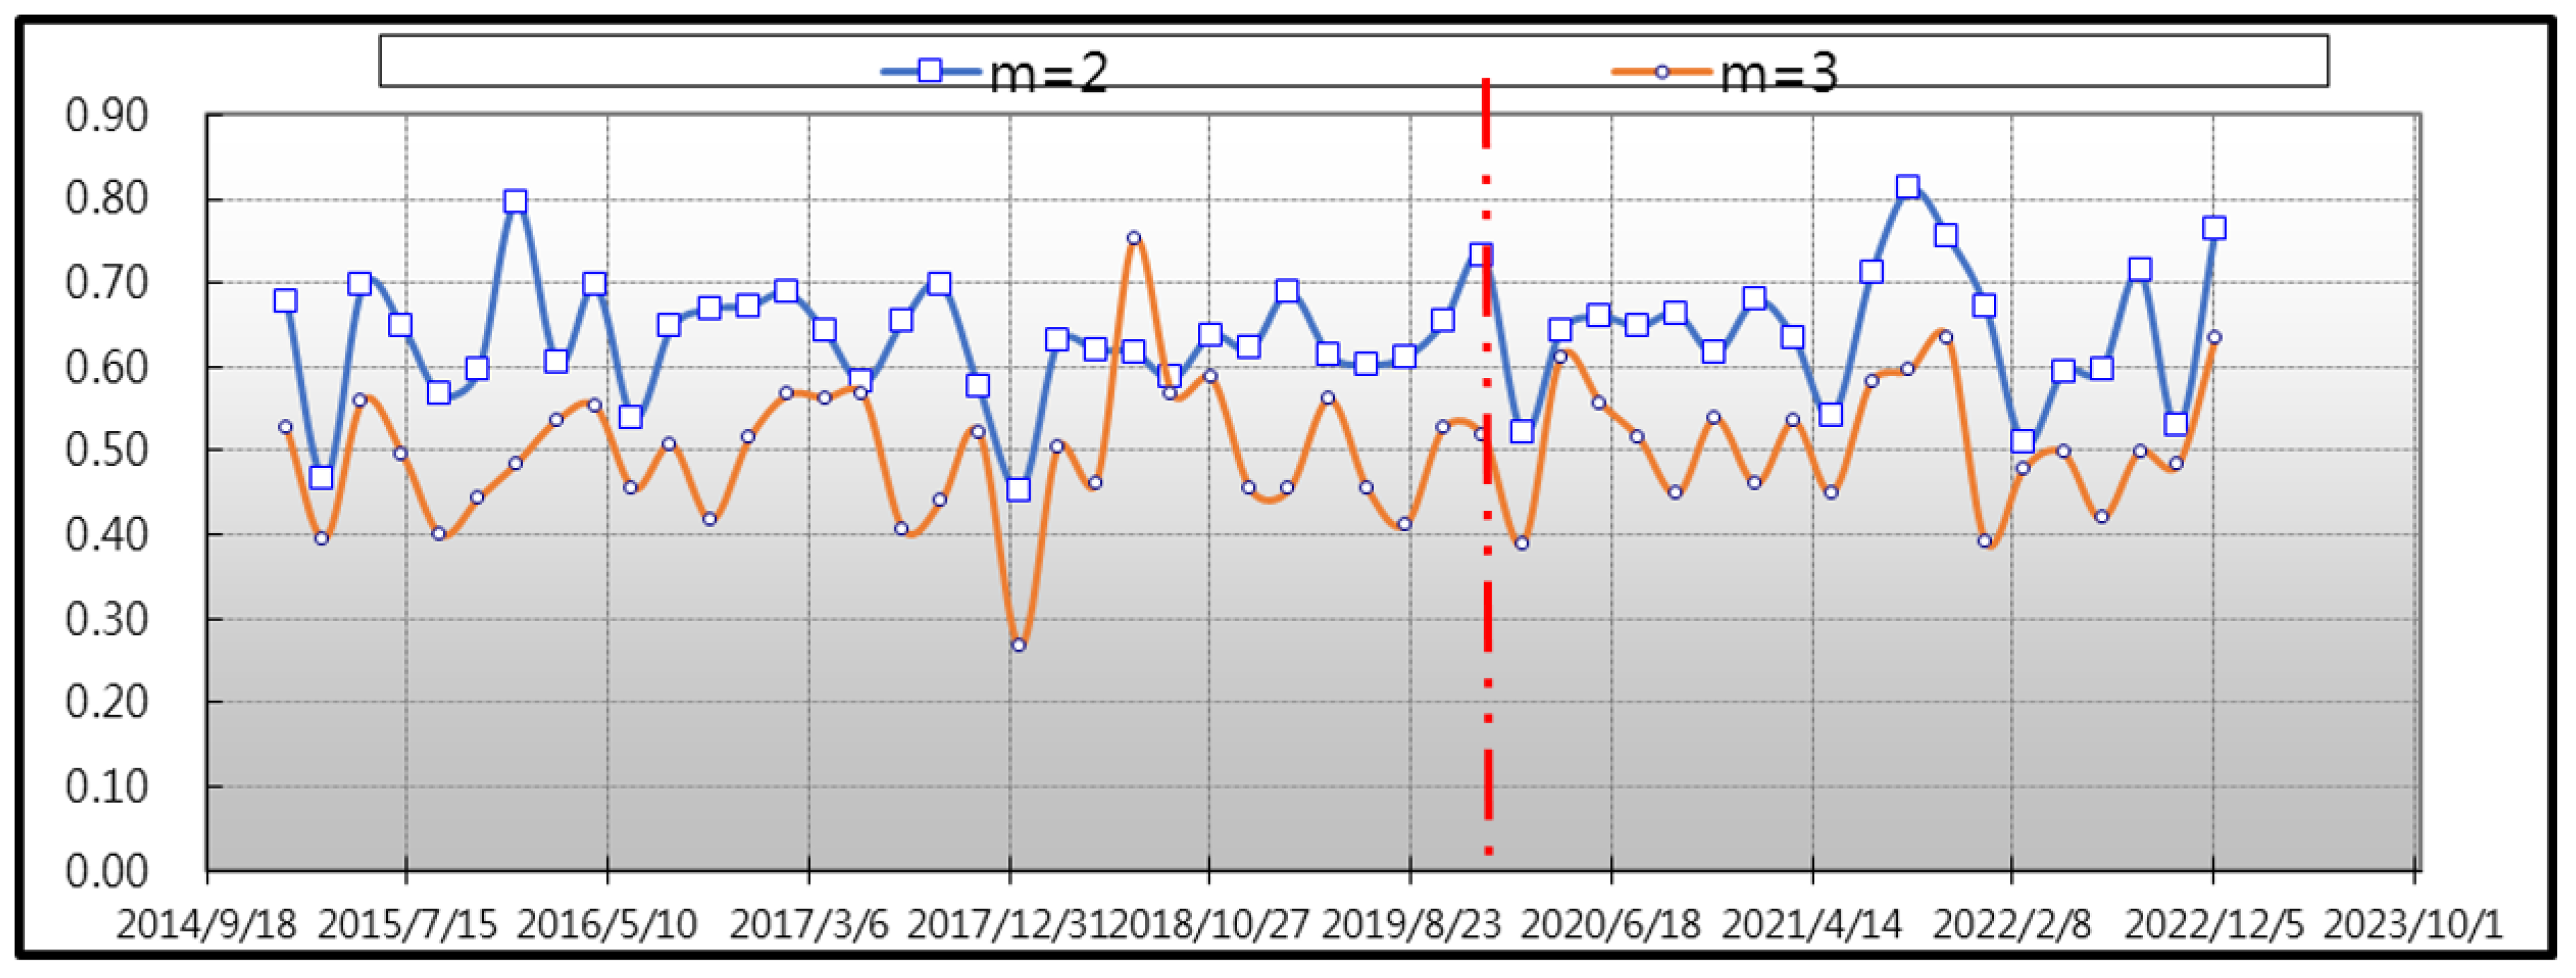
1]. Notably, we tracked the approximate entropy of the mapped data series; this was carried out graphically over a range of embedding dimensions from 2–3, and
Figure 2,
Figure 3,
Figure 4,
Figure 5 and
Figure 6 depict the diagrams for the two periods (pre- and post-COVID-19 outbreak).
Figure 2 and
Figure 3 show the approximate entropy for Bitcoin and sustainable finance. The red line presents the occurrence of the first wave of the COVID-19 outbreak.
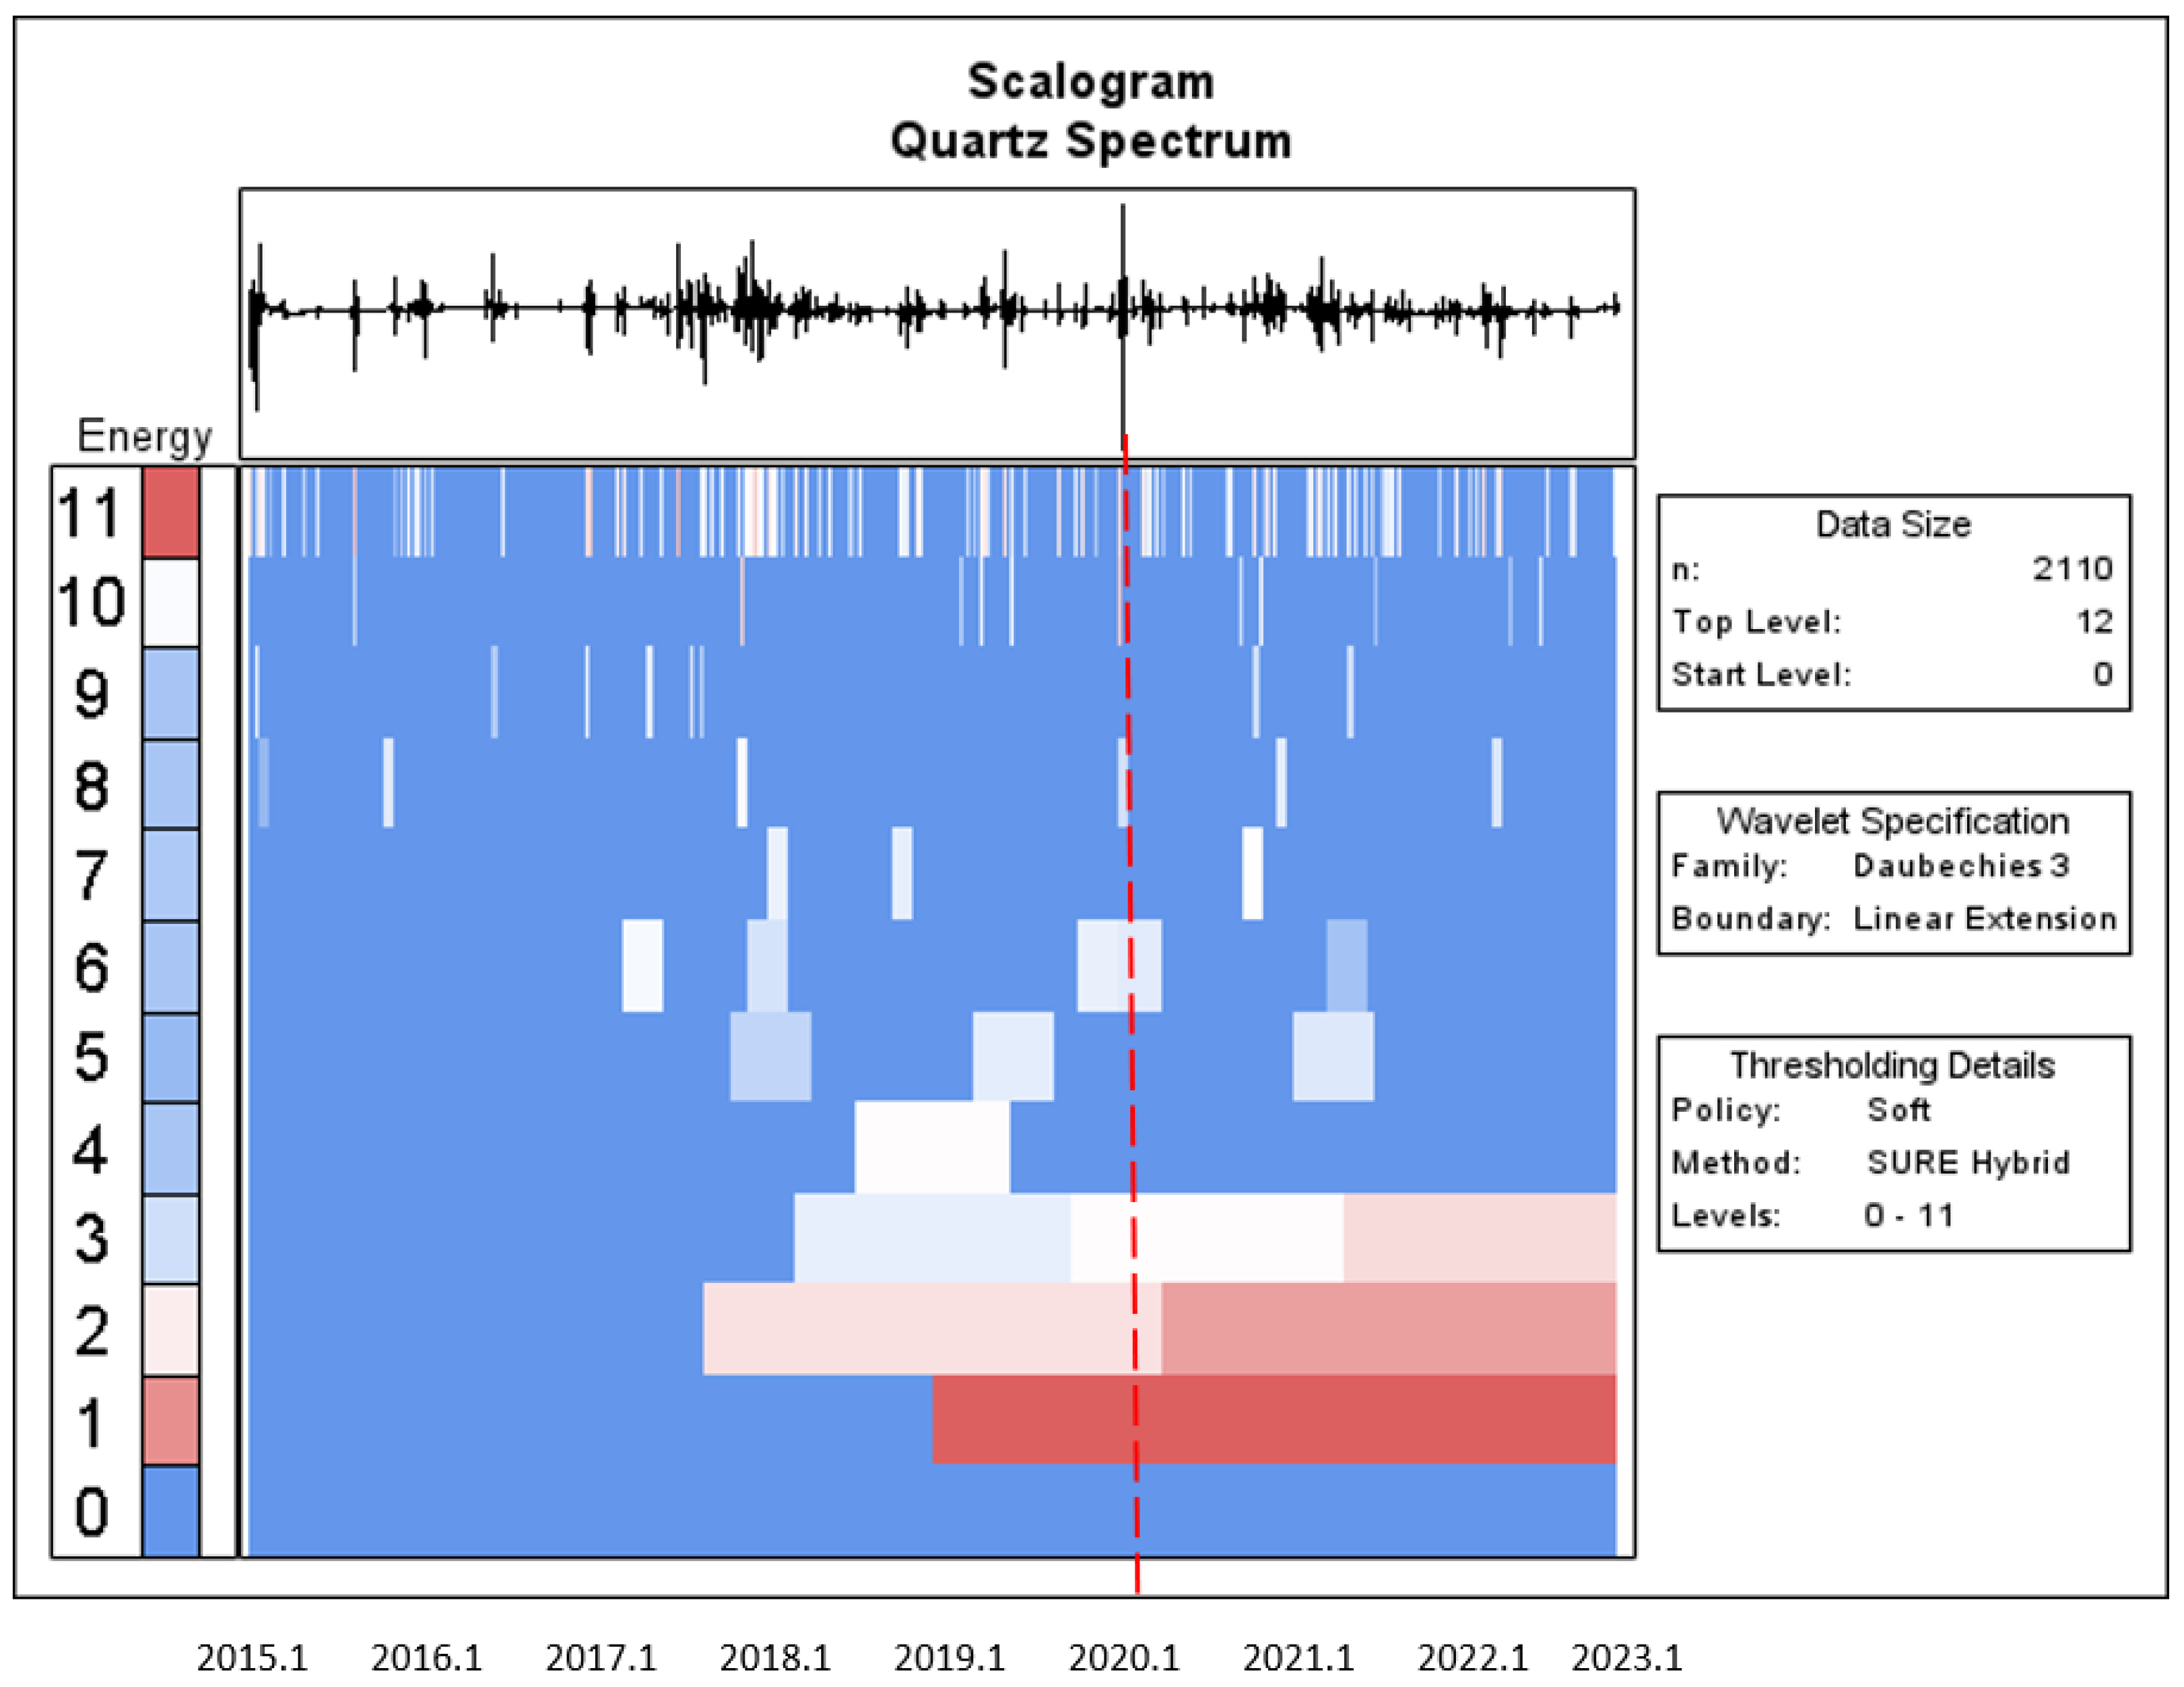
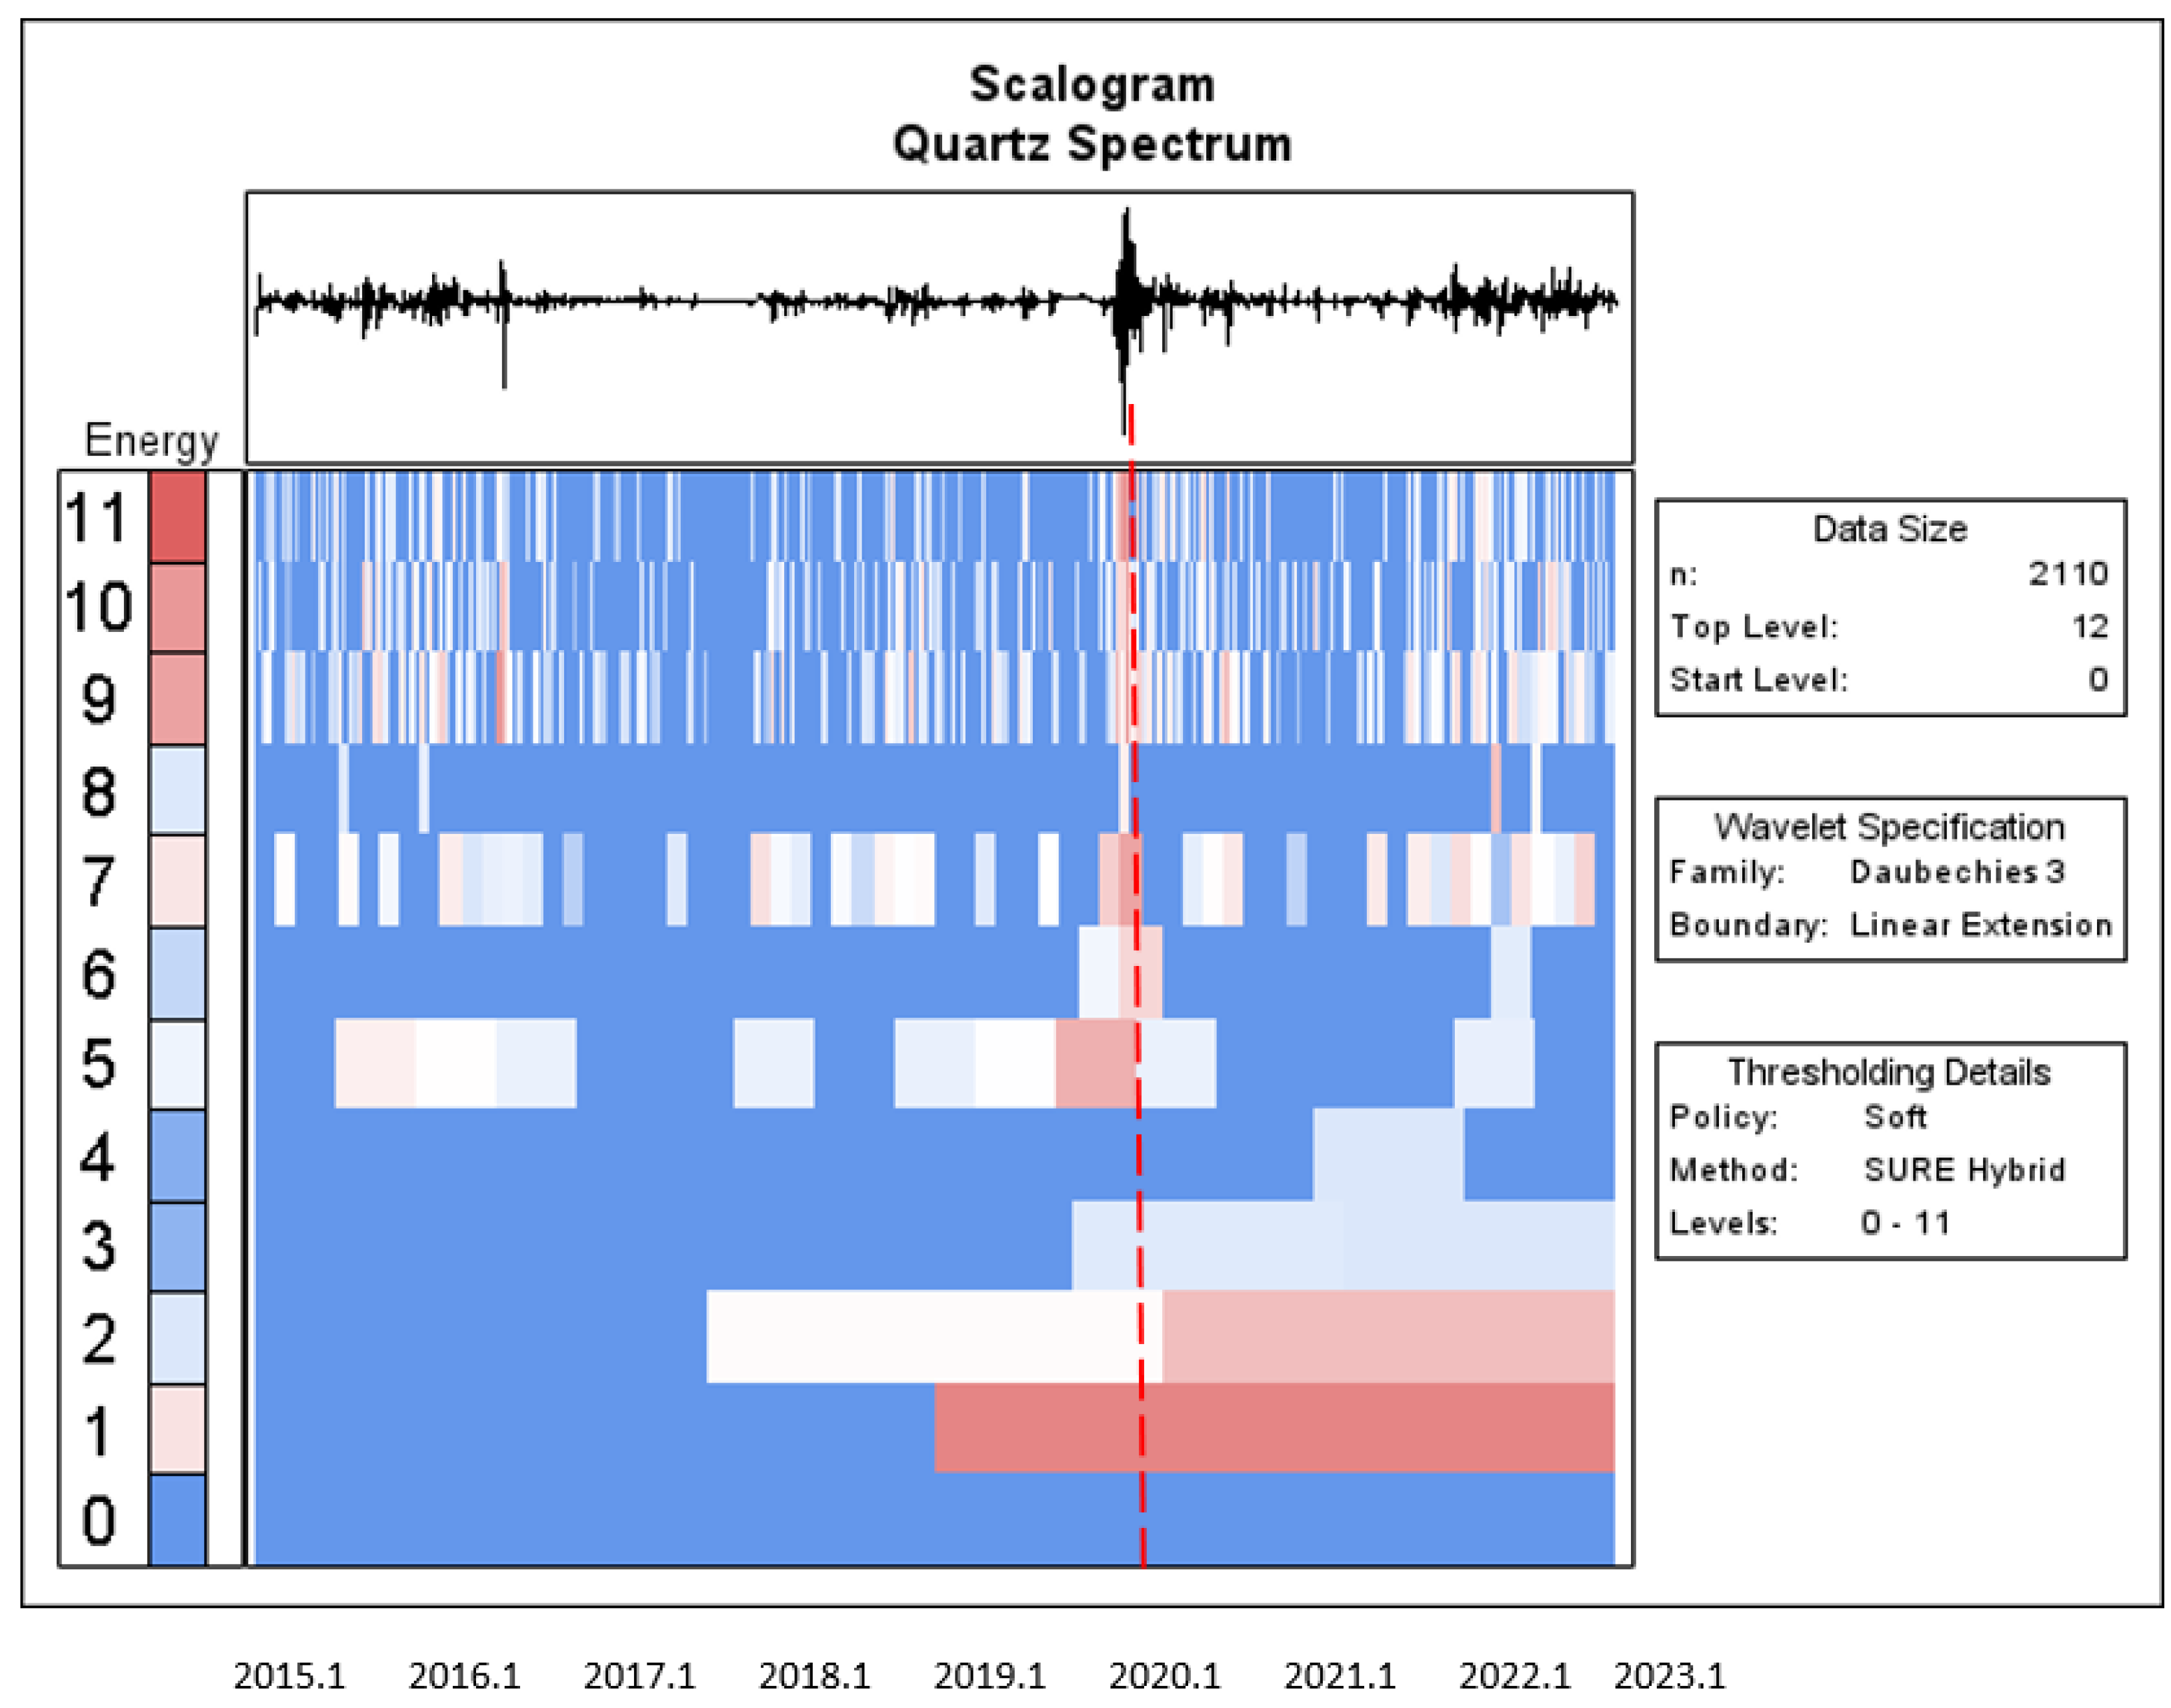
To distinguish the significant role of the wavelet power spectrum, we focus on the unique features of the wavelet power spectrum for each asset. The wavelet power/energy is denoted by colour, and ranges from blue for low power to red for high wavelet power.
Figure 7 displays the wavelet power spectrum for Bitcoin. It is not difficult to recognize the two major areas of red, with a dark contour indicating the short term, occurring from 2017 to 2018 and from 2019 to 2020. These findings suggest that the volatility of Bitcoin prices rose substantially within these frequency regions and time scales. Moreover, they indicate the existence of high uncertainty in Bitcoin within smaller time ranges (higher frequencies).
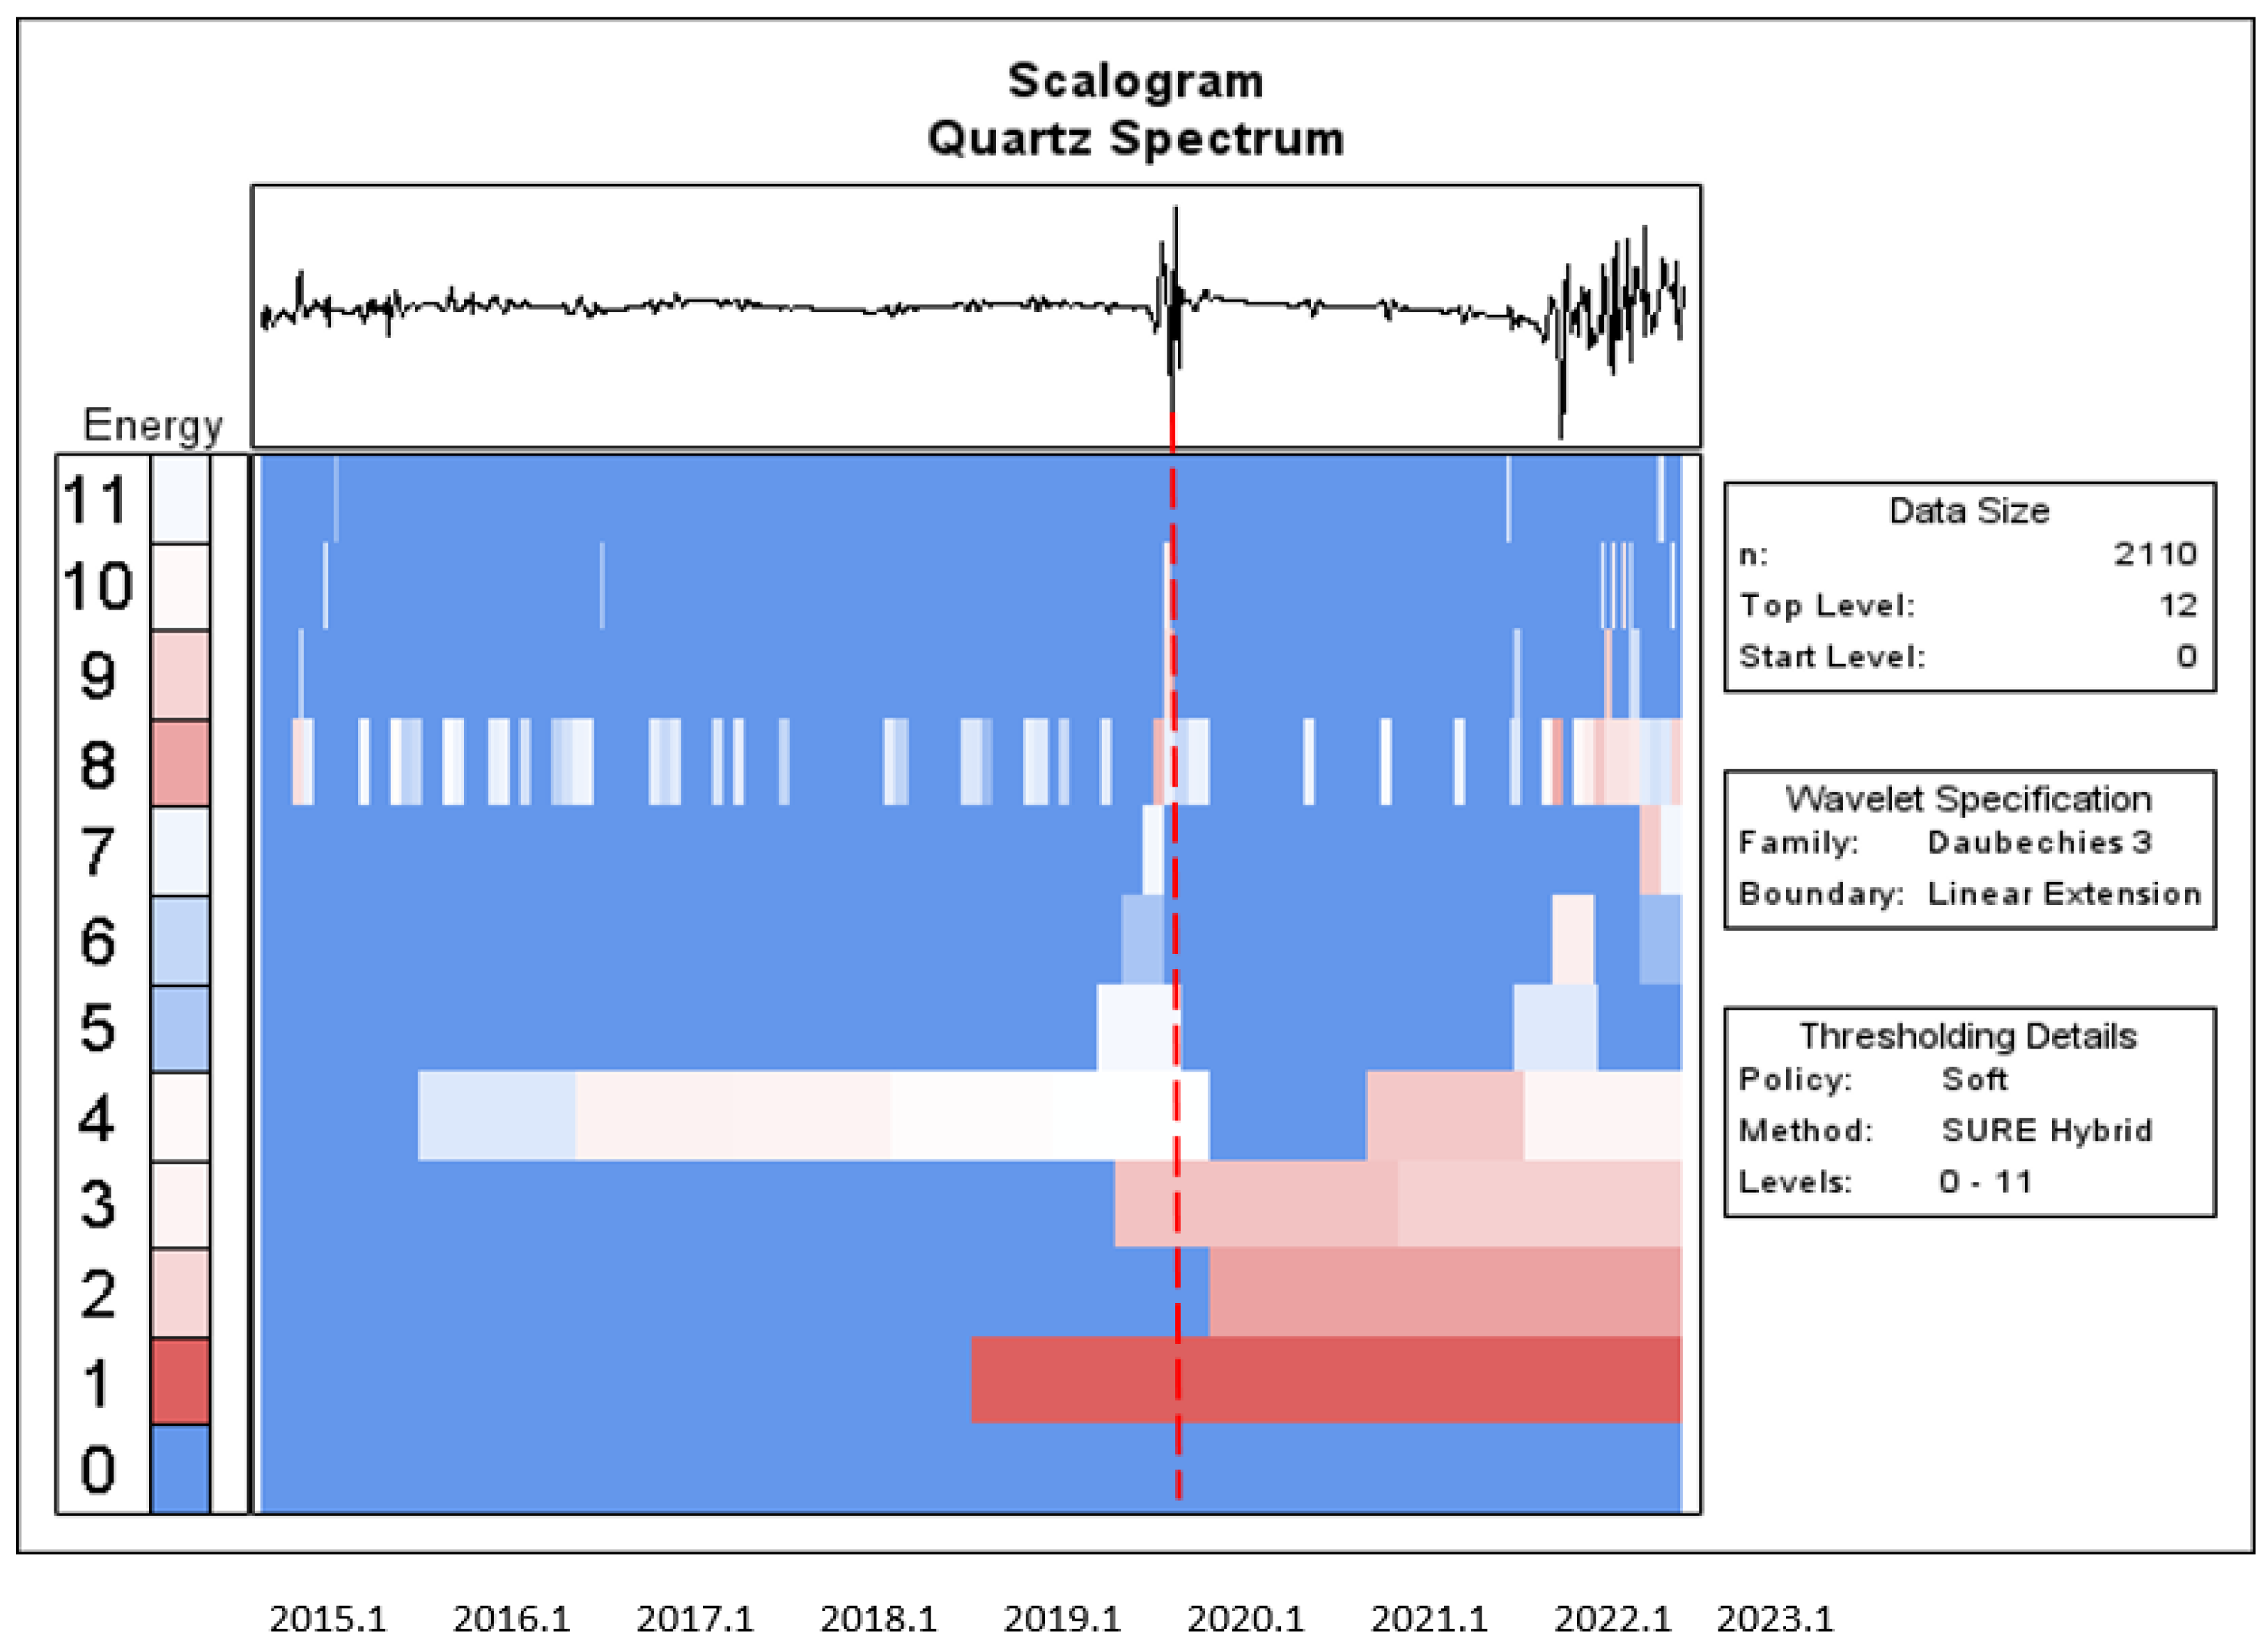
In the case of the DJWS in
Figure 8, we can observe that its returns show high wavelet power at high frequencies (smaller time scales), and emerge during January 2020.
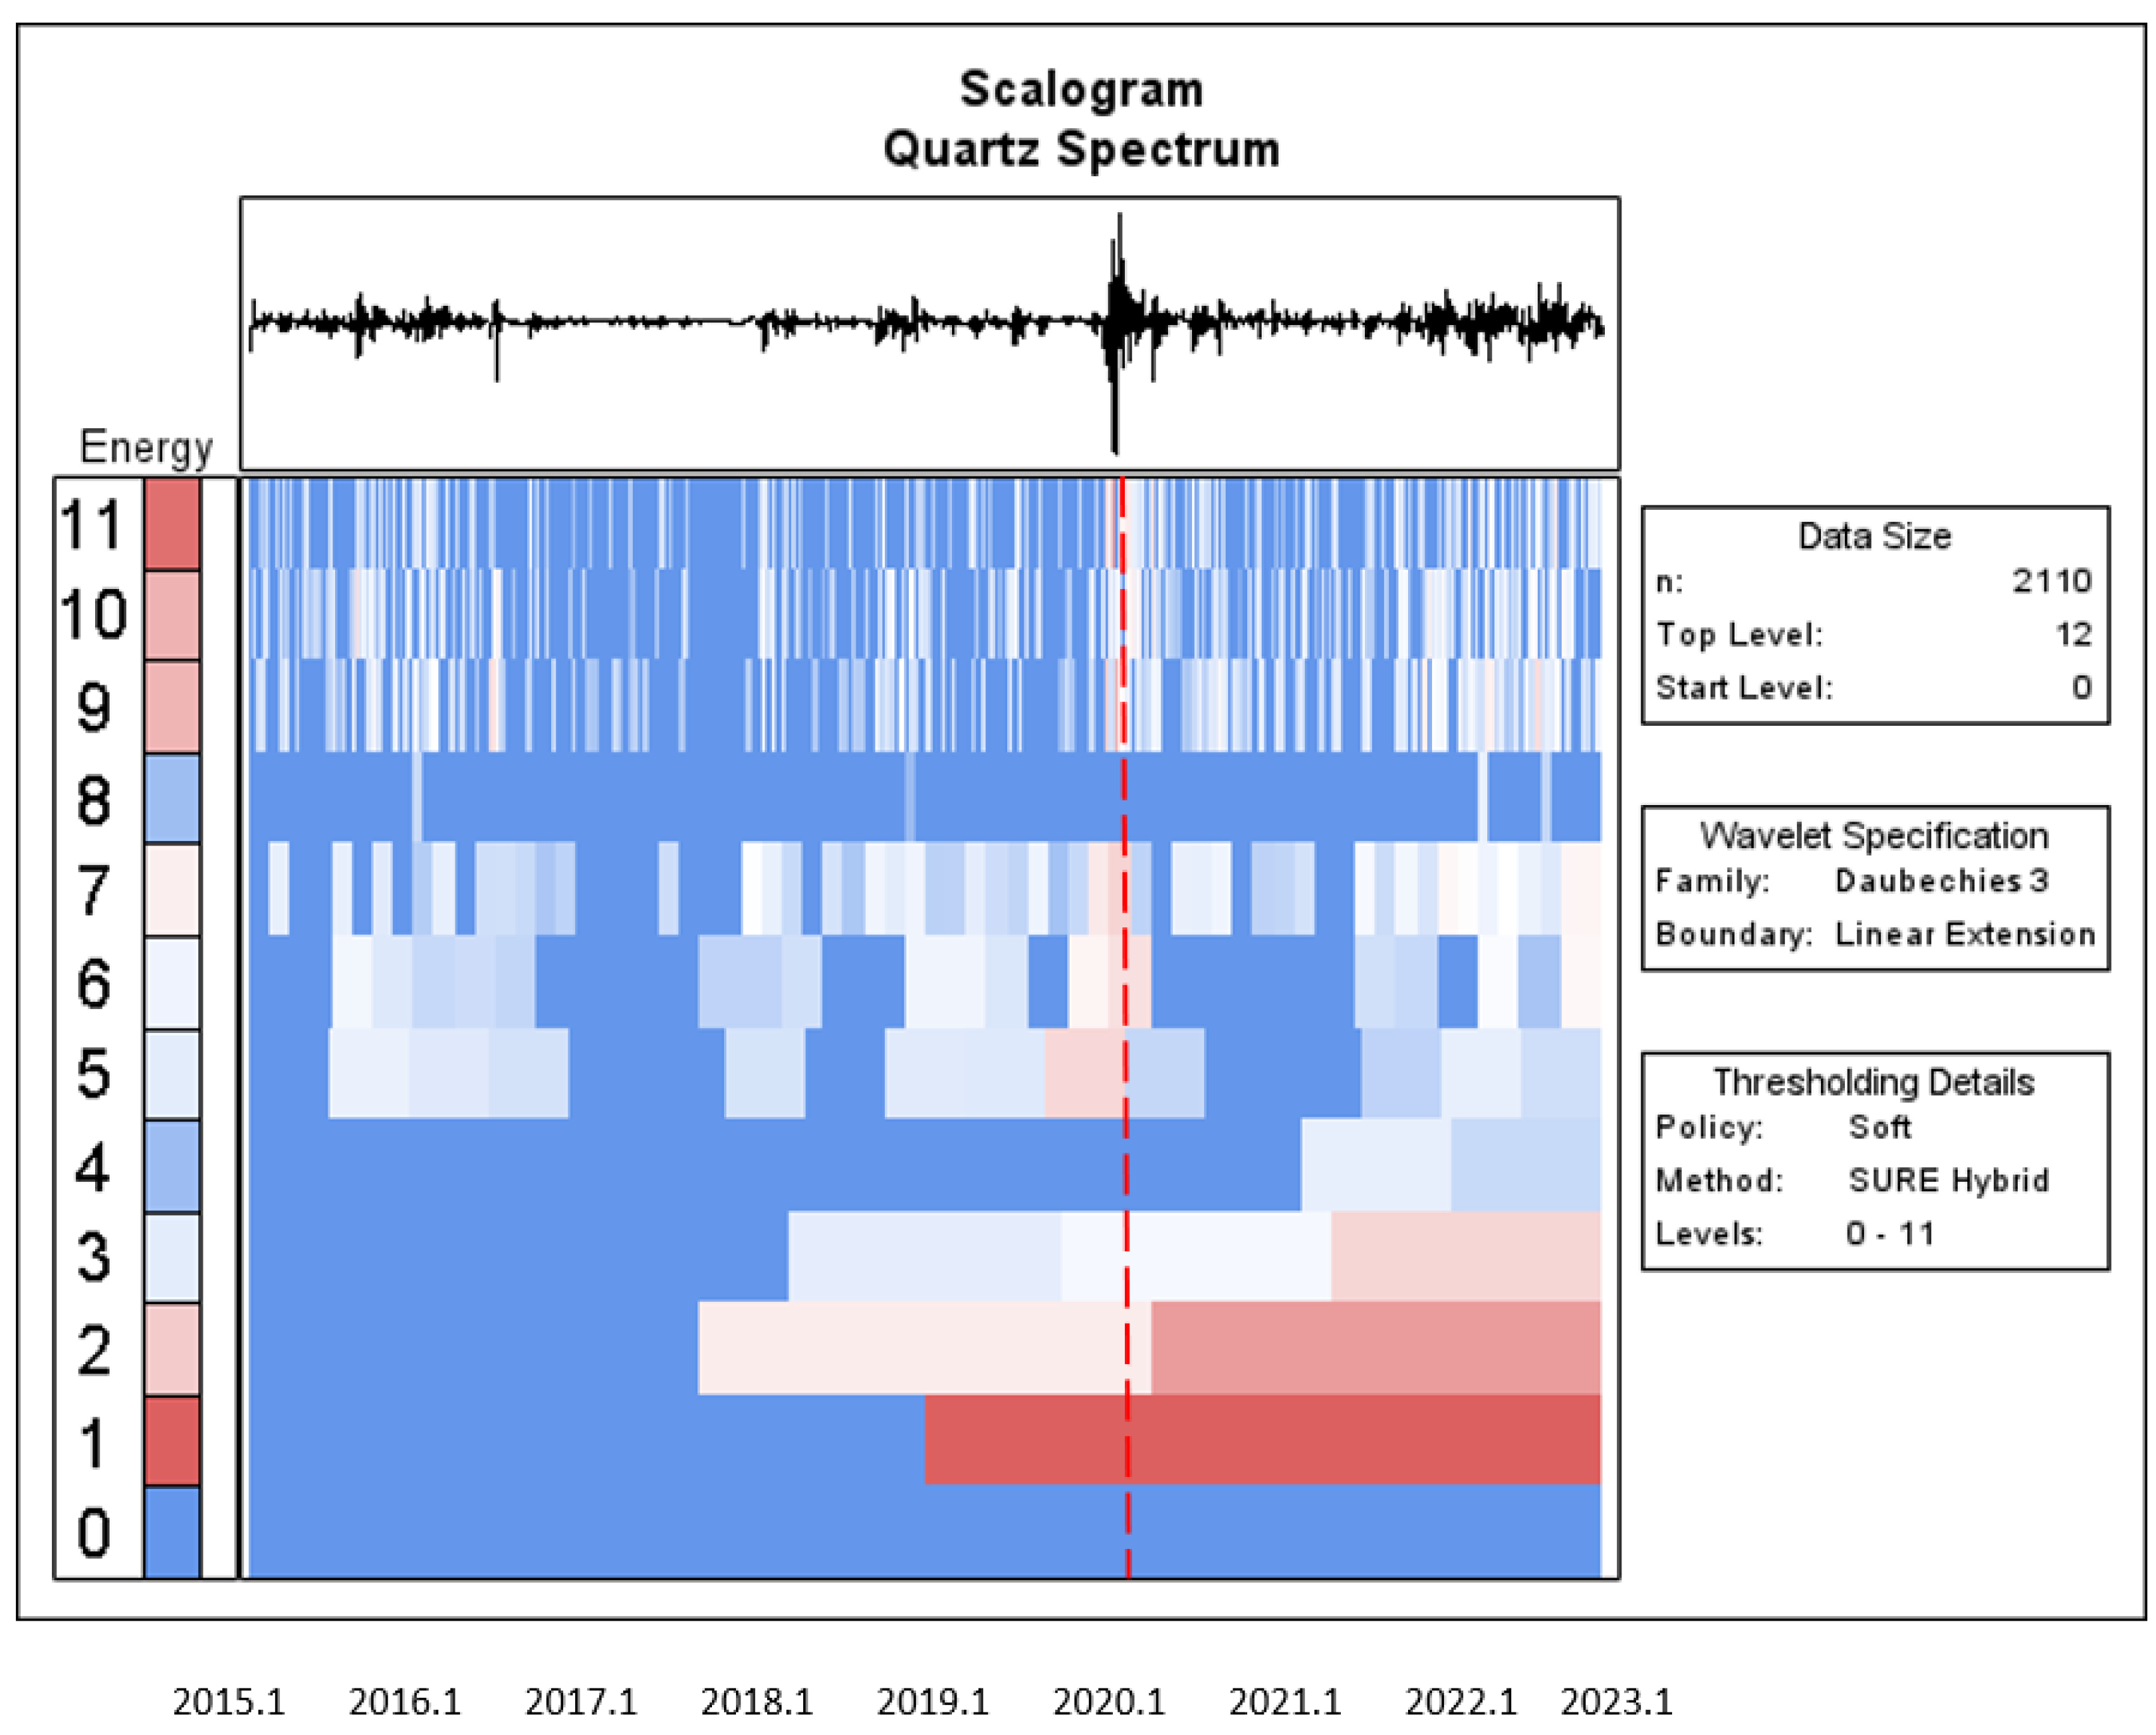
In the case of Green Bond,
Figure 9 displays that the returns illustrate high wavelet power at high frequencies (smaller time scales), and occur in January 2020 and January 2022.
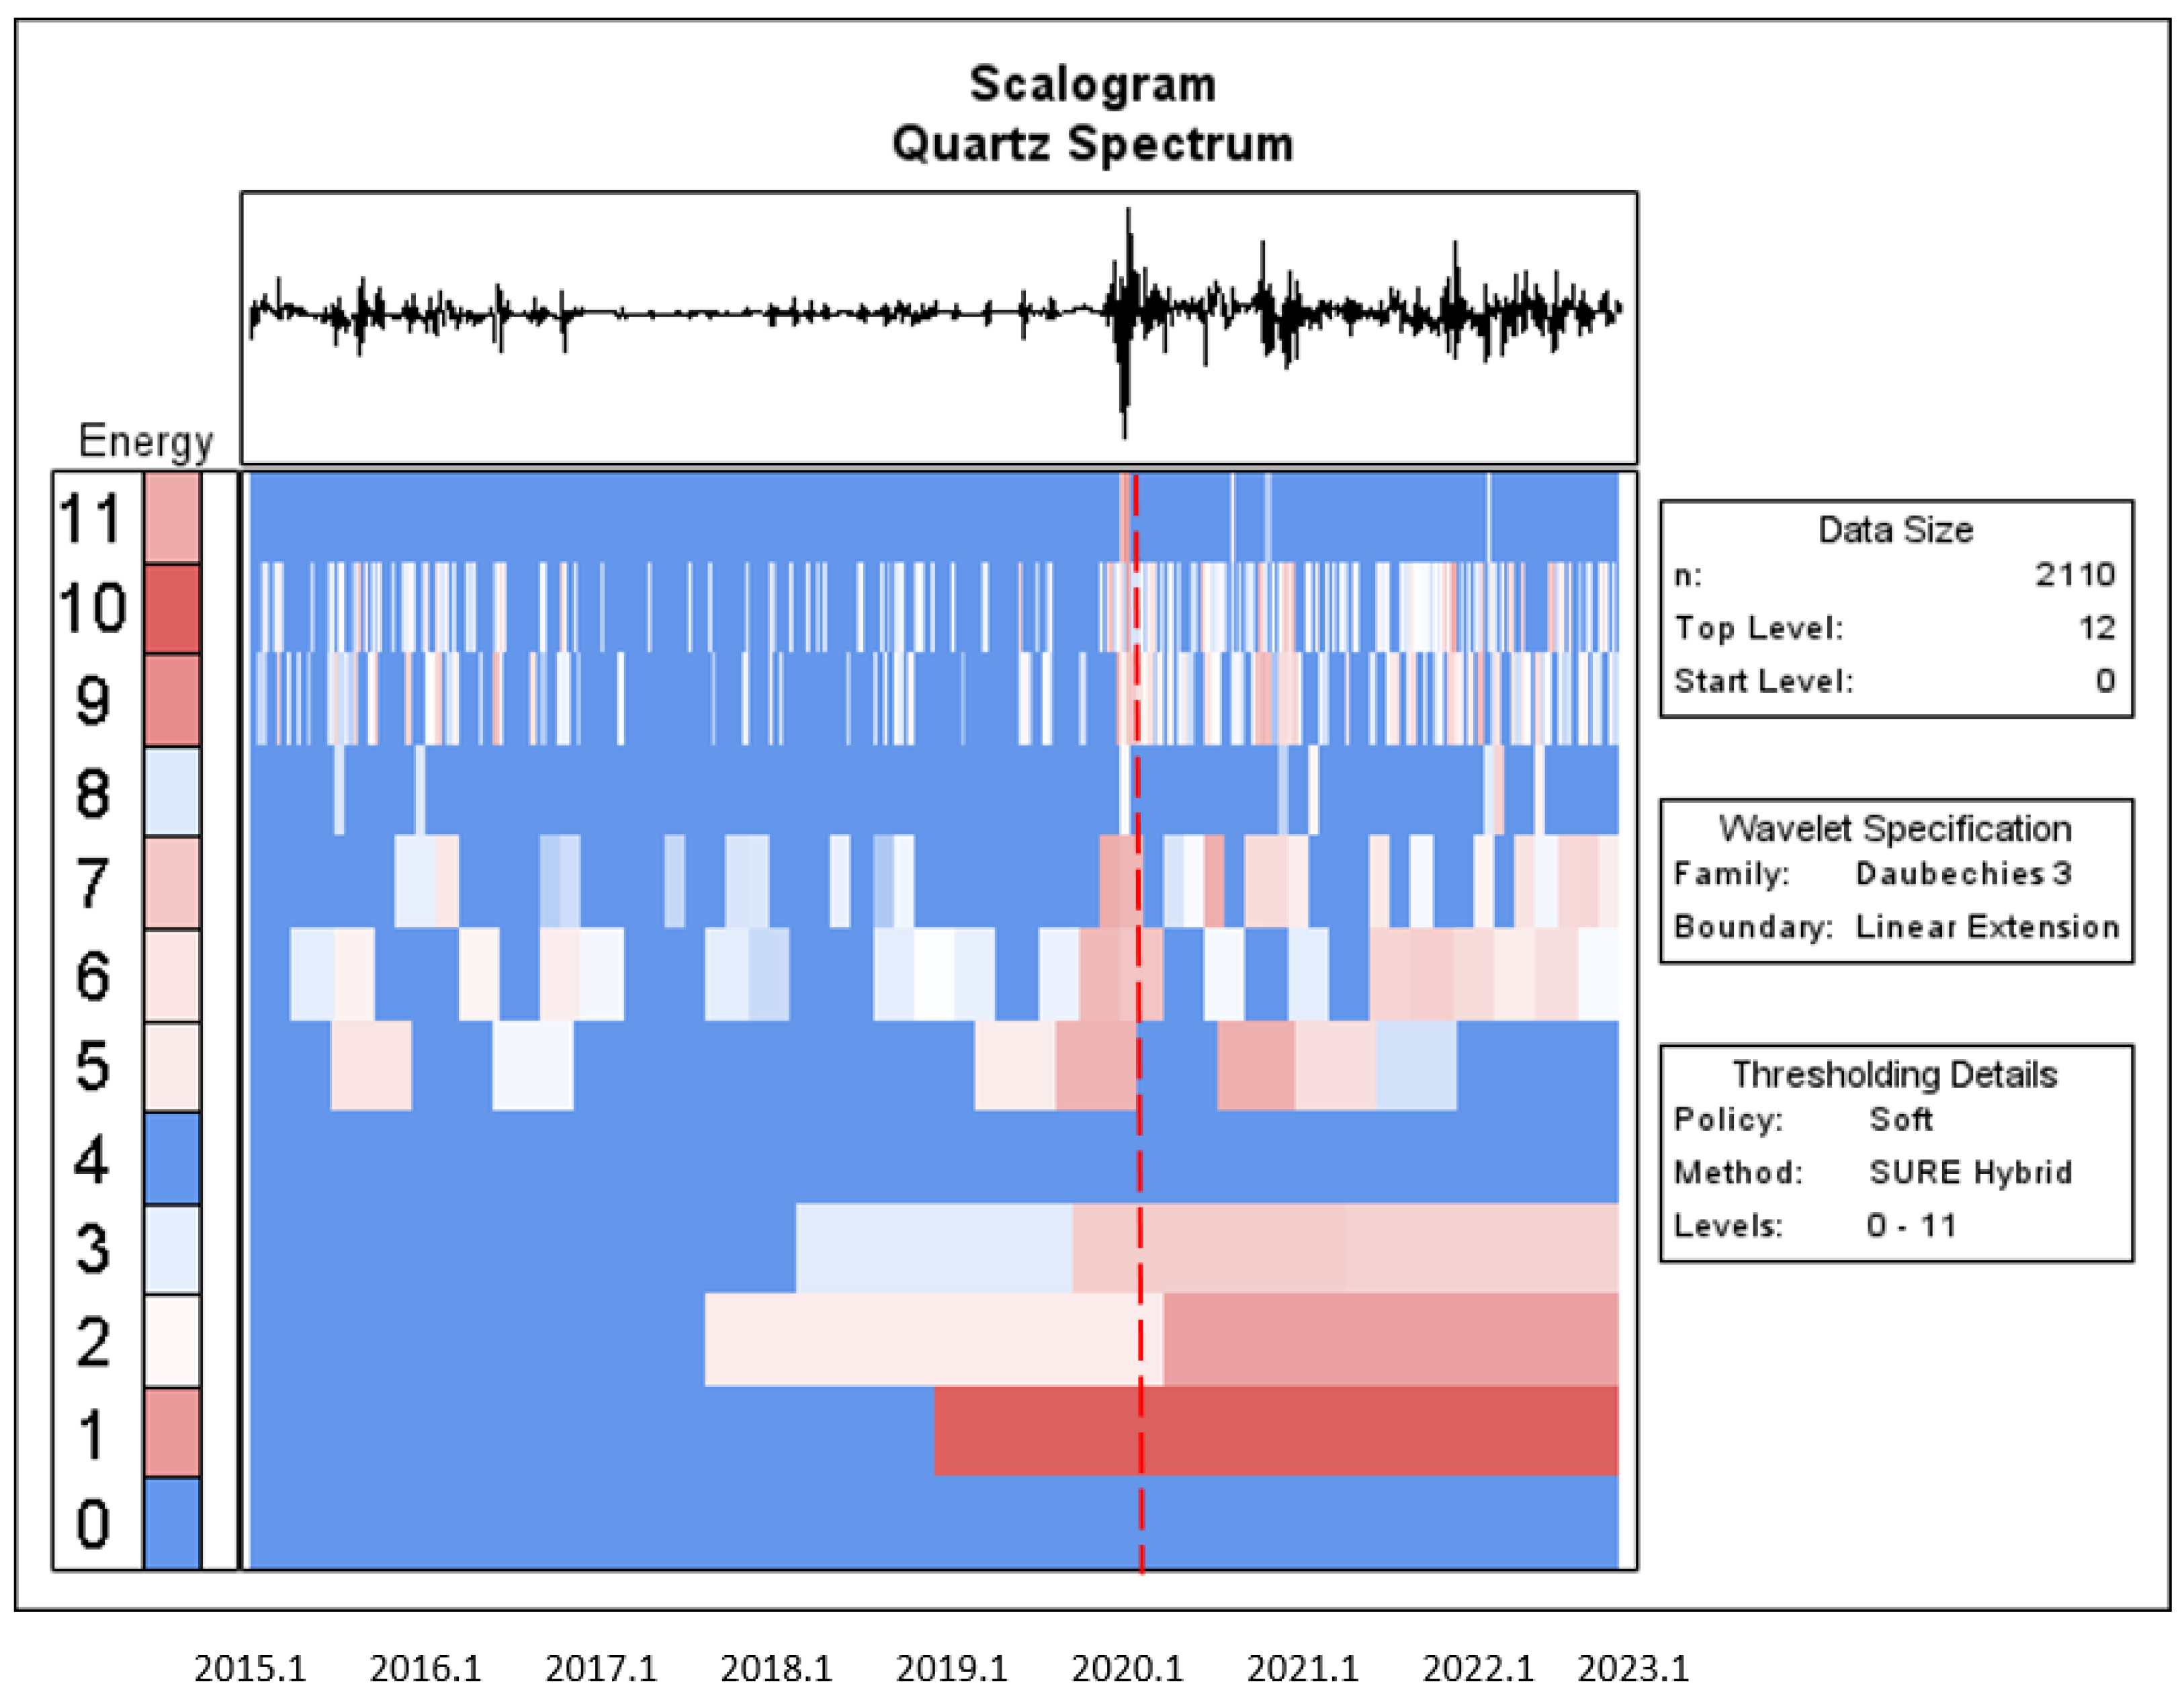
In terms of Carbon,
Figure 10 also shows that high wavelet power (at high frequencies and within smaller time scales) is mainly concentrated at the start of 2020.
Lastly, in the case of the Clean Energy, the index in
Figure 11 shows that regions of significant volatility are mainly focused on high frequencies within the period 2019–2020.
The wavelet scalogram contains the wavelet coefficient energy (left) and point wavelet entropy dynamics (right) for the individual financial time series. This study used energy/power to obtain the wavelet spectra of the time series. The red vertical line is the start of the COVID-19 outbreak. The X-axis and Y-axis represent time scales and frequencies, respectively.
To summarise, the wavelet power spectra findings are analogous to the time diagrams in the upper portion of these Figures, indicating some of the main fluctuations associated with boom–bust in the five assets within the sample period. More specifically, the phases of high volatility for these return series could be due to the turmoil caused by the COVID-19 outbreak at the start of 2020.
The top of the scalogram in
Figure 7,
Figure 8,
Figure 9,
Figure 10 and
Figure 11 depicts the return trajectory of the daily closed prices, and plots a time–frequency analysis of the individual financial time series.
Figure 7,
Figure 8,
Figure 9,
Figure 10 and
Figure 11 also display the wavelet power spectrum and describe a partial view of the movements between Bitcoin and sustainable financial markets. Most of the assets’ returns show general properties, such as large-scale fluctuations at a 2 to 6-day scale, corresponding to the period 2015–2020. 1. As depicted in
Figure 7,
Figure 8,
Figure 9,
Figure 10 and
Figure 11, the spectrum colour of the wavelet power scalograms is more reddish after the COVID-19 pandemic. This implies the existence of high uncertainty in the Bitcoin and sustainable financial markets at smaller time scales (i.e., higher frequencies); investors, in recognizing this uncertainty and volatility, may alter their contributions accordingly.
The
X-axis is a yearly timeline for the sample period, starting in January 2015. The unprecedented COVID-19 period is commonly considered to have begun with the WHO announcement on 11 January 2020, wherein the WHO reported that genetic sequences of the novel coronavirus had been received from China, and the Chinese media disclosed the first death from the novel coronavirus:
https://www.who.int/news/item/29-06-2020-COVIDtimeline (accessed on 26 February 2023). The vertical axis (
Y-axis) is scaled at 0, 1, 2, …, and 11. The vertical axis on left-hand side represents the colour axis; the brighter the red colour, the larger the magnitude of the given coefficient, and the less bright the blue colour, the smaller the magnitude of the coefficient. This is not a surprising result, as similar evidence is presented in
Figure 7,
Figure 8,
Figure 9,
Figure 10 and
Figure 11. The Bitcoin and sustainable financial markets showed a significant shift in response to the outbreak of the COVID-19 pandemic, occurring in 2020 January (labelled with the red dotted line). In addition, the assets’ returns exhibited higher levels of persistent memory at all scales after the COVID-19 outbreak when compared to before the COVID-19 pandemic; the colour of the spectrum is more reddish after the COVID-19 pandemic.
5. Conclusions
Our study aims to uncover information based on fractal and entropy analyses of Bitcoin and four recognized indices belonging to prominent sustainable financial markets, namely DJSW, Green Bond, Carbon, and Clean Energy. Perhaps the most prominent application of fractal analysis concluded that the time series of Bitcoin and sustainable indices were persistent. The approximate entropy can be introduced to detect nonlinear dependence or deterministic chaos in financial assets’ returns. One of the most commonly applied tools is the approximate entropy (ApEn) test developed by [
41], which is inspired by information theory. The empirical outcome indicates interesting results, especially during the COVID-19 pandemic. After the outbreak of the pandemic, Bitcoin presents higher levels of approximate entropy (ApEn) compared with the other sustainable financial assets, due to the impact of COVID-19. The
p-value is less than 0.05, which shows that the average values of Bitcoin’s ApEn between the pre- and post-COVID-19 pandemic periods are significantly different. On the other hand, the impact of COVID-19 on sustainable financial assets is shown to be insignificant. Alvarez-Ramirez [
42] pointed out the smaller values of ApEn reflect more regular time series, whilst larger values reflect more unpredictability and more nonregular fluctuations.
Crucially, compared to Bitcoin, sustainable financial assets may play a better safe haven role during the pandemic period. The study shows that the DJSW, Green Bond, Carbon, and Clean Energy, as typical global indices, could have the characteristics of safe haven assets during the crisis periods such as the COVID-19 pandemic.
In contrast, this study shed light on the evaluation of the complex patterns of assets, alongside rigorously testing R/S statistics for the statistical significance of Bitcoin and sustainable asset indices before and after the outbreak of the pandemic. Using daily data, this study employs fractal (R/S) analysis to examine the long-range dependence of returns among Bitcoin and sustainable finance both before and after the COVID-19 pandemic. An approximate entropy approach is applied to document some stylized facts of the complexity and efficiency of Bitcoin and sustainable financial markets over the last eight years. The transmission of the impact of COVID-19 is not significant between sustainable financial indices when comparing the periods pre- and post-COVID-19. Besides, the impact of COVID-19 was shown to be significant in response to fluctuations in the price of Bitcoin during the COVID-19 period. The mean of approximate entropy between sustainable finance is higher in the post-pandemic period than in the pre-pandemic period. Empirically, a possible reason for this result may be the extreme events surrounding the COVID-19 pandemic shock of 2020, as our findings indicate that estimates of ApEn have risen in the aftermath of the COVID-19 pandemic, and now reflect more complex or irregular information within Bitcoin time series dynamics. Importantly, in the context of this paper, these findings will generate fresh insights into the information channels of sustainable finance, which may show their ability to act as safe haven assets in periods of turmoil. The policy implications of this study may help market actors and portfolio managers to improve their trading strategies, and to incorporate flexibility in their investment decisions during crisis and non-crisis periods.


