Article

Thermal Conductivity of Fractal-Textured Foamed Concrete

Department of Civil Engineering, Anhui University of Technology, Maanshan 243002, China
*
Author to whom correspondence should be addressed.
Fractal Fract. 2023, 7(6), 475; https://doi.org/10.3390/fractalfract7060475
Submission received: 9 May 2023 / Revised: 2 June 2023 / Accepted: 8 June 2023 / Published: 15 June 2023

Abstract

:
To provide scientific guidance for the use of foamed concrete (FC) in construction engineering, a thermal conductivity calculation method, based on the fractal model of FC, has been developed. The thermal conductivity (TC) of FC has been tested by the transient planar heat source method in order to verify the reliability of the proposed calculation model. The FC was made of cement, fly ash, and ore powder, and cured under natural conditions for 7 d, 14 d, 28 d, and 42 d, respectively. The TC of FC gradually decreases with the increase in age. The fractal dimension of FC can be determined by both the box-counting method and compressive strength test, and the dimensions determined by both methods are similar. The TC of FC at different porosities and curing ages can be calculated by the fractal dimension, and the estimated values are basically consistent with the test data.

1. Introduction

Foamed concrete (FC) is a type of lightweight concrete in which air is added to the cement paste by a foaming agent [1,2,3,4]. It has many advantages, such as its high fluidity, low cement content, lower aggregate consumption, light weight, and optimal thermal insulation properties [5,6]. FC is increasingly used in modern architecture due to its unique properties and wide range of applications [7]. Thermal conductivity (TC) is an important thermal parameter in the numerical modeling of temperature fields in cold regions [8,9,10]. The TC of FC is an important parameter for its technical engineering applications. Therefore, it is of great technical and scientific importance to develop a model for calculating the TC of FC [11,12,13]. Currently, there are several proposals for predictive models for the TC of porous materials. Bi et al. [14] developed a model specifically for fine-grained soils, while Zhang et al. [15] created a model matrix for soil. Miled et al. [16] used mean-field homogenization schemes to derive analytical forms for predicting the normalized effective TC of foamed concretes, which were then compared with FEM-based simulation results. However, these models are primarily empirical formulas based on experimental data and are limited in their applicability to different materials with different TC properties, which presents a challenge for the materials mixed in FC. The relationship between the macroscopic mechanical and transport properties of concrete and its micro- and meso-material structures has been extensively studied [17,18]. Concrete is known for its complex spatial distribution, from the nanometric to the macroscopic scale, as well as its highly inconsistent chemical and physical composition due to varying mix proportions, fillers, aggregates, and the sensitivity of the hydration process to curing conditions and environmental loads [19,20]. Although significant progress has been made in improving experimental techniques, interpretation methods, and numerical models, it remains a challenge to extract parameters or quantities that accurately represent the microstructure of concrete over a wide range with a solid physical basis. One possible solution is to use fractal dimensions to characterize structural complexity at a given scale [21]. For example, Lü et al. [22] discovered simple relationships between fractal dimension, compressive strength (CS), and permeability in concrete with silica fume. In addition, Chen et al. [23] developed a fractal theory-based predictive model for CS in foamed concrete. Although the correlation between the fractal dimension of the surface of FC and TC has not yet been demonstrated, similar relationships have been observed in other porous materials. For example, Yu [24] developed a model for the effective TC of double-dispersed porous media based on fractal theory and thermos-electric analogy. Shen et al. [25] proposed a different model for the effective TC of unsaturated porous media using the theory of fractal geometry. Feng et al. [26] considered the variation of fractal pore size with porosity and developed a new generalized model for the effective TC of unsaturated porous media.
Córdoba and Arias-Zugasti [27] present an efficient and accurate iterative algorithm for multicomponent thermal diffusion coefficients and partial thermal conductivity based on the kinetic theory of gases (KTG), which provides an extremely efficient and accurate method for calculating molecular mass transfer coefficients in mixtures with a large number of components. Based on the fractal dimension and fractal theory, several different modified Sierpinski carpet fractal models were developed by Li et al. [28]. The results of the study can be used to establish the relationship between fractal dimension and structure and heat transfer, and to estimate the thermal conductivity. Zhao et al. [29] proposed a simple thermal model for calculating the effective thermal conductivity of Li4SiO4 spherical beds, but these models are only capable of preliminary approximation predictions and cannot be fully used to calculate the true thermal conductivity. The preliminary prediction can provide a general guide for the test, and thermal conductivity that does not meet the expectation can be discarded without further testing. Dubil et al. [30] investigated the effect of several geometric properties on the effective thermal conductivity of POCS and then derived the effective thermal conductivity of the cell from the resulting total thermal resistance. It shows good agreement with the simulated data and is able to capture all the geometrical effects discussed in this work. Yuan et al. [31] investigated the theoretical calculation method of the effective thermal conductivity of carbon nanotube (CNT) composite molten salt, and the reliability of the model was verified by comparison with the measured data. The method can be used for the calculation of effective thermal conductivity of CNT composite molten salts. This method is studied to simplify the TC calculation for CNT, and it can obtain the TC of CNT quickly and accurately. The thermal conductivity model was developed to find out the TC easily and quickly on the one hand, and to give an approximate value when the TC cannot be calculated exactly on the other hand, which is very meaningful for the study of TC. These studies provide valuable insights for the development of thermal conductivity models of FC that utilize fractal dimensions.
Based on the fractal dimension of the surface of FC, a fractal relationship was established between the TC of FC and its porosity. The fractal dimension of FC, which was made with different water–cement ratios, was calculated by the SEM image method and compressive strength testing. Based on this, the TC of FC was calculated, and the calculated values were compared with the measured TC in this paper and the literature to verify the accuracy of the proposed model. The results show that the model can provide a simple and scientific method for predicting the thermal insulation performance of FC.

2. Theory

Relation of Thermal Conductivity to Porosity

Similar to the hypothesis of Krone [32], it can be assumed that the concrete block is formed from cement particles, while the cement particles are formed from plenty of primary cement cells with strong attractive bonds; the attractive bonds and spherical cells will not significantly change with successively higher order cementation (see Figure 1). Thus, the functional relationship between cement particle number and particle diameter can be expressed as follows [33]:
N = f c d c 3 d c d p D
The relationship between the porosity of FC and its fractal dimension is shown below [33]:
φ = 1 f c d c d p D 3
where φ is the porosity of FC, fc is the scaling factor, dc is the average diameter of cement particles, dp is the minimum particle diameter, and D is the surface fractal dimension.
As shown in Figure 1, a macro void will exist between the cement particles while, inside the cement particles, a micro void also exists between the primary cement cells. Pore gases have very poor thermal conductivity and usually do not participate in heat transfer. Therefore, the main heat transfer channels are the attractive bonds between cells. Son and Hsu [34] found the number of attractive bonds between cells of FC is a function of the skeleton fractal dimension, and the number of attractive bonds between cells (N′) in the plane crossing the center of FC is:
N = π 4 π 6 2 3 d c d p 2 D 3
where N′ is the number of attractive bonds. The ratio of the skeleton volume V′ to the total volume V is expressed as:
V V = C α d c d p 2 1 D 3
Therefore, the density of effective contact points in concrete is N′/V′, and total adhesive point density is N/V (ratio of total number of particles to total volume). Therefore, the relative density of effective contact points λ can be expressed as:
λ = N / V N / V = α d c d p D 2 3
The larger the λ, the more channels available for heat transfer, and, then, the better the thermal conductivity. Accordingly, we assume that the thermal conductivity of FC is proportional to the relative density, that is:
κ λ = α d c d p D 2 3
Then, combining Equations (2) and (6), the relation between the thermal conductivity and compactness can be expressed as:
κ = κ 0 ( 1 φ ) b
where κ0 is the thermal conductivity of the FC with φ = 0, and the relationship between the parameter b and fractal dimension D is given as:
b = D 2 3 ( 3 D )

3. Experiments

3.1. Thermal Conductivity Measurement

The cement was ordinary silicate cement 42.5. Fly ash and ore powder were provided by Baowu Group, China. Plant protein foaming agent was used and diluted with water at a weight ratio of 1:50. The compositions of the three binders are shown in Table 1.
FC was prepared by mixing cement, fly ash, and ore powder in a mass ratio of 15:3.5:1.5, with the water–binder ratio adjusted to 0.38. The binders were weighed and uniformly mixed according to the mixing ratio. Then, the binders were batched into the cement foaming machine and mixed with water. At the same time, the diluted foaming agent was added to the foaming machine. After the foaming agent stabilized, the bubbles were added to the cement slurry. The bubble content can be adjusted by controlling the foaming time. The cement slurry and bubbles were mixed for 3 min to distribute the bubbles evenly, and then the slurry was poured into the test mold. After the specimen was made, it was demolded after 24 h and cured under natural conditions for 7 d, 14 d, 28 d, and 42 d. Then, it was put into a 60 °C drying oven to dry, taken out, and cooled to room temperature for testing.
According to Chinese standard GB/T 32064-2015 [35], the transient plane source method was used to measure the thermal conductivity κ of FC, and a TC3000E thermal conductivity meter (Xiatech Co., Ltd., Xi’an, China) was selected. The dried sample surface was wiped, and the hot disk sensor was placed between two sample pieces to form a sandwich structure with the hot disk sensor (see Figure 2). Since the TC of FC is in the range of 0.1~0.5 W/(m-K) [36,37,38], a voltage of 1.0 V was selected according to the instruction manual of the meter, and the acquisition time was set to 10 s with an acquisition time interval of 3 min. After confirming the sensor settings, a heat equilibrium measurement was performed, and after the heat equilibrium measurement was completed, the TC was measured. Three samples were tested for each group, and the average value of TC was obtained.
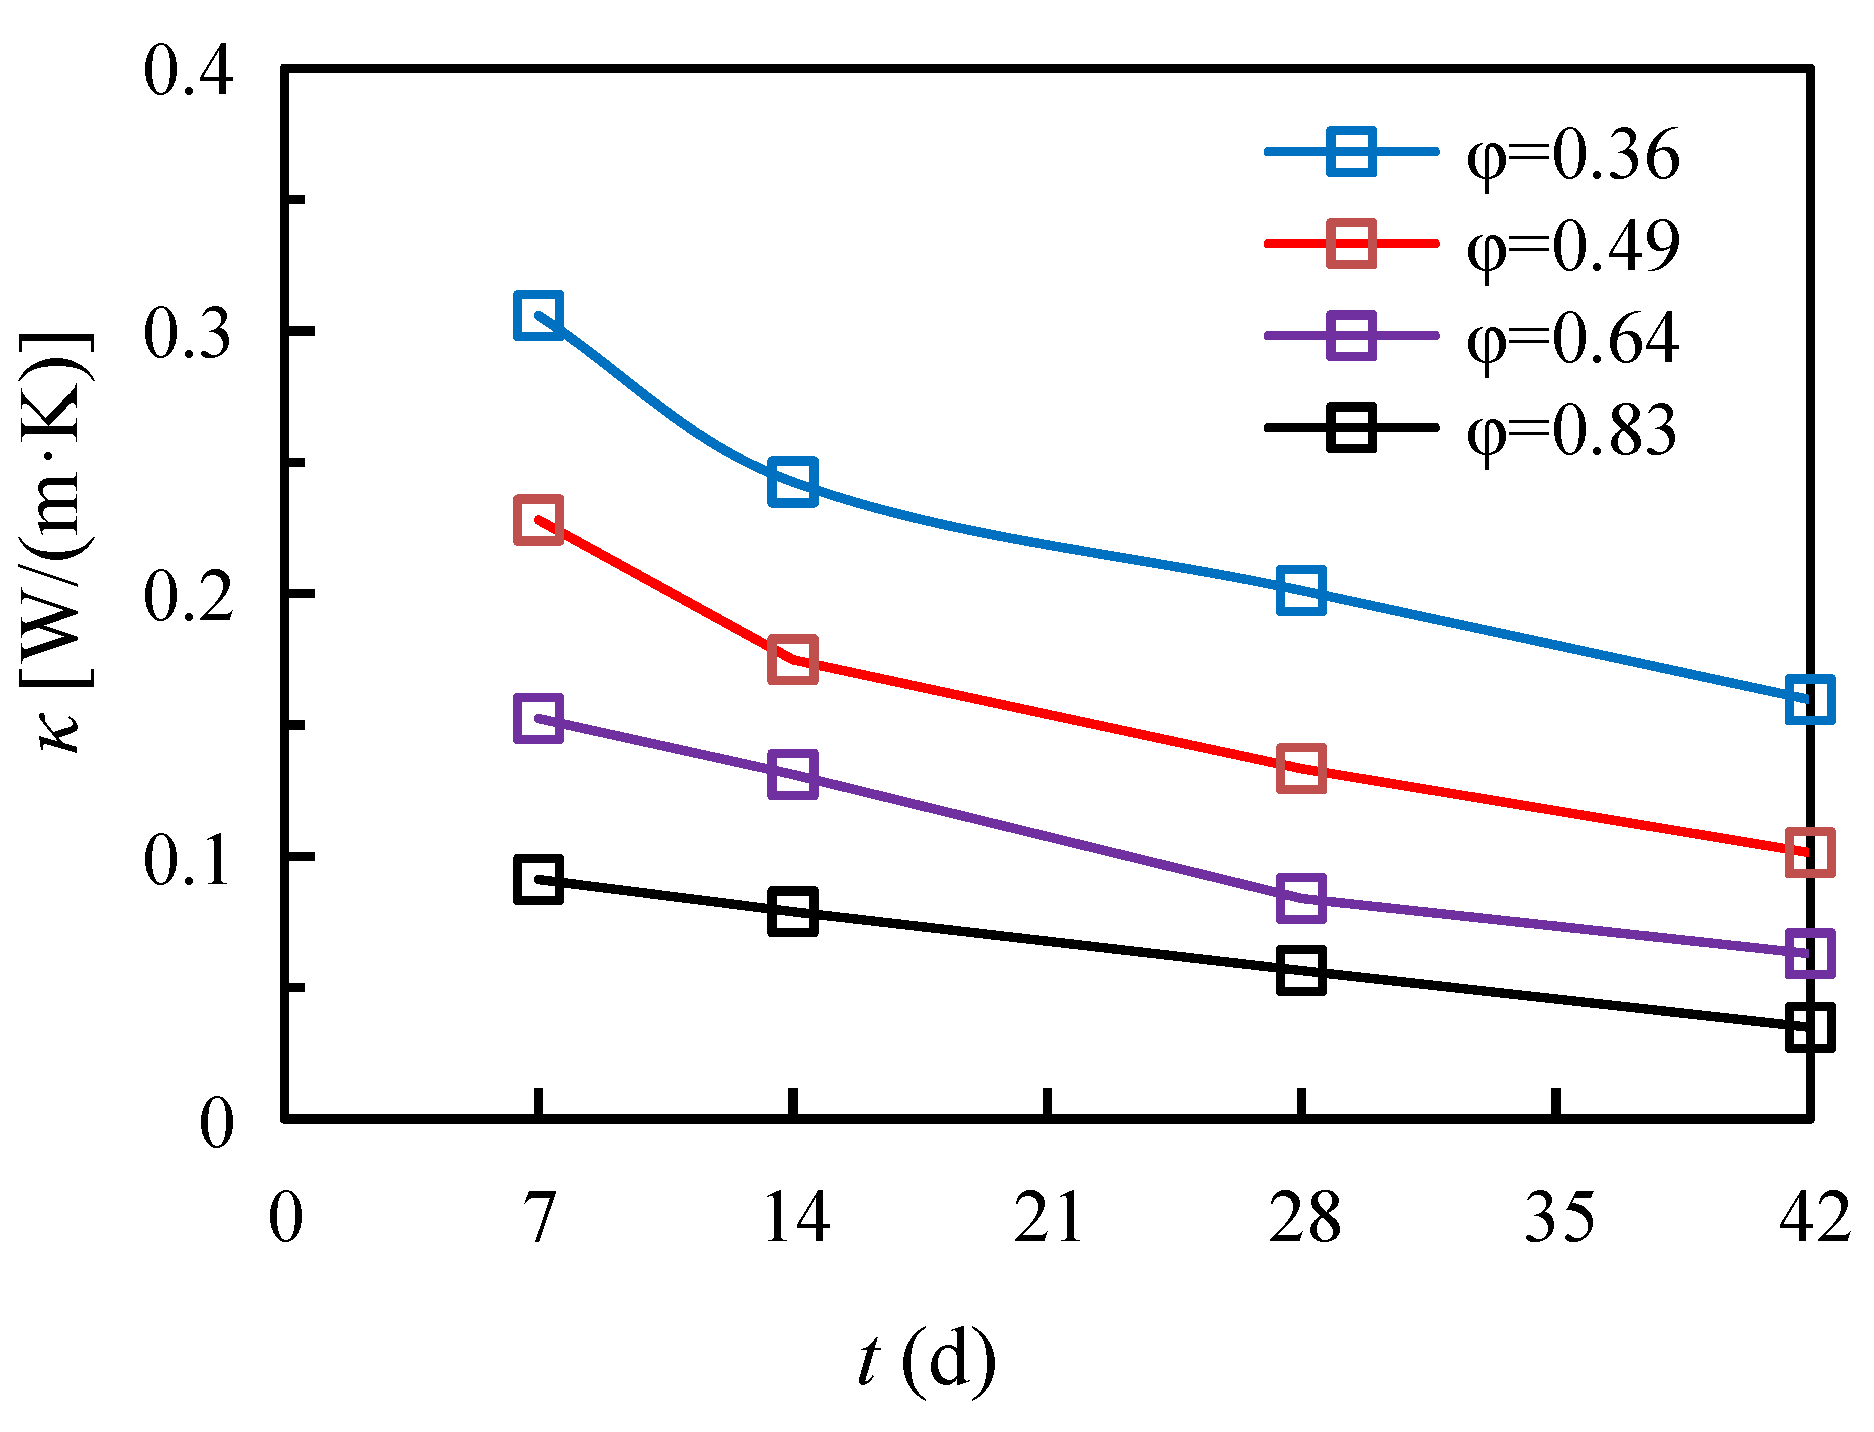
Figure 3 shows the changes in the TC of FC with age at different porosities. Due to the fact that the TC of air is much smaller than that of cementitious material, the TC of FC decreases with an increase in porosity (φ), where the porosity φ is calculated as:
φ = 1 ρ f c ρ c
where ρfc is the dry density of FC and ρc is the dry density of concrete without foaming agent.
From Figure 3, it also can be seen that the TC of FC gradually decreases with increasing curing age, which is mainly because the sample is cured under natural conditions and the water content is gradually lost with increasing age, resulting in a decrease in TC. As the porosity increases, the TC decreases. This is because the thermal conductivity of air is less than that of solid concrete, the pores become more porous and the overall TC decreases. As shown in Figure 4, the TC of concrete without a foaming agent decreases logarithmically with curing age, and the relationship can be expressed as κ0 = −0.18lnt + 0.95 with a correlation coefficient of 0.957.

3.2. Compressive Strength Test

After testing the TC, a universal testing machine was used to test the compressive strength of FC with different ages and porosity. The experiment was conducted according to the Chinese specification JGJT372-2016.
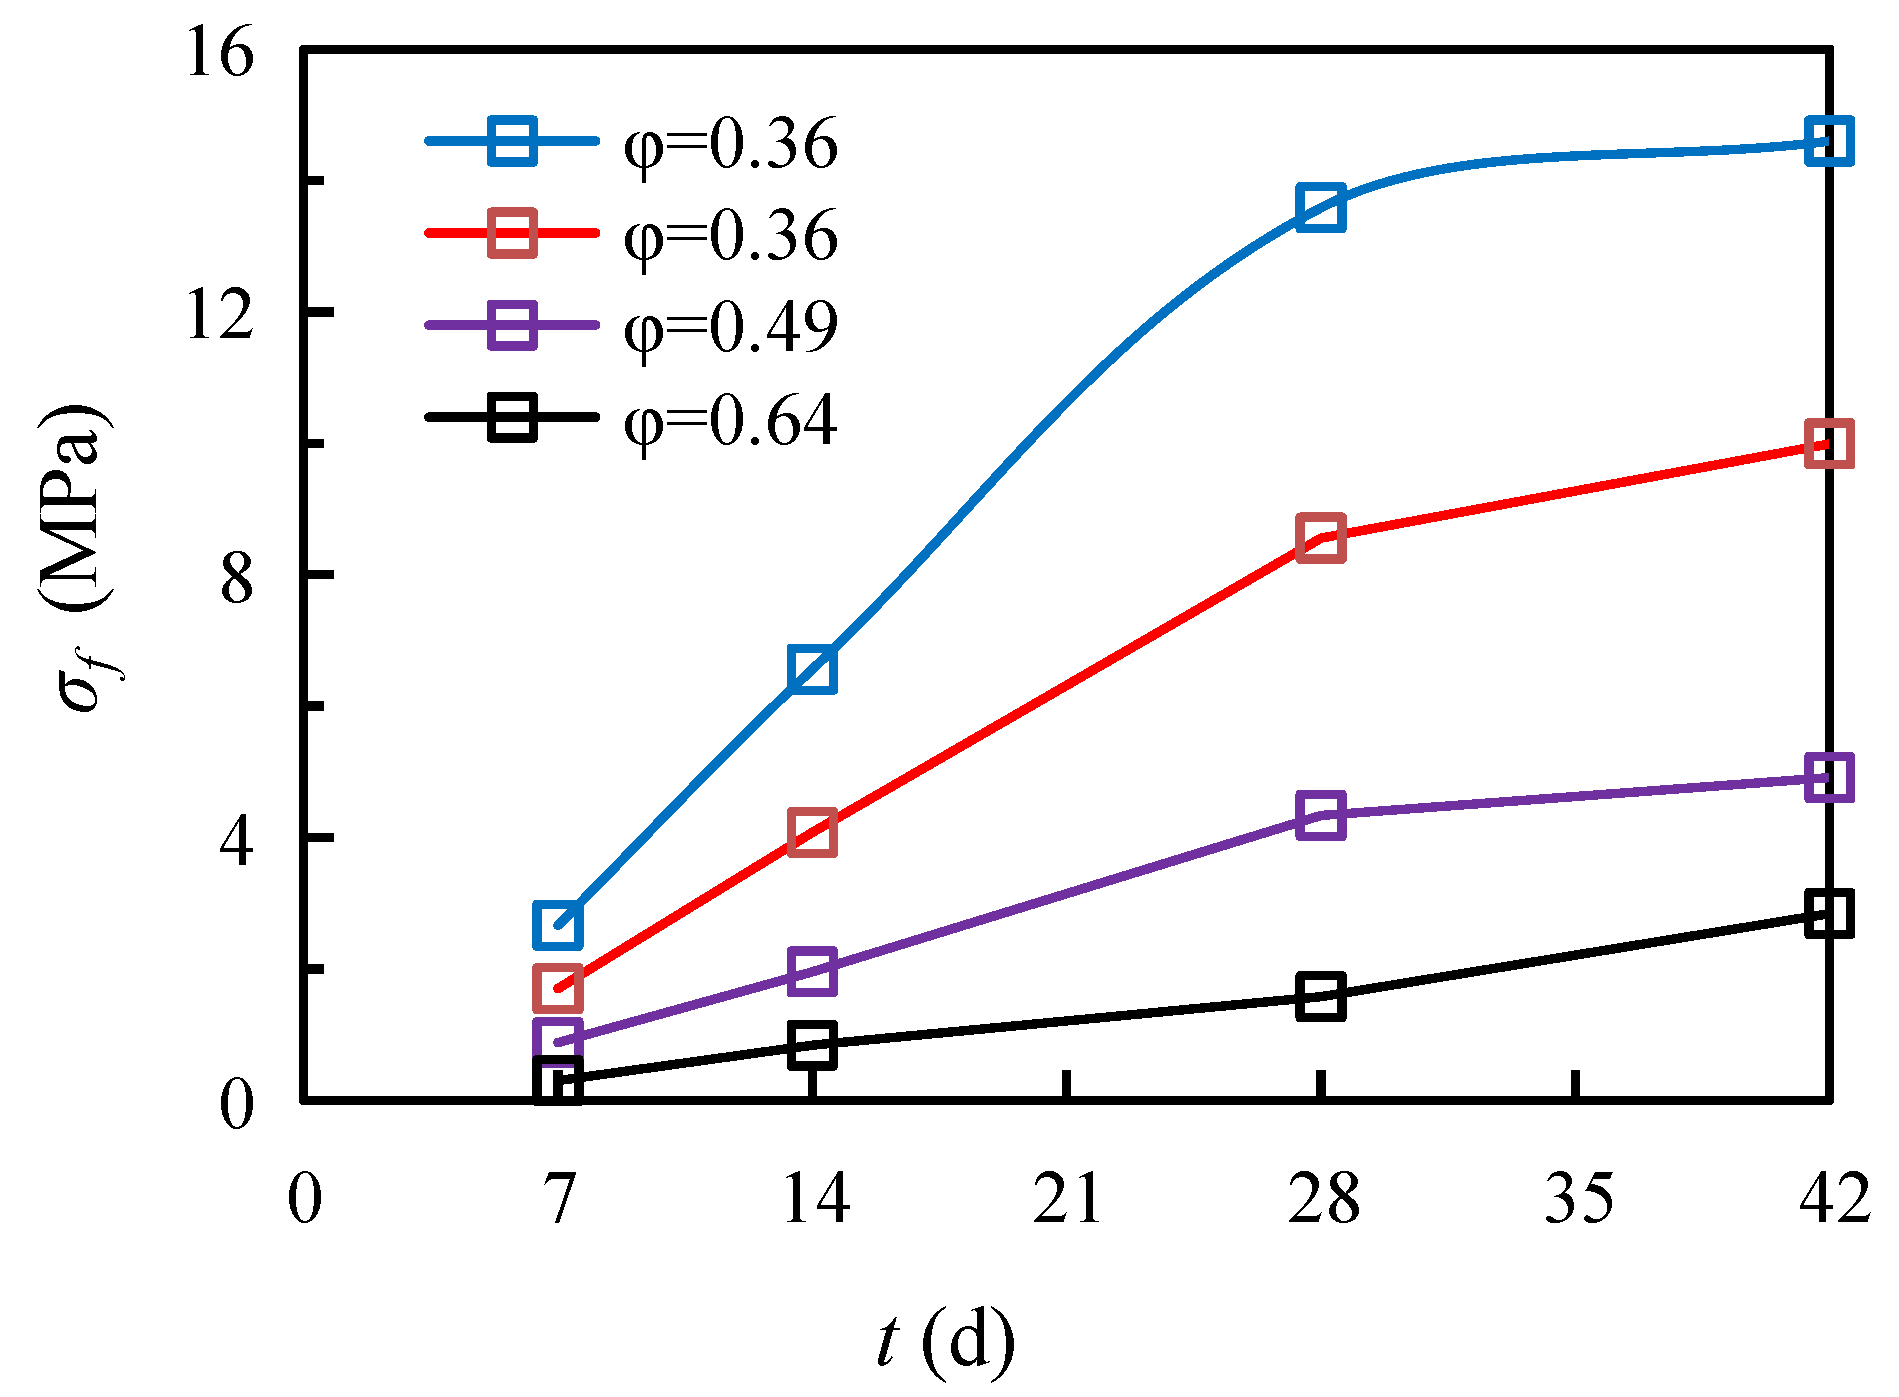
Figure 5 shows the relationship between the compressive strength of FC and age. From the figure, it can be seen that the higher the foaming rate of FC, the lower the compressive strength. This is because more pores make the effective skeleton of the internal structure of FC reduced, making the load-bearing effect lower. As the curing age increases, the compressive strength of FC increases gradually, especially in the initial stage, where the hydration reaction of the cementitious materials is more intense and the strength increases rapidly; with time, the hydration reaction tends to be stable and the strength increase slows down.

3.3. Scanning Electron Microscope Test

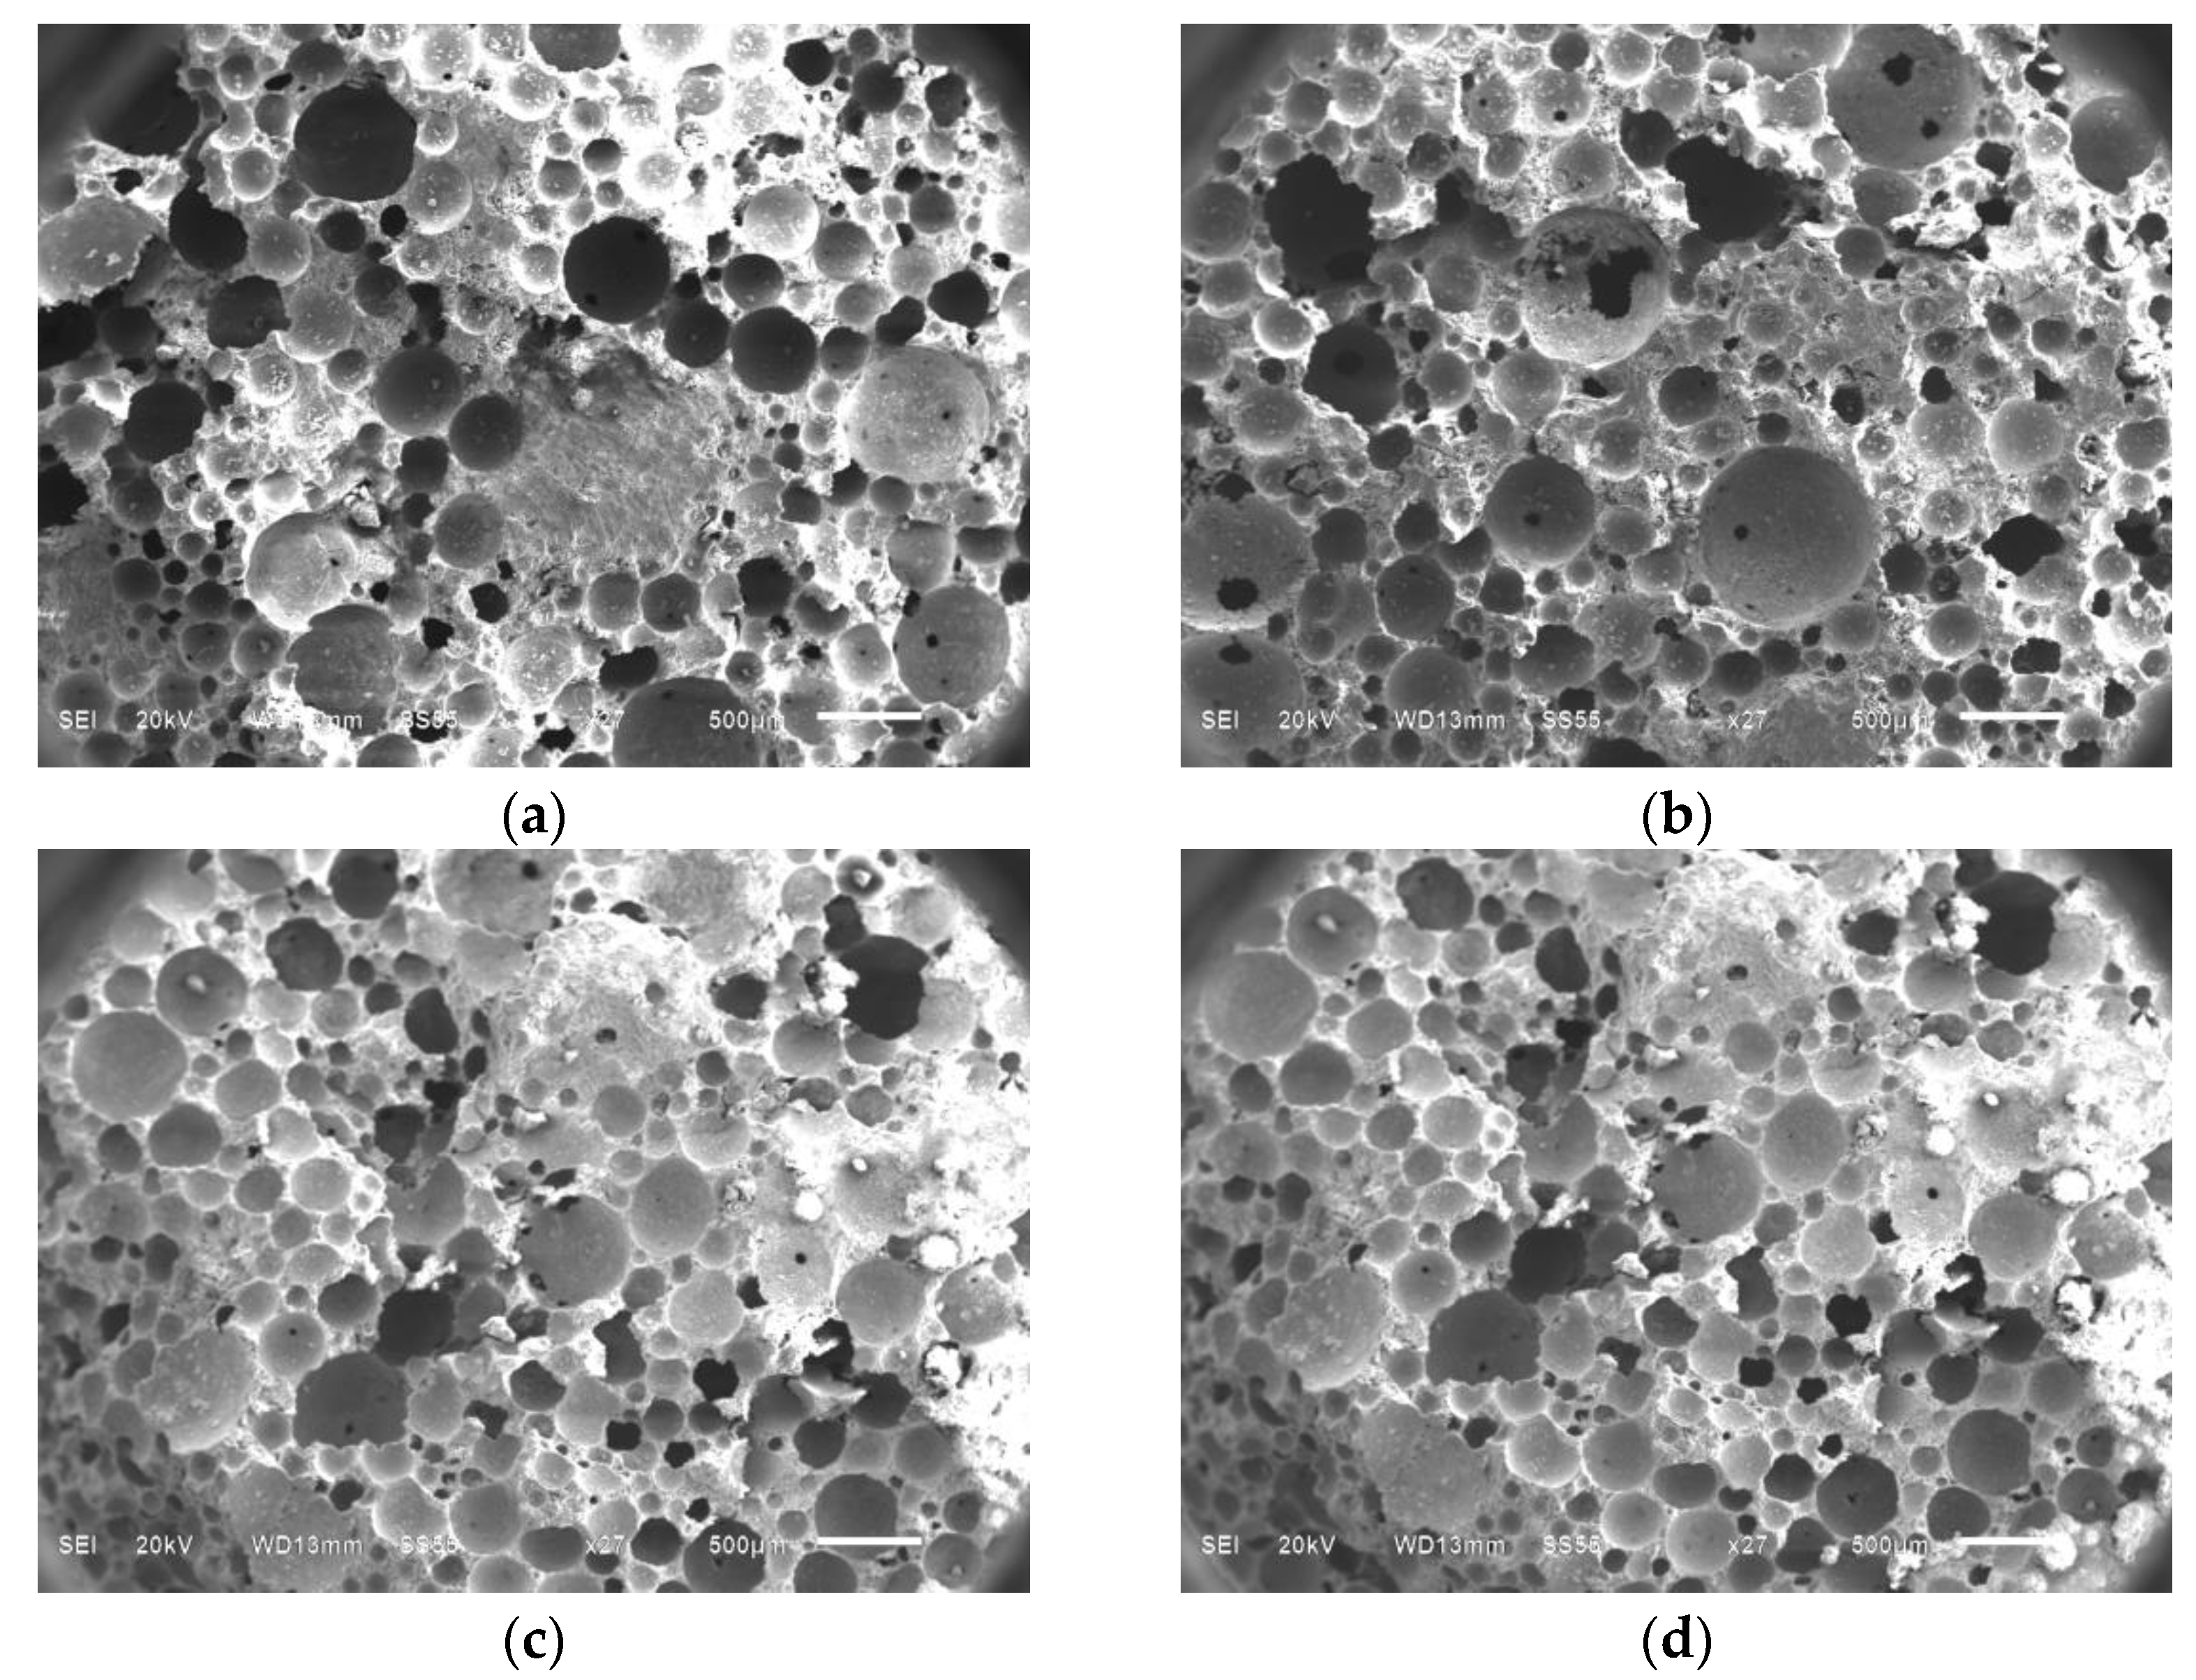
After the compressive strength test, large fragments of fractured bodies were selected and cut into slices, each with a length and width of about 5 mm and a thickness of about 2 mm. Then, the slices were fixed on the observation platform with double-sided tape for further observations. The JSM-6490LV scanning electron microscope (JEOL, Beijing, China) was used to perform the microscopic morphology study. The typical SEM images of FC at different curing times are shown in Figure 6.

3.4. Calculation of Fractal Dimension of FC

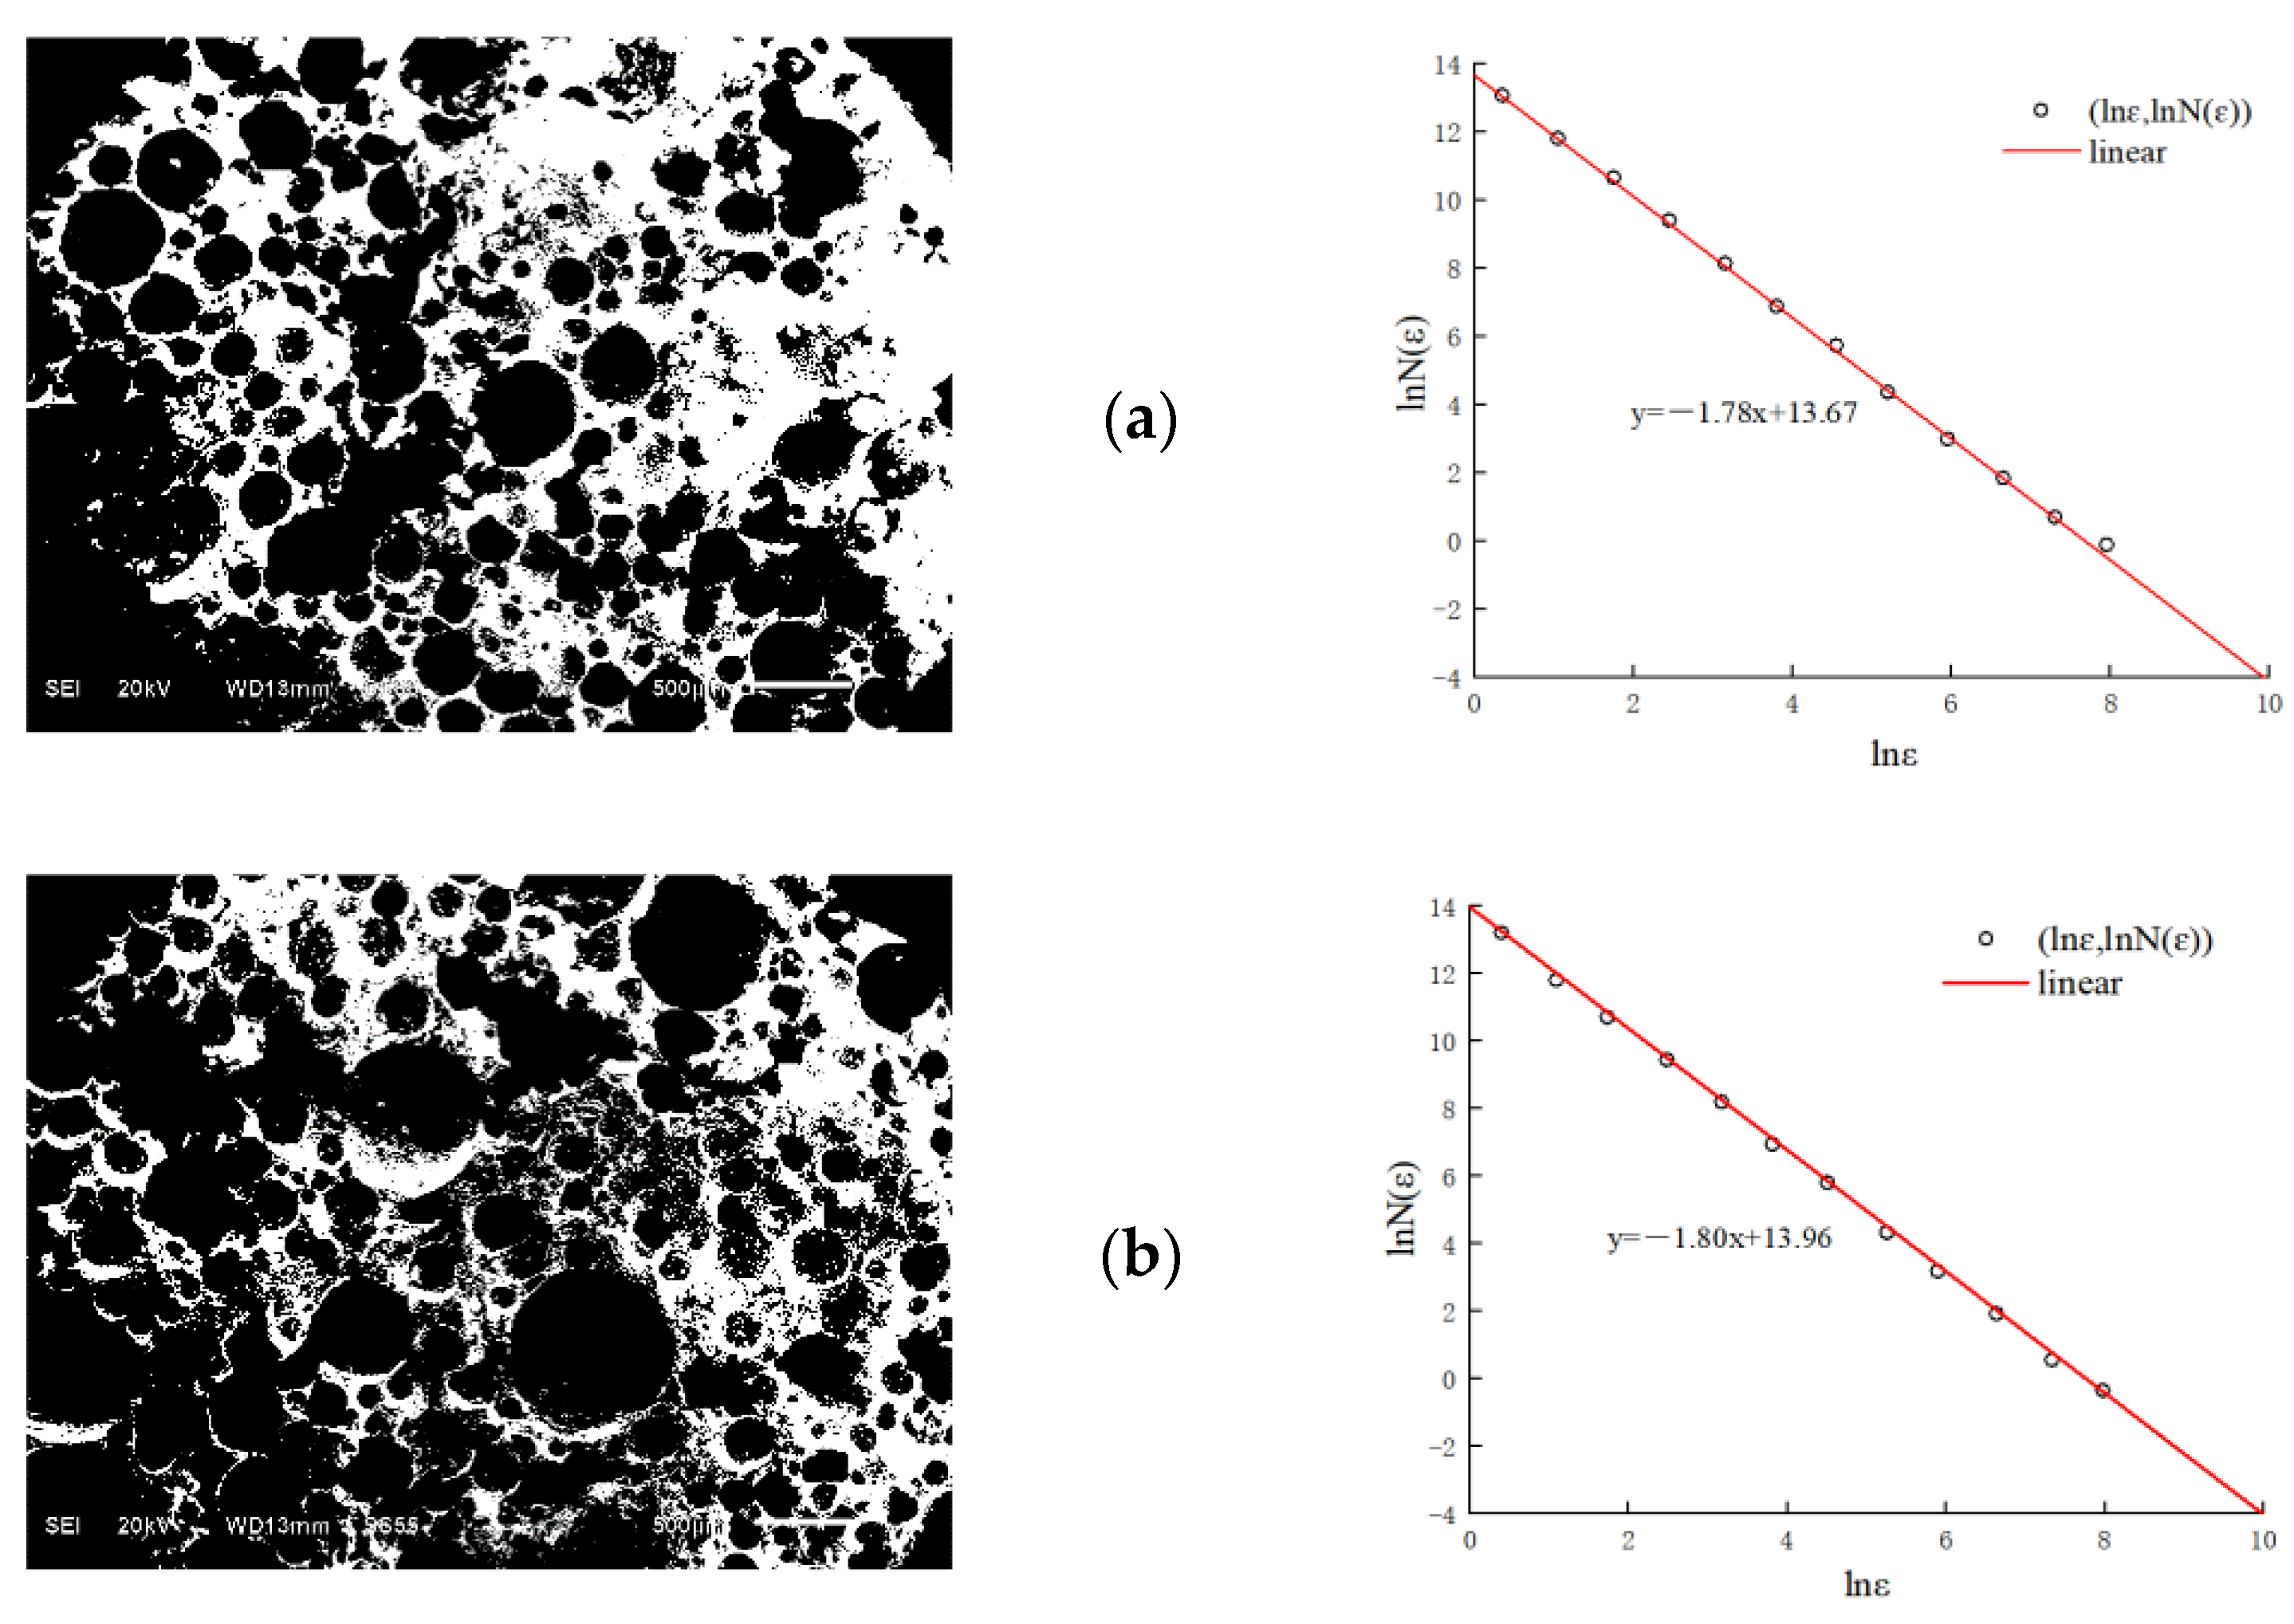
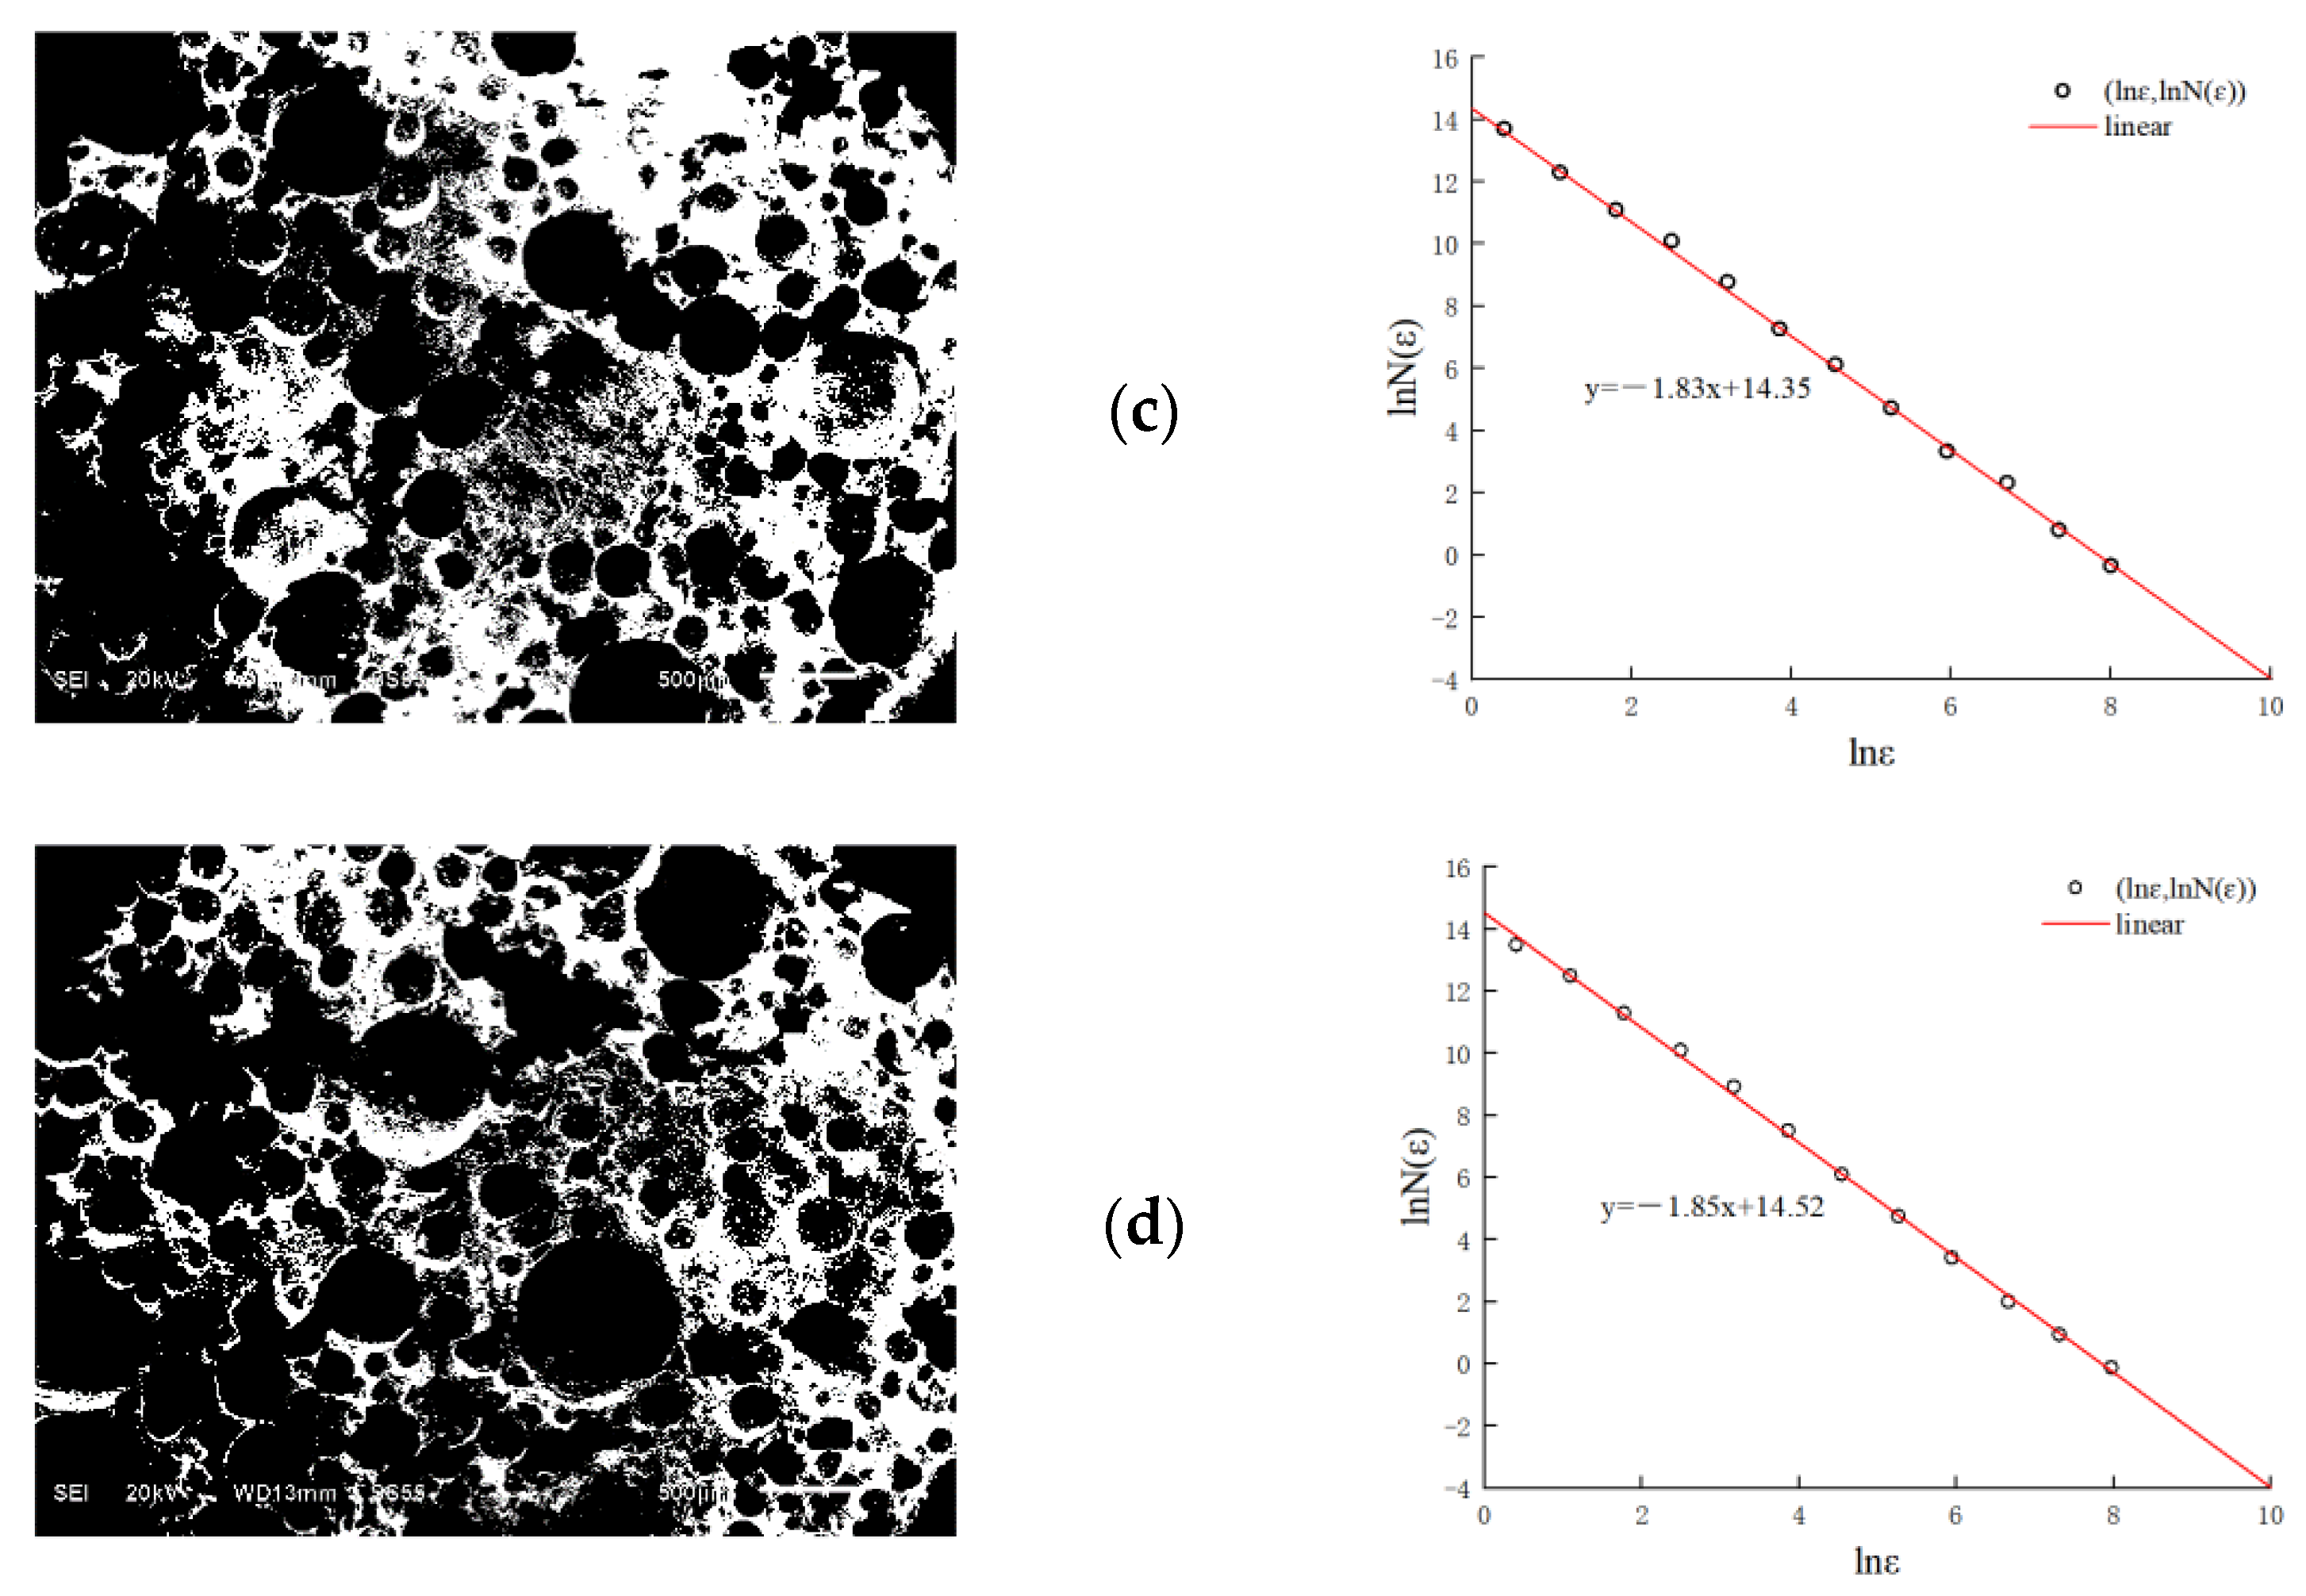
Due to its simplicity, ease of use, and relatively high accuracy, the box-counting method is often used to calculate the fractal dimension of complex surfaces. Therefore, this paper used the box-counting method to analyze the SEM image, and used MATLAB software (9.0.0321247) to calculate the box-counting dimension D of the SEM image. Hao et al. [39] selected binarized images with a grayscale threshold of 0.3647 to 0.5608, and found that a grayscale threshold of 0.4353 is better for thresholding and has a more uniform distribution of black and white. Therefore, the SEM images are converted to a binary image in MATLAB programming, based on a grayscale threshold of 0.4353. The corresponding box count increases as the pixel size of the SEM image decreases. When the box length ε approaches 0, theoretically, the box count N(ε) tends to infinity. Take lnε as the abscissa and lnN(ε) as the ordinate to fit, and the negative value of the slope of lnN(ε)-lnε is the box-counting dimension D of the SEM image [40,41]:
D c = lim ln N ε ln ε
It should be noted that the Dc obtained from the contour line or region in the plane image is not the real surface fractal dimension. The relationship between the surface fractal dimension D and the box-counting dimension Dc is commonly expressed as [42]:
DDc + 1
The left side of Figure 7a shows the binary image obtained by binarizing the SEM image of the FC with a curing age of 7 d, and the right side shows its corresponding lnN(ε)-lnε curve. The red line is the line fitted from the measurement data, and the negative value of its slope is the fractal dimension Dc of the corresponding FC. The left side of Figure 7b shows the binary image obtained after binarization of the SEM image of the FC with a curing age of 14 d. The right side shows its corresponding lnN(ε)-lnε curve. The left side of Figure 7c shows the binarized image obtained by binarizing the SEM image of the FC with a curing age of 28 d. The right side shows its correspondence to the lnN(ε)-lnε curve. The left side of Figure 7d shows the binary image obtained after binarization of the SEM image of the FC with a solidification age of 42 d, and the right side shows its corresponding lnN(ε)-lnε curve. It can be seen that the surface fractal dimension D of FC is about 2.80 (±0.05), suggesting that the curing age has little effect on the fractal dimension.

3.5. Compressive Strength Method

In this experiment, the fractal dimension obtained by the box-counting method was compared with that obtained by the CS method based on the fractal model. According to the relationship between CS and porosity deduced by Balshin [43], the measured values of CS under different porosity values are as follows:
σ f = σ f 0 ( 1 φ ) β
where σf is the CS of the sample, σf0 is the CS of the sample with no foam, φ represents the porosity of the sample, and β refers to an empirical parameter. The relationship between empirical constant β and surface fractal dimension D is given by Chen and Xu [23] as:
β = D 1 3 ( 3 D )
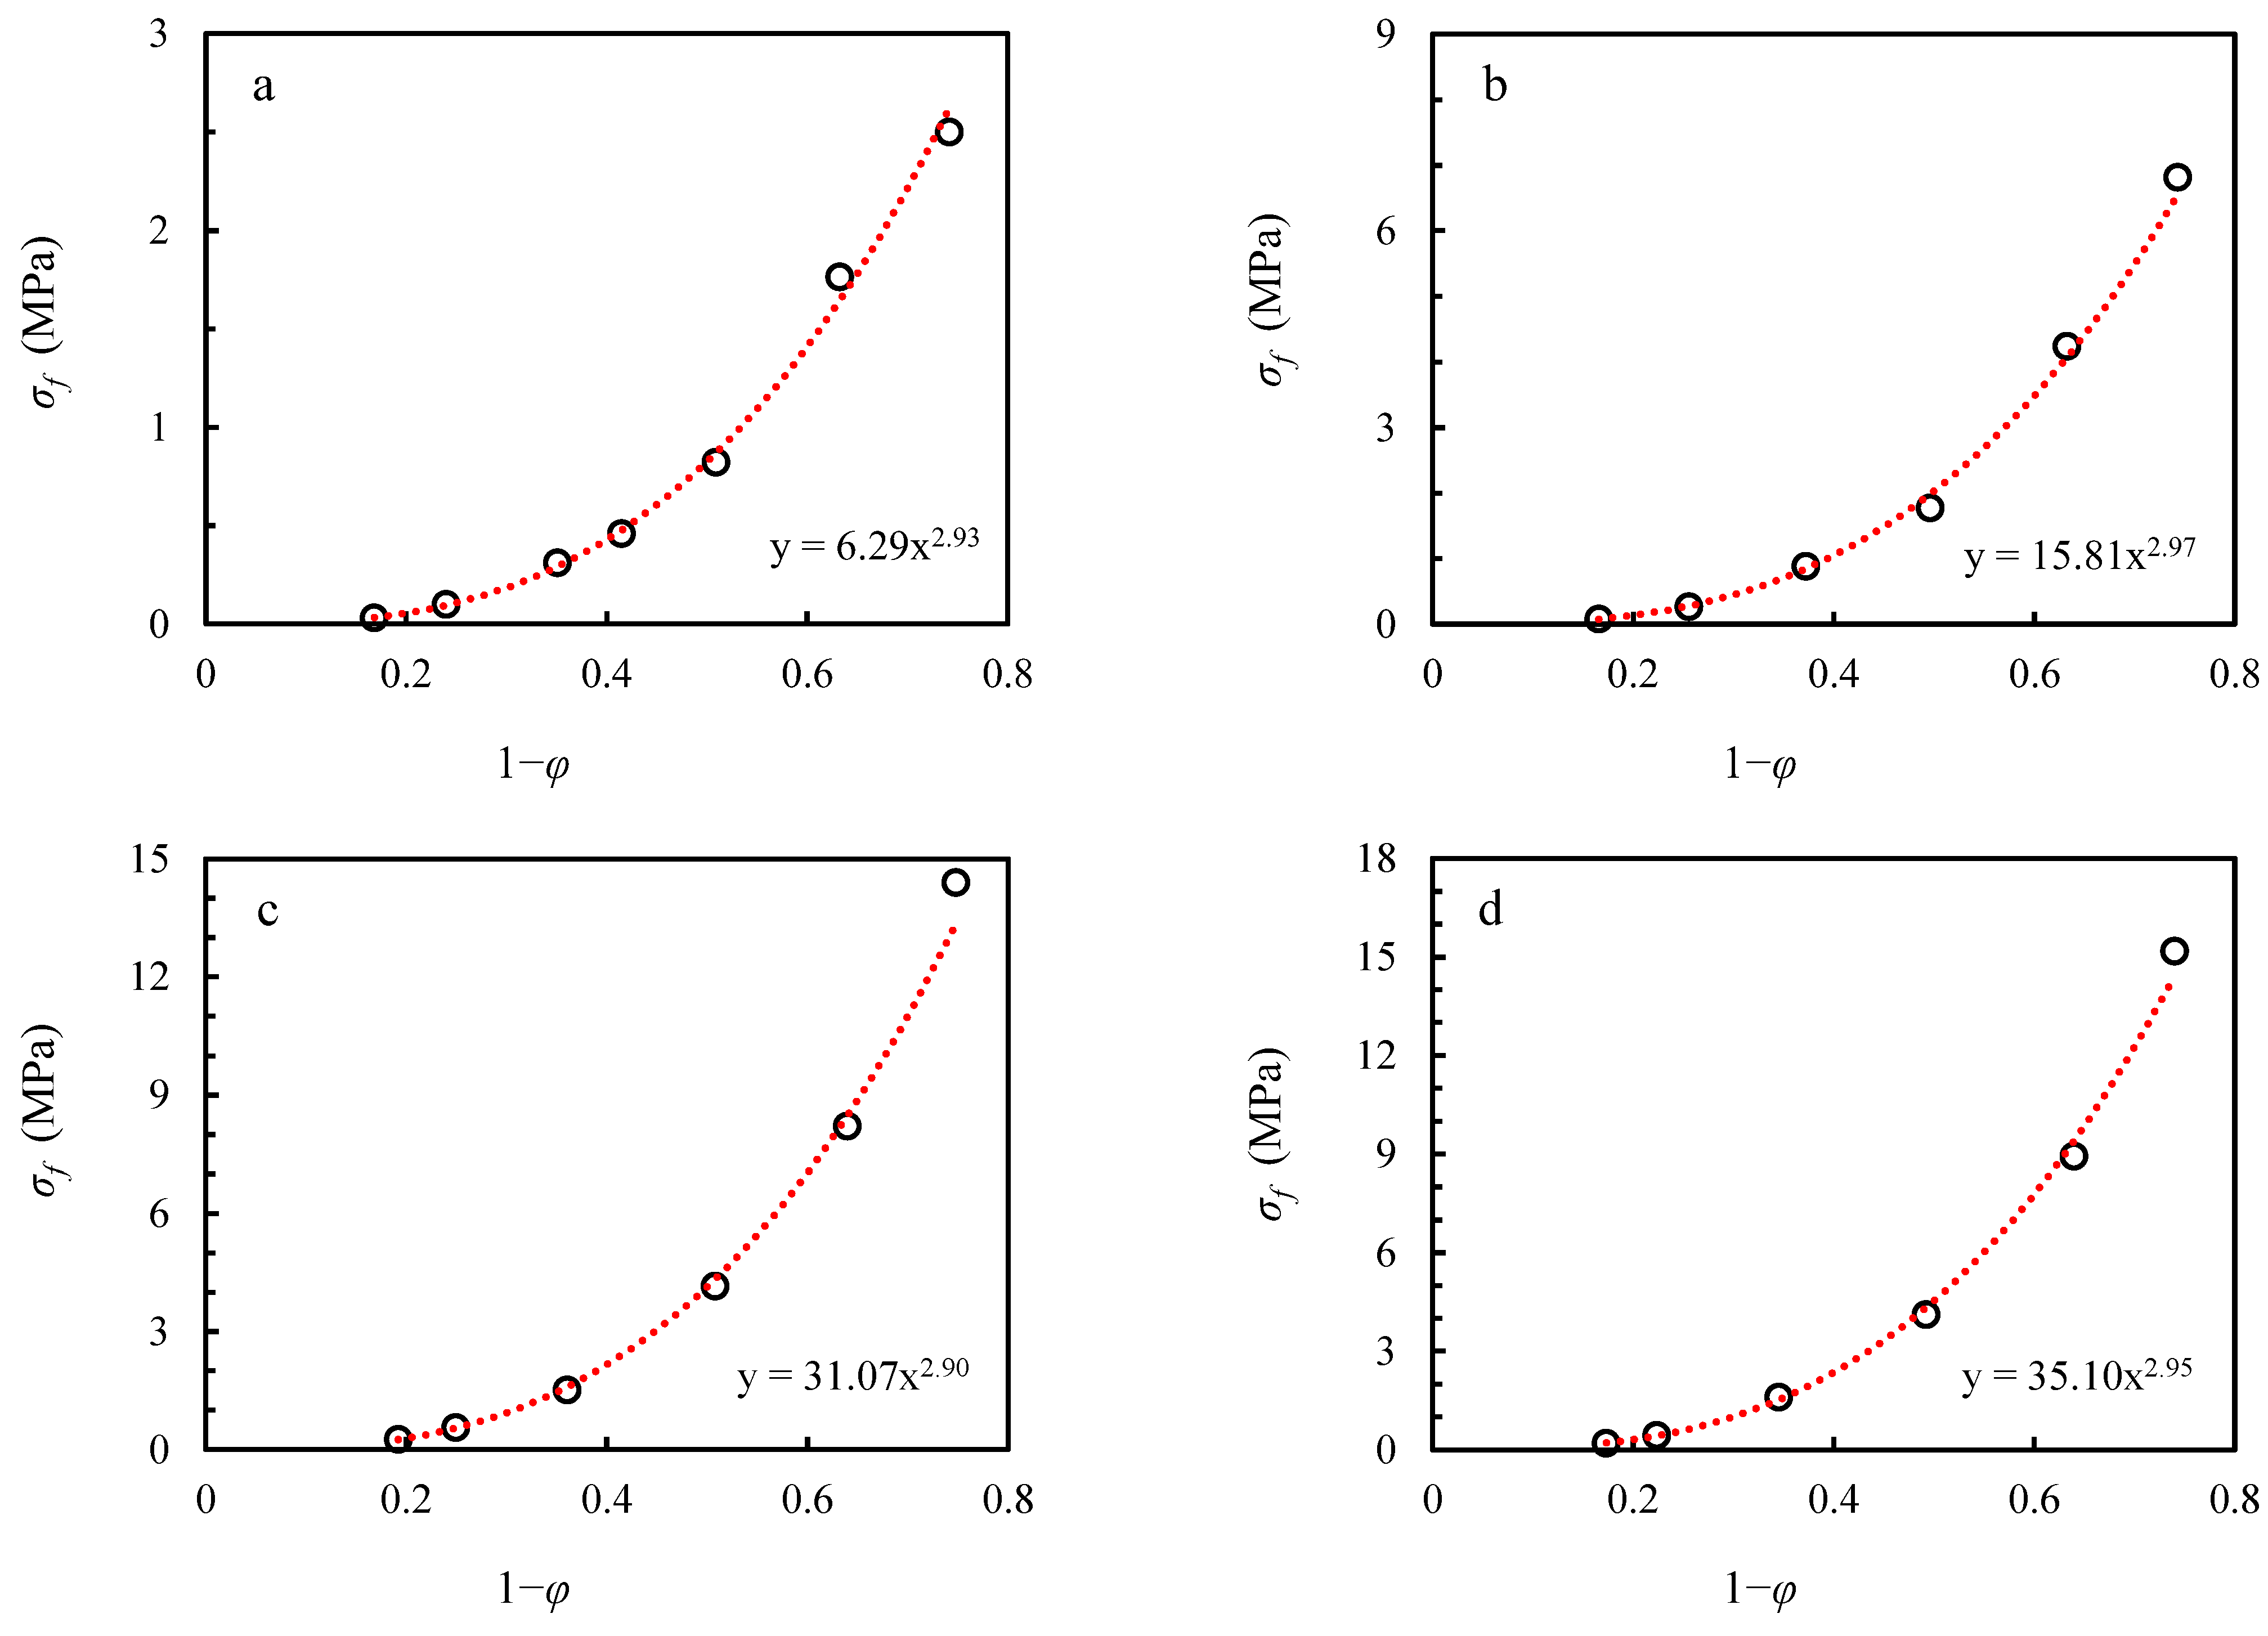
Figure 8 shows the fitting curves between the compression strength and porosity of FC at different ages. It can be seen that the compression strength of all FC samples conforms to the power function relationship in Equation (12), and the surface fractal dimension of FC can be approximately 2.80 according to the exponent β, which is consistent with that obtained by the box-counting method. The results of the two algorithms agree, which also verifies the accuracy of the box-counting method to calculate the fractal dimension and provides accurate values for the next step of the computational model.

3.6. Validation of the Proposed Model

After the D of the FC sample conducted in this study has been calculated, the parameter b can be calculated by using Equation (8). According to the box-counting method and compressive strength test, the surface fractal dimension of FC is 2.80 and, correspondingly, b = 1.33. Combining the relation between the TC of concrete without foaming agent and curing age, the TC of FC at the different curing ages can be expressed as:
κ = (−0.18lnt + 0.95)(1 − φ)1.33
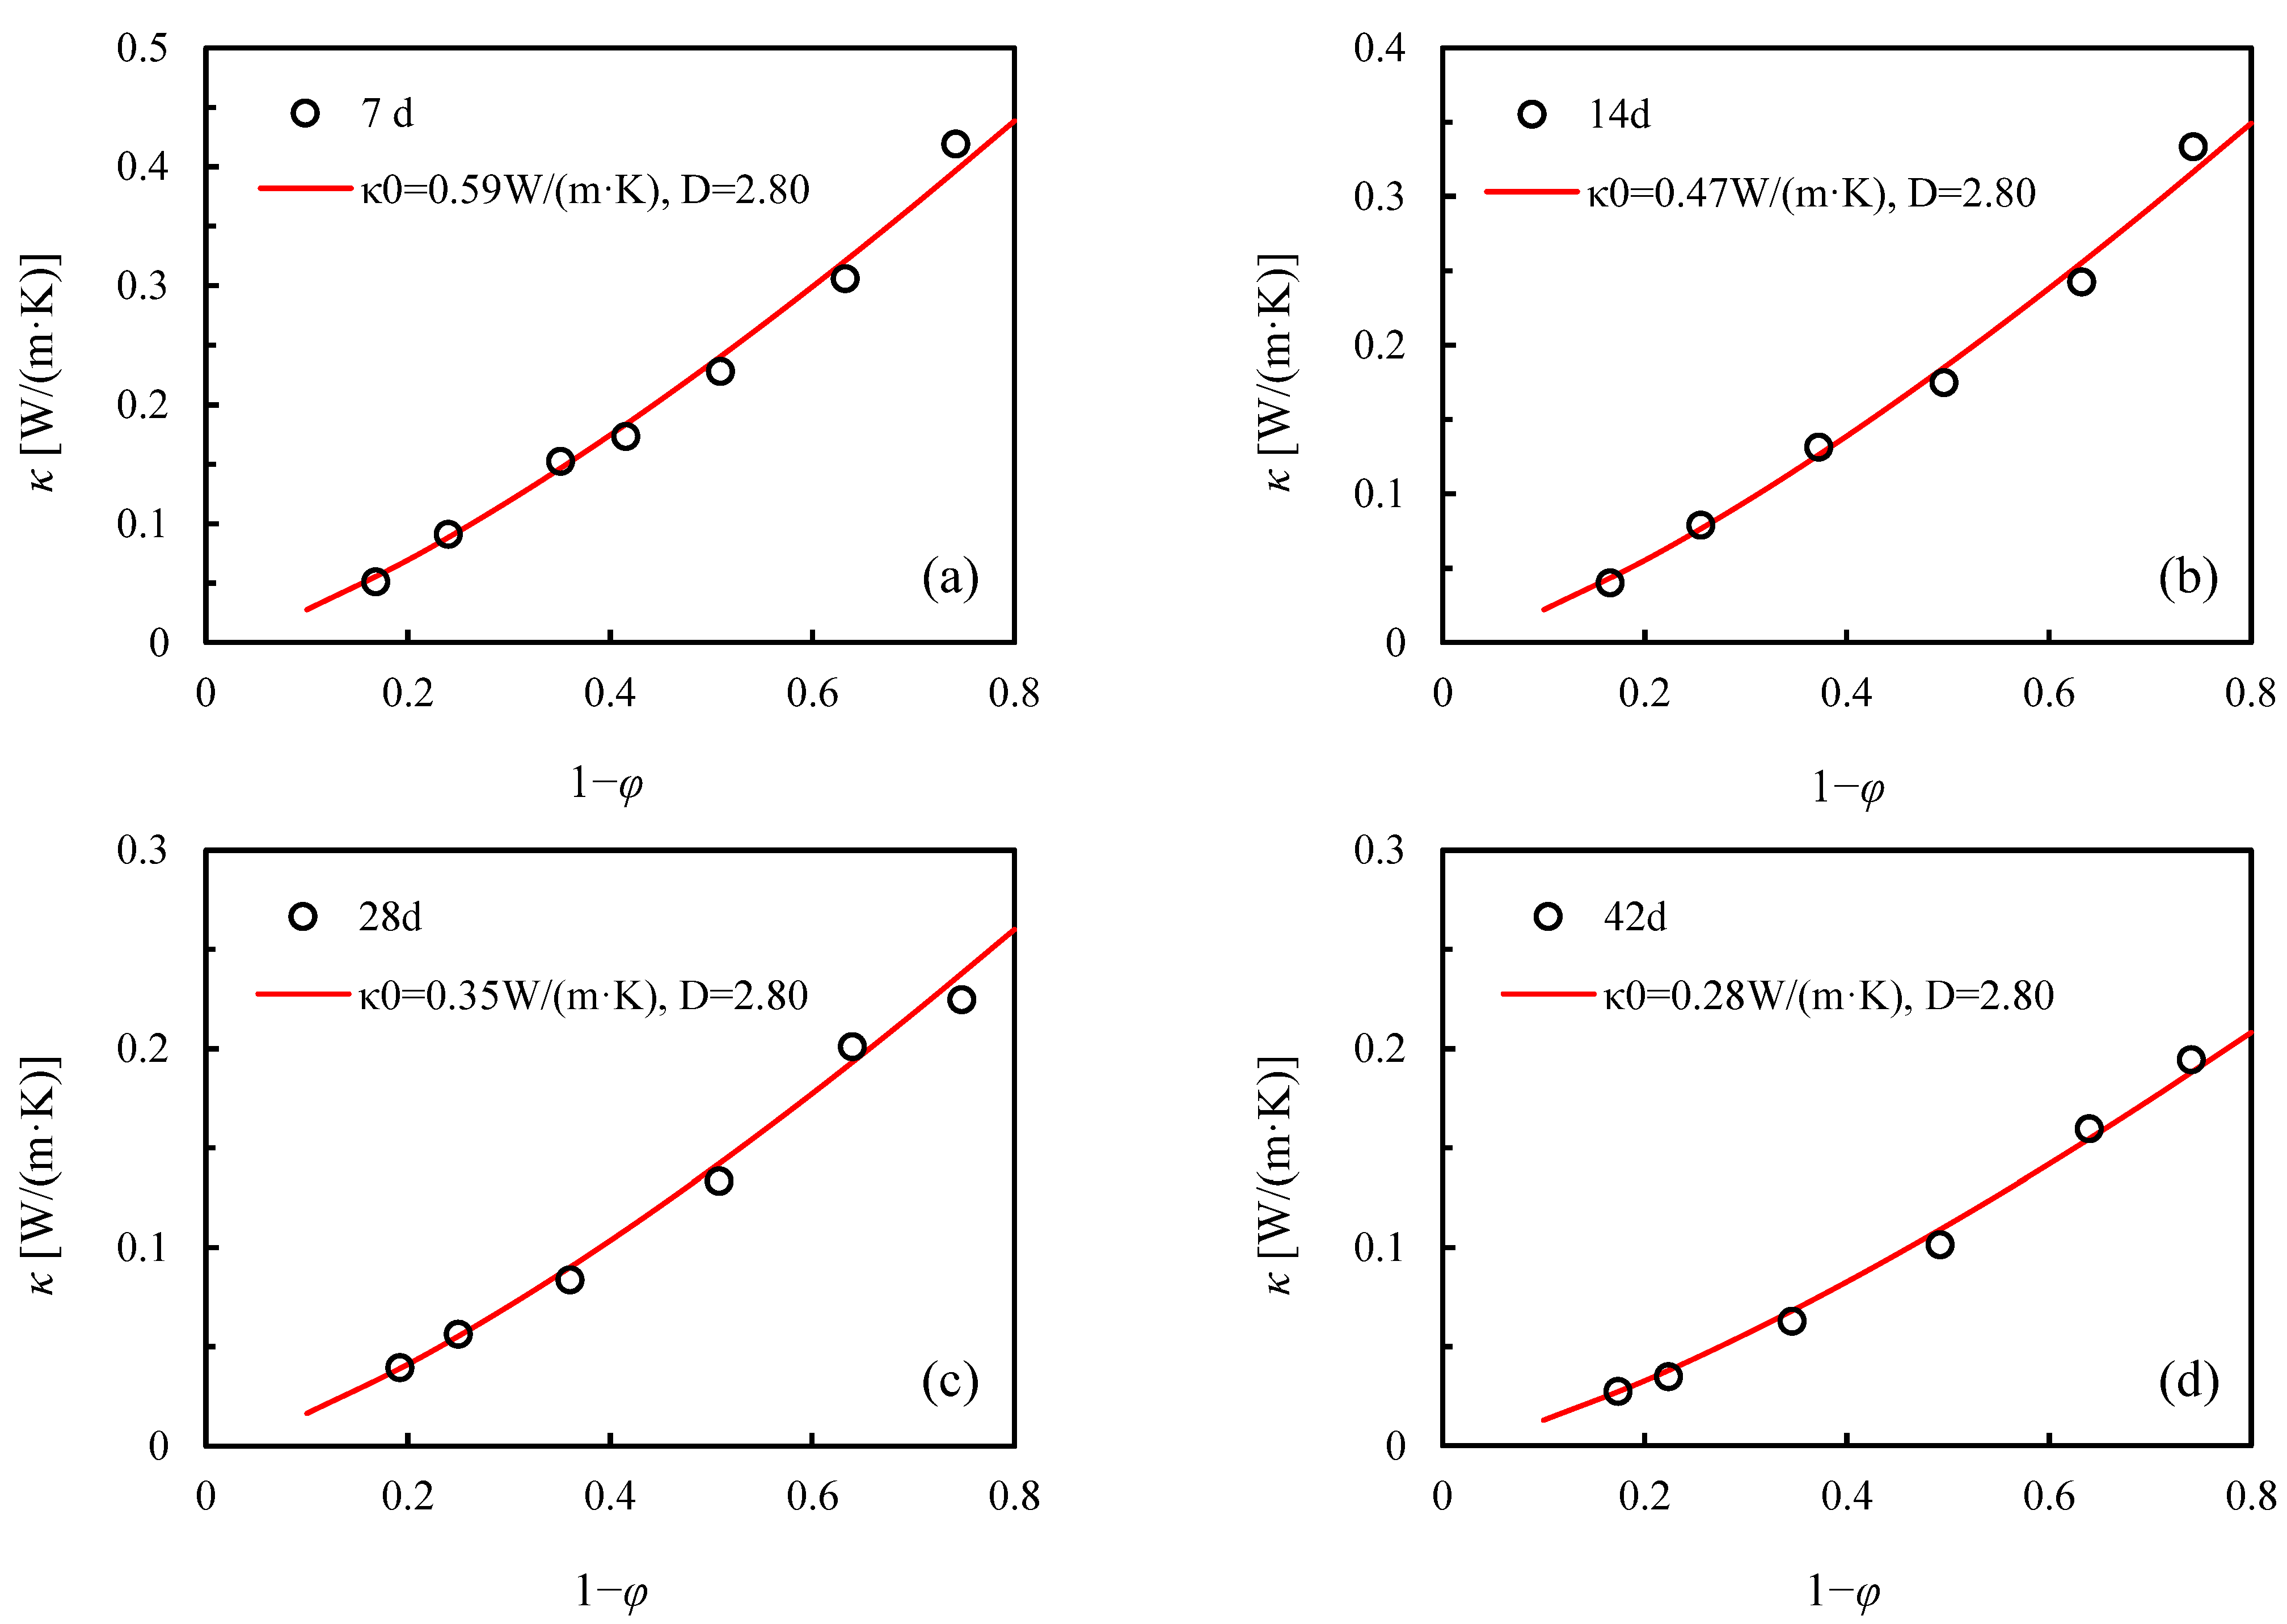
Figure 9 shows the comparison between the calculated values of TC and the experimental data in this paper. It is seen that the estimated values match well with the tested data for FC at the curing age of 7 d, 14 d, 28 d, and 42 d, respectively. The data fit well, which indicates the feasibility of the formula and that it is good, simple, and accurate. The TC of FC at different ages can also fit the prediction curve well, indicating that this formula can adapt to the age changes and make accurate predictions, which has practical significance.
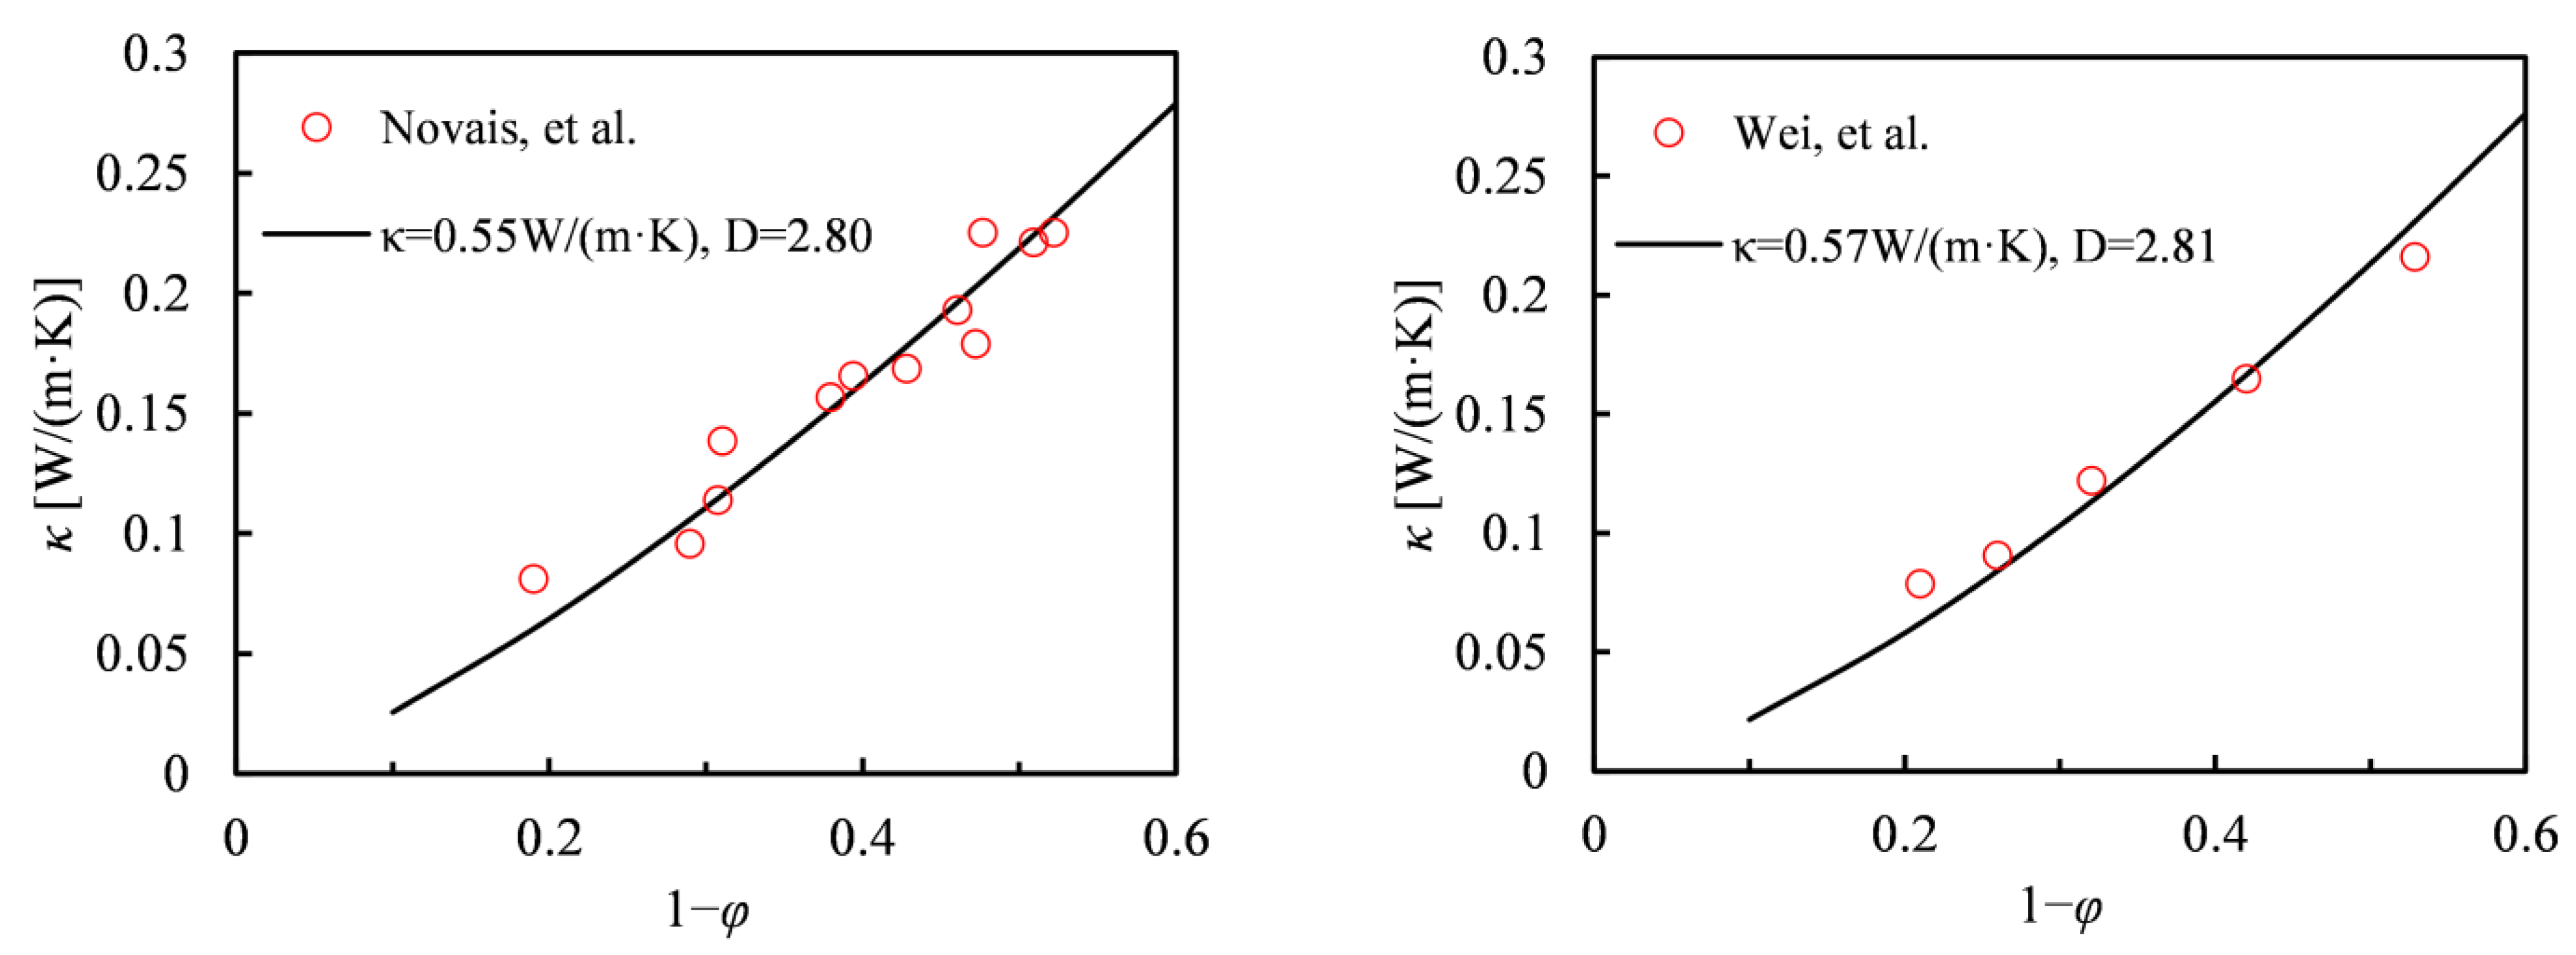
To study the feasibility of the proposed relationship (Equation (14)), the calculated TC is also compared with its measured value in the literature [36,38], as shown in Figure 10. It can be concluded that the latter value is in good agreement with the measured value in the other literature, and that the relationship between TC and porosity is robust and reliable. Furthermore, it can accurately predict the TC according to the porosity of the FC.

4. Conclusions

(1) Based on the constituent structure of the foamed concrete, a fractal relation between the thermal conductivity and porosity has been estimated. This proposed method is superior to empirical models since it utilizes only two measurable parameters, i.e., the fractal dimension and the TC of FC with φ = 0.
(2) The fractal dimensions of FC determined by the box-counting method were essentially the same as those determined using the compressive strength method, suggesting that the CS method offered a good method to measure the fractal dimension, since it was easy to operate in construction engineering.
(3) In order to verify the reliability of the proposed TC model, the variation of TC with age under natural curing conditions was tested and it was found that the TC decreased logarithmically with curing age as the water content is gradually lost. The TC of foamed concrete was estimated by using the TC model and measured fractal dimension, and the estimated values were basically consistent with the experimental value. The results show that the fractal model can predict the TC of FC simply and accurately. The model provides a simple and accurate calculation method for calculating the TC of FC.

Author Contributions

Conceptualization, methodology, validation, formal analysis, funding acquisition, writing—review and editing, G.X.; investigation, validation, data curation, writing—original draft preparation, H.L.; software, resources, visualization, supervision, validation, Y.Z.; validation, project administration, Z.H. All authors have read and agreed to the published version of the manuscript.

Funding

This study is supported by the National Natural Science Foundation of China (41702311) and the Anhui Provincial Natural Science Foundation of China (2208085MD98, 2108085QD168).

Data Availability Statement

Not applicable.

Conflicts of Interest

The authors declare no conflict of interest.

References

  1. Raj, A.; Sathyan, D.; Mini, K.M. Physical and functional characteristics of foam concrete: A review. Constr. Build. Mater. 2019, 221, 787–799. [Google Scholar] [CrossRef]
  2. Shang, X.; Qu, N.; Li, J. Development and functional characteristics of novel foam concrete. Constr. Build. Mater. 2022, 324, 126666. [Google Scholar] [CrossRef]
  3. Nambiar, E.K.K.; Ramamurthy, K. Air-void characterisation of foam concrete. Cem. Concr. Res. 2007, 37, 221–230. [Google Scholar] [CrossRef]
  4. Ranjani, I.S.; Ramamurthy, K. Relative assessment of density and stability of foam produced with four synthetic surfactants. Mater. Struct. 2010, 43, 1317–1325. [Google Scholar] [CrossRef]
  5. Fu, Y.; Wang, X.; Wang, L.; Li, Y. Foam concrete: A state-of-the-art and state-of-the-practice review. Adv. Mater. Sci. Eng. 2020, 2020, 6153602. [Google Scholar] [CrossRef] [Green Version]
  6. Raj, B.; Sathyan, S.; Madhavan, M.K.; Raj, A. Mechanical and durability properties of hybrid fiber reinforced foam concrete. Constr. Build. Mater. 2020, 245, 118373. [Google Scholar] [CrossRef]
  7. Babu, K.G.; Babu, D.S. Behaviour of lightweight expanded polystyrene concrete containing silica fume. Cem. Concr. Res. 2003, 33, 755–762. [Google Scholar] [CrossRef]
  8. Pei, W.; Zhang, M.; Lai, Y.; Yan, Z.; Li, S. Evaluation of the ground heat control capacity of a novel air-L-shaped TPCT-ground (ALTG) cooling system in cold regions. Energy 2019, 179, 655–668. [Google Scholar] [CrossRef]
  9. Zhang, M.; Zhang, X.; Li, S.; Wu, D.; Pei, W.; Lai, Y. Evaluating the cooling performance of crushed-rock interlayer embankments with unperforated and perforated ventilation ducts in permafrost regions. Energy 2015, 93, 874–881. [Google Scholar] [CrossRef]
  10. Li, S.; Wang, C.; Shi, L.; Yin, N. Statistical characteristics of the thermal conductivity of frozen clay at different water contents. Results Phys. 2019, 13, 102179. [Google Scholar] [CrossRef]
  11. Li, T.; Huang, F.; Zhu, J.; Tang, J.; Liu, J. Effect of foaming gas and cement type on the thermal conductivity of foamed concrete. Constr. Build. Mater. 2020, 231, 117197. [Google Scholar] [CrossRef]
  12. Zhang, X.; Yang, Q.; Shi, Y.; Zheng, G.; Li, Q.; Chen, H.; Cheng, X. Effects of different control methods on the mechanical and thermal properties of ultra-light foamed concrete. Constr. Build. Mater. 2020, 262, 120082. [Google Scholar] [CrossRef]
  13. Jhatial, A.A.; Goh, W.I.; Mohamad, N.; Rind, T.A.; Sandhu, A.R. Development of thermal insulating lightweight foamed concrete reinforced with polypropylene fibers. Arab. J. Sci. Eng. 2020, 45, 4067–4076. [Google Scholar] [CrossRef]
  14. Bi, J.; Chen, W.; Zhang, J.; Zhang, Y.; Fan, W.; Jia, B. A modified calculation model for the saturation-dependent thermal conductivity of fine-textured soils. Results Phys. 2019, 15, 102673. [Google Scholar] [CrossRef]
  15. Zhang, M.; Bi, J.; Chen, W.; Zhang, X.; Lu, J. Evaluation of calculation models for the thermal conductivity of soils. Int. Commun. Heat. Mass. 2018, 94, 14–23. [Google Scholar] [CrossRef]
  16. Miled, K.; Limam, O. Effective thermal conductivity of foam coconcreteHomogenization schemes vs experimental data and FEM simulations. Mech. Res. Commun. 2016, 76, 96–100. [Google Scholar] [CrossRef]
  17. Yuan, H.; Ge, Z.; Sun, R.; Xu, X.; Lu, Y.; Ling, Y.; Zhang, H. Drying shrinkage, durability, and microstructure of foamed concrete containing high-volume lime mud-fly ash. Constr. Build. Mater. 2022, 327, 126990. [Google Scholar] [CrossRef]
  18. Kim, J.S.; Chung, S.Y.; Han, T.S.; Stephan, D.; Elrahman, M.A. Mohamed, Correlation between microstructural characteristics from micro-CT of foamed concrete and mechanical behaviors evaluated by experiments and simulations. Cement Concr. Comp. 2020, 112, 103657. [Google Scholar] [CrossRef]
  19. Gancel, O.; Bilir, T.; Bademler, Z.; Ozbakkaloglu, T. A detailed review on foam concrete composites: Ingredients, properties, and microstructure. Appl. Sci. 2022, 12, 5752. [Google Scholar] [CrossRef]
  20. Demir, I.; Sevim, O.; Ozel, G.; Dogan, O. Microstructural, physical, and mechanical properties of aerated concrete containing fly ash under high temperature and pressure. Rev. Rom. Mater. 2020, 50, 240–249. [Google Scholar]
  21. Fu, J.; Yu, Y. Experimental study on pore characteristics and fractal dimension calculation of pore structure of aerated concrete block. Adv. Civil Eng. 2019, 2019, 8043248. [Google Scholar] [CrossRef] [Green Version]
  22. Lü, Q.; Qiu, Q.; Zheng, J.; Wang, J.; Zeng, Q. Fractal dimension of concrete incorporating silica fume and its correlations to pore structure, strength and permeability. Constr. Build. Mater. 2019, 228, 116986. [Google Scholar] [CrossRef]
  23. Chen, Y.; Xu, Y. Compressive strength of fractal textured foamed concrete. Fractals 2019, 27, 1940003. [Google Scholar] [CrossRef] [Green Version]
  24. Yu, B. Analysis of Flow in Fractal Porous Media. Appl. Mech. Rev. 2008, 61, 050801. [Google Scholar] [CrossRef]
  25. Shen, Y.; Xu, P.; Qiu, S.; Rao, B.; Yu, B. A generalized thermal conductivity model for unsaturated porous media with fractal geometry. Int. J. Heat. Mass. Transf. 2020, 152, 119540. [Google Scholar] [CrossRef]
  26. Feng, Y.; Yu, B.; Zou, M.; Zhang, D. A Generalized Model for the Effective Thermal Conductivity of Unsaturated Porous Media Based on Self-Similarity. J. Porous. Media 2007, 10, 551–568. [Google Scholar] [CrossRef]
  27. Coórdoba, O.; Arias-Zugasti, M. Accurate and efficient calculation of multicomponent thermal diffusion coefficients and partial thermal conductivity based on kinetic theory. Combust. Flame 2022, 244, 112202. [Google Scholar] [CrossRef]
  28. Li, W.; Jiang, Y.; Liu, H.; Wang, C.; He, X.; He, F.; Li, M. Mullite fibers/whiskers hierarchical porous materials: Experimental characterization and fractal model to predict thermal conductivity. Ceram. Int. 2023, 49, 13657–13665. [Google Scholar] [CrossRef]
  29. Zhao, Z.; Feng, K.M.; Feng, Y.J. Theoretical calculation and analysis modeling for the effective thermal conductivity of Li4SiO4 pebble bed. Fusion Eng. Des. 2010, 85, 1975–1980. [Google Scholar] [CrossRef]
  30. Dubil, K.; Wolf, H.; Wetzel, T.; Dietrich, B. Development of a generalized thermal resistance model for the calculation of effective thermal conductivities in periodic open cellular structures (POCS). Int. J. Heat. Mass. Transf. 2022, 183, 122083. [Google Scholar] [CrossRef]
  31. Yuan, F.; He, Y.; Li, M.; Li, X. Study on the theoretical calculation method for the effective thermal conductivity of carbon nanotube composite molten salt for solar energy application. Sol. Energy Mat. Sol. C 2022, 238, 111631. [Google Scholar] [CrossRef]
  32. Krone, R.B. A Study of Rheologic Properties of Estuarial Sediments; Hydraulic Engineering Laboratory and Sanitary Engineering Research Laboratory, University of California: Berkeley, CA, USA, 1963. [Google Scholar]
  33. Xu, Y.; Jiang, H.; Chu, F.; Liu, C. Fractal model for surface erosion of cohesive sediments. Fractals 2014, 22, 1440006. [Google Scholar] [CrossRef]
  34. Son, M.; Hsu, T.J. The effect of variable yield strength and variable fractal dimension on flocculation of cohesive sediment. Water Res. 2009, 43, 3582–3592. [Google Scholar] [CrossRef]
  35. GB/T 32064-2015; Determination of Thermal Conductivity and Thermal Diffusivity of Building Matertials: Transient Plane Heat Sourse Method. State Administration for Market Regulation: Beijing, China, 2015.
  36. Novais, R.M.; Ascensão, G.; Buruberri, L.H.; Senff, L.; Labrincha, J.A. Influence of blowing agent on the fresh-and hardened-state properties of lightweight geopolymers. Mater. Des. 2016, 108, 551–559. [Google Scholar] [CrossRef]
  37. Wei, S.; Chen, Y.; Zhang, Y.; Jones, M.R. Characterization and simulation of microstructure and thermal properties of foamed concrete. Constr. Build. Mater. 2013, 47, 1278–1291. [Google Scholar] [CrossRef]
  38. Yang, K.H.; Lee, K.H.; Song, J.; Gong, M.H. Properties and sustainability of alkali-activated slag foamed concrete. J. Clean. Prod. 2014, 68, 226–233. [Google Scholar] [CrossRef]
  39. Hao, K.; Li, Y.; Zhang, N. Application of fractal dimension to activated sludge SEM images in MATLAB environment. Environ. Sci. Tec. 2020, 43, 22–27. (In Chinese) [Google Scholar]
  40. Buczkowski, S.; Kyriacos, S.; Nekka, F.; Cartilier, L. The modified box-counting method: Analysis of some characteristic parameters. Pattern Recogn. 1998, 31, 411–418. [Google Scholar] [CrossRef]
  41. Liebovitch, L.S.; Toth, T. A fast algorithm to determine fractal dimensions by box counting. Phys. Lett. A 1989, 141, 386–390. [Google Scholar] [CrossRef]
  42. Shibuichi, S.; Onda, T.; Satoh, N.; Tsujii, K. Super water-repellent surfaces resulting from fractal structure. J. Phys. Chem. 1996, 100, 19512–19517. [Google Scholar] [CrossRef]
  43. Balshin, M.Y. Relation of mechanical properties of powder metals and their porosity and ultimate properties of porous metal-ceramic materials. Dokl. Akad. Nauk. 1949, 6, 831–834. [Google Scholar]
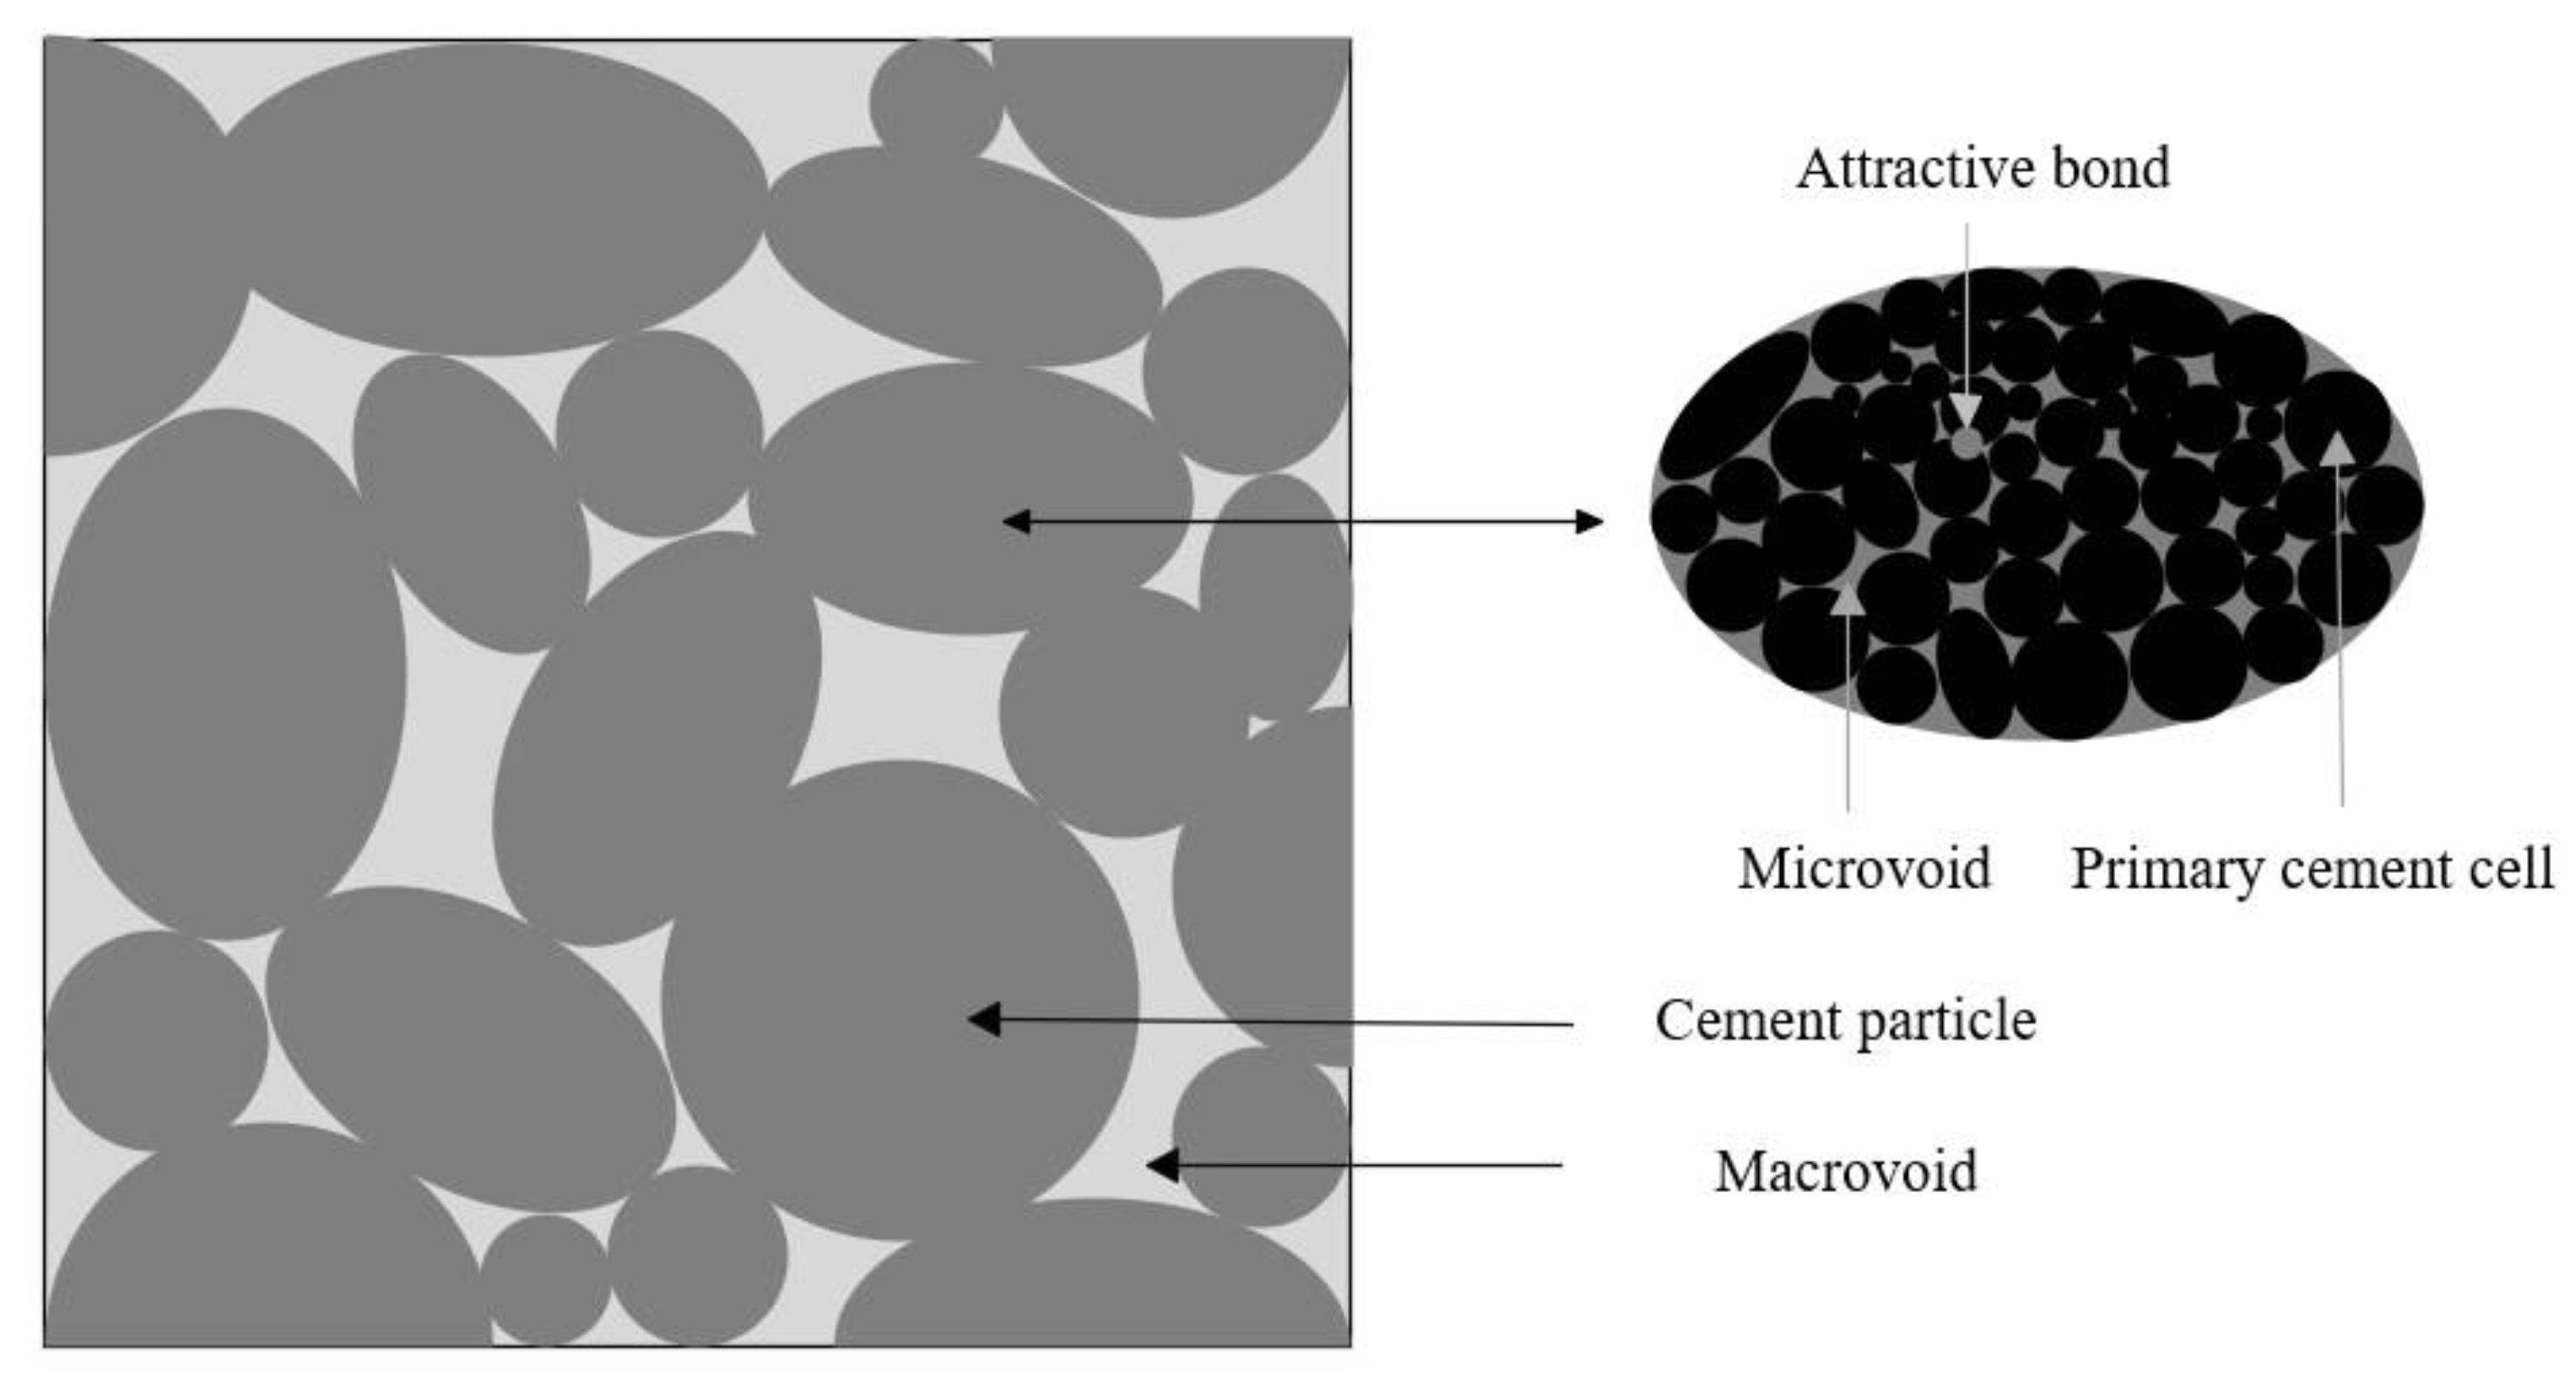
Figure 1. Composition diagram of concrete blocks.
Fractalfract 07 00475 g001
Figure 2. Measurement of Thermal Conductivity: (a) TC3000E Thermal Conductivity Meter and (b) specimen installation.
Fractalfract 07 00475 g002
Figure 3. Relationship between the TC of FC and curing age.
Fractalfract 07 00475 g003
Figure 4. Relationship between the TC of concrete without foaming agent and curing age.
Fractalfract 07 00475 g004
Figure 5. Relationship between the compressive strength of FC and curing age.
Fractalfract 07 00475 g005
Figure 6. Typical micromorphology of fracture surfaces of FC with different curing ages: (a) 7 d, (b) 14 d, (c) 28 d, and (d) 42 d.
Fractalfract 07 00475 g006
Figure 7. Fractal dimension of FC obtained by scanning electron microscope image box counting analysis corresponding to different curing ages. (a) 7 d, (b) 14 d, (c) 28 d, and (d) 42 d.
Fractalfract 07 00475 g007aFractalfract 07 00475 g007b
Figure 8. Relationship between porosity and compressive strength of FC at ages of (a) 7 d, (b) 14 d, (c) 28 d, and (d) 42 d.
Fractalfract 07 00475 g008
Figure 9. Comparisons between predictions and tested TC of FC at age of (a) 7 d, (b) 14 d, (c) 28 d, and (d) 42 d.
Fractalfract 07 00475 g009
Figure 10. Comparison between calculated and experimental values of TC in different kinds of literature [36,37,38].
Fractalfract 07 00475 g010aFractalfract 07 00475 g010b
Table 1. Chemical compositions of the cementitious material used in the test (%).
CementFly AshOre Powder
SiO221.854.131.12
Al2O34.1525.313.87
Fe2O34.526.9615.38
CaO65.58.7326.61
Na2O0.160.310.43
K2O0.510.130.23
SO31.730.610.33
MgO1.092.078.44
Disclaimer/Publisher’s Note: The statements, opinions and data contained in all publications are solely those of the individual author(s) and contributor(s) and not of MDPI and/or the editor(s). MDPI and/or the editor(s) disclaim responsibility for any injury to people or property resulting from any ideas, methods, instructions or products referred to in the content.