Article

Analysis of Damage Characteristics for Skarn Subjected to Freeze-Thaw Cycles Based on Fractal Theory

1
School of Resources and Safety Engineering, Central South University, Changsha 410083, China
2
Research Center for Mining Engineering and Technology in Cold Regions, Central South University, Changsha 410083, China
3
School of Geology and Mining Engineering, Xinjiang University, Urumqi 830046, China
*
Author to whom correspondence should be addressed.
Fractal Fract. 2023, 7(5), 354; https://doi.org/10.3390/fractalfract7050354
Submission received: 17 March 2023 / Revised: 20 April 2023 / Accepted: 24 April 2023 / Published: 27 April 2023
(This article belongs to the Special Issue Fractal Analysis and Its Applications in Geophysical Science)

Abstract

:
A large number of rock works in cold areas suffer from long-term freeze-thaw damage, and it seriously affects the stability of mine slopes. In this paper, the XRD component measurement, P-wave velocity, freeze-thaw cycling test at different times, uniaxial compression test, and scanning electron microscope (SEM) test were carried out to obtain the mechanical properties and microstructure evolution of skarn under the effect of freeze-thaw cycles. The results of the study indicate that with an increase in the number of freeze-thaw cycles, the mass of the rock gradually increases and the P-wave velocity, uniaxial compressive strength, elastic modulus, and Poisson’s ratio all decrease. Based on the SEM image of the rock after crushing, fine pores and fissures gradually developed, expanded, and penetrated each other under the action of freezing and thawing; the inter-particle bonding force decreased; and the cement gradually loosened. The fractal dimension of the specimens under different numbers of freeze-thaw cycles was obtained using the box dimension method, and the degradation of the fine structure of the rock was quantitatively elaborated. By establishing the relationship between the compressive strength of rocks and the fractal dimension, the mechanism of damage to skarn under freeze-thaw action was further investigated. It provides some theoretical basis for the characterization of freeze-thaw damage of rocks in cold regions.

1. Introduction

In cold regions, freeze-thaw cycles caused by diurnal and seasonal temperature variations are one of the main factors in the occurrence of many rock engineering accidents, and these freeze-thaw cycle effects lead to other serious risks such as weathering, deformation, and landslides in cold regions [1]. In recent years, with the continuous growth in demand for mineral resources and the gradual depletion of mineral resources mining in low-altitude plains, the center of gravity of mineral resources development has gradually shifted to high-altitude, cold-area mines in the west, which inevitably requires consideration of the hazards brought about by freeze-thaw damage to mine engineering construction in these high, cold areas, and the slope engineering construction in the process of open-pit mining needs to consider the effect of the freeze-thaw cycle on the stability of the slope [2]. Therefore, it is important to study and analyze the changes in physical and mechanical properties of slope rocks under the action of freeze-thaw cycles, to understand the damage deterioration effect on the slope rocks, and then to evaluate the stability coefficient of the slope rocks under the consideration of freeze-thaw factors to ensure the safe, stable, and efficient mining in cold areas.
The main reason for the deterioration of rock properties caused by freezing and thawing is the phase change of the pore water inside the rock. Nine percent volume expansion occurs after the water freezes into ice, resulting in a large expansion force within the pores and the extension penetration of fractures inside the rock. At present, scholars at home and abroad mainly analyze the damage of rocks under freeze-thaw action from two perspectives: macro-mechanical properties and microstructural damage.
  • Xu et al. [3] conducted freeze-thaw cycling tests on red sandstone and shale and obtained the variation patterns between the number of cycles and the strength and deformation parameters of the rock masses.
  • Inigo A.C. et al. [4] investigated the mechanical properties of Spanish granite under different numbers of freeze-thaw cycles by means of indoor tests using chromatic coordinates and acoustic tests.
  • Long et al. [5] prepared interrupted joint specimens with different joint dips and rock bridge lengths using similar materials, and obtained the deterioration damage characteristics of the various types of specimens and their influence laws on the compressive strength and damage modes.
  • Yamabe et al. [6] conducted a thermal expansion strain test and corresponding rock mechanics experiments within one freeze-thaw cycle on the Sirahama sandstone in Japan and obtained the relationship between the number of cycles and strength and deformation.
  • Kodama J. et al. [7] studied the effect of rock moisture content and temperature on the mechanical properties of frozen rocks and specifically analyzed the extent of the effect.
  • Gao et al. [8] proposed a new segmental intrinsic structure model by examining the stress–strain relationship of sandstone under different numbers of freeze-thaw weathering cycles.
  • Huang et al. [9] studied the pore structure changes and physical and mechanical property deterioration of red sandstone under freeze-thaw cycles and concluded that the growth of large pores may play a dominant role in freeze-thaw damage and strength deterioration.
  • Seyed Zanyar et al. [10] established an empirical equation between the triaxial compressive strength and the number of freeze-thaw cycles for calcareous schist samples from an Angouran open pit by analyzing the test results of triaxial compressive strength under freeze-thaw cycles.
  • On the other hand, Zhang Huimei et al. [11] carried out freeze-thaw cycling tests and CT (computed tomography) scanning tests on red sandstone as the research object. Based on three-dimensional reconstruction, the damage pattern of the red sandstone specimens during freezing and thawing, and the development characteristics of the internal pores, were analyzed.
  • Park et al. [12] used X-ray and CT scan images and electron microscopy to study the changes in the internal fine structure of rocks under the action of freeze-thaw cycles.
  • Feng et al. [13] extracted the microscopic pore structure parameters of sandstone under the freeze-thaw effect based on CT scan tests; the functional relationship between the number of freeze-thaw cycles and the coefficient of freezing and thawing of the pore particles was established.
  • Zhou et al. [14], based on NMR (nuclear magnetic resonance) and impact loading tests of freeze-thaw sandstones, analyzed the microstructural damage and the characteristics of the dynamic mechanical parameters’ evolution of the rocks under freeze-thaw action.
  • Li et al. [15,16] carried out nuclear magnetic resonance tests to study the pore structure evolution of sandstone under freeze-thaw action and analyzed the pore water distribution patterns of the different sizes.
  • Zhang et al. [17] studied the damage deterioration of rock’s mechanical properties and fine structure caused by freeze-thaw cycling action on saturated red sandstone.
  • Javad et al. [18] investigated the damage behavior of Tasmanian sandstone under different numbers of freeze-thaw cycles and explored the damage mechanism of Tasmanian sandstone subjected to various freeze-thaw cycles in UCS (uniaxial compressive strength) and BTS (Brazilian tensile strength) tests.
The evolution of the fine structure of rocks subjected to freeze-thaw cycles is often irregular and random. Therefore, to quantitatively assess the degree of damage deterioration under the freeze-thaw action, it is necessary to evaluate it with the help of fractal theory. Fractal theory was proposed by Mandelbrot in 1983 [19]. As one of the main branches of nonlinear science, it is a very popular mathematical and analytical tool for studying irregular objects and complex structural features [20,21,22]. After decades of development, fractal theory has been widely used in many fields such as rock blasting, mineral mining and processing, and medicine.
  • Zhu et al. [23] conducted a fractal study of rock damage under blasting loads and defined the degree of damage in terms of the fractal dimension to provide a new way to study the damage evolution of rocks under blasting action.
  • Based on fractal theory, Luo et al. [24] studied the distribution characteristics of blasting blockiness in medium-deep holes and obtained a prediction model of blasting blockiness distribution.
  • Liu et al. [25] applied the fractal theory to the various stages of mineral processing and introduced a variety of fractal laws for each process step.
  • Shan et al. [26] investigated the fractality characteristics of oil-rich kerogen destruction under microwave–water interaction and quantitatively described the fracture expansion pattern of the specimen with the help of the fractal dimension.
  • Yu et al. [27] used fractal theory combined with medical images to provide a practical method for describing complex structures and behaviors in living organisms.
  • Li et al. [28] quantified the brain development images of infants and children based on fractal theory. All these fields have achieved more fruitful results due to the intervention of fractal methods. In addition, for rocks, as a natural, porous material, fractal theory provides a new method for the quantitative analysis of their internal pore structure and crack nodularity.
  • M.N. Bagde et al. [29] proposed a better method of rock classification based on the fractal approach.
  • The fractal characterization of the evolution of microstructural features of sandstones under dry and wet cycles was carried out by Zhou et al. [30].
  • Ren et al. [31] explored the fractal characteristics of perforated rock masses based on acoustic emission tests and the fractal dimension.
In summary, scholars have achieved fruitful results in the research and analysis of freeze-thaw rock damage and fractal methods. However, more and more cold-area projects are gradually shifting to the western high-altitude cold area. Therefore, it is still necessary to explore the damage and destruction characteristics of rocks under freeze-thaw conditions. The slope rocks (skarn) of the BeiZhan iron ore mine in Hejing County, Xinjiang province, were selected for indoor freeze-thaw cycle tests. Uniaxial compression tests and SEM (scanning electron microscope) experiments on the rock were carried out, and the evolution of the macroscopic mechanical parameters and fine structure of the rocks with the number of freeze-thaw cycles was obtained. Based on the fractal theory, the mesoscopic fracture damage evolution of the rocks under different freeze-thaw cycles was quantitatively analyzed with the fractal dimension as an index, and the damage deterioration mechanism of rocks in cold regions under freeze-thaw action was further studied. This study is significant for guiding the stable construction of rock engineering in mining areas in cold regions.

2. Methodology

2.1. Experiments

2.1.1. Specimen Preparation

The rock sample used for the test is the slope rock of the BeiZhan iron ore mine, and the lithology is skarn. Skarn is a metamorphic rock, which is mainly composed of silicate minerals. As a common rock type in the mining resource extraction process, skarn is representative of mine rocks and can provide a reliable basis for rock freeze-thaw damage studies in most mines. The rock samples taken are from the same batch and the same rock body, and their surfaces need to be smooth, with high end flatness and no obvious fissures in the macroscope. Referring to the recommended method of the International Society for Rock Mechanics (ISRM) rock mechanics test, the rock samples were processed as cylindrical specimens with a height to diameter ratio of 2:1, with a height of about 100 mm and a diameter of about 50 mm.

2.1.2. Specimen Grouping

After the specimen preparation, the mass, height, diameter, longitudinal wave velocity, and XRD (X-ray diffractometer, Bruker AXS, Karlsruhe, Germany) mineral fraction determination tests were carried out on the specimens first, and the rock samples with large differences were rejected. Next, three rocks were randomly selected on which to carry out XRD component analysis tests. XRD diffraction mineral analysis technology can qualitatively and quantitatively analyze the composition of crystalline minerals and can accurately obtain the percentage content of various minerals in geotechnical engineering. Table 1 shows the results of the XRD mineral fraction testing.
As illustrated in Table 1, the specimens contained mainly five mineral components; the mineral contents of the three groups of rock samples were pyroxene > feldspar > chlorite > mica > quartz, in order. The mineral fraction of the specimen reflects the physicochemical properties of the rock to a certain extent, and it can be considered that the difference between the selected batches of rock samples is small. The discrete nature of the rock mechanics experiments is reduced and the rationality of the experimental data is ensured.
According to the rock mechanics test standard [32], the number of specimens under each set of freeze-thaw cycles was set to at least three. Based on the actual production service life of the mine, the number of freeze-thaw cycles was set to 5, 10, 15, 20, and 25 times. The specimens were grouped; the number of circulating specimens in each group was 3, with a total of 6 groups of rock samples, for a total of 18 rock samples.

2.1.3. Experimental Program

Referring to the temperature environment where the rock sampling mine is located, we set the test corresponding freeze-thaw cycle parameters (freezing temperature: −40 °C, thawing temperature: 20 °C). Figure 1 shows the temperature change profile of the rock, monitored in real time in the freeze-thaw chamber under freeze-thaw cycle treatment. We can learn from the figure that after putting in the rock sample, the freeze-thaw chamber temperature gradually decreases from 20 °C to −40 °C and enters the low-temperature freezing stage, which lasts for 10 h. Then, the temperature gradually rises to 20 °C (the freeze-thaw machine uses the water thawing method to raise the temperature inside the box) and enters the thawing stage, lasting 10 h. A complete freeze-thaw cycle lasts a total of 24 h.
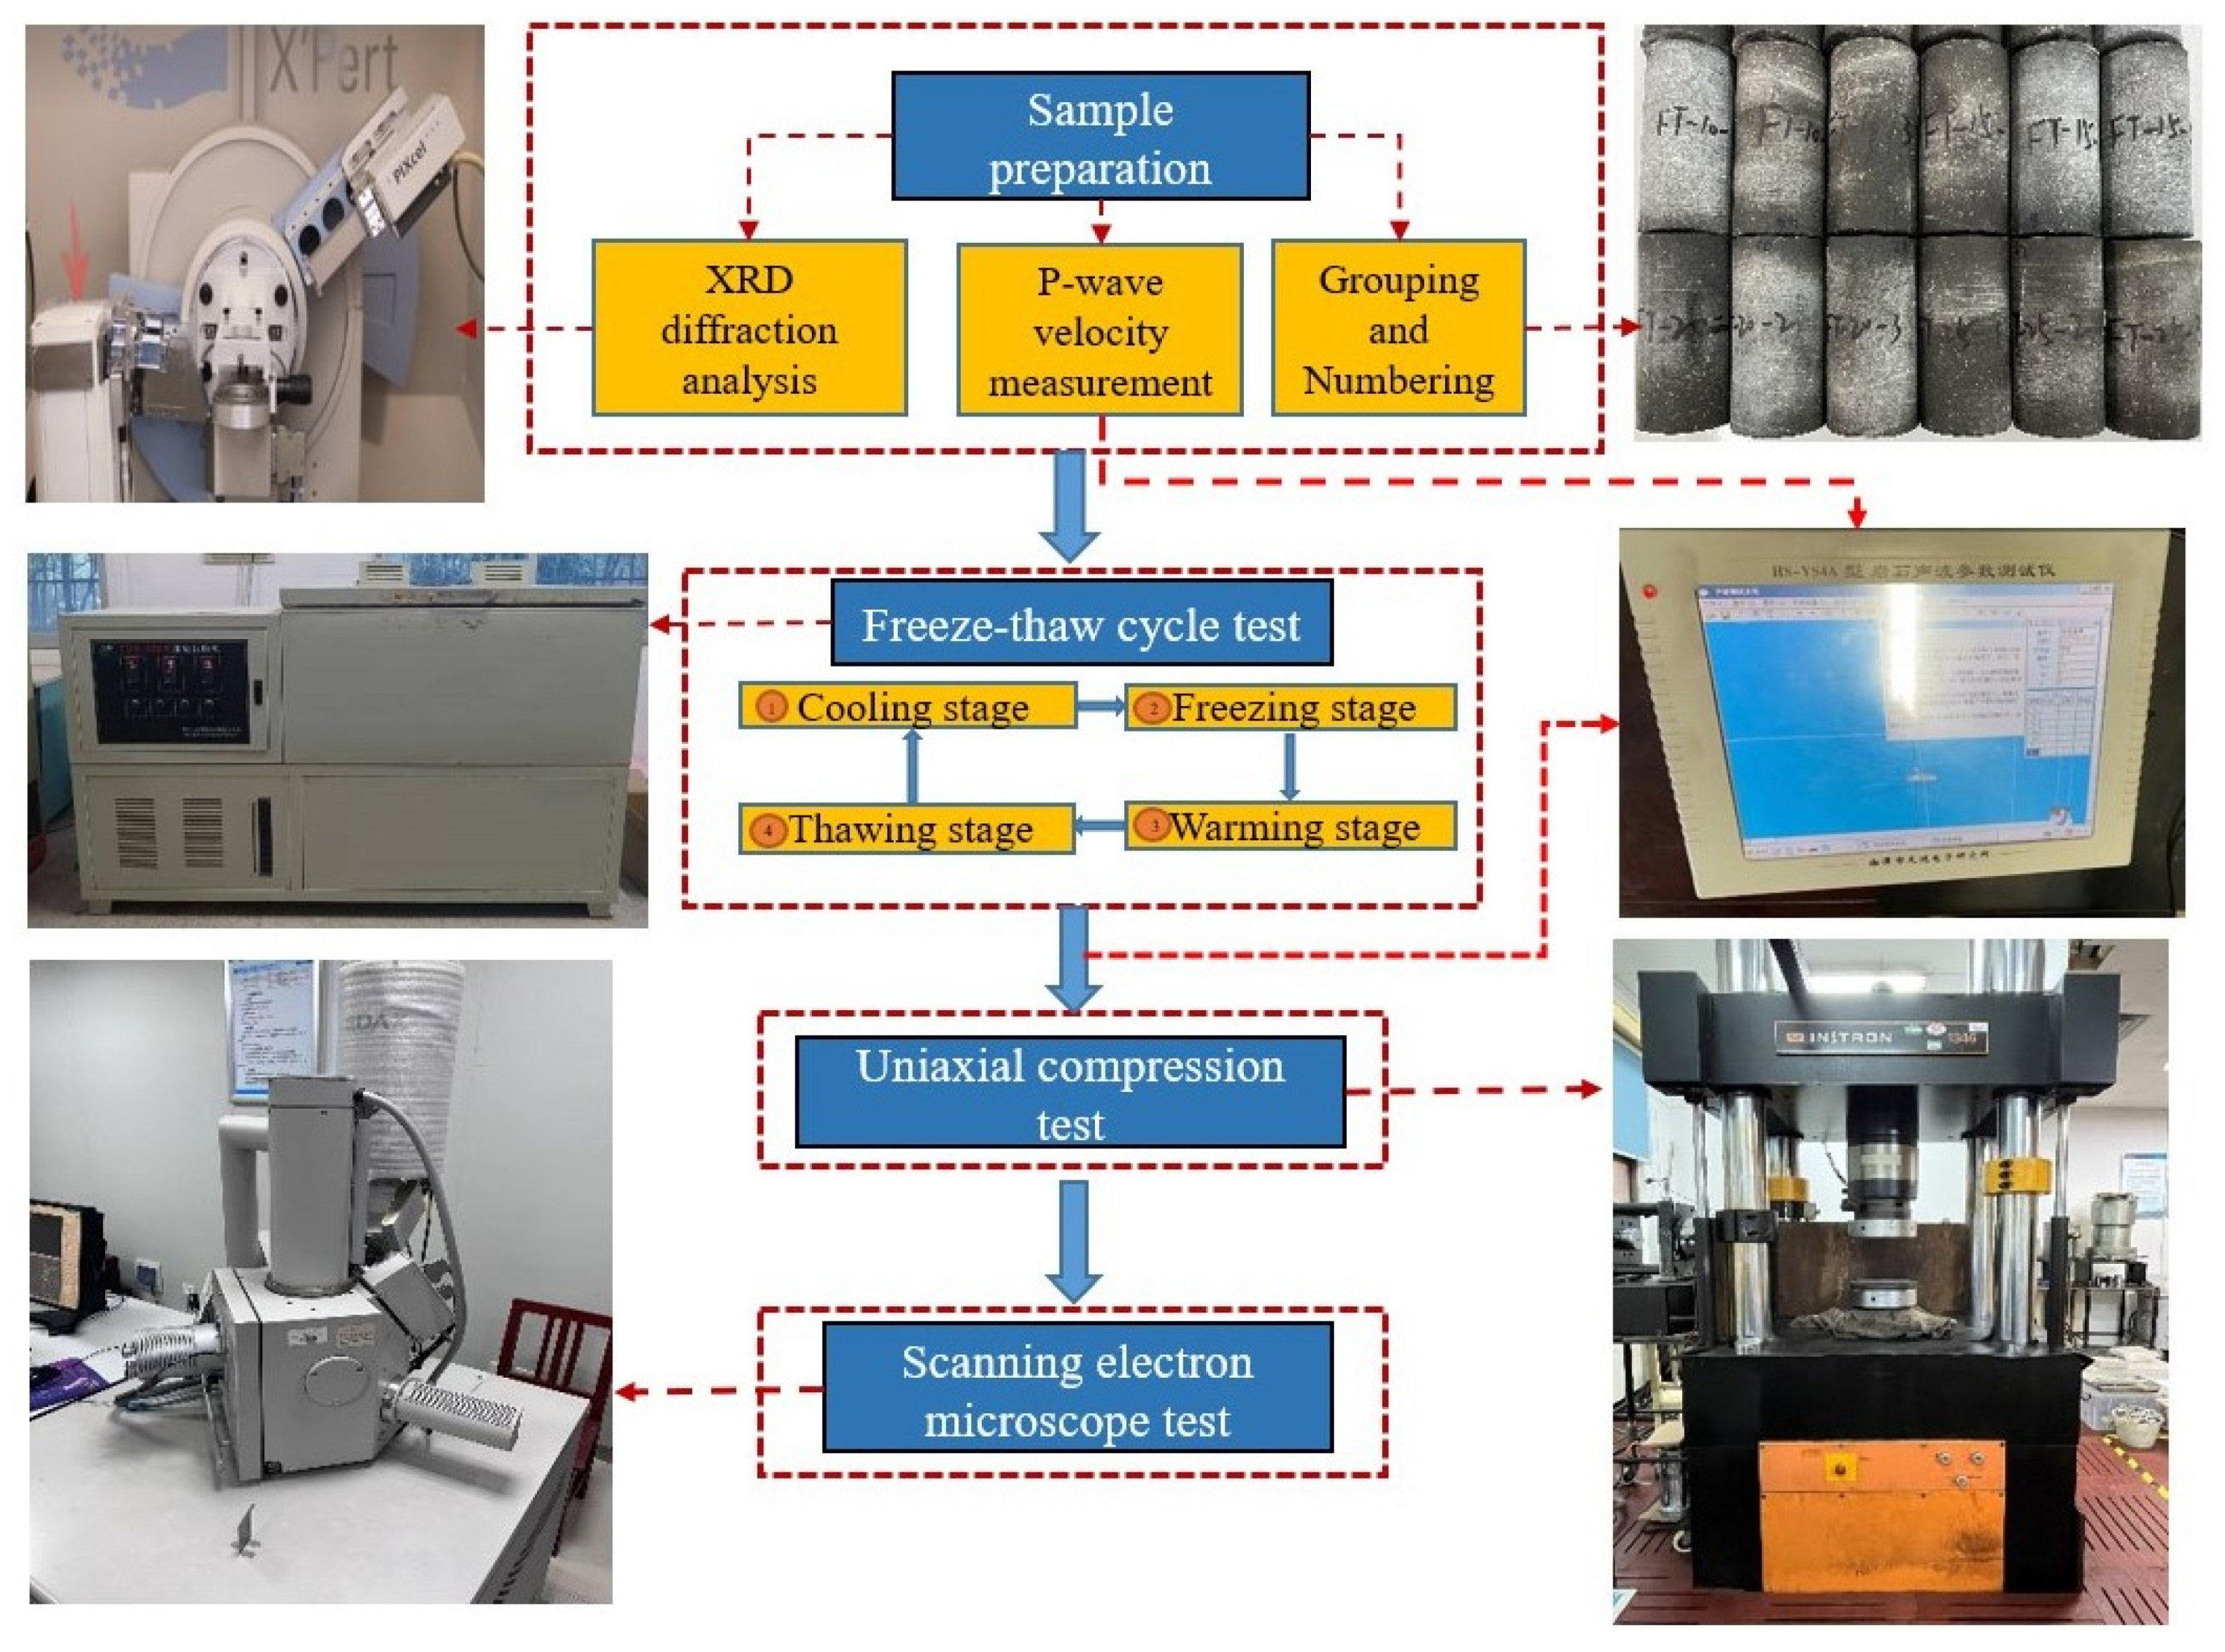
Figure 2 shows the flow of all tests and the required test instruments. The specific experimental procedure is as follows:
(1)
After the sampling was completed, the quality and diameter of the rock samples were tested first, and the rock samples with obvious defects such as fractures on the surface were rejected. Then, based on the XRD component analysis test, the specimens with large differences and that did not meet the test requirements were rejected. The 18 rock samples that met the test requirements were grouped and numbered in the format of FT-X-Y (X is the number of corresponding cycles, Y is the serial number).
(2)
Except for the rock sample with freeze-thaw cycle number 0, all other rock samples were put into the TDS-300 freeze-thaw cycle tester (Donghua Test Equipment Co., Suzhou, China), the corresponding freezing and thawing temperatures were set, and then the samples were removed after completing the corresponding freeze-thaw cycle number.
(3)
(The P-wave velocity test was carried out again on the specimens after the freeze-thaw treatment using the HS-YS4A Rock Acoustic Wave Parameter Tester (Tianhong Electronics Research Institute, Xiangtan, China) to obtain the P-wave velocity values of the specimens after the freeze-thaw.
(4)
Uniaxial compression testing of rock samples was conducted using the Instron 1346 Electro-Hydraulic Servo Universal Testing Machine (INSTRON Corporation, Norwood, MA, USA). The test machine was loaded using displacement control loading and a loading rate of 0.1 mm/min to obtain the stress–strain curve during the uniaxial compression of the specimen.
(5)
The SEM test was carried out with an FEG-Quanta 200 environmental scanning electron microscope (FEI Corporation, Hillsboro, OR, USA) on the fine structure of the crushed rock samples after the uniaxial compression test under different cycle times, and the SEM images of the rock samples under different freeze-thaw cycle times were obtained.
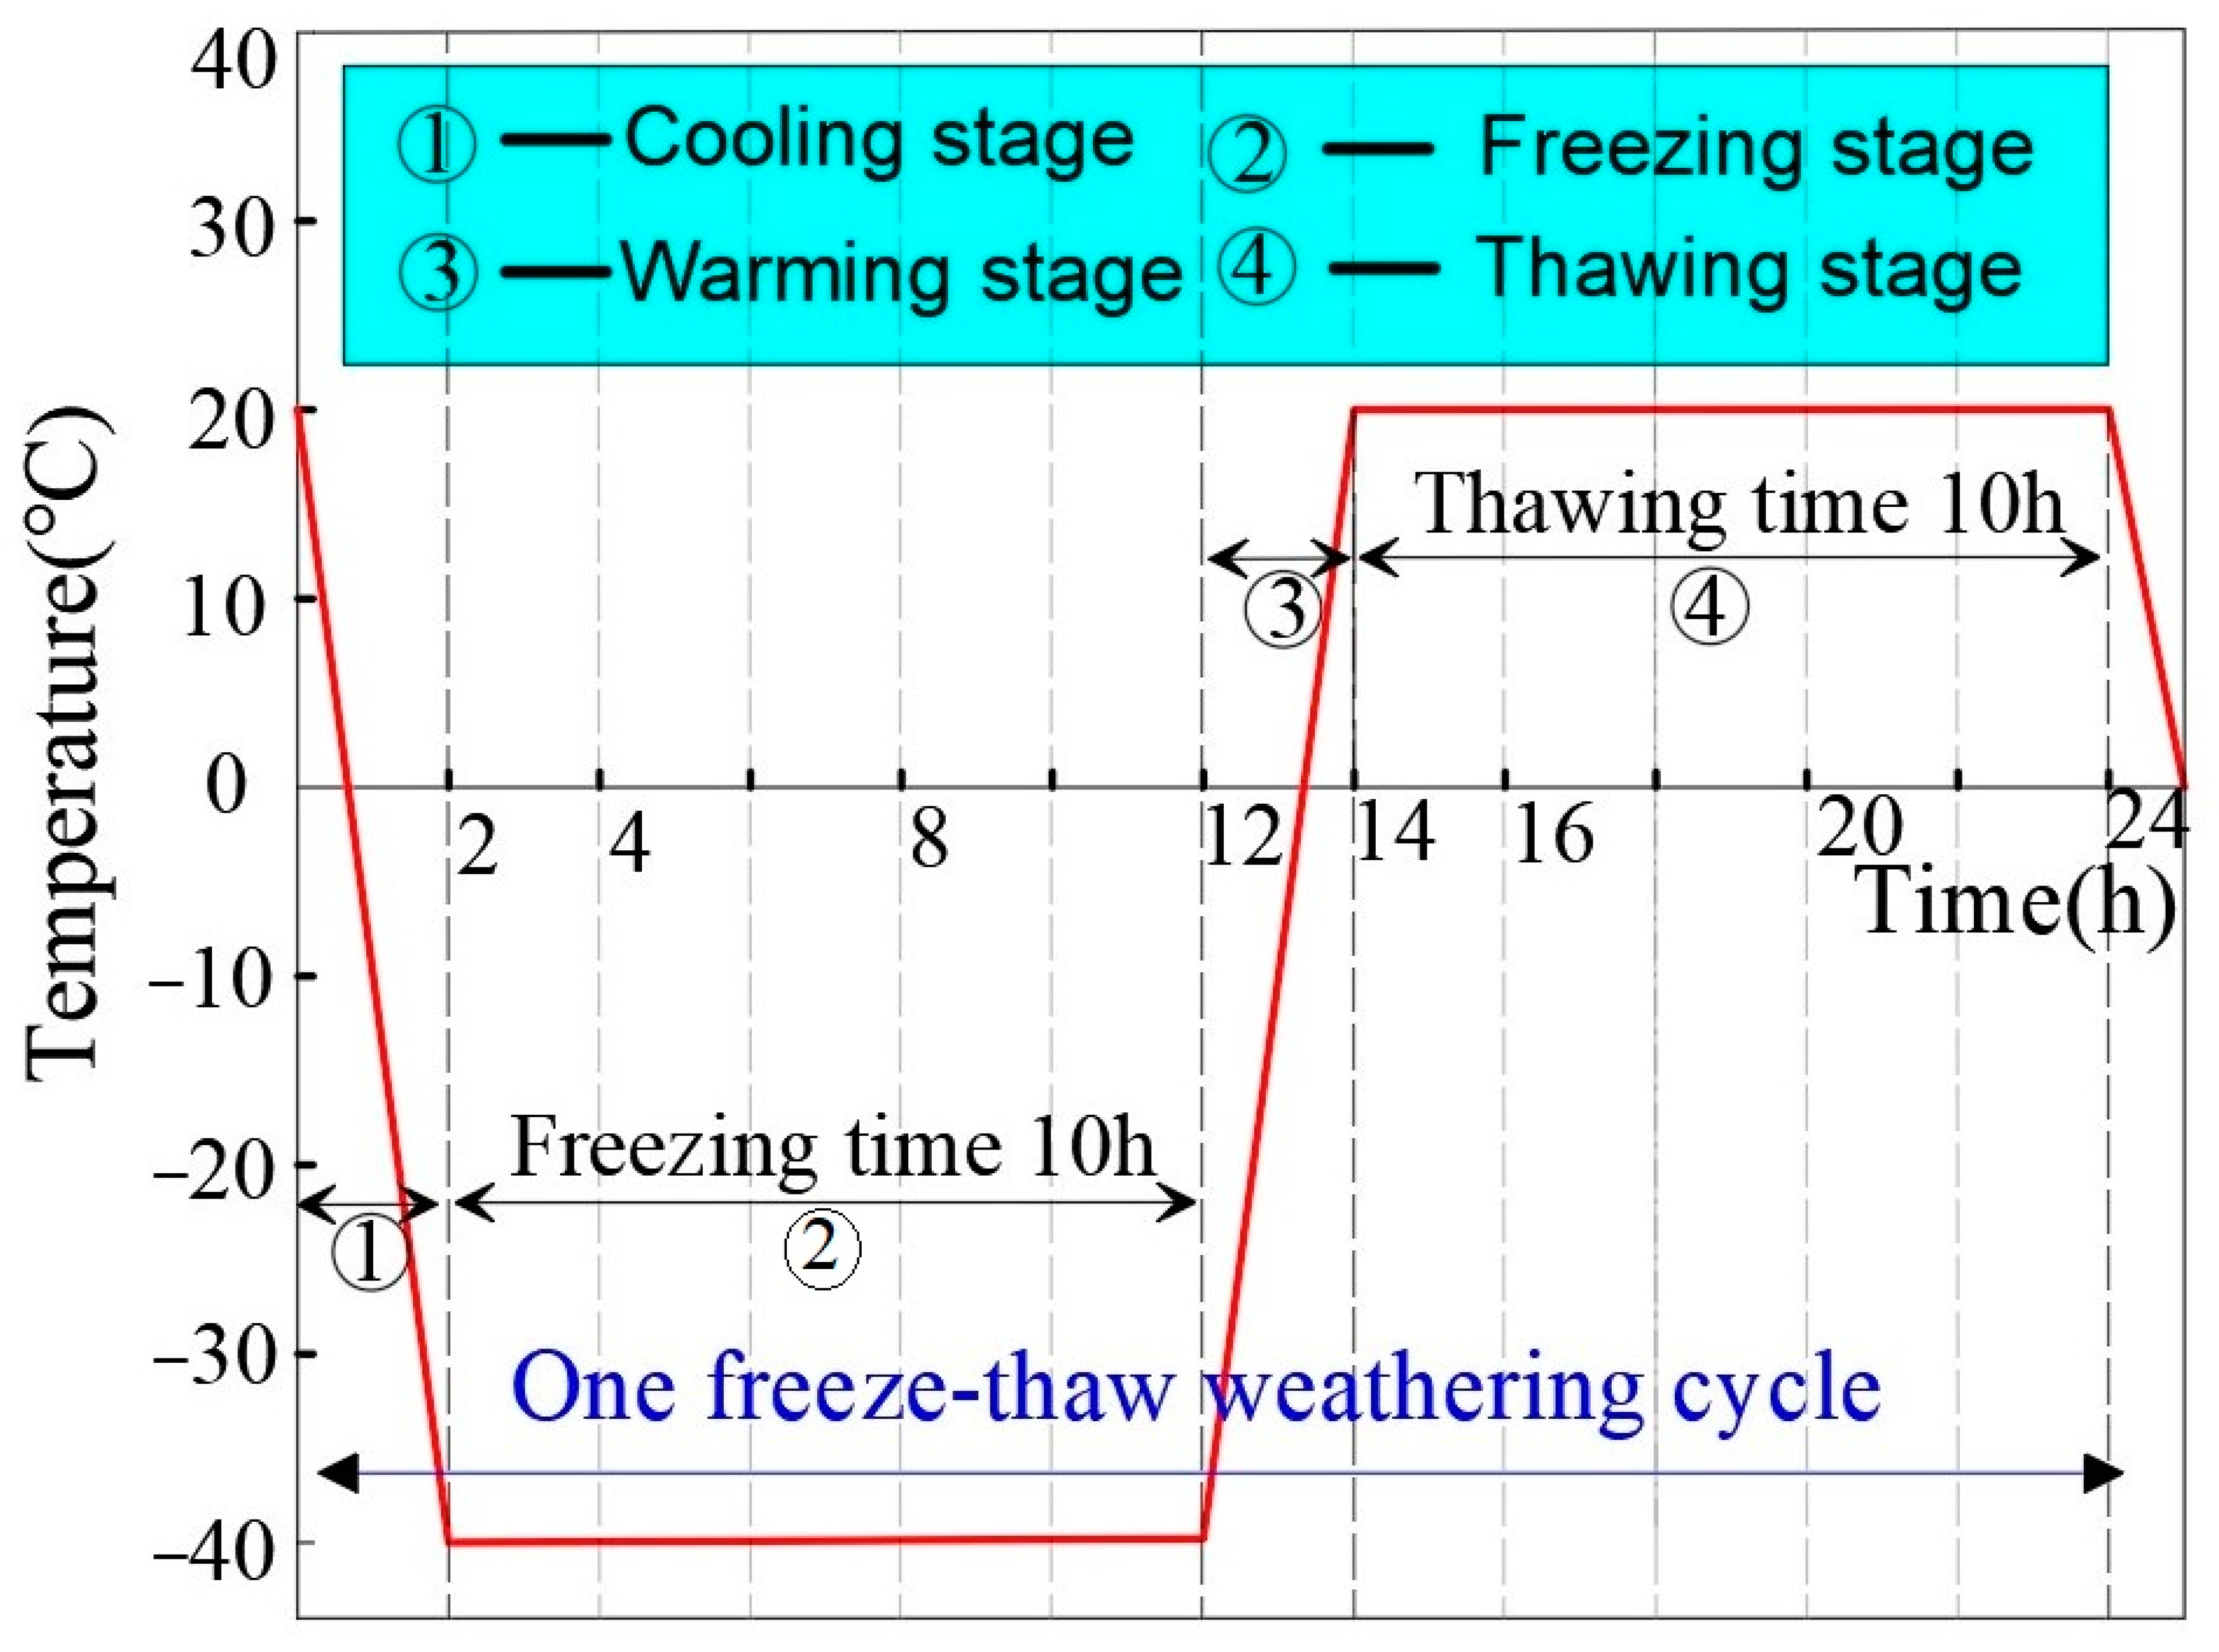
Figure 1. Freeze-thaw cycle temperature change curve.
Fractalfract 07 00354 g001
Figure 2. Experimental procedures and equipment.
Fractalfract 07 00354 g002

2.2. Fractal

Fractals have become a popular method to evaluate irregular and complex research objects. The fractal dimension, as an important parameter to describe the fractal, can reflect the basic characteristics of the fractal. There are various ways to determine the fractal dimension: the common similarity dimension, box-dimension counting method, capacity dimension, etc. Currently, the box dimension counting method is more frequently used. In combination with computer programs, it can be used as an indicator of the statistical homogeneity of nodular rock masses [33] and to evaluate the fractal dimension of rock surface defects [34]. The box dimension method has also been further improved to evaluate the fractal characteristics of rough surfaces [35].
To further analyze the extension characteristics of cracks inside the rocks, the fractal dimension of the fine-view cracks in rocks subjected to freeze-thaw was determined with the box dimension method based on the fractal theory in order to quantify and analyze the cumulative damage caused by the freeze-thaw treatment on the rocks [36,37,38,39]. Figure 3 shows the specific fractal procedure; the calculation steps are as follows:
(1)
Image processing: The “gradient” function in the Matlab software environment is used to convert the SEM image into a grayscale image, and then the grayscale image is binarized, with the white area representing the particulate matter and the black area representing the crack network in the black-and-white image.
(2)
Box dimension method calculation: The fractal dimension of the crack network in the SEM image is calculated using the box-dimension counting method, and each region in the binary image is covered by a sequence of square grids of scale r. The number of regions containing black or white parts is recorded as N(r), which is usually taken as r = 1, 2, 4, …, 2i (i = 0, 1, 2, 3, …); from the image perspective, the dimensions of 1, 2, 4, …, 2i pixels are taken as the edge length to divide the image; and finally, the number of boxes N(1), N(2), N(4), …, N(2i) is obtained.
(3)
When r tends to 0, the fractal dimension of the box dimension method is obtained as:
f = lim r 0 ln N r ln r
where f is the value of the fractal dimension measured by the box dimension.
Because only a finite number of side lengths r can be taken for practical applications, the double logarithmic coordinates have a good linear relationship:
ln N r = ln r × f + h
where f is the slope of the line (i.e., the fractal dimension of the image) and h is the intercept.
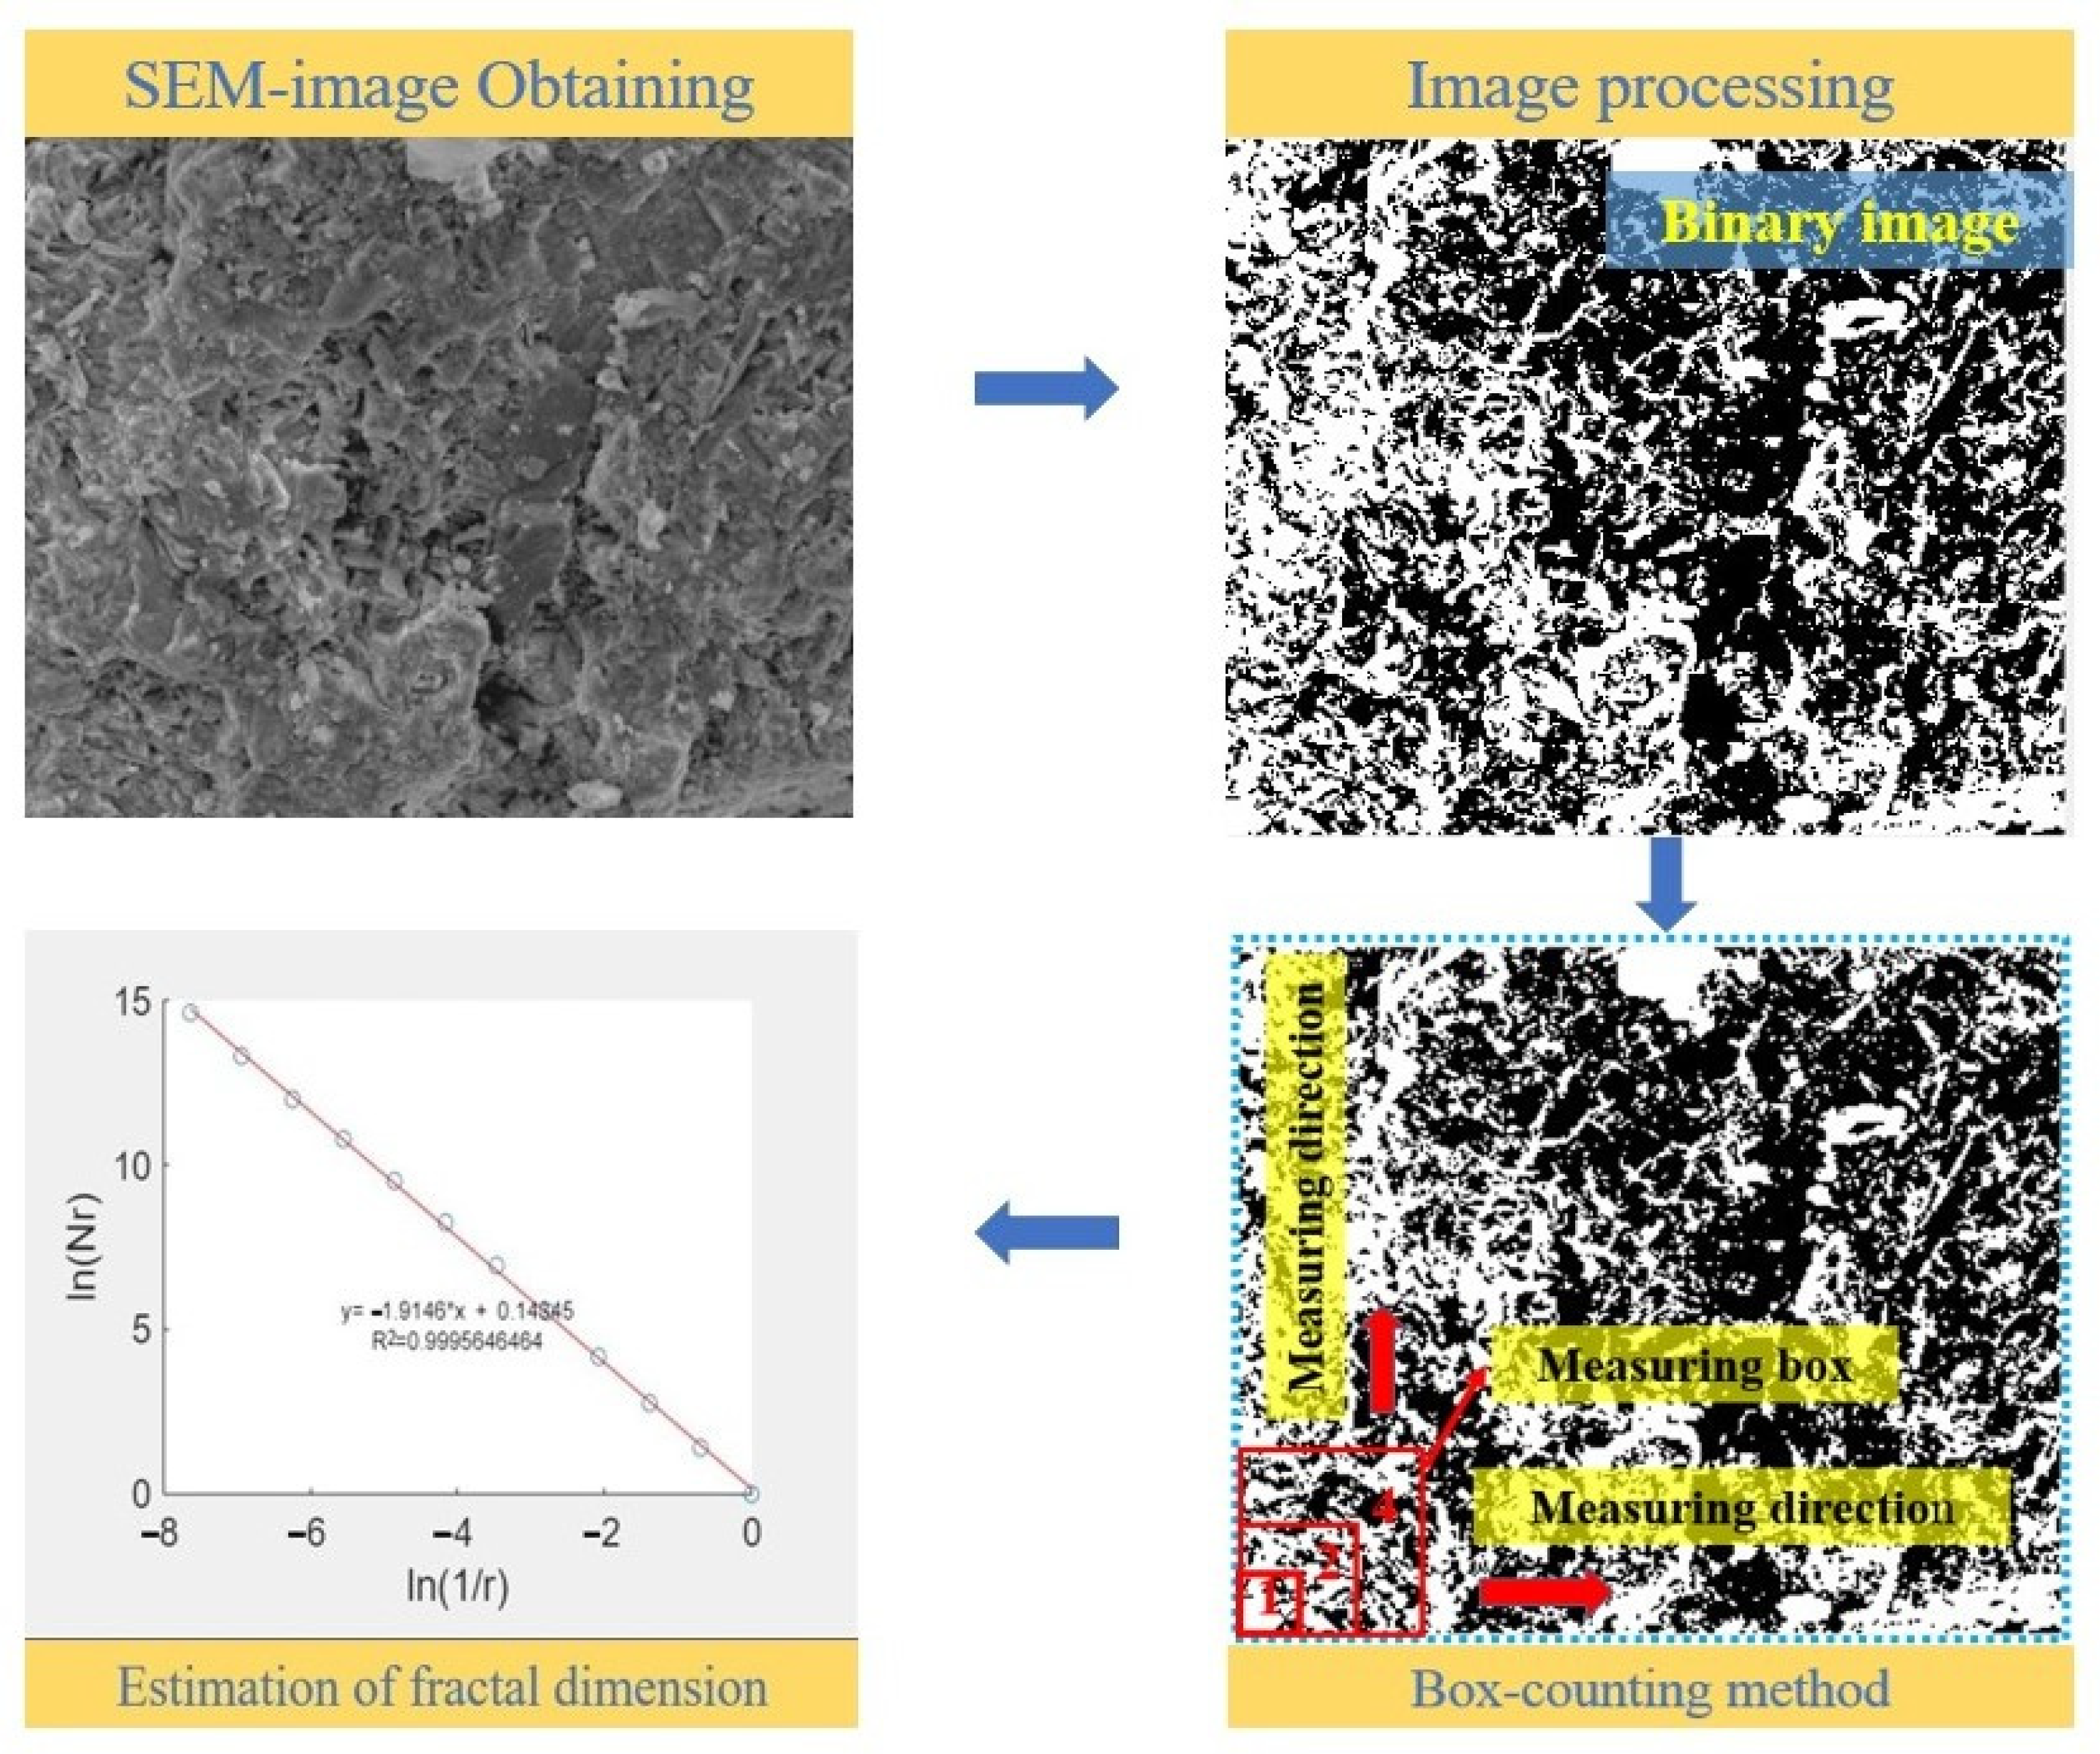
Figure 3. Schematic diagram of the procedure to determine the fractal dimensions of micro-cracks on the surface of a specimen by SEM images of silica at 1000× magnification.
Fractalfract 07 00354 g003

3. Experimental Results

3.1. Physical Parameter Degradation Characteristics

3.1.1. P-Wave Velocity

Figure 4 illustrates that the P-wave velocity values of the rock samples tended to decrease gradually with an increase in the number of freeze-thaw cycles. When the number of freeze-thaw cycles reached 25, the P-wave velocity reduction value of the rock samples reached 1681.64 m/s. Compared with the initial rock samples before the freeze-thaw, the P-wave velocity reduction reached 27.32%, and the P-wave reduction rate was relatively uniform at each cycle number.

3.1.2. Quality Change

Table 2 indicates the results of mass changes in the rock samples before and after the freeze-thaw. It can be seen that the mass of the skarn increased significantly after freeze-thawing compared with before freeze-thawing, but the mass of each specimen increased at different rates. The average mass changes of the skarn after 5, 10, 15, 20, and 25 freeze-thaw cycles were 0.85%, 1.27%, 1.75%, 0.96%, and 0.57%, respectively, and the rate of change showed a trend of increasing and then decreasing. The greatest increase in the mass change rate was observed when the number of freeze-thaws reached 15, and the smallest increase was observed at 25.

3.2. Mechanical Parameter Degradation Characteristics

3.2.1. Stress–Strain Curve

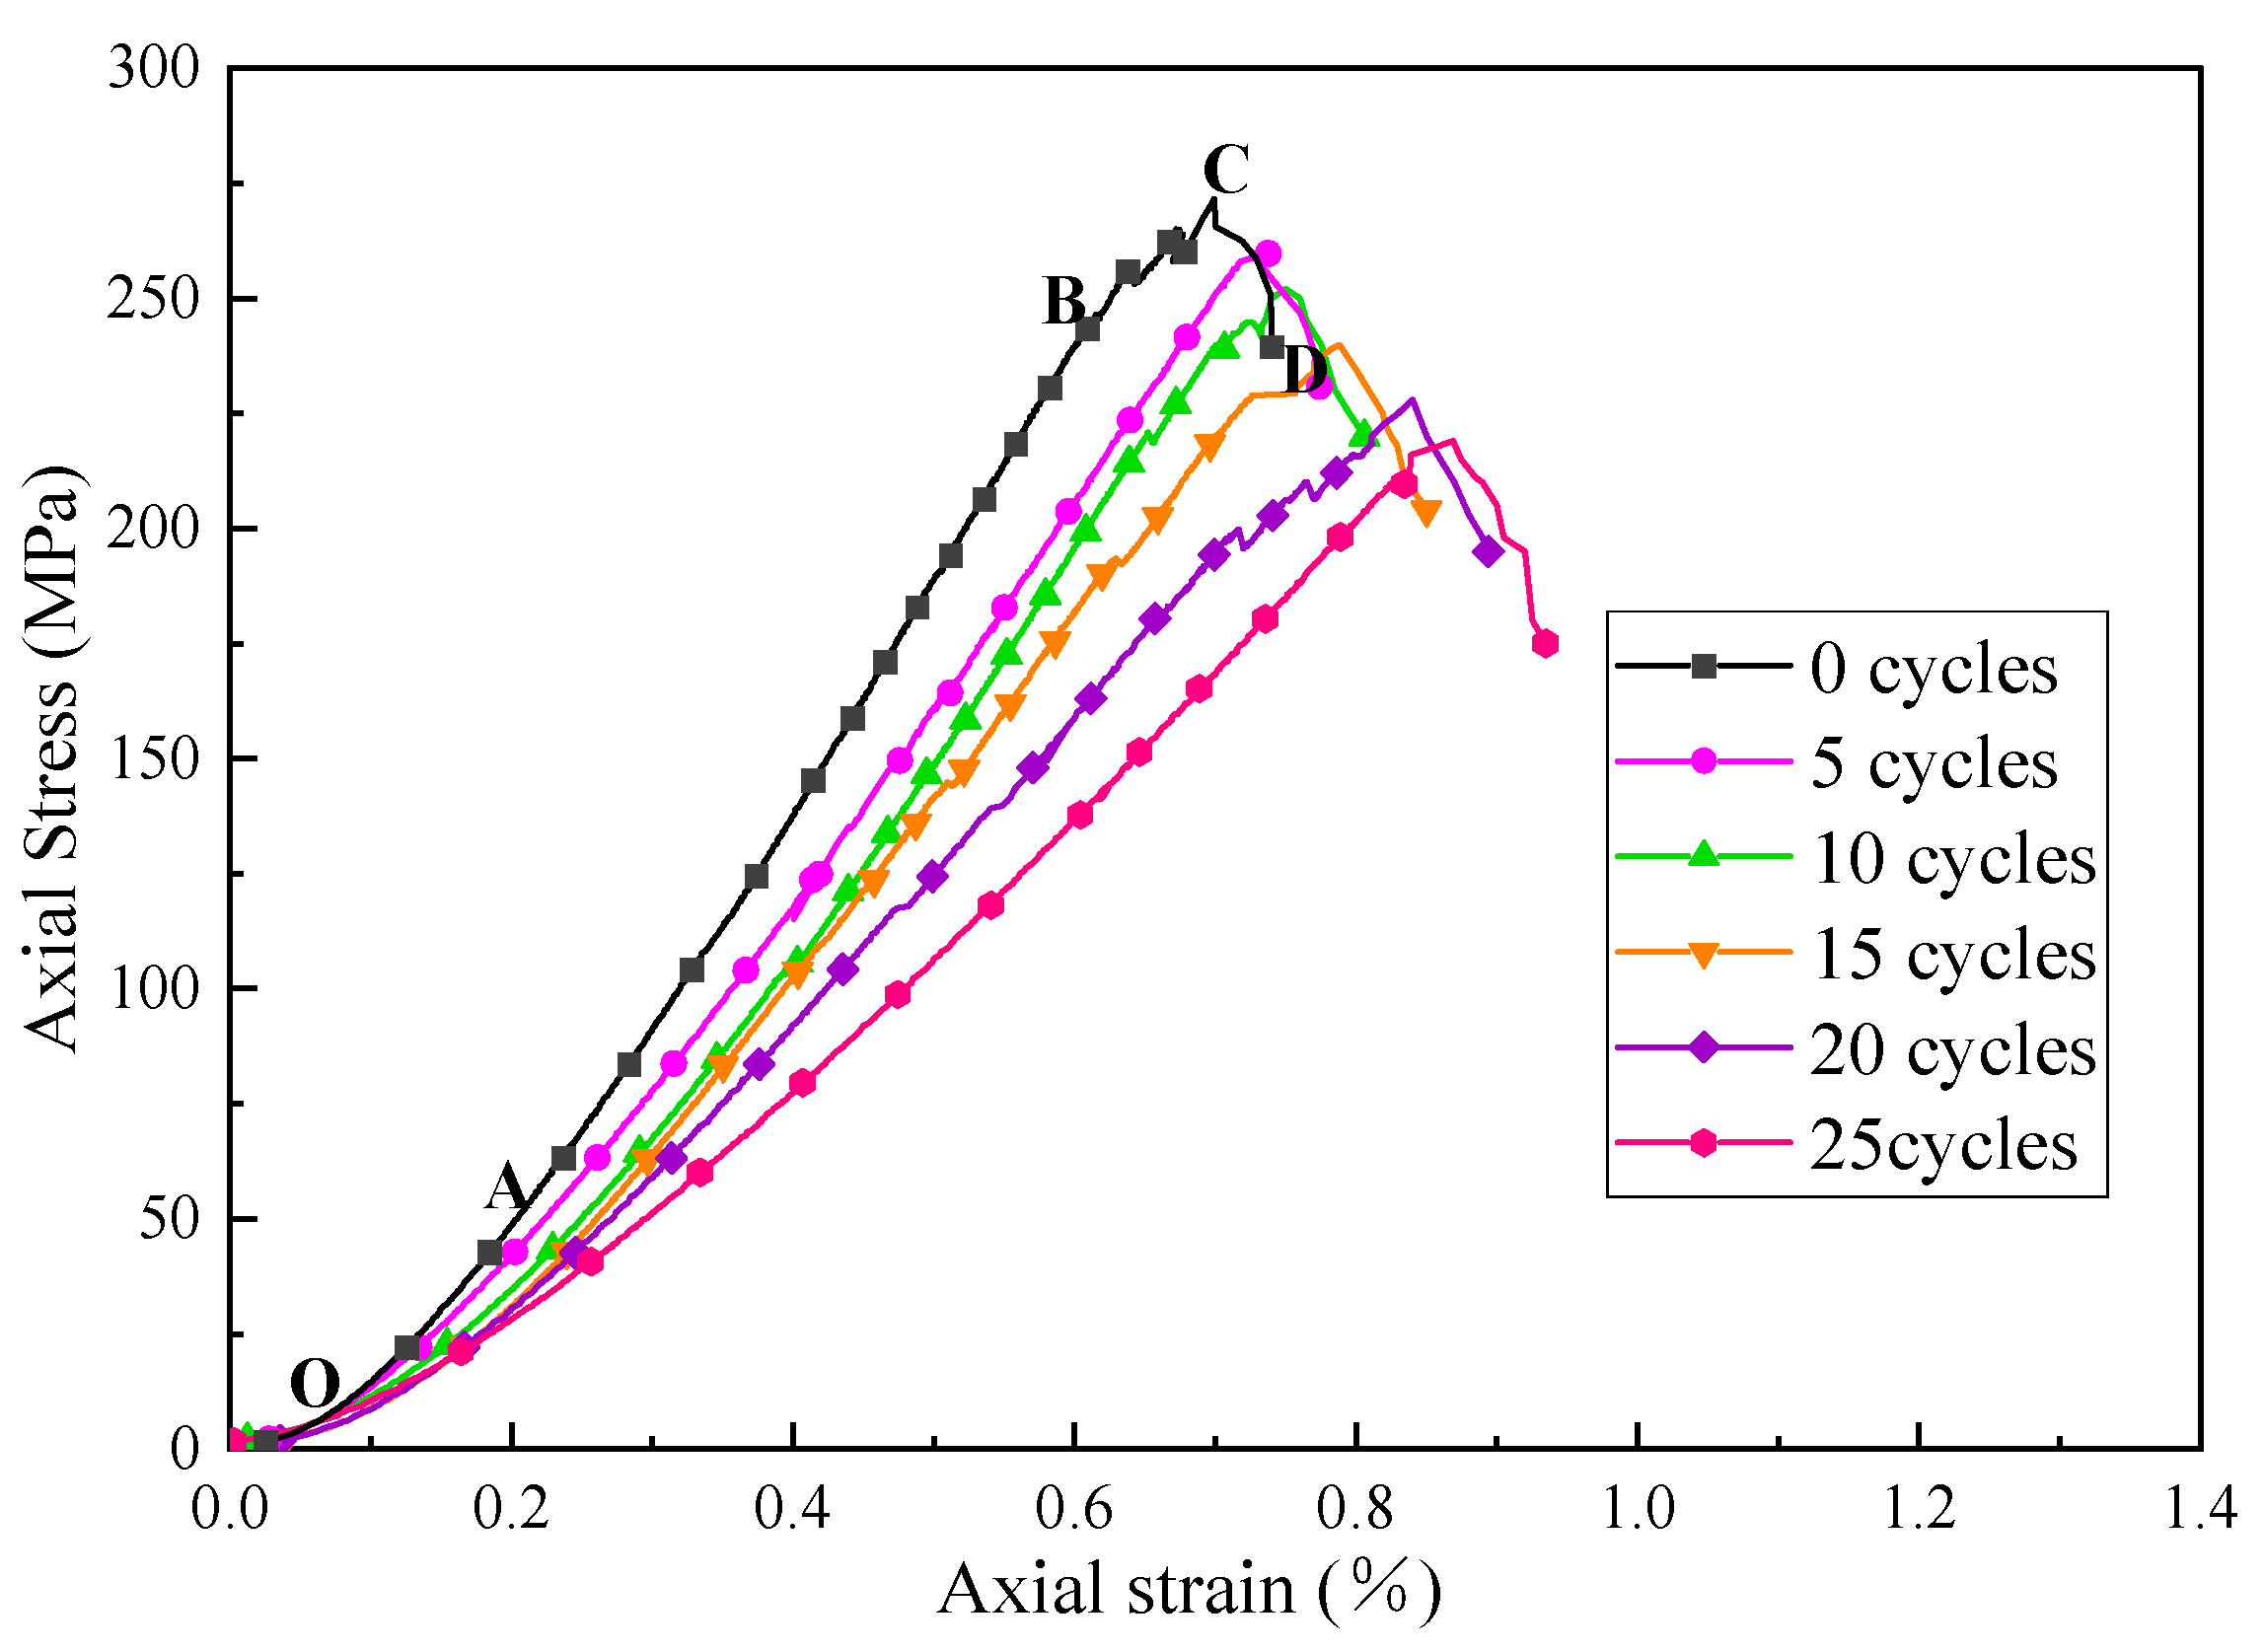
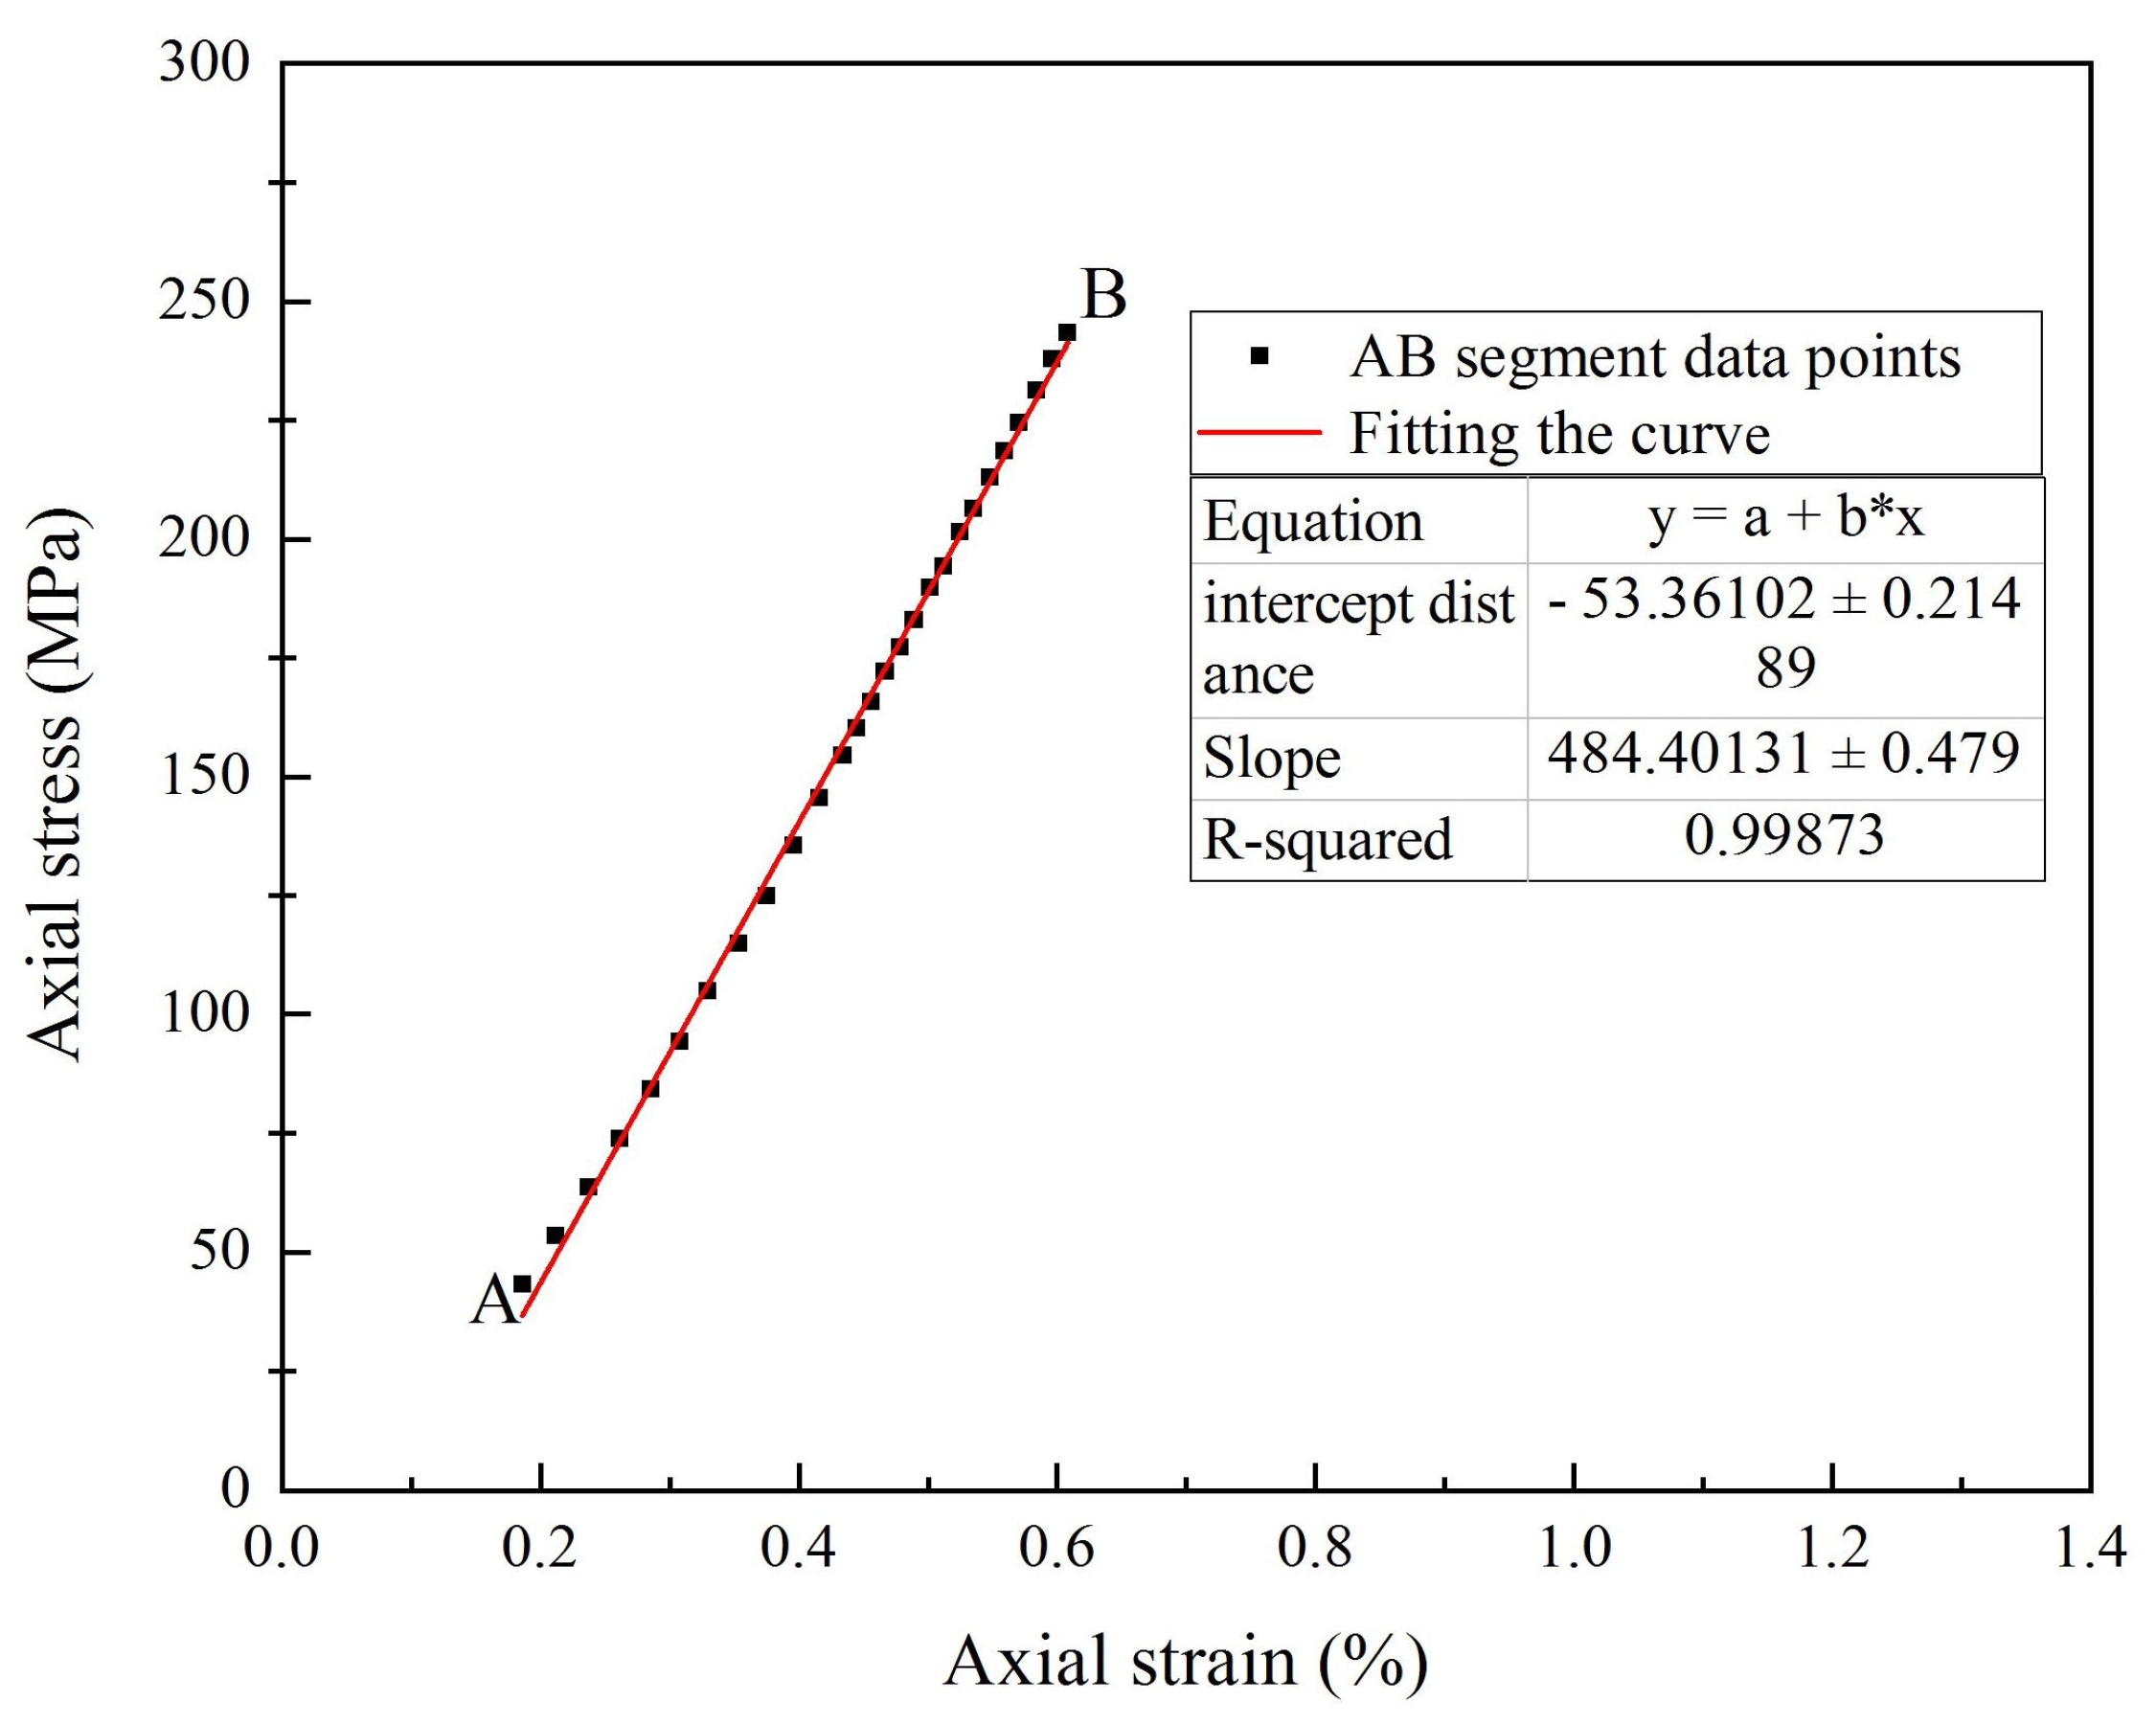
Figure 5 shows the stress–strain curves of the rock samples under different numbers of freeze-thaw cycles. It can be seen that the uniaxial compression process of silica after different freeze-thaw cycles can be divided into four stages: a micro-fracture compression stage (OA), an elastic deformation stage (AB) (Figure 6 shows the linear fit obtained using 0 cycles of the AB segment data points), a fracture development extension stage (BC), and a post-yield stage (CD). With the increase in the number of freeze-thaw cycles of the rock, the peak strength of the rock gradually decreases, and the compressive phase (OA) and elastic phase (AB) of the rock are prolonged after the freeze-thaw treatment compared with the rock without freeze-thaw cycles. Both the OA phase strain and the full phase strain of the specimen gradually increase with the increase in the number of freeze-thaw cycles.

3.2.2. Uniaxial Compressive Strength

Table 3 indicates the peak compressive strength values of the rocks under different numbers of freeze-thaw cycles.
Table 3 illustrates that the peak strength of the rock gradually decreases with the increase in the number of freeze-thaw cycles, and the compressive strength of the rock sample decreases from 275.35 MPa to 221.699 MPa under the action of 25 freeze-thaw cycles. The peak strength loss rate of the specimens after 5, 10, 15, 20, and 25 freeze-thaw cycles was 3.35%, 9.56%, 15.11%, 17.80%, and 19.67%, respectively. The degree of damage to the internal structure of the rock varies with different freeze-thaw cycles, and the longer the freeze-thaw cycle, the greater the strength loss.
Figure 7 displays the compressive strength of the skarn specimens as a function of the number of cycles by nonlinear fitting The functional relationship equation was obtained as:
σ c n = 102.681 exp 80.289 / n + 80.787 ( R 2 = 0.981 )
where σ c n is the compressive strength of the specimens after n freezing cycles.
Equation (3) indicates that as the number of cycles n increases, σ c n decreases, and the correlation coefficient is 0.981. It demonstrates that the freeze-thaw action caused irreversible damage to the skarn specimens, and with the gradual increase in the accumulated damage, the ability of the rock to resist external damage gradually became weaker, so the compressive strength of the specimens after the freeze-thaw was lower than the initial strength.

3.2.3. Modulus of Elasticity and Poisson’s Ratio

As indicated in Table 4, the modulus of elasticity and Poisson’s ratio of the rocks decreased gradually with the increase in the number of freeze-thaw cycles. The modulus of elasticity decreased by 9.86% from 42.78 GPa to 38.56 GPa in the initial rock samples at 25 cycles; Poisson’s ratio decreased from 0.22 to 0.16 in the initial rock samples.
Based on the above data, the relationship between the modulus of elasticity, Poisson’s ratio, and the number of freeze-thaw cycles of silica can be obtained by using nonlinear fitting. From Figure 8, it can be seen that the fitted relationship is as follows:
E n = 35.989 exp 2.890 / n + 16.754
μ n = 0.125 exp 11.265 / n + 19.862
According to Equations (4) and (5), it can be seen that the elastic modulus, Poisson’s ratio, and the number of freeze-thaw cycles are negatively correlated, and the goodness of the fitted functions are all high. The modulus of elasticity and Poisson’s ratio are important indicators to evaluate the deformation resistance of rocks with the increase in freeze-thaw cycles. The rate of decline of both is faster in the early stages of freeze-thawing; it then gradually slows down and tends to level off.
Figure 8. Relationship between modulus of elasticity, Poisson’s ratio, and number of cycles.
Fractalfract 07 00354 g008

3.3. Freeze-Thaw Damage Analysis of Rocks Based on Scanning Electron Microscopy

In order to reveal the damage caused by the freeze-thaw cycles to the internal structure of the specimens, scanning electron microscopy was carried out using an FEG-Quanta 200 environmental scanning electron microscope with a sample size no larger than 10 mm.
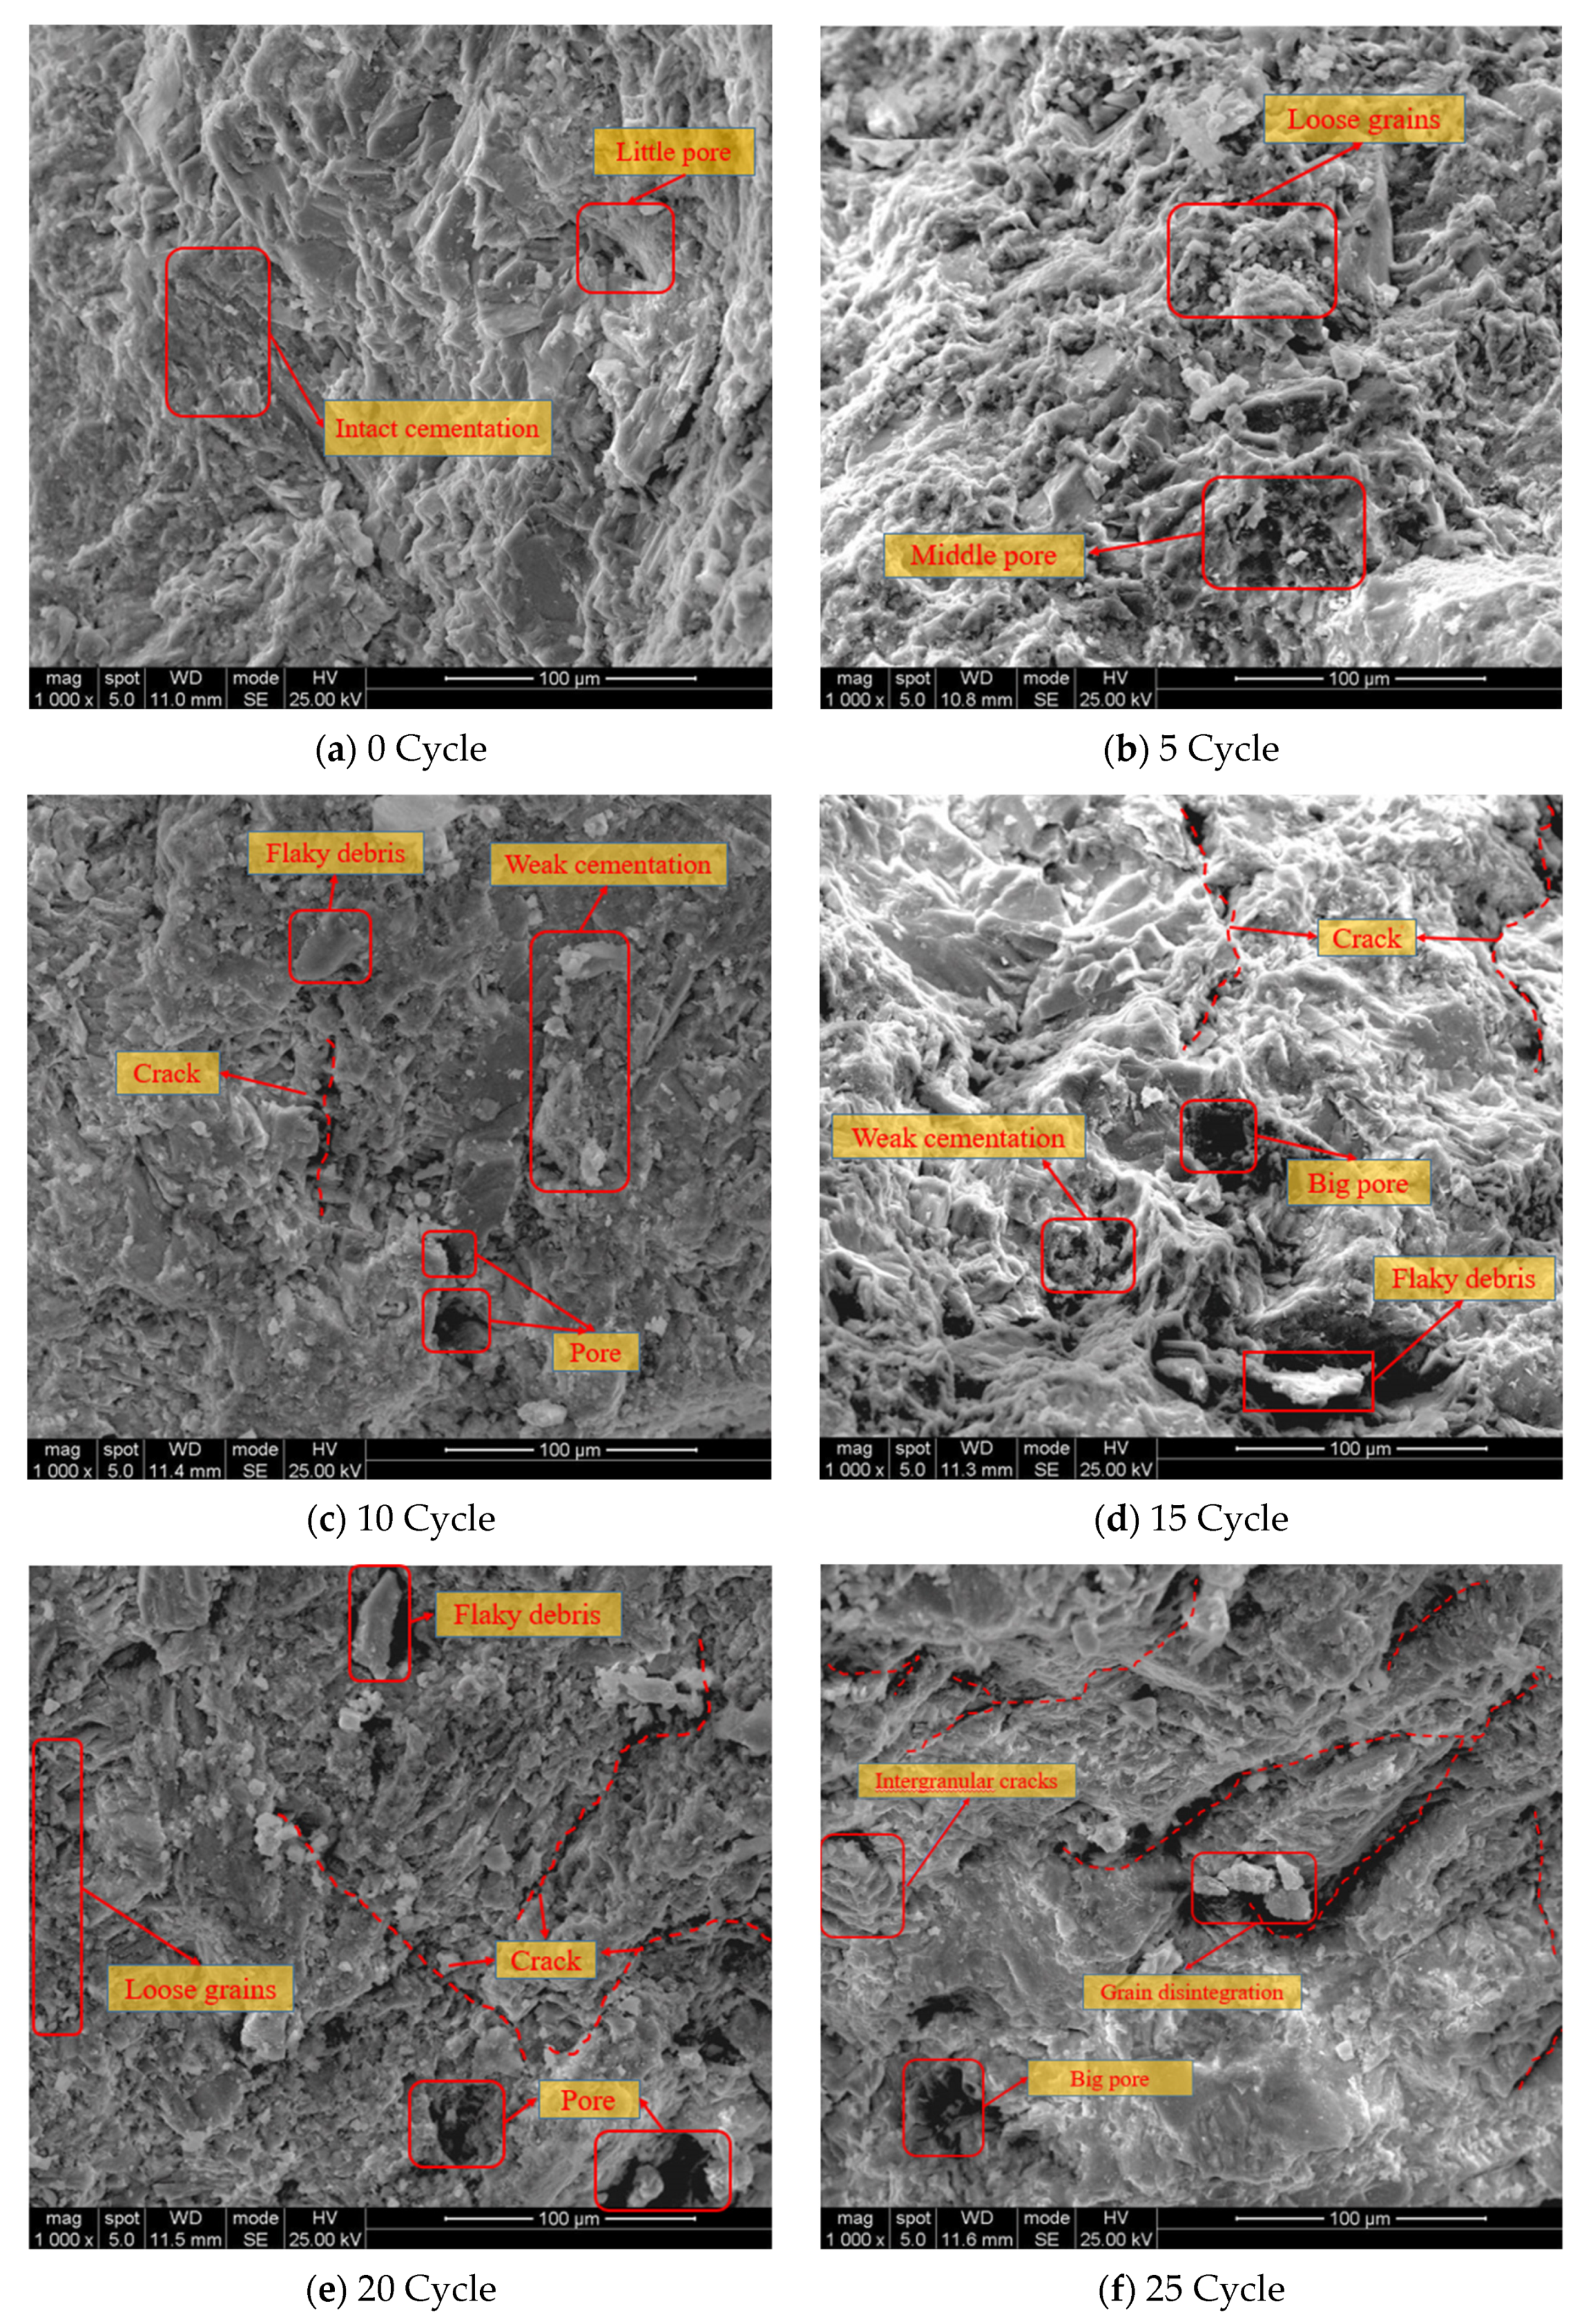
As shown in Figure 9a, the skarn specimens that did not experience freeze-thawing are closely packed with few pores, with micro-porosity predominating and containing very few medium pores. However, after 10 freeze-thaw cycles, the pore development expanded into medium-sized pores, micro-cracks started to appear inside, and the particles became loose from each other (Figure 9c). With the increase in the number of freeze-thaw cycles, the length and number of micro-cracks increased significantly, and there was also a gradual penetration between the cracks to form flakes of debris (Figure 9e). When the number of cycles was 25, the internal granules disintegrated, the pores developed into large pores, the number of cracks increased significantly, and mutual penetration occurred (Figure 9f). These observations indicate that freeze-thaw cycling weakened the rock interparticle assemblage, reduced interparticle cementation, and had a significant impact on the changes in the internal fine structure of the rock.

3.4. Calculation of the Fractal Dimension Based on SEM Images

The SEM images of skarn samples after 10 freeze-thaw cycles were selected as an example, and the crack fractal dimensions of the SEM images were calculated for different numbers of freeze-thaw cycles, as shown in Table 5.
As can be observed from Table 5, the goodness of fit of the fractal procedures is very good; with the increase in the number of freeze-thaw cycles, the fractal dimension gradually increases at an overall homogeneous rate.

4. Discussion

4.1. Correlation Analysis of Fractal Dimension and Rock Physical Property Parameters

It is well known that the speed of acoustic wave propagation is related to the density of the medium [40]. The internal pore water of the rock is subjected to freeze-thaw cycles in the process of freezing → thawing → freezing, and the frost-swelling force generated by the internal constrained surface of the rock causes the further development and expansion of the cracks and pores inside the rock. The extension and penetration of the cracks leads to an increase in the complexity and fractal dimension inside the rock. The increased number of cracks also greatly reduces the density of the internal structure of the rock, which leads to a decrease in the speed of sound wave propagation within the rock. Therefore, as the number of freeze-thaw cycles increases, the wave velocity of the rock samples gradually decreases and the fractal dimension gradually increases, as the two are negatively correlated.
There are two main reasons for the increase in the mass of the skarn specimen: the increase in the pore water inside the specimen and the flaking of granular material on the surface of the rock sample. With the gradual increase in the number of freeze-thaw cycles, the number of pores inside the rock sample gradually increased, and micro-pores gradually developed and cracks penetrated each other, resulting in an increase in the volume of pores inside the specimen. Water molecules are affected by migration and will penetrate larger pores and new pores; thus, the amount of water in the pores inside the rock becomes larger and the mass of the specimen increases [41]. However, when the freeze-thaw cycle reaches a certain stage, the formation and development of internal defects leads to damage to the surface of the specimen (e.g., spalling of surface particles, increase in joints and cracks, etc.). Thus, the rate of specimen mass increase slows. The fractal dimension tends to increase with the number of cycles, and its rate of increase is proportionally uniform, which is different from the rate of increase in mass. The analysis suggests that the period of freeze-thaw action may not be long enough, and the stripping of the granular debris from the rock surface is much less than the rate of crack expansion inside it, so the rate of fractal dimension increase is more uniform.
The compressive strength, elastic modulus, and Poisson’s ratio are important indicators to evaluate the deformation resistance of rocks. Based on the analysis of the experimental results, it can be seen that the increase in strain in the initial compressive section is caused by the damage deterioration of the fine structure of the rock by the freeze-thaw action as the number of internal pores of the specimen gradually increases and the cracks penetrate each other. The damage deterioration of the internal structure is the fundamental reason for the decrease in the compressive strength, elastic modulus, and Poisson’s ratio of the rock.
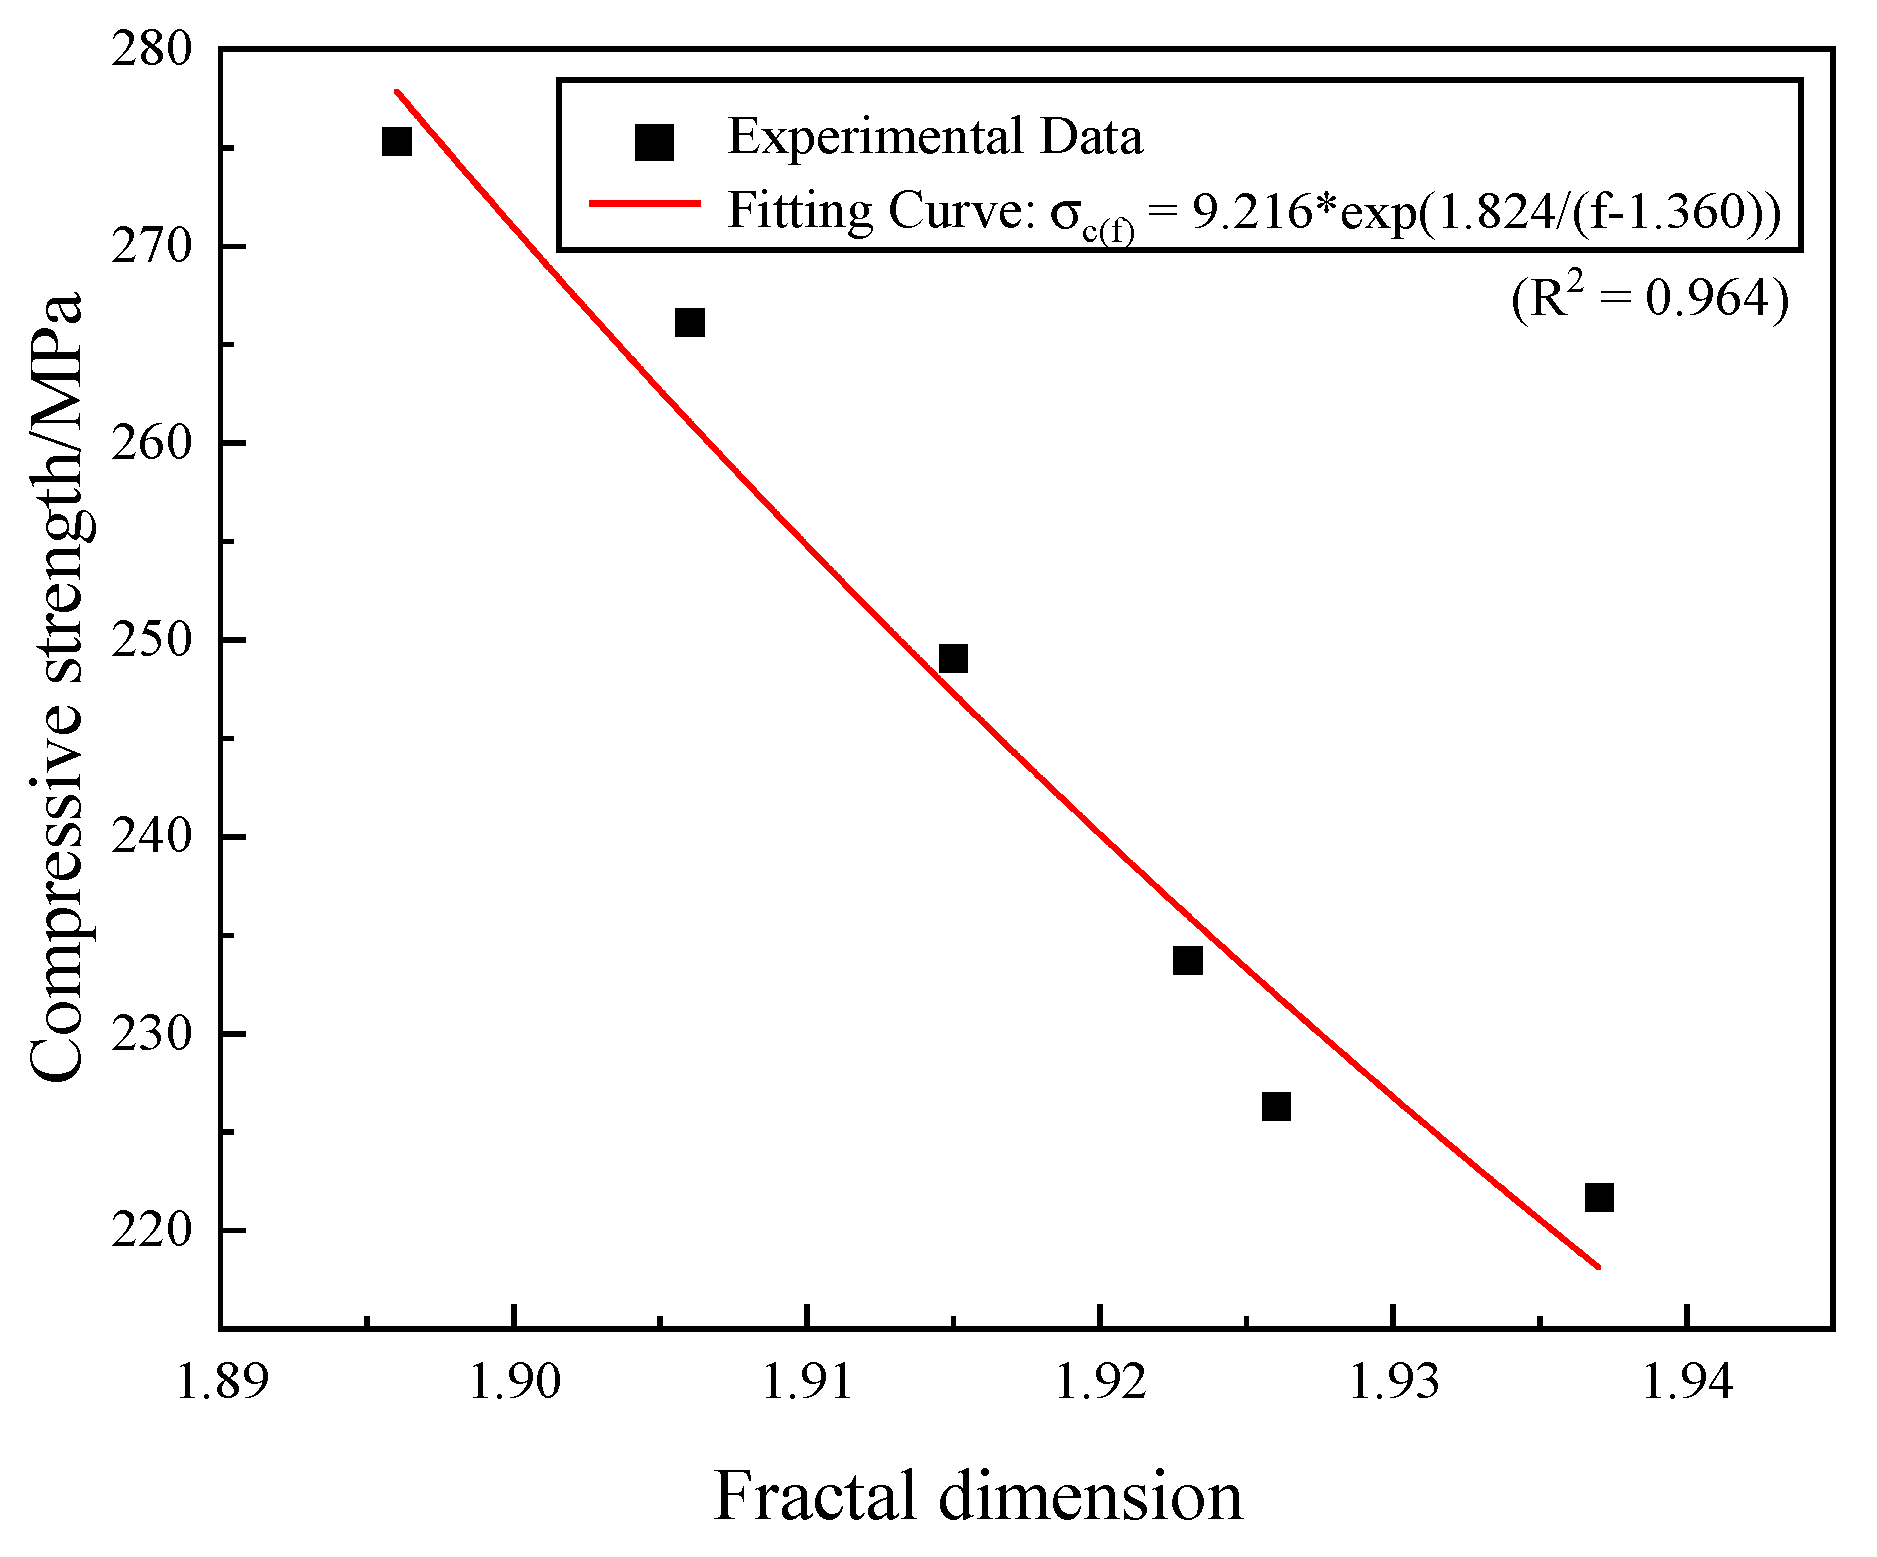
Figure 10 illustrates that the larger the fractal dimension is, the lower the compressive strength of the specimen is, and the two are negatively correlated. This indicates that the nature of rock deterioration by freeze-thaw damage is the deterioration of the fine structure of the rock, in which the fractal dimension gradually increases and the deformation resistance gradually decreases.

4.2. Analysis of Freeze-Thaw Damage Mechanism

There have been many insights into the mechanism of freeze-thaw damage in rocks [42,43], but the dominant factors of the freeze-thaw damage destruction are yet to be explored. Combined with the obtained experimental results, the mechanism of deterioration of skarn by freeze-thaw damage is considered to be dominated by the following three factors: (1) Inter-pore freezing and swelling force: The rock itself is a pore medium material; when it is in a water-rich environment, water molecules enter the rock interior through the pores until saturation is reached. According to the water expansion theory, under freezing conditions, water freezing results in 9% volume expansion, which generates significant freeze-swelling stress. As the cycle period becomes longer, more bound surfaces are subjected to the freezing stress, and when the freezing stress is greater than the cementing force between the internal particles of the rock, the particles with weak cementing force will be exfoliated and precipitated, and new pores and cracks will be created. With the reciprocal freeze-thaw process, the crack development will lead to macroscopic damage of the rock to a certain extent. (2) The reduction of effective bearing area: With the increase in the number of cycles, a large number of pores and fissures are formed in the interior of the specimen. Although the outer surface of the specimens did not change significantly, the internal structure pore evolution was obvious: small pores gradually evolved into medium or large pores, the number of cracks increased significantly, and some pores were accompanied by flaky fragments. These behaviors led to a decrease in the internal compactness of the rock, and the effective area for bearing external stress decreased, which caused damage deterioration to the deformation resistance of the rock. (3) Crack extension penetration: Crack penetration is one of the direct causes of rock damage and deformation. In the process of freezing and thawing, the pores inside the rock gradually develop and expand under the action of the freezing and swelling force, and the pores penetrate to form fissures. The fractures evolve randomly in the reciprocation of freezing and thawing, and intergranular cracking occurs between particles, so that the complexity of the internal crack structure gradually increases. That is, the crack fractal dimension of the rock gradually increases.

5. Conclusions

(1) Freeze-thaw cycles have significant effects on the physical property parameters of rocks. With an increase in the number of freeze-thaw cycles, the mass of the rock samples gradually increased, but the P-wave velocity values, compressive strength, elastic modulus, and Poisson’s ratio all showed a decreasing trend.
(2) The SEM images of the skarn show that under the action of the freeze-thaw cycles, the number of internal pores gradually increased, the particle cement gradually became loose, and penetration occurred between cracks. The internal compactness of the rock decreased, the crack complexity increased, and the fractal dimension value gradually increased.
(3) The variation law between fractal dimension and rock physical property parameters under different numbers of freeze-thaw cycles was investigated, and the fractal dimension values were negatively correlated with P-wave velocity, compressive strength, elastic modulus, and Poisson’s ratio. Based on the obtained experimental results, three factors are proposed for the deterioration of rock damage under freeze-thaw action: inter-pore freeze-swelling force, reduction of effective bearing area, and crack extension penetration.

Author Contributions

Conceptualization, J.L.; Methodology, J.L., S.T. and C.Y.; Investigation, S.T., H.C. and Y.L.; Data curation, J.L., S.T. and C.Y.; Writing—original draft, S.T.; Writing—review & editing, C.Y.; Supervision, J.L. and C.Y.; Project administration, J.L. and H.C.; Funding acquisition, J.L. All authors have read and agreed to the published version of the manuscript.

Funding

This work was supported by the Natural Science Foundation of Hunan Province (Surface Project) (Grant No. 2020JJ4712) and the Natural Science Foundation of Hunan Province (Youth Project) (Grant No. 2022JJ0602).

Data Availability Statement

All data were obtained through this experiment.

Conflicts of Interest

The authors declare that they have no known competing financial interests or personal relationships that could have appeared to influence the work reported in this paper.

References

  1. Shen, Y.J.; Yang, G.S.; Rong, T.L.; Jia, H.L.; Wang, M.; Liu, H. Analysis of localized damage effect and end fracture characteristics of single fracture type sandstone under the action of freeze-thaw cycles. J. Rock Mech. Eng. 2017, 36, 562–570. [Google Scholar]
  2. Yang, G.S.; Pu, Y.B.; Ma, W. Study on the extension of rock damage under freeze-thaw environment conditions in cold regions. Exp. Mech. 2002, 17, 220–226. [Google Scholar]
  3. Xu, G.M.; Liu, Q.S.; Peng, W.W.; Chang, X.X. Experimental study of basic mechanical properties of rocks under low temperature action. J. Rock Mech. Eng. 2006, 25, 2502–2508. [Google Scholar]
  4. Iñigo, A.C.; García-Talegón, J.; Vicente-Tavera, S.; Martín-González, S.; Casado-Marín, S.; Vargas-Muñoz, M.; Pérez-Rodríguez, J.L. Colour and ultrasound propagation speed changes by different ageing of freezing/thawing and cooling/heating in granitic materials. Cold Reg. Sci. Technol. 2013, 85, 71–78. [Google Scholar] [CrossRef]
  5. Long, S.G.; Xu, J.T.; Li, R.J.; Liu, X.; Chen, J. Damage and mechanical properties of intermittent jointed rock masses under freeze-thaw action. J. Disaster Prev. Mitig. Eng. 2023, 3, 1–7. [Google Scholar]
  6. Yamabe, T.; Neaupane, K.M. Determination of some thermo-mechanical properties of Sirahama sandstone under subzero temperature condition. Int. J. Rock Mech. Min. Sci. 2001, 38, 1029–1034. [Google Scholar] [CrossRef]
  7. Kodama, J.; Goto, T.; Fujii, Y.; Hagan, O. The effects of water content, temperature and loading rate on strength and failure process of frozen rocks. Int. J. Rock Mech. Min. Sci. 2013, 62, 1–13. [Google Scholar] [CrossRef]
  8. Gao, F.; Xiong, X.; Xu, C.; Zhou, K.P. Mechanical property deterioration characteristics and a new constitutive model for rocks subjected to freeze-thaw weathering process. Int. J. Rock Mech. Min. Sci. 2021, 140, 104642. [Google Scholar] [CrossRef]
  9. Huang, S.; Yu, S.; Ye, Y.; Ye, Z.; Cheng, A. Pore structure change and physico-mechanical properties deterioration of sandstone suffering freeze-thaw actions. Constr. Build. Mater. 2022, 330, 127200. [Google Scholar] [CrossRef]
  10. Mousavi SZ, S.; Tavakoli, H.; Moarefvand, P.; Rezaei, M. Assessing the effect of freezing-thawing cycles on the results of the triaxial compressive strength test for calc-schist rock. Int. J. Rock Mech. Min. Sci. 2019, 123, 104090. [Google Scholar] [CrossRef]
  11. Zhang, H.M.; Wang, H.; Zhang, J.F.; Cheng, S.F.; Zhou, H.W. Characterization of fine-scale damage in freeze-thaw rocks at CT scale. J. Liaoning Univ. Eng. Technol. Nat. Sci. Ed. 2020, 39, 51–56. [Google Scholar]
  12. Park, J.; Hyun, C.U.; Park, H.D. Changes in microstructure and physical properties of rocks caused by artificial freeze–thaw action. Bull. Eng. Geol. Environ. 2015, 74, 555–565. [Google Scholar] [CrossRef]
  13. Feng, Q.; Hou, S.; Liu, W.; Zhang, S.; Li, W.; Tian, M. Study on the simulation method and mesoscopic characteristics of rock freeze-thaw damage. Comput. Geotech. 2023, 153, 105038. [Google Scholar] [CrossRef]
  14. Zhou, K.; Bin, L.; Li, J.L.; Deng, H.; Bin, F. Microscopic damage and dynamic mechanical properties of rock under freeze–thaw environment. Trans. Nonferr. Met. Soc. China 2015, 25, 1254–1261. [Google Scholar] [CrossRef]
  15. Li, J.L.; Zhu, L.Y.; Zhou, K.P.; Liu, H.W.; Cao, S.P. Characterization of pore structure damage in sandstone under freeze-thaw action. Geotech. Mech. 2019, 40, 3524–3532. [Google Scholar]
  16. Li, J.L.; Zhou, K.P.; Zhang, Y.M.; Xu, Y. Experimental study on freeze-thaw damage of rock pore structure based on nuclear magnetic resonance technique. J. Rock Mech. Eng. 2012, 31, 1208–1214. [Google Scholar]
  17. Zhang, N.; Zhao, W.Z.; Luo, S.L.; Wang, S.D.; Wang, R.C.; Li, X.L. Mineral analysis of freeze-thaw red sandstone damage characteristics based on uniaxial compression and scanning electron microscopy experiments. J. Build. Sci. Eng. 2022, 3, 1–9. [Google Scholar]
  18. Perfect, E. Fractal models for the fragmentation of rocks and soils: A review. Eng. Geol. 1997, 48, 185–198. [Google Scholar] [CrossRef]
  19. Mandelbrot, B.B.; Passoja, D.E.; Paullay, A.J. Fractal character of fracture surfaces of metals. Nature 1984, 308, 721–722. [Google Scholar] [CrossRef]
  20. Chen, P.P.; Qi, L.H.; Zhang, X.B.; Ma, L.; Yang, G.; Qi, J. Analysis of heat–moisture coupling transfer for unsaturated soil under freezing and thawing based on fractal theory. Cold Reg. Sci. Technol. 2023, 206, 103744. [Google Scholar] [CrossRef]
  21. Ma, B.Y.; Hu, Q.H.; Yang, S.Y.; Zhang, T.; Qiao, H.; Meng, M.; Zhu, X.; Sun, X. Pore structure typing and fractal characteristics of lacustrine shale from Kongdian Formation in East China. J. Nat. Gas Sci. Eng. 2021, 85, 103709. [Google Scholar] [CrossRef]
  22. Jiang, S.F.; Su, Y. Application of fractal theory in the field of civil engineering. Eng. Mech. 2009, 26, 148–152. [Google Scholar]
  23. Zhu, W.H.; Ming, F.; Song, C.Z. Fractal Study of Rock Damage Destruction under Blasting Load. Geotech 2011, 32, 3131–3135. [Google Scholar]
  24. Luo, H.H.; Yang, R.S.; Ma, X.M. Study on the distribution characteristics of blockiness in fan-shaped deep hole blasting in Shilu iron ore mine. J. Min. Saf. Eng. 2023, 40, 371–377. [Google Scholar]
  25. Liu, X.R.; Zhou, W.G.; Xie, G.Y.; Peng, Y.L.; Liang, L.; Li, Y.J. The basis of application of fractal theory in mineral processing and research progress. J. China Coal Soc. 2023. [Google Scholar] [CrossRef]
  26. Shan Peng, F.; Yang, P.; Lai, X.P.; Sun, H.Q.; Guo, Z.A.; Gu, H.L.; Li, W.; Zhang, S. Experiment on the progressive damage law of oil-rich coal rocks under microwave-water interaction. J. Rock Mech. Eng. 2023. [Google Scholar] [CrossRef]
  27. Yu, K.J.; Li, C. A Study on The Application of Matlab-Based Fractal Theory in Medicine. Software 2019, 40, 111–116. [Google Scholar] [CrossRef]
  28. Li, H.H.; Luo, L.P.; Huang, L. Quantitative analysis of medical images of normal brain development in infants and children based on fractal theory. J. Biomed. Eng. 2011, 28, 18–21. [Google Scholar]
  29. Bagde, M.N.; Raina, A.K.; Chakraborty, A.K.; Jethwa, J.L. Rock mass characterization by fractal dimension. Eng. Geol. 2002, 63, 141–155. [Google Scholar] [CrossRef]
  30. Zhou, Z.L.; Cai, X.; Ma, D.; Chen, L.; Wang, S.; Tan, L. Dynamic tensile properties of sandstone subjected to wetting and drying cycles. Constr. Build. Mater. 2018, 182, 215–232. [Google Scholar] [CrossRef]
  31. Ren, J.J.; Zhang, W.L.; Ma, J. Experimental study on butterfly shape of failure zone and fractal characteristics of rock burst. Eng. Fail. Anal. 2022, 140, 106636. [Google Scholar] [CrossRef]
  32. GBT 50266-2013; Standard for Test Methods of Engineering Rock Mass. Standardization Administration of China: Beijing, China, 2013.
  33. Kulatilake, P.H.S.W.; Fiedler, R.; Panda, B.B. Box fractal dimension as a measure of statistical homogeneity of jointed rock masses. Eng. Geol. 1997, 48, 217–229. [Google Scholar] [CrossRef]
  34. Aia, T.; Zhang, R.; Zhou, H.W. Box-counting methods to directly estimate the fractal dimension of a rock surface. Appl. Surf. Sci. 2014, 314, 610–621. [Google Scholar] [CrossRef]
  35. Wu, M.; Wang, W.; Shi, D.; Song, Z.; Li, M.; Luo, Y. Improved box-counting methods to directly estimate the fractal dimension of a rough surface. Measurement 2021, 177, 109303. [Google Scholar] [CrossRef]
  36. Yahaghi, J.; Liu, H.; Chan, A.; Fukuda, D. Experimental and numerical studies on failure behaviours of sandstones subject to freeze-thaw cycles. Transp. Geotech. 2021, 31, 100655. [Google Scholar] [CrossRef]
  37. Bour, O.; Davy, P.; Darcel, C.; Odling, O. A statistical scaling model for fracture network geometry, with validation on a multiscale mapping of a joint network (Hornelen Basin, Norway). J. Geophys. Res. Solid Earth 2002, 107, ETG 4-1–ETG 4-12. [Google Scholar] [CrossRef]
  38. Lu, Y.; Liu, S.; Weng, L.; Wang, L.; Li, Z.; Xu, L. Fractal analysis of cracking in a clayey soil under freeze–thaw cycles. Eng. Geol. 2016, 208, 93–99. [Google Scholar] [CrossRef]
  39. Wang, S.; Li, X.; Yao, J.; Gong, F.; Li, X.; Du, K.; Tao, M.; Huang, L.; Du, S. Experimental investigation of rock breakage by a conical pick and its application to non-explosive mechanized mining in deep hard rock. Int. J. Rock Mech. Min. Sci. 2019, 122, 104063. [Google Scholar] [CrossRef]
  40. Lin, Z.J.; Niu, F.J.; Liu, H.; Lu, J.H. Influence of cyclic freezing and thawing on the physical and mechanical properties of permafrost road base boulders. Rock Soil Mech. 2011, 32, 1369–1375. [Google Scholar]
  41. Li, J.-L.; Zhou, K.-P.; Liu, W.-J.; Deng, H.-W. NMR research on deterioration characteristics of microscopic structure of sandstones in freeze−thaw cycles. Trans. Nonferr. Met. Soc. China 2016, 26, 2997–3003. [Google Scholar] [CrossRef]
  42. Tan, H.; Song, Y.J.; Guo, X.X.; Meng, F.D.; Han, D.Y.; Sun, Y.W. Study on fine view damage and strain localization in freeze-thaw fractured sandstone. Chin. J. Rock Mech. Eng. 2022, 41, 2485–2495. [Google Scholar]
  43. Yang, G.S.; Shen, Y.J.; Jia, H.L.; Wei, Y.; Zhang, H.M.; Liu, H. Multiscale study and progress of mechanical properties of rock damage in freeze-thaw environment. Chin. J. Rock Mech. Eng. 2018, 37, 545–558. [Google Scholar]
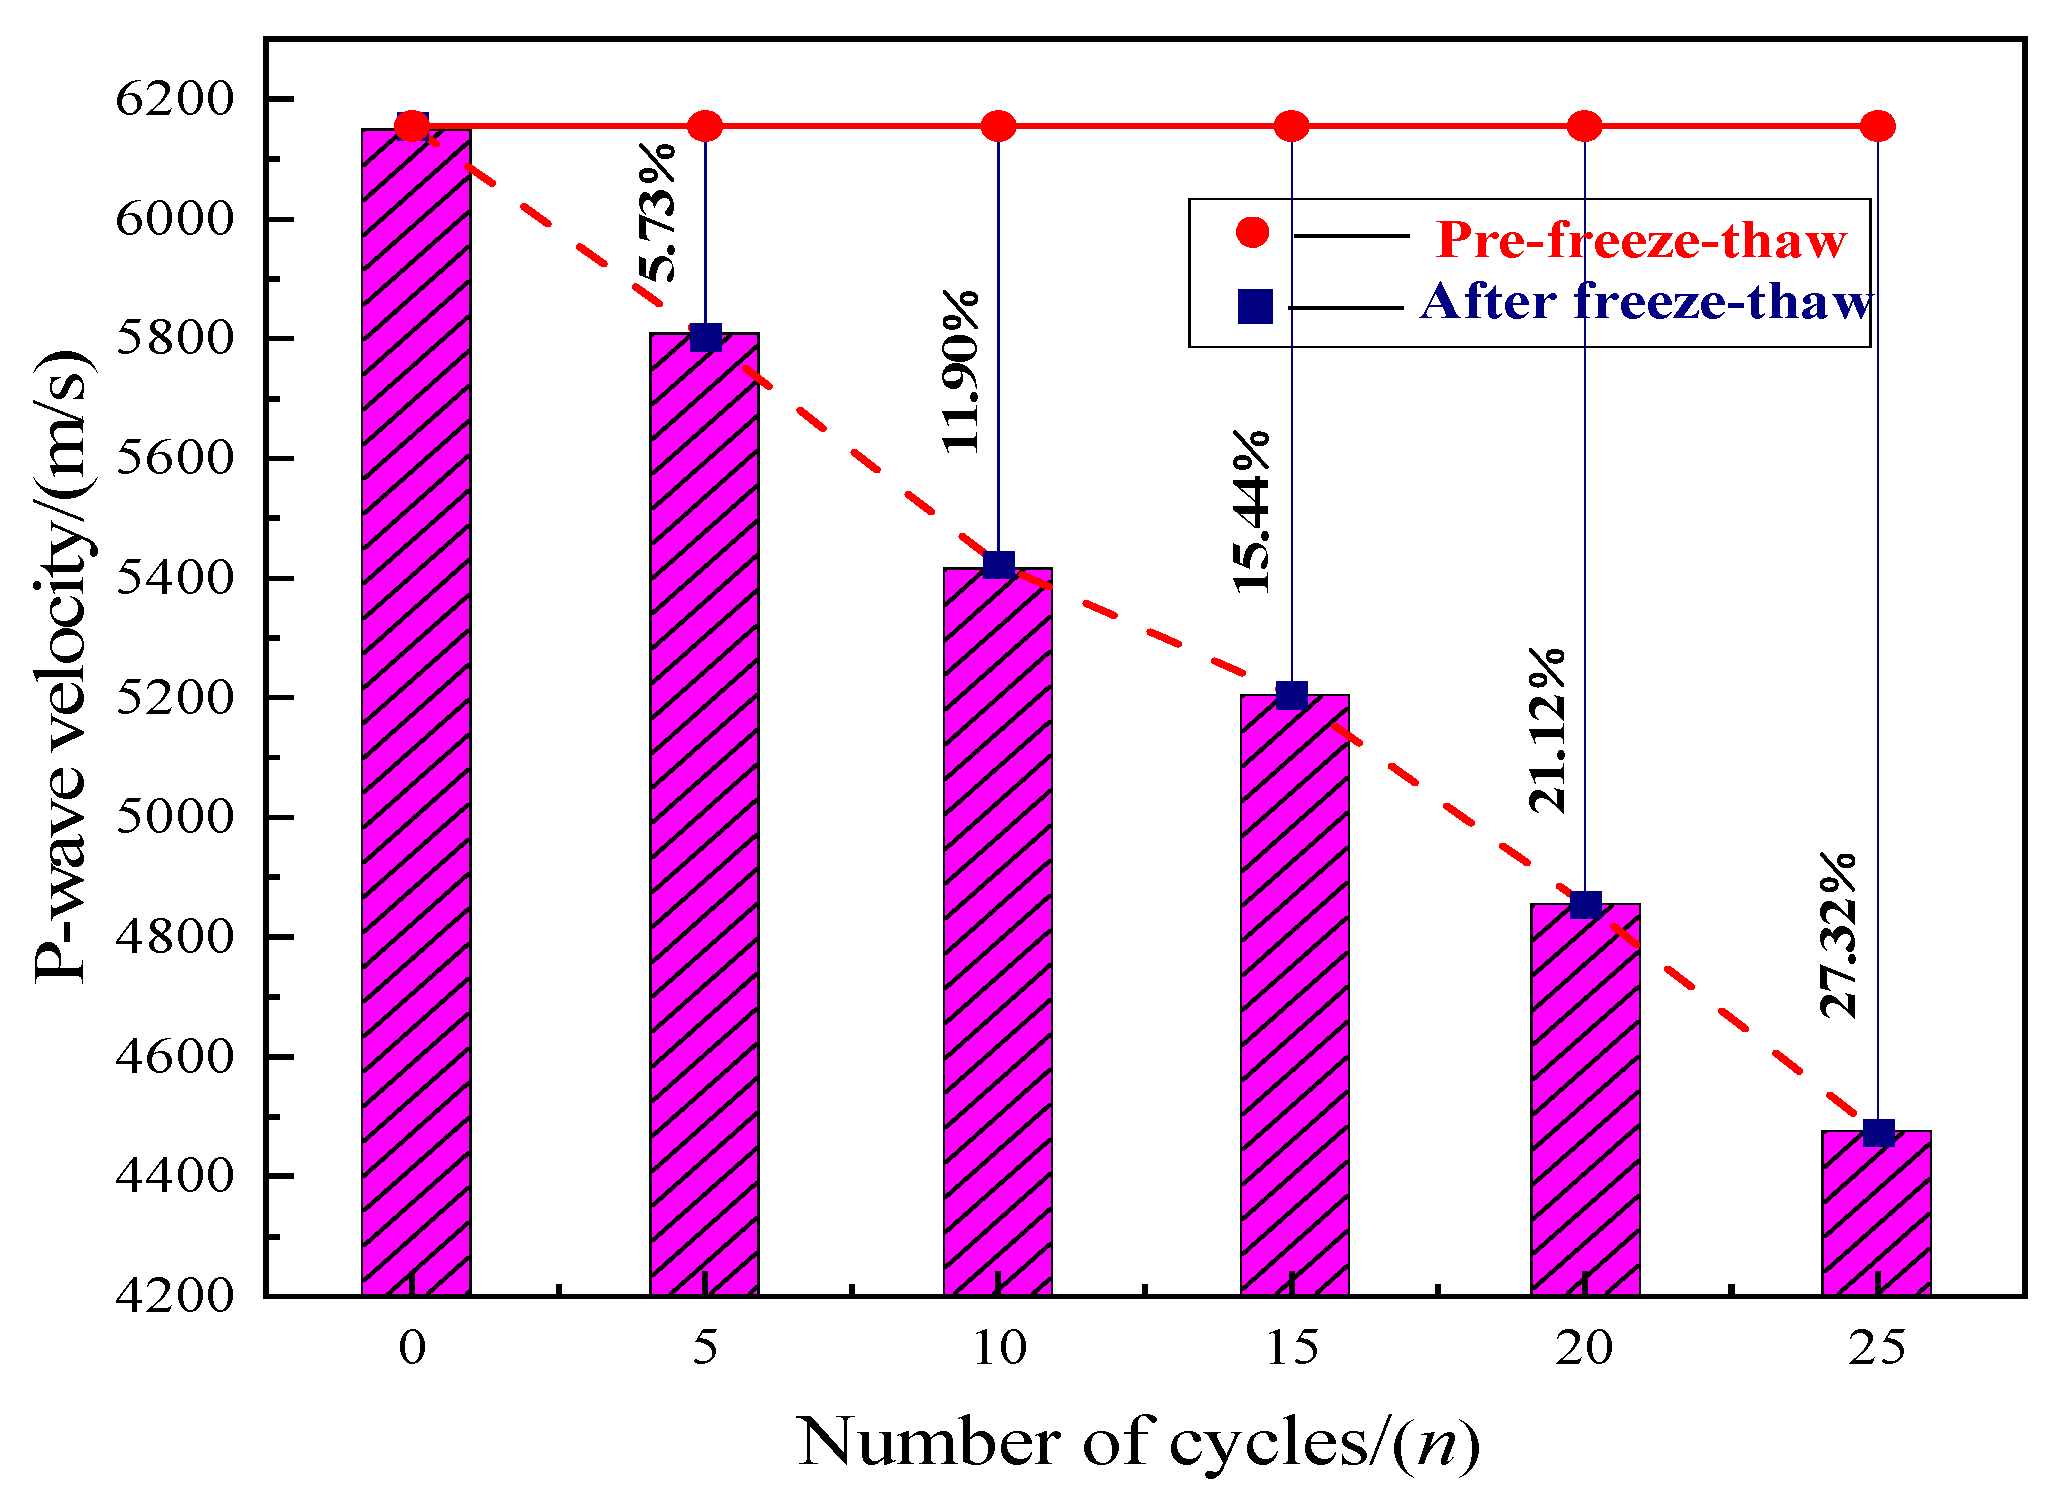
Figure 4. P-wave velocity of silica after different numbers of freeze-thaw cycles.
Fractalfract 07 00354 g004
Figure 5. Stress–strain curve.
Fractalfract 07 00354 g005
Figure 6. Elastic Phase Fitting Curve.
Fractalfract 07 00354 g006
Figure 7. Variation pattern of the compressive strength of the skarn specimens versus number of cycles.
Fractalfract 07 00354 g007
Figure 9. SEM images (1000×) of silica at different numbers of freeze-thaw cycles.
Fractalfract 07 00354 g009
Figure 10. The relationship law between the fractal dimension and compressive strength.
Fractalfract 07 00354 g010
Table 1. Mineral composition of skarn.
Mineral/%PyroxeneFeldsparChloriteMicaQuartz
Number
No.151.620.815.38.53.8
No.253.419.514.59.13.5
No.348.918.316.712.83.9
Table 2. Changes in mass of specimens before and after freezing and thawing.
Number of Cycles/nSpecimen NumberBefore Freezing and Thawing/gAfter Freezing and Thawing/gPoor Quality/gMass Change Rate/%Average Mass Change Rate/%
0FT-0-1569.51569.51000
FT-0-2583.5583.500
FT-0-3585.38585.3800
5FT-5-1581.49585.694.20.720.85
FT-5-2556.17562.266.091.09
FT-5-3579.18583.364.180.72
10FT-10-1557.64565.838.191.471.27
FT-10-2578.71583.865.150.89
FT-10-3582.15590.688.531.47
15FT-15-1578.17587.869.691.681.75
FT-15-2553.91562.989.071.64
FT-15-3557.15567.9610.811.94
20FT-20-1582.35586.894.540.780.96
FT-20-2582.81587.544.730.81
FT-20-3582.14589.647.51.29
25FT-25-1580.53584.654.120.710.57
FT-25-2578.04581.343.30.57
FT-25-3584.8587.382.580.44
Table 3. Peak compressive strength.
Number of Cycles/nSpecimen NumberPeak Compressive Strength/MPaAverage Peak Compressive Strength/MPaLoss Rate/%
0FT-0-1279.18275.350
FT-0-2270.63
FT-0-3276.25
5FT-5-1269.48266.153.35
FT-5-2265.02
FT-5-3263.97
10FT-10-1244.83249.059.56
FT-10-2250.95
FT-10-3251.37
15FT-15-1228.49233.7515.12
FT-15-2237.55
FT-15-3235.21
20FT-20-1222.46226.3517.81
FT-20-2225.21
FT-20-3231.38
25FT-25-1217.03221.6919.50
FT-25-2221.89
FT-25-3226.16
Table 4. Modulus of elasticity and Poisson’s ratio of specimens at different cycle times.
Number of Cycles/nSpecimen NumberModulus of Elasticity/GPaAverage Modulus of Elasticity/GPaLoss Rate/%Poisson’s Ratio
00-142.7142.7800.22
0-243.95
0-341.68
55-137.4941.064.020.20
5-242.95
5-342.74
1010-142.7440.096.280.18
10-238.38
10-340.67
1515-142.1439.527.620.17
15-236.02
15-340.41
2020-139.7438.889.110.17
20-237.23
20-339.67
2525-138.4138.569.860.16
25-239.04
25-338.23
Table 5. Fractal dimensions based on SEM images.
Number of CyclesFitting FormulaGoodness of FitFractal Dimension
0y = −1.8964x + 0.1714R2 = 0.9991.896
5y = −1.906x + 0.1570R2 = 0.9991.906
10y = −1.9146x + 0.1434R2 = 0.9991.915
15y = −1.923x + 0.1394R2 = 0.9991.923
20y = −1.9257x + 0.1303R2 = 0.9991.926
25y = −1.9371x + 0.1121R2 = 0.9991.937
Disclaimer/Publisher’s Note: The statements, opinions and data contained in all publications are solely those of the individual author(s) and contributor(s) and not of MDPI and/or the editor(s). MDPI and/or the editor(s) disclaim responsibility for any injury to people or property resulting from any ideas, methods, instructions or products referred to in the content.