Article

Fractal Analysis of Porous Alumina and Its Relationships with the Pore Structure and Mechanical Properties

1
College of Materials Science and Engineering, Xi’an University of Architecture and Technology, Xi’an 710055, China
2
School of Resources Engineering, Xi’an University of Architecture and Technology, Xi’an 710055, China
*
Author to whom correspondence should be addressed.
Fractal Fract. 2022, 6(8), 460; https://doi.org/10.3390/fractalfract6080460
Submission received: 20 July 2022 / Revised: 9 August 2022 / Accepted: 16 August 2022 / Published: 21 August 2022

Abstract

:
Porous alumina was prepared by the sacrificial template approach using 30 vol.%, 50 vol.%, and 70 vol.% of carbon fibers and graphite as pore formers. In order to determine the pore size distribution, porosity, most probable pore size, and median pore size, a mercury intrusion porosimeter (MIP) was used. The surface fractal dimensions (Ds) of porous alumina with various pore formers were assessed based on MIP data. The findings revealed that the pore size distribution of the prepared porous alumina was either bimodal or trimodal at 50 vol.% of the pore formers, and unimodal at 30 vol.% and 70 vol.% of the pore formers in the raw materials. The porous alumina’s pore structure and morphology varied depending on the volume content of the pore formers and their shapes. The porosity and pore size of the porous alumina increased with the increase in carbon fiber content because the carbon fiber was unfavorable to the densification of the initial billet before sintering. After sintering, there were no residual pore formers other than alumina in the samples. The pore structure of the porous alumina samples showed prominent fractal characteristics, and its DS decreased with the increase in the pore former content. The samples’ Ds was highly negatively correlated with the pore structure parameters, and was positively correlated with the flexural strength.

1. Introduction

Over the last few decades, interest in producing and using porous ceramic materials has increased significantly [1,2,3,4,5,6]. Porous alumina ceramics are widely employed in catalyst carriers, molten metal filters, heat protection systems, heat exchangers, biomaterials, and other fields due to their high melting point, high corrosion resistance, controlled permeability, high surface area, and low density [3,7,8,9,10]. The pore sizes, morphology, and degree of interconnection are also crucial factors affecting the potential applications of these materials [11,12].
Recently, there has been growth in various porous ceramic materials with relatively low surface areas in several fields where macroporosity is also desired. The large surface area produced by the material’s microporosity provides efficient adsorption and catalytic properties, where the macroporosity enhances the diffusion of fluids into the microporosity [13,14]. For bioreactors, enzymes or bacteria are immobilized in tiny pores, while large, open pores are employed as channels or gas diffusion paths for transporting reactants. For electrodes in fuel cells, multimodal porous structures with a wide pore size distribution are also required, which provide tiny pores for electrochemical reactions and large pores for gas diffusion paths [15,16].
Thus, multimodal porous ceramics require the development of specific structures within the material and controlling the volume fraction, size, and geometry of pores. One of the most feasible methods is the use of sacrificial template approaches, where spatial scaffolds (e.g., fibers or cotton-like threads) are arranged in a ceramic paste that acts as a short-acting pore-forming agent. In terms of the pore size and structure, and the performance of the final material, process control remains a significant challenge for all of the mentioned approaches.
Recently, the effects of some pore structure parameters on the properties of porous ceramic materials were examined [17,18,19,20]. Although porous ceramics differ in their porosity and pore size, their strength may also be influenced by other pore-related properties, namely pore size distribution, median pore size, and the most available few pore sizes, which have been neglected. Therefore, more careful consideration of the dependence of pore properties on ceramic properties is essential for the design, preparation, and application of porous ceramics. Therefore, it is also critical to seek effective approaches for practical and accurate quantification.
With the development of fracture mechanics, pore structure, and fractal theory, some porous material structures have significant fractal characteristics [21,22,23,24,25,26,27,28,29,30,31]. The microstructure and associated physicochemical properties of materials can be described in fractal dimensions. However, the microstructures of actual porous materials may be more complex, and may almost be obtained from these ideal fractal geometries. In addition to porosity, pore size distribution, and pore surface area, pore surface fractals are also considered to be primary microstructural parameters [32]. Furthermore, a mercury intrusion porosimeter (MIP) has the advantages of producing simple and rapid experiments, and the being able to measure a wide range pore sizes; it is the most commonly employed method in the investigation of the pore structure of porous materials [32]. The current MIP analysis of porous ceramics focuses only on pore size distribution characteristics, while surface fractal dimension analysis can be employed to investigate pore morphological characteristics. Therefore, it can be employed to complement existing analytical approaches for MIP measurements, and the understanding of the pore structure characteristics of porous ceramic materials is enhanced.
In this study, carbon fiber and graphite with various morphologies and dimensions were employed as pore formers. The porous alumina samples with various porosities were prepared by adjusting the pore former content and using the sacrificial template approach of atmospheric pressure sintering. The surface fractal dimensions (Ds) of porous alumina with various pore former contents were also assessed based on the MIP data. The relationship between the fractal dimensions and the pore structure and flexural strength was examined in detail.

2. Materials and Methods

2.1. Raw Materials

α-calcined alumina powder (CT3000SG, Almatis GmbH, Ludwigshafen, Germany) was employed as the ceramic phase, which was characterized by an average particle size of 0.5 μm and a specific surface area of 7.5 m2 g−1. At 20 °C ± 5 °C, the densities of carbon fiber and graphite powder measured using a helium-specific gravity bottle (AccuPyc 1330, Micromeritics Ltd., Unterschleißheim, Germany) were 1.75 × 10³ kg·m−3 and 2.25 × 10³ kg·m−3, respectively. Milled carbon fiber with an average diameter of 14.5 μm and a length of 90 μm was purchased from East Bontanet Ltd. in Germany, and the average diameter of the graphite powder was 28.7 μm, as confirmed by light diffraction (Malvern Instruments, Worcestershire, UK), as illustrated in Figure 1. The carbon fiber and graphite were employed as pore formers; the carbon fiber was in the form of a fiber, and the graphite was in the form of a flake.

2.2. Preparation of Porous Alumina

Different volume fractions of carbon fiber and graphite relative to the above alumina were employed as the pore-forming agents in order to prepare porous materials. The sample mixtures were attrition milled with alumina milling media using ethanol as a solvent for 2 h. Then, the ground slurry was dried for 12 h and sieved through a 200 μm sieve. Subsequently, the powder was pressed into rods of 47 mm in length and 7 mm in width through a uniaxial press with a steel die at 125 MPa for 20 s and a cold isostatic press at 500 MPa for 2 min. Finally, it was sintered at 1550 °C for 2 h at a heating rate of 1 °C min−1 in an air atmosphere, and was cooled from the sintering temperature to 300 °C at a cooling rate of 10 °C min−1. During the sintering process, the internal pore-forming agent underwent a combustion reaction, and the porous alumina materials were prepared in situ.
As Figure 2 illustrates, the porosity of the porous alumina samples was first determined using 50 vol.%, 70 vol.%, 80 vol.%, and 90 vol.% of pore formers in order to determine the reasonable content range of the pore former. Furthermore, 1:1 was the ratio of carbon fiber and graphite. The porous samples’ porosity increased with an increase in the pore former content up to 83 vol.%. However, the porous samples’ porosity decreased with the increase in the volume fraction of the pore former when the pore former content exceeded 83 vol.%. Because the pores generated by the pore former are compressed or destroyed by the matrix, the pore structure parameters can no longer be characterized by the fractal dimension. Thus, the volume fractions of pore formers were 30 vol.%, 50 vol.%, and 70 vol.% based on the above experimental results, and Table 1 shows the specific ratios.

2.3. Characterization Methods

The bulk densities and total porosities of the samples were measured by the Archimedes approach employing glycerol solution, according to ASTM C373–88. The sample surfaces were ground by employing commercial 180 to 800 grit, and were polished using commercial 2400 grit. The samples were ultrasonically cleaned in ethanol for 10 min after polishing. The sintered samples’ crystal structures were analyzed using X-ray diffraction analysis and Cu Kα radiation (D8 Discover, AXS Bruker, Karlsruhe, Germany). The flexural strength was measured on samples of 3 mm × 4 mm × 30 mm using a four-point flexural test with an inner and outer span of 10 mm and 20 mm, respectively. The crosshead speed for the measurement of the strength was 0.5 mm min−1. The section’s microstructures were then observed using a scanning electron microscope (LEO 1530 FESEM, Gemini/Zeiss, Oberkochen, Germany). The samples’ pore size distribution and open porosity were measured by MIP (AutoPore IV 9500 V1.04, Micromeritics GmbH, Unterschleißheim, Germany). The contact angle and surface tension employed for the computations were 141.3° and 485 × 10−3 N m−1, respectively.
The Ds of the pore surface was computed by employing a fractal model based on the thermodynamic method derived by Zhang and Li to accurately quantify the pore size distribution parameters, and to understand the impact of various contents of pore formers on the mechanical properties of porous alumina materials [33]. The model was extensively employed, and was confirmed to be an accurate model for the description of Ds.
Zhang and Li proposed a logarithmic scaling relationship between the cumulative intrusion work Wn and the cumulative mercury intrusion surface Qn through Equation (1):
ln W n = C + ln Q n
where C represents the product of the surface tension and the mercury contact angle cosine, and the subscript n denotes a specific intrusion stage. Assuming that, in this intrusion stage, the pressure used in the injection of mercury in phase i was Pi, Pa; the volume of mercury injected into the pore was Vi, m3; the accumulated mercury volume was Vn, m3; and the smallest pore radius was rn, m. Then, the intrusion work Wn and the intrusion surface Qn were computed using Equations (2) and (3).
W n = i n P i Δ V i
Q n = r n 2 D V n D / 3
Here, D represents the pore surface’s actual size. Then, the equation can be rearranged as Equation (4).
ln W n r n 2 = D S ln V n 1 / 3 r n + C
The Wn, Vn, ln W n r n 2 , and ln V n 1 3 r n values can be computed and then plotted with ln V n 1 / 3 r n as the x-axis and ln W n r n 2 as the y-axis based on the collected MIP data and Equations (2) and (3), and then Ds is also the fitted line of the slope, which can be examined according to Equation (4).

3. Results and Discussion

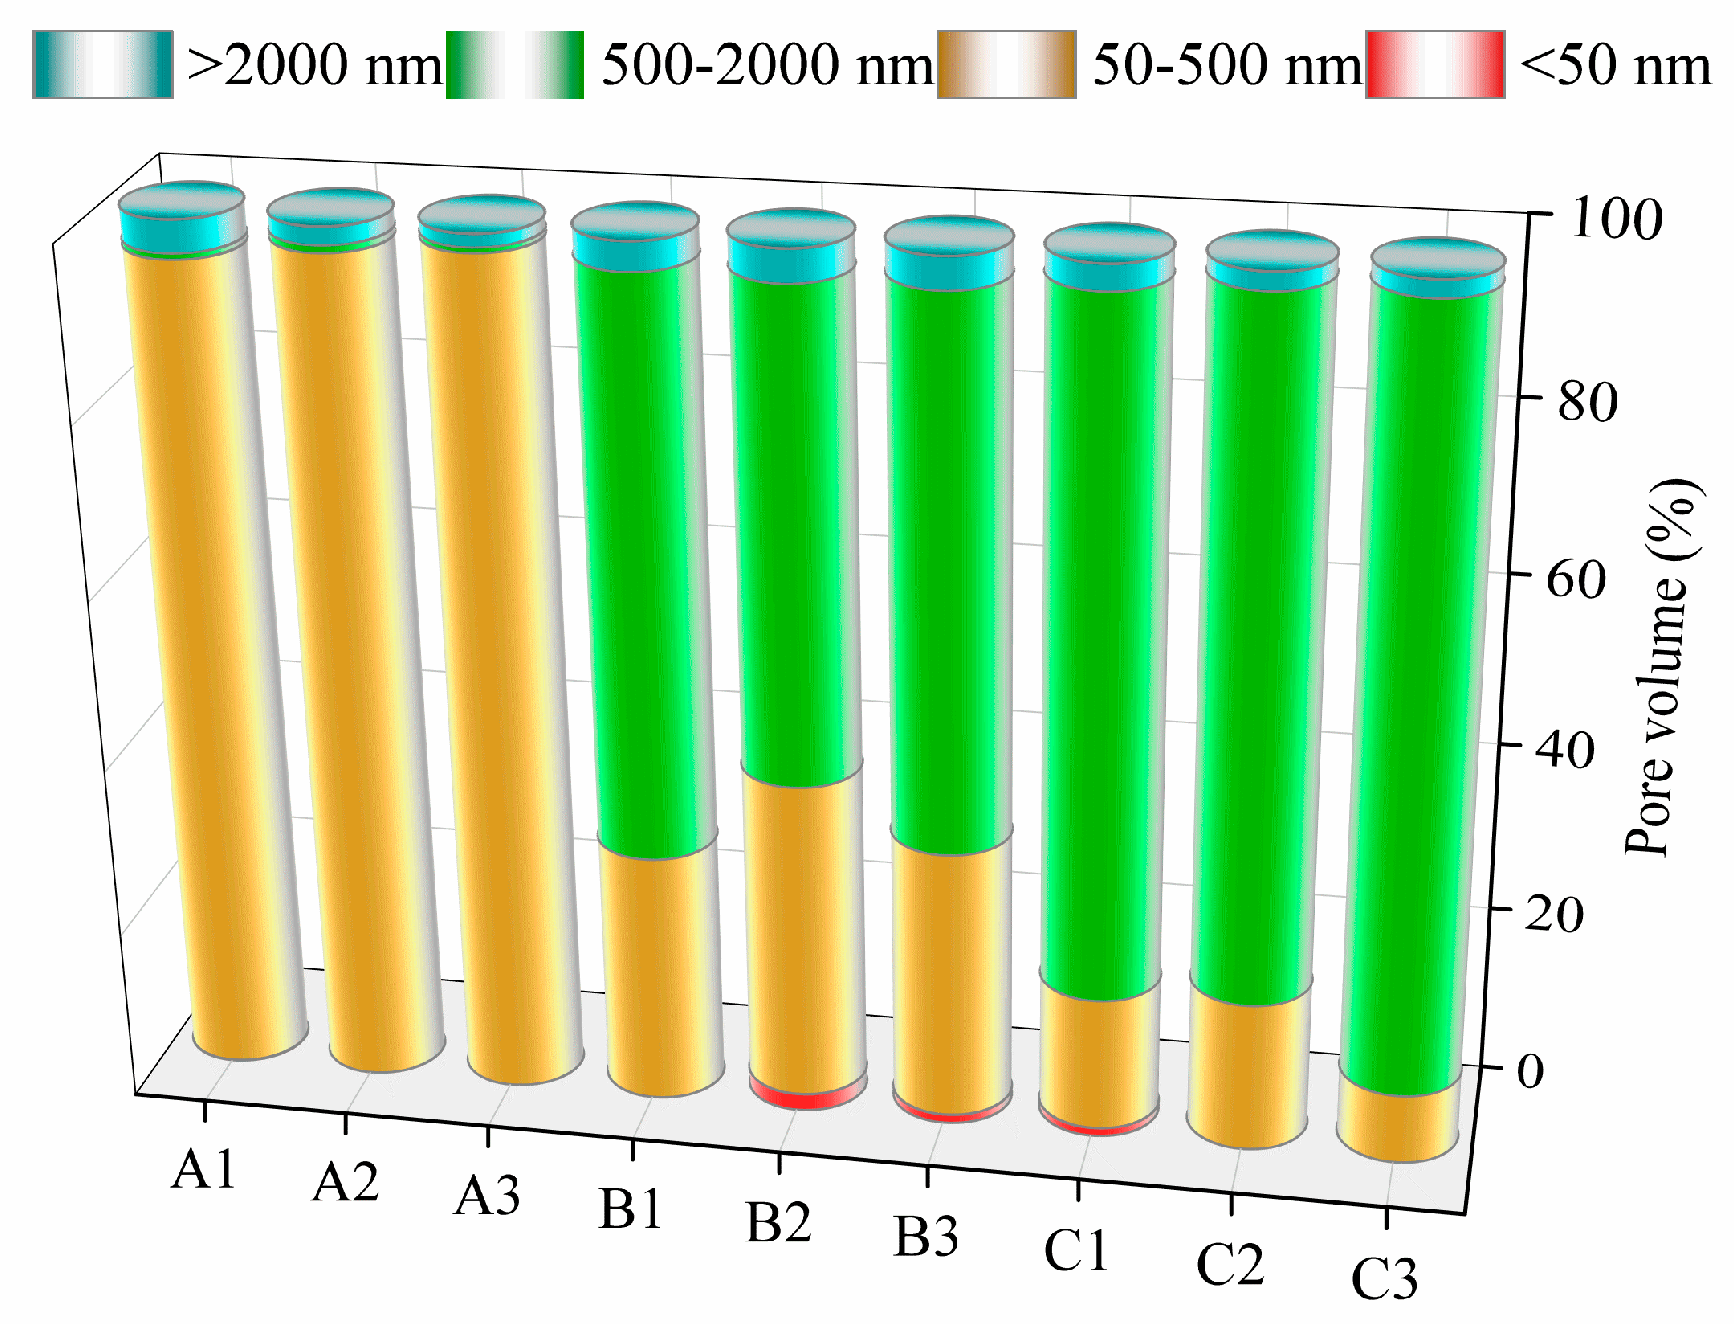
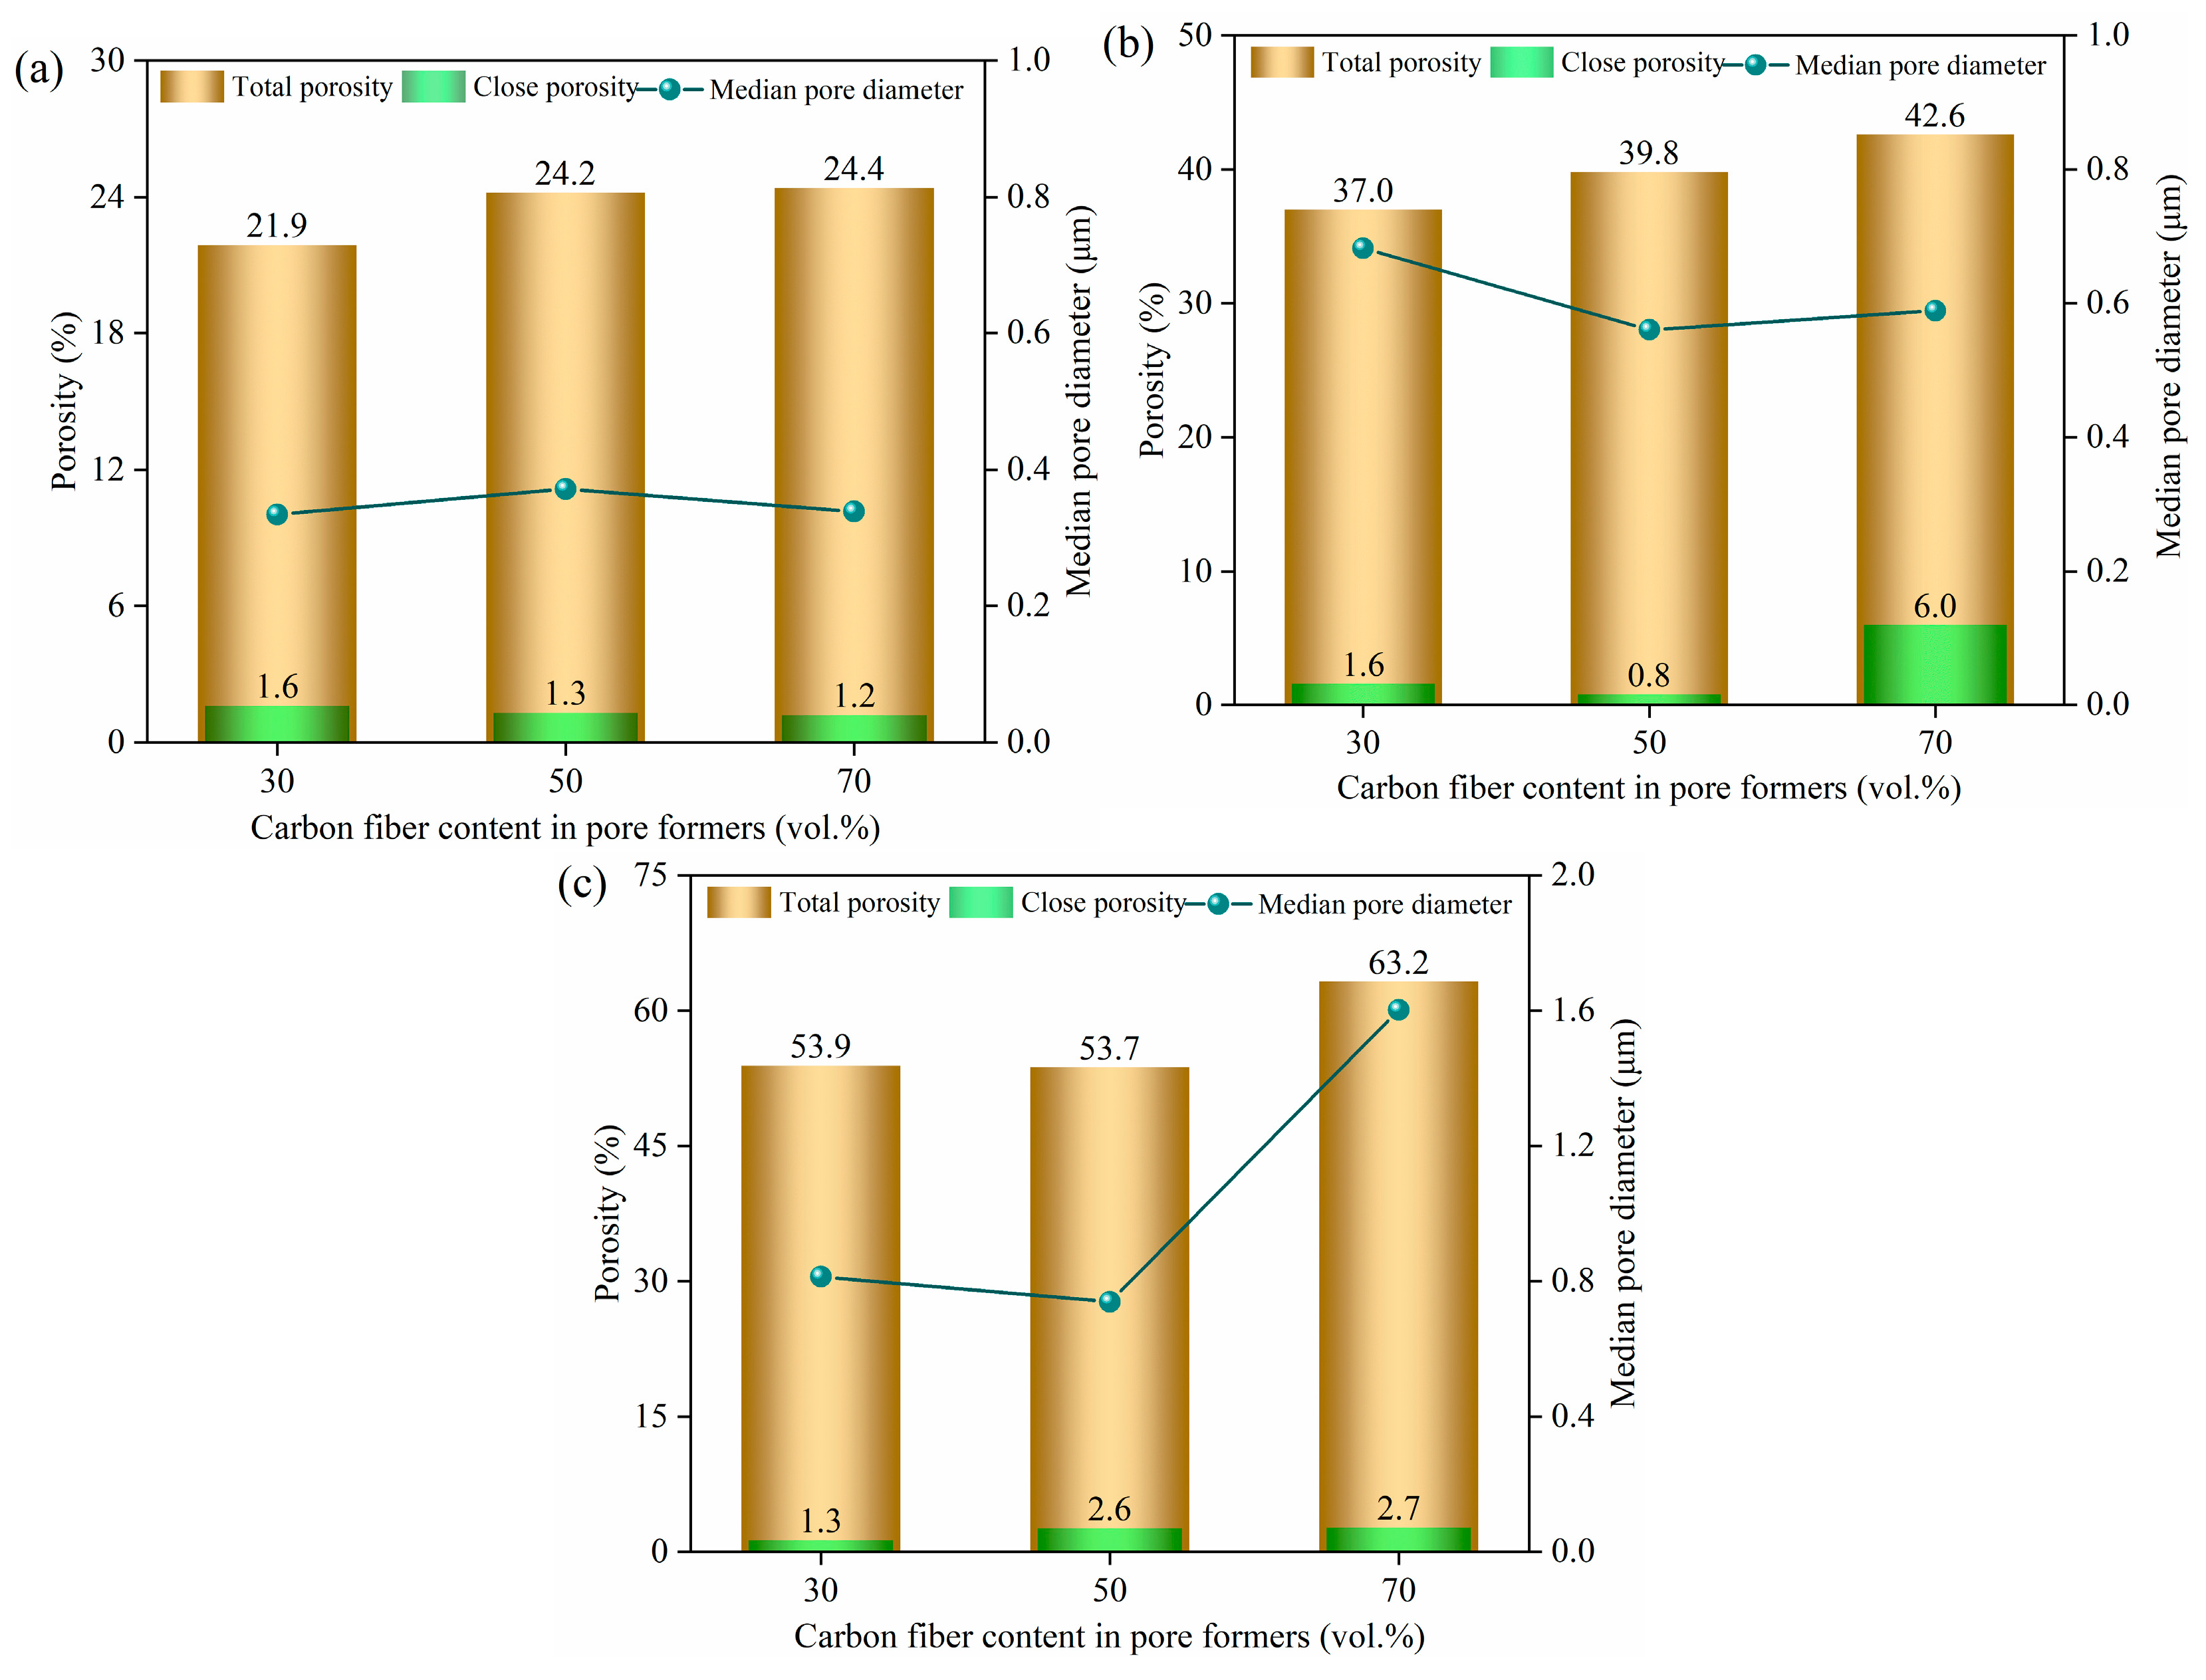
3.1. Effect of Pore Formers on the Bulk Density, Linear Shrinkage, Pore Size Distribution, and Porosity of the Porous Alumina

Figure 3 demonstrates the bulk densities and linear shrinkage of the porous alumina samples with various pore formers. The pore formers substantially influenced the samples’ structure and properties. The samples’ bulk densities for groups A, B, and C decreased with the increase in the content of carbon fiber in the pore former, as demonstrated in Figure 3a. Furthermore, the samples’ bulk densities decreased with the increase in the volume fraction of the pore former because the graphite and carbon fiber burned sufficiently at the sintering temperature of 1550 °C.
Additionally, the linear shrinkage for the porous alumina samples increased gradually as the volume fraction of the pore formers in the raw materials increased, as shown in Figure 3b. However, the variation tendencies of the linear shrinkage for groups A, B, and C were different. The linear shrinkage of group A’s samples first decreased and then increased when the carbon fiber content in the pore former increased. The linear shrinkage was the lowest, and the value was 16.9% for the 50 vol.% of carbon fiber relative to graphite. The sample’s linear shrinkage demonstrated a gradually decreasing trend for group B. The sample’s linear shrinkage was the lowest, and the value was 18.9% when the carbon fiber content was 70 vol.% relative to graphite. For group C, the line shrinkage demonstrated a trend of increasing first and then decreasing. The line shrinkage had the lowest value of 19.0% when the carbon fiber content was 70 vol.% relative to the graphite. The above findings showed that the linear shrinkage was correlated with the volume fraction of the pore former and the ratio between carbon fiber and graphite. The linear shrinkage and bulk densities for group B decreased with the increase in carbon fiber content in the pore formers. The increase in linear shrinkage made the volume of the materials lower when the sample mass was certain. However, groups A and C demonstrated various patterns because of the shape of the carbon fibers and graphite.
Figure 4 demonstrates the porous alumina samples’ pore size distribution when prepared with various ratios of carbon fiber and graphite. The A1–A3 samples’ most probable pore sizes were 440 nm, 425 nm, and 376 nm, respectively, which implies that the average pore sizes of porous alumina decreased as the carbon fiber content increased. Furthermore, the B1–B3 samples’ most probable pore sizes lacked a specific pattern of variation, and the pore size distribution was either bimodal or trimodal. The large pore sizes were produced from the combustion of carbon fiber and graphite. The pores’ tiny pore sizes were generated through sintering among alumina particles. The large pore size was on the micron scale, and the small pore size was on the nanometer scale for the B1 and B3 samples’ bimodal and trimodal pore size distributions. The B2 sample’s bimodal pore size distributions were all nanoscale pores. The most probable pore size of the C1–C3 samples demonstrated that the pore size distribution of porous alumina ceramic samples was unimodal. When the carbon fiber content increased from 30 vol.% to 50 vol.%, the most probable pore size change was insignificant. However, the most probable pore size demonstrated a substantial increase as the carbon fiber content increased to 70 vol.%.
Figure 5 shows the contribution of the pore volume with various pore formers. The volume fraction of >500 nm pores showed an increasing trend as the volume fraction of the pore former increased. The volume fraction of pores in the range of 50–500 nm was primarily offered by the pores in group A. The volume fraction of pores in the range increased with the increase of the carbon fiber content, and the volume fraction of >500 nm pores decreased, which was consistent with the most probable pore size’s variation pattern in Figure 4a. The pore volume of >500 nm pores of group B demonstrated a trend of decreasing and then increasing, and the pore volume fraction in the pore diameter range was the lowest when the carbon fiber content was 50 vol.%. The pore volume was primarily offered by the pores in the range of 500–2000 nm, and the volume fraction of >500 nm pores gradually increased when the content of the pore former continued to increase to 70 vol.%. The volume fraction of >500 nm pores was 91.79% when the carbon fiber content was 70 vol.%.
The physical properties of the porous alumina measured by MIP are demonstrated in Figure 6. The porous alumina samples’ porosity increased as the volume content of the pore former increased. However, the open porosity and median pore sizes demonstrated various trends. The closed porosity gradually decreased as the volume proportion of the carbon fiber in the pore former increased for group A, but the median pore size had no substantial change. Additionally, group A’s pore size distribution was unimodal because the porous alumina samples’ closed pore content was relatively high and the MIP only measured the pore size distribution of open pores in the samples.
The samples’ closed porosity and median pore size in group B both demonstrated a trend of decreasing and then increasing with the increase of the carbon fiber content. The samples’ closed porosity demonstrated a substantial increase when the carbon fiber content increased from 50 vol.% to 70 vol.% because the disordered distribution of carbon fiber and graphite caused the pore-forming agents to lap or overlap each other. The closed porosity gradually increased with the increase of the proportion of carbon fiber in the pore former for group C. The median pore size demonstrated a trend of decreasing and then increasing. The possibility of mutual contact between the pore formers was increased, and the contact between the pore formers was more complex because the content of carbon fiber and graphite was high in group C. Therefore, the mutual contact between graphite resulted in the generation of a larger pore size compared to the carbon fiber.

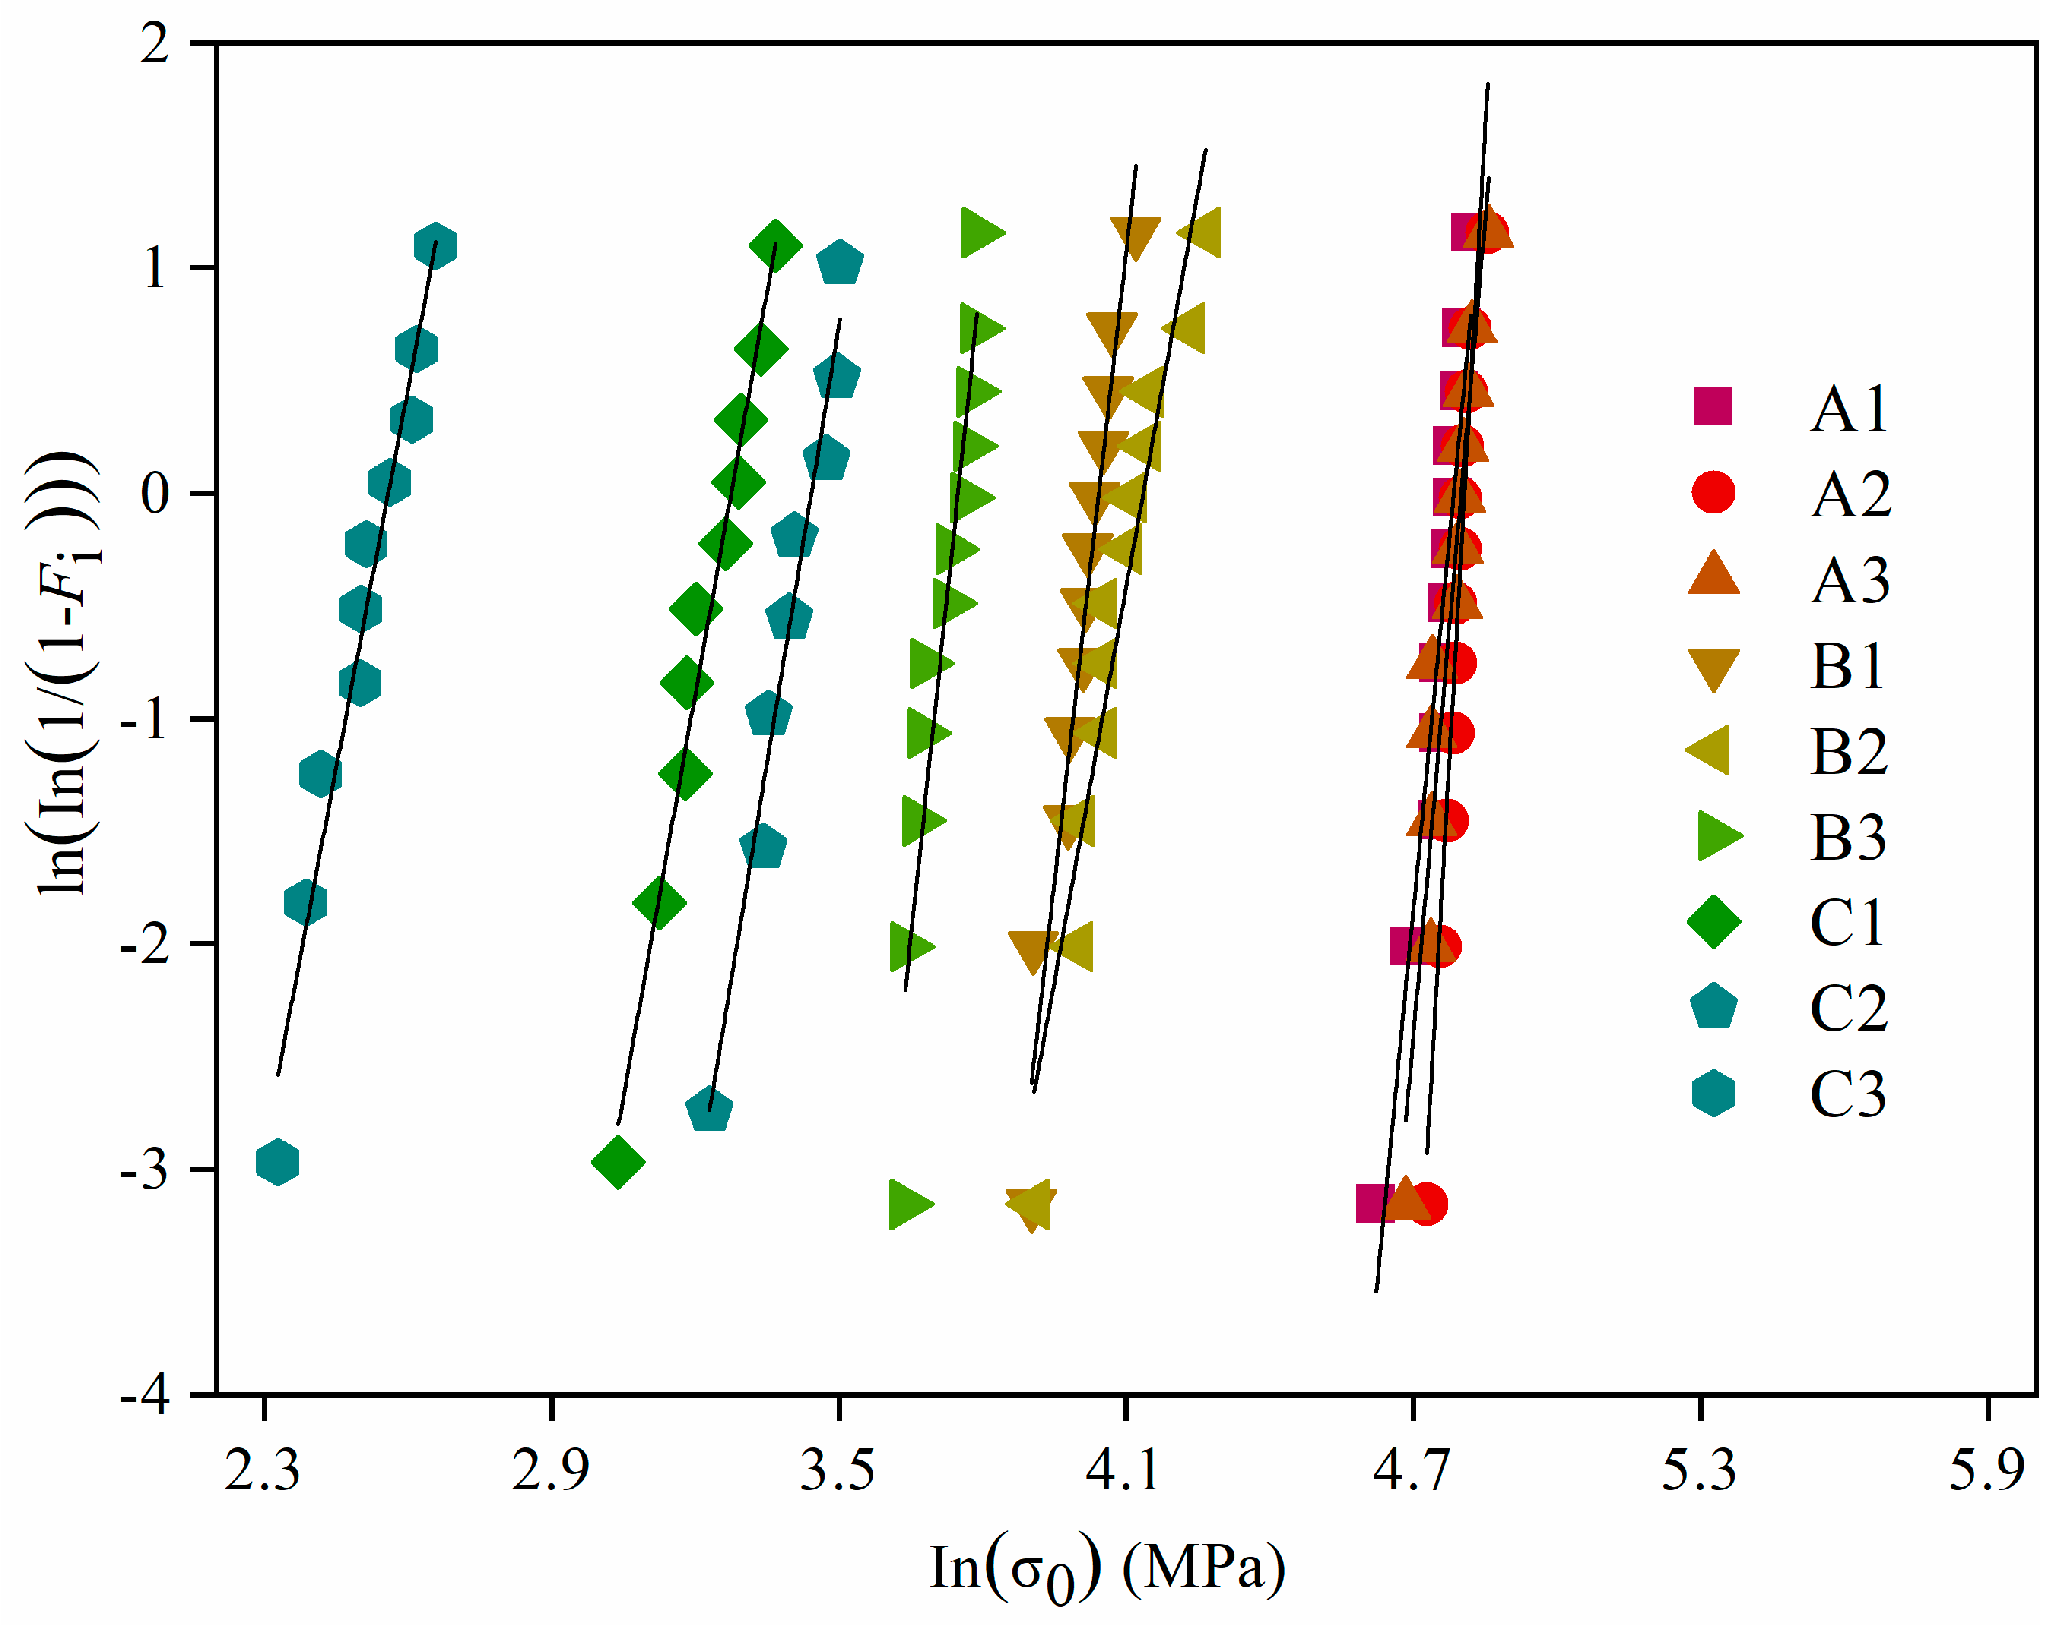
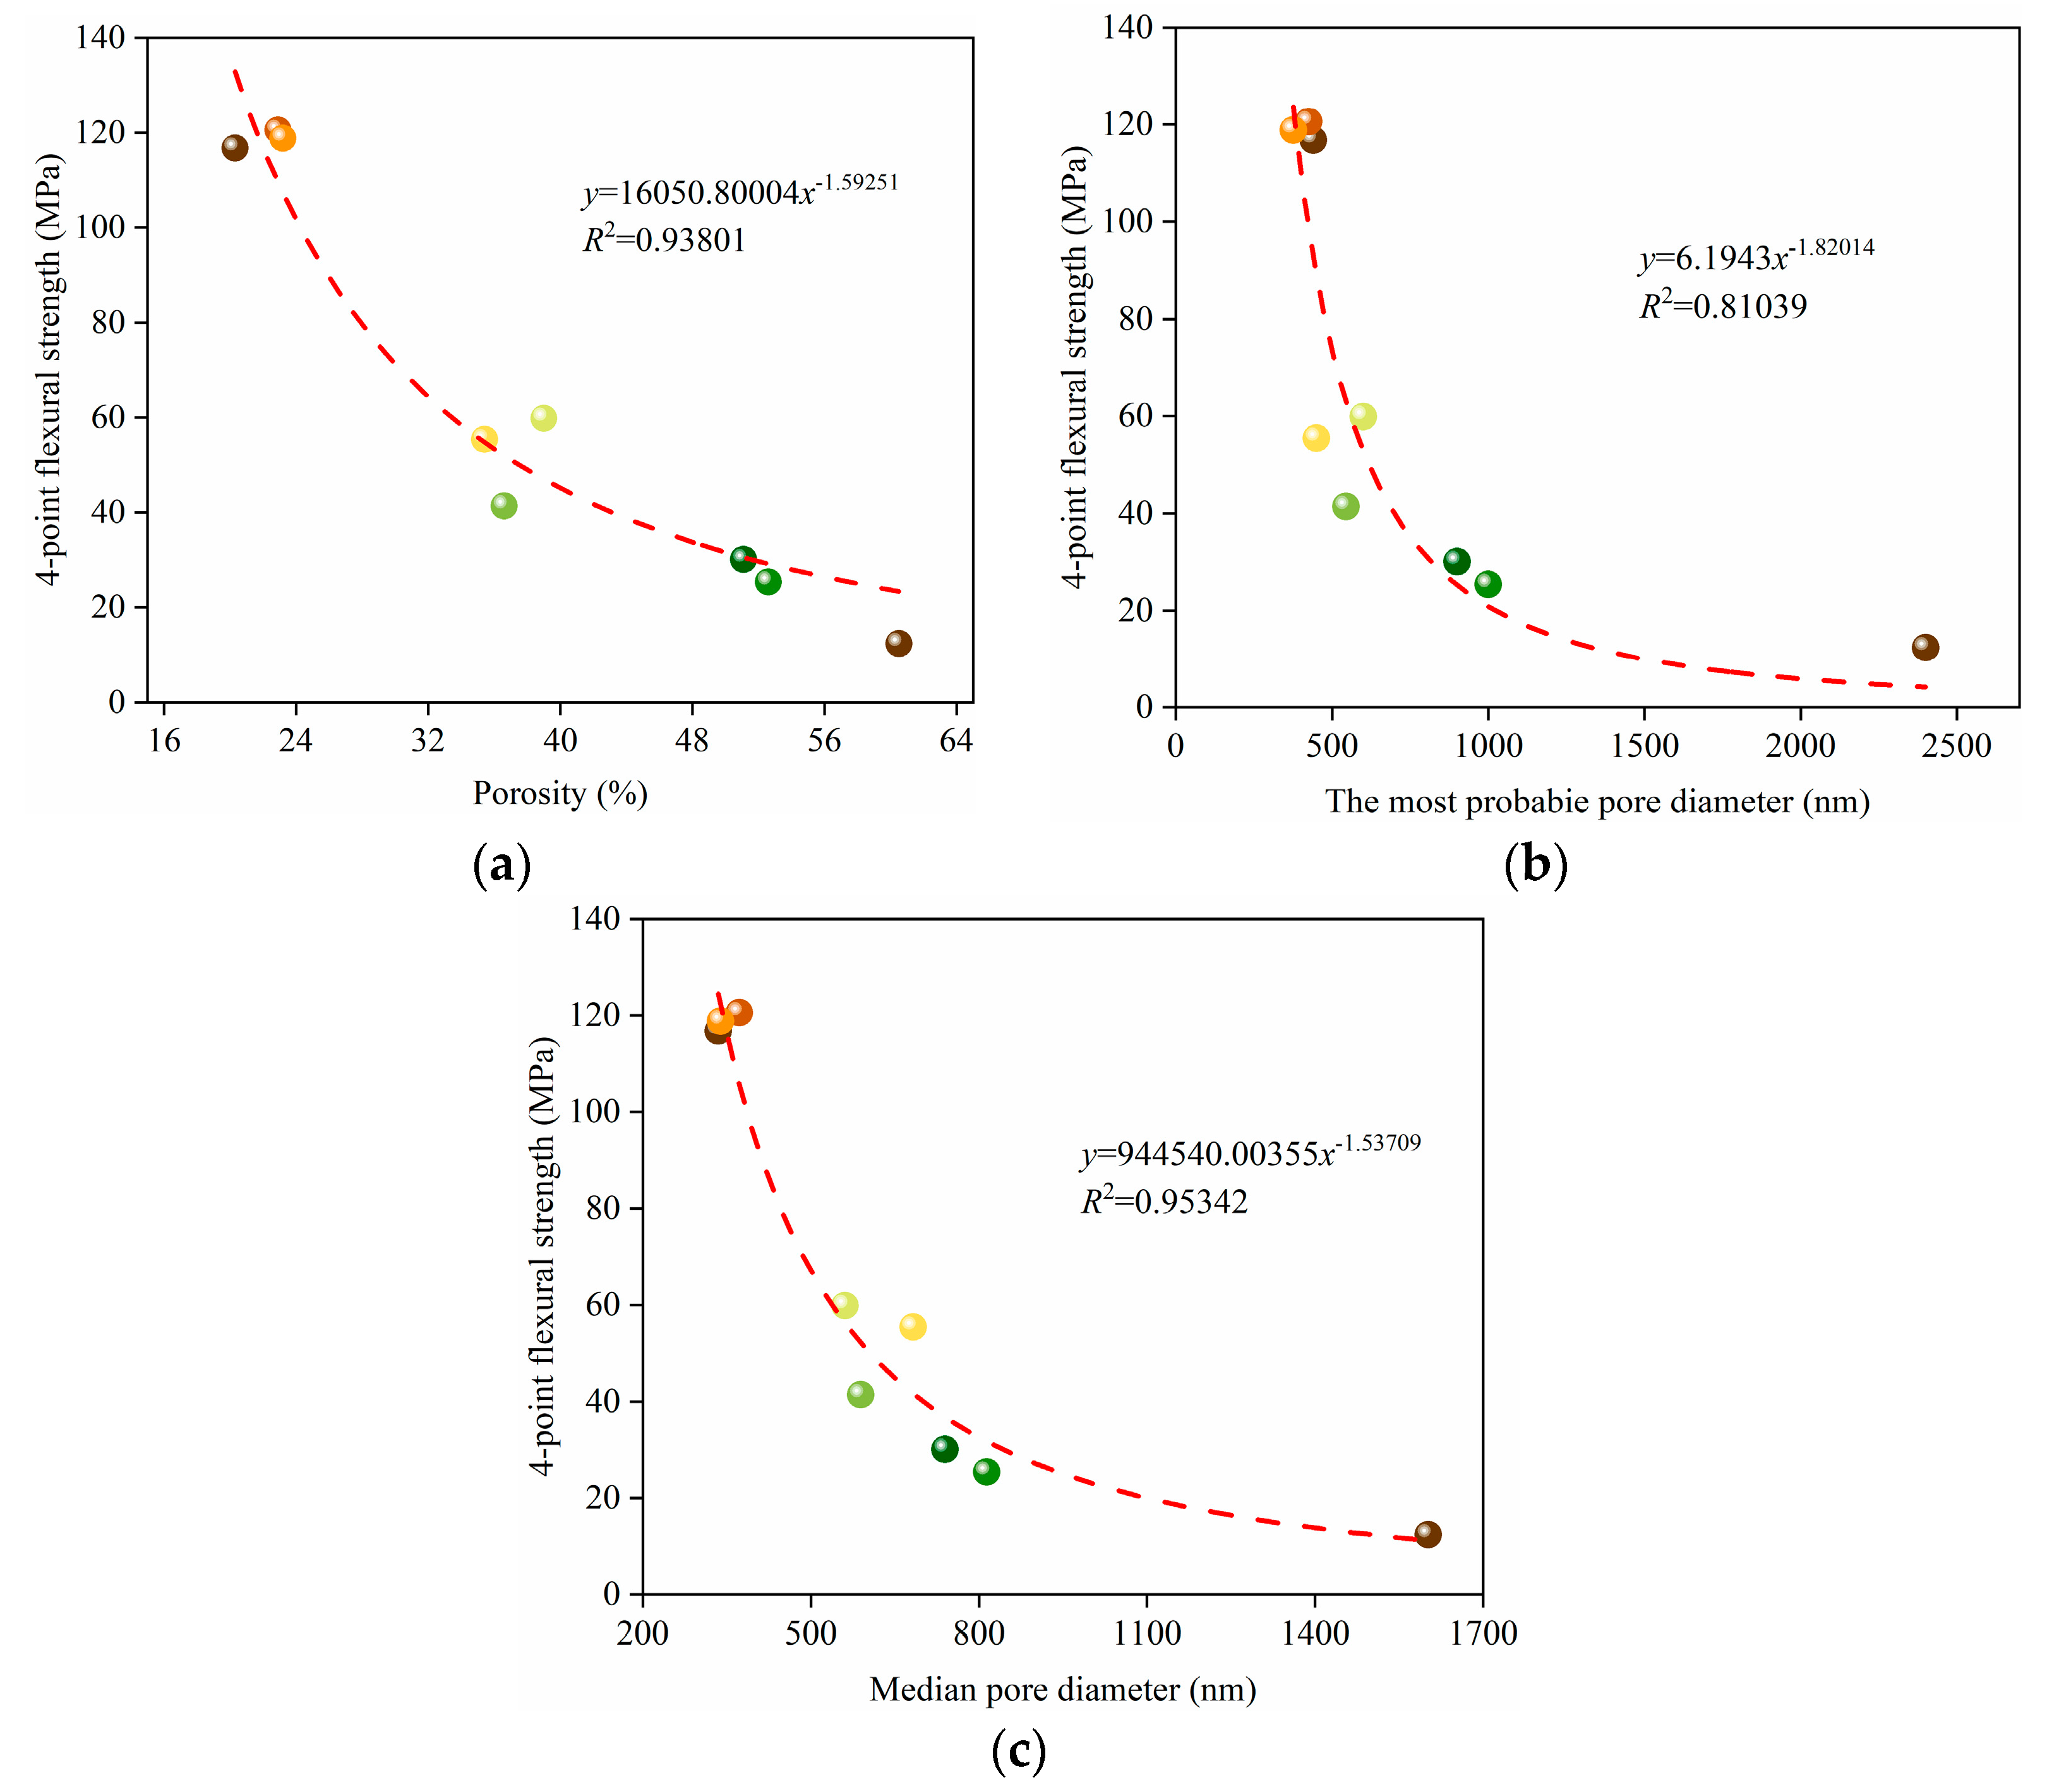
3.2. Mechanical Properties and Weibull Distribution of the Porous Alumina

Figure 7 demonstrates the porous alumina samples’ four-point flexural strength when prepared with various volume contents and ratios of pore formers. The samples’ total porosity increased as the volume content of the pore former increased, as shown in Figure 6. The samples’ four-point flexural strength decreased with the increase in pore former content according to the Ryskewitsch equation [34,35]. The corresponding strength decreased when the carbon fiber volume increased at 30 vol.% and 50 vol.% for the same volume content of pore formers. When the volume of carbon fiber and graphite was 70 vol.%, the increase of carbon fiber content lacked much impact on the samples’ strength.
The A1–C3 samples’ Weibull distributions obtained with various volume contents of pore formers are demonstrated in Figure 8 and Table 2. The larger the Weibull coefficient m is, the smaller the deviation from the strength data is, and the higher the reliability of the material’s measured strength is. The computed values of m were all within the range of values trusted for the porous ceramics, such that the samples’ measured flexural strengths had the needed reliability.

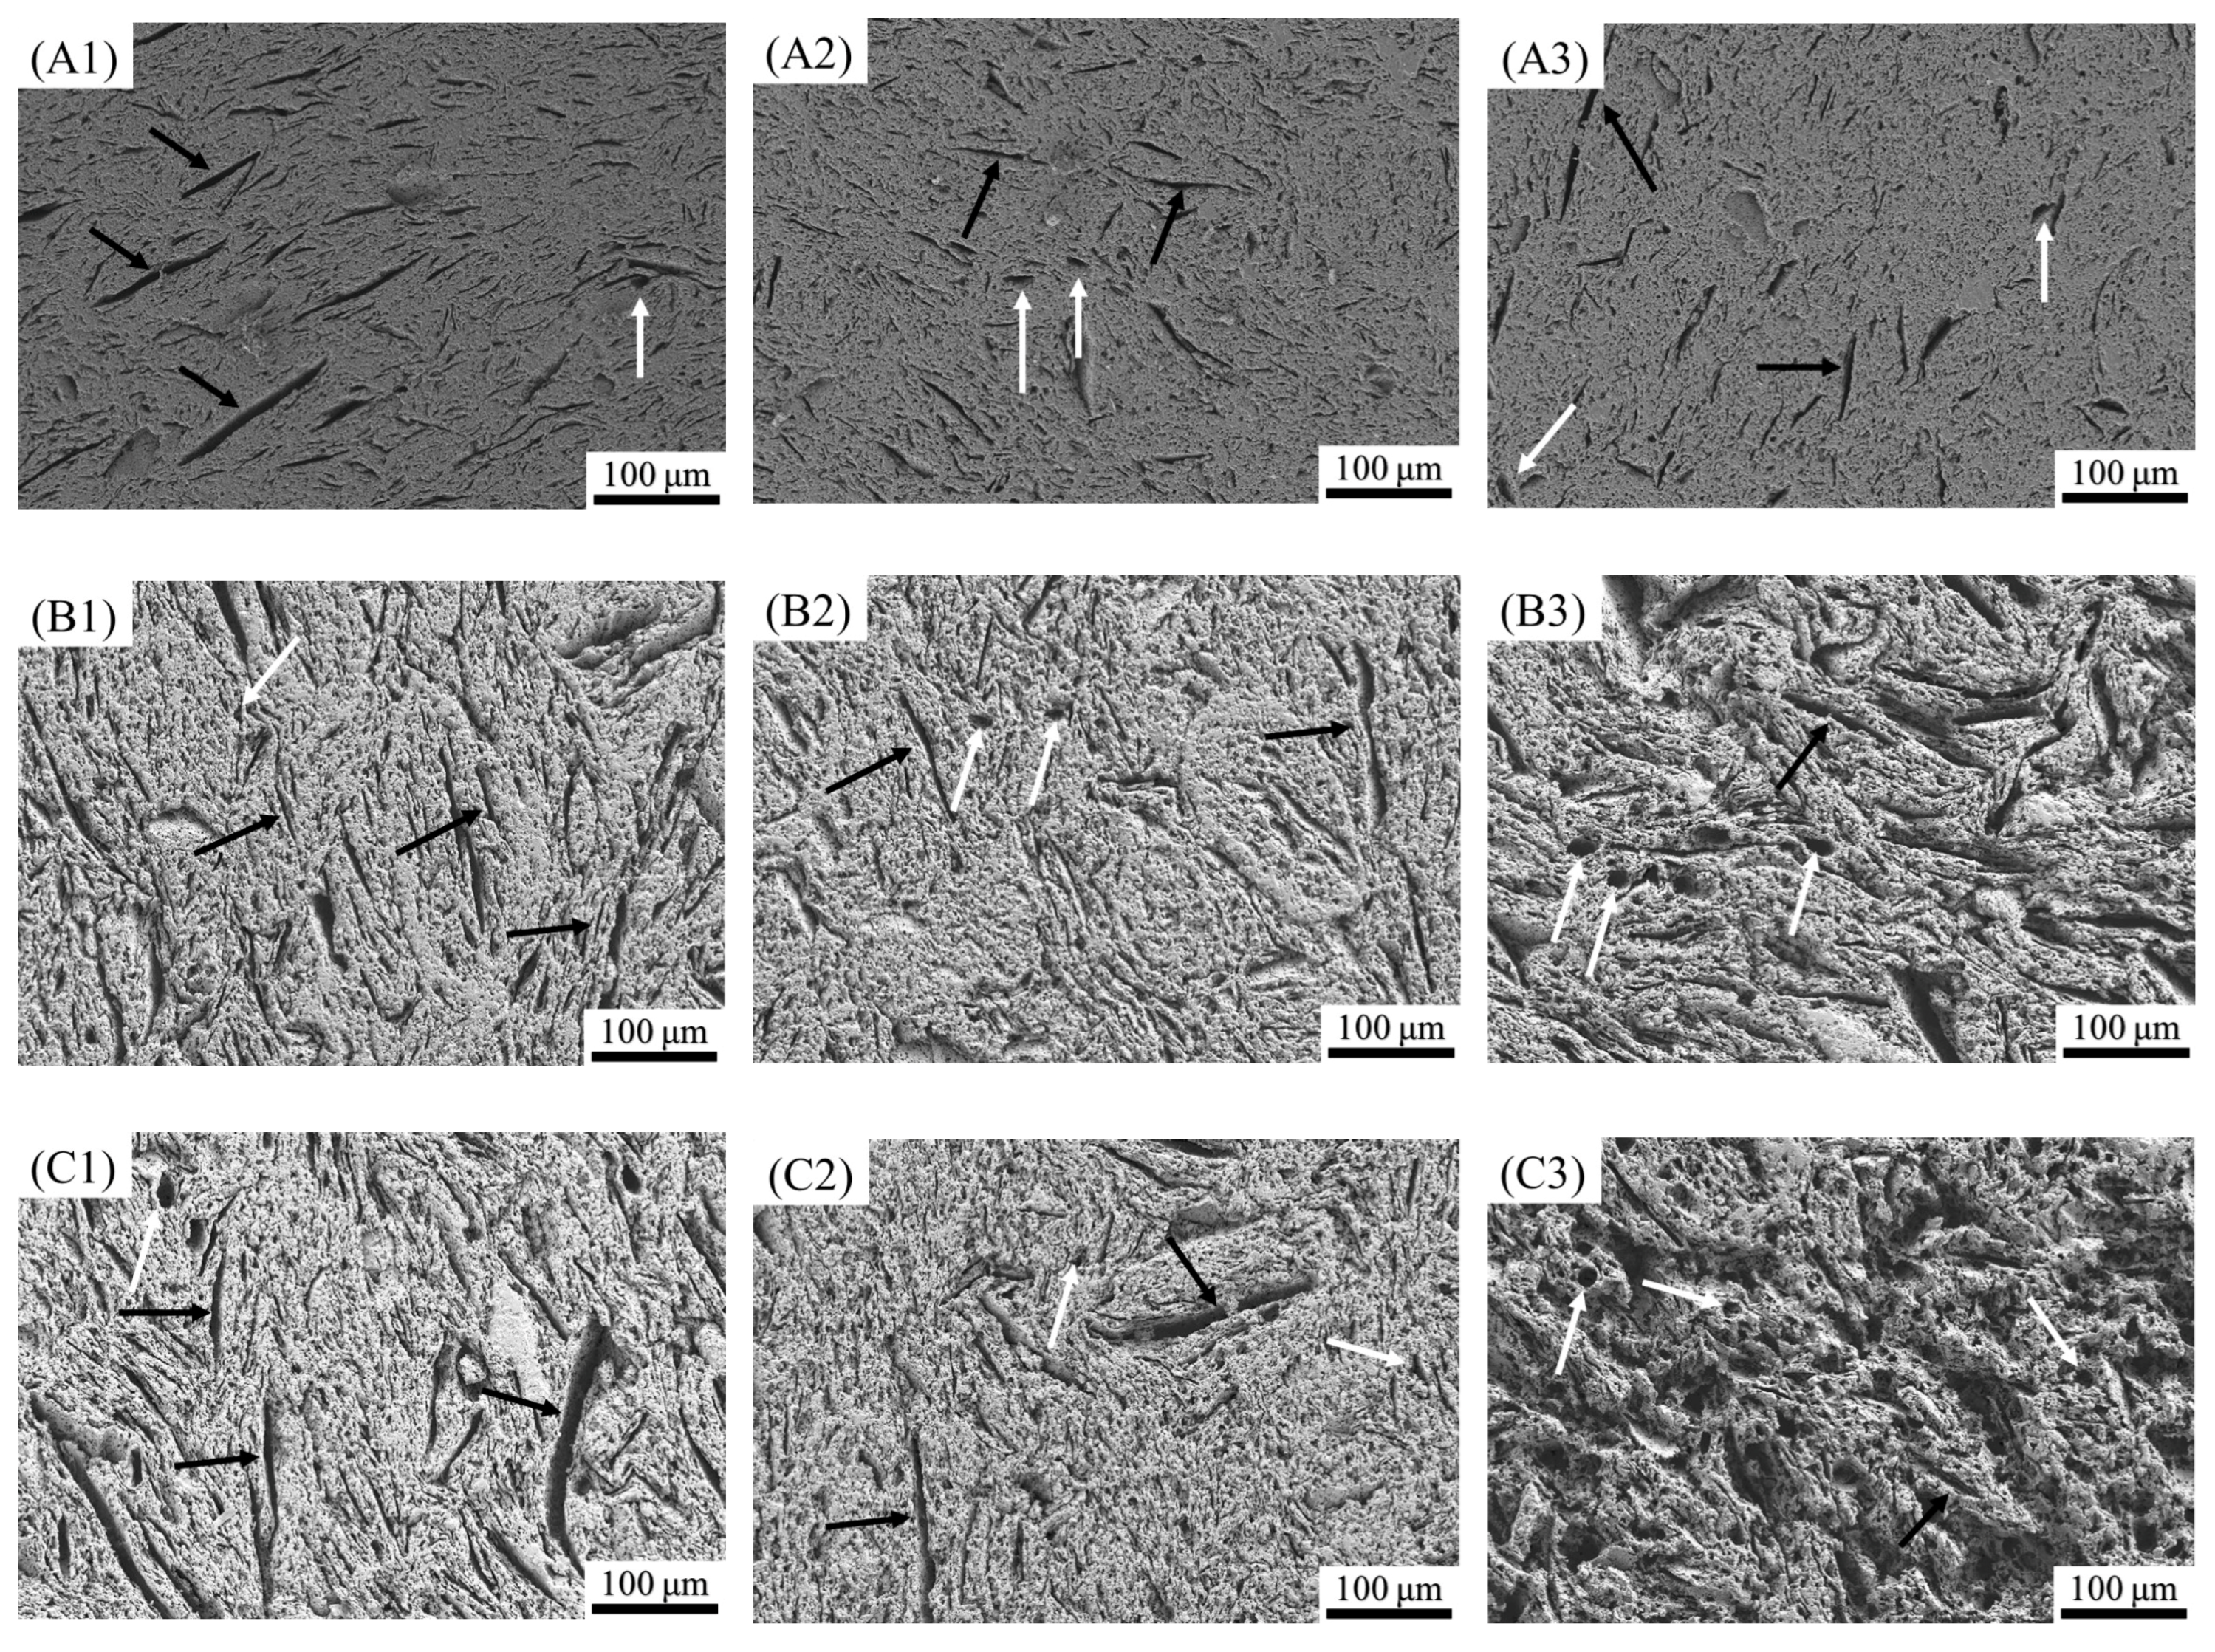
3.3. Phase Composition and Microstructure of the Porous Alumina

Samples A1–C3’s XRD plots are demonstrated in Figure 9. The various ratios of carbon fiber and graphite in the raw materials were completely burned during the sintering process. The common diffraction peaks of alumina existed in the samples obtained through sintering at 1550 °C and holding for 2 h. There was no residual pore former in the samples.
Figure 10 shows the photographs of the porous alumina samples’ cross-sections, as obtained with various contents of carbon fiber and graphite. The pores’ shapes in the samples retained the shapes of the pore formers. The black arrows in the figures indicate the holes left by the combustion of the flaky graphite, and the white arrows indicate the circular holes left by the combustion of the fibrous carbon fiber. These circular holes were primarily induced by the fibrous holes perpendicular to the cross-sectional surface. However, the overall samples’ most probable pore size was higher than that measured using MIP because the use of carbon fibers and graphite as pore-forming agents easily resulted in the formation of ink bottle-like pores in the sintered samples. Additionally, the porous alumina samples’ pore shapes changed from predominantly flat to fibrous when the content of carbon fibers increased. The A1–C3 samples’ average pore diameters measured using the Ferret diameter test approach were 32 μm, 17 μm, 6 μm, 34 μm, 35 μm, 45 μm, 36 μm, 39 μm, and 52 μm, respectively. The most probable pore size decreased with the increase in the carbon fiber content for group A. The most probable pore size decreased with the increase of the carbon fiber content for groups B and C. The pore former’s volume fraction in the samples of group A was low, and there were almost closed pores in the sintered samples. Meanwhile, the samples’ pores after sintering were linked, and large pores were generated for groups B and C such that the diameter values computed by the Ferret diameter were high.
Figure 11 demonstrates the porous alumina samples’ cross-sections, as obtained with various contents of carbon fiber and graphite. The orientation of the carbon fiber in the alumina was random in the A1–A3 samples, which resulted in a decrease in the porous alumina’s density. Furthermore, the alumina particles’ average particle size was 2 μm. The porous alumina particle sizes for groups B and C were substantially reduced compared to group A, and the average particle sizes were 700 nm and 600 nm, respectively. The disordered arrangement of carbon fibers in the samples and the alumina particle sizes’ reduction resulted in the flexural strength’s reduction, according to Figure 6, as shown in Figure 11.

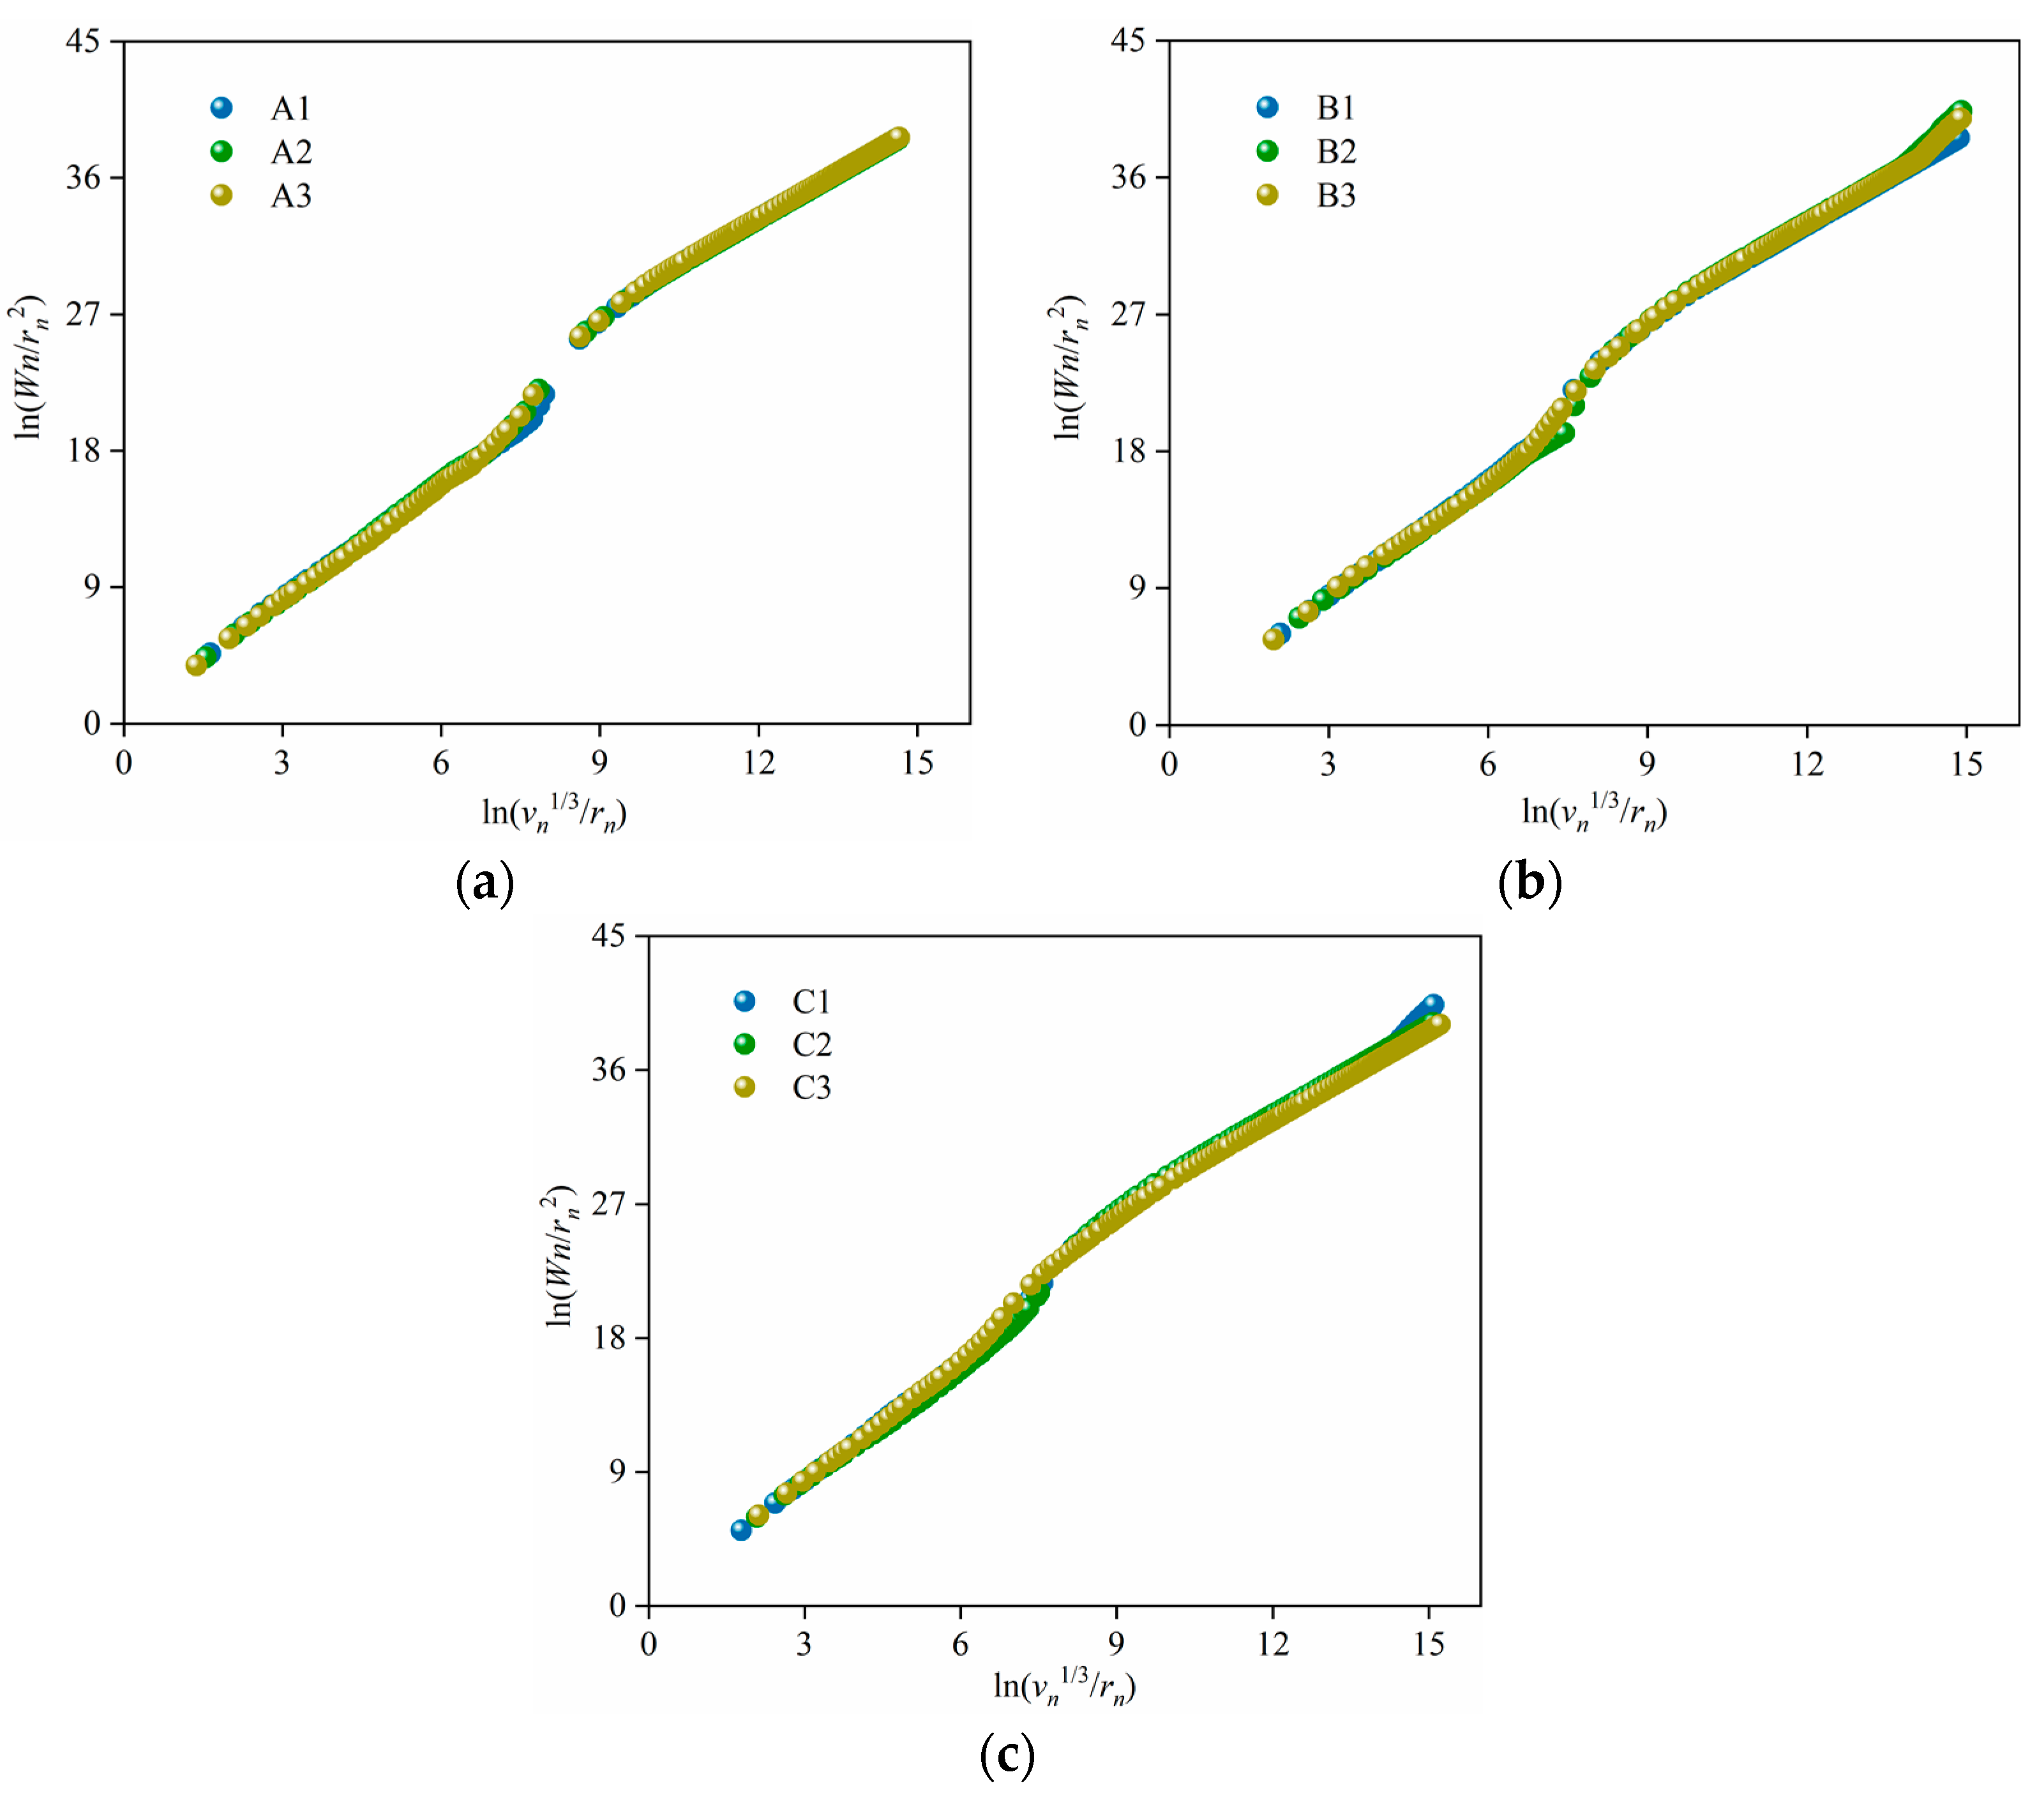
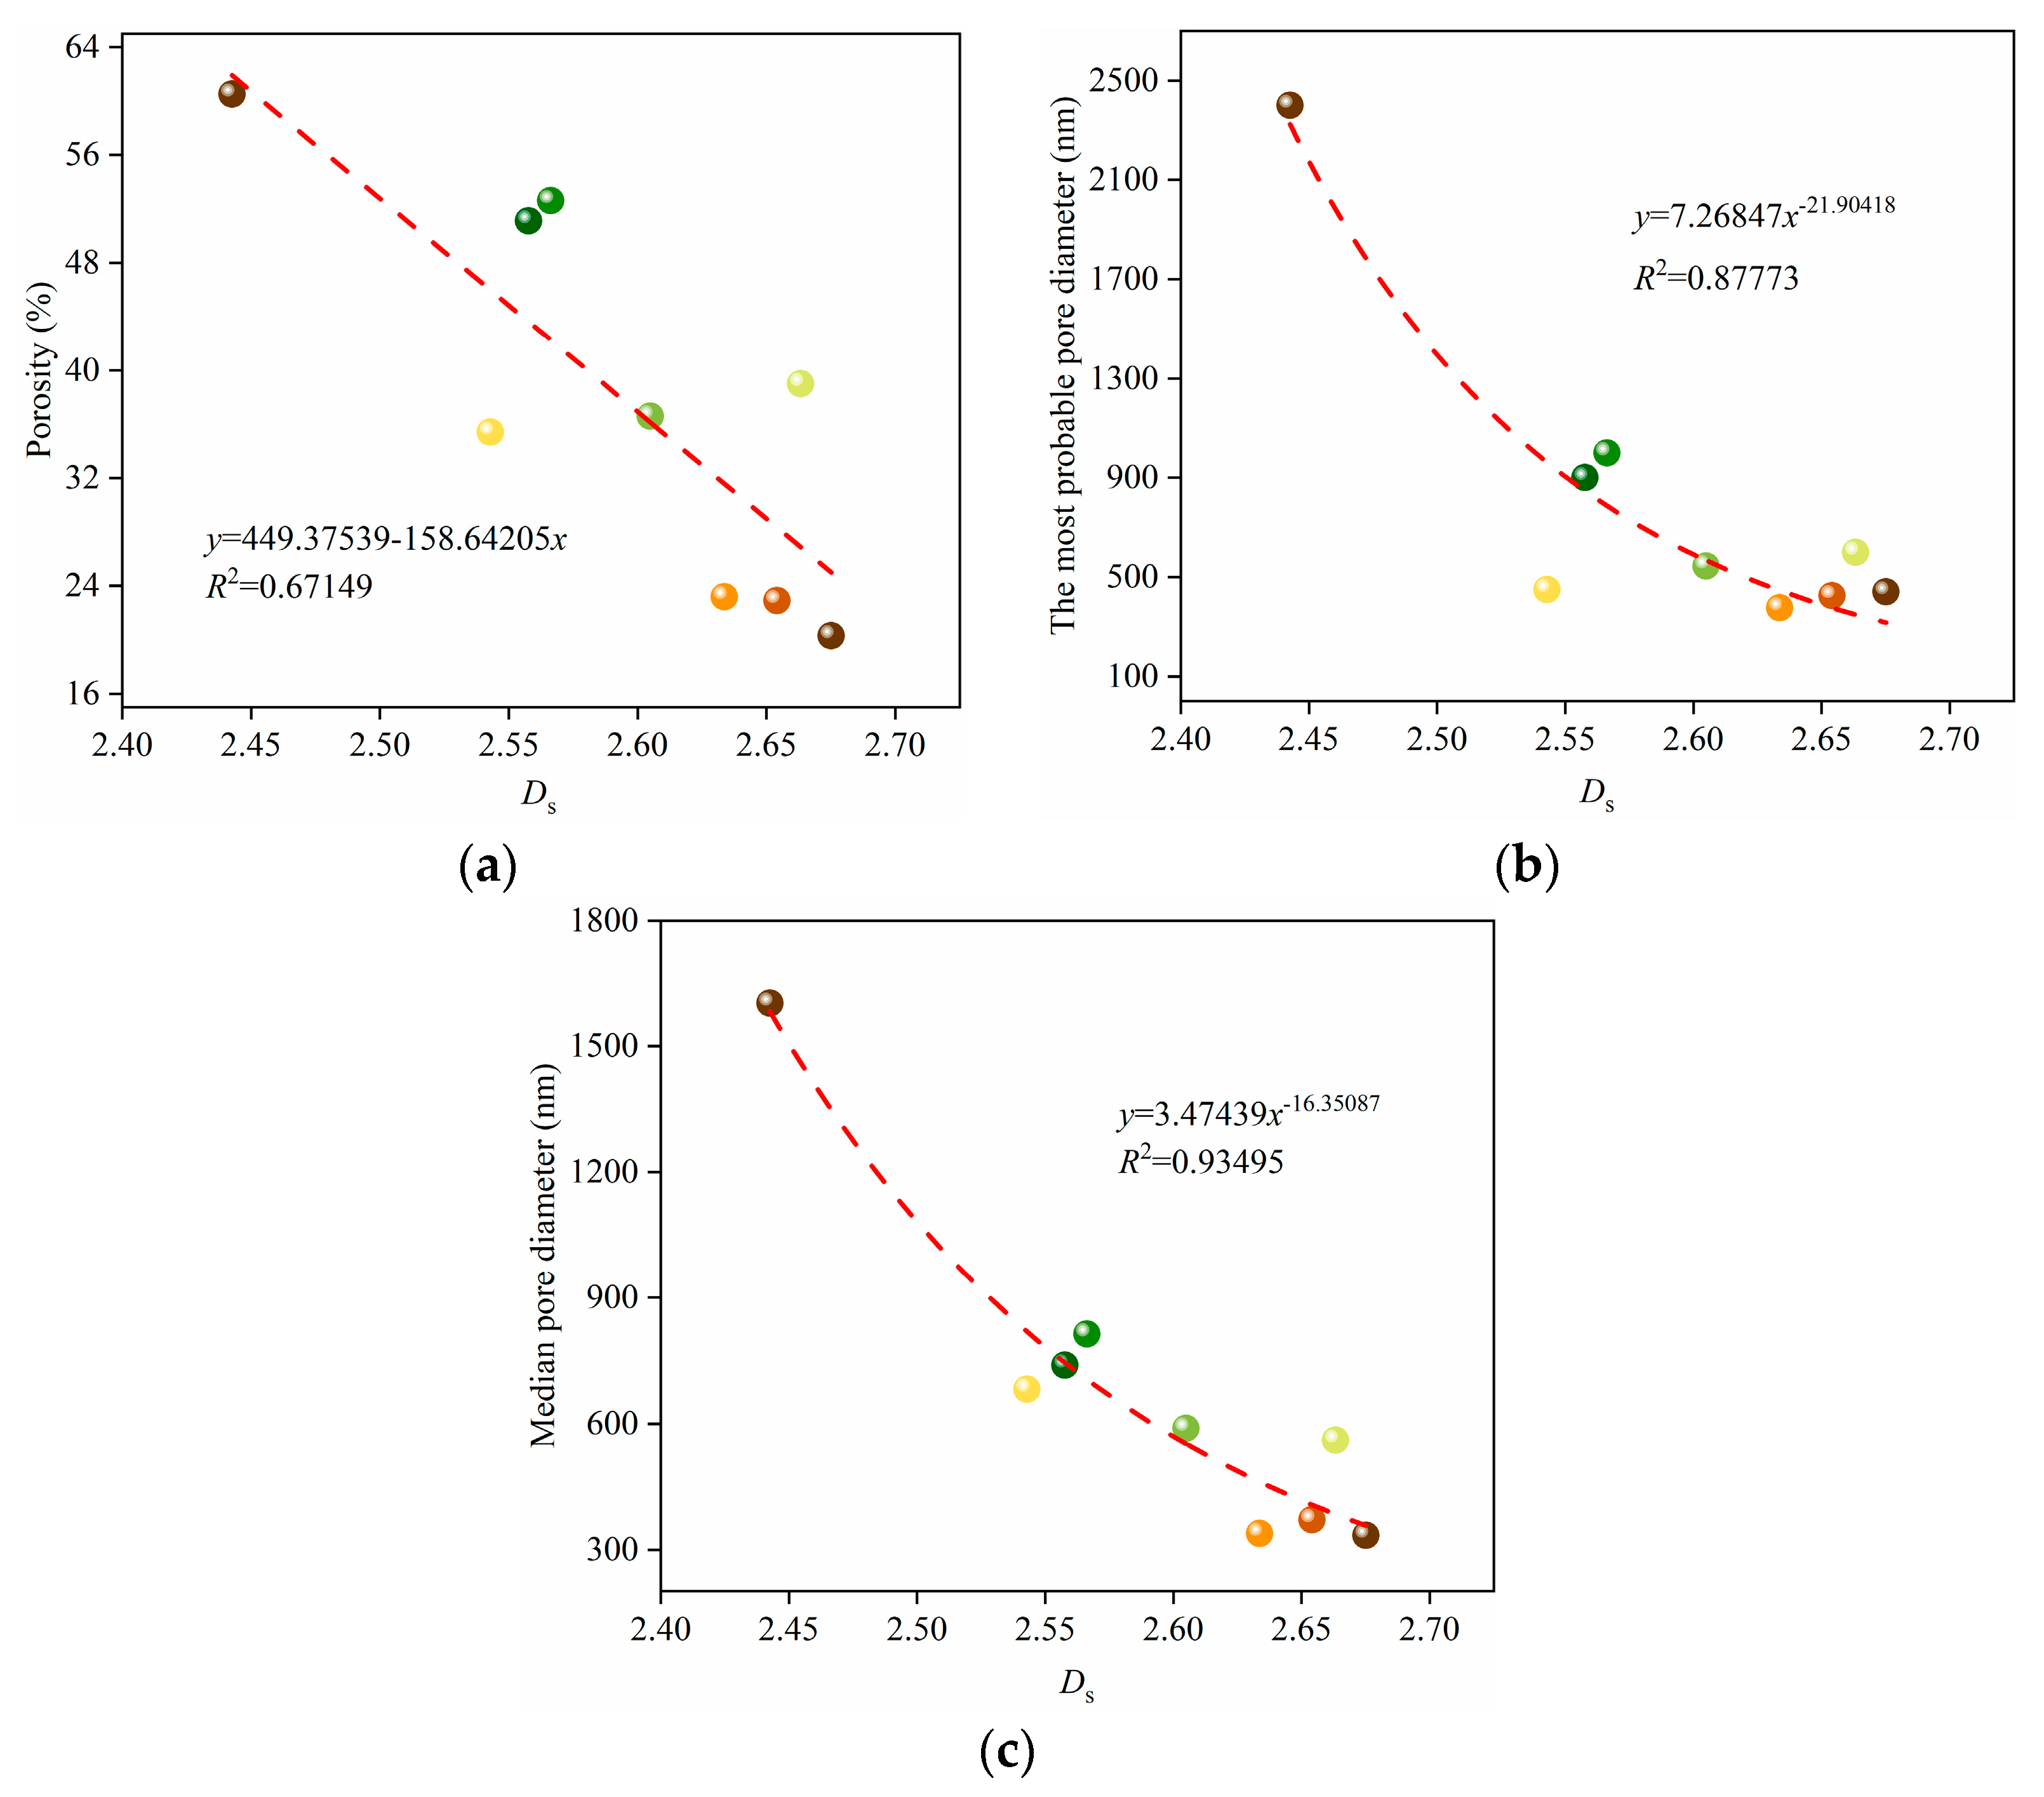
3.4. Fractal Characteristics of the Porous Alumina

The porous alumina samples’ Ds values with various pore former contents and the coefficient of determination of R2 were computed based on the experimental data of the MIP findings and Equation (4), as demonstrated in Figure 12.
Table 3 demonstrates the porous alumina samples’ Ds values with various pore former contents and the coefficient of determination of R2. The computed fractal dimensions were between 2.4 and 2.7, and the correlation coefficient values were all higher than 0.99000. Therefore, the porous alumina samples’ pore structure had prominent fractal characteristics, and the pore surface had high roughness and irregularity. The fractal dimension of the porous alumina samples showed a decreasing trend with the increase of the pore former’s volume fraction. Furthermore, the average particle size of the alumina decreased, the tiny pores made by the sintered alumina particles decreased, and the samples’ density decreased. The samples’ pores were linked after sintering, and the tiny pores generated large pores. The decrease in the proportion of tiny pores resulted in the simplicity of the sample pore structure. Thus, the group A and C samples’ fractal dimensions decreased with the increase in the carbon fiber content. The fractal dimension of the group B samples increased first and then decreased, and the Ds values were the lowest when the carbon fiber content was 30 vol.% because the increase in carbon fiber content caused the inhomogeneous distribution of carbon fiber. When the carbon fiber content was more than 50 vol.%, the fibers lapped or contacted each other, increasing the proportion of large pores, which is consistent with the pattern in Figure 5.
The plots of the relationship between Ds and the porosity, most probable pore size, and median pore diameter of the porous alumina samples are shown in Figure 13. The porosity, most probable pore size, and median pore size were all negatively correlated with the fractal dimension, and the values of R2 were 0.67194, 0.87773, and 0.93495, respectively. The proportion of large pores increased, the proportion of tiny pores decreased, and the pore structure’s complexity decreased with the increase of the most probable and median pore size. The high R2 value showed the close relationship between Ds and the pore structure parameters of the porous alumina samples. Therefore, the pore structure parameters could be characterized and expressed by Ds.
Figure 14 demonstrates the relationship between the porous alumina samples’ porosity, most probable pore size, median pore size, and flexural strength. The three plots had a negative relationship with the flexural strength, and had a high correlation. The correlation coefficients R2 were 0.93801, 0.81039, and 0.95342, respectively. The densities of the porous alumina decreased as the porosity of the samples increased; therefore, the mechanical behavior during compression changed from brittle damage to a more fragile behavior [36]. Additionally, Meille et al. [37] concluded that the mechanical properties of porous ceramics were regulated by the presence of isolated pores. During mechanical tests, tensile cracks first popped out of the largest pores, and the cracks paralleled the applied load, followed by the cracks’ steady expansion and crack–crack interactions, resulting in the final failure of the specimen. In a specific range of porosity, the decrease in the most available pore size and median pore size resulted in a substantial increase in the number of pores. In contrast, the pores’ diameter became low. The increase in the number of pores contributed to the crack expansion path’s deflection, which facilitated the increase in fracture energy absorption. Additionally, the reduction of the pore size could efficiently reduce the occurrence of cracks; therefore, it increased the maximum value of fracture stress [36]. The above findings show that the pore structure parameters were the decisive factors for the porous alumina samples’ mechanical properties. For porous ceramics with the same porosity, the mechanical properties could be efficiently enhanced by reducing the proportion of macroporosity and increasing the microporosity, which was in good agreement with the findings reported by Liu et al. [38].
The relationship between the flexural strength findings and the fractal dimension of the porous alumina samples with various pore former contents is demonstrated in Figure 15. There was a power function relationship between flexural strength and the fractal dimension with an acceptable correlation coefficient of R2 = 0.64278. The primary reason is that the sample porosity increased, the volume fraction of large pores increased, and the complexity of the pore structure decreased with the increase in pore-forming agent content, which was consistent with the findings in Figure 13 and Figure 14. As mentioned above, the fractal dimension was a crucial parameter to reflect the pore structure of porous alumina ceramics, which could explain how the flexural properties of porous alumina ceramics were influenced by various pore-forming agent contents from the fractal theory.

4. Conclusions

(1) The porous alumina with various porosities was completely sintered at a sinter temperature of 1550 °C. The open pore proportion increased, the closed pore proportion decreased, the porous alumina’s pore distribution became more extensive, and the volume fraction of large pores increased when the pore former content in the raw materials increased. The samples’ pore structure and morphology varied, and the disorderly arrangement of carbon fibers and the decrease of the alumina particle size in the samples resulted in a decrease in the flexural strength.
(2) The pore structure parameters could be characterized and expressed by Ds. Ds decreases with the increase in pore-forming agent content, and the impact of carbon fiber on Ds is more substantial than that of graphite.
(3) The fractal dimension of porous alumina was positively correlated with flexural strength and highly negatively correlated with pore structure parameters. The pore structure parameter was the decisive factor in the mechanical properties of porous alumina. The fractal dimension can also be employed to investigate other properties of porous ceramics. This new approach is also extensively applicable to the examination of ceramics with different porosity levels.

Author Contributions

Conceptualization, C.C.; methodology, C.C.; validation, X.W.; formal analysis, C.C. and X.W.; investigation, X.W.; resources, C.C.; data curation, C.C.; writing—original draft preparation, X.W.; writing—review and editing, C.C.; supervision, C.C.; project administration, Y.W. and C.C.; funding acquisition, Y.W. All authors have read and agreed to the published version of the manuscript.

Funding

This research was funded by the National Natural Science Foundation of China (No. 51974218).

Institutional Review Board Statement

Not applicable.

Informed Consent Statement

Not applicable.

Data Availability Statement

The data are available from the corresponding author upon request.

Acknowledgments

The authors are very grateful to Lei Wang from Xi’an University of Architecture and Technology for his kind guidance in writing this article.

Conflicts of Interest

The authors declare no conflict of interest.

References

  1. Guzman, I.Y. Certain principles of formation of porous ceramic structures. Properties and applications (A review). Glass Ceram. 2003, 60, 280–283. [Google Scholar] [CrossRef]
  2. Studart, A.R.; Gonzenbach, U.T.; Tervoort, E.; Gauckler, L.J. Processing routes to macroporous ceramics: A review. J. Am. Ceram. Soc. 2006, 89, 1771–1789. [Google Scholar] [CrossRef]
  3. Ohji, T.; Fukushima, M. Macro-porous ceramics: Processing and properties. Int. Mater. Rev. 2012, 57, 115–131. [Google Scholar] [CrossRef]
  4. Pia, G.; Casnedi, L.; Sanna, U. Porous ceramic materials by pore-forming agent method: An intermingled fractal units analysis and procedure to predict thermal conductivity. Ceram. Int. 2015, 41, 6350–6357. [Google Scholar] [CrossRef]
  5. Yin, S.; Pan, L.; Huang, K.; Qiu, T.; Yang, J. Porous Si3N4 ceramics with hierarchical pore structures prepared by gelcasting using DMAA as gelling agent and PS as pore–forming agent. J. Alloys Compd. 2019, 805, 69–77. [Google Scholar] [CrossRef]
  6. He, C.; Du, B.; Ma, J.; Xiong, H.; Qian, J.; Cai, M.; Shui, A. Enhanced sound absorption properties of porous ceramics modified by graphene oxide films. J. Am. Ceram. Soc. 2022, 105, 3177–3188. [Google Scholar] [CrossRef]
  7. Farahani, H.; Wagiran, R.; Hamidon, M.N. Humidity sensors principle, mechanism, and fabrication technologies: A comprehensive review. Sensors 2014, 14, 7881–7939. [Google Scholar] [CrossRef] [PubMed] [Green Version]
  8. Blank, T.A.; Eksperiandova, L.P.; Belikov, K.N. Recent trends of ceramic humidity sensors development: A review. Sens. Actuat. B 2016, 228, 416–442. [Google Scholar] [CrossRef]
  9. Chen, Y.; Wang, N.; Ola, O.; Xia, Y.; Zhu, Y. Porous ceramics: Light in weight but heavy in energy and environment technologies. Mater. Sci. Eng. R 2021, 143, 100589. [Google Scholar] [CrossRef]
  10. Raja, M.; Sanjeev, G.; Prem Kumar, T.; Manuel Stephan, A. Lithium aluminate-based ceramic membranes as separators for lithium-ion batteries. Ceram. Int. 2015, 41, 3045–3050. [Google Scholar] [CrossRef]
  11. Xu, C.; Liu, H.; Yang, H.; Yang, L. A green biocompatible fabrication of highly porous functional ceramics with high strength and controllable pore structures. J. Mater. Sci. Technol. 2016, 32, 729–732. [Google Scholar] [CrossRef]
  12. Faria, F.P.; Ruellas, T.M.O.; Del Roveri, C.; Donizette Malafatti, J.O.; Paris, E.C.; Giraldi, T.R.; Maestrelli, S.C. Obtaining porous zinc oxide ceramics using replica technique: Application in photocatalysis. Mater. Res.-Ibero-Am. J. 2022, 25, e20210083. [Google Scholar] [CrossRef]
  13. Wang, S.L.; Zhou, M.; Zeng, L.K.; Dai, W.B. Investigation on the preparation and properties of reticulate porous ceramic for organism carrier in sewage disposal. J. Ceram. Process. Res. 2016, 17, 1095–1099. [Google Scholar]
  14. Li, Y.; Yang, X.; Liu, D.; Chen, J.; Zhang, D.; Wu, Z. Permeability of the porous Al2O3 ceramic with bimodal pore size distribution. Ceram. Int. 2019, 45, 5952–5957. [Google Scholar] [CrossRef]
  15. Hedayat, N.; Du, Y.; Ilkhani, H. Review on fabrication techniques for porous electrodes of solid oxide fuel cells by sacrificial template methods. Renew. Sustain. Energ. Rev. 2017, 77, 1221–1239. [Google Scholar] [CrossRef]
  16. Qu, F.; Yu, Z.; Krol, M.; Chai, N.; Riedel, R.; Graczyk-Zajac, M. Electrochemical performance of carbon-rich silicon carbonitride ceramic as support for sulfur cathode in lithium sulfur battery. Nanomaterials 2022, 12, 1283. [Google Scholar] [CrossRef]
  17. Wang, L.; He, G.; Yang, Z.C.; Li, J.T. Combustion synthesis of high flexural strength, low linear shrinkage and machinable porous beta-Si3N4 ceramics. J. Eur. Ceram. Soc. 2021, 41, 2395–2399. [Google Scholar] [CrossRef]
  18. Liu, X.; Yu, C.; Qu, D.L.; Luo, X.D. Preparation of porous beta-SiAlON ceramics using corn starch as pore-forming agent. J. Aust. Ceram. Soc. 2022, 58, 531–537. [Google Scholar] [CrossRef]
  19. Ternero, F.; Rosa, L.G.; Urban, P.; Montes, J.M.; Cuevas, F.G. Influence of the total porosity on the properties of sintered materials: A review. Metals 2021, 11, 730. [Google Scholar] [CrossRef]
  20. Dong, Y.; Jiang, H.; Chen, A.; Yang, T.; Zou, T.; Xu, D. Porous Al2O3 ceramics with spontaneously formed pores and enhanced strength prepared by indirect selective laser sintering combined with reaction bonding. Ceram. Int. 2020, 46, 15159–15166. [Google Scholar] [CrossRef]
  21. Mandelbrot, B.B.; Wheeler, J.A. The fractal geometry of nature. Am. J. Phys. 1983, 51, 286–287. [Google Scholar] [CrossRef]
  22. Pfeifer, P.; Avnir, D. Chemistry in noninteger dimensions between two and three. I. Fractal theory of heterogeneous surfaces. J. Chem. Phys. 1983, 79, 3558–3565. [Google Scholar] [CrossRef]
  23. Shenker, O.R. Fractal geometry is not the geometry of nature. Stud. Hist. Philos. Sci. 1994, 25, 967–981. [Google Scholar] [CrossRef]
  24. Mitic, V.V.; Paunovic, V.; Kocic, L. Fractal approach to BaTiO3-ceramics micro-impedances. Ceram. Int. 2015, 41, 6566–6574. [Google Scholar] [CrossRef]
  25. Esmonde, H. Fractal and fractional derivative modelling of material phase change. Fractal Fract. 2020, 4, 46. [Google Scholar] [CrossRef]
  26. Bohaiennko, V.; Bulavatsky, V. Fractional-fractal modeling of filtration-consolidation processes in saline saturated soils. Fractal Fract. 2020, 4, 59. [Google Scholar] [CrossRef]
  27. Yang, H.M.; Zhang, S.M.; Wang, L.; Chen, P.; Shao, D.K.; Tang, S.W.; Li, J.Z. High-ferrite Portland cement with slag: Hydration, microstructure, and resistance to sulfate attack at elevated temperature. Cem. Concr. Comp. 2022, 130, 104560. [Google Scholar] [CrossRef]
  28. Meng, Q.; Qin, Q.; Yang, H.; Zhou, H.; Wu, K.; Wang, L. Fractal characteristics of the pore structure of coral powder-cement slurry under different fractal models. Fractal Fract. 2022, 6, 145. [Google Scholar] [CrossRef]
  29. Wang, L.; Lu, X.; Liu, L.; Xiao, J.; Zhang, G.; Guo, F.; Li, L. Influence of MgO on the hydration and shrinkage behavior of low heat Portland cement-based materials via pore structural and fractal analysis. Fractal Fract. 2022, 6, 40. [Google Scholar] [CrossRef]
  30. Peng, Y.; Tang, S.; Huang, J.; Tang, C.; Wang, L.; Liu, Y. Fractal analysis on pore structure and modeling of hydration of magnesium phosphate cement paste. Fractal Fract. 2022, 6, 337. [Google Scholar] [CrossRef]
  31. Wang, L.; Yu, Z.; Liu, B.; Zhao, F.; Tang, S.; Jin, M. Effects of fly ash dosage on shrinkage, crack resistance and fractal characteristics of face slab concrete. Fractal Fract. 2022, 6, 335. [Google Scholar] [CrossRef]
  32. Wang, L.; Zeng, X.; Yang, H.; Lv, X.; Guo, F.; Shi, Y.; Hanif, A. Investigation and application of fractal theory in cement-based materials: A review. Fractal Fract. 2021, 5, 247. [Google Scholar] [CrossRef]
  33. Zhang, B.; Li, S. Determination of the surface fractal dimension for porous media by mercury porosimetry. Ind. Eng. Chem. Res. 1995, 34, 1383–1386. [Google Scholar] [CrossRef]
  34. Yao, D.; Xia, Y.; Zuo, K.H.; Jiang, D.; Günster, J.; Zeng, Y.P.; Heinrich, J.G. The effect of fabrication parameters on the mechanical properties of sintered reaction bonded porous Si3N4 ceramics. J. Eur. Ceram. Soc. 2014, 34, 3461–3467. [Google Scholar] [CrossRef]
  35. Coble, R.L.; Kingery, W.D. Effect of porosity on physical properties of sintered alumina. J. Am. Ceram. Soc. 1956, 39, 377–385. [Google Scholar] [CrossRef]
  36. Wang, S.; Yang, Z.; Duan, X.; Jia, D.; Cui, W.; Sun, B.; Zhou, Y. Effects of pore size on microstructure, mechanical and dielectric properties of gel casting BN/Si3N4 ceramics with spherical-shaped pore structures. J. Alloys. Compd. 2013, 581, 46–51. [Google Scholar] [CrossRef]
  37. Meille, S.; Lombardi, M.; Chevalier, J.; Montanaro, L. Mechanical properties of porous ceramics in compression: On the transition between elastic, brittle, and cellular behavior. J. Eur. Ceram. Soc. 2012, 32, 3959–3967. [Google Scholar] [CrossRef]
  38. Liu, J.; Li, Y.; Li, Y.; Sang, S.; Li, S. Effects of pore structure on thermal conductivity and strength of alumina porous ceramics using carbon black as pore-forming agent. Ceram. Int. 2016, 42, 8221–8228. [Google Scholar] [CrossRef]
Figure 1. Microstructures of the pore formers: (a) carbon fiber; (b) graphite.
Fractalfract 06 00460 g001
Figure 2. Porosity of the porous alumina samples prepared with different pore former contents.
Fractalfract 06 00460 g002
Figure 3. (a) Bulk densities and (b) linear shrinkage of the samples prepared with different pore former contents. The volume fraction values of pore former are (A) 30 vol.%, (B) 50 vol.%, and (C) 70 vol.%, respectively.
Fractalfract 06 00460 g003
Figure 4. Pore size distribution of the porous alumina samples prepared with different ratios of carbon fiber and graphite. The volume fraction values of pore formers are (a) 30 vol.%, (b) 50 vol.%, and (c) 70 vol.%, respectively.
Fractalfract 06 00460 g004
Figure 5. Pore volume of the porous alumina prepared with various ratios of carbon fiber and graphite.
Fractalfract 06 00460 g005
Figure 6. Total porosity, close porosity, and median pore diameter of porous alumina, as measured by MIP. The volume fraction values of the pore former are (a) 30 vol.%, (b) 50 vol.%, and (c) 70 vol.%, respectively.
Fractalfract 06 00460 g006
Figure 7. Flexural strength of the porous alumina samples with different volume contents and ratios of pore formers. The volume fraction values of the pore formers are (A) 30 vol.%, (B) 50 vol.%, and (C) 70 vol.%, respectively.
Fractalfract 06 00460 g007
Figure 8. Weibull distribution of the porous alumina samples obtained by adding various pore formers.
Fractalfract 06 00460 g008
Figure 9. XRD of the porous alumina samples with different pore former contents.
Fractalfract 06 00460 g009
Figure 10. Cross-sectional morphologies of the porous alumina samples. (A1) 9 vol.% carbon fiber + 21 vol.% graphite + 70 vol.% alumina; (A2) 15 vol.% carbon fiber + 15 vol.% graphite + 70 vol.% alumina; (A3) 21 vol.% carbon fiber + 9 vol.% graphite + 70 vol.% alumina; (B1) 15 vol.% carbon fiber + 35 vol.% graphite + 50 vol.% alumina; (B2) 25 vol.% carbon fiber + 25 vol.% graphite + 50 vol.% alumina; (B3) 35 vol.% carbon fiber + 15 vol.% graphite + 50 vol.% alumina; (C1) 21 vol.% carbon fiber + 49 vol.% graphite + 30 vol.% alumina; (C2) 35 vol.% carbon fiber + 35 vol.% graphite + 30 vol.% alumina; (C3) 49 vol.% carbon fiber + 21 vol.% graphite + 30 vol.% alumina.
Fractalfract 06 00460 g010
Figure 11. SEM of the fracture surfaces of the porous alumina samples. (A1) 9 vol.% carbon fiber + 21 vol.% graphite + 70 vol.% alumina; (A2) 15 vol.% carbon fiber + 15 vol.% graphite + 70 vol.% alumina; (A3) 21 vol.% carbon fiber + 9 vol.% graphite + 70 vol.% alumina; (B1) 15 vol.% carbon fiber + 35 vol.% graphite + 50 vol.% alumina; (B2) 25 vol.% carbon fiber + 25 vol.% graphite + 50 vol.% alumina; (B3) 35 vol.% carbon fiber + 15 vol.% graphite + 50 vol.% alumina; (C1) 21 vol.% carbon fiber + 49 vol.% graphite + 30 vol.% alumina; (C2) 35 vol.% carbon fiber + 35 vol.% graphite + 30 vol.% alumina; (C3) 49 vol.% carbon fiber + 21 vol.% graphite + 30 vol.% alumina.
Fractalfract 06 00460 g011
Figure 12. Logarithmic plots of V n 1 / 3 r n and W n r n 2 for samples with different pore former contents. (a) 30 vol.% pore formers + 70 vol.% alumina; (b) 50 vol.% pore formers + 50 vol.% alumina; (c) 70 vol.% pore formers + 30 vol.% alumina.
Fractalfract 06 00460 g012
Figure 13. Relationship between Ds and (a) the porosity, (b) the most probable pore size, and (c) the median pore diameter of the porous alumina.
Fractalfract 06 00460 g013
Figure 14. Relationship between flexural strength and (a) the porosity, (b) the most probable pore size, and (c) the median pore diameter of the porous alumina.
Fractalfract 06 00460 g014
Figure 15. Relationship between flexural strength and the fractal dimension.
Fractalfract 06 00460 g015
Table 1. The ratios of the raw materials for the different porous alumina materials.
SamplesCompositions
A19 vol.% carbon fiber + 21 vol.% graphite + 70 vol.% alumina
A215 vol.% carbon fiber + 15 vol.% graphite + 70 vol.% alumina
A321 vol.% carbon fiber + 9 vol.% graphite + 70 vol.% alumina
B115 vol.% carbon fiber + 35 vol.% graphite + 50 vol.% alumina
B225 vol.% carbon fiber + 25 vol.% graphite + 50 vol.% alumina
B335 vol.% carbon fiber + 15 vol.% graphite + 50 vol.% alumina
C121 vol.% carbon fiber + 49 vol.% graphite + 30 vol.% alumina
C235 vol.% carbon fiber + 35 vol.% graphite + 30 vol.% alumina
C349 vol.% carbon fiber + 21 vol.% graphite + 30 vol.% alumina
Table 2. Weibull values of the porous alumina samples obtained by adding various pore formers.
SamplesA1A2A3B2B2B3C1C2C3
Weibull (m)21.937.424.118.611.720.011.912.911.2
Table 3. Fractal dimensions of the pore surfaces.
SamplesDsR2
A12.675130.99238
A22.654070.99291
A32.633620.99270
B12.542880.99144
B22.663330.99302
B32.604910.99283
C12.566220.99346
C22.557750.99045
C32.442550.99028
Publisher’s Note: MDPI stays neutral with regard to jurisdictional claims in published maps and institutional affiliations.

