Article

Fractal Analysis on Pore Structure and Modeling of Hydration of Magnesium Phosphate Cement Paste

1
State Key Laboratory of Water Resources and Hydropower Engineering Science, Wuhan University, Wuhan 430072, China
2
State Key Laboratory of Building Safety and Built Environment, Beijing 100013, China
3
National Engineering Research Center of Building Technology, Beijing 100053, China
4
Department of Architecture and Civil Engineering, City University of Hong Kong, Kowloon, Hong Kong 999077, China
5
Department of Hydraulic Engineering, Tsinghua University, Beijing 100084, China
6
College of Materials Science and Engineering, Xi′an University of Architecture and Technology, Xi′an 710000, China
7
Department of Applied Mathematics, Xi′an Jiaotong-Liverpool University, Suzhou 215123, China
*
Author to whom correspondence should be addressed.
Fractal Fract. 2022, 6(6), 337; https://doi.org/10.3390/fractalfract6060337
Submission received: 30 April 2022 / Revised: 8 June 2022 / Accepted: 16 June 2022 / Published: 17 June 2022

Abstract

:
Magnesium phosphate cement (MPC) paste is hardened by the acid–base reaction between magnesium oxide and phosphate. This work collects and evaluates the thermodynamic data at 25 °C and a pressure of 0.1 MPa and establishes the hydration reaction model of MPC pastes. The influence of the magnesium–phosphorus molar (M/P) ratio and water-to-binder (W/B) ratio on the hydration product is explored by the thermodynamic simulation. Following this, the initial and ultimate states of the hydration state of MPC pastes are visualized, and the porosity of different pastes as well as fractal analysis are presented. The result shows that a small M/P ratio is beneficial for the formation of main hydration products. The boric acid acts as a retarder, has a significant effect on lowering the pH of the paste, and slows down the formation of hydration products. After the porosity comparison, it can be concluded that the decreasing of M/P and W/B ratios helps reduce porosity. In addition, the fractal dimension Df of MPC pastes is positively proportional to the porosity, and small M/P ratios as well as small W/B ratios are beneficial for reducing the Df of MKPC pastes.

1. Introduction

Magnesium phosphate cement (MPC), also known as chemically bonded ceramics [1], is usually made by dead-burned magnesium oxide with phosphate. It is commonly used in the quick repair of buildings and road traffic [2], solidification of nuclear waste and toxic substances [3], wastewater treatment [4], and restoration of teeth and bones in biology and medicine [5]. Compared with ordinary Portland cement, MPC has a shorter setting time, higher early strength, and better volume stability [2,6,7,8]. In the application of MPC, potassium dihydrogen phosphate (KDP) and ammonium dihydrogen phosphate (ADP) are usually used as the phosphate components. Such MPC added with KDP and ADP are short for MKPC and MAPC, respectively. The main reaction products of MKPC and MAPC-based materials are MgKPO4·6H2O (also called K-struvite) and MgNH4PO4·6H2O (struvite) [9]:
MgO + KH 2 PO 4 + 5 H 2 O MgKPO 4 6 H 2 O
MgO + NH 4 HPO 4 + 5 H 2 O MgNH 4 PO 4 6 H 2 O
The hydration process of MPCs is essentially an exothermic reaction of acid–base neutralization. It is believed that the hydration process of MPC can be divided into several steps: (a) MgO dissolves in water and releases Mg2+ and OH; (b) Mg2+ reacts with water molecules to form a positively charged hydrosol; (c) the hydrosol subsequently forms hydrogen phosphate with hydrogen phosphate ions; (d) the newly generated hydrogen phosphate forms a molecular network in the aqueous solution and then forms a gel [10,11,12].
Since the performance of MPC-based materials is mainly determined by the composition of their hydration products, there is a large number of studies describing the role of the water-to-binder mass ratio (W/B ratio) and the magnesium–phosphorus molar ratio (M/P ratio) in the hydration process of materials [13,14,15]. Xu et al. confirmed the influence of M/P in MKPCs and also concluded that potential hydration products were MgHPO4·3H2O, Mg2KH(PO4)2·15H2O and K-struvite and that there are also unreacted MgO particles in MKPC system. Lahalle et al. [16,17] pointed out that under the experimental conditions of diluting suspension, boric acid retarded the hydration of MKPC, and at the same time, boron did not precipitate in the cement hydrate, nor did it become adsorbed on the surface of MgO particles, but stayed in the solution. However, for recent studies on MAPC-based materials, Sugama et al. [18] pointed out that the main hydration products of MAPC pastes are struvite, Mg3(PO4)2·4H2O, and a small amount of Mg(OH)2 and MgHPO4·3H2O. Abdelrazig et al. [19] showed that (NH4)2Mg(HPO4)2·4H2O was an intermediate product and continued to react to form struvite.
Commonly speaking, cement-based materials such as MPC pastes are considered porous composite materials and have an extremely complex pore structure, which largely determines their mechanical properties [20,21,22]. Recently, fractal analysis has been widely applied in revealing the microstructure properties in different materials [23,24,25], and fractal dimension is proved to be a vital parameter from fractal analysis. Jin et al. [26] showed that the relationship between fractal dimension and capillary pore volume was a negative function. Zhang et al. [27] considered that the fractal dimension of concrete could be estimated by the box-counting method, which is able to be applied on MPC-based materials to provide a further evaluation of the complexity of the pore structures.
At present, the studies on the mechanism of boric acid retardation in MPC-based materials and the relationship between hydration products and pore structure need to be further deepened, and computer simulations on the hydration mechanism of MPC-based materials can potentially serve as a supplement to experimental results of the hydration process of the MPCs [28,29,30,31,32]. This work establishes the hydration reaction model of MPC pastes and presents the method of thermodynamic calculation to study the evolution of hydration products with boric acid, as well as the relationship between the hydration products and pore structure of MAPC and MKPC pastes. Furthermore, fractal analysis is applied on the pore structure of the MPC pastes to evaluate the relationship between the microstructure and M/P or W/B ratios.

2. Methods and Algorithms

2.1. Establishment of a Thermodynamic Database of MPC

Now commonly used thermodynamic simulation software include PHREEQC, GEMS [33], and GWB [34], etc. In this work, PHREEQC is used to stimulate the hydration products of MPC pastes. PHREEQC is designed to perform a wide variety of aqueous geochemical calculations. Before performing thermodynamic simulation, relatively complete and reliable thermodynamic databases must be established. A comparison of different thermodynamic databases is shown in Table 1. During the modeling through PHREEQC with PITZER aqueous model, MINTEQA2 V.4 database was used to deal with the conditions of high ionic strength and complicated ionic interaction in MPC pastes for its extensive ion reaction data in the database. As summarized in Table 2, most of the thermodynamic data for MPC pastes were collected from the literature; others were from MINTEQ databases, where K was the chemical equilibrium constant.

2.2. Hydration Algorithm

In this work, a state-oriented computer model is used to study the microstructure of MPC pastes performing on MATLAB [42]. In the model, there are five phases assumed in the hydration process: MgO particle, KH2PO4 (or NH4H2PO4) particle, inner hydration product, outer hydration product, and large capillary pores. The input parameters of the model are the M/P ratio, W/B ratio, degree of hydration, molar density, and molar mass (as demonstrated in Table 3) of the reactants and hydration products.
This model is based on the growing of spheres assumption; the reaction occurs on the surface of particles and the reactant is consumed layer by layer. The initial state of the hydration of MPC pastes is simulated by randomly distributing MgO and KH2PO4 (or NH4H2PO4) spheres into a representative elementary volume (REV), which is a 100 × 100 × 100 μm3 cubic with the periodic boundary condition. The particle size distributions of MgO, KH2PO4 and NH4H2PO4 are referred to in the experimental data [43,44]; therein, the particles with sizes smaller than 0.5 μm and larger than 45 μm are not considered for efficiency. The REV is discretized into 1000 × 1000 × 1000 cubic voxels with a resolution of 0.1 μm3.
In the ultimate hydration state, KH2PO4 (or NH4H2PO4) particles are fully reacted or dissolved in the solution, while the hydrated products constantly form around the MgO sphere layer by layer until the volume of hydrate is equal to the calculated one in this state. In this model, the layers whose thickness is equal to or smaller than the radius of MgO particles are called inner hydration products; otherwise, they are considered outer hydration products. In MKPC (or MAPC) paste, the inner and outer hydration products are the same, K-struvite (or struvite), so there is no distinction between these two products. The kinetics is not taken into consideration in this simulation.
The algorithm for calculating porosity is called the “Disk Filling Method”, and it is based on the final hydration stage of the MKPC (or MAPC) paste. In this algorithm, a disc with an initial radius is used to fill the pores in the pastes. The radius of the disk continues to increase until the pores are completely filled. Thus, the corresponding pore volumes are considered to be equal to the volumes of these discs. Therefore, when the volume of REV is known, the cumulative porosity of the paste can be obtained.

2.3. Construction of Reaction System

In this work, the hydration simulation of MPC pastes is carried out at 25 °C and 0.1 MPa. The M/P ratio in MKPC pastes varies from 6 to 10, while W/B ratios are determined to be 0.2, 0.25, 0.3, and 0.5. The reaction step is set as 10,000, and the mix proportion of MKPC pastes is shown in Table 4. Moreover, the influence of boric acid as an admixture on the pH value of MKPC paste is analyzed. The mix proportion of reactants is 44.4 g of MgO, 55.6 g of KH2PO4, and 100 g of water. The amount of boric acid in the reactants is 0, 0.25, 1, and 2.5% of the mass of MgO and KH2PO4, as shown in Table 5. For the case of MAPC pastes, another 10 groups of reactants with different ratios are set to react, and the amount of MgO is fixed as 1 mol. The M/P ratio and W/B ratio of MAPC paste are shown in Table 6.
According to Table 2, the development of K-struvite in MKPC pastes and struvite in MAPC pastes must meet the following equalities:
logK   <   loga Mg 2 + + loga K + + loga PO 4 3 - + 6 loga H 2 O
logK   <   loga Mg 2 + + loga NH 4 + + loga PO 4 3 - + 6 loga H 2 O
The hydration process of MPC pastes is simulated based on the minimal energy principle [45]. With initial settings of the reaction and input of the verified database, the ultimate equilibrium phase is obtained. In order to examine the accuracy of calculation for pH of the solution, MP8H5K is taken as an example; it is found that the calculated pH value agrees well with the experimental one from Xu et al. [15], as demonstrated in Figure 1.

2.4. Fractal Analysis of Pore Structure in MKPC Paste

With respect to cement paste, fractal theory plays an important role in the pore structure analysis. Based on fractal theory, there is a relation among the number of pores whose diameters are larger than d, N(d), the probability density function of pore size distribution (f(d)), and the fractal dimension for pore size (Df):
N ( d ) = ( d max / d ) D f
f ( d ) = D f d min D f d - D f - 1
where d, dmax, and dmin are the given, maximum, and minimum pore size of the cement paste. Based on the image theory applied on a cross-section of a paste, Df is able to be obtained using box-counting method [46,47]. For each REV, ten cross-sections are analyzed based on the image analysis to calculate values of Df, which are opposite numbers of slopes of the paradigmatic logarithmic plot of cumulative pore account versus box size. The final Df of a paste is the average of ten values of Df of each cross-section.

3. Simulation Results and Analysis of MKPC Hydration

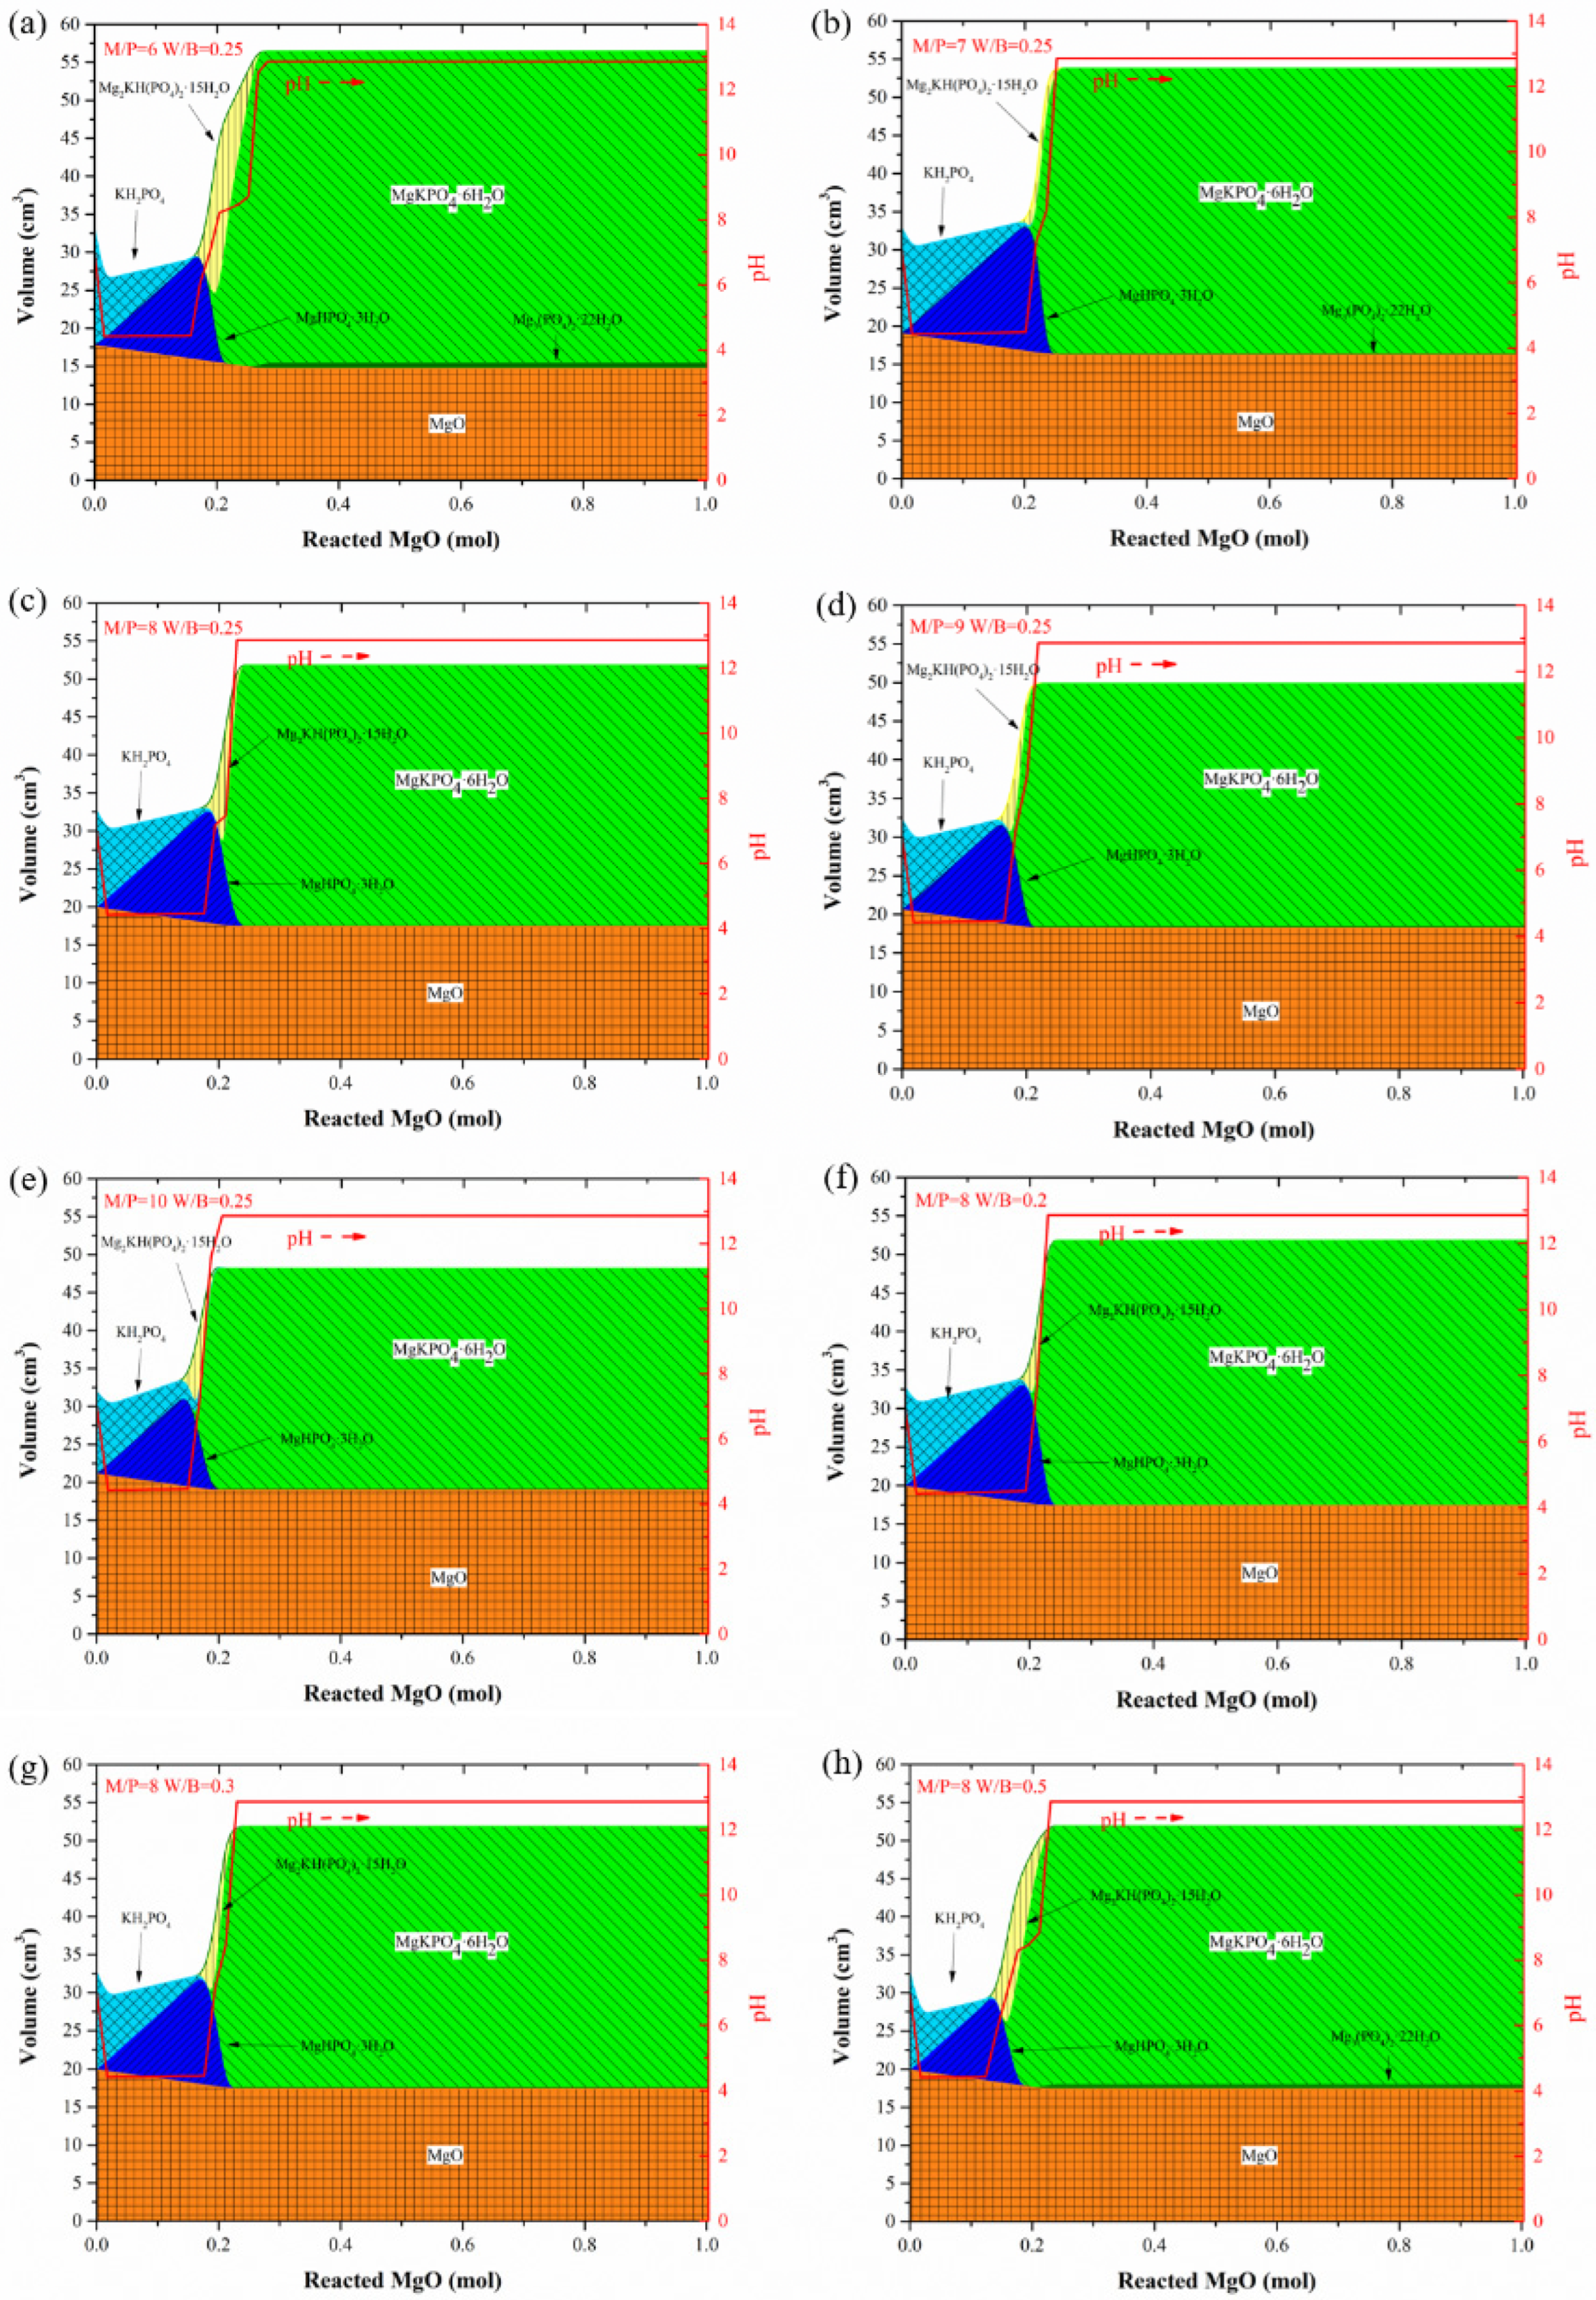
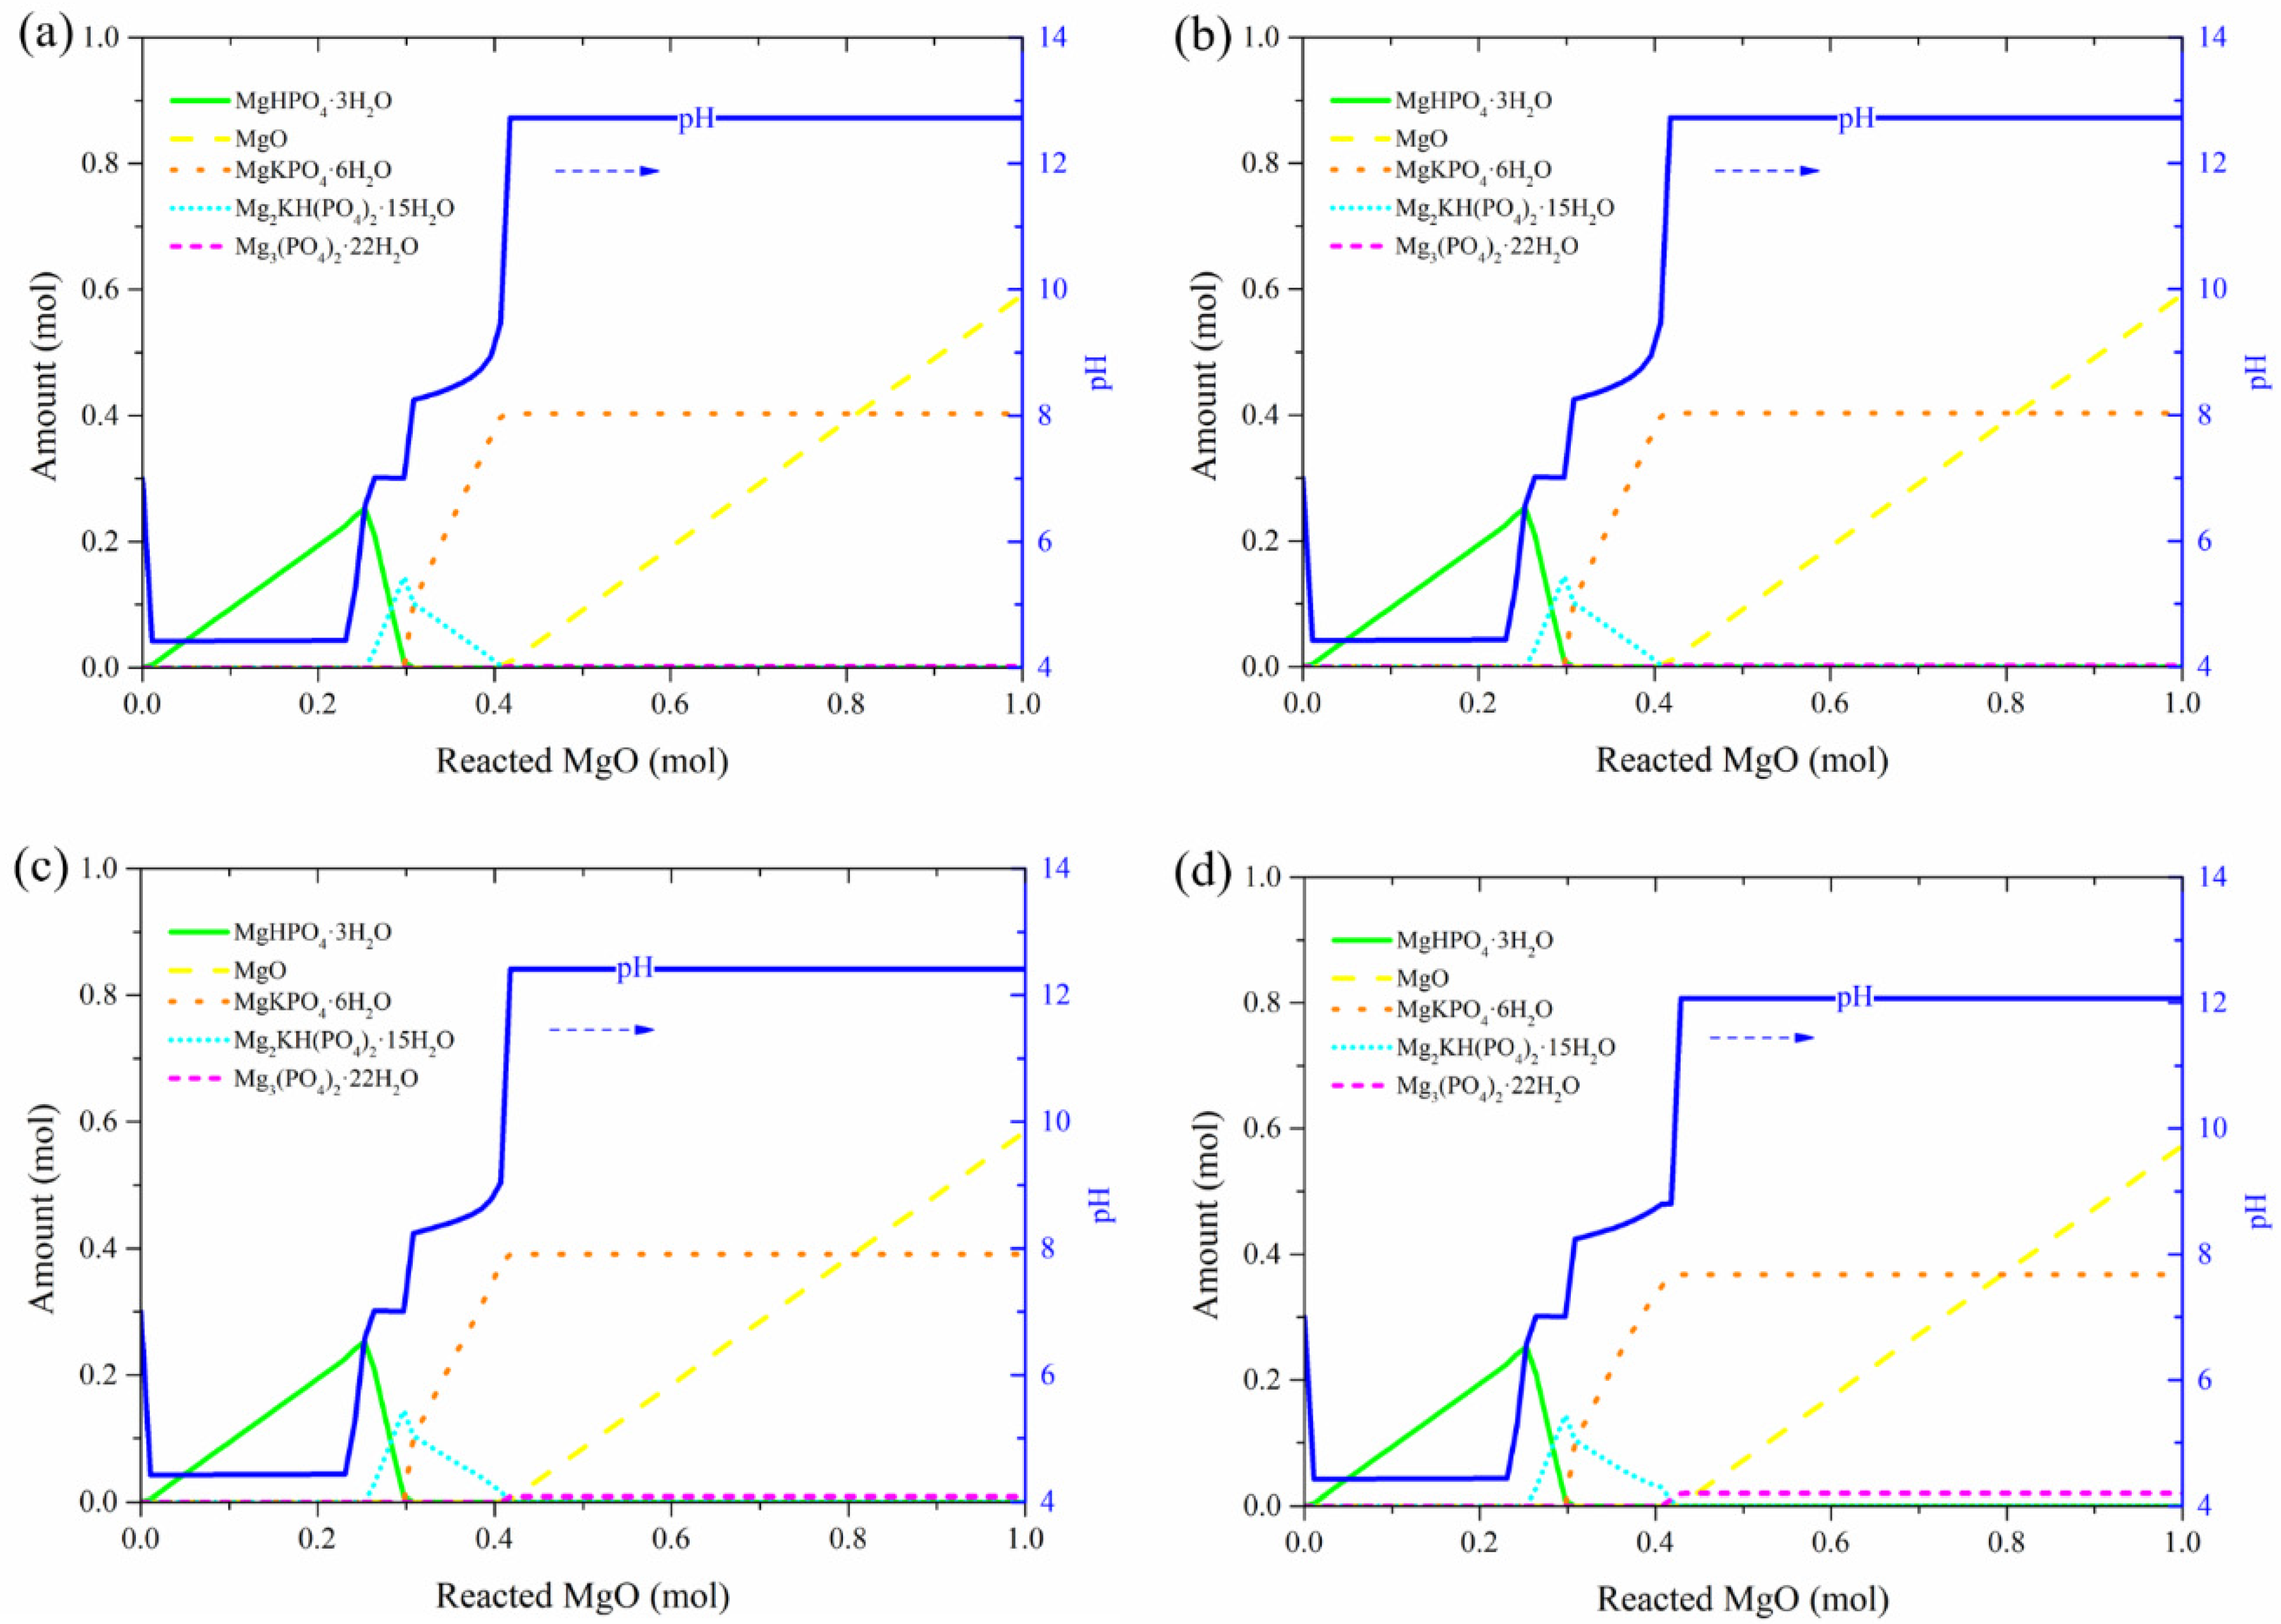
3.1. Influence of M/P and W/B Ratios on Hydration Products in MKPC Pastes

In this section, the simulation hydration results of MKPC pastes are presented. Figure 2 illustrates the evolution of the volume of hydration products and pH values with the reacted amount of MgO in MKPC pastes. From Figure 2, the hydration process of MKPC pastes can be identified as: firstly, KH2PO4 particles quickly dissolve in water and react with magnesium oxide to form MgHPO4·3H2O. Then Mg2KH(PO4)2·15H2O appears and gradually dissolves in MgHPO4·3H2O, and the main hydration product, K-struvite, is formed in large quantities. Additionally, the continuous reaction between MgO particle and water increases the pH value, which leads to the conversion from MgHPO4·3H2O to Mg2KH(PO4)2·15H2O. Then the decomposition of Mg2KH(PO4)2·15H2O and the presence of K-struvite further increase the pH value. Xu et al. [15] considered the final hydration products of MKPC pastes were K-struvite and unreacted MgO with some intermediate products of Mg2KH(PO4)2·15H2O, which shows a great agreement with the simulation results.
It was also found that the increase in the M/P ratio inhibits the formation of K-struvite of MKPC pastes as well as the formation of Mg2KH(PO4)2·15H2O, while a low M/P ratio leads to the formation of Mg2(PO4)3·22H2O. The increase in W/B ratio has little effect on K-struvite. The high W/B ratio also causes the formation of intermediate products such as Mg2(PO4)3·22H2O and Mg2KH(PO4)2·15H2O as well as inhibits the formation of MgHPO4·3H2O. Moreover, no significant differences in the ultimate pH values are found among these eight pastes in Figure 2. Moreover, an increase of pH value in the solution implies that main hydration products are formed in large quantities, and intermediate products simultaneously disappear. The same phenomenon appears for the case of Rouzic et al. and Lahalle et al. [16,48].

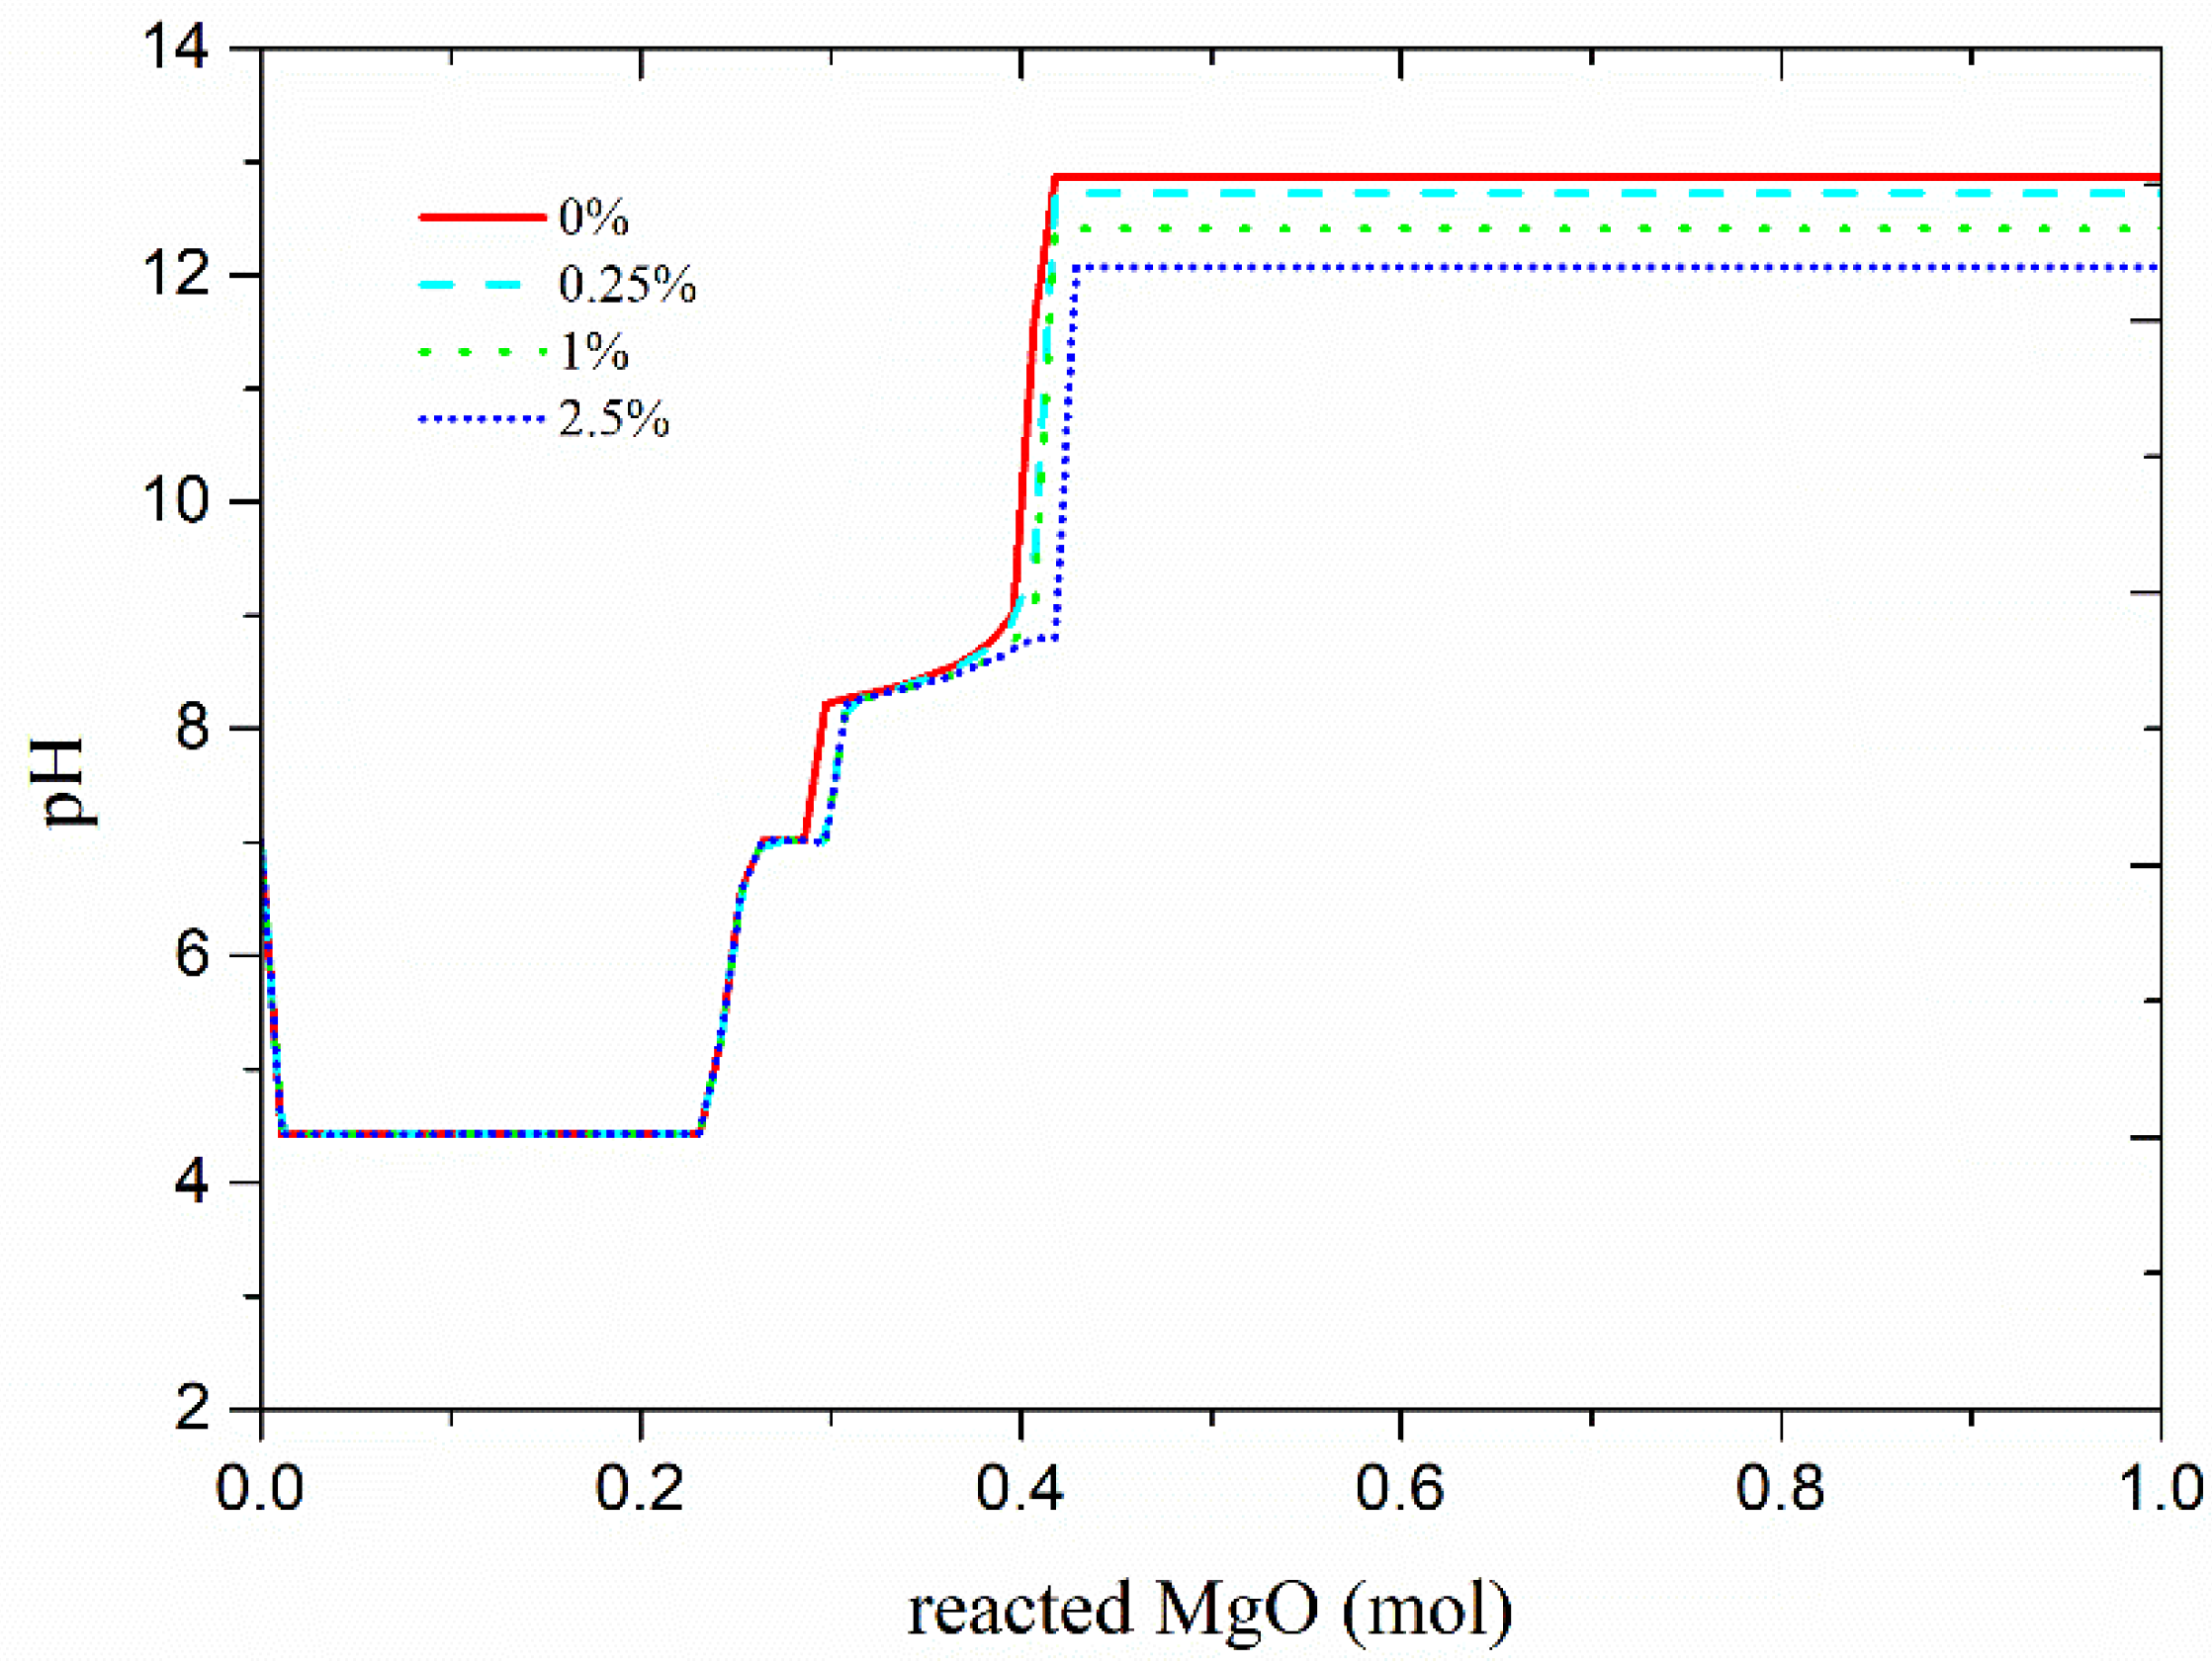
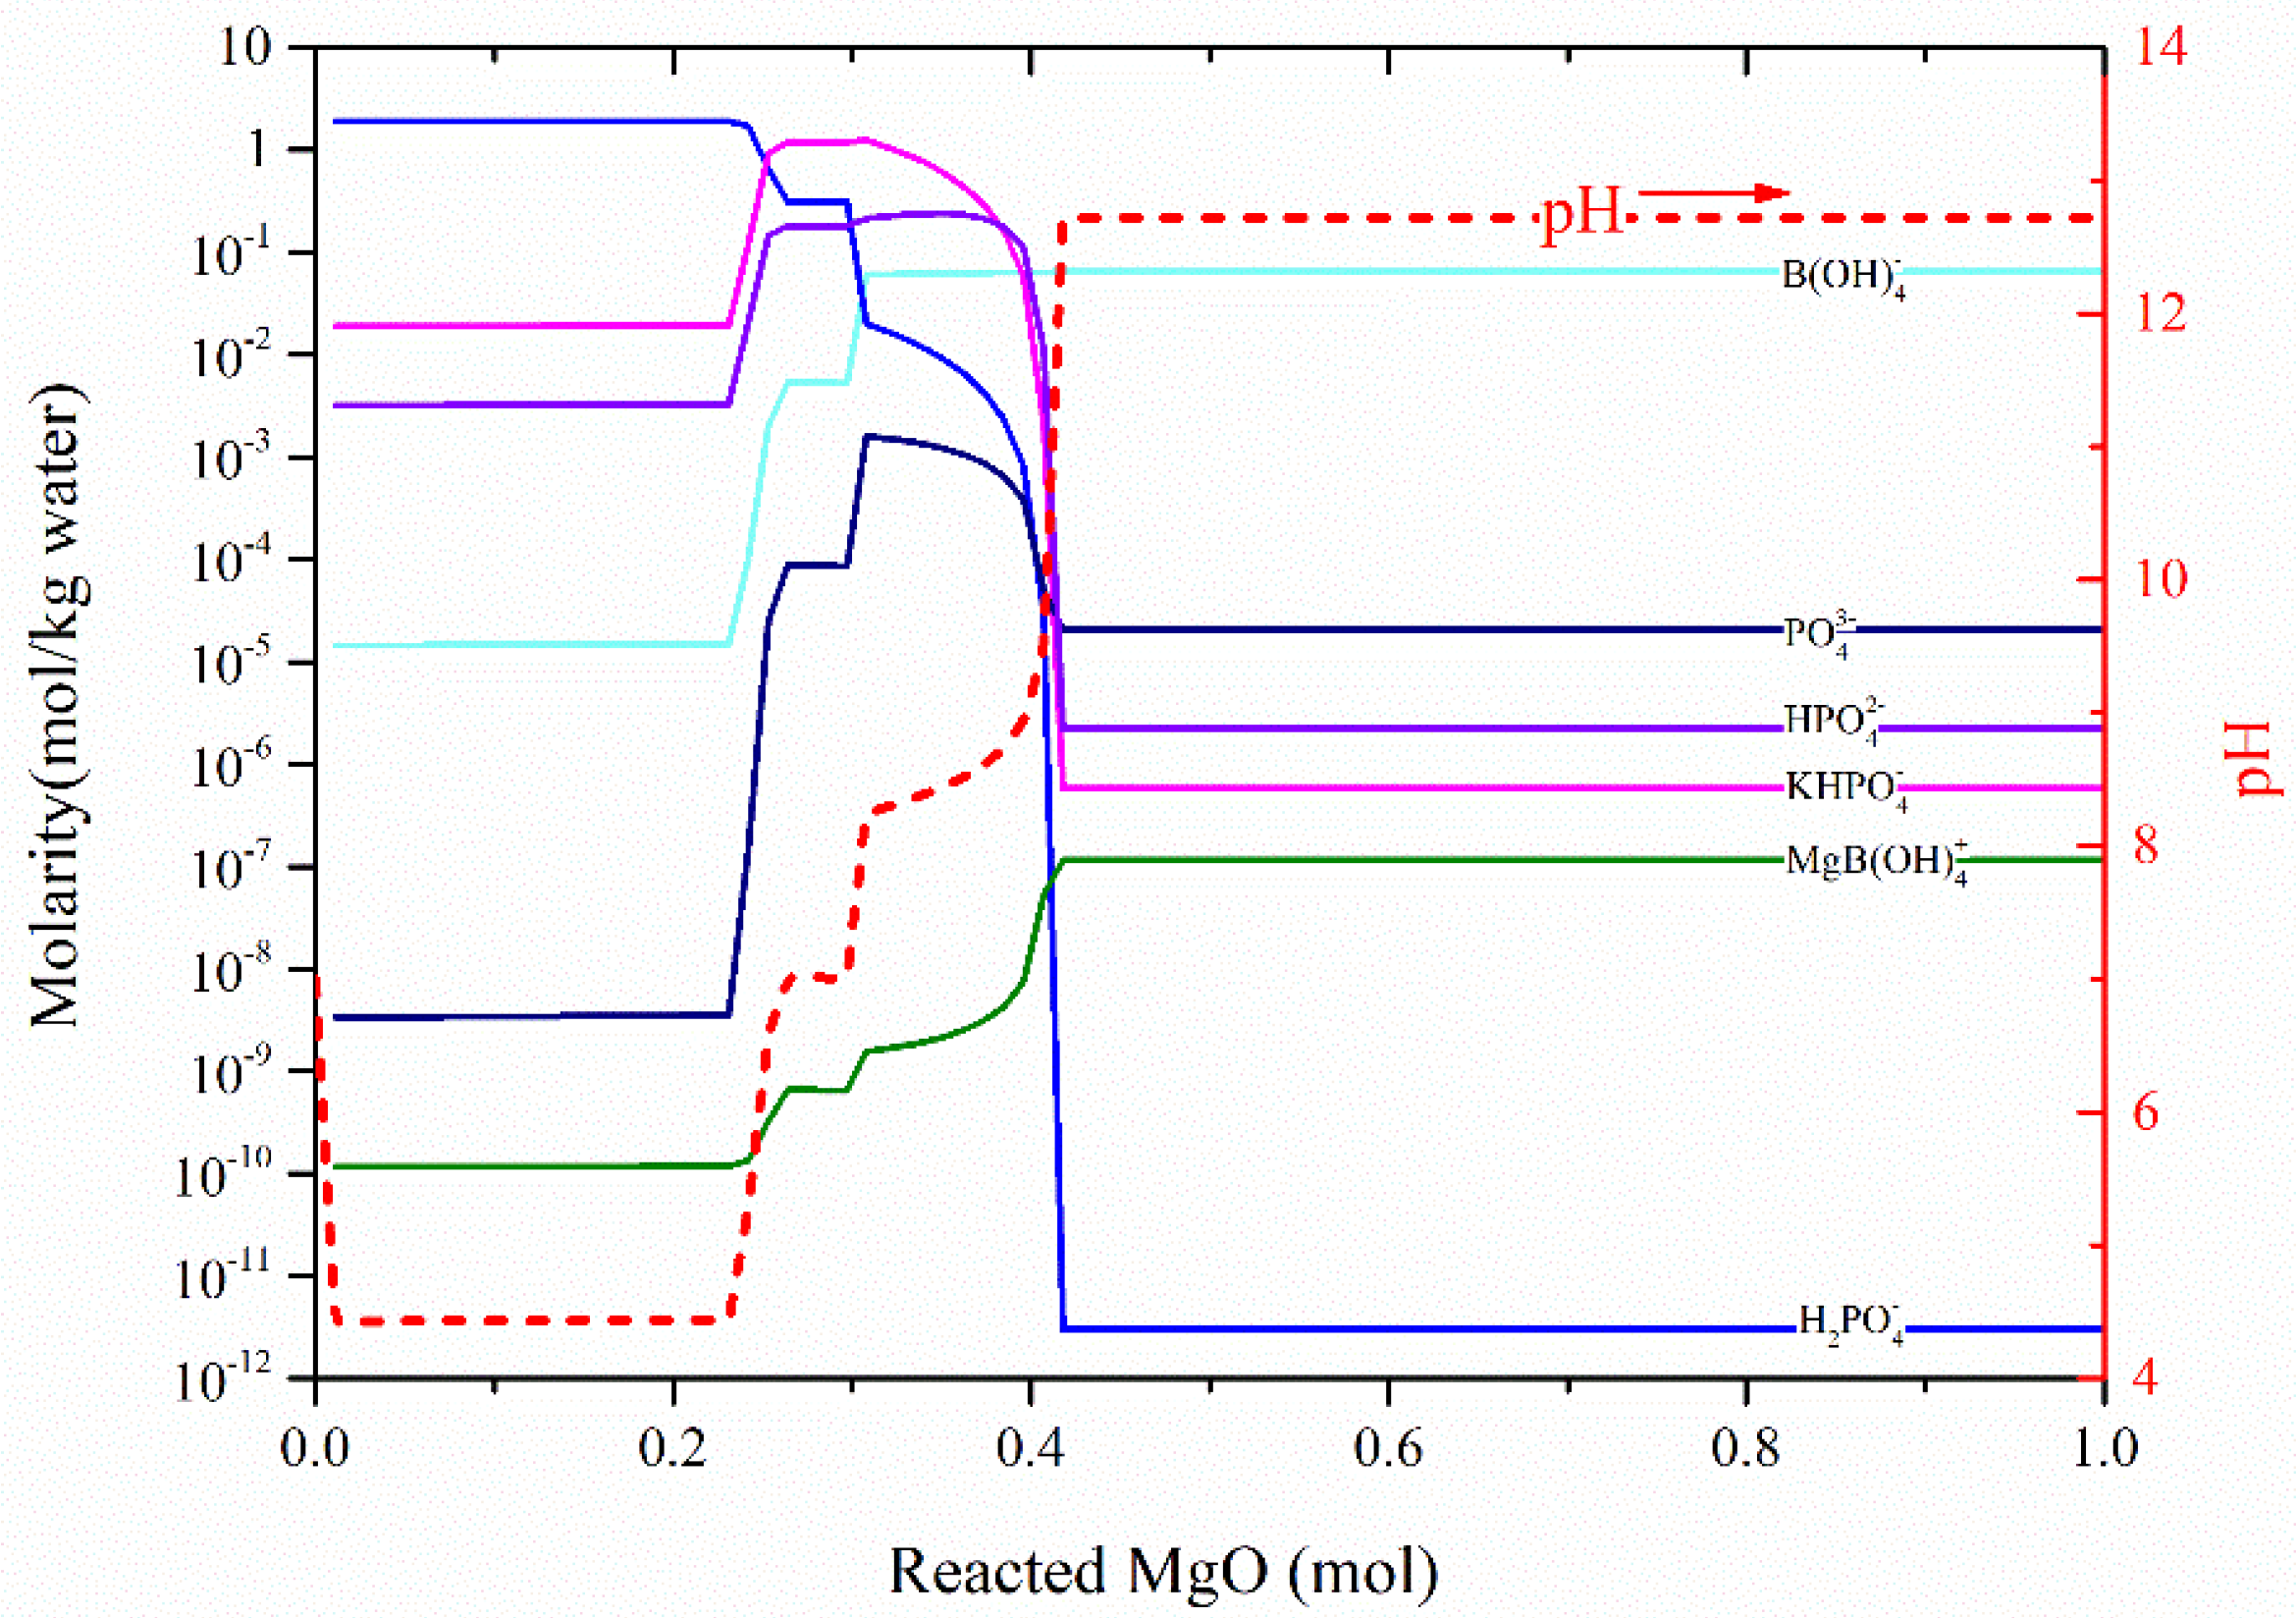
3.2. Influence of Boric Acid on Hydration Products and pH in MKPC Pastes

The evolution of the amount of hydration products with the reacted amount of MgO in each mix proportion of Table 5 is shown in Figure 3, while the corresponding pH values of the pastes are compared in Figure 4. Expectedly, the addition of boric acid significantly decreases the pH value of the paste, inhibits the appearance of K-struvite, and promotes the formation of Mg2(PO4)3·22H2O. A similar phenomenon was observed by Lahalle et al.: boric acid does not slow down the initial dissolution of the reactants (MgO and KH2PO4), but it delays the precipitation of hydration products. In order to illustrate the influence of boric acid on the hydration of MPCs, the evolution of the molarity of ions and pH value in MP2.7B0.25 solution and comparison of the molarity of MP2.7B0.25 and MP2.7B0 are shown in Figure 5 and Figure 6, respectively. It can be found that there are five stages in the evolution of the molarity of the ions in the MKPC solution with boric acid, which are shown in Table 7.
From Table 7 and Figure 3, the hydration process of the MKPC with boric acid can be figured out to some extent. Firstly, MgO particles react with KH2PO4 particles and form MgHPO4·3H2O, and the boric acid dissolves in the solution, forming B ( OH ) 4 - and a small amount of MgB ( OH ) 4 + . Then, the excessive MgO raises the pH of the solution from 4.4 to 7 with part of H 2 PO 4 - changing into PO 4 3 - , HPO 4 2 - , and KHPO 4 - . At the same time, more and more boric acid dissolves into B ( OH ) 4 - and MgB ( OH ) 4 + . When pH reaches seven, there is a plateau because MgHPO4·3H2O gradually changes into Mg2KH(PO4)2·15H2O. When the amount of Mg2KH(PO4)2·15H2O gets to a peak, the pH continuously raises, and K-struvite begins to appear. Because of the formation of MgB ( OH ) 4 + , the amount of K-struvite rises slowly, and the final pH value of the MKPC solution is lower with boric acid than without boric acid, while the ultimate amount of K-struvite is not significantly influenced. It can be also found that the boric acid does not slow down the initial dissolution of MgO and KH2PO4, but MgB ( OH ) 4 + together with B ( OH ) 4 - slows down the formation of K-struvite. The increase of B ( OH ) 4 - affects the molarity of phosphate, while lots of magnesium is combined to form MgB ( OH ) 4 + , which favors the formation of Mg2(PO4)3·22H2O and retards the formation of K-struvite.

3.3. Pore structure of MKPC Pastes

The simulated microstructure of different MKPC pastes in the initial and ultimate hydration state is shown in Figure 7. Different phases are represented by different colors: orange, light blue, green, and dark blue represent the MgO particle, KH2PO4 particle, K-struvite, and pore (or water). From Figure 7, it is anticipated that KH2PO4 particles are totally dissolved in the water or completely reacted in the paste, and MgO particles are redistributed throughout the REV due to the long-term reaction. It can be also found that small MgO particles are completely hydrated due to the fast reaction rate, while the hydration part of large MgO particles is controlled by the water diffusion in the deposited hydrates covering the surface of MgO particles. Therefore, once the external hydrate is decomposed into water and MgO particles are exposed to water, the internal non-hydrated MgO part may be hydrated again. In addition, during the hydration process, with the increase of the ion concentration in the solution, K-struvite is also gradually formed around the particles, and together with MgO and the hydration products on its surface, it forms the skeleton of the cement paste, contributing to the increase of paste strength. The original pores of MKPC pastes in the initial hydration state are gradually filled by hydration products, and the large capillary pores in the ultimate hydration state are the voids left by the cement particles that are not filled by hydration products and the ones by the water-filled spaces.
It is generally believed that cement-based materials have a porous structure, and their porosities significantly affect the mechanical properties and durability of the materials [21]. Therefore, porosity, as the most commonly used indicator, is adopted in this work to evaluate MKPC pastes. The porosity of MP8H0.25K is compared with experimental data determined by the mercury intrusion porosimetry test to verify the reliability of the porosity derivation, which is presented in Figure 8.
Additionally, the comparison of cumulative porosity in different MKPC pastes is shown in Figure 9. It is apparent from the figures that the cumulative porosity of MKPC pastes decreases from 18.3% to 3.77% with the decrease of M/P ratio from 10 to 6 when W/B ratio is fixed at 0.25. This result is potentially attributed to the fact that the increase of KH2PO4 particle in the paste leads to a large amount of K-struvite and thus a small porosity. On the contrary, the increase of the W/B ratio casts a negative impact on the porosity evolution of MKPC pastes. In general, the pore size of the MKPC paste is between 100 and 5000 nm, which is in agreement with Ma et al., and with the increase of W/B and M/P ratios, the proportion of large pores remarkably increases.

3.4. Analysis of Fractal Features of MKPC Pastes

Based on pore structure analysis and Equations (3) and (4), an analysis of fractal features of MKPC pastes was performed. The calculated Df in MKPC pastes are shown in Figure 10, which is in good agreement with Yu et al. and Tang et al. [49], while the difference between the simulation data and experimental data is potentially caused by the difference in pore size distribution. It is presented in Figure 10 that the Df in the MKPC pastes varies between 1.4 and 2, which is consistent with the literature. Additionally, the Df of MKPC paste increases as the porosity of the pastes increases, and the larger the porosity grows, the slower Df increases. In this work, the Df of MKPC pastes in the ultimate stage is smaller than that in initial stage because the hydration products of MKPC pastes fill in the pores in the initial stage, as the small Df attributes to the small porosity in the ultimate stage.
Moreover, the Df of MKPC pastes in this work is related to the M/P ratio and W/B ratio. As shown in Figure 9 and Figure 10, a small M/P ratio as well as a small W/B ratio gives birth to a small Df. This phenomenon may be explained, as the small M/P ratio leads to a large amount of K-struvite and small capillary pores, which results in a small Df, while the small W/B ratio enables a small fraction of water in the total volume of MKPC pastes in the initial stage, resulting in a relatively large faction of small pores rather than large pores.

4. Simulation Results and Analysis of MAPC Hydration

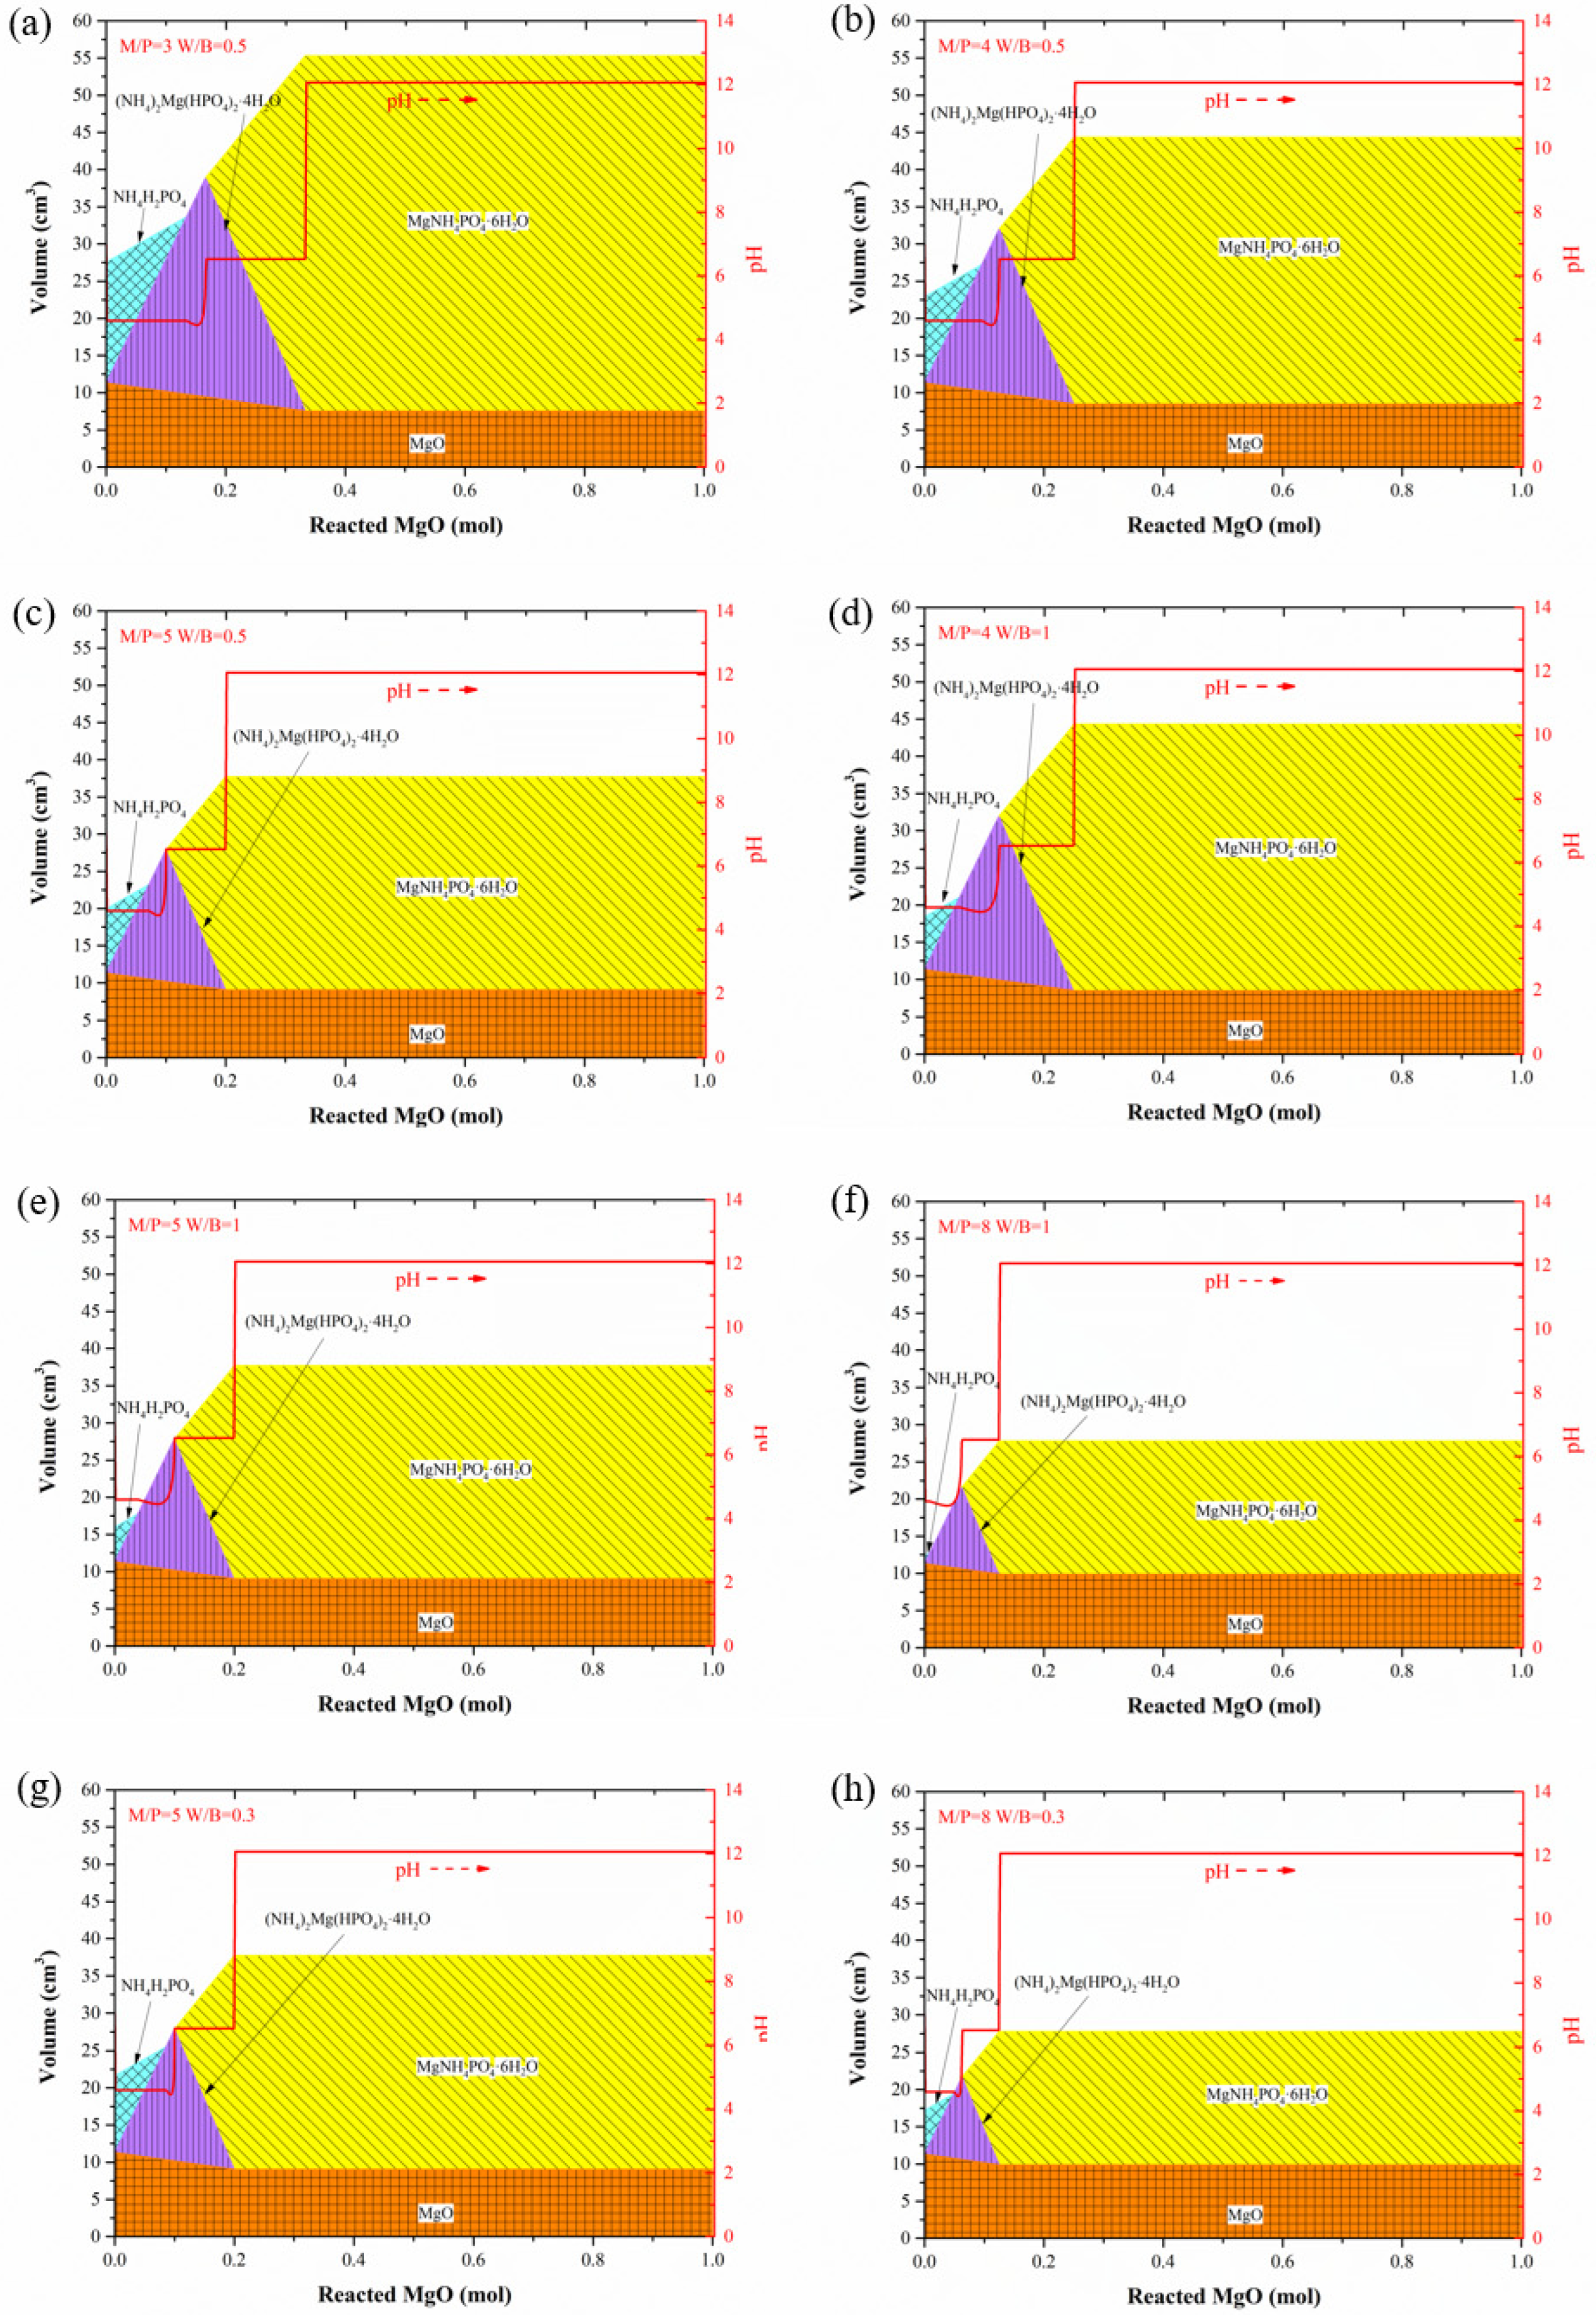
4.1. Influence of M/P and W/B Ratios on Hydration Products in MAPC Pastes

Figure 11 illustrates the evolution of volume of hydration product and pH value with the reacted amount of MgO in the MAPC pastes. In Figure 11, yellow, green, blue, and brown colors represent the struvite, (NH4)2Mg(HPO4)2·4H2O, MgO, and NH4H2PO4. The initial pH value of MAPC pastes is 4.59, and with the addition of MgO, the pH expectedly increases. Compared with Figure 11, the influence of M/P ratio has a more profound effect on the change of pH value than that of W/B ratio in the paste. Due to the presence of MgO, the pH in the system has a short plateau, and then rapidly rises to around 6 and 12 for second and third plateaus. Compared with Figure 11c,e,g, when M/P ratio is fixed, W/B ratio hardly affects the type and volume of hydration products.
MgHPO4·3H2O is basically not generated in Figure 11 above, which is in line with the report in the literature [40]. (NH4)2Mg(HPO4)2·4H2O and struvite appear in sequence when the reaction progresses in a high M/P ratio. However, when M/P ratio is equal to 0.5, the final product is only (NH4)2Mg(HPO4)2·4H2O. Accordingly, when M/P ratio is low, the intermediate product (NH4)2Mg(HPO4)2·4H2O is generated in a large amount, while a high M/P ratio in turn inhibits the formation of intermediate products and promotes the formation of struvite. In addition, in Figure 11, the pH value of the paste remains stable when (NH4)2Mg(HPO4)2·4H2O turns into struvite. The reacted MgO constantly releases Mg+ into the system and directly reacts with (NH4)2Mg(HPO4)2·4H2O, forming struvite without releasing ammonium ion and phosphate into the system. While the amount of struvite in the system reaches a peak, the excessive MgO raises the pH of the solution rapidly.

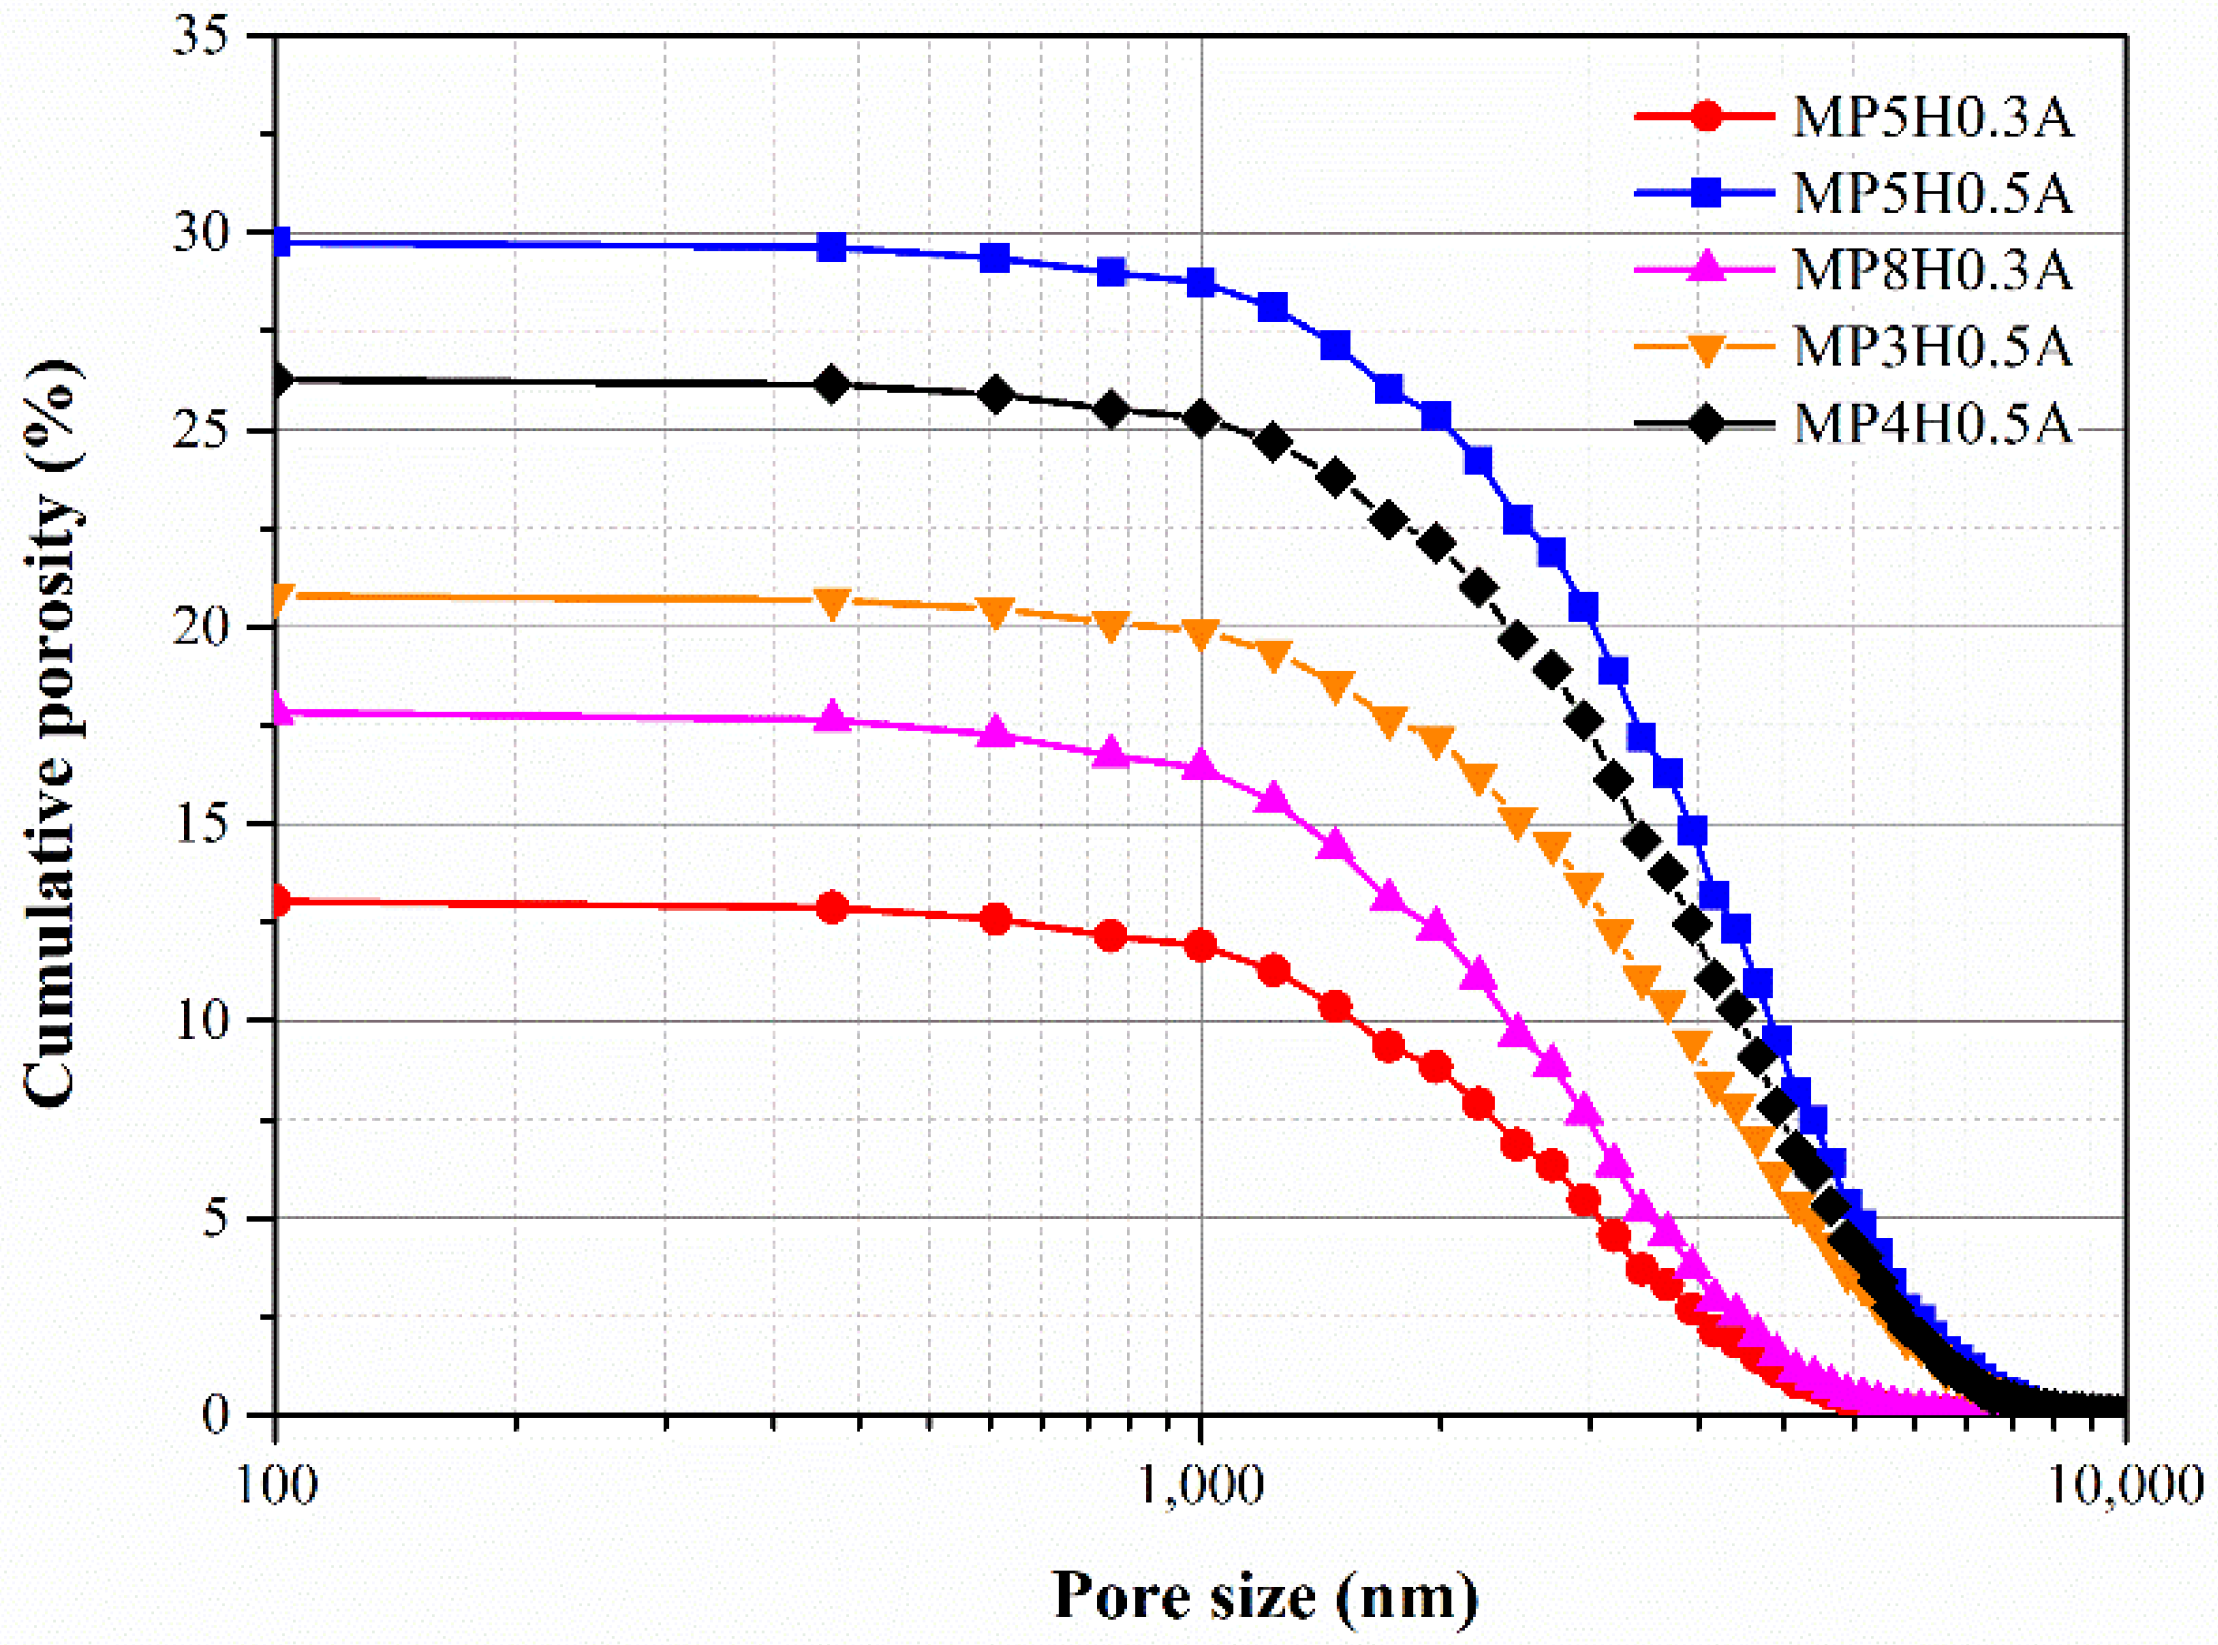
4.2. Pore Structure of MAPC Pastes

In Figure 12, the simulated microstructure of different MAPC pastes in the initial and ultimate hydration state is presented. Yellow, light blue, and green spheres represent MgO, NH4H2PO4, and struvite, while dark blue is for water and pores. As shown in Figure 12, in the ultimate state, the reaction occurs on the surface of MgO that is often covered by struvite and hardly can be completely hydrated, and the excessive MgO particles may act as aggregates, enhancing the stability and strength of the paste structure. It is found that when the M/P ratio is fixed, within a certain range, the smaller the W/B ratio is, the denser the formed paste structure is, which is in line with Wang et al. [51]. These trends are similar with ones of MKPC pastes.
Figure 13 is the comparison of cumulative porosity in different MAPC pastes. When W/B ratio is 0.3, the cumulative porosities of MP5H0.3A and MP8H0.3A are smaller than 20%. Relatively speaking, the sequence of cumulative porosity is MP4H0.5A > MP5H0.5A > MP3H0.5A > MP8H0.3A > MP5H0.3A. In practical application, when the M/P ratio is larger than one, it is conductive to the formation of hydration products. It can be found from Figure 13 that when M/P ratio is fixed at five, the hydration product structure of MP5H0.3A is the densest, a small W/B ratio obviously leads to a compact structure of the final cement paste, and vice versa. When W/B ratio is fixed, as M/P ratio increases from three to five, the cumulative porosity increases from 20.79% to 29.75%, which may be attributed by the decrease of the volume fraction of struvite in MAPC pastes. According to Figure 12, as the ultimate state of MAPC pastes is composed of struvite and excessive MgO, the decrease of M/P ratio significantly increases the volume of the whole paste as well as enlarges the volume fraction of struvite inside. Moreover, the fraction of small pores in the cumulative porosity of pastes with a low W/B ratio is larger than that of pastes with a high W/B ratio; MgO particles are remarkably separated for the case of a high W/B ratio and beneficial for the formation of pores with a large size within struvite.

4.3. Comparison between MKPC System and MAPC System

Due to the presence of ammonium ion, the pH of MAPC paste is lower than that of MKPC one, and it can be found that the hydration process of MKPC paste is more complicated than that of the MAPC one. More intermediate hydration products show up in the hydration process of MKPC pastes than those of MAPC ones. For example, MgHPO4·3H2O hardly appears in the hydration process of MAPC pastes, while it is the main intermediate product in the MKPC one. A similar phenomenon was found by Han et al. and Zhang et al. [41]. Generally speaking, with respect to the same condition and mix proportion, the cumulative porosity of MKPC pastes is lower than MAPC ones. The comparison of porosities among simulated and experimental results is shown in Table 8. Although the molar volume of struvite and K-struvite are close, the volume fraction of K-struvite in MKPC paste is larger than that of struvite in MAPC ones, which leads to a smaller porosity in MKPC paste at the same mix proportion.

5. Conclusions and Prospects

Several conclusions can be drawn:
(1)
M/P and W/B ratios significantly affect the hydration products in MKPC pastes. In the hydration process of MKPC pastes, intermediate products, such as MgHPO4·3H2O and Mg2KH(PO4)2·15H2O, form first before the appearance of the main hydration product, K-struvite, and Mg2(PO4)3·22H2O is generated in a small amount together with K-struvite. Additionally, the increase in the M/P ratio inhibits the formation of K-struvite, and a low M/P ratio facilitates the formation of intermediate products. A high W/B ratio also causes the formation of intermediate products and accelerates the formation of K-struvite. As for MAPC pastes, M/P and W/B ratios play the same role in the influence of the main hydration product. With the hydration process, the intermediate product (NH4)2Mg(HPO4)2·4H2O is gradually replaced by struvite.
(2)
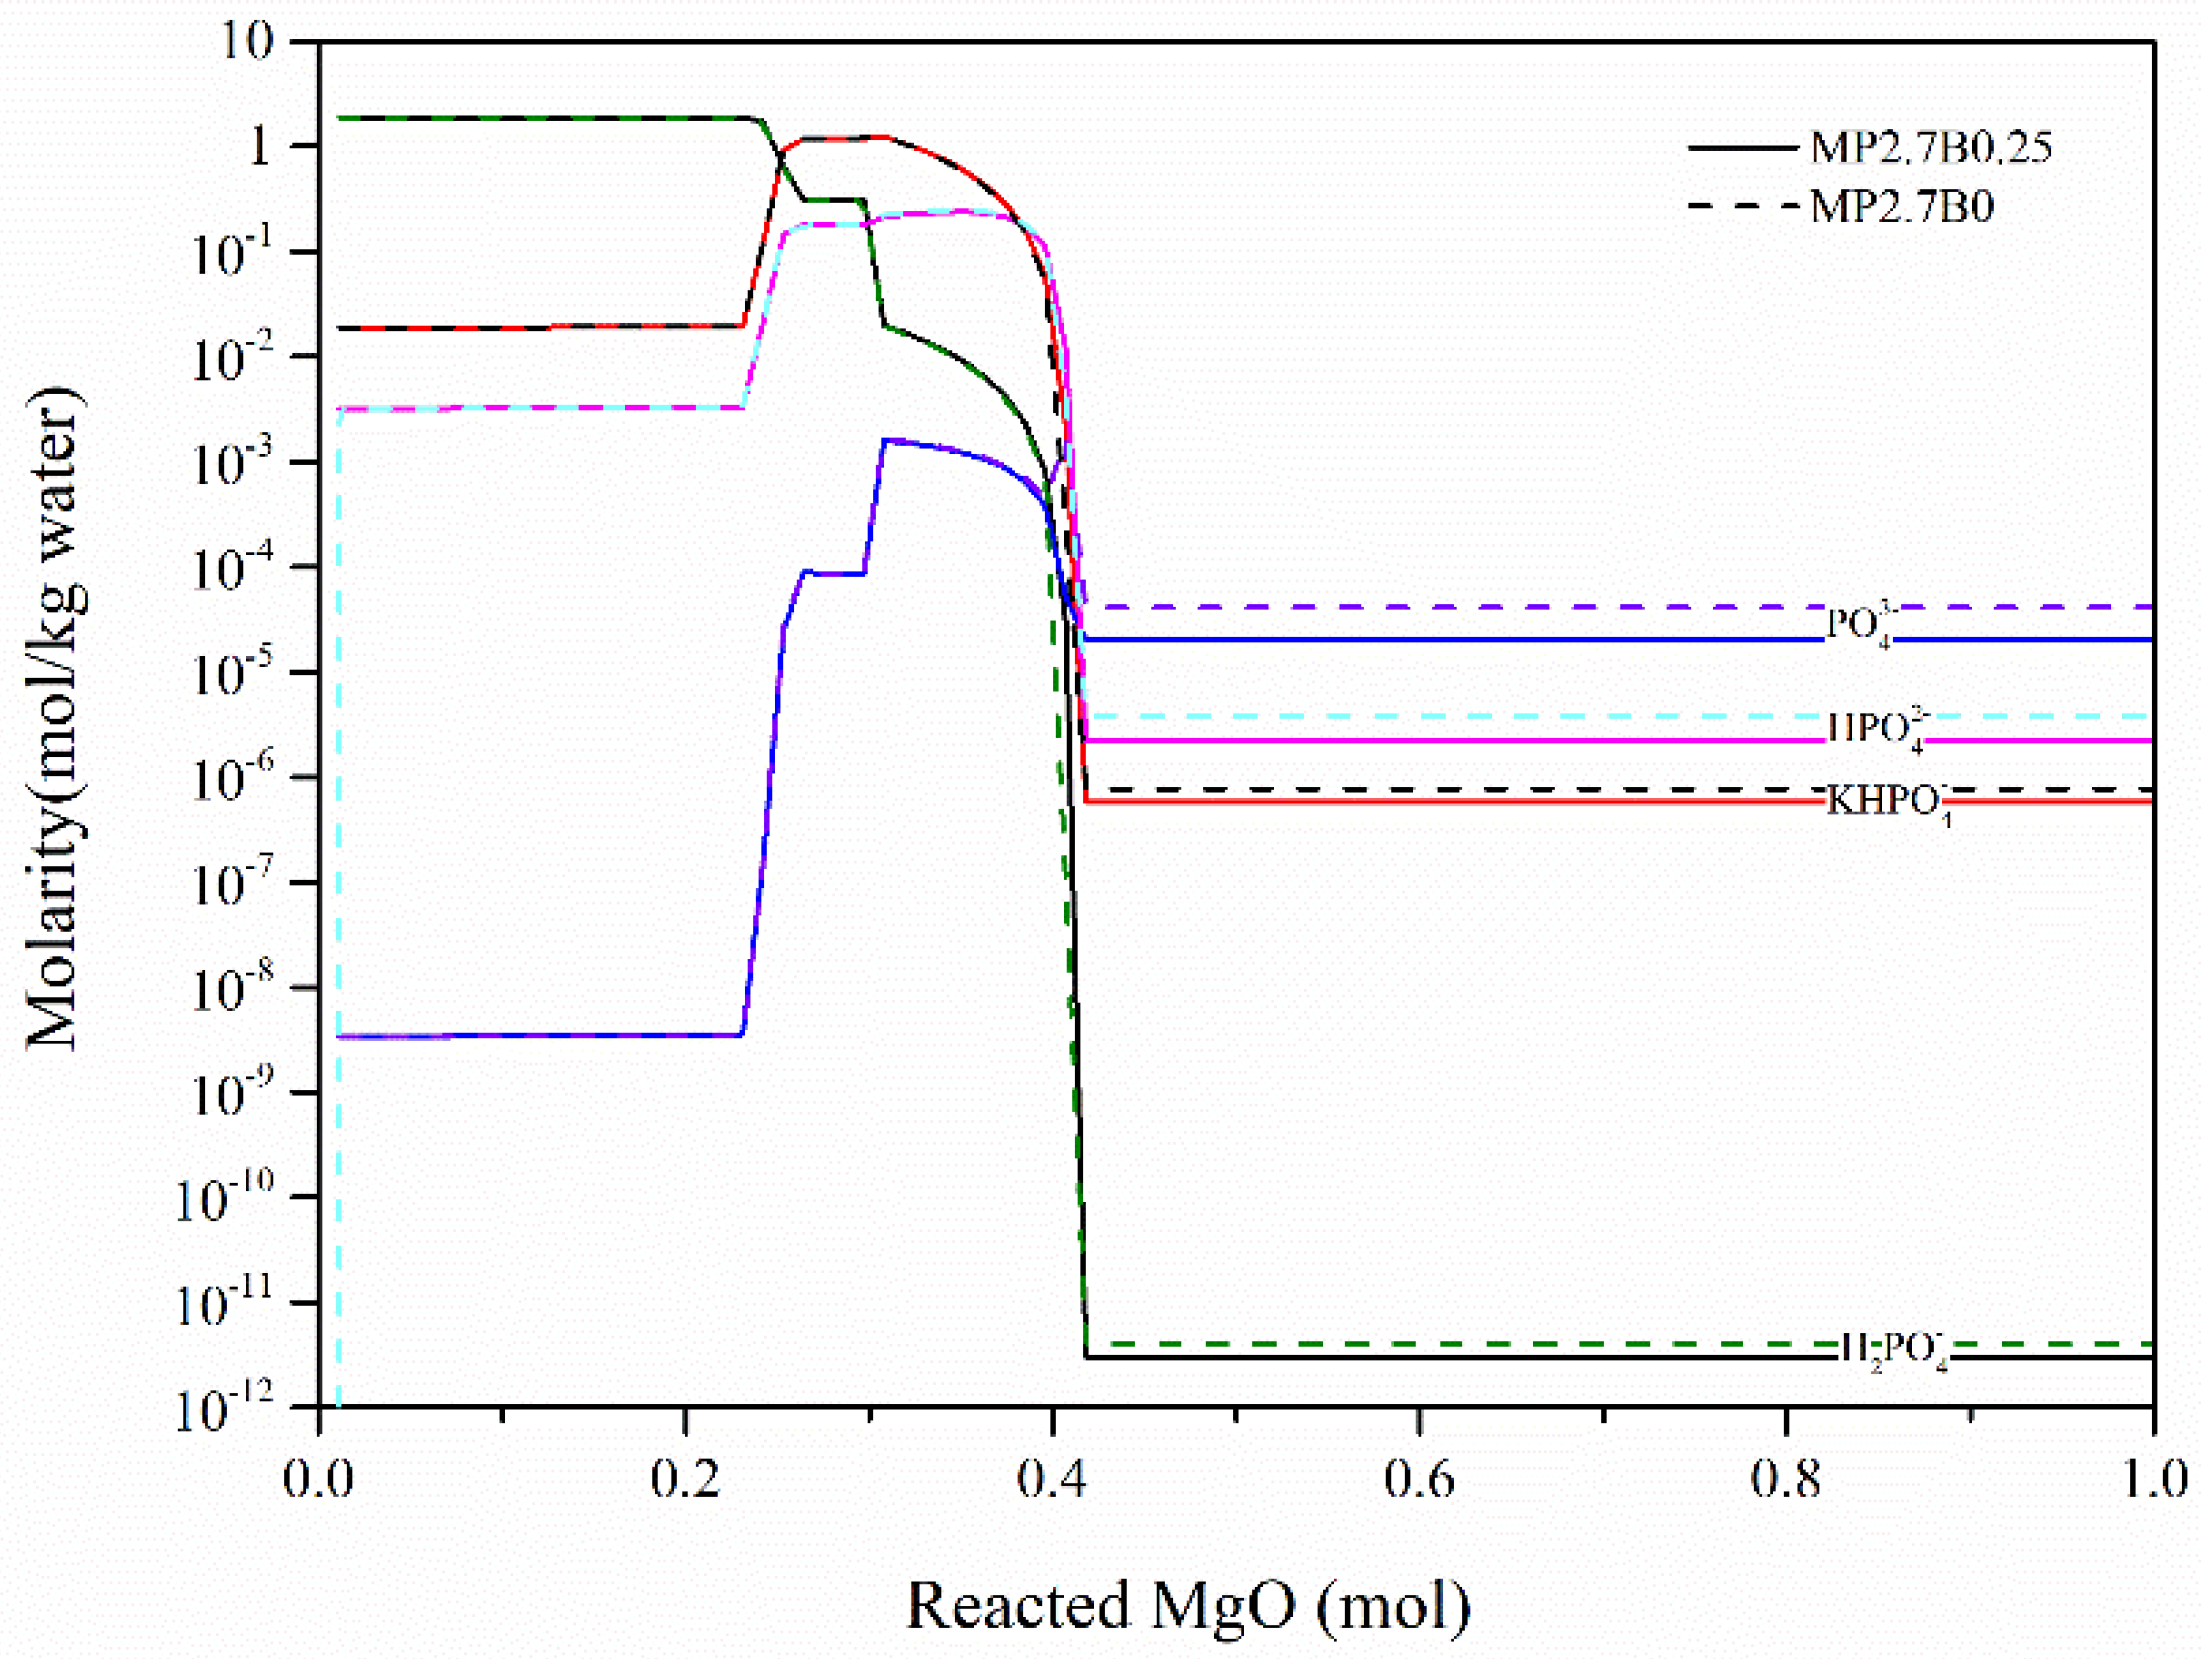
The addition of boric acid significantly reduces the pH of the reaction, inhibits the formation of K-struvite, as well as promotes the formation of intermediate products. The boric acid does not slow down the initial dissolution of MgO and KH2PO4, but MgB ( OH ) 4 + together with B ( OH ) 4 - slows down the formation of K-struvite and lowers the pH value of the solution.
(3)
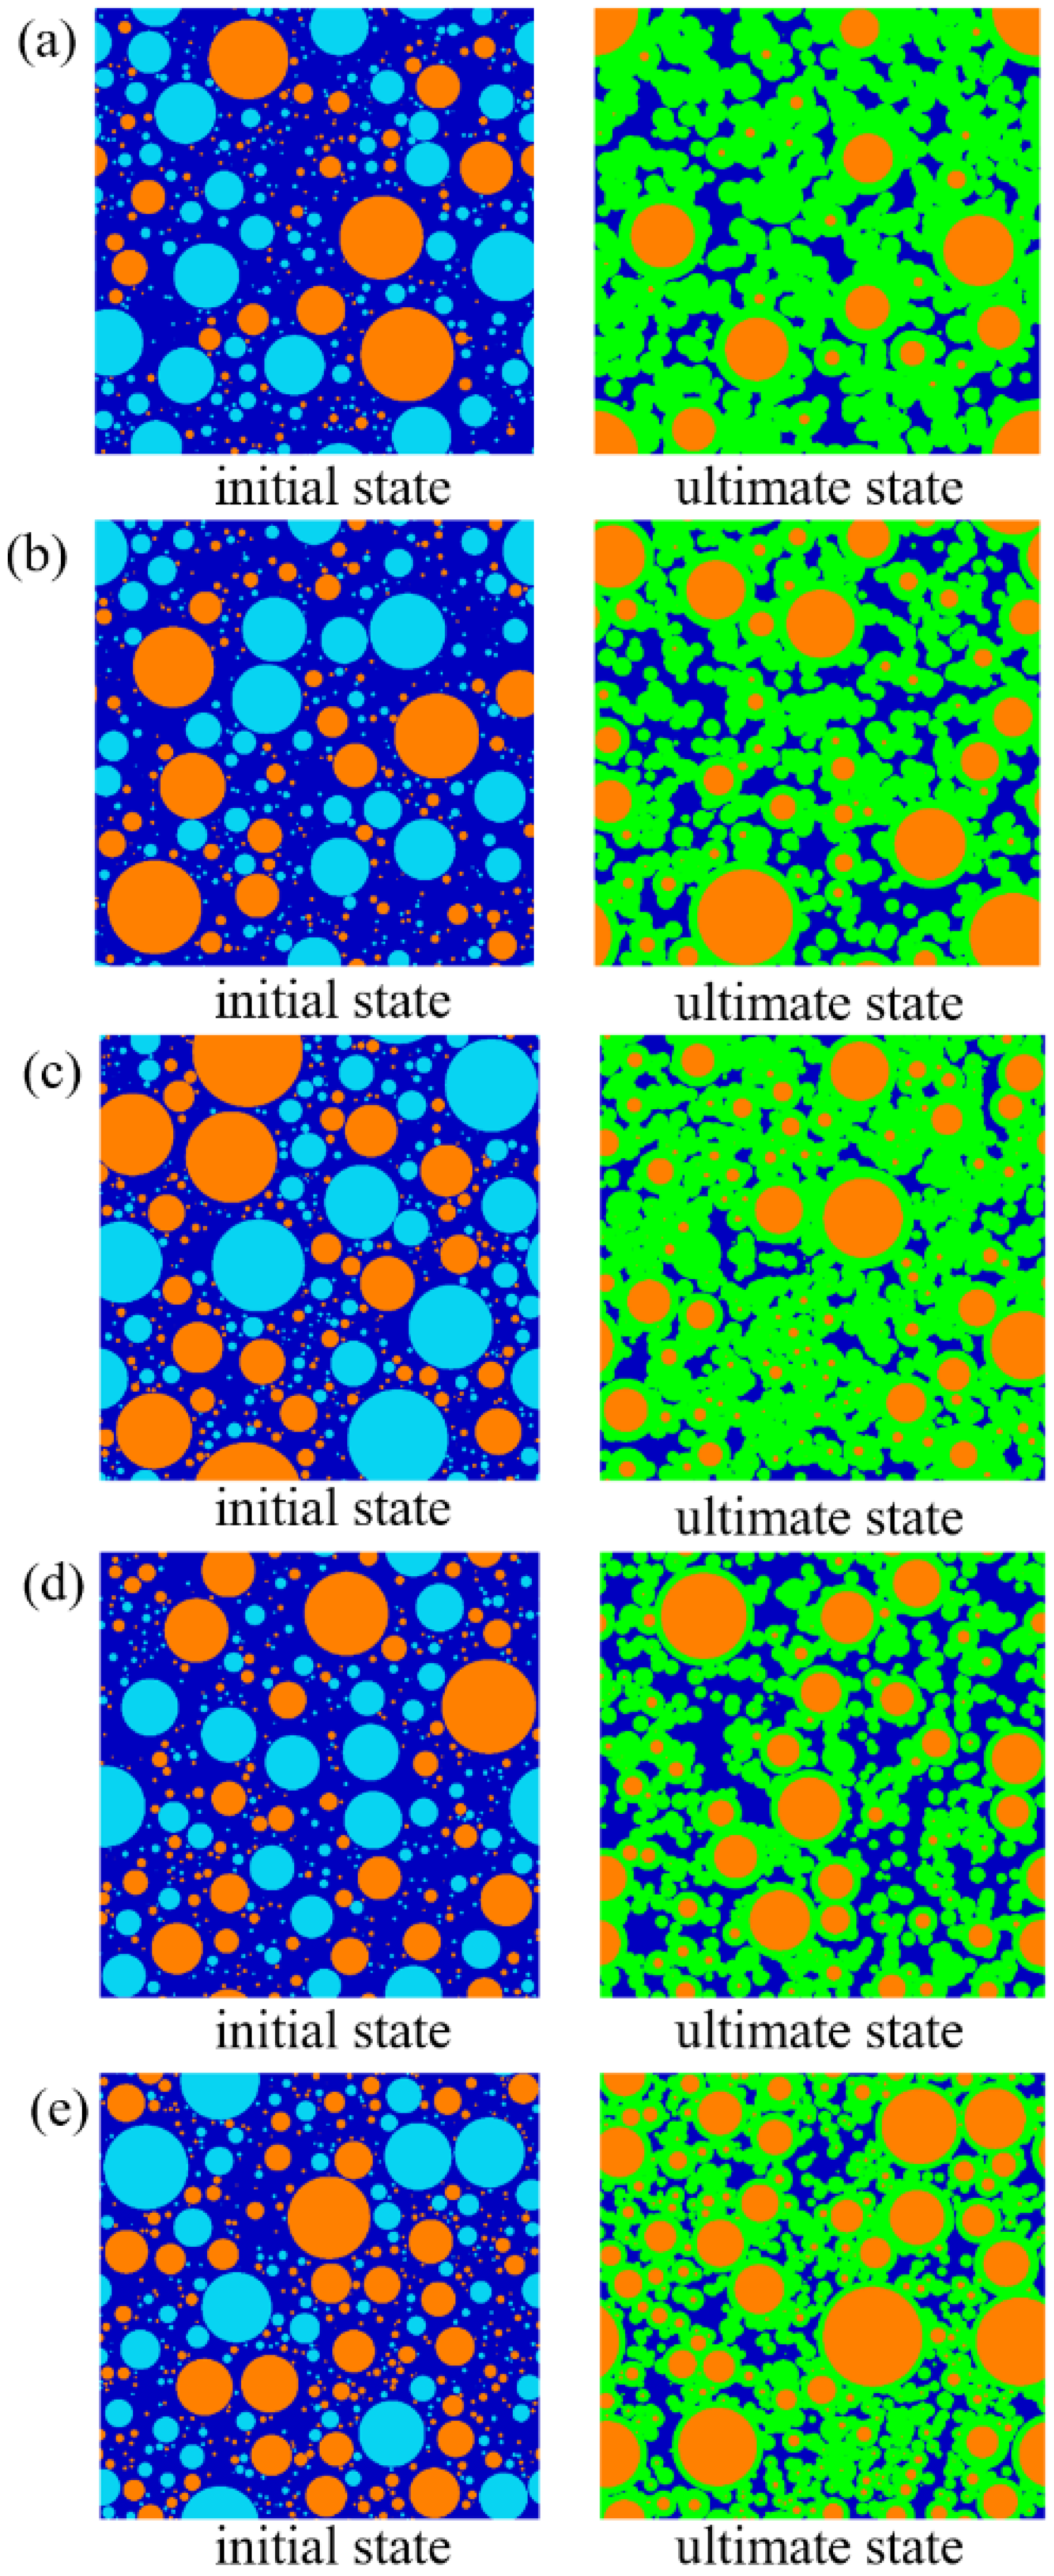
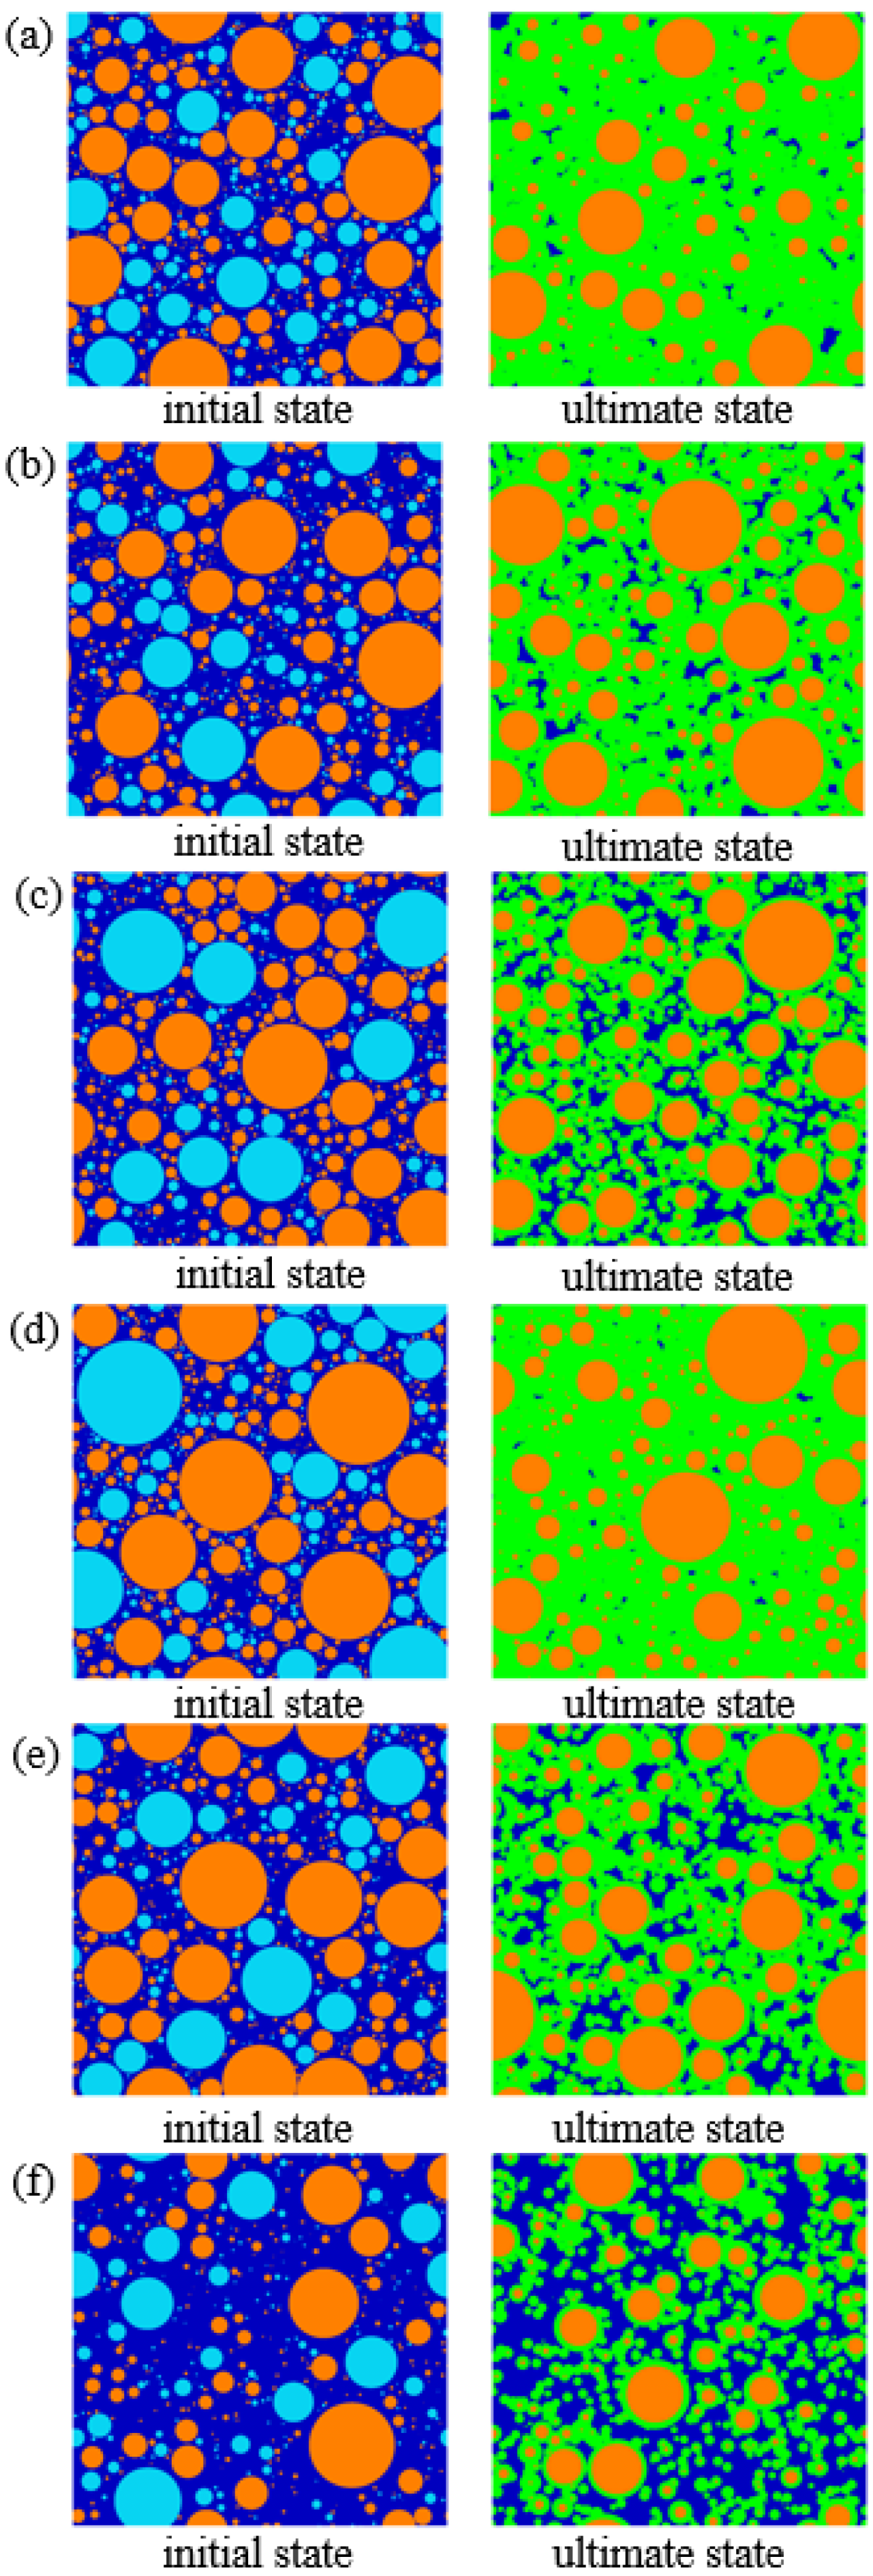
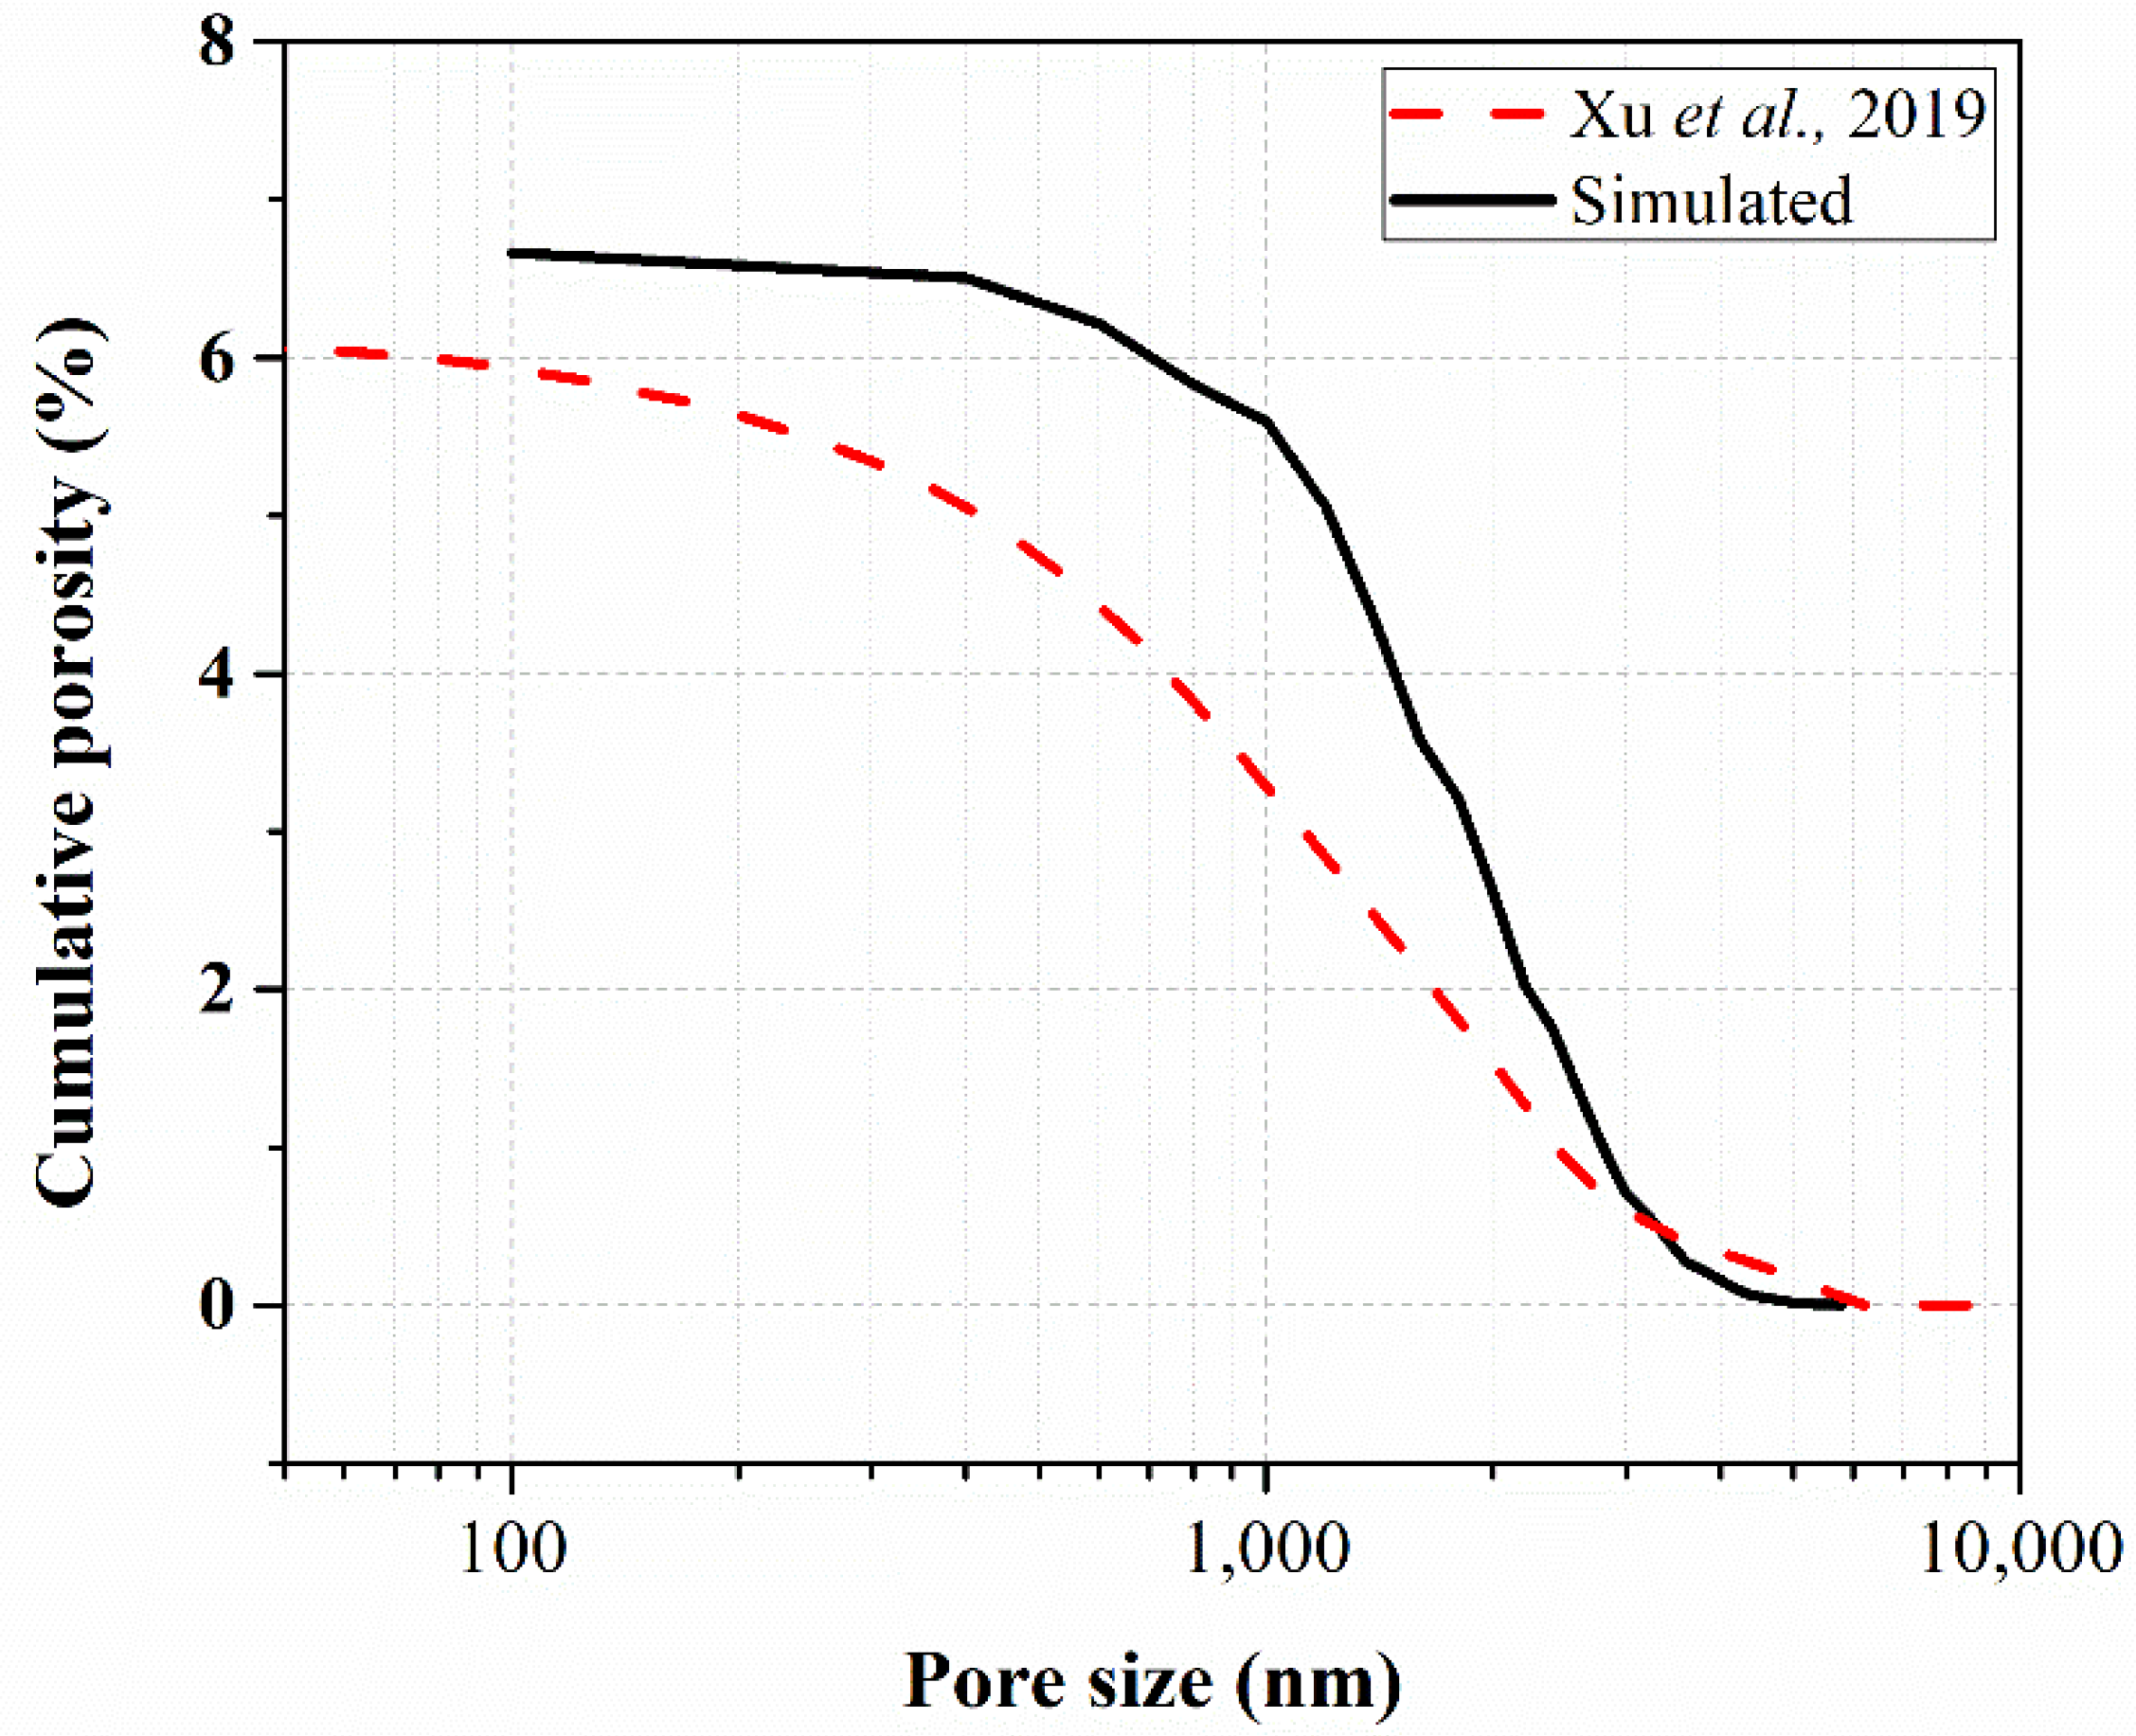
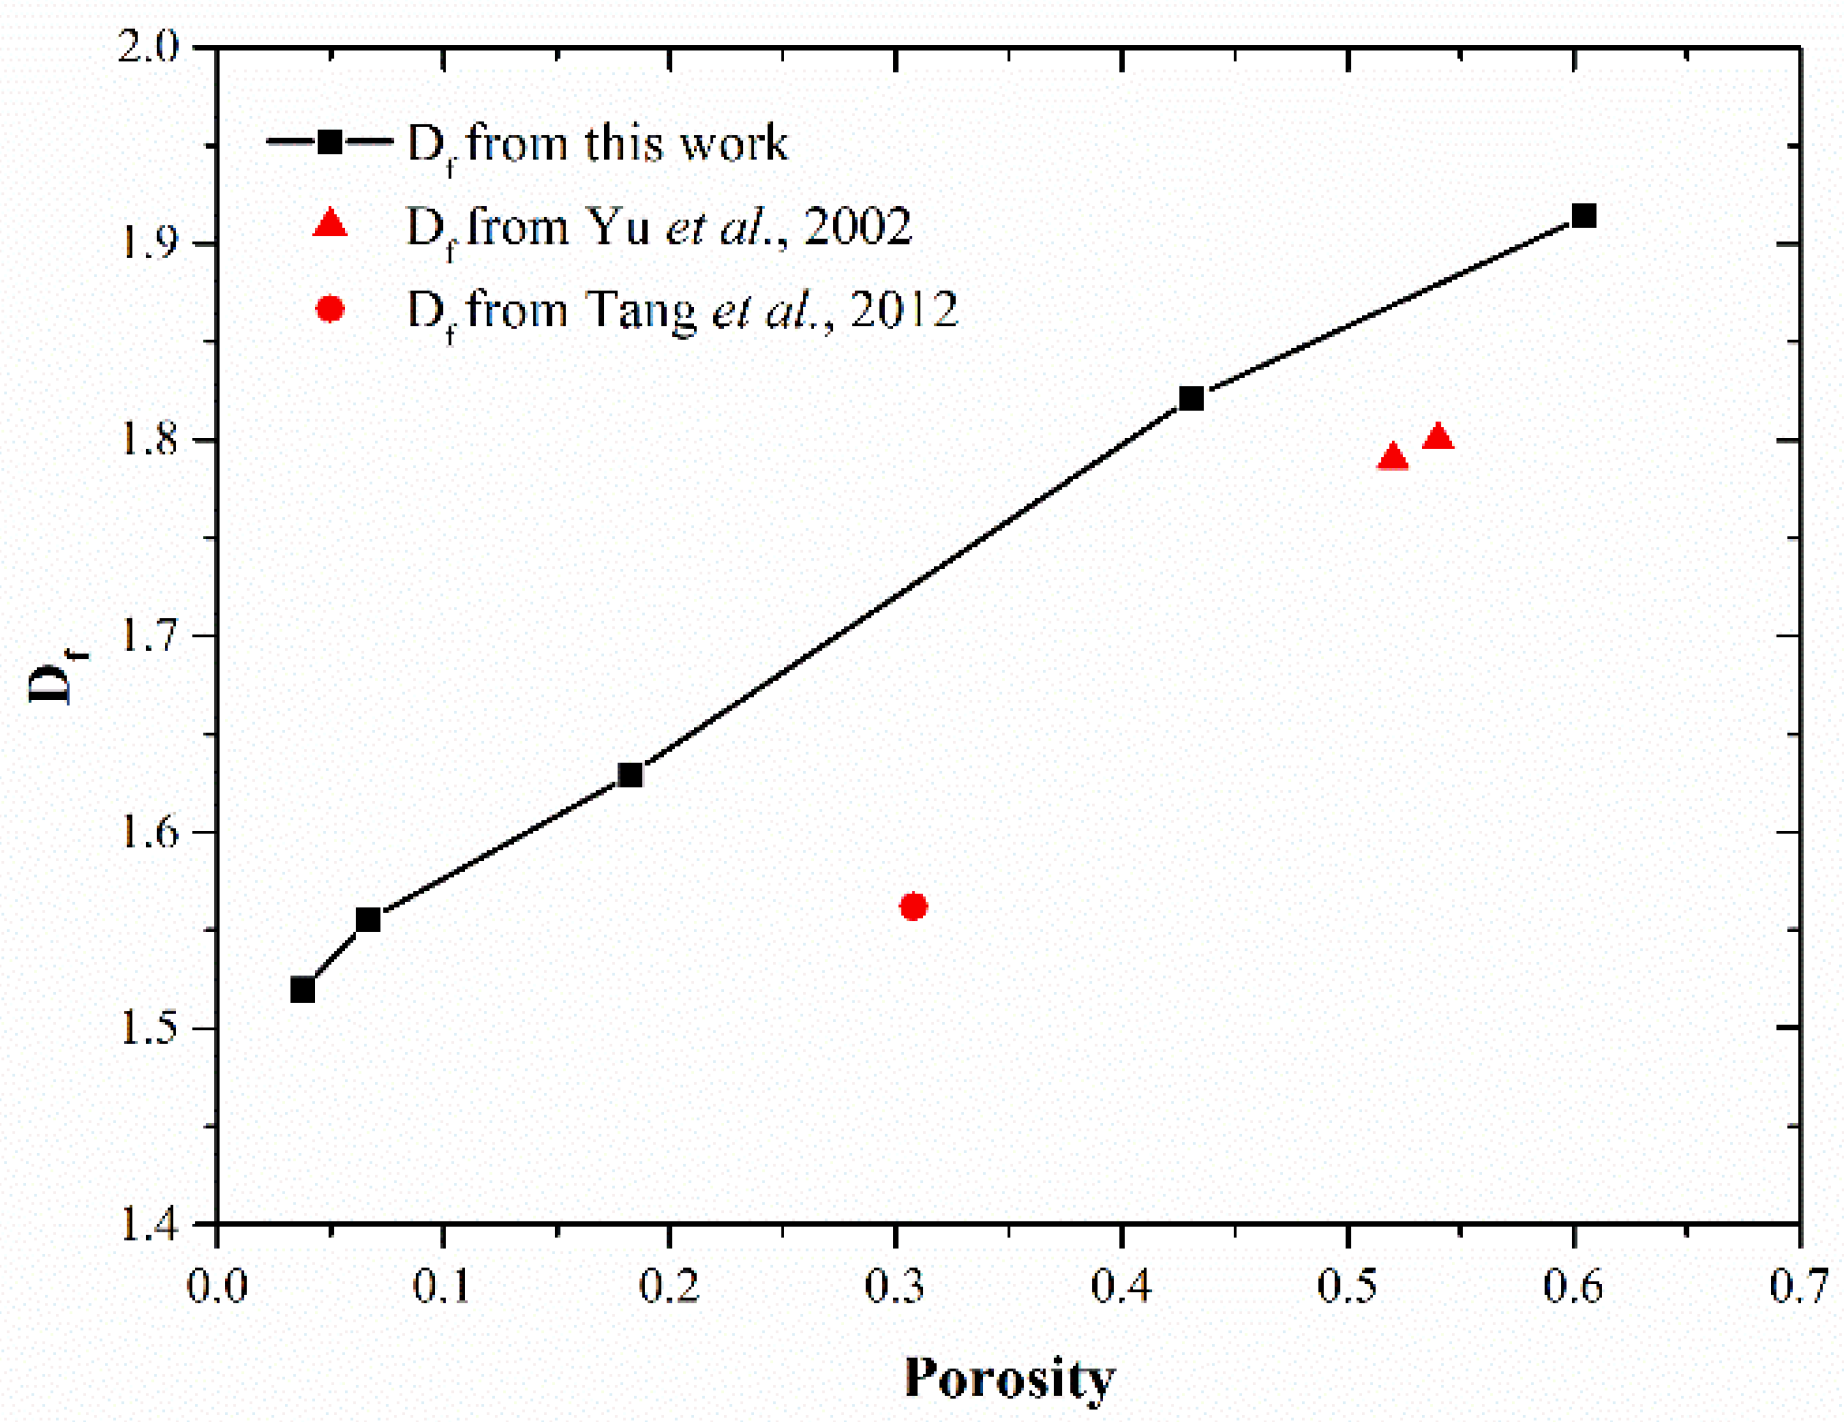
From the initial and final hydration states of MKPC and MAPC pastes, it can be found that in the hydration process, the small MgO particles are entirely hydrated due to the quick reaction, while the large ones are covered by inner hydration products and outer hydration products. According to the porosity analysis conducted based on hydration state, the increase in M/P ratio in the paste leads to a large volume fraction of K-struvite/struvite, which is conductive to a small porosity of the paste. In contrast, a high W/B ratio increases the porosity of MPC pastes. With the increase of M/P and W/B ratios, there is a significant growth in the fraction of large pores. Additionally, fractal analysis in this work reveals that the Df of MKPC pastes is positively proportional to the porosity and small M/P ratios, and small W/B ratios are beneficial for reducing the Df of MKPC pastes.

Author Contributions

Conceptualization, S.T. and J.H.; Data curation, Y.P. and C.T.; Formal analysis, Y.P., C.T. and Y.L.; Funding acquisition, S.T.; Methodology, Y.P., S.T., L.W. and J.H.; Project administration, S.T.; Software, Y.P., J.H. and C.T.; Validation, Y.P.; Visualization, Y.P.; Writing—original draft, Y.P.; Writing—review and editing, Y.P. and S.T. All authors have read and agreed to the published version of the manuscript.

Funding

This work was supported by the Opening Funds of the State Key Laboratory of Building Safety and Built Environment and National Engineering Research Center of Building Technology (Grant No. BSBE2020-1) and the Yangtze River Water Science Research Joint Fund Key Project of the National Natural Science Foundation of China (Grant No. U2040222).

Institutional Review Board Statement

Studies did not involve humans.

Informed Consent Statement

Studies did not involve humans.

Data Availability Statement

The data that support the findings of this study are available from the corresponding author upon reasonable request.

Acknowledgments

The authors would like to thank all the anonymous referees for their constructive comments and suggestions.

Conflicts of Interest

The authors declare no conflict of interest.

References

  1. Roy, D.M. New strong cement materials: Chemically bonded ceramics. Science 1987, 235, 651–658. [Google Scholar] [CrossRef] [PubMed]
  2. Qiao, F.; Chau, C.K.; Li, Z. Property evaluation of magnesium phosphate cement mortar as patch repair material. Constr. Build. Mater. 2010, 24, 695–700. [Google Scholar] [CrossRef]
  3. Yu, Y.; Wang, J.; Liu, C.; Zhang, B.; Chen, H.; Guo, H.; Zhong, G.; Qu, W.; Jiang, S.; Huang, H. Evaluation of inherent toxicology and biocompatibility of magnesium phosphate bone cement. Colloids Surf. B Biointerfaces 2010, 76, 496–504. [Google Scholar] [CrossRef]
  4. Xu, K.; Li, J.; Zheng, M.; Zhang, C.; Xie, T.; Wang, C. The precipitation of magnesium potassium phosphate hexahydrate for P and K recovery from synthetic urine. Water Res. 2015, 80, 71–79. [Google Scholar] [CrossRef] [PubMed]
  5. Lee, J.; Farag, M.M.; Park, E.K.; Lim, J.; Yun, H.-S. A simultaneous process of 3D magnesium phosphate scaffold fabrication and bioactive substance loading for hard tissue regeneration. Mater. Sci. Eng. C 2014, 36, 252–260. [Google Scholar] [CrossRef]
  6. Yang, B.; Liu, J.; Zhao, X.; Zheng, S. Evaporation and cracked soda soil improved by fly ash from recycled materials. Land. Degrad. Dev. 2021, 32, 2823–2832. [Google Scholar] [CrossRef]
  7. Yang, B.; Li, D.; Yuan, S.; Jin, L. Role of biochar from corn straw in influencing crack propagation and evaporation in sodic soils. Catena 2021, 204, 105457. [Google Scholar] [CrossRef]
  8. Ostrowski, N.; Roy, A.; Kumta, P.N. Magnesium phosphate cement systems for hard tissue applications: A Review. ACS Biomater. Sci. Eng. 2016, 2, 1067–1083. [Google Scholar] [CrossRef]
  9. Ma, H.; Xu, B.; Liu, J.; Pei, H.; Li, Z. Effects of water content, magnesia-to-phosphate molar ratio and age on pore structure, strength and permeability of magnesium potassium phosphate cement paste. Mater. Des. 2014, 64, 497–502. [Google Scholar] [CrossRef]
  10. Wagh, A.S.; Jeong, S.Y. Chemically bonded phosphate ceramics: I, a dissolution model of formation. J. Am. Ceram. Soc. 2003, 86, 1838–1844. [Google Scholar] [CrossRef]
  11. Wang, A.; Fan, X.; Li, J.; Ding, C. Curing behavior and structure of magnesium phosphate chemically bonded ceramics with different MgO to KH2PO4 ratios. Int. J. Appl. Ceram. Technol. 2015, 12, 1124–1130. [Google Scholar] [CrossRef]
  12. Ding, Z.; Dong, B.; Xing, F.; Han, N.; Li, Z. Cementing mechanism of potassium phosphate based magnesium phosphate cement. Ceram. Int. 2012, 38, 6281–6288. [Google Scholar] [CrossRef]
  13. Xu, B.; Lothenbach, B.; Leemann, A.; Winnefeld, F. Reaction mechanism of magnesium potassium phosphate cement with high magnesium-to-phosphate ratio. Cem. Concr. Res. 2018, 108, 140–151. [Google Scholar] [CrossRef]
  14. Xu, B.; Ma, H.; Li, Z. Influence of magnesia-to-phosphate molar ratio on microstructures, mechanical properties and thermal conductivity of magnesium potassium phosphate cement paste with large water-to-solid ratio. Cem. Concr. Res. 2015, 68, 1–9. [Google Scholar] [CrossRef]
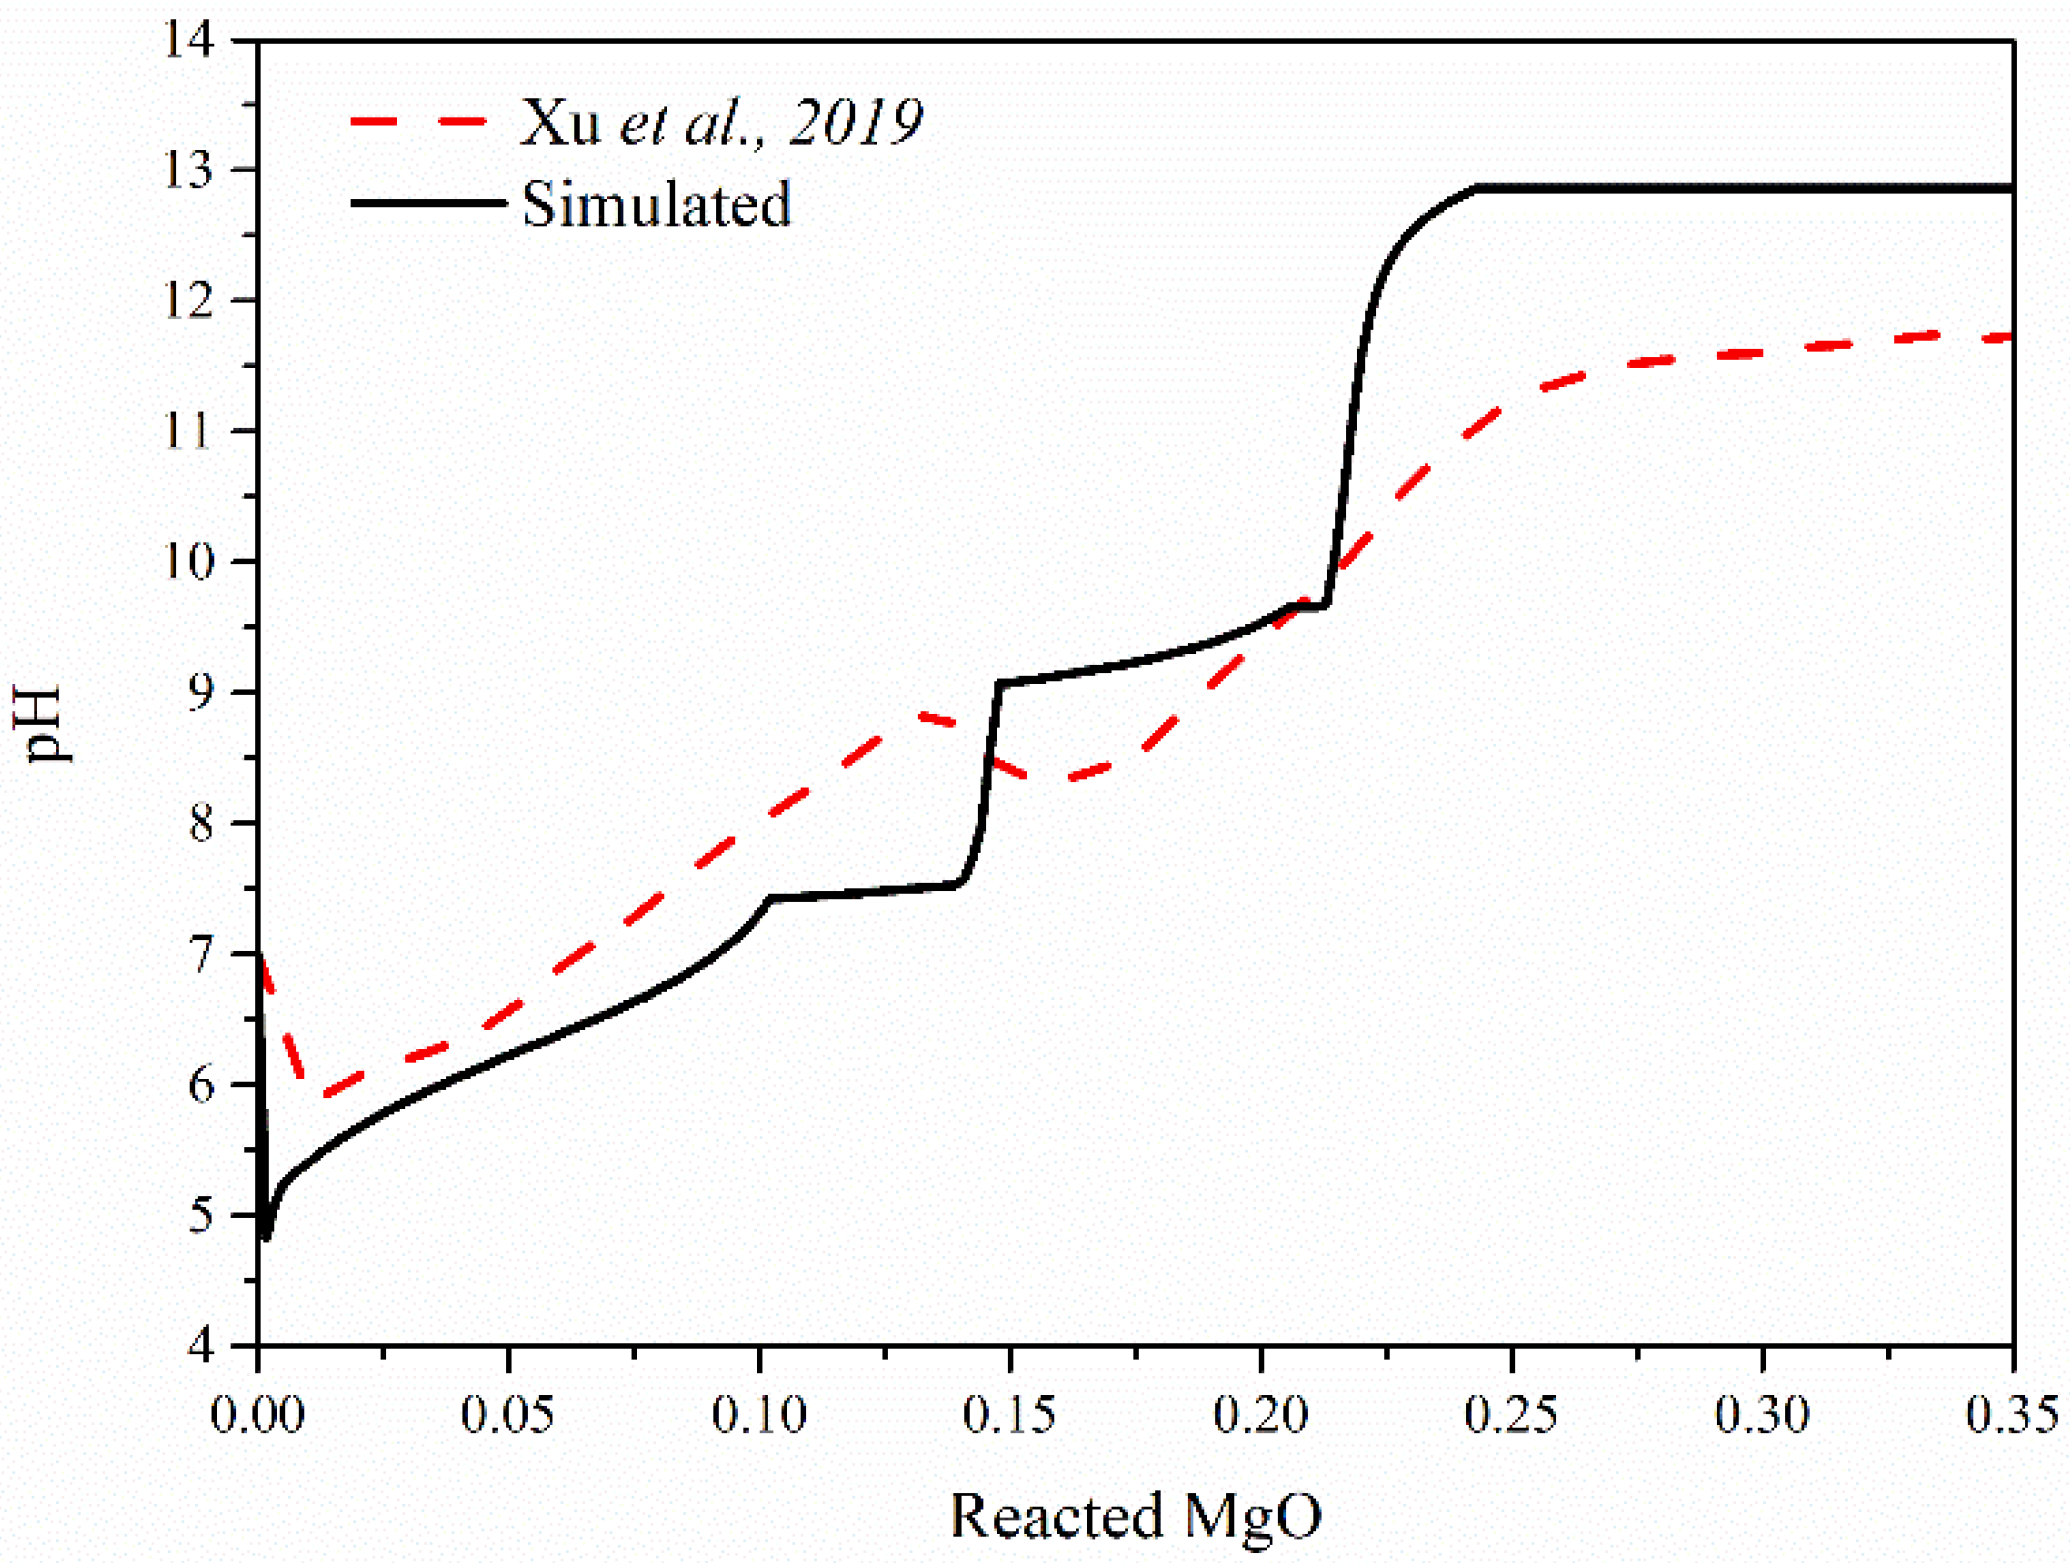
  15. Xu, B.; Winnefeld, F.; Kaufmann, J.; Lothenbach, B. Influence of magnesium-to-phosphate ratio and water-to-cement ratio on hydration and properties of magnesium potassium phosphate cements. Cem. Concr. Res. 2019, 123, 105781. [Google Scholar] [CrossRef]
  16. Lahalle, H.; Cau Dit Coumes, C.; Mercier, C.; Lambertin, D.; Cannes, C.; Delpech, S.; Gauffinet, S. Influence of the w/c ratio on the hydration process of a magnesium phosphate cement and on its retardation by boric acid. Cem. Concr. Res. 2018, 109, 159–174. [Google Scholar] [CrossRef]
  17. Lahalle, H.; Cau Dit Coumes, C.; Mesbah, A.; Lambertin, D.; Cannes, C.; Delpech, S.; Gauffinet, S. Investigation of magnesium phosphate cement hydration in diluted suspension and its retardation by boric acid. Cem. Concr. Res. 2016, 87, 77–86. [Google Scholar] [CrossRef]
  18. Sugama, T.; Kukacka, L. Magnesium monophosphate cements derived from diammonium phosphate solutions. Cem. Concr. Res. 1983, 13, 407–416. [Google Scholar] [CrossRef]
  19. Abdelrazig, B.; Sharp, J. A discussion of the papers on magnesia-phosphate cements by T. Sugama and LE Kukacka. Cem. Concr. Res. 1985, 15, 921–922. [Google Scholar] [CrossRef]
  20. Yuan, B.; Li, Z.; Chen, Y.; Ni, H.; Zhao, Z.; Chen, W.; Zhao, J. Mechanical and microstructural properties of recycling granite residual soil reinforced with glass fiber and liquid-modified polyvinyl alcohol polymer. Chemosphere 2022, 286, 131652. [Google Scholar] [CrossRef]
  21. Ma, H.; Xu, B. Potential to design magnesium potassium phosphate cement paste based on an optimal magnesia-to-phosphate ratio. Mater. Des. 2017, 118, 81–88. [Google Scholar] [CrossRef]
  22. Yuan, B.; Sun, M.; Wang, Y.; Zhai, L.; Luo, Q.; Zhang, X. Full 3D displacement measuring system for 3D displacement field of soil around a laterally loaded pile in transparent soil. Int. J. Geomech. 2019, 19, 04019028. [Google Scholar] [CrossRef]
  23. Véhel, J.L.; Lutton, E.; Tricot, C. Fractals in Engineering: From Theory to Industrial Applications; Springer Science & Business Media: Berlin/Heidelberg, Germany, 2012. [Google Scholar]
  24. Yang, B.; Liu, Y. Application of fractals to evaluate fractures of rock due to mining. Fractal Fract. 2022, 6, 96. [Google Scholar] [CrossRef]
  25. Fisher, Y. Fractal Image Compression: Theory and Application; Springer Science & Business Media: Berlin/Heidelberg, Germany, 2012. [Google Scholar]
  26. Jin, S.; Zhang, J.; Han, S. Fractal analysis of relation between strength and pore structure of hardened mortar. Constr. Build. Mater. 2017, 135, 1–7. [Google Scholar] [CrossRef]
  27. Zhang, L.; Dang, F.; Ding, W.; Zhu, L. Comparative study on damage process of concrete subjected to uniaxial tensile and compression loads based on CT test and improved differential box counting method. Constr. Build. Mater. 2021, 285, 122693. [Google Scholar] [CrossRef]
  28. Lothenbach, B.; Wieland, E. A thermodynamic approach to the hydration of sulphate-resisting Portland cement. Waste Manag. 2006, 26, 706–719. [Google Scholar] [CrossRef]
  29. Leisinger, S.M.; Lothenbach, B.; Le Saout, G.; Johnson, C.A. Thermodynamic modeling of solid solutions between monosulfate and monochromate 3CaO·Al2O3·Ca[(CrO4)x(SO4)1−x]·nH2O. Cem. Concr. Res. 2012, 42, 158–165. [Google Scholar] [CrossRef]
  30. Lothenbach, B.; Zajac, M. Application of thermodynamic modelling to hydrated cements. Cem. Concr. Res. 2019, 123, 105779. [Google Scholar] [CrossRef]
  31. Lothenbach, B.; Xu, B.; Winnefeld, F. Thermodynamic data for magnesium (potassium) phosphates. Appl. Geochem. 2019, 111, 104450. [Google Scholar] [CrossRef]
  32. Myers, R.J.; Lothenbach, B.; Bernal, S.A.; Provis, J.L. Thermodynamic modelling of alkali-activated slag cements. Appl. Geochem. 2015, 61, 233–247. [Google Scholar] [CrossRef]
  33. Wagner, T.; Kulik, D.A.; Hingerl, F.F.; Dmytrieva, S.V. Gem-selektor geochemical modeling package: Tsolmod library and data interface for multicomponent phase models. Can. Mineral. 2012, 50, 1173–1195. [Google Scholar] [CrossRef]
  34. Bethke, C.M.; Yeakel, S. The Geochemist’s Workbench. Release 10.0. GWB Essentials Guide; LLC: Champagin, IL, USA, 2014. [Google Scholar]
  35. Helgeson, H.C. Summary and critique of the thermodynamic properties of rock-forming minerals. Am. J. Sci. 1978, 278, 1–229. [Google Scholar]
  36. Thoenen, T.; Berner, U.; Curti, E.; Hummel, W.; Pearson, F.J. The Nagra/PSI Thermochemical Data Base. Geochim. Cosmochim. Acta 2002, 66, A771. [Google Scholar]
  37. Blanc, P.; Bourbon, X.; Lassin, A.; Gaucher, E.C. Chemical model for cement-based materials: Thermodynamic data assessment for phases other than C–S–H. Cem. Concr. Res. 2010, 40, 1360–1374. [Google Scholar] [CrossRef]
  38. Allison, J.D.; Brown, D.S.; Novo-Gradac, K.J. MINTEQA2/PRODEFA2, A Geochemical Assessment Model for Environmental Systems: Version 3.0 User’s Manual; Environmental Research Laboratory, Office of Research and Development, US Environmental Protection Agency: Washington, DC, USA, 1991.
  39. Speight, J.G. Lange’s Handbook of Chemistry; McGraw-Hill Education: New York, NY, USA, 2017. [Google Scholar]
  40. Han, W.; Chen, H.; Li, X.; Zhang, T. Thermodynamic modeling of magnesium ammonium phosphate cement and stability of its hydration products. Cem. Concr. Res. 2020, 138, 106223. [Google Scholar] [CrossRef]
  41. Zhang, T.; Chen, H.; Li, X.; Zhu, Z. Hydration behavior of magnesium potassium phosphate cement and stability analysis of its hydration products through thermodynamic modeling. Cem. Concr. Res. 2017, 98, 101–110. [Google Scholar] [CrossRef]
  42. Ma, H.; Xu, B.; Lu, Y.; Li, Z. Modeling magnesia-phosphate cement paste at the micro-scale. Mater. Lett. 2014, 125, 15–18. [Google Scholar] [CrossRef]
  43. Chau, C.K.; Qiao, F.; Li, Z. Microstructure of magnesium potassium phosphate cement. Constr. Build. Mater. 2011, 25, 2911–2917. [Google Scholar] [CrossRef]
  44. Góchez, R.; Wambaugh, J.; Rochner, B.; Kitchens, C.L. Kinetic study of the magnesium oxychloride cement cure reaction. J. Mater. Sci. 2017, 52, 7637–7646. [Google Scholar] [CrossRef]
  45. Zhong, Z.; Chen, H.; Zongjin, L.I.; Huajian, L.I. Simulation of the properties of MgO-MgfCl2-H2O system by thermodynamic method. Cem. Concr. Res. 2015, 68, 105–111. [Google Scholar] [CrossRef]
  46. Yu, P.; Duan, Y.H.; Chen, E.; Tang, S.W.; Wang, X.R. Microstructure-based fractal models for heat and mass transport properties of cement paste. Int. J. Heat Mass Tran. 2018, 126, 432–447. [Google Scholar] [CrossRef]
  47. Wang, R.; Singh, A.K.; Kolan, S.R.; Tsotsas, E. Fractal analysis of aggregates: Correlation between the 2D and 3D box-counting fractal dimension and power law fractal dimension. Chaos Solitons Fract. 2022, 160, 112246. [Google Scholar] [CrossRef]
  48. Le Rouzic, M.; Chaussadent, T.; Stefan, L.; Saillio, M. On the influence of Mg/P ratio on the properties and durability of magnesium potassium phosphate cement pastes. Cem. Concr. Res. 2017, 96, 27–41. [Google Scholar] [CrossRef]
  49. Tang, H.; Wang, J.; Zhu, J.; Ao, Q.; Wang, J.; Yang, B.; Li, Y.N. Fractal dimension of pore-structure of porous metal materials made by stainless steel powder. Powder Technol. 2012, 217, 383–387. [Google Scholar] [CrossRef]
  50. Yu, B.; Cheng, P. A fractal permeability model for bi-dispersed porous media. Int. J. Heat Mass Trans. 2002, 45, 2983–2993. [Google Scholar] [CrossRef]
  51. Wang, A.-J.; Yuan, Z.-L.; Zhang, J.; Liu, L.-T.; Li, J.-M.; Liu, Z. Effect of raw material ratios on the compressive strength of magnesium potassium phosphate chemically bonded ceramics. Mater. Sci. Eng. C 2013, 33, 5058–5063. [Google Scholar] [CrossRef]
  52. Dong, P.; Ahmad, M.R.; Chen, B.; Munir, M.J.; Saleem Kazmi, S.M. Preparation and study of magnesium ammonium phosphate cement from waste lithium slag. J. Clean. Prod. 2021, 316, 128371. [Google Scholar] [CrossRef]
Figure 1. pH values of MP8H5 and experimental data in Ref. [15].
Fractalfract 06 00337 g001
Figure 2. Evolution of volume of hydration products and pH values with the reacted amount of MgO in (a) MP6H0.25K; (b) MP7H0.25K; (c) MP8H0.25K; (d) MP9H0.25K; (e) MP10H0.25K; (f) MP8H0.2K; (g) MP8H0.3K; and (h) MP8H0.5K.
Fractalfract 06 00337 g002
Figure 3. Evolution of amount of hydration products with reacted amount of MgO in (a) MP2.7B0K; (b) MP2.7B0.25K; (c) MP2.7B1K; and (d) MP2.7B2.5K.
Fractalfract 06 00337 g003
Figure 4. Comparison of pH in MKPC pastes with different amounts of boric acid.
Fractalfract 06 00337 g004
Figure 5. Evolution of the molarity of ions and pH value in MP2.7B0.25 solution with reacted amount of MgO.
Fractalfract 06 00337 g005
Figure 6. Comparison of the molarity of MP2.7B0.25 and MP2.7B0 during the hydration.
Fractalfract 06 00337 g006
Figure 7. Simulated microstructure of (a) MP6H0.25K; (b) MP8H0.25K; (c) MP10H0.25K; (d) MP8H0.2K; (e) MP8H0.3K; and (f) MP8H0.5K.
Fractalfract 06 00337 g007
Figure 8. Porosity of simulated and experimental data in Ref. [15] for MP8H0.25K.
Fractalfract 06 00337 g008
Figure 9. Comparison of cumulative porosity in different MKPC pastes.
Fractalfract 06 00337 g009
Figure 10. Evolution of Df with porosity from this work and Refs. [49,50].
Fractalfract 06 00337 g010
Figure 11. Evolution of volume of hydration products and pH values with reacted amount of MgO in (a) MP3H0.5A; (b) MP4H0.5A; (c) MP5H0.5A; (d) MP4H1A; (e) MP5H1A; (f) MP8H1A; (g) MP5H0.3A; and (h) MP8H0.3A.
Fractalfract 06 00337 g011
Figure 12. Simulated microstructure of (a) MP3H0.5A; (b) MP4H0.5A; (c) MP5H0.3A; (d) MP5H0.5A; and (e) MP8H0.3A.
Fractalfract 06 00337 g012
Figure 13. Comparison of cumulative porosity in different MAPC pastes.
Fractalfract 06 00337 g013
Table 1. A Comparison of different thermodynamic databases.
DatabaseContent(s)Software Support(s)Reference
ThermoddemLiquid ions, gas phases, and mineral phasesPHREEQC, Crunch, Geochemist′s workbench, Toughreact, Chess[35]
PSI/NagraSolutes, actinides, and radioactive fission products in natural waterGEMS, PHREEQC[36]
Blanc cement chemistry databaseDetailed C-S-H data of different forms at different temperaturePHREEQC[37]
MINTEQA2 V.4 databaseA large number of complex ions and precipitation reactionsMINTEQ, Geochemist′S, WorkBench, PHREEQC[38]
Table 2. Thermodynamic data of MPC pastes.
Ions and PhasesReactionLog K
MgO MgO + 2 H + = Mg 2 + + H 2 O 21.8 [37]
KH 2 PO 4 KH 2 PO 4 = K + + H 2 PO 4 - 0.278
NH 4 H 2 PO 4 NH 4 H 2 PO 4 = NH 4 + + 2 H + + PO 4 3 - −18.5 [39]
MgNH 4 PO 4 6 H 2 O MgNH 4 PO 4 6 H 2 O = Mg 2 + + NH 4 + + PO 4 3 - + 6 H 2 O −13.13 [40]
( NH 4 ) 2 Mg ( HPO 4 ) 2 4 H 2 O ( NH 4 ) 2 Mg ( HPO 4 ) 2 4 H 2 O = Mg 2 + + 2 NH 4 + + 2 PO 4 3 - + 2 H + + 4 H 2 O −36.3
MgKPO 4 6 H 2 O MgKPO 4 6 H 2 O = Mg 2 + + K + + PO 4 3 - + 6 H 2 O −10.62 [41]
MgHPO 4 3 H 2 O MgHPO 4 3 H 2 O + H + = Mg 2 + + H 2 PO 4 - + 3 H 2 O 1.41 [41]
Mg 2 KH ( PO 4 ) 2 15 H 2 O Mg 2 KH ( PO 4 ) 2 15 H 2 O = 2 Mg 2 + + K + + H + + 2 PO 4 3 - + 15 H 2 O −29.54 [41]
Mg 3 ( PO 4 ) 2 22 H 2 O Mg 3 ( PO 4 ) 2 22 H 2 O = 3 Mg 2 + + 22 H 2 O + 2 PO 4 3 - −23.1 [41]
B ( OH ) 4 - B ( OH ) 3 ( aq ) + H 2 O = B ( OH ) 4 - + H + −9.24 [17]
B 3 O 3 ( OH ) 4 - 3 B ( OH ) 3 ( aq ) = B 3 O 3 ( OH ) 4 - + H + + 2 H 2 O −7.528
B 4 O 5 ( OH ) 4 2 - 4 B ( OH ) 3 ( aq ) = B 4 O 5 ( OH ) 4 2 - + 2 H + + 3 H 2 O −16.13
MgB ( OH ) 4 + Mg 2 + + B ( OH ) 3 + H 2 O = MgB ( OH ) 4 + + H + −7.84
Mg ( OH ) 2 Mg ( OH ) 2 = Mg 2 + + 2 OH - −10.88
Table 3. Molar density and molar mass of reactants and hydration products.
SolidMolar Mass (g/mol)Molar Volume (cm3/mol)
MgO4011.3
KH2PO413658.2
NH4H2PO411563.8
MgHPO4·3H2O17482.9
Mg2KH(PO4)2·15H2O549303.2
MgKPO4·6H2O266142.5
MgNH4PO4·6H2O245143.5
(NH4)2Mg(HPO4)2·4H2O324177.3
Table 4. Mix proportion of MKPC pastes.
PasteMgO/KH2PO4 Molar RatioW/B Mass Ratio
MP8H0.2K80.2
MP8H0.3K80.25
MP8H0.5K80.5
MP6H0.25K60.25
MP7H0.25K70.25
MP8H0.25K80.25
MP9H0.25K90.25
MP10H0.25K100.25
Table 5. Mix proportion of MKPC pastes with boric acid.
PasteBoric Acid to Solid Mass Ratio (%)MgO
(g)
KH2PO4
(g)
Water
(g)
Boric Acid (g)
MP2.7B0044.455.61000
MP2.7B0.250.2544.455.61000.25
MP2.7B1144.455.61001
MP2.7B2.52.544.455.61002.5
Table 6. Mix proportion of MAPC pastes.
PasteMgO/NH4H2PO4 Molar RatioW/B Mass Ratio
MP3H0.5A30.5
MP4H0.5A40.5
MP4H1A41
MP5H0.3A50.3
MP5H0.5A50.5
MP5H1A51
MP8H0.3A80.3
MP8H1A81
Table 7. Stages in the evolution of the molarity of the ions in the MKPC solution with boric acid.
StageReacted MgO (mol)pHMolarity
B ( OH ) 4 - PO 4 3 - HPO 4 2 - KHPO 4 - MgB ( OH ) 4 + H 2 PO 4 -
Stage I0–0.2314.4------
Stage II0.231–0.2644.4–7increasedincreasedincreasedincreasedincreaseddecreased
Stage III0.264–0.2977------
Stage IV0.297–0.3637–8.5increasedincreased--increaseddecreased
Stage V0.363–0.4188.5–12.7-decreaseddecreaseddecreasedincreaseddecreased
Table 8. Comparison of porosities among simulated and experimental results.
PastePorosity by Simulation (%)Porosity by Experiment (%)Difference (%)
MP6H0.25K3.77--
MP6H0.2K-5.46 [48]-
MP8H0.25K6.666.06 [15]9.9
MP8H0.5K37.6740.24 [21]6.4
MP10H0.25K18.31--
MP10H0.5K-42.69 [21]-
MP4H0.5A26.15--
MP5H0.3A12.88--
MP5H0.5A29.76--
MP4H0.22A-6.18 [52]-
Publisher’s Note: MDPI stays neutral with regard to jurisdictional claims in published maps and institutional affiliations.

