Article

Mitochondrial DNA Profiling by Fractal Lacunarity to Characterize the Senescent Phenotype as Normal Aging or Pathological Aging

1
Center of Innovative Models and Technology for Aging Care, Scientific Direction, IRCCS INRCA, Via S. Margherita 5, 60124 Ancona, AN, Italy
2
School of Science and Technology, University of Camerino, Via Madonna delle Carceri 9, 62032 Camerino, MC, Italy
*
Author to whom correspondence should be addressed.
Fractal Fract. 2022, 6(4), 219; https://doi.org/10.3390/fractalfract6040219
Submission received: 28 February 2022 / Revised: 5 April 2022 / Accepted: 7 April 2022 / Published: 13 April 2022
(This article belongs to the Section Life Science, Biophysics)

Abstract

:
Biocomplexity, chaos, and fractality can explain the heterogeneity of aging individuals by regarding longevity as a “secondary product” of the evolution of a dynamic nonlinear system. Genetic-environmental interactions drive the individual senescent phenotype toward normal, pathological, or successful aging. Mitochondrial dysfunctions and mitochondrial DNA (mtDNA) mutations represent a possible mechanism shared by disease(s) and the aging process. This study aims to characterize the senescent phenotype and discriminate between normal (nA) and pathological (pA) aging by mtDNA mutation profiling. MtDNA sequences from hospitalized and non-hospitalized subjects (age-range: 65–89 years) were analyzed and compared to the revised Cambridge Reference Sequence (rCRS). Fractal properties of mtDNA sequences were displayed by chaos game representation (CGR) method, previously modified to deal with heteroplasmy. Fractal lacunarity analysis was applied to characterize the senescent phenotype on the basis of mtDNA sequence mutations. Lacunarity parameter β, from our hyperbola model function, was statistically different (p < 0.01) between the nA and pA groups. Parameter β cut-off value at 1.26 × 10⁻³ identifies 78% nA and 80% pA subjects. This also agrees with the presence of MT-CO gene variants, peculiar to nA (C9546m, 83%) and pA (T9900w, 80%) mtDNA, respectively. Fractal lacunarity can discriminate the senescent phenotype evolving as normal or pathological aging by individual mtDNA mutation profile.

1. Introduction

Biocomplexity, chaos, and fractality have been introduced in the study of aging phenomena to provide innovative approaches and alternative tools. These new paradigms, applied to the gerontologic field, can explain contradictions and seemingly understandable phenomena. The high degree of inter- and intra-individual heterogeneity, always present in the senescent phenotype, can be understood by regarding longevity as a “secondary product” of a complex system evolution characterized by dynamic nonlinear kinetics [1,2].
Complex systems strictly depend upon initial conditions; therefore, even the smallest differences occurring in a cohort at given times induce unpredictable (small or huge) variations in late life in several features of the individual phenotype. Regarding human beings as complex systems [3], trajectories of individuals in a population, independently of how close they are at birth, evolve lifelong by waving and expanding their phenotype variance, one characteristic of which is aging. Inter-individual heterogeneity can be observed even in the presence of genetic background homogeneity and independently of how similar environmental noxae are. Interrelationships between genetics and the environment (both endogenous and exogenous) determine the behavior of individual trajectories at critical points (bifurcations) where unpredictable deviations occur. Bifurcations can be considered the source of heterogeneity characterizing the senescent phenotype.
A complex system, following the law of deterministic chaos, can generate so-called “strange attractors,” observable at critical points, that can be described by fractals [4]. This concept highlights the potential application of fractal analysis to study changes in complexity in aging biosystems at both structural and functional levels [5,6,7,8]. Fractal analysis, therefore, can define the senescent phenotype of human beings that, following different trajectories under the individual specific influence of genetic-environmental interactions, evolve as normal, pathological, or successful aging [2].
An increasing number of people are going to live longer; nevertheless, only a few individuals are going to age in good health. Many elderly people (60%) experience pathological aging, often characterized by multimorbidity. Fractal analysis can represent a promising tool to give insight into the search for good biomarkers useful to discriminate between aging and disease(s) as well as between physiological and pathological aging, two main tasks regarding aging well. Aging has been defined as a “progressive, generalized impairment of functions responsible for increased vulnerability to environmental challenges and growing risk of disease and death” [9]. The huge effort spent on understanding the underlying mechanisms has not produced a “universal” or all-inclusive theory of aging yet. The “mitochondrial” theory of aging, a variant of the “free radical” theory of aging, has been introduced based on the relevant role age-related mitochondrial dysfunction can have in the aging process [10,11].
Damage accumulation and integrity loss of the mitochondrial genome are known to affect aging processes. Increasing evidence firmly implies that mutations in mitochondrial DNA (mtDNA) strongly affect the aging process [12,13,14]. Accumulation of mtDNA mutations has been reported in several different aging tissues for humans and other species as well [15,16,17,18,19,20]; nevertheless, it is not clear whether alterations of the mitochondrial genome can be regarded as a determinant or consequence of aging [21]. Homoplasmy and heteroplasmy are two terms to classify point mutations of mtDNA: homoplasmic mutations regarding all mtDNA copies and heteroplasmic mutations regarding only a fraction [22,23]. Somatic mutations in mtDNA leading to heteroplasmy, the co-presence in a cell of normal and mutated mtDNA molecules, seem to affect aging mechanisms notably. MtDNA heteroplasmic mutations accumulate with aging in all tissues; however, cellular energetic impairment occurs only after the mutated to normal mtDNA ratio exceeds a critical level [24,25]. This threshold is tissue-specific, and the most deleterious effect on energy metabolism is mainly in charge of those tissues with high levels of energetic demand such as cerebral, cardiac, and muscular tissues [26].
Each mitochondrion counts 2–7 mtDNA molecules, and any typical human cell houses thousands of mtDNA copies [27]. Therefore, we have to handle very large data sets with time-consuming techniques when approaching studies on DNA sequencing in the search of mutations. Furthermore, the huge variety of mtDNA mutations found in aging subjects makes the genetic characterization for the senescent phenotype very challenging by numerical and/or statistical analytical procedures used.
We have recently proposed a method to characterize mtDNA mutation profile in aging and disease able to identify two main age-related neurodegenerative disorders such as Alzheimer’s disease [28] and Parkinson’s disease [29]. In this study, we extend the application of our lacunarity method in the study of the aging process that, following different rates, defines the senescent phenotype as physiological aging (normal rate) or pathological aging (fast rate) to confirm, in this way, that fractal analysis represents a powerful predictive/diagnostic tool based on complexity evaluation of biological structures. The method has been set up by considering the complexity and fractality of human beings and of their sub-systems (organs, tissues, etc.) [30,31,32,33], including mtDNA [34]. Fractal mathematics has been used to characterize complex objects also in biomedicine, and fractal dimension (FD) has been applied to estimate both functional and structural biocomplexity and its changes with aging and pathology [35,36,37,38,39,40,41]. DNA is among several biomedical fractal objects studied [42,43,44,45,46]. While FD estimates complexity alone, it cannot fully feature a fractal object; the other fractal property, lacunarity, by analyzing the texture of fractal sets, measures space-filling capacity [47]. Mandelbrot coined the term lacunarity from Latin lacuna (lack or hole), referred to as “gap” distribution in a fractal, and introduced lacunarity analysis to feature objects with the same FD but different shapes [47].
Fractal lacunarity was chosen to set up the mtDNA profiling method as it was able to overcome the limits of fractal analysis in describing natural objects [2,47,48]. Lacunarity analysis represents a more general technique as it is applicable to fractal, multi-fractal, and non-fractal (random) spatial patterns [48,49]. Regarding point mutations of mtDNA as “gaps” in the nucleotide sequence [28,29], fractal lacunarity analysis can be used to quantitatively describe the senescent phenotype that evolves lifelong as physiological or pathological aging depending on its individual specific mtDNA mutations’ profile.
Chaos Game Representation (CGR) method, used to unveil fractal features of DNA nucleotide sequences [50,51,52,53], has been adapted to display also heteroplasmy of mtDNA [28,29]. Lacunarity parameter β, from our hyperbola model function-based method [54,55,56,57], has been used to quantitatively characterize the senescent phenotype and discriminate between physiological aging and pathological aging based on individual mtDNA mutations’ profile.

2. Materials and Methods

2.1. Subjects and mtDNA Resequencing

This study was carried out on mtDNA sequences from peripheral blood of 33 subjects belonging to two age-matched control groups used in previous studies [28,29]. MtDNA resequencing data are deposited in NCBI’s Gene Expression Omnibus [58] and can be accessible through GEO Series accession number GSE113704 (https://www.ncbi.nlm.nih.gov/geo/query/acc.cgi?acc=GSE113704 and GSE49160 (http://www.ncbi.nlm.nih.gov/geo/query/acc.cgi?acc=GSE49160).
Table 1 summarizes the demographic and clinical characteristics of the sample studied. The two groups of subjects were defined as nA (normal aging) and pA (pathological aging) based on their clinical setting: outpatient and hospitalized, respectively.
Data and biological samples are preserved in the institutional Database Sample Resource (approved by our Institutional Bioethics Committee-12/DSAN; 19 April 2011) for those patients who had given written informed consent in accordance with the Declaration of Helsinki.
MtDNA resequencing was performed by MitoChips set up as previously described [59]. In particular, the Affymetrix GeneChip Command Console software and the GeneChip Sequence Analysis software 4.1 (Affymetrix, Santa Clara, CA, USA) were used to acquire and elaborate fluorescence intensity data. Parameters of the algorithm used were chosen to achieve optimal analysis performance for mitochondrial sequences as follows: “model type” set at diploid for heteroplasmy detection, and “quality score threshold” equal to 3 to obtain the best accuracy and rate for base calling. Chips with a call rate > 95%, that is, with very low levels of no-call (unclassified nucleotide positions, np), were included in the analysis. rCRS as the reference was used in the Single Nucleotide Polymorphism View output files to obtain the base calls, comprehensive of homoplasmic and heteroplasmic variants.

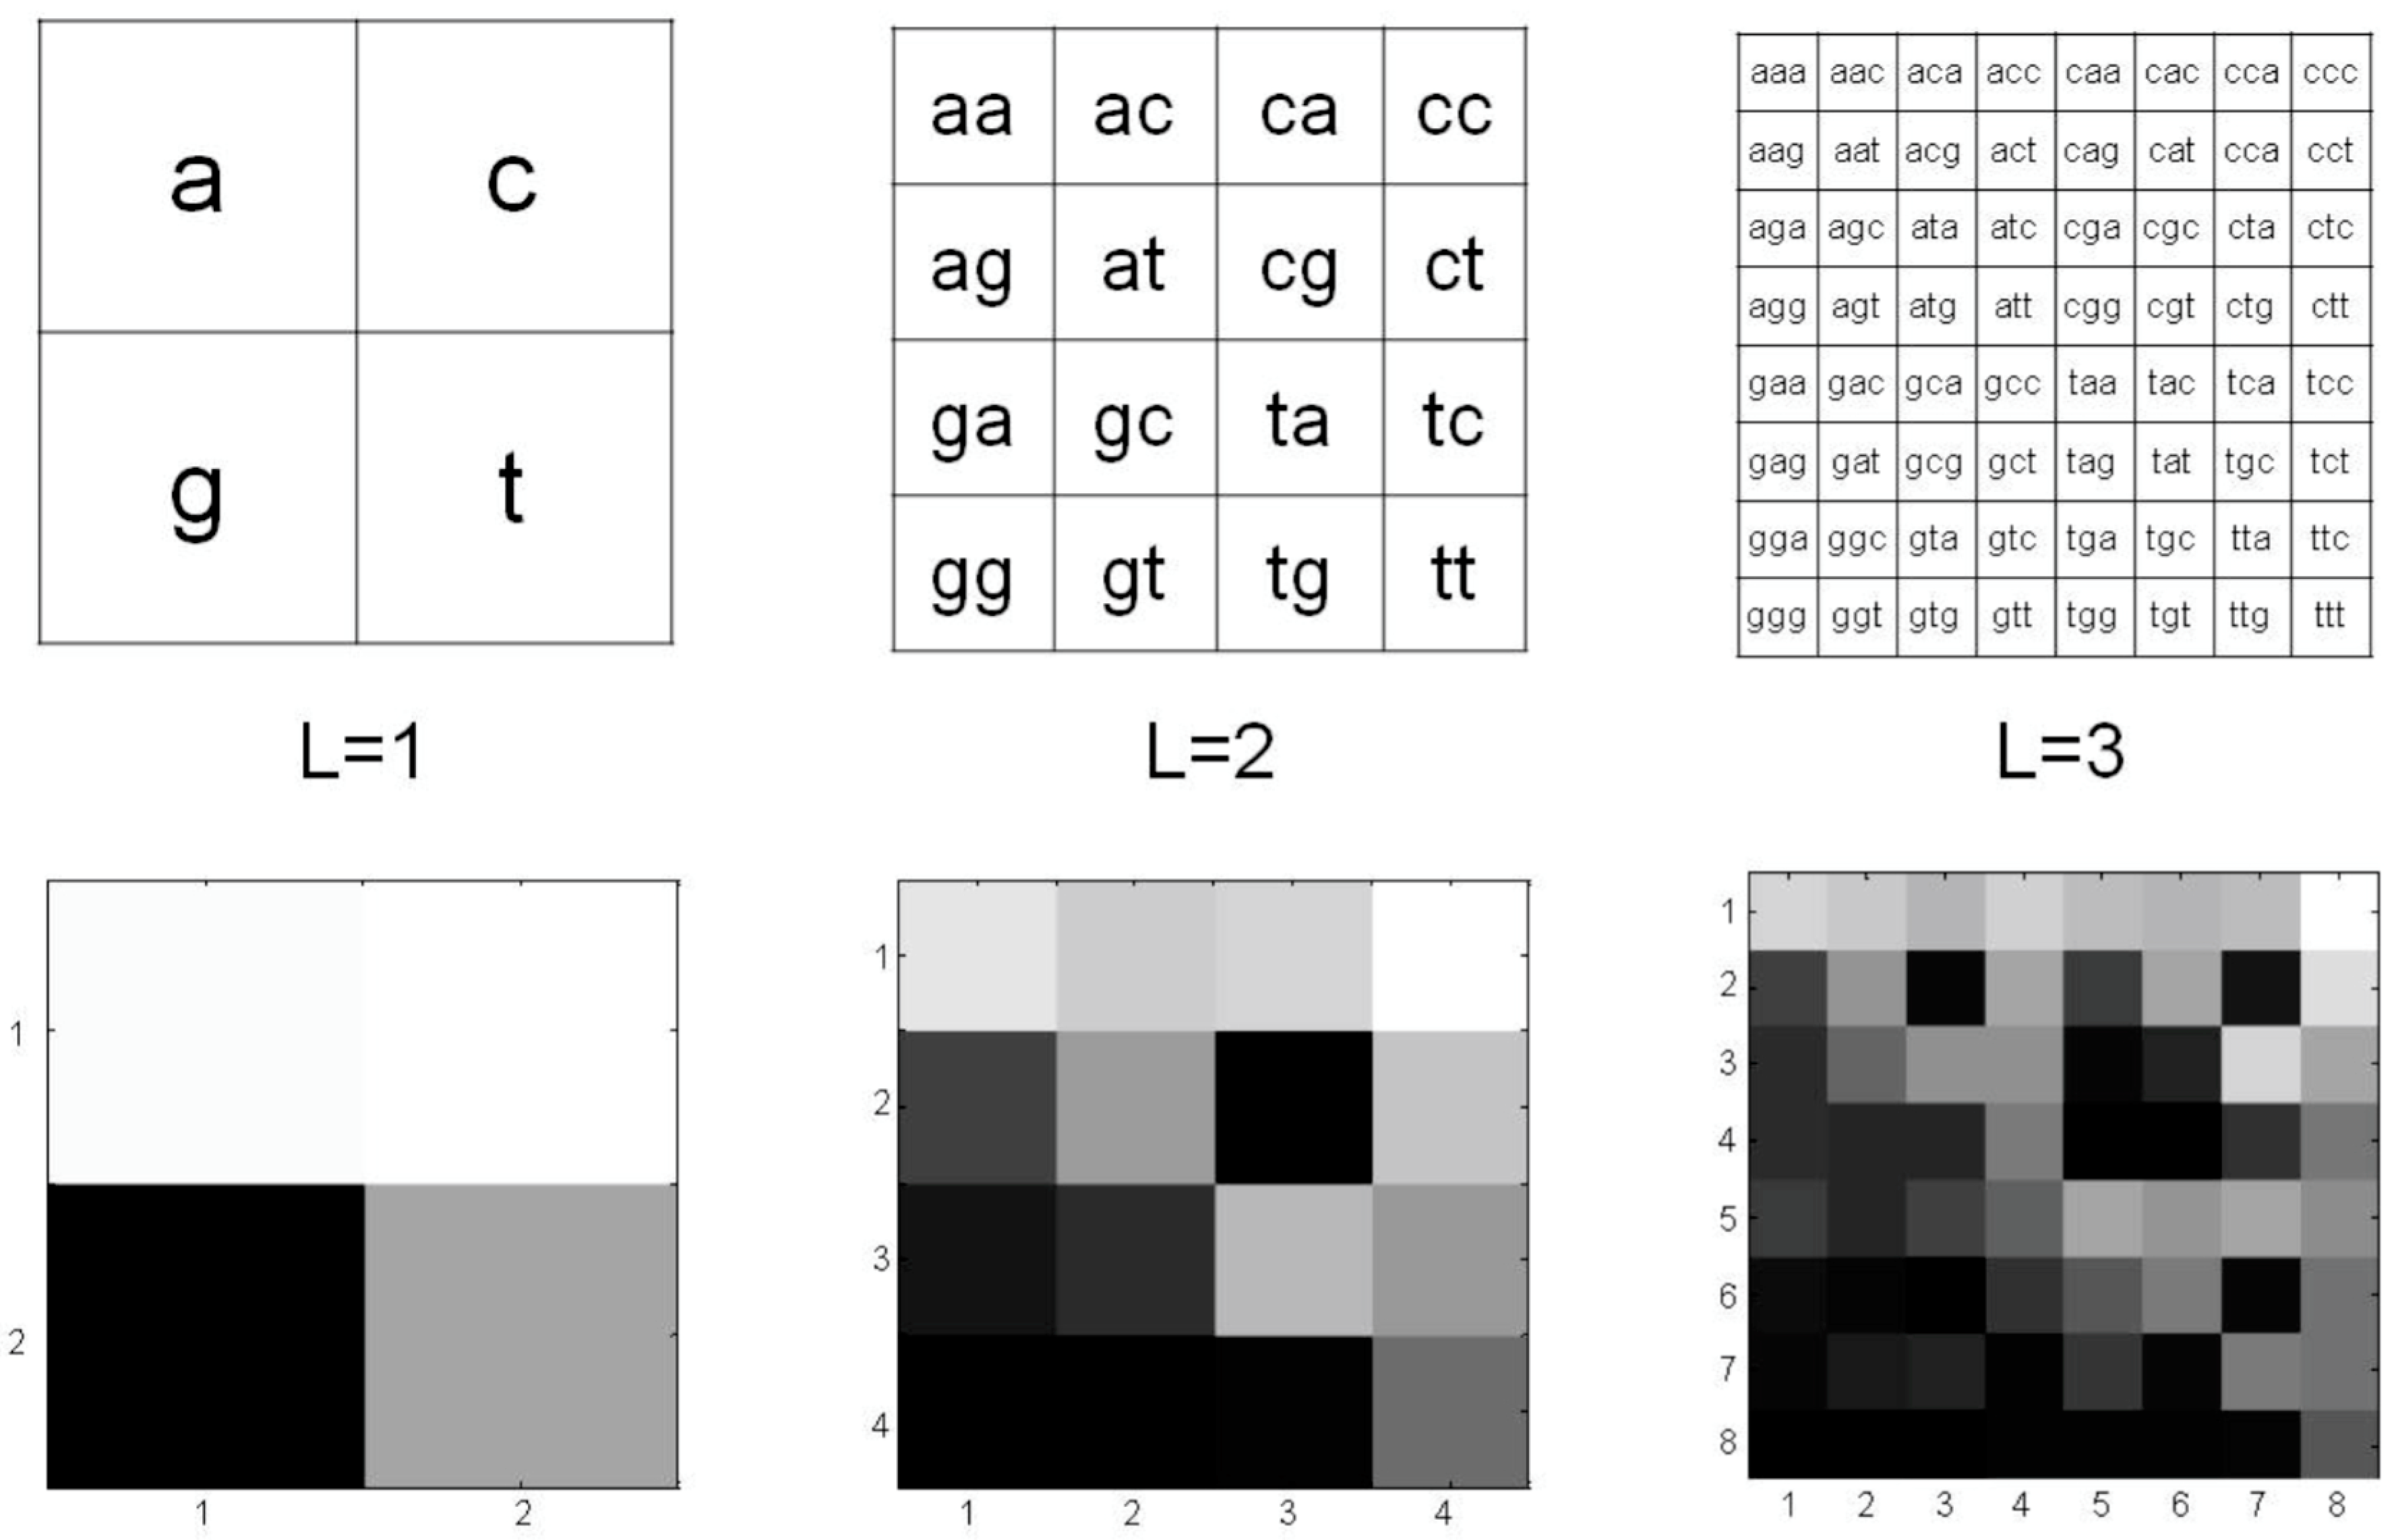
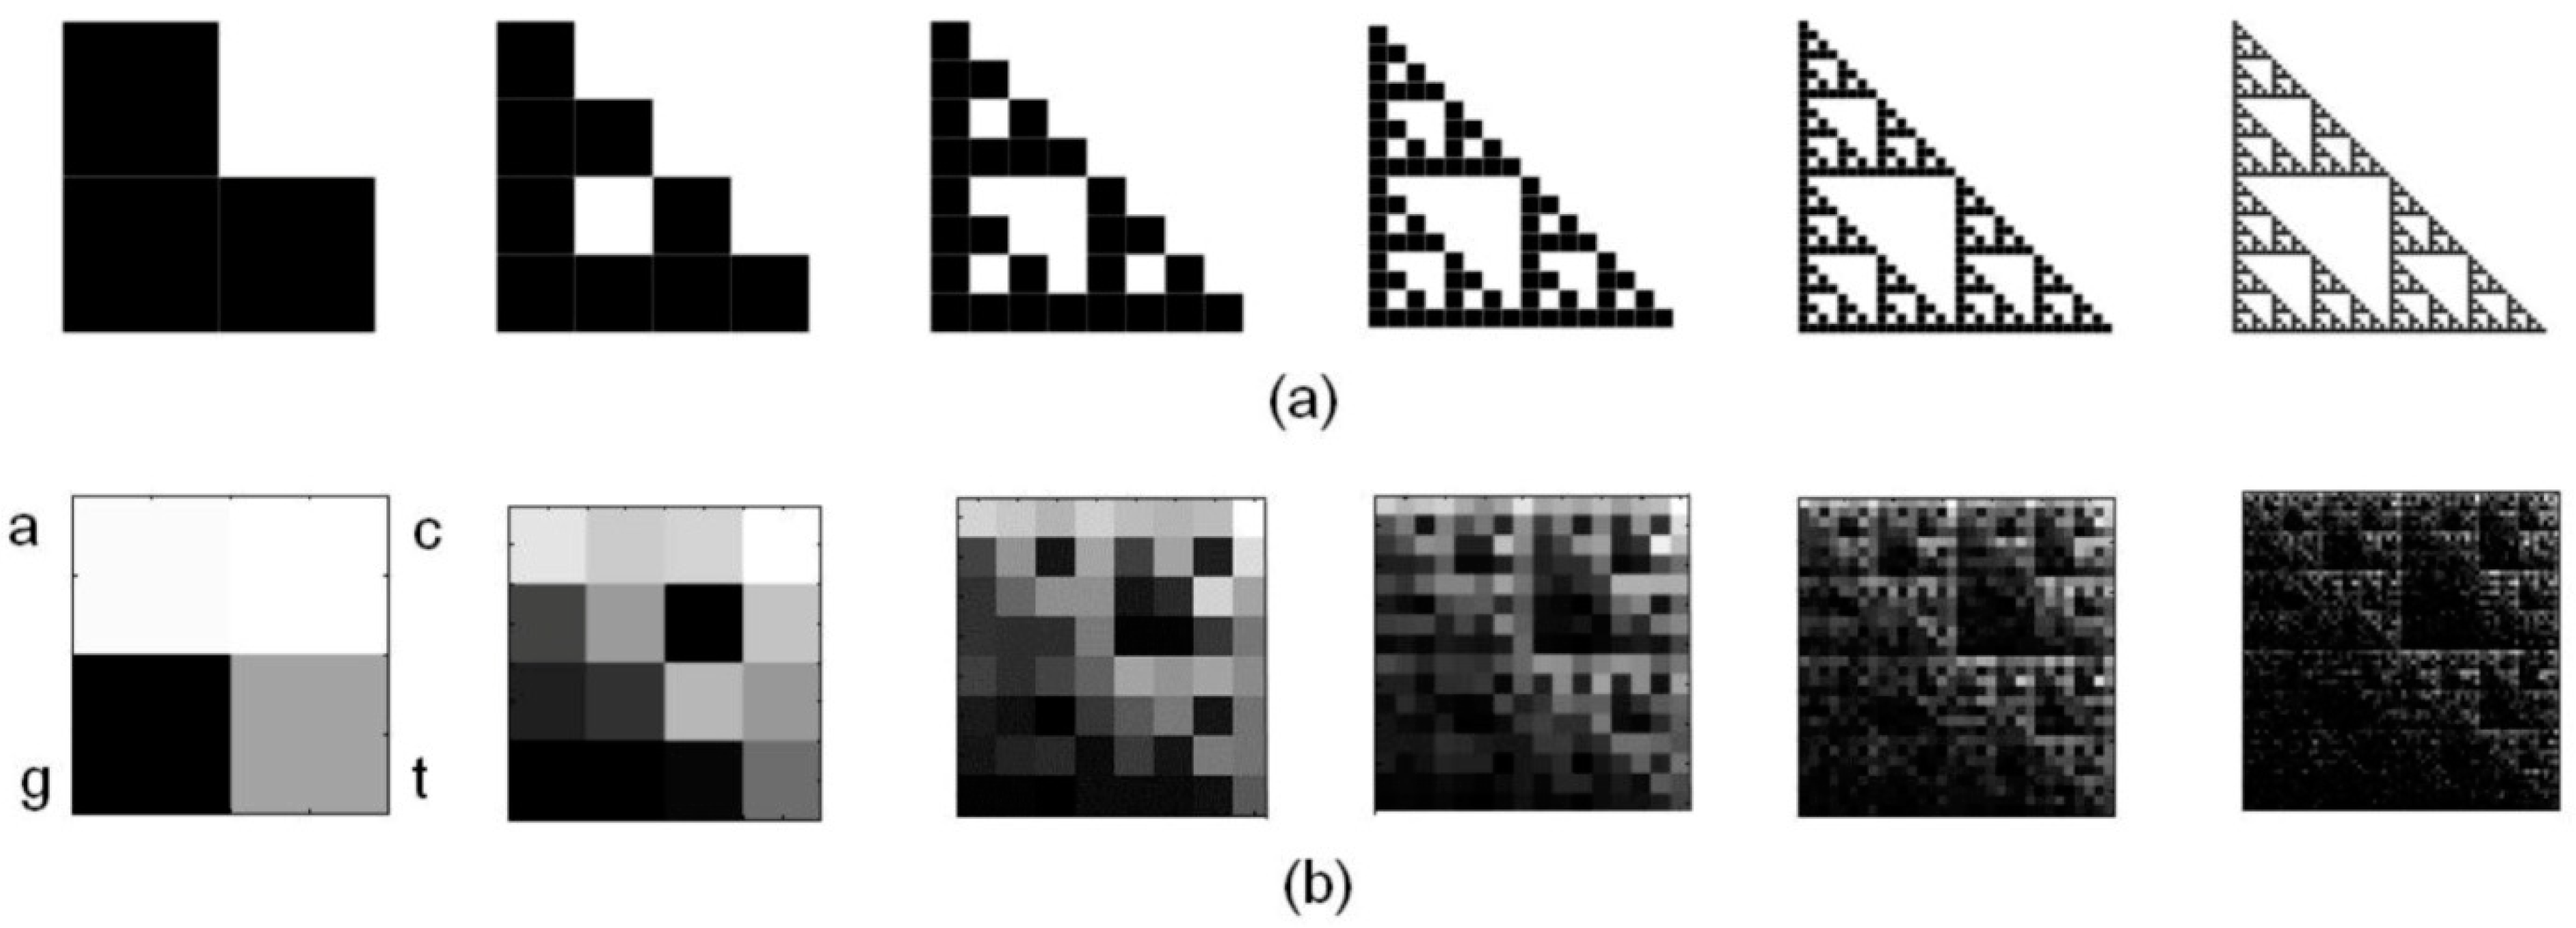
2.2. The Modified Chaos Game Representation of mtDNA

The CGR method, proposed by Jeffrey [50], allows the evaluation and visualization of the fractal features of DNA sequences. This method codifies DNA sequences’ information in images; therefore, the fractal features of these CGR images can be used to characterize the corresponding DNA sequences. A modified version of this method [28] to account for heteroplasmy was applied to display fractal features of mtDNA, and the resulting structure was used to analyze the relevant properties of mtDNA sequences. More precisely, the CGR method is based on a particular representation of the frequency occurrence of substrings s in a given DNA sequence S. In particular, due to the four-symbol alphabet {a, c, g, t} of DNA, all the possible substrings s with length L have biunivocal relation with the entries of a square matrix of order 2L. Given such a biunivocal relation and a DNA sequence S, the CGR matrix of S is obtained by filling each entry with the relative frequency in S of the corresponding subsequence s. Figure 1 shows an example for the cases L = 1, 2, 3. An algorithm to compute the CGR matrix is given in Zaia et al. [28]; moreover, an efficient computer implementation is described in Vinga et al. [60].
Heteroplasmic mutations produce undetermined DNA typing symbols. This uncertainty can be solved by a probabilistic approach for the modification of the CGR method. In particular, substrings s without undetermined symbols are considered as in the original method; these substrings take a weight w = 1 for the frequency computation. Substrings s containing undetermined symbols are replaced with the corresponding multiple strings generated by solving such symbols, and each new string takes a fractional weight w = 1/n computed by the number n of generated strings. Two examples of this modification are given below:
(a)
L = 5, s = ‘tacgm’, where ‘m’ means ‘a’ or ‘c’. This string is substituted by s1 = ‘tacga’, s2 = ‘tacgc’; the weight is w = 1/2.
(b)
L = 6, s = ‘vtacgm’, where ‘v’ means ‘a’, ‘c’, or ‘g’, and ‘m’ means ‘a’ or ‘c’. This string is substituted by s1 = ‘atacga’, s2 = ‘ctacga’, s3 = ‘gtacga’, s4 = ‘atacgc’, s5 = ‘ctacgc’, s6 = ‘gtacgc’; the weight is w = 1/6.
An algorithm to compute the modified CGR matrix I is given in Zaia et al. [28,29]. Our MATLAB (the MatWorks, Inc.; Natick, MA, USA) implementation of this algorithm also computes additional information on mtDNA sequence processed, i.e., type and number of nucleotide(s), number and position of both homoplasmic and heteroplasmic point mutations. The results reported in this study were obtained by using this program.

2.3. Estimate of Lacunarity

The lacunarity method is based on the gliding box algorithm (GBA) [49] and a hyperbola model to outline the fractal features of the analyzed image. This method was developed in our laboratories, and the original version [54,55] and modified grayscale ones have been described [56,57]. In this section, the method applied to CGR images of mtDNA is laid out briefly.
The GBA was used to evaluate the fractal lacunarity of CGR matrices. GBA analyzes the mass distribution in a given set, that, in this case, is the CGR matrix I, and the mass is associated with the total frequency registered in the entries of CGR matrix. More precisely, GBA considers the moments of the box mass distribution obtained by all the possible boxes of size b within I. For each b, let Mj, j = 1, 2, …, μ(b) be the different masses encountered in the various gliding boxes of size b, and n(Mj, b), j = 1, 2, …, μ(b) be the discrete frequency distribution of masses. The moments Zq of order q of M, are given as follows:
Z q ( M , b ) = 1 N ( b ) j = 1 μ ( b ) M j q n ( M j , b ) ,    b > 0
where N(b) is the total number of boxes of size b. The lacunarity function Λ is defined as follows:
Λ ( b ) = Z 2 ( M , b ) Z 1 ( M , b ) 2
GBA can also be used in the case of grayscale images, see Zaia et al. [56] and Zaia [57] for details. In this case, the efficiency of the algorithm is usually improved by a pre-processing step, where the original image I is replaced by a refined version J computed as follows:
J ( i , j ) = 1 1 + exp ( k ( I ( i , j ) σ ) ) ,       i = 1 , 2 , N r o w s ,   j = 1 , 2 , N c o l u m n s
where sigmoid coefficients k, σ > 0 are two given parameters.
The lacunarity function Λ(b) has a decreasing trend, and its graph resembles a hyperbola; it is worth noting that this last property is guaranteed for self-similar sets [49]. Therefore, this function can be approximated by using the model:
Λ ˜ ( b ; α , β , γ ) = β b α + γ , b [ b m i n , b m a x ]
where α, β, γ are suitable parameters, and [bmin, bmax] gives proper truncation bounds for boxes size; more precisely, bmin is usually chosen in the range 3–5 and bmax as a fraction of the image diagonal. In this study, we used bmax = 30 for CGR matrix size 32 × 32 and bmax = 60 for size 64 × 64. The best-fit of lacunarity function Λ(b) with model Λ ˜ ( b ; α , β , γ ) in (4) defines parameters α*, β*, γ* characterizing the fractal properties of set I. More precisely, parameter α is related to fractal dimension and parameter β gives an estimate of the reciprocal lacunarity of the set I [54,55]; so, high values of β means low lacunarity and low values of β means high lacunarity.
In the following results, parameters α*, β*, γ* are computed by a minimum least squares problem. The goodness-of-fit (R2 range: 0.9–0.95) obtained from any images analyzed supports the appropriateness of our choice of hyperbola model function to fit the gliding box curve.
The main phases in the proposed procedure to analyze mtDNA sequences are rendered in Figure 2. The particular example has been produced by using rCRS, where a good fit is obtained for the lacunarity function Λ(b) computed with GBA.

3. Results

Peripheral blood mtDNA from 33 subjects, 18 outpatients (nA: normal aging; age range 65–81 years) and 15 hospitalized patients (pA: pathological aging; age range 72–89 years) (Table 1), which served as age-matched controls in two previous studies on neurodegenerative disorders [28,29], were included in this study. Based on results from previous studies, for which the best CGR display of mtDNA fractal features was obtained for L equal to 5 and 6, mtDNA sequences were processed by the modified CGR method to generate a matrix description of each sequence for L = 5 and L = 6, where L was the length of subsequences in the matrix construction process. The same CGR sizes were previously reported to be the best for fractal feature displaying of DNA [61]. Fractal properties of CGR matrices (2L × 2L size) were analyzed to quantitatively characterize alterations of mtDNA in normal aging and pathological aging by our lacunarity parameter β, in comparison with the revised Cambridge Reference Sequence (rCRS).

3.1. CGR of Human mtDNA

Figure 3 shows images generated by the CGR method from rCRS with 2L × 2L matrices (L = 1, 2,…, 6). It is worth noting that the fractal feature of human mtDNA resembles the triangle of Sierpinski, an ideal fractal characterized by self-similarity, a property peculiar to fractals. Wang et al. [61] previously described the Sierpinski-like representation of human mtDNA. It has to be stressed that CGR representation of human mtDNA differs from human nuclear DNA as well as from non-human ones. This aspect highlights a species- and type-specificity of DNA fractality.
Table 2 shows results on mtDNA nucleotide bases (nb) from the subjects’ sample under study. MtDNA nucleotide sequences from the pA group present decreased numbers of the four nb while the nA one shows decreased Cytosine number and increased number of the other three nb when compared to rCRS. The number of all the four nb in the pA group is statistically significantly lower than that counted in the nA one (p < 0.001). The decreased number of nb counted in pA mtDNA sequences can be attributable mainly to a statistically significantly higher number of no-call (980 ± 390 in pA vs. 488 ± 145 in nA, p < 0.001). While the number of homoplasmic mutations observed in both groups does not show statistically significant differences, heteroplasmic mutations’ number is statistically significantly different (p = 0.006), with a higher number found in pA mtDNA sequences when compared with nA ones (10 ± 6 vs. 5 ± 4, respectively).
Among several and different point mutations observed, 83% of nA mtDNA sequences show the same C9546m variant, while 80% of the pA ones are characterized by the T9900w variant. These two heteroplasmic point mutations are both located in the mtDNA 9207–9900 frame, the MT-CO3 gene that encodes Cytochrome c oxidase subunit III (COX3) belonging to the Complex IV of the electron transport chain.

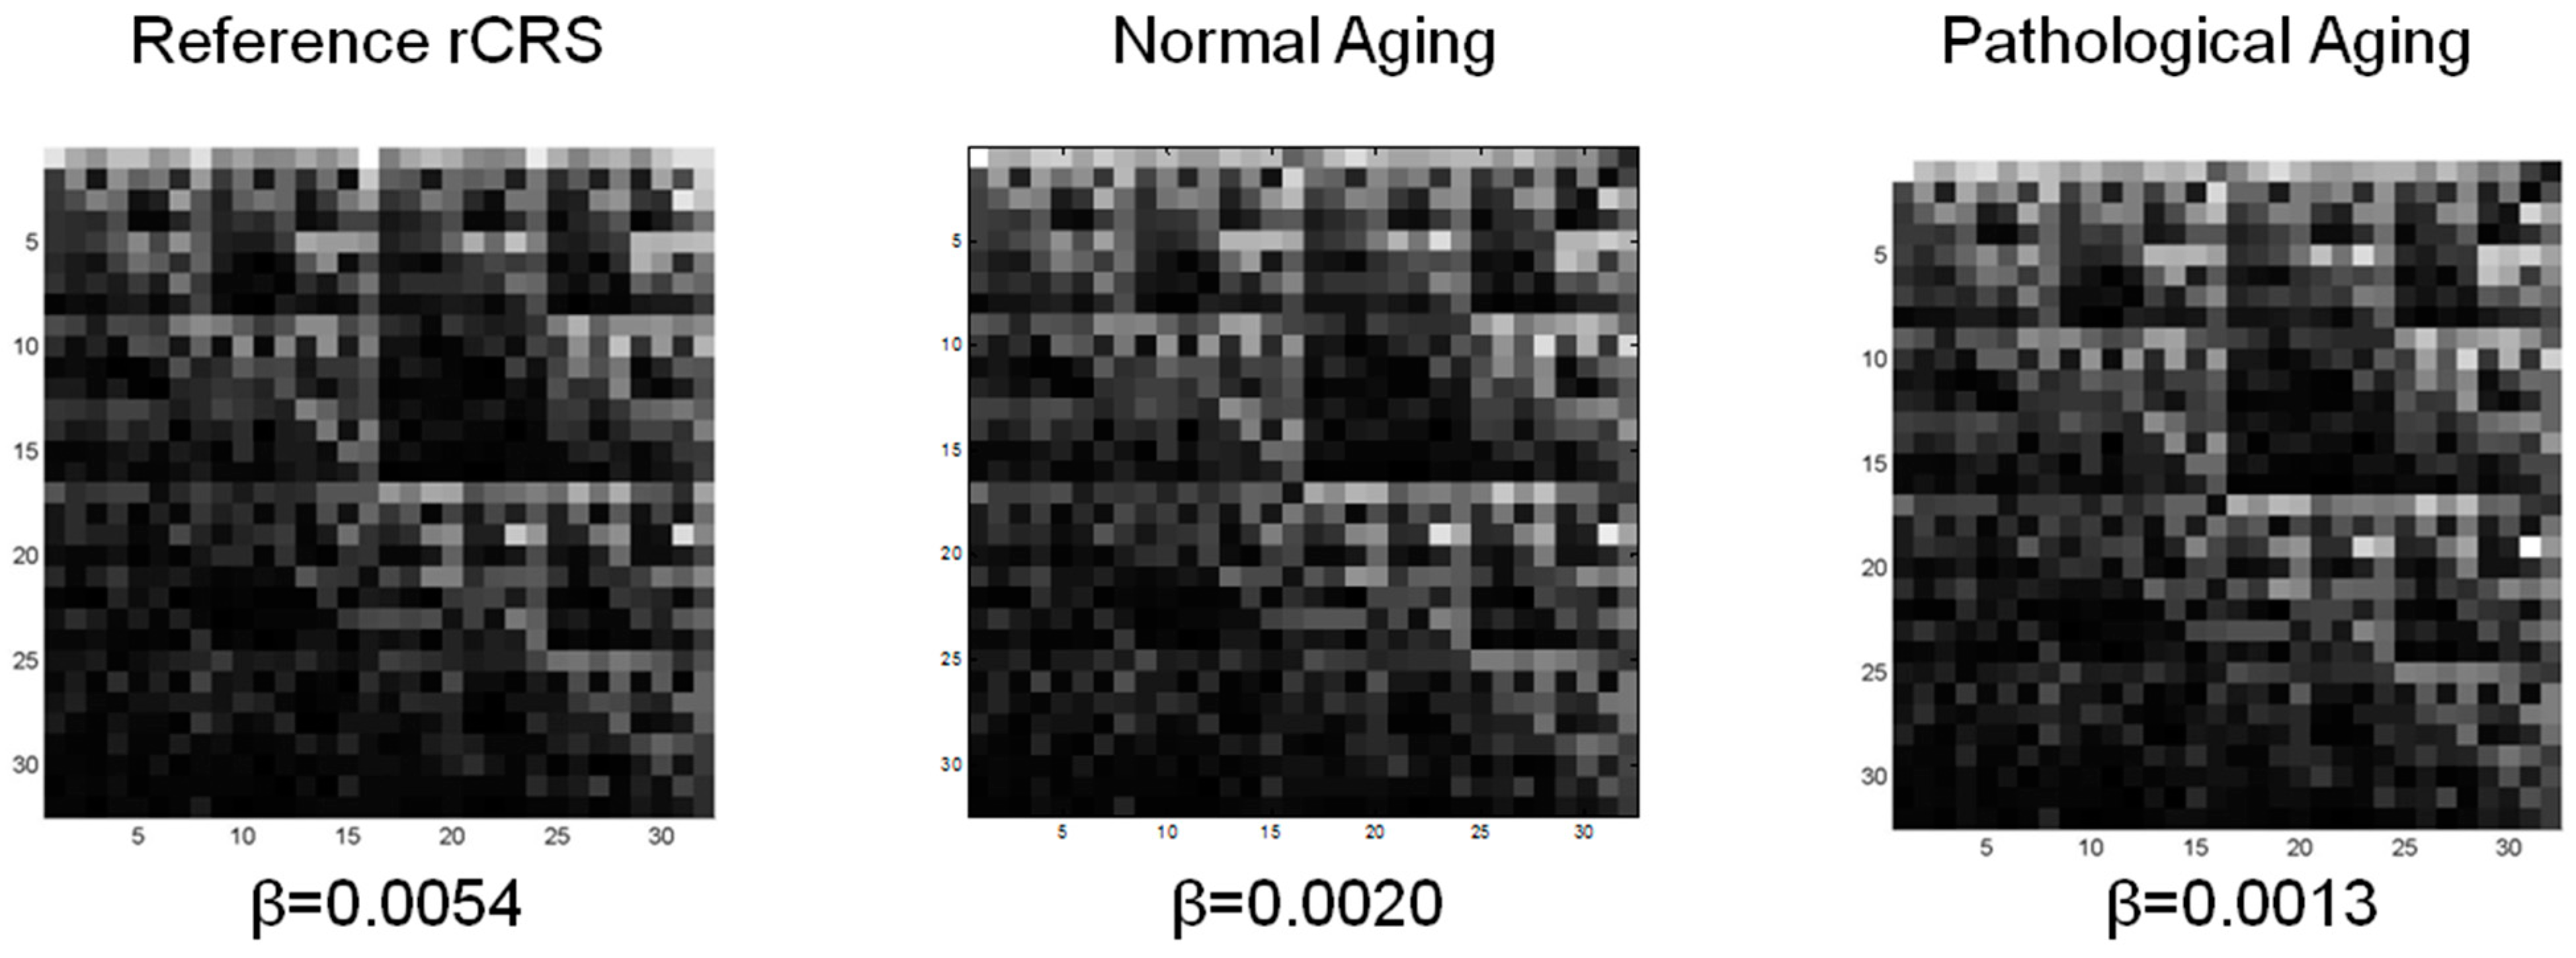
3.2. Lacunarity of mtDNA in Normal Aging and Pathological Aging

Accordingly with results from previous studies on mtDNA phenotyping [28,29], fractal lacunarity analysis of mtDNA was performed on CGR matrices 32 × 32 (L = 5) and 64 × 64 (L = 6). The optimal characterization of mtDNA nucleotide sequences was obtained using the following combination of coefficients: k and σ sigmoid coefficients, respectively equal to 7 and 0.7, and bmin equal to 3 or 5. Comparable results for rCRS were produced by using these values for L and bmin. Note that, for the sake of simplicity, we often focus on results related to L = 5 and bmin = 3. In addition, this combination produces lacunarity parameters for which α values, related to fractal dimension, are consistent with the fractal dimension of the Sierpinski triangle (approximately equal to 1.58). Figure 4 shows three examples of CGR matrices 32 × 32 (L = 5), generated by the modified CGR method, from mtDNA nucleotide sequence of rCRS, an nA subject, and a pA patient.
Despite the three examples of mtDNA CGR images appearing quite similar, parameter β values from nA and pA subjects are statistically significantly different from rCRS. The lower β values (high lacunarity) of nA and pA mtDNA account for a high degree of mutations (type, number, and position) of the mtDNA sequences analyzed. Statistically significant differences (p < 0.005) between nA and pA groups were found using bmin equal to 3 and 5 in CGR matrices 25 × 25 (32 × 32) and 26 × 26 (64 × 64). Table 3 shows lacunarity results related to CGR matrices 32 × 32 (i.e., L = 5) and 64 × 64 (i.e., L = 6). From this table, we can observe that the cases L = 5 and L = 6 give coherent results, confirming the validity of the conceptual basis of this work. As expected, the variation intervals for parameter α in nA and pA groups show relevant overlapping, which is consistent with very similar CGR displays. For parameter β lower overlaps are obtained, and a statistically significant difference (p < 0.001) between the two groups is found despite large SD values. This interesting property of parameter β deserves further analysis also in relation of different L values in CGR and the measurement accuracy in mtDNA resequencing.
Because of the statistically significant difference of age between nA and pA groups (p < 0.001), we also analyzed mtDNA sequences from two age-matched sub-groups. In particular, we considered 9 nA and 9 pA subjects within the same age-range 72–81 years (mean age 76 ± 3 and 77 ± 3, respectively, p = 0.1245).
Table 4 compares lacunarity results between the whole sample and the age-matched sub-groups for CGR matrices 32 × 32 and bmin = 3. Consistent results were obtained also for L = 5, bmin = 5, and for L = 6, bmin = 3 or 5 (data not shown).
Table 5 summarizes mtDNA classical characteristics from these two age-matched sub-groups. Results related to lacunarity parameters as well as nucleotide number and mutations from age-matched sub-groups are comparable to those observed in the whole sample, thereby excluding differences that are linked to aging per se.
Figure 5 shows the age-related distribution of lacunarity in nA and pA mtDNA sequences. In spite of high dispersion of nA and pA data values and a certain degree of overlap, parameter β at a cut-off value equal to 1.26 × 10⁻³, the median value of our data set, recognizes 78% nA subjects and 80% pA patients.

4. Discussion

Aging populations are characterized by a relevant level of heterogeneity. Inter-individual variability observed in the elderly account for an extended lifespan where only a few people experience healthy aging, while most individuals suffer pathological aging often characterized by multi-morbidity. For a long time, heterogeneity of the senescent phenotype has been making it hard to understand and characterize physiological aging, thereby making it difficult to recognize pathologically aging subjects. Here, we demonstrate that fractal analysis is a useful approach to distinguish between physiological and pathological aging. Profiling of mitochondrial genome by fractal lacunarity analysis, using our modified CGR method to deal with heteroplasmy, can point out statistically significant differences in mtDNA mutations’ profile of normally and pathologically aging subjects with a lower β value (higher lacunarity) observed in the pathological aging group when compared with normal aging one. A certain degree of data dispersion observed, reflecting the inter-individual heterogeneity, has to be expected. Most shared point mutations are peculiar to the haplogroup to which all the subjects under study belong. Differences among single individuals account for a very limited number of point mutations, any of which, in technical terms, corresponds to a light change of grayscale level in one pixel. This consideration further supports the usefulness of fractal analysis to face the problem of heterogeneity in aging populations. The proposed method, therefore, can overcome the limits of classical methods that often fail in searching for mutations associable with aging and/or disease(s).
The role of mitochondrial dysfunction and oxidative damage in both aging processes and etiopathogenesis of several age-dependent diseases is widely accepted in literature [9,12,62,63,64]; nevertheless, the mechanisms affecting these processes are not fully understood yet [65,66,67,68,69,70,71,72]. A solid link between inherited and acquired mtDNA genomic variants and frailty or mortality has not been demonstrated yet [73]. Studies on several and different populations have been producing conflicting and/or inconsistent data that do not convince about the correlation between aging and mtDNA somatic mutations [74,75,76,77,78,79]. In cohorts of healthy aged subjects, however, different mtDNA polymorphic variants seem to be enriched, suggesting that the mitochondrial genome may affect our way of aging as well as our lifespan [80,81,82]. These conflicting and/or inconsistent findings strongly raise the need for additional studies on mtDNA and senescent phenotypes. There is no evidence that pathological inherited mtDNA mutations represent one dominant detrimental factor in the etiology of age-related pathologies; nevertheless, it has been reported that at least a few pathologically aged subjects carry mtDNA mutations that predispose to onset/progression of disease(s) and a few normally aged subjects carry protective mtDNA mutations against pathology onset [83]. This aspect is strongly supported by the presence of the two mtDNA variants peculiar to normal aging and pathological aging, respectively, observed in the present study.
Most mtDNA variants have been mainly found in those tissues with the highest bioenergetic consumption, such as the brain [84], skeletal muscle [85], and heart [86], involved in the more common age-related pathologies. However, point mutations do not necessarily induce a pathological status. One major feature of the mitochondrial genome is nucleotide sequence polymorphism induced by mutations. The mitochondrial genome profile defined by heteroplasmy makes any mitochondria different from each other within cells. However, the pathological impact of the biochemical phenotype may occur only when the number of mtDNA mutated molecules responsible for bioenergetic impairment exceeds a critical level. In addition, bioenergetic impairment is also affected by the type of mutations as well as by the specific energetic requirement of any tissue [67]. According to the mitochondrial theory of aging, two major conditions can predispose to disease onset and progression: the rate at which both inherited and acquired mutations induces mitochondrial decline and the point at which compensation and adaptation to aging changes are insufficient to maintain the equilibrium of the system. The kinetics rates of these conditions determine when an individual starts to suffer pathological symptoms. In addition, the severity of pathological signs correlates with both the number of heteroplasmic point mutations and the size of deletions if present [66].
Tissue degeneration induced by mitochondrial dysfunction shows degree and pattern variability among and within individuals. It is linked to the type, number, and distribution of mutated mtDNA at the level of whole tissue regions and of single cells as well [23]. As already introduced and discussed elsewhere [2,28,29], introducing paradigms such as the theory of complexity and laws of chaos sounds appropriate to interpret the heterogeneity of aging people and define individual senescent phenotypes. By considering longevity as a “secondary product” of the evolution of a complex system, the aging individuals, as dynamic nonlinear systems, evolve with time toward physiological or pathological aging phenotype. Biocomplex systems such as humans are built up of several interactive sub-systems (cardiovascular, nervous, endocrine, … systems). Any sub-systems are made up of further interactive lowering components: organs, tissues, cells, and so forth to the lowest organization level. In particular, the hierarchy organization governed by the laws of chaos can elucidate the evolution of biological systems that, through lifelong adaptive responses to continuous stimuli from both internal and external environments, maintain the homeostasis (dynamic equilibrium of their integrated functions).
In light of this new perspective, aging represents the temporal evolution of a complex system characterized by a nonlinear dynamic behavior governed by the laws of chaos. Aging systems, influenced by both internal and external environments, undergo temporal evolution by losing complexity [6,7,31]. Human biocomplex systems, following a chaotic behavior, generate fractals; therefore, fractal analysis can be used to describe biocomplexity and measure changes with aging and pathology. The senescent phenotype, following different trajectories with different kinetics rates, evolves as pathological aging (fast rate), physiological aging (intermediate rate), or successful aging (low rate) depending on specific individual genetic-environmental interactions [1,2,87]. As already introduced, regarding point mutations as “holes” or “gaps” in mtDNA sequences, fractal lacunarity represents a proper tool to differentiate the senescent phenotype in physiological and pathological aging. In the case of mtDNA deterioration, fractal lacunarity provides a holistic estimate of changes occurring in the nucleotide sequences of the mitochondrial genome, inclusive of the type, number, and position of mutation(s), whose combination could drive the evolution of the individual senescent phenotype toward physiological or pathological aging. In this study, the age range of subjects is 65–89 years. It would be intriguing to study the lacunarity-based mtDNA mutation profile of centenarians dealing with successful aging (low aging rate). It is known that they live longer than normally aging subjects but not necessarily they age in good health. The present study could be extended to the analysis of this interesting problem.
Recently, lacunarity analysis of genome nucleotide sequences has been introduced as a method of analysis potentially applicable to any prokaryote and eukaryote bio-sequences [88]. Lacunarity analysis, by our hyperbola model function-based method, performed on magnetic resonance images of trabecular bone, successfully differentiates between aging and osteoporosis [54,55,56,57,89]. The modified version for CGR images of mtDNA nucleotide sequences, usable for characterization of the mitochondrial genome individual mutation profile, has been successfully applied to differentiate between aging and age-dependent neurodegenerative disorders such as Alzheimer’s and late-onset Parkinson’s diseases [28,29]. As mtDNA accounts for both homoplasmy and heteroplasmy, several symbols, different from the four-symbols alphabet used for DNA representation, identify heteroplasmic point mutations. The variant we introduced [28] to the original CGR algorithm by Jeffrey [50] to identify mtDNA heteroplasmy constitutes an innovative tool in the field. Lacunarity parameter β from our hyperbola model function is particularly sensitive to changes in mutated mtDNA sequences and can characterize the individual senescent phenotype by discriminating between normal aging and pathological aging. The median value of lacunarity parameter β (1.26 × 10⁻³) from all the subjects included in the study, used as the edge value, can separate 78% nA subjects and 80% pA patients. As already observed in previous studies [28,29], very few nA subjects display a mutation profile of mtDNA similar to the pA ones and vice versa. This aspect is particularly interesting as these subjects could serve to pinpoint mtDNA mutation(s) that protect aging individuals against pathology onset or that predispose them to pathological aging. A preliminary gross analysis of mutated frames highlights the presence of homoplasmic and/or heteroplasmic mutations at a level of different but very closed np when comparing mtDNA sequences from the two senescent phenotypes under study. In particular, the COX3 C9546m variant found in 83% of nA subjects and the COX3 T9900w one observed in 80% of pA subjects seem to be peculiar to normal aging and pathological aging, respectively. The peculiarity of the two heteroplasmic mutations found in the MT-CO gene further stresses the role mitochondrial genome dysfunction can play in the aging process and suggests potential mechanisms involved in aging and disease. Further deep analyses of mutated frames are in progress to understand the role they can play in driving the evolution of the senescent phenotype toward normal aging or pathological aging.
It is worth noting that this method can be applied to any diseases related to genetic alterations. It represents a “smart” screening tool for the genome that geneticists could use to identify altered nucleotide frame(s) and give insight into the search for selective gene(s) involved in specific diseases.
The intriguing results obtained from this preliminary study to verify the potential of the method solicit to confirm them in larger population samples. The proposed method, based on chaos game representation and fractal lacunarity analysis, emerges as a promising analysis tool for mutated mtDNA. Lacunarity parameter β can characterize an individual mitochondrial genome on the basis of its own mutation profile. In particular, parameter β can represent a good index to characterize the senescent phenotype as it distinguishes between physiological and pathological aging. It provides a helpful approach to recognize good biomarkers of aging and age-related pathologies.

5. Conclusions

Our method, based on chaos game representation and fractal lacunarity analysis of mtDNA, is able to feature an individual mitochondrial genome mutation profile. MtDNA mutation-based profiling of the senescent phenotype by fractal lacunarity discriminates between physiological and pathological aging.
Lacunarity parameter β from hyperbola model function allows for a holistic quantitative characterization of mtDNA damage, comprehensive of the type, number, and placement of mutations. Lacunarity results are consistent with the presence of specific point mutations; in particular, two variants peculiar to physiological and pathological aging, respectively, have been observed in most subjects from the two groups considered.
This study further supports the usefulness of paradigms such as biocomplexity, chaos, and fractality, to recognize good biomarkers and determinants of aging and disease(s). The proposed method represents a smart tool to predict the pathological evolution of the individual senescent phenotype, potentially useful for the early adoption of preventive interventions.

Author Contributions

Conceptualization, A.Z.; methodology, A.Z. and P.M.; software, P.M.; validation, A.Z.; formal analysis, A.Z. and P.M.; investigation, A.Z.; data curation, A.Z.; writing—original draft preparation, A.Z.; writing—review and editing, A.Z. and P.M. All authors have read and agreed to the published version of the manuscript.

Funding

This research received no external funding.

Institutional Review Board Statement

In this study, mtDNA sequences used were from previous studies conducted in accordance with the Declaration of Helsinki and approved by our Institutional Bioethics Committee-12/DSAN; 19 April 2011.

Informed Consent Statement

Informed consent was obtained from all subjects involved in the study.

Data Availability Statement

Data and biological samples are preserved in the institutional Database Sample Resource and can be made available upon reasonable request. MtDNA resequencing data are deposited in NCBI’s Gene Expression Omnibus and accessible at: https://www.ncbi.nlm.nih.gov/geo/query/acc.cgi?acc=GSE113704, http://www.ncbi.nlm.nih.gov/geo/query/acc.cgi?acc=GSE49160.

Acknowledgments

The authors wish to acknowledge Tiziana Casoli for having made mtDNA sequences available for this study. Internal ‘Ricerca Corrente’ funds from Italian Ministry of Health to IRCCS INRCA partially supported this study.

Conflicts of Interest

The authors declare no conflict of interest.

References

  1. Piantanelli, L.; Rossolini, G.; Basso, A.; Piantanelli, A.; Malavolta, M.; Zaia, A. Use of mathematical models of survivorship in the study of biomarkers of aging: The role of heterogeneity. Mech. Ageing Dev. 2001, 122, 1461–1475. [Google Scholar] [CrossRef]
  2. Zaia, A. Osteoporosis and fracture risk: New perspectives for early diagnosis and treatment assessment. In Osteoporosis: Etiology, Diagnosis and Treatment; Mattingly, B.E., Pillare, A.C., Eds.; Nova Science Publishers: Hauppauge, NY, USA, 2009; pp. 267–290. [Google Scholar]
  3. Pettersson, M. Complexity and Evolution; Cambridge University Press: Cambridge, UK, 1996. [Google Scholar]
  4. Grassberger, A.; Procaccia, I. Measuring the strangeness of strange attractors. Phys. D 1983, 9, 189–208. [Google Scholar] [CrossRef]
  5. Goldberger, A.L.; Rigney, D.R.; West, B.J. Chaos and fractals in human physiology. Sci. Am. 1990, 262, 42–49. [Google Scholar] [CrossRef]
  6. Goldberger, A.L. Non-linear dynamics for clinicians: Chaos theory, fractals, and complexity at the bedside. Lancet 1996, 347, 1312–1314. [Google Scholar] [CrossRef]
  7. Nonnenmacher, T.F.; Baumann, G.; Losa, G.A. Self-organization and fractal scaling patterns in biological systems. In Trends in Biological Cybernetics; Menon, J., Ed.; Publication Manager, Research Trends, Council of Scientific Research Integration: Trivandrum, India, 1990; pp. 65–73. [Google Scholar]
  8. Weibel, E.R. Fractal geometry: A design principle for living organisms. Am. J. Physiol. 1991, 261, L361–L369. [Google Scholar] [CrossRef] [PubMed]
  9. Trifunovic, A.; Larsson, N.G. Mitochondrial dysfunction as a cause of ageing. J. Int. Med. 2008, 263, 167–178. [Google Scholar] [CrossRef]
  10. Fleming, J.E.; Miquel, J.; Cottrell, S.F.; Yengoyan, L.S.; Economos, A.C. Is cell aging caused by respiration-dependent injury to the mitochondrial genome? Gerontology 1982, 28, 44–53. [Google Scholar] [CrossRef]
  11. Harman, D. Aging: A theory based on free radical and radiation chemistry. J. Gerontol. 1956, 11, 298–300. [Google Scholar] [CrossRef] [Green Version]
  12. Bratic, A.; Larsson, N.G. The role of mitochondria in aging. J. Clin. Investig. 2013, 123, 951–957. [Google Scholar] [CrossRef] [Green Version]
  13. Gomez-Cabrera, M.C.; Sanchis-Gomar, F.; Garcia-Valles, R.; Pareja-Galeano, H.; Gambini, J.; Borras, C.; Vina, J. Mitochondria as sources and targets of damage in cellular aging. Clin. Chem. Lab. Med. 2012, 50, 1287–1295. [Google Scholar] [CrossRef]
  14. Kennedy, S.R.; Loeb, L.A.; Herr, A.J. Somatic mutations in aging, cancer and neurodegeneration. Mech. Ageing Dev. 2012, 133, 118–126. [Google Scholar] [CrossRef] [PubMed] [Green Version]
  15. Wei, Y.H.; Lee, H.C. Oxidative stress, mitochondrial DNA mutation, and impairment of antioxidant enzymes in aging. Exp. Biol. Med. 2002, 227, 671–682. [Google Scholar] [CrossRef]
  16. Cortopassi, G.A.; Arnheim, N. Detection of a specific mitochondrial DNA deletion in tissues of older humans. Nucleic Acids Res. 1990, 18, 6927–6933. [Google Scholar] [CrossRef] [PubMed] [Green Version]
  17. Soong, N.W.; Hinton, D.R.; Cortopassi, G.; Arnheim, N. Mosaicism for a specific somatic mitochondrial DNA mutation in adult human brain. Nat. Genet. 1992, 2, 318–323. [Google Scholar] [CrossRef] [PubMed]
  18. Munscher, C.; Rieger, T.; Muller-Hocker, J.; Kadenbach, B. The point mutation of mitochondrial DNA characteristic for MERRF disease is found also in healthy people of different ages. FEBS Lett. 1993, 317, 27–30. [Google Scholar] [CrossRef] [Green Version]
  19. Schwarze, S.R.; Lee, C.M.; Chung, S.S.; Roecker, E.B.; Weindruch, R.; Aiken, J.M. High levels of mitochondrial DNA deletions in skeletal muscle of old rhesus monkeys. Mech. Ageing Dev. 1995, 83, 91–101. [Google Scholar] [CrossRef]
  20. Khaidakov, M.; Heflich, R.H.; Manjanatha, M.G.; Myers, M.B.; Aidoo, A. Accumulation of point mutations in mitochondrial DNA of aging mice. Mutat. Res. 2003, 526, 1–7. [Google Scholar] [CrossRef]
  21. Hebert, S.L.; Lanza, I.R.; Nair, K.S. Mitochondrial DNA alterations and reduced mitochondrial function in aging. Mech. Ageing Dev. 2010, 131, 451–462. [Google Scholar] [CrossRef] [Green Version]
  22. Payne, B.A.; Wilson, I.J.; Yu-Wai-Man, P.; Coxhead, J.; Deehan, D.; Horvath, R.; Taylor, R.W.; Samuels, D.C.; Santibanez-Koref, M.; Chinnery, P.F. Universal heteroplasmy of human mitochondrial DNA. Hum. Mol. Genet. 2012, 22, 384–390. [Google Scholar] [CrossRef] [Green Version]
  23. Dhillon, V.S.; Fenech, M. Mutations that affect mitochondrial functions and their association with neurodegenerative diseases. Mutat. Res. Rev. Mutat. Res. 2014, 759, 1–13. [Google Scholar] [CrossRef]
  24. Rossignol, R.; Malgat, M.; Mazat, J.P.; Letellier, T. Threshold effect and tissue specificity. Implication for mitochondrial cytopathies. J. Biol. Chem. 1999, 274, 33426–33432. [Google Scholar] [CrossRef] [PubMed] [Green Version]
  25. Wallace, D.C. Mitochondrial DNA mutations in disease and aging. Environ. Mol. Mutagen. 2010, 51, 440–450. [Google Scholar] [CrossRef] [PubMed]
  26. Kujoth, G.C.; Bradshaw, P.C.; Haroon, S.; Prolla, T.A. The role of mitochondrial DNA mutations in mammalian aging. PLoS Genet. 2007, 3, e24. [Google Scholar] [CrossRef] [PubMed] [Green Version]
  27. Shuster, R.C.; Rubenstein, A.J.; Wallace, D.C. Mitochondrial DNA in anucleate human blood cells. Biochem. Biophys. Res. Commun. 1988, 155, 1360–1365. [Google Scholar] [CrossRef]
  28. Zaia, A.; Maponi, P.; Di Stefano, G.; Casoli, T. Biocomplexity and fractality in the search of biomarkers of aging and pathology: Focus on mitochondrial DNA and Alzheimer’s disease. Aging Dis. 2017, 8, 44–56. [Google Scholar] [CrossRef] [PubMed] [Green Version]
  29. Zaia, A.; Maponi, P.; Zannotti, M.; Casoli, T. Biocomplexity and Fractality in the Search of Biomarkers of Aging and Pathology: Mitochondrial DNA Profiling of Parkinson’s Disease. Int. J. Mol. Sci. 2020, 21, 1758. [Google Scholar] [CrossRef] [Green Version]
  30. Mandelbrot, B.B. The Fractal Geometry of Nature; WH Freeman: New York, NY, USA, 1982. [Google Scholar]
  31. Lipsitz, L.A.; Goldberger, A.L. Loss of ‘complexity’ and aging: Potential applications of fractals and chaos theory to senescence. JAMA 1992, 267, 1806–1809. [Google Scholar] [CrossRef]
  32. Losa, G.A.; Nonnenmacher, T.F. Self-similarity and fractal irregularity in pathologic tissues. Mod. Pathol. 1996, 9, 174–182. [Google Scholar]
  33. Cross, S.S. Fractals in pathology. J. Pathol. 1997, 182, 1–8. [Google Scholar] [CrossRef]
  34. Oiwa, N.N.; Glazier, J.A. Self-similar mitochondrial DNA. Cell Biochem. Biophys. 2004, 41, 41–62. [Google Scholar] [CrossRef]
  35. Goldberger, L.A.; Peng, C.K.; Lipsitz, L.A. What is physiologic complexity and how does it change with aging and disease? Neurobiol. Aging 2002, 23, 23–26. [Google Scholar] [CrossRef]
  36. Piantanelli, A.; Serresi, S.; Ricotti, G.; Rossolini, G.; Zaia, A.; Basso, A.; Piantanelli, L. Color-based method for fractal dimension estimation of pigmented skin lesion contour. In Fractals in Biology and Medicine; Losa, G.A., Ed.; Birkhauser Press: Basel, Switzerland, 2002; pp. 127–136. [Google Scholar]
  37. Vaillancourt, D.E.; Newell, K.M. Changing complexity in human behaviour and physiology through aging and disease. Neurobiol. Aging 2002, 23, 1–11. [Google Scholar] [CrossRef]
  38. Lipsitz, L.A. Physiological complexity, aging, and the path to frailty. Sci. Aging Knowl. Environ. 2004, 16, pe16. [Google Scholar] [CrossRef] [PubMed]
  39. Doubal, F.N.; MacGillivray, T.J.; Patton, N.; Dhillon, B.; Dennis, M.S.; Wardlaw, J.M. Fractal analysis of retinal vessels suggests that a distinct vasculopathy causes lacunar stroke. Neurology 2010, 74, 1102–1107. [Google Scholar] [CrossRef] [Green Version]
  40. Fiz, J.A.; Monte-Moreno, E.; Andreo, F.; Auteri, S.J.; Sanz-Santos, J.; Serra, P.; Bonet, G.; Castellà, E.; Manzano, J.R. Fractal dimension analysis of malignant and benign endobronchial ultrasound nodes. BMC Med. Imaging 2014, 14, 22. [Google Scholar] [CrossRef] [Green Version]
  41. Captur, G.; Karperien, A.L.; Li, C.; Zemrak, F.; Tobon-Gomez, C.; Gao, X.; Bluemke, D.A.; Elliott, P.M.; Petersen, S.E.; Moon, J.C. Fractal frontiers in cardiovascular magnetic resonance: Towards clinical implementation. J. Cardiovasc. Magn. Reson. 2015, 17, 80. [Google Scholar] [CrossRef] [Green Version]
  42. Hao, B.L. Fractals from genomes—Exact solutions of a biology-inspired problem. Phys. A 2000, 282, 225–246. [Google Scholar] [CrossRef] [Green Version]
  43. Kirilyuk, A.P. Complex-dynamical extension of the fractal paradigm and its applications in life sciences. In Fractals in Biology and Medicine; Losa, G.A., Merlini, D., Nonnenmacher, T.F., Weibel, E., Eds.; Birkhauser Press: Basel, Switzerland, 2004; pp. 233–244. [Google Scholar]
  44. Zhou, L.Q.; Yu, Z.G.; Deng, J.Q.; Anh, V.; Long, S.C. A fractal method to distinguish coding and non-coding sequences in a complete genome based on a number sequence representation. J. Theor. Biol. 2005, 232, 559–567. [Google Scholar] [CrossRef] [Green Version]
  45. Aldrich, P.R.; Horsley, R.K.; Turcic, S.M. Symmetry in the language of gene expression: A survey of gene promoter networks in multiple bacterial species and non-σ regulons. Symmetry 2011, 3, 750–766. [Google Scholar] [CrossRef] [Green Version]
  46. Cattani, C.; Pierro, G. On the fractal geometry of DNA by the binary image analysis. Bull. Math. Biol. 2013, 75, 1544–1570. [Google Scholar] [CrossRef]
  47. Mandelbrot, B.B. A Fractal’s Lacunarity, and how it can be Tuned and Measured. In Fractals in Biology and Medicine; Nonnenmacher, T.F., Losa, G.A., Weibel, E.R., Eds.; Birkhauser Press: Basel, Switzerland, 1993; pp. 8–21. [Google Scholar]
  48. Plotnick, R.E.; Gardner, R.H.; Hargrove, W.W.; Prestegard, K.; Perlmutter, M. Lacunarity analysis: A general technique for the analysis of spatial patterns. Phys. Rev. E 1996, 53, 5461–5468. [Google Scholar] [CrossRef] [PubMed] [Green Version]
  49. Allain, C.; Cloitre, M. Characterizing the lacunarity of random and deterministic fractal sets. Phys. Rev. A 1991, 44, 3552–3558. [Google Scholar] [CrossRef] [PubMed]
  50. Jeffrey, H.J. Chaos game representation of gene structure. Nucleic Acids Res. 1990, 18, 2163–2170. [Google Scholar] [CrossRef] [PubMed] [Green Version]
  51. Deschavanne, P.J.; Giron, A.; Vilain, J.; Fagot, G.; Fertil, B. Genomic signature: Characterization and classification of species assessed by chaos game representation of sequences. Mol. Biol. Evol. 1999, 16, 1391–1399. [Google Scholar] [CrossRef]
  52. Fu, W.; Wang, Y.; Lu, D. Multifractal analysis of genomic sequences CGR images. In Proceedings of the 2005 IEEE Engineering in Medicine and Biology 27th Annual Conference, Shanghai, China, 17–18 January 2006; Volume 5, pp. 4783–4786. [Google Scholar] [CrossRef]
  53. Stan, C.; Cristescu, C.P.; Scarlat, E.I. Similarity analysis for DNA sequences based on chaos game representation. Case study: The albumin. J. Theor. Biol. 2010, 267, 513–518. [Google Scholar] [CrossRef] [Green Version]
  54. Zaia, A.; Eleonori, R.; Maponi, P.; Rossi, R.; Murri, R. Medical imaging and osteoporosis: Fractal’s lacunarity analysis of trabecular bone in MR images. Proceedings of Eighteenth IEEE Symposium on Computer-Based Medical Systems (CBMS 2005), Dublin, Ireland, 23–24 June 2005; IEEE: Piscataway, NJ, USA, 2005; pp. 3–8. [Google Scholar] [CrossRef]
  55. Zaia, A.; Eleonori, R.; Maponi, P.; Rossi, R.; Murri, R. MR imaging and osteoporosis: Fractal lacunarity analysis of trabecular Bone. IEEE Trans. Inf. Technol. Biomed. 2006, 10, 484–489. [Google Scholar] [CrossRef]
  56. Zaia, A.; Rossi, R.; Egidi, N.; Maponi, P. Fractal’s lacunarity analysis of trabecular bone in MR images. In Computational Vision and Medical Image Processing; Tavares, J., Jorge, N., Eds.; CRC Press: Boca Raton, FL, USA, 2010; pp. 421–426. [Google Scholar]
  57. Zaia, A. Fractal lacunarity of trabecular bone and magnetic resonance imaging: New perspectives for osteoporotic fracture risk assessment. World J. Orthop. 2015, 6, 221–235. [Google Scholar] [CrossRef]
  58. Edgar, R.; Domrachev, M.; Lash, A.E. Gene expression omnibus: NCBI gene expression and hybridization array data repository. Nucleic Acids Res. 2002, 30, 207–210. [Google Scholar] [CrossRef] [Green Version]
  59. Casoli, T.; Di Stefano, G.; Spazzafumo, L.; Balietti, M.; Giorgetti, B.; Giuli, C.; Postacchini, D.; Fattoretti, P.; Conti, F. Contribution of non-reference alleles in mtDNA of Alzheimer’s disease patients. Ann. Clin. Transl. Neurol. 2014, 1, 284–289. [Google Scholar] [CrossRef]
  60. Vinga, S.; Carvalho, A.M.; Francisco, A.P.; Russo, L.M.; Almeida, J.S. Pattern matching through chaos game representation: Bridging numerical and discrete data structures for biological sequence analysis. Algorithms Mol. Biol. 2012, 7, 10. [Google Scholar] [CrossRef] [Green Version]
  61. Wang, Y.; Hill, K.; Singh, S.; Kari, L. The spectrum of genomic signatures: From dinucleotides to chaos game representation. Gene 2005, 346, 173–185. [Google Scholar] [CrossRef] [PubMed]
  62. Trifunovic, A. Mitochondrial DNA and ageing. Biochem. Biophys. Acta 2006, 1757, 611–617. [Google Scholar] [CrossRef] [PubMed] [Green Version]
  63. Federico, A.; Cardaioli, E.; Da Pozzo, P.; Formichi, P.; Gallus, G.N.; Radi, E. Mitochondria, oxidative stress and neurodegeneration. J. Neurol. Sci. 2012, 322, 254–262. [Google Scholar] [CrossRef] [PubMed]
  64. Jang, J.Y.; Blum, A.; Liu, J.; FinkelJ, T. The role of mitochondria in aging. J. Clin. Investig. 2018, 128, 3662–3670. [Google Scholar] [CrossRef] [PubMed] [Green Version]
  65. Linnane, A.W.; Marzuki, S.; Ozawa, T.; Tanaka, M. Mitochondrial DNA mutations as an important contributor to ageing and degenerative diseases. Lancet 1989, 1, 642–645. [Google Scholar] [CrossRef]
  66. Gellerich, F.N.; Deschauer, M.; Chen, Y.; Muller, T.; Neudecker, S.; Zierz, S. Mitochondrial respiratory rates and activities of respiratory chain complexes correlate linearly with heteroplasmy of deleted mtDNA without threshold and independently of deletion size. Biochem. Biophys. Acta 2002, 1556, 41–52. [Google Scholar] [CrossRef] [Green Version]
  67. Taylor, R.W.; Turnbull, D.M. Mitochondrial DNA mutations in human disease. Nat. Rev. Genet. 2005, 6, 389–402. [Google Scholar] [CrossRef] [PubMed] [Green Version]
  68. Lagouge, M.; Larsson, N.G. The role of mitochondrial DNA mutations and free radicals in disease and ageing. J. Intern. Med. 2013, 273, 529–543. [Google Scholar] [CrossRef] [Green Version]
  69. Kazachkova, N.; Ramos, A.; Santos, C.; Lima, M. Mitochondrial DNA Damage Patterns and Aging: Revising the Evidences for Humans and Mice. Aging Dis. 2013, 4, 337–350. [Google Scholar] [CrossRef] [PubMed]
  70. Zapico, S.C.; Ubelaker, D.H. mtDNA Mutations and Their Role in Aging, Diseases and Forensic Sciences. Aging Dis. 2013, 4, 364–380. [Google Scholar] [CrossRef]
  71. Itsara, L.S.; Kennedy, S.R.; Fox, E.J.; Yu, S.; Hewitt, J.J.; Sanchez-Contreras, M.; Cardozo-Pelaez, F.; Pallanck, L.J. Oxidative stress is not a major contributor to somatic mitochondrial DNA mutations. PLoS Genet. 2014, 10, e1003974. [Google Scholar] [CrossRef] [PubMed] [Green Version]
  72. Ziada, A.S.; Smith, M.S.R.; Côté, H.C.F. Updating the Free Radical Theory of Aging. Front. Cell Dev. Biol. 2020, 8, 575–645. [Google Scholar] [CrossRef] [PubMed]
  73. Collerton, J.; Ashok, D.; Martin-Ruiz, C.; Pyle, A.; Hudson, G.; Yadegarfar, M.; Davies, K.; Jagger, C.; von Zglinicki, T.; Kirkwood, T.B.; et al. Frailty and mortality are not influenced by mitochondrial DNA haplotypes in the very old. Neurobiol. Aging 2013, 34, 2889.e1–2889.e4. [Google Scholar] [CrossRef] [PubMed] [Green Version]
  74. Courtenay, M.D.; Gilbert, J.R.; Jiang, L.; Cummings, A.C.; Gallins, P.J.; Caywood, L.; Reinhart-Mercer, L.; Fuzzell, D.; Knebusch, C.; Laux, R.; et al. Mitochondrial haplogroup X is associated with successful aging in the Amish. Hum. Genet. 2012, 131, 201–208. [Google Scholar] [CrossRef] [Green Version]
  75. De Benedictis, G.; Rose, G.; Carrieri, G.; De Luca, M.; Falcone, E.; Passarino, G.; Bonafe, M.; Monti, D.; Baggio, G.; Bertolini, S.; et al. Mitochondrial DNA inherited variants are associated with successful aging and longevity in humans. Faseb J. 1999, 13, 1532–1536. [Google Scholar] [CrossRef]
  76. Feng, J.; Zhang, J.; Liu, M.; Wan, G.; Qi, K.; Zheng, C.; Lv, Z.; Hu, C.; Zeng, Y.; Gregory, S.G.; et al. Association of mtDNA haplogroup F with healthy longevity in the female Chuang population, China. Exp. Gerontol. 2011, 46, 987–993. [Google Scholar] [CrossRef]
  77. Ross, O.A.; McCormack, R.; Curran, M.D.; Duguid, R.A.; Barnett, Y.A.; Rea, I.M.; Middleton, D. Mitochondrial DNA polymorphism: Its role in longevity of the Irish population. Exp. Gerontol. 2001, 36, 1161–1178. [Google Scholar] [CrossRef]
  78. Tanaka, M.; Gong, J.-S.; Zhang, J.; Yoneda, M.; Yagi, K. Mitochondrial genotype associated with longevity. Lancet 1998, 351, 185–186. [Google Scholar] [CrossRef]
  79. Tanaka, M.; Gong, J.-S.; Zhang, J.; Yamada, Y.; Borgeld, H.; Yagi, K. Mitochondrial genotype associated with longevity and its inhibitory effect on mutagenesis. Mech. Ageing Dev. 2000, 116, 65–76. [Google Scholar] [CrossRef]
  80. Niemi, A.K.; Hervonen, A.; Hurme, M.; Karhunen, P.J.; Jylha, M.; Majamaa, K. Mitochondrial DNA polymorphisms associated with longevity in a Finnish population. Hum. Genet. 2003, 112, 29–33. [Google Scholar] [CrossRef]
  81. Niemi, A.K.; Moilanen, J.S.; Tanaka, M.; Hervonen, A.; Hurme, M.; Lehtimaki, T.; Arai, Y.; Hirose, N.; Majamaa, K. A combination of three common inherited mitochondrial DNA polymorphisms promotes longevity in Finnish and Japanese subjects. Eur. J. Hum. Genet. 2005, 13, 166–170. [Google Scholar] [CrossRef] [PubMed] [Green Version]
  82. Yang, X.; Wang, X.; Yao, H.; Deng, J.; Jiang, Q.; Guo, Y.; Lan, G.; Liao, D.J.; Jiang, H. Mitochondrial DNA polymorphisms are associated with the longevity in the Guangxi Bama population of China. Mol. Biol. Rep. 2012, 39, 9123–9131. [Google Scholar] [CrossRef] [PubMed]
  83. Elson, J.L.; Herrnstadt, C.; Preston, G.; Thal, L.; Morris, C.M.; Edwardson, J.A.; Beal, M.F.; Turnbull, D.M.; Howell, N. Does the mitochondrial genome play a role in the etiology of Alzheimer’s disease? Hum. Genet. 2006, 119, 241–254. [Google Scholar] [CrossRef] [PubMed]
  84. Corral-Debrinski, M.; Horton, T.; Lott, M.T.; Shoffner, J.M.; Beal, M.F.; Wallace, D.C. Mitochondrial DNA deletions in human brain: Regional variability and increase with advanced age. Nat. Genet. 1992, 2, 324–329. [Google Scholar] [CrossRef] [PubMed]
  85. Fayet, G.; Jansson, M.; Sternberg, D.; Moslemi, A.R.; Blondy, P.; Lombes, A.; Fardeau, M.; Oldfors, A. Ageing muscle: Clonal expansions of mitochondrial DNA point mutations and deletions cause focal impairment of mitochondrial function. Neuromuscul. Disord. 2002, 12, 484–493. [Google Scholar] [CrossRef]
  86. Corral-Debrinski, M.; Shoffner, J.M.; Lott, M.T.; Wallace, D.C. Association of mitochondrial DNA damage with aging and coronary atherosclerotic heart disease. Mutat. Res. 1992, 275, 169–180. [Google Scholar] [CrossRef]
  87. Franceschi, C.; Garagnani, P.; Morsiani, C.; Conte, M.; Santoro, A.; Grignolio, A.; Monti, D.; Capri, M.; Salvioli, S. The Continuum of Aging and Age-Related Diseases: Common Mechanisms but Different Rates. Front. Med. 2018, 5, 61. [Google Scholar] [CrossRef] [Green Version]
  88. Gopakumar, G.; Nair, A.S. Lacunarity Analysis of Genomic Sequences: A Potential Bio-sequence Analysis Method. In Proceedings of the 5th International Conference on of Bioinformatics and Biomedical Engineering (iCBBE), Wuhan, China, 10–12 May 2011; IEEE: Piscataway, NJ, USA, 2011; pp. 1–4. [Google Scholar] [CrossRef]
  89. Zaia, A.; Rossi, R.; Galeazzi, R.; Sallei, M.; Maponi, P.; Scendoni, P. Fractal lacunarity of trabecular bone in vertebral MRI to predict osteoporotic fracture risk in over-fifties women. The LOTO study. BMC Musculoskelet. Disord. 2021, 22, 108. [Google Scholar] [CrossRef]
Figure 1. Rendering of Chaos Game Representation method. (Top) CGR display in 2L × 2L matrices for L = 1, 2, 3 in the case of DNA four-symbol alphabet {a, c, g, t}. (Bottom) CGR images of rCRS, revised Cambridge Reference Sequence, for the same matrix sizes.
Fractalfract 06 00219 g001
Figure 2. Rendering of fractal lacunarity method. Top left: imaging of rCRS-mtDNA generated by L = 5, so the CGR matrix is 32 × 32 square. Top right: fitting of GBA lacunarity plot (dotted line), for k, σ respectively equal to 7, 0.7, and bmin, bmax respectively equal to 3, 30, by hyperbola model function (solid line). Bottom: the hyperbola formula containing the three parameters α, β, γ. rCRS: revised Cambridge Reference Sequence; CGR: Chaos Game Representation; GBA: Gliding Box Algorithm.
Fractalfract 06 00219 g002
Figure 3. Chaos Game Representation (CGR) of human mtDNA. (a) The Sierpinski triangle, an ideal fractal generated by repeated iterations starting from a square. (b) Sierpinski-like self-similarity of mtDNA by CGR matrices 2L × 2L, for L = 1, 2…, 6, of revised Cambridge Reference Sequence (rCRS).
Fractalfract 06 00219 g003
Figure 4. Examples of mtDNA sequence images generated by the CGR method. CGR matrices 25 × 25 (32 × 32) and related lacunarity parameter β values are shown for mtDNA sequences from rCRS (left), a subject of the nA group (middle), and a pA patient (right). CGR: Chaos Game Representation; rCRS: revised Cambridge Reference Sequence; nA: normal aging; pA: pathological aging.
Fractalfract 06 00219 g004
Figure 5. Age-related distribution of mtDNA lacunarity values in the senescent phenotype. A cut-off value at 1.26 × 10⁻³ of lacunarity parameter β is able to separate most normal aging (gray circle) and pathological aging (black circle) subjects.
Fractalfract 06 00219 g005
Table 1. Demographic and clinical characteristics of analyzed subjects’ sample.
OverallnApA
Number (Female/Male)33 (23/10)18 (14/4)15 (9/6)
Age (year)76.1 ± 6.472.1 ± 4.480.9 ± 5.1
ADL (hierarchy scale)0.0 (0.0–0.0)0.0 (0.0–0.0)0.0 (4.5–0.0)
MMSE (scale 30–0)-28.2 (28.4–27.4)-
CPS (hierarchy scale)--1.0 (2.0–0.0)
Values are mean ± SD or median (interquartile range) for non-normally distributed variables; nA: normal aging; pA: pathological aging; ADL: Activities of Daily Living; MMSE: Mini-Mental State Examination; CPS: Cognitive Performance Scale.
Table 2. Classic characteristics of mtDNA nucleotide sequences in normal and pathological aging.
NumberrCRSnApAp Value
Subjects-1815
Adenine51175172 ± 114912 ± 111<0.001
Cytosine51754946 ± 184618 ± 168<0.001
Guanine21632270 ± 232108 ± 49<0.001
Thymine40894157 ± 73916 ± 101<0.001
No-call-488 ± 145980 ± 390<0.001
Homoplasmy-18 ± 921 ± 80.170
Heteroplasmy-5 ± 410 ± 60.006
Results are expressed as mean ± SD; p Values: statistical significance of differences between groups accepted for p ≤ 0.05 by one-tail t-test; rCRS: revised Cambridge Reference Sequence; nA: normal aging; pA: pathological aging.
Table 3. Fractal parameters of mtDNA CGR matrices from hyperbola model function-based lacunarity method.
mtDNAbmin = 3bmin = 5
α (100)β (*)α (100)β (*)
CGR matrix
L = 5
rCRS1.64255.36502.097810.8327
nA1.6543 ± 0.00051.4772 ± 0.50602.1725 ± 0.00163.6416 ± 1.3046
pA1.6403 ± 0.00070.8988 ± 0.49902.0364 ± 0.00131.7004 ± 1.0239
p Value<0.00010.0023<0.00010.0001
CGR matrix
L = 6
rCRS1.00991.20131.03691.1125
nA1.0521 ± 0.02331.1225 ± 0.03671.1328 ± 0.19541.3821 ± 0.6591
pA0.9955 ± 0.05900.8828 ± 0.20600.9982 ± 0.06370.9305 ± 0.1791
p Value0.0004<0.00010.00790.0076
*: 10−3 for β values related to L = 5 and 10−1 β values related to L = 6; bmax values are respectively 30 and 60 for L = 5 and L = 6; values are expressed as mean ± SD; fractal parameters α and β: α correlates with fractal dimension and β measures fractal lacunarity; p values from one-tail t-test for p ≤ 0.05 to compare nA and pA; rCRS: revised Cambridge Reference Sequence; nA: normal aging; pA: pathological aging.
Table 4. Fractal parameters of mtDNA in age-matched subjects.
mtDNAOverallAge-Matched
α (100)β (10−3)α (100)β (10−3)
rCRS1.64255.36501.64255.3650
nA1.6543 ± 0.00051.4772 ± 0.50601.6544 ± 0.00051.3850 ± 0.4227
pA1.6403 ± 0.00070.8988 ± 0.49901.6399 ± 0.00090.6596 ± 0.6026
p Value<0.00010.0023<0.00010.0082
Values are expressed as mean ± SD; α and β: fractal parameters for bmin = 3 in CGR matrices with L = 5, α correlates with fractal dimension and β measures fractal lacunarity; p values from one-tail t-test for p ≤ 0.05 to compare nA and pA; rCRS: revised Cambridge Reference Sequence; nA: normal aging; pA: pathological aging.
Table 5. Characteristics of mtDNA nucleotide sequences in age-matched sub-groups.
NumberrCRSnA (n.9)pA (n.9)p Value
Age-75.8 ± 2.977.4 ± 3.00.1245
Adenine51175173 ± 64873 ± 122<0.0001
Cytosine51754945 ± 194551 ± 189<0.0001
Guanine21632268 ± 182090 ± 56<0.0001
Thymine40894158 ± 83875 ± 110<0.0001
No-call-481 ± 1351142 ± 4270.0002
Homoplasmy-17 ± 920 ± 80.2056
Heteroplasmy-6 ± 413 ± 70.0074
Results are represented as mean ± SD; p value: statistical significance accepted for p ≤ 0.05 by one-tail t-test to compare nA and pA sub-groups; rCRS: revised Cambridge Reference Sequence; nA: normal aging; pA: pathological aging.
Publisher’s Note: MDPI stays neutral with regard to jurisdictional claims in published maps and institutional affiliations.

