Article

Fault Diagnosis of Hydroelectric Units Based on a Novel Multiscale Fractional-Order Weighted Permutation Entropy

1
Department of Electrical Engineering, College of Water Resources and Architectural Engineering, Northwest A&F University, Xianyang 712100, China
2
Key Laboratory of Agricultural Soil and Water Engineering in Arid and Semiarid Areas, Ministry of Education, Northwest A&F University, Xianyang 712100, China
*
Author to whom correspondence should be addressed.
Fractal Fract. 2022, 6(10), 588; https://doi.org/10.3390/fractalfract6100588
Submission received: 8 September 2022 / Revised: 9 October 2022 / Accepted: 11 October 2022 / Published: 13 October 2022

Abstract

:
To improve the noise immunity, stability and sensitivity to different signal types in the hydroelectric unit fault diagnosis model, a hydroelectric unit fault diagnosis model based on improved multiscale fractional-order weighted permutation entropy (IMFWPE) is proposed. Firstly, the fractional order and weighting theory is introduced into the permutation entropy (PE) to improve the sensitivity to different fault signals while improving the defect of ignoring the signal amplitude information. Additionally, considering the problem that a single scale cannot fully reflect the timing characteristics and that the traditional coarse-grained method will shorten the timing length, a new tool for measuring the complexity of timing signals, IMFWPE, is proposed by introducing an improved multiscale method. Finally, the IMFWPE values of signals are extracted as features and input to the classifier for fault identification of hydroelectric units. The experimental results show that the proposed method has the best diagnostic effect when compared with other methods, has good noise immunity and stability, and has good diagnostic capability in the actual unit environment.

1. Introduction

As an important core component of hydroelectric energy conversion, the safety and stability of the hydroelectric unit operation process is crucial. Unit vibration is the main cause of faults, and relevant studies show that about 80% of hydroelectric unit faults are reflected in the unit vibration signal [1]. Therefore, fault identification by extracting unit vibration signal features is the most commonly used fault diagnosis method for hydroelectric units.
During the operation of hydroelectric units, it is subject to the combined effect of mechanical, hydraulic, and electromagnetic factors. Therefore, the vibration signal of the unit is nonlinear, nonstationary, and contains a certain amount of noise interference. Entropy is an important tool to measure the complexity of time series. Entropy theories such as Shannon entropy (ShanEn) [2,3], approximate entropy (ApEn) [4,5,6], sample entropy (SE) [7,8,9], permutation entropy (PE) [10,11,12,13], slope entropy [14,15], and Tsallis entropy [16,17], etc., have been widely used in the field of fault diagnosis in recent years. Among them, PE has the advantages of theoretical simplicity, fewer input parameters, fast computation, and good noise immunity, when compared with other entropy algorithms [12]. However, PE is often limited by a single scale when analyzing time series, which makes PE ignore or omit potential information related to the target state in the series. For this reason, multiscale permutation entropy (MPE) has been proposed in conjunction with the coarse-graining process [18]. Zhang et al. [19] use MPE to extract features of bearing signals, and inputs them into the support vector machine (SVM) optimized by the seagull optimization algorithm (SOA) for the identification of bearing faults. Zhao et al. [20] obtain multiscale features with high dimensionality by MPE and downscale the features by linear local tangent space alignment (LLTSA), and finally introduce the least-squares support vector machine (LSSVM) for fault identification. Nevertheless, the traditional coarse-graining method makes the time-series length much shorter and reduces the stability of its calculation [21,22], and the defect that PE itself only considers the time-series structure and lacks amplitude information also affects the effectiveness of the MPE algorithm for feature extraction [23,24,25]. In recent years, the applications of fractional order in the fields of image [26], chemistry [27,28], automation [29,30,31,32,33], and signal analysis [34] have gradually increased. Some scholars have tried to combine it with entropy for signal processing and obtained good results. However, how to combine the two methods still remains to be discussed. To address these problems, this paper introduces the idea of fractional order and weighting based on the improved coarse-graining method and proposes improved multiscale fractional-order weighted permutation entropy (IMFWPE).
In summary, the main contributions and innovations of this paper are as follows: First, the fractional-order entropy and weighting ideas are combined with PE to improve its sensitivity in capturing time-series features. Additionally, based on this, a new time-series feature extraction method, IMFWPE, is proposed for the incomprehensiveness of single scale and the instability of the traditional coarse-granulation method; its noise resistance and feature extraction ability are discussed, and IMFWPE is proved to be superior to IMFPE, IMPE, and MSE. Then, the feature extraction method based on IMFWPE is combined with a classifier to propose a new fault diagnosis method for hydroelectric units. Finally, the stability and superiority of the proposed method are verified through rotor failure simulation experiments and comparison with other models.
The remainder of the paper is organized as follows. In Section 2, the basic principles of nonlinear feature extraction methods such as fractional-order entropy, PE, IMPE, and IMFWPE are explained, and the process of IMFWPE-based fault diagnosis is described. In Section 3 the noise immunity and feature extraction capability of IMFWPE are analyzed and the selection of its parameters is discussed. In Section 4, simulation and actual machine experiments are conducted to verify the stability and superiority of the proposed method. Finally, Section 5 concludes the whole paper.

2. IMFWPE-Based Hydroelectric Unit Fault Diagnosis Model

2.1. Fractional-Order Entropy

ShanEn is the basis of most entropies, and most of the definitions of entropy are expanded based on the definition of ShanEn. Yuan [35] et al. combined fractional-order calculus theory and entropy theory to propose a new fractional-order entropy algorithm.
The definition of ShanEn is
E ( P ) = c i = 1 n p i ln p i
where p i represents the probability distribution of a random variable i , and it is often taken to be c = 1 . Rewriting Equation (1) in derivative and limit form according to the definition of the derivative,
E ( P ) = lim t 1 d d t i = 1 n p i t
where d d t ( ) is the first-order derivative.
By the definition of a class of fractional-order derivatives, assume that f ( x ) : R R is a function and α R , then the fractional-order derivative of f ( x ) is
f α ( x ) = D x ( α ) f ( x ) = lim h 0 L ( f α ( x + h ) f α ( x ) ( x + h ) α x α ) = lim h 0 d ( f α ( x + h ) f α ( x ) ) d h d ( ( x + h ) α x α ) d h = f ( x ) f α - 1 ( x ) x α - 1
where D ( α ) ( ) represents the fractional-order derivation process and L ( ) is a L H o ¨ s p i t a l process.
Combining Equation (2) with Equation (3) yields the definition of the new fractional-order entropy,
E α ( P ) = lim t 1 i = 1 n D x ( α ) ( p i t ) = lim t 1 i = 1 n p i α ln ( p i ) ( p i t ) α 1 t α 1 = lim t 1 i = 1 n p i t α ln ( p i ) t α 1 = ( 1 ) α i = 1 n p i α ln ( p i )
where E α ( P ) is the value of fractional-order entropy and α denotes the order of the fractional order in the range of 0 < α 1 .
Considering that when 0 < α 1 , ( 1 ) α may appear as a plural; rewriting E α ( P ) in the form of plural entropy,
E α ( P ) = k 1 i = 1 n p i α l n ( p i ) + i [ k 2 i = 1 n p i α l n ( p i ) ]
where k 1 and k 2 are the real and imaginary parts of ( 1 ) α , respectively, that is, ( 1 ) α = k 1 + i k 2 , k 1 , k 2 R .
In practical applications, the fractional-order entropy value is expressed in the form of a most-valued function,
E α ( P ) = max { k 1 i = 1 n p i α l n ( p i ) , k 2 i = 1 n p i α l n ( p i ) }

2.2. Improved Multiscale Fractional-Order Weighted Permutation Entropy

PE is an entropy metric proposed by Bandt [36] in 2002 for evaluating time-series instability. For a time series { X i } = { x 1 , x 2 , , x L } of length L , the steps to calculate PE are as follows:
A phase space reconstruction is performed on the time series X ,
X t m , l = ( x t , x t + l , , x t + ( m 1 ) l )
where X t m , l represents the reconstruction matrix, l represents the time delay, m represents the embedding dimension, and t is an arbitrary time point with a range of value at t = 1 , 2 , , L ( m 1 ) l .
Rearranging the elements in X t m , l in ascending order of size and noting that the permutation pattern as π d 1 , d 2 , , d m , then
X t ( π d 1 , d 2 , , d m ) = ( x t + ( i 1 1 ) l , x t + ( i 2 1 ) l , , x t + ( i m 1 ) l )
where X t ( π d 1 , d 2 , , d m ) denotes the matrix with the permutation pattern π d 1 , d 2 , , d m , d 1 , d 2 , , d m are the ordinal numbers of the elements in the reconstruction matrix X t m , l . For the case of equal elements, the sorting position is determined by the initial position of the elements in X .
For any m-dimensional reconstruction matrix X t m , l , there are m ! kinds of permutation patterns, and the probability of occurrence of any one permutation pattern can be expressed as
P ( π d 1 , d 2 , , d m ) = N ( π d 1 , d 2 , , d m ) L ( m 1 ) l
where P ( π d 1 , d 2 , , d m ) represents the probability that the permutation pattern is π d 1 , d 2 , , d m and N ( ) denotes the number of occurrences of the corresponding permutation pattern.
The PE of the time series { X i } = { x 1 , x 2 , , x L } is
P E ( X ) = π = 1 m ! P ( π d 1 , d 2 , , d m ) ln P ( π d 1 , d 2 , , d m )
Entropy analysis from only a single scale will ignore part of the feature information of the original time-series signal. Costa et al. proposed the concept of multiscale entropy (MSE) in 2007 [37,38] to achieve the extraction of signal features from different time scales by coarse-graining the time-series signal. The coarse-graining process is as follows.
For a time series { X i } = { x 1 , x 2 , , x L } of length L , a nonoverlapped sliding with a window of length τ , and taking the average of the data within the window as the time series at that scale,
y j ( τ ) = 1 τ i = τ ( j 1 ) + 1 τ j x i
where τ is the scale factor and y j ( τ ) denotes the new time series obtained after the coarse-graining process when the scale factor is τ , 1 j n τ .
However, this coarse-graining method makes the time-series length much shorter as the scale factor τ increases, and the too-short sequence reduces the stability of entropy calculation and affects the effect of feature extraction. An improved coarse-graining method has been proposed for solving the problem of time-series length reduction [21]. Taking τ = 3 as an example, the process is shown in Figure 1.
The new improved time-series expression is
z i ( τ ) = { y i , 1 ( τ ) , y i , 2 ( τ ) , y i , 3 ( τ ) , }
where y i , j ( τ ) represents the new time-series element obtained according to the improved method, and y i , j ( τ ) = 1 τ f = 0 τ 1 x f + i + τ ( i 1 ) , i = 1 , 2 , , τ . As a result, the improved multiscale permutation entropy (IMPE) can be expressed as
I M P E ( x , τ , m ) = 1 τ i = 1 τ P E ( z i ( τ ) )
Considering that IMPE only considers the timing structure and ignores the signal amplitude information, a novel IMFWPE is proposed. The specific calculation steps are as follows:
(1)
For a time series { X i } = { x 1 , x 2 , , x L } of length L , a new time series z i ( τ ) = { y i , 1 ( τ ) , y i , 2 ( τ ) , y i , 3 ( τ ) , } is obtained by the improved coarse-graining method at the scale factor τ .
(2)
The variance of adjacent elements in the time series z i ( τ ) is calculated so that the weight ω i , t ( τ ) can be defined as
ω i , t ( τ ) = 1 m k = 1 m [ y i , t + ( k 1 ) τ Y ¯ i , t m , τ ]
where Y ¯ i , t m , τ is the average value of all elements in the corresponding time series, Y ¯ i , t m , τ = 1 m k = 1 m y i , t + ( k 1 ) τ .
(3)
According to the set time delay l and embedding dimension m , the time series in z i ( τ ) | ( i = 1 , 2 , , τ ) corresponding to each scale factor τ are reconstructed and ordered in phase space, respectively, then the probability of any of the permutation patterns after weighting can be expressed as,
P i ( τ ) ( π d ) = c : the   arrangement   pattern   of   X t m , l   is   the   number   of   π d ω i , c ( τ ) c : number   of   all   alignment   patterns ω i , c ( τ )
Calculate their average value as the probability of any of the permutation patterns weighted with a scale factor is τ ,
P ¯ i ( τ ) ( π d ) = 1 τ i = 1 τ P i ( τ ) ( π d )
(4)
According to the fractional-order entropy definition, IMFWPE can be defined as
I M F W P E ( X , m , l , τ , α ) = max { k 1 P ¯ i ( τ ) α ( π d ) ln P ¯ i ( τ ) ( π d ) , k 2 P ¯ i ( τ ) α ( π d ) ln P ¯ i ( τ ) ( π d ) }

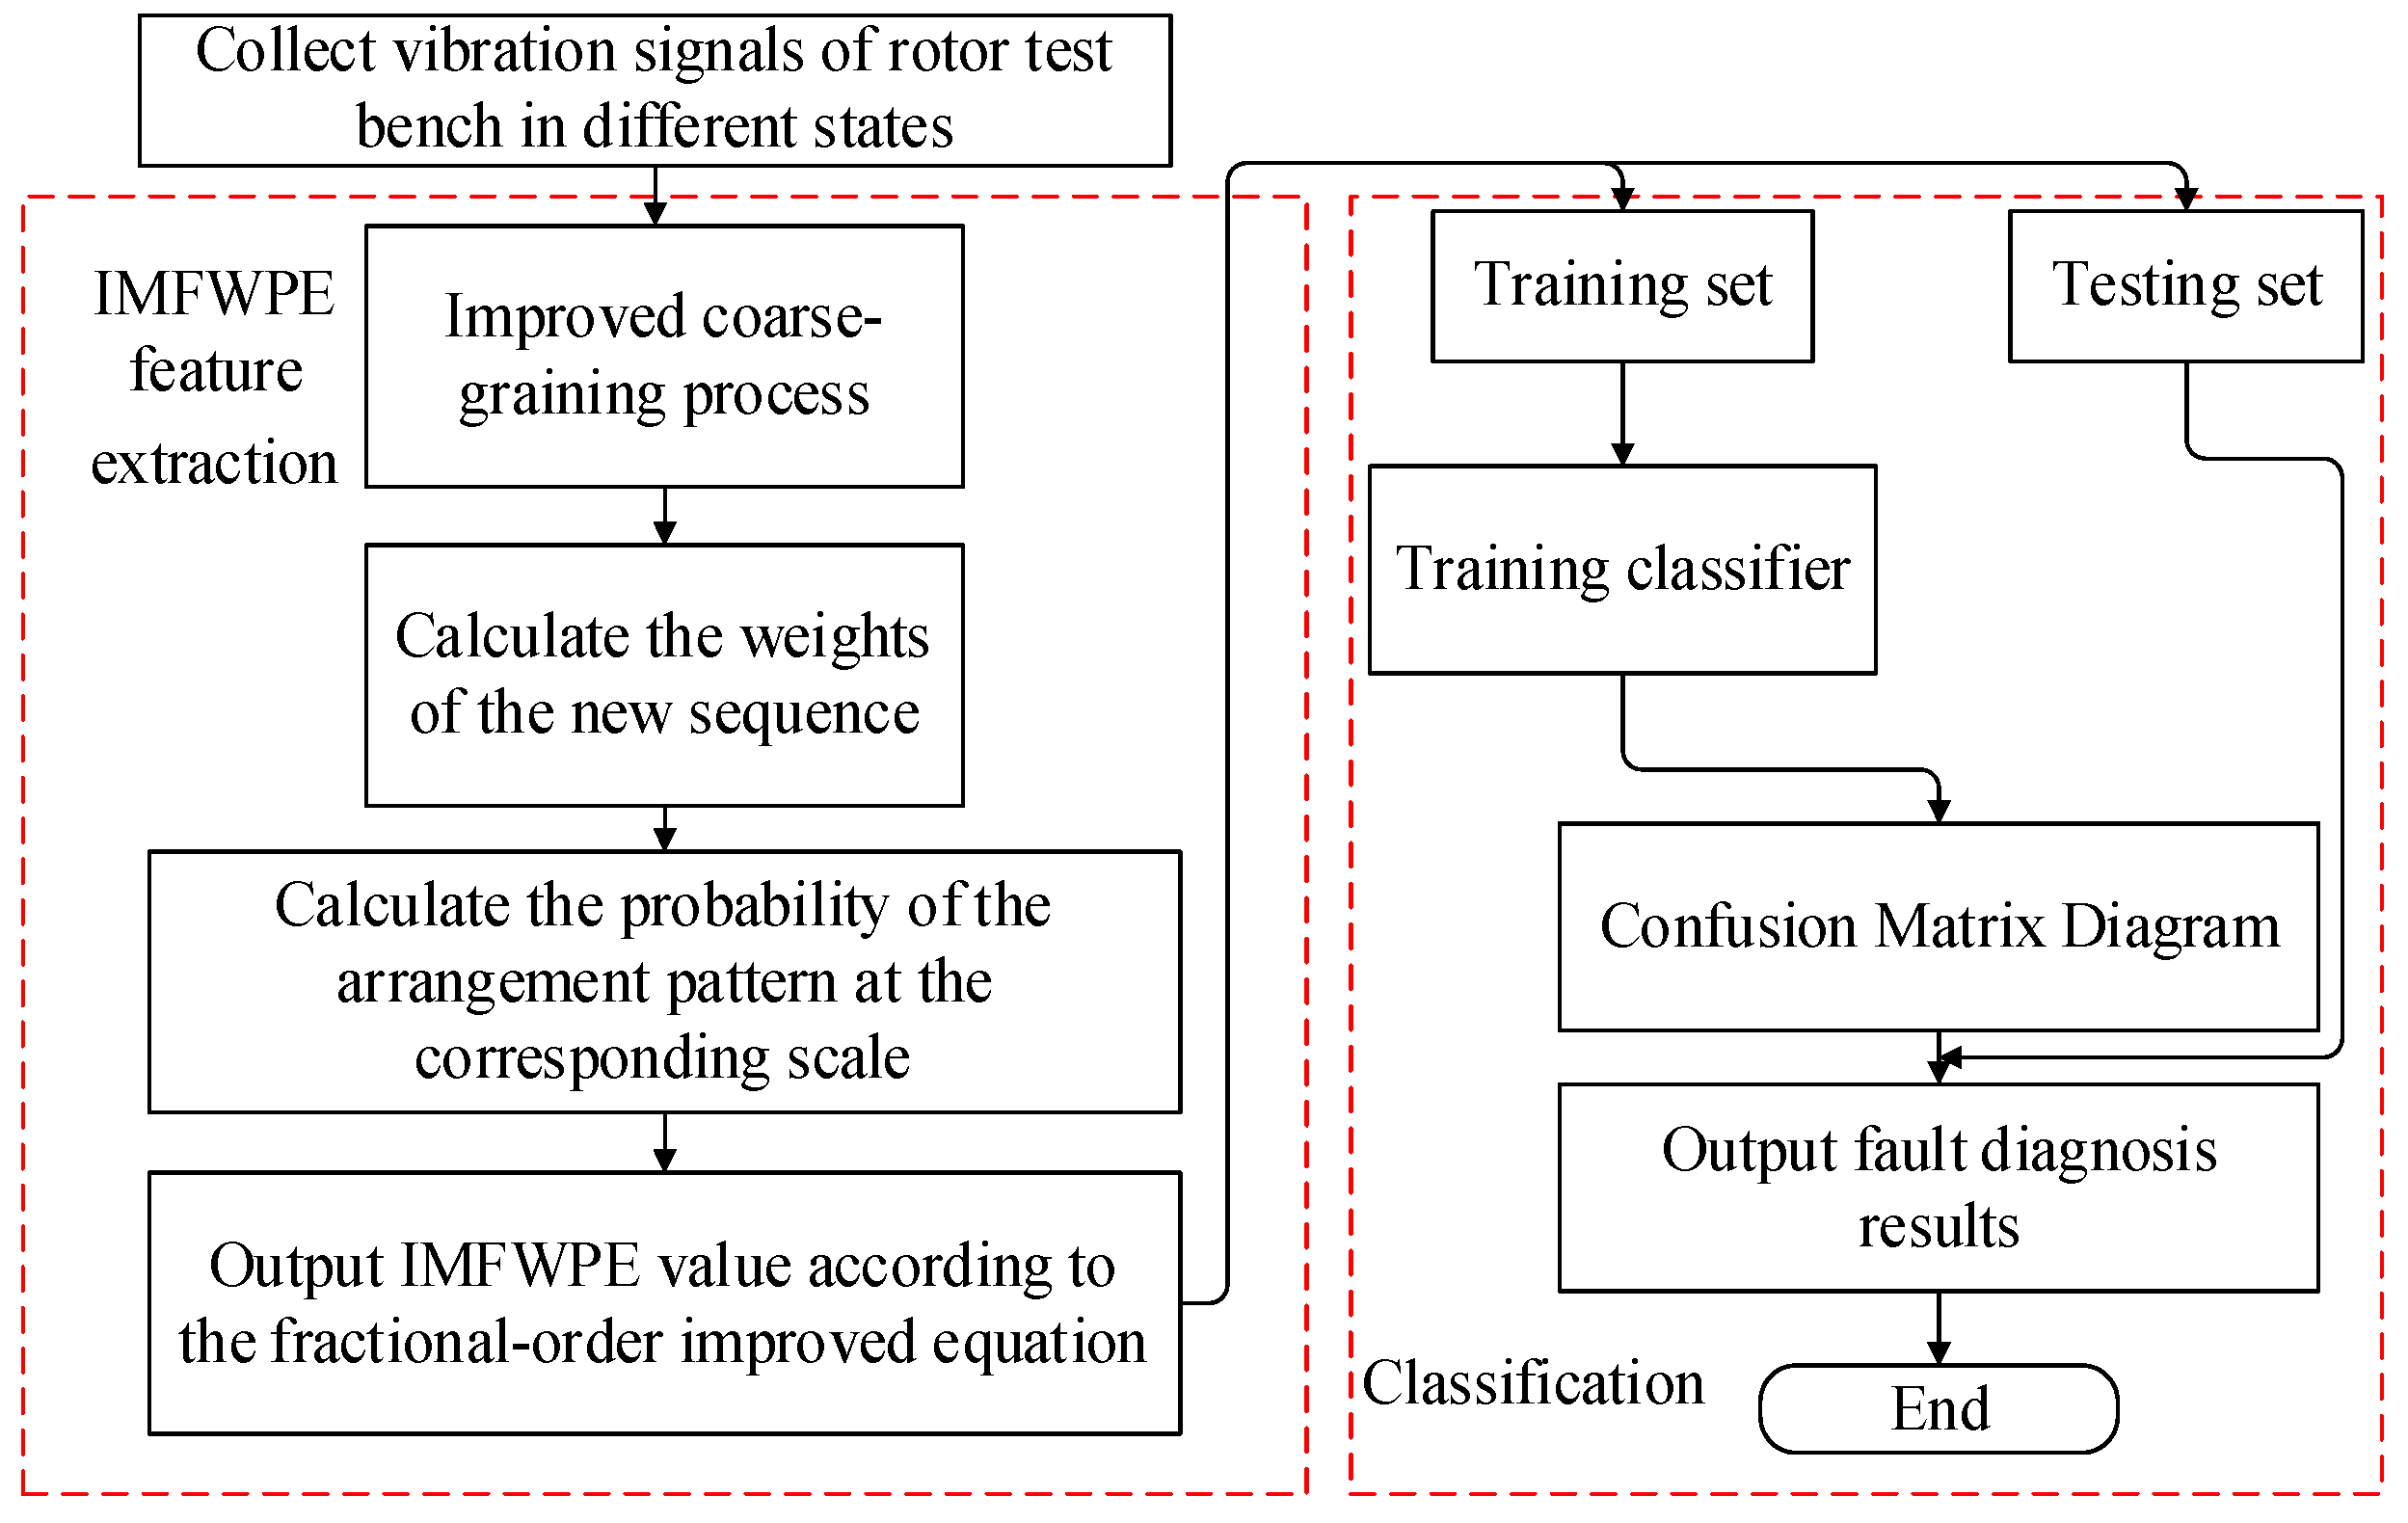
2.3. Flow of the Fault Diagnosis Method Based on IMFWPE

In this paper, we propose a new fault diagnosis method for hydroelectric units based on IMFWPE, and its main process is as follows:
(1)
Data acquisition: Use sensors to collect the vibration data of the rotor test bench in different states, and take N sets of vibration signals of length L as samples.
(2)
Feature extraction: The sample signals are processed using the improved coarse-grain process, weights of the new sequences and the probabilities under the corresponding permutation patterns are calculated, and finally the IMFWPE values are obtained as the feature sample set by Equation (17).
(3)
Fault identification: The training set and testing set are divided from the feature sample set in a certain ratio, and the training set is input to the classifier for training to construct a fault classifier. The testing set is then input to the trained classifier for fault diagnosis, results are visualized with confusion matrix graphs, and the fault identification is finally completed.
The flow chart of the proposed algorithm is shown in Figure 2.

3. IMFWPE Performance Analysis and Parameter Determination

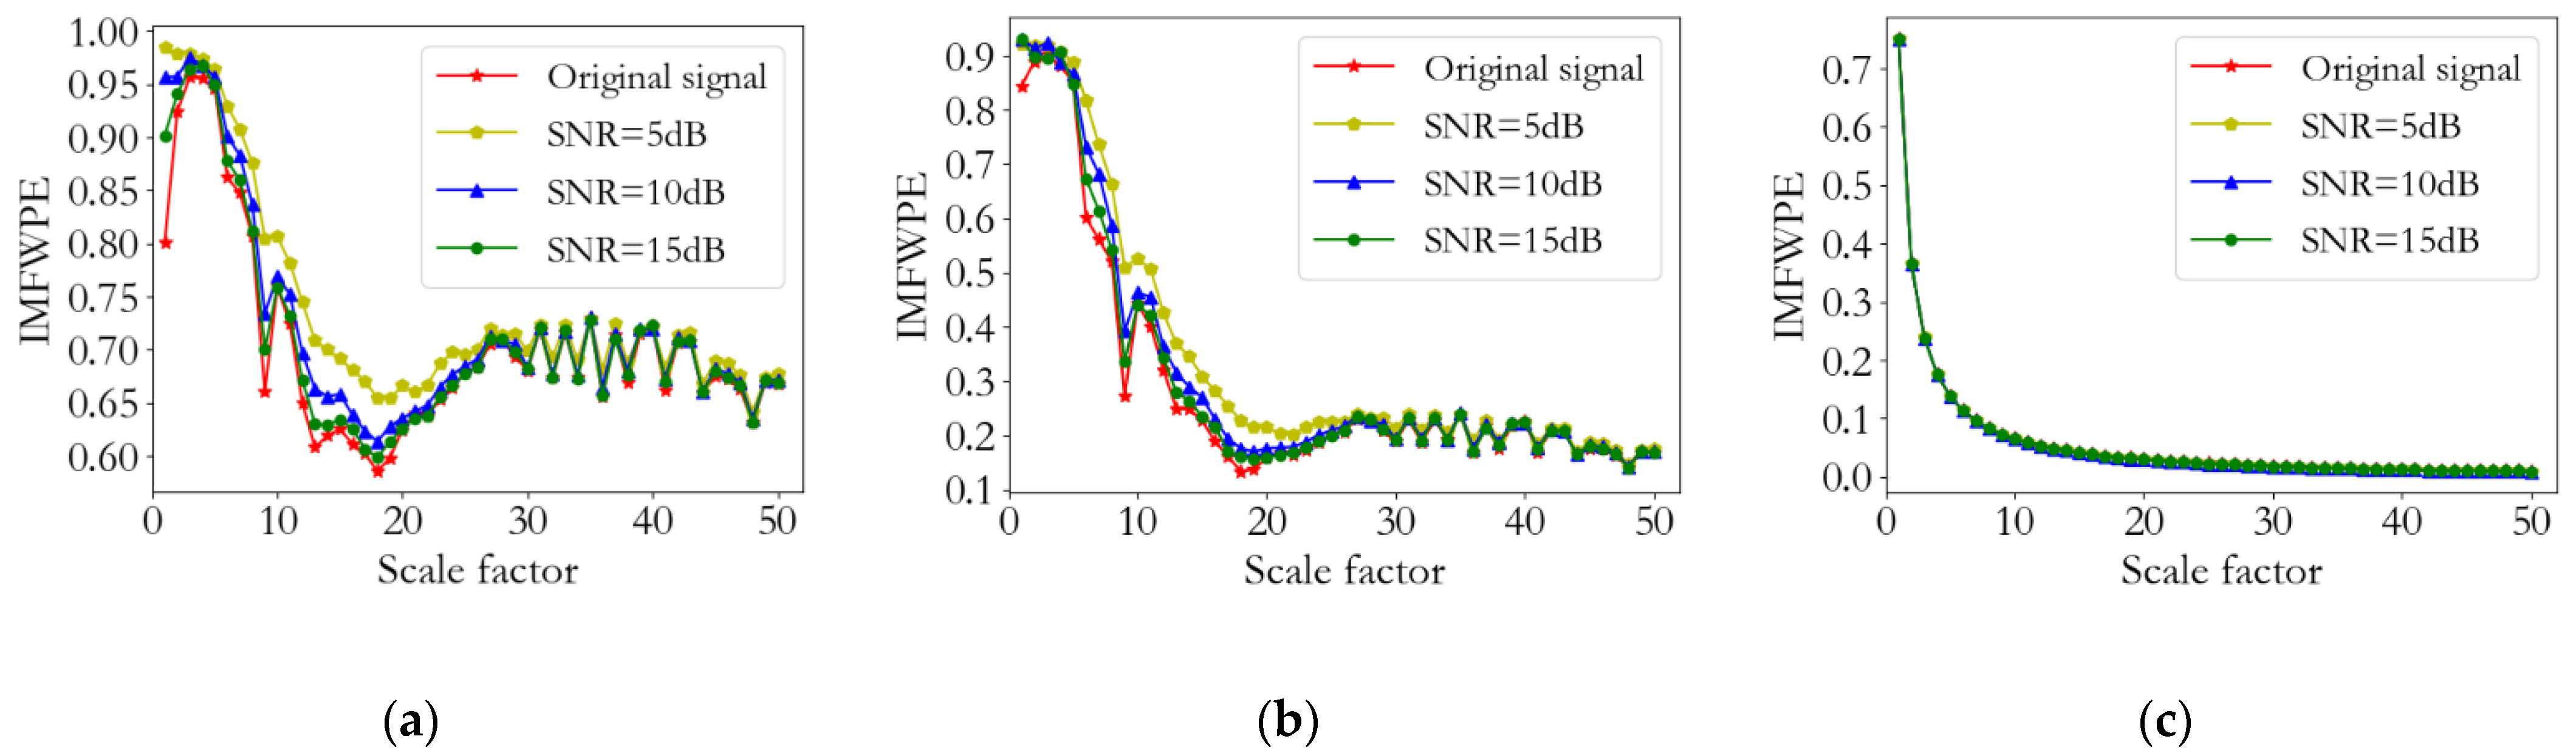
3.1. IMFWPE Noise Immunity Analysis

Owing to the complex operating environment and variable operating conditions of hydroelectric units, the vibration signals of the units often contain certain noise, and the extraction results of fault signal features are easily disturbed. Therefore, the feature extraction tool is required to have good noise immunity in hydroelectric unit fault diagnosis. The paper simulates the noise-containing signal in the low-frequency vortex band-induced vibration fault condition of the tail pipe of a hydroelectric unit, represented by Equation (18).
h ( t ) = 0.39 sin ( π t ) + 0.21 sin ( 4.2 π t ) + 0.1 sin ( 33.4 π t ) + 0.11 sin ( 58.4 π t ) + 0.13 sin ( 100 π t ) + 0.06 sin ( 200 π t )
where h ( t ) denotes the vibration fault signal of the hydropower unit containing noise; z ( t ) denotes Gaussian white noise, which is taken herein as 15, 10, and 5 dB. The vibration waveforms of the noise-stained signal and the unstained signal are shown in Figure 3, which shows that some fault features are covered by the noisy signal, making it difficult to extract fault information.
As shown in Figure 4, the distributions of IMFWPE, IMFPE, and IMPE are analyzed for different noise environments (SNR of 15, 10, and 5 dB). The correlation coefficients of the signals before and after adding noise are calculated to quantify the noise immunity of the feature extraction tool, and the results are shown in Table 1. At SNR = 15 dB and SNR = 10 dB, the correlation coefficients of IMFWPE and IMFPE both remain above 99%, while the correlation coefficient of IMPE decreases with the decrease in SNR; at SNR = 5 dB, the correlation coefficients of IMFPE and IMPE have different degrees of decrease, while IMFWPE can still remain at 99%, which indicates that IMFWPE has stronger noise immunity. In addition, comparing the IMPE and IMFPE algorithms, it is found that the entropy curve becomes smoother and less volatile after adding the fractional order, and the noise immunity of the algorithm is significantly improved.

3.2. Feature Extraction Capability of IMFWPE

Liu et al. [39] used the rotor failure test bench to simulate the vibration signals of a hydroelectric unit in four states: normal, rubbing, misalignment, and unbalance, with a sampling frequency of 2048 Hz and 225 sets of vibration signals in each category, giving a total of 900 sets of vibration signals. White noise with three different SNRs, 15, 10, and 5 dB, is added to these data, as shown in Figure 5.
To explore the feature extraction capability of IMFWPE, the t-distributed neighbor embedding (T-SNE) algorithm is used to reduce the high-dimensional features of signals extracted from different fault types to 2D for visualization. Meanwhile, IMFPE, IMPE and MSE are introduced for comparison.
From Figure 6, the IMFWPE algorithm can effectively distinguish the different kinds of fault signals for the unit vibration signals without noise. As a comparison, the IMFPE and IMPE algorithms show partial overlap of features extracted from normal and misaligned signals, and the MSE algorithm shows more overlap of features extracted from unbalanced and misaligned signals. It can be seen that the IMFWPE algorithm has good feature extraction capability in the absence of noise.
To further fit the vibration signal with noise in the operating environment of the hydroelectric units, white noise with SNR of 15, 10, and 5 dB was added to the signal. With the increase in noise, the mixing of the extracted different state signal feature distributions gradually becomes serious. Owing to the limitation of space, only the characteristic distributions of various types of multiscale-entropy-extracted unit vibration signals under 5 dB noise are analyzed. From Figure 6, only a very small amount of misaligned and unbalanced signal features appears mixed in IMFWPE, while the IMFPE and IMPE algorithms show partial mixing of features extracted from normal and misaligned signals. Additionally, MSE shows more mixing of misaligned and unbalanced signals and normal signal features. This shows that the IMFWPE algorithm still has good feature extraction capability in a high-noise environment.

3.3. Parameter Selection in IMFWPE

In the IMFWPE, the parameters to be determined include the embedding dimension m , the time delay l , the scale factor τ , and the fractional order f . For the embedding dimension m , the values generally range from 3 to 7. When the value of m is too large, the reconstruction of the phase space homogenize the time series, making the computational process more complex and easier to ignore the subtle changes in the sequence; in contrast, when the embedding dimension m is too small ( m = 1 , 2 ), the number of reconstruction components is too small and it is difficult to accurately detect the kinetic mutations of the signal [13]. In this paper, the embedding dimension is taken as m = 5 . The value of time delay l has little effect on the result of entropy calculation and is taken as l = 1 . There is generally no restriction on the value of the scale factor, which is generally taken to be τ 10 [20], and in this paper, τ = 30 .
As one of the important parameters in IMFWPE, the optimal value of fractional order f should meet the requirement of making a large distinction between different types of unit fault vibration signal characteristics for subsequent fault diagnosis. To determine the optimal value of f , the IMFWPE values of the four types of 225 group unit signals were calculated and error maps plotted on the interval [ 0.1 , 1 ] with an interval of 0.1 for the search, as shown in Figure 7. When the order is 1, it is obvious that the misalignment signal extracted by the integer order overlaps with the robbing signal; when the order is 0.2, the misalignment signal also overlaps with the normal signal; when the order is 0.1, the different types of unit vibration fault signals can be accurately distinguished. Therefore, the fractional order f = 0.1 was used.

4. Experimental Verification

4.1. Case 1

The test bench consists of an HZXT-008 rotor rolling-bearing comprehensive fault-simulation test bench, which is mainly composed of a motor, bearing housing, coupling, control box, rotor, rolling bearing, three-directional acceleration sensor, data collector, and computer, as shown in Figure 8. By adding unbalanced adjustment parts, mass blocks, and rubbing parts, vibration signals are simulated for hydroelectric units in four different states: normal, unbalance, misalignment, and rubbing. The sampling frequency is 2000 Hz, and a total of 600 groups of sample data are collected. A single sample contains 2048 sampling points. The vibration signals in different states are shown in Figure 9.
We divided the collected vibration signal sample data into training and test sets proportionally, which were input into the IMFWPE-based fault diagnosis model for fault identification. The final determination results are analyzed by using a confusion matrix, while different classifiers are introduced to compare the results of different models, as shown in Figure 10.
According to Figure 10 and Table 2, it can be seen that the method proposed in the thesis has strong recognition ability for vibration signals in different states, and can make accurate judgments for vibration signals in different states; the fault recognition accuracy rate reaches 100%. The IMFWPE-RF model also has a relatively good performance, with an accuracy of 99.15% and only one case of misclassification of an imbalance fault. The IMFPE-XGBoost model and IMFPE-RF model performed generally with 94.93% and 94.14% fault identification accuracy, respectively, with some misclassification of misaligned faults and normal states, and a small number of misclassification cases of rubbing faults and normal states. The accuracy of the IMPE-XGBoost model is 93.41%, and it cannot carry out accurate identification of the rubbing fault, misalignment fault, or normal state, compared to the worse performance of IMPE-RF model, with an accuracy of 90.84%. The MSE-XGBoost model has problems in distinguishing misalignment faults from normal states, with more cases of misclassification and an accuracy rate of 92.61%; the MSE-RF model showed more misclassifications for misalignment faults and normal states, with a diagnosis rate of 89.07%.
To avoid the overfitting phenomenon and to verify the generalization ability and stability of the models, we use K-fold cross-validation. The number of folds K = 2, 3, 4, 5, 6, 7, 8, and 9 is applied. To reduce the effect of randomized experiments on the results, 30 independent replicate experiments were conducted for each type of model. The mean and standard deviation were calculated, and the results are shown in Figure 11.
As shown in Figure 11, the accuracy of the IMFWPE-XGBoost model was 98.06%, 98.39%, 99.61%, 99.00%, 98.53%, 99.09%, 99.06%, and 99.09% at different folding numbers, respectively, with a mean accuracy of 98.85%. The accuracy of the IMFWPE-RF model at different folds was 98.17%, 98.97%, 98.92%, 99.03%, 98.94%, 98.94%, and 98.84%, with an average accuracy of 98.84%. Compared with the results of other methods, the proposed method in terms of diagnostic accuracy has obvious advantages in diagnostic accuracy. Meanwhile, the standard deviations of the diagnostic rates of the IMFWPE-XGBoost model were 1.01, 0.90, 0.52, 0.67, 0.81, 0.46, 0.57, and 0.51, respectively, with a mean value of 0.68. The IMFWPE-RF model results were 1.58, 0.95, 1.05, 0.96, 0.82, 0.96, 1.11 and 0.96, with a mean value of 1.05. The standard deviations of the other comparison models were generally larger, which can indicate that the proposed method has good stability. In addition, based on the superior performance of IMFWPE-XGBoost and IMFWPE-RF models when compared with other models, it can be verified that IMFWPE is a good tool for data feature extraction.

4.2. Case 2

The analysis and experimental results reported above were obtained in the experimental bench environment, and there is a lack of fault verification for the proposed method in an actual hydroelectric unit operation environment. Therefore, in order to verify the capability of the proposed method for actual unit fault diagnosis, actual machine experiments were conducted. The vibration signal data in this paper were taken from unit 3 of a hydroelectric station, model ZZA315-LJ-800, with a rated power of 200 MW. The inspector found abnormal sound at the upper frame, worm housing, and tail pipe of the unit, and the unit turbine chamber ring steel plate was detached. The vibration data of the unit under normal operation and abnormal condition were exported from the monitoring system, and 80 sets of samples under normal and abnormal conditions were collected. The specific vibration signals are shown in Figure 12.
The vibration signal of the unit is extracted by IMFWPE and its features are visualized by t-SNE, as shown in Figure 13a. It can be clearly seen that the signal features extracted by IMFWPE are completely separated without any overlap, thus proving that the proposed method is effective for the extraction of fault signal features of hydroelectric units. The extracted signal features are input to the classifier for diagnosis, and the results are shown in Figure 13b. It can be seen that the diagnosis rate reaches 100% and there is no misclassification. This shows that the proposed method is still effective in an actual hydroelectric unit environment.

5. Conclusions

By introducing fractional-order entropy and weighting theory, this paper proposes a fault diagnosis method for hydroelectric units based on IMFWPE, and draws the following conclusions through a simulation experiment:
(1)
The fractional-order entropy concept and weighting theory were introduced on the basis of PE. On the basis of improved coarse-graining process, a new tool for measuring the complexity of time-series IMFWPE was proposed. By analyzing the distribution of entropy values of simulated signals with different signal-to-noise ratios and their correlation coefficients, the good noise immunity was verified.
(2)
The feature extraction ability of four multiscale entropies, IMFWPE, IMFPE, IMPE, and MSE, for different types of rotor fault vibration signals under different noises was compared and visualized using the t-SNE algorithm. The results showed that IMFWPE had good feature extraction ability under different noise intensity environments.
(3)
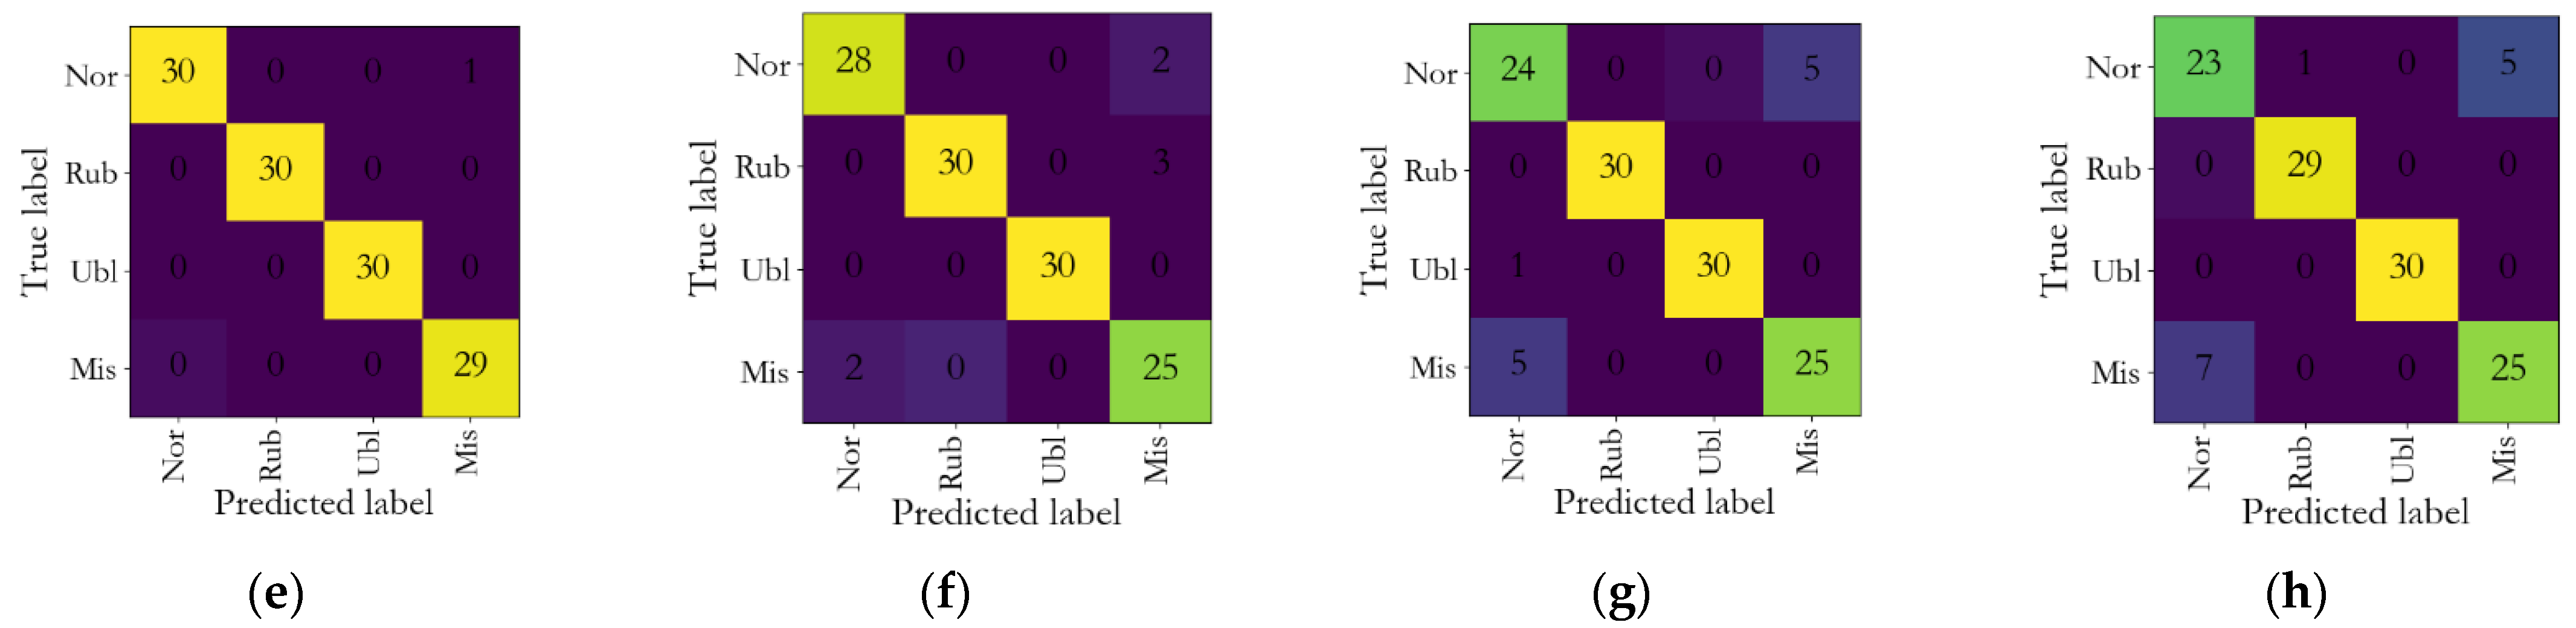
Through the diagnostic analysis of four types of rotor fault signals, the proposed method was combined with RF and XGBoost classifiers, and independent repetitive experiments were conducted using the cross-validation method. The results show that the proposed method has good performance at no less than 98.06% under different folding numbers, and the standard deviation of the proposed method is only 0.68. The proposed method has the best performance among the compared models, which verifies the superiority and stability of the method.
(4)
The proposed method is applied to actual data from hydroelectric units. Its diagnosis rate reaches 100%, which verifies that the method can still achieve good results in an actual hydroelectric unit environment.
The proposed method outperforms other comparisons in terms of accuracy, noise immunity, stability, and sensitivity to features, indicating its good advantages and potential in the field of hydroelectric unit fault diagnosis. In future research, more exploration is required for the treatment of plural forms in the fractional order and permutation entropy incorporation process to uncover additional feature details.

Author Contributions

Conceptualization, W.Z.; methodology, W.Z.; validation, W.Z., Y.G. and S.P.; resources, W.Z.; supervision B.W.; data curation, D.Z.; writing—original draft preparation, W.Z.; writing—review and editing, W.Z. All authors have read and agreed to the published version of the manuscript.

Funding

This research was funded by the scientific research foundation of the Young Scholar Project of Cyrus Tang Foundation, the Shaanxi Province Key Research and Development Plan (Number 2021NY-181), the National Natural Science Foundation of China (Numbers 51909222 and 51509210) and the Chinese Universities Scientific Fund (Number 2452022326).

Institutional Review Board Statement

Not applicable.

Informed Consent Statement

Not applicable.

Data Availability Statement

Not applicable.

Conflicts of Interest

The authors declare no conflict of interest.

References

  1. Liu, D.; Wang, X.; Huang, J.; Zhang, X.; Xiao, Z. Vibration fault diagnosis for hydro-power units based on Bayesian network. J. Hydroelectr. Eng. 2019, 38, 112–120. (In Chinese) [Google Scholar] [CrossRef]
  2. Wang, Z.; Hong, J.; Liu, P.; Zhang, L. Voltage fault diagnosis and prognosis of battery systems based on entropy and Z-score for electric vehicles. Appl. Energy 2016, 196, 289–302. [Google Scholar] [CrossRef]
  3. Gu, D.; Kim, J.; Kelimu, T.; Huh, S.C.; Choi, B.K. Evaluation of the use of envelope analysis and DWT on AE signals generated from degrading shafts. Mater. Sci. Eng. B 2012, 177, 1683–1690. [Google Scholar] [CrossRef]
  4. Shi, Y.; Yi, C.; Lin, J.; Zhuang, Z.; Lai, S. Ensemble empirical mode decomposition-entropy and feature selection for pantograph fault diagnosis. J. Vib. Control. 2020, 26, 107754632091662. [Google Scholar] [CrossRef]
  5. Chen, D.; Mao, C.; Qin, B. Study on transformer fault diagnosis technology of VMD local signal de-noising based on kurtosis-approximate entropy. Diagnostyka 2020, 1, 81–87. [Google Scholar] [CrossRef] [Green Version]
  6. Jiang, W.; Hu, X.; Zhang, P.; Deng, S.; Xiao, Z. Feature extraction of vibration signals of hydroelectric units based on EEMD approximate entropy. J. Hydroelectr. Eng. 2020, 39, 18–27. (In Chinese) [Google Scholar] [CrossRef]
  7. Wu, H.; Zhou, J.; Xie, C.; Zhang, J.; Huang, Y. Two-dimensional time series sample entropy algorithm: Applications to rotor axis orbit feature identification. Mech. Syst. Signal Process. 2021, 147, 107123. [Google Scholar] [CrossRef]
  8. Guo, X.; Shen, Y.; Yang, S. Application of sample entropy and Fractional Fourier transform in the fault diagnosis of rolling bearings. J. Vib. Shock. 2017, 36, 65–69. (In Chinese) [Google Scholar] [CrossRef]
  9. Chen, J.; Zhou, D.; Lyu, C.; Lu, C. An integrated method based on CEEMD-SampEn and the correlation analysis algorithm for the fault diagnosis of a gearbox under different working conditions. Mech. Syst. Signal Process. 2017, 113, 102–111. [Google Scholar] [CrossRef]
  10. Govind, V.; Sumika, C.; Manpreet, S.; Rajesh, K. Bearing defect identification by swarm decomposition considering permutation entropy measure and opposition-based slime mould algorithm. Measurement 2021, 178, 109389. [Google Scholar] [CrossRef]
  11. Khandaker, N.; Wang, D.; Peng, Z.; He, Q. Oscillation based permutation entropy calculation as a dynamic nonlinear feature for health monitoring of rolling element bearing. Measurement 2021, 172, 108891. [Google Scholar] [CrossRef]
  12. Sharma, S.; Tiwari, S.K.; Singh, S. Integrated approach based on flexible analytical wavelet transform and permutation entropy for fault detection in rotary machines. Measurement 2021, 169, 108389. [Google Scholar] [CrossRef]
  13. Zhen, X.; Zhou, G.; Ren, H.; Fu, Y. Fault diagnosis of rolling bearing based on variational mode decomposition and permutation entropy. J. Vib. Shock. 2017, 36, 22–28. (In Chinese) [Google Scholar] [CrossRef]
  14. Li, Y.; Mu, L.; Gao, P. Particle Swarm Optimization Fractional Slope Entropy: A New Time Series Complexity Indicator for Bearing Fault Diagnosis. Fractal Fract. 2022, 6, 345. [Google Scholar] [CrossRef]
  15. Li, Y.; Gao, P.; Tang, B.; Yi, Y.; Zhang, J. Double Feature Extraction Method of Ship-Radiated Noise Signal Based on Slope Entropy and Permutation Entropy. Entropy 2021, 24, 22. [Google Scholar] [CrossRef]
  16. Ibrahim, R.W.; Darus, M. Analytic Study of Complex Fractional Tsallis’ Entropy with Applications in CNNs. Entropy 2018, 20, 722. [Google Scholar] [CrossRef] [Green Version]
  17. Abou Jaoude, A. The paradigm of complex probability and Claude Shannon’s information theory. Syst. Sci. & Control Eng. 2017, 5, 380–425. [Google Scholar] [CrossRef] [Green Version]
  18. Ye, M.; Yan, X.; Jia, M. Rolling bearing fault diagnosis based on VMD-MPE and PSO-SVM. Entropy 2021, 23, 762. [Google Scholar] [CrossRef]
  19. Zhang, X.; Wang, H.; Ren, M.; He, M.; Jin, L. Rolling Bearing Fault Diagnosis Based on Multiscale Permutation Entropy and SOA-SVM. Machines 2022, 10, 485. [Google Scholar] [CrossRef]
  20. Zhao, J.; Ning, J.; Ning, Y.; Chen, C.; Li, Y. Feature extraction of mechanical fault diagnosis based on multiscale arrangement entropy and linear local tangent space arrangement. J. Vib. Shock. 2021, 40, 136–145. (In Chinese) [Google Scholar] [CrossRef]
  21. Azami, H.; Escudero, J. Improved multiscale permutation entropy for biomedical signal analysis: Interpretation and application to electroencephalogram recordings. Biomed. Signal Process. Control. 2016, 23, 28–41. [Google Scholar] [CrossRef] [Green Version]
  22. Chen, Y.; Chen, Y.; Dai, Q. Gear compound fault detection method based on improved multiscale permutation entropy and local mean decomposition. J. Vibroengineering 2021, 23, 1171–1183. [Google Scholar] [CrossRef]
  23. Xue, S.; Tan, J.; Shi, L.; Deng, J. Rope Tension Fault Diagnosis in Hoisting Systems Based on Vibration Signals Using EEMD Improved Permutation Entropy, and PSO-SVM. Entropy 2020, 22, 209. [Google Scholar] [CrossRef] [PubMed] [Green Version]
  24. Li, Z.; Cui, Y.; Li, L.; Chen, R.; Dong, L.; Du, J. Hierarchical Amplitude-Aware Permutation Entropy-Based Fault Feature Extraction Method for Rolling Bearings. Entropy 2022, 24, 310. [Google Scholar] [CrossRef] [PubMed]
  25. Gong, J.; Yang, X.; Feng, K.; Liu, W.; Zhou, F.; Liu, Z. An integrated health condition detection method for rolling bearings using time-shift multi-scale amplitude-aware permutation entropy and uniform phase empirical mode decomposition. Meas. Sci. Technol. 2021, 32, 125103. [Google Scholar] [CrossRef]
  26. Zhang, X.; Dai, L. Image Enhancement Based on Rough Set and Fractional Order Differentiator. Fractal Fract. 2022, 6, 214. [Google Scholar] [CrossRef]
  27. Hu, W.; Tang, R.; Li, C.; Zhou, T.; Chen, K. Fractional order modeling and recognition of nitrogen content level of rubber tree foliage. J. Near Infrared Spectrosc. 2021, 29, 42–52. [Google Scholar] [CrossRef]
  28. Zhao, H.; Gan, S.; Yuan, X.; Hu, L.; Wang, J.; Liu, S. Application of a Fractional Order Differential to the Hyperspectral Inversion of Soil Iron Oxide. Agriculture 2022, 12, 1163. [Google Scholar] [CrossRef]
  29. Zhang, X.; Huang, W. Adaptive Neural Network Sliding Mode Control for Nonlinear Singular Fractional Order Systems with Mismatched Uncertainties. Fractal Fract. 2020, 4, 50. [Google Scholar] [CrossRef]
  30. Zhang, X.; Huang, W.; Wang, Q.-G.; Robust, H. Adaptive Sliding Mode Fault Tolerant Control for T-S Fuzzy Fractional Order Systems With Mismatched Disturbances. IEEE Trans. Circuits Syst. I Regul. Pap. 2021, 68, 1297–1307. [Google Scholar] [CrossRef]
  31. Zhang, X.; Huang, W. Adaptive sliding mode fault tolerant control for interval Type-2 fuzzy singular fractional-order systems. J. Vib. Control. 2022, 28, 465–475. [Google Scholar] [CrossRef]
  32. Zhang, J.; Yang, G. Fault-tolerant output-constrained control of unknown Euler–Lagrange systems with prescribed tracking accuracy. Automatica 2020, 111, 108606. [Google Scholar] [CrossRef]
  33. Li, R.; Zhang, X. Adaptive Sliding Mode Observer Design for a Class of T–S Fuzzy Descriptor Fractional Order Systems. IEEE Trans. Fuzzy Syst. 2020, 28, 1951–1960. [Google Scholar] [CrossRef]
  34. Macias, M.; Sierociuk, D.; Malesza, W. MEMS Accelerometer Noises Analysis Based on Triple Estimation Fractional Order Algorithm. Sensors 2022, 22, 527. [Google Scholar] [CrossRef] [PubMed]
  35. Karci, A. Fractional order entropy: New perspectives. Optik 2016, 127, 9172–9177. [Google Scholar] [CrossRef]
  36. Bandt, C.; Pompe, B. Permutation entropy: A natural complexity measure for time series. Phys. Rev. Letter. 2002, 88, 174102. [Google Scholar] [CrossRef]
  37. Costa, M.; Goldberger, A.L.; Peng, C.K. Multiscale entropy analysis of complex physiologic time series. Phys. Rev. Lett. 2007, 89, 705–708. [Google Scholar] [CrossRef] [Green Version]
  38. Wu, H.; Chen, Y.; Zhang, T.; Wang, Y. Rolling bearing fault diagnosis by improved multiscale amplitude-aware permutation entropy and random forest. Opt. Precis. Eng. 2020, 29, 621–631. (In Chinese) [Google Scholar] [CrossRef]
  39. Liu, D.; Xiao, Z.; Hu, X.; Zhang, C.; Malik, O.P. Feature extraction of rotor fault based on EEMD and curve code. Measurement 2019, 135, 712–724. [Google Scholar] [CrossRef]
Figure 1. Improved coarse-graining process (with τ = 3 ).
Fractalfract 06 00588 g001
Figure 2. IMFWPE–XGBoost fault diagnosis method flow.
Fractalfract 06 00588 g002
Figure 3. Vibration signals with different signal-to-noise ratios: (a) original signal; (b) noisy signal (SNR = 15 dB); (c) noisy signal (SNR = 10 dB); (d) noisy signal (SNR = 5 dB).
Fractalfract 06 00588 g003
Figure 4. Entropy distribution of IMFWPE, IMFPE, and IMPE for different signal-to-noise ratio signals: (a) IMPE entropy distribution; (b) IMFPE entropy distribution; (c) IMFWPE entropy distribution.
Fractalfract 06 00588 g004
Figure 5. Vibration signals with different signal-to-noise ratios: (a) original signal; (b) SNR = 15 dB; (c) SNR = 10 dB; (d) SNR = 5 dB.
Fractalfract 06 00588 g005
Figure 6. Distribution of signal characteristics under different noise: (a) IMFWPE visualization (without adding noise); (b) IMFPE visualization (without adding noise); (c) IMPE visualization (without adding noise); (d) MSE visualization (without adding noise); (e) IMFWPE visualization (SNR = 15 dB); (f) IMFPE visualization (SNR = 15 dB); (g) IMPE visualization (SNR = 15 dB); (h) MSE visualization (SNR = 15 dB); (i) IMFWPE visualization (SNR = 10 dB); (j) IMFPE visualization (SNR = 10 dB); (k) IMPE visualization (SNR = 10 dB); (l) MSE visualization (SNR = 10 dB); (m) IMFWPE visualization (SNR = 5 dB); (n) IMFPE visualization (SNR = 5 dB); (o) IMPE visualization (SNR = 5 dB); (p) MSE visualization (SNR = 5 dB).
Fractalfract 06 00588 g006
Figure 7. IMFWPE entropy values of vibration signals at different orders: (a) entropy distribution of vibration signal at different orders; (b) entropy distribution of 0.1 order signal; (c) entropy distribution of 0.2 order signal; (d) entropy distribution of 1 order signal.
Fractalfract 06 00588 g007
Figure 8. HZXT-008 rotor rolling-bearing comprehensive fault-simulation test bench and the installation of fault components: (a) test bench; (b) unbalance adjustment parts; (c) mass block; (d) rubbing parts.
Fractalfract 06 00588 g008
Figure 9. Vibration signals in different states.
Fractalfract 06 00588 g009
Figure 10. Confusion matrix diagram for different models: (a) IMFWPE-XGBoost; (b) IMFPE-XGBoost; (c) IMPE-XGBoost; (d) MSE-XGBoost; (e) IMFWPE-RF; (f) IMFPE-RF; (g) IMPE-RF; (h) MSE-RF.
Fractalfract 06 00588 g010aFractalfract 06 00588 g010b
Figure 11. Diagnostic rates of different models at different fold numbers: (a) diagnostic rates (mean) for different models at different fold numbers; (b) diagnostic rates (standard deviation) for different models at different fold numbers.
Fractalfract 06 00588 g011aFractalfract 06 00588 g011b
Figure 12. Vibration signals of hydroelectric units.
Fractalfract 06 00588 g012
Figure 13. Actual machine experiment results: (a) visualization results of hydroelectric-unit signal characteristics; (b) diagnosis results for the fault signal from hydroelectric units.
Fractalfract 06 00588 g013
Table 1. Entropy correlation coefficient of vibration signal before and after noise addition.
Correlation CoefficientSNR = 15SNR = 10SNR = 5
IMFWPE99.99%99.99%99.99%
IMFPE99.68%99.17%97.43%
IMPE98.71%96.64%92.54%
Table 2. Fault diagnosis results of different models.
Diagnostic AccuracyIMFWPEIMFPEIMPEMSE
XGBoost100%94.93%93.41%92.61%
RF99.15%94.14%90.84%89.07%
Publisher’s Note: MDPI stays neutral with regard to jurisdictional claims in published maps and institutional affiliations.

