
Effect of Chemical Composition of Fine Aggregate on the Frictional Behavior of Concrete–Soil Interface under Sulfuric Acid Environment

 ,
,  ,
,  ,
,  and
and
Abstract
:1. Introduction
2. Experiment Program
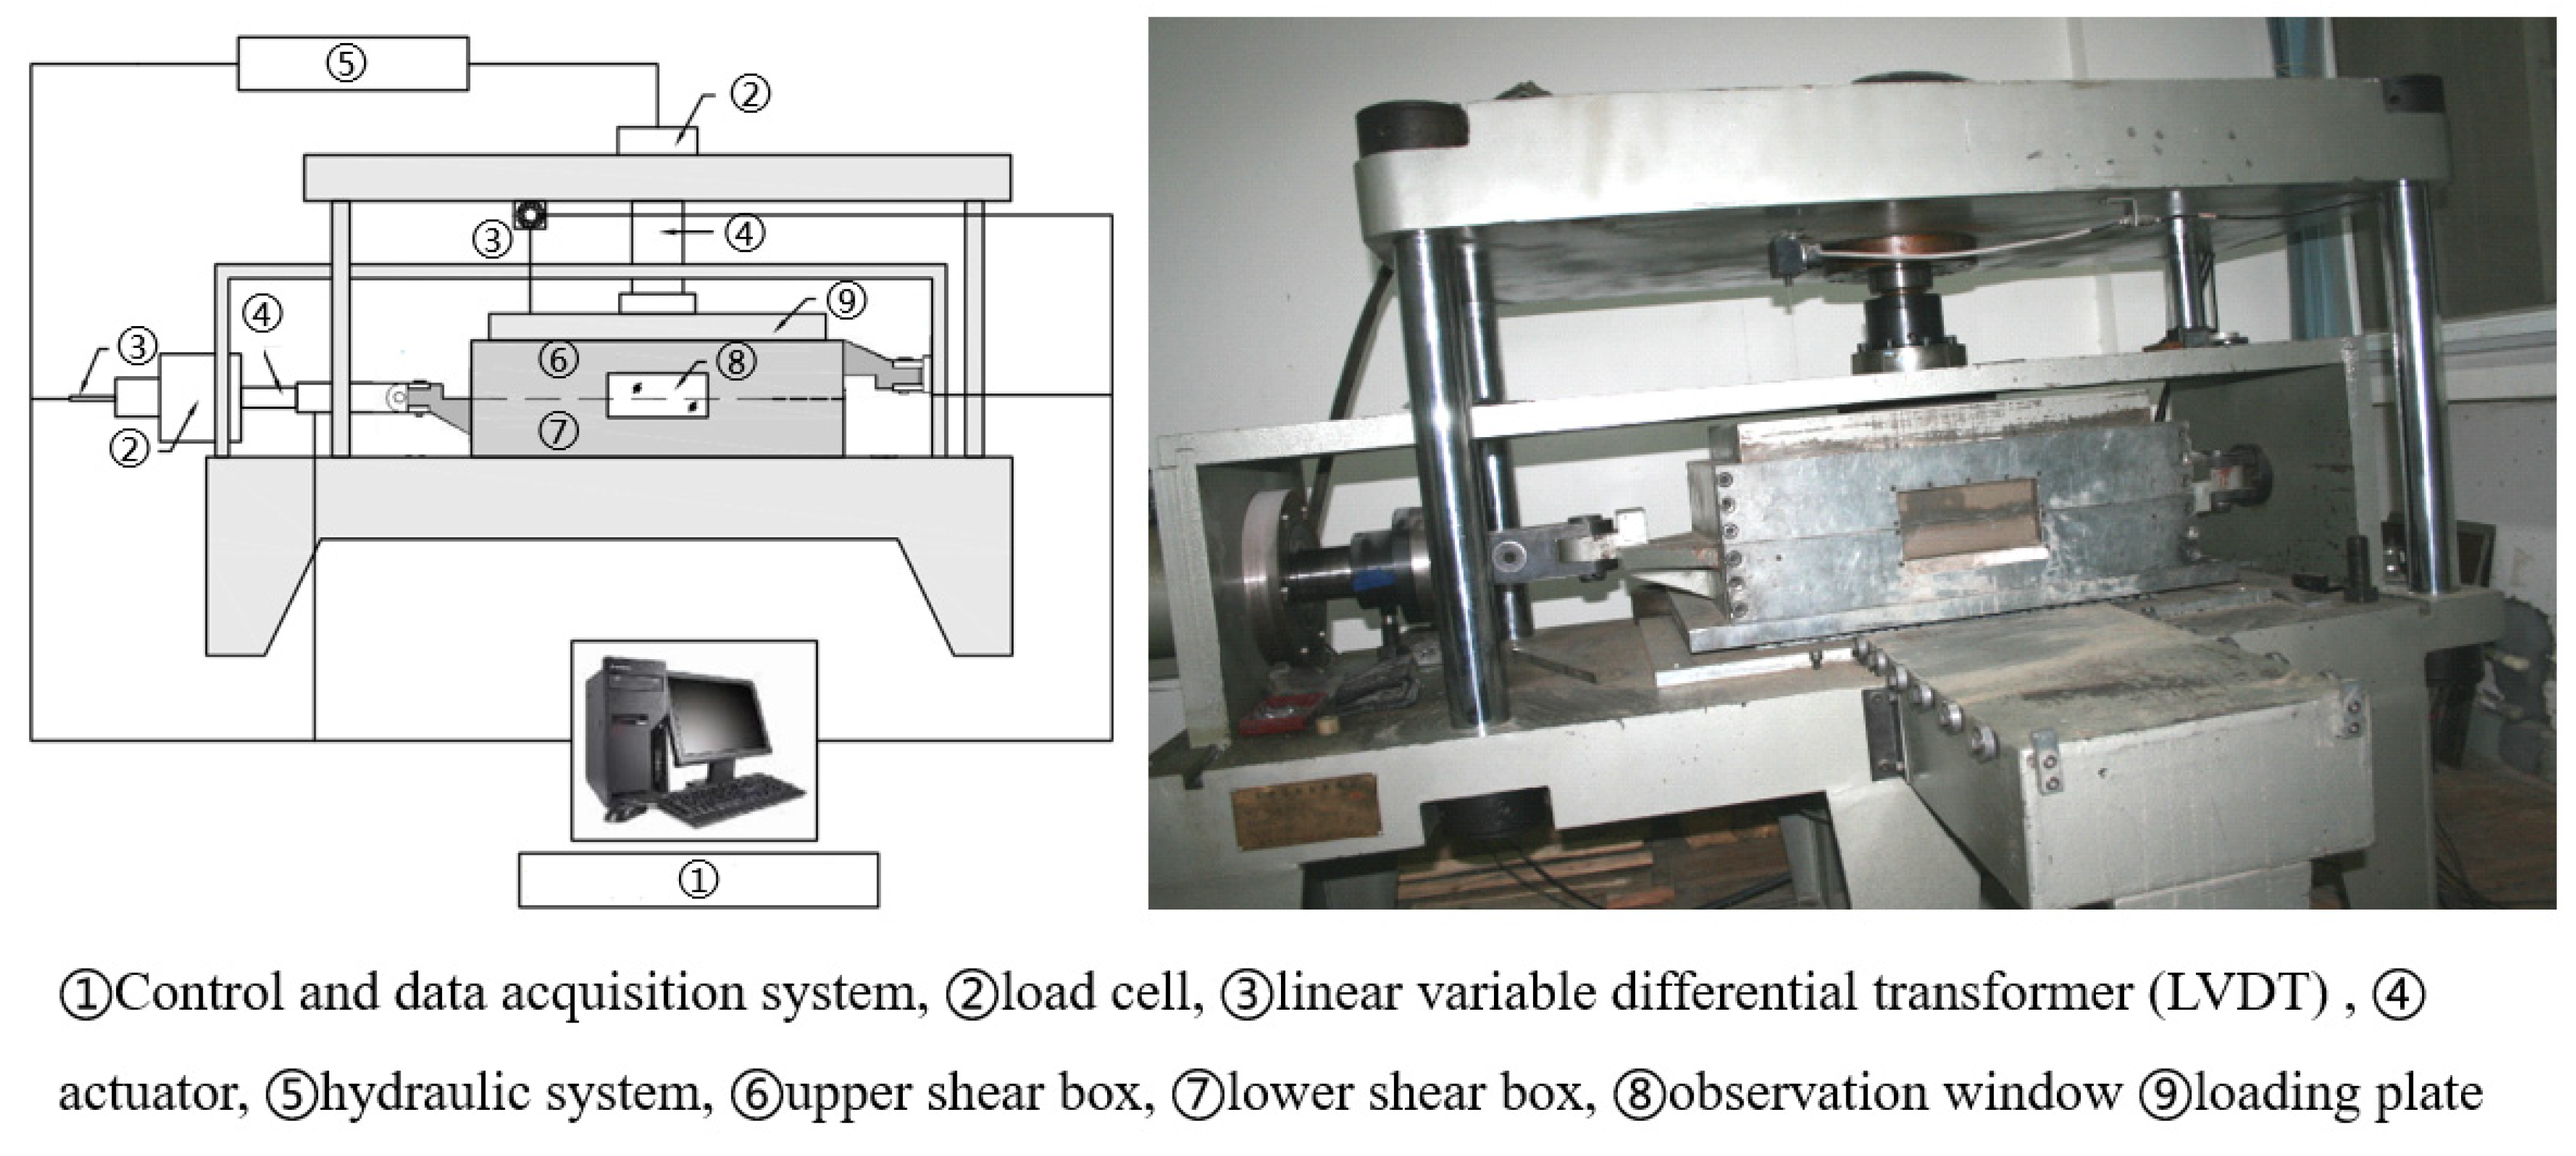
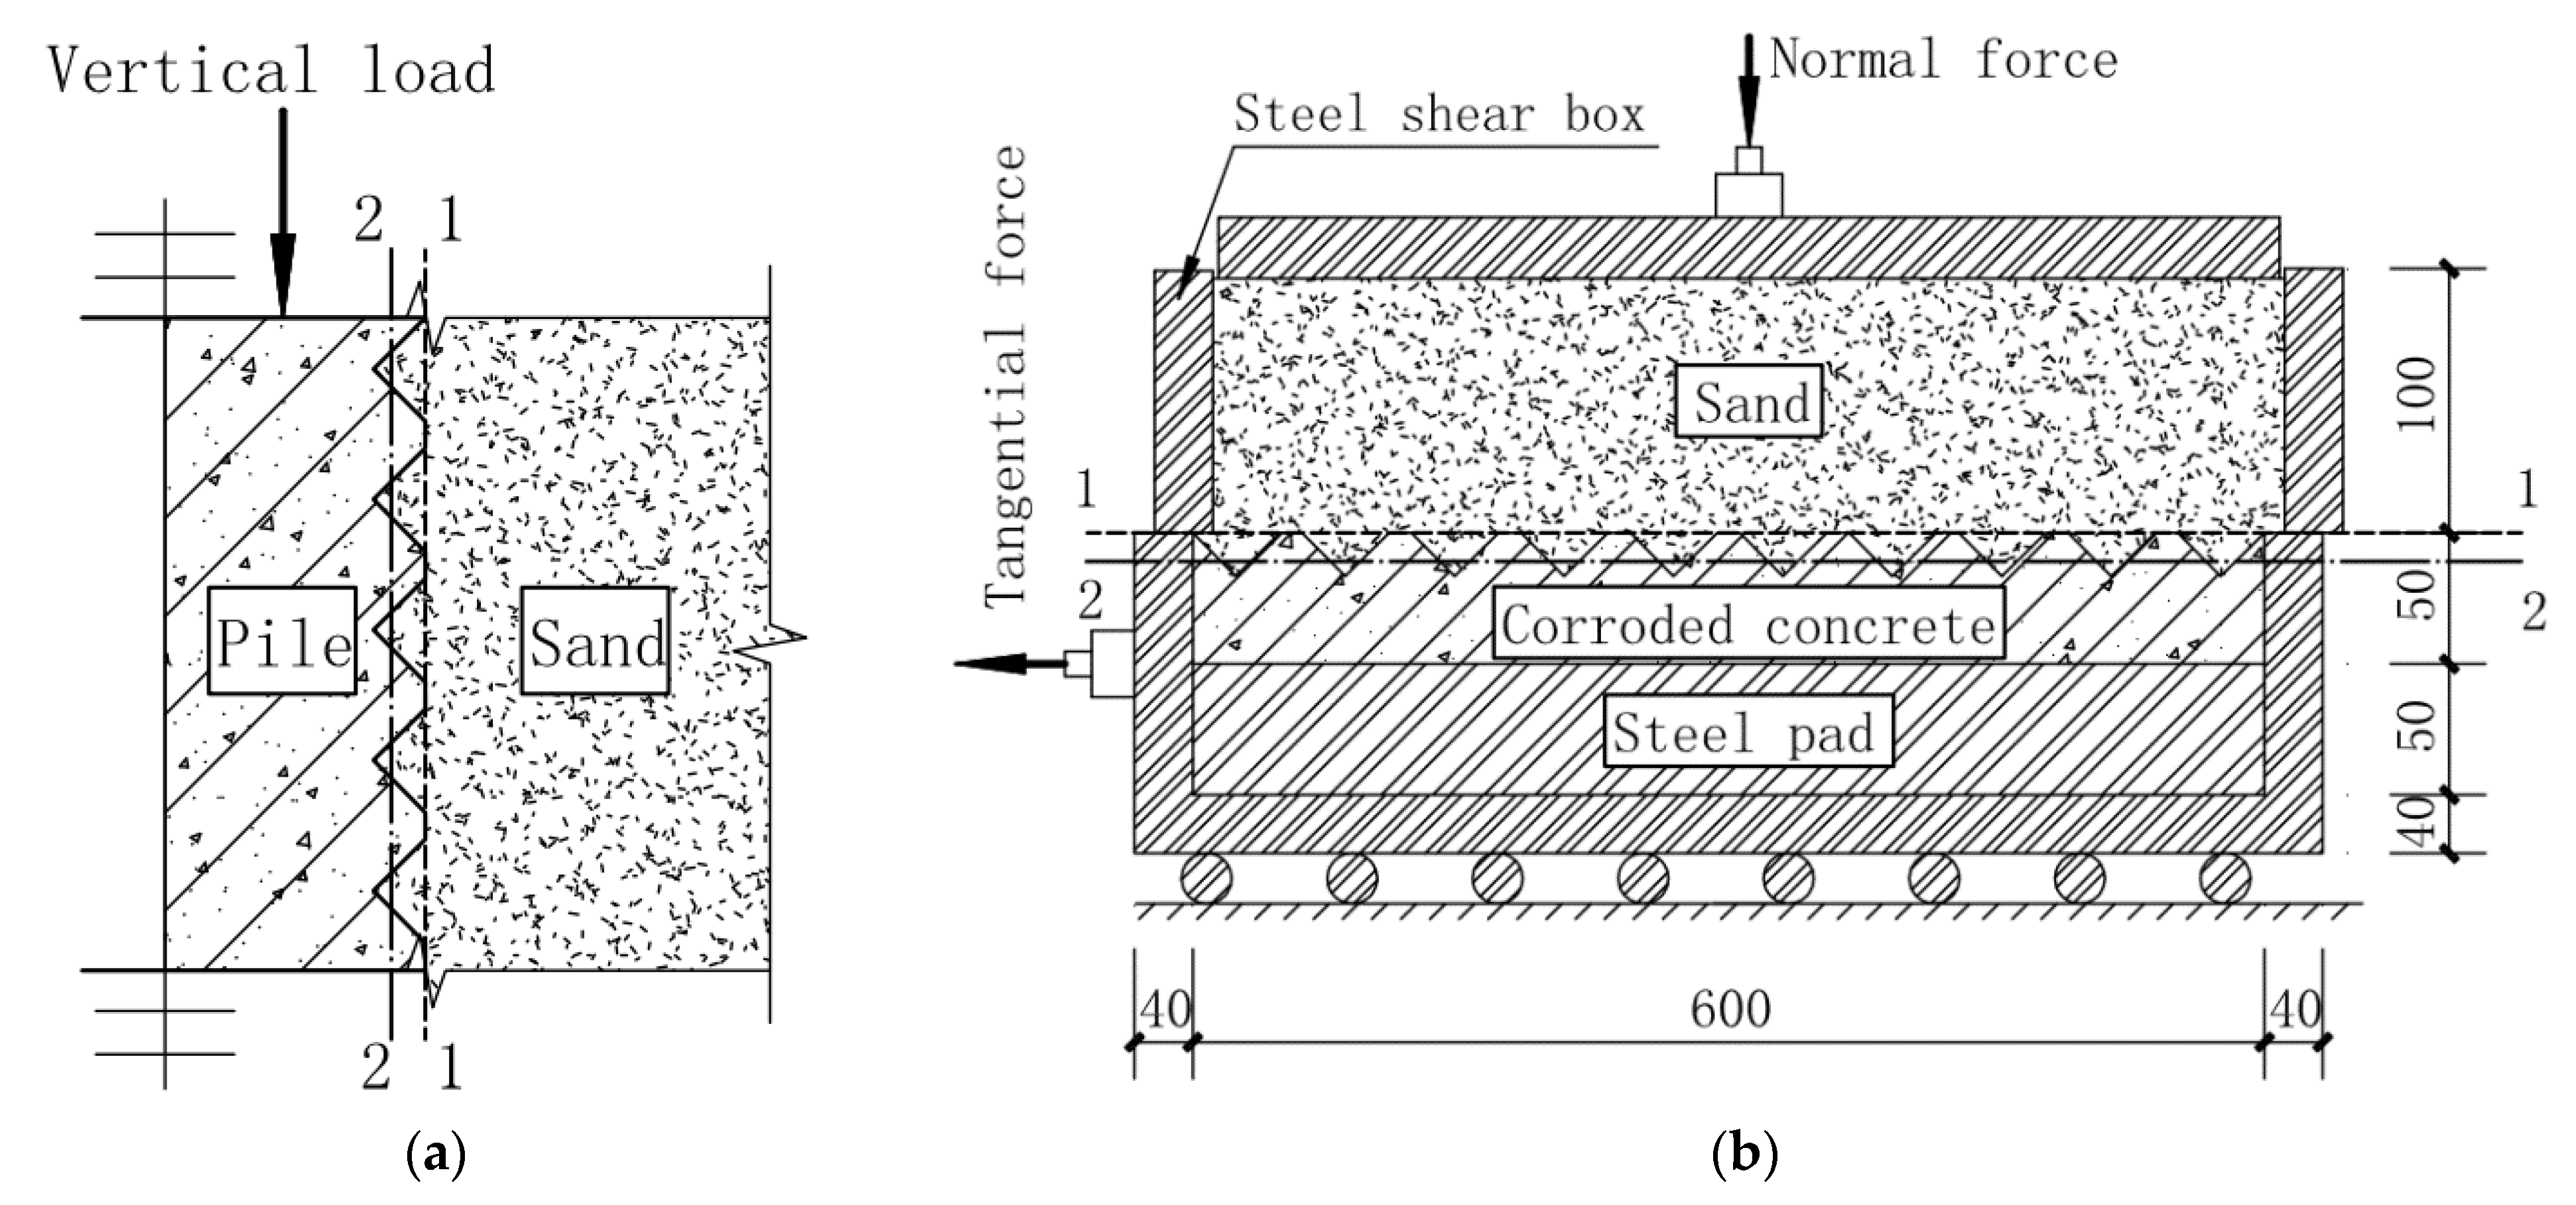
2.1. Large Direct Shear Experiment Equipment
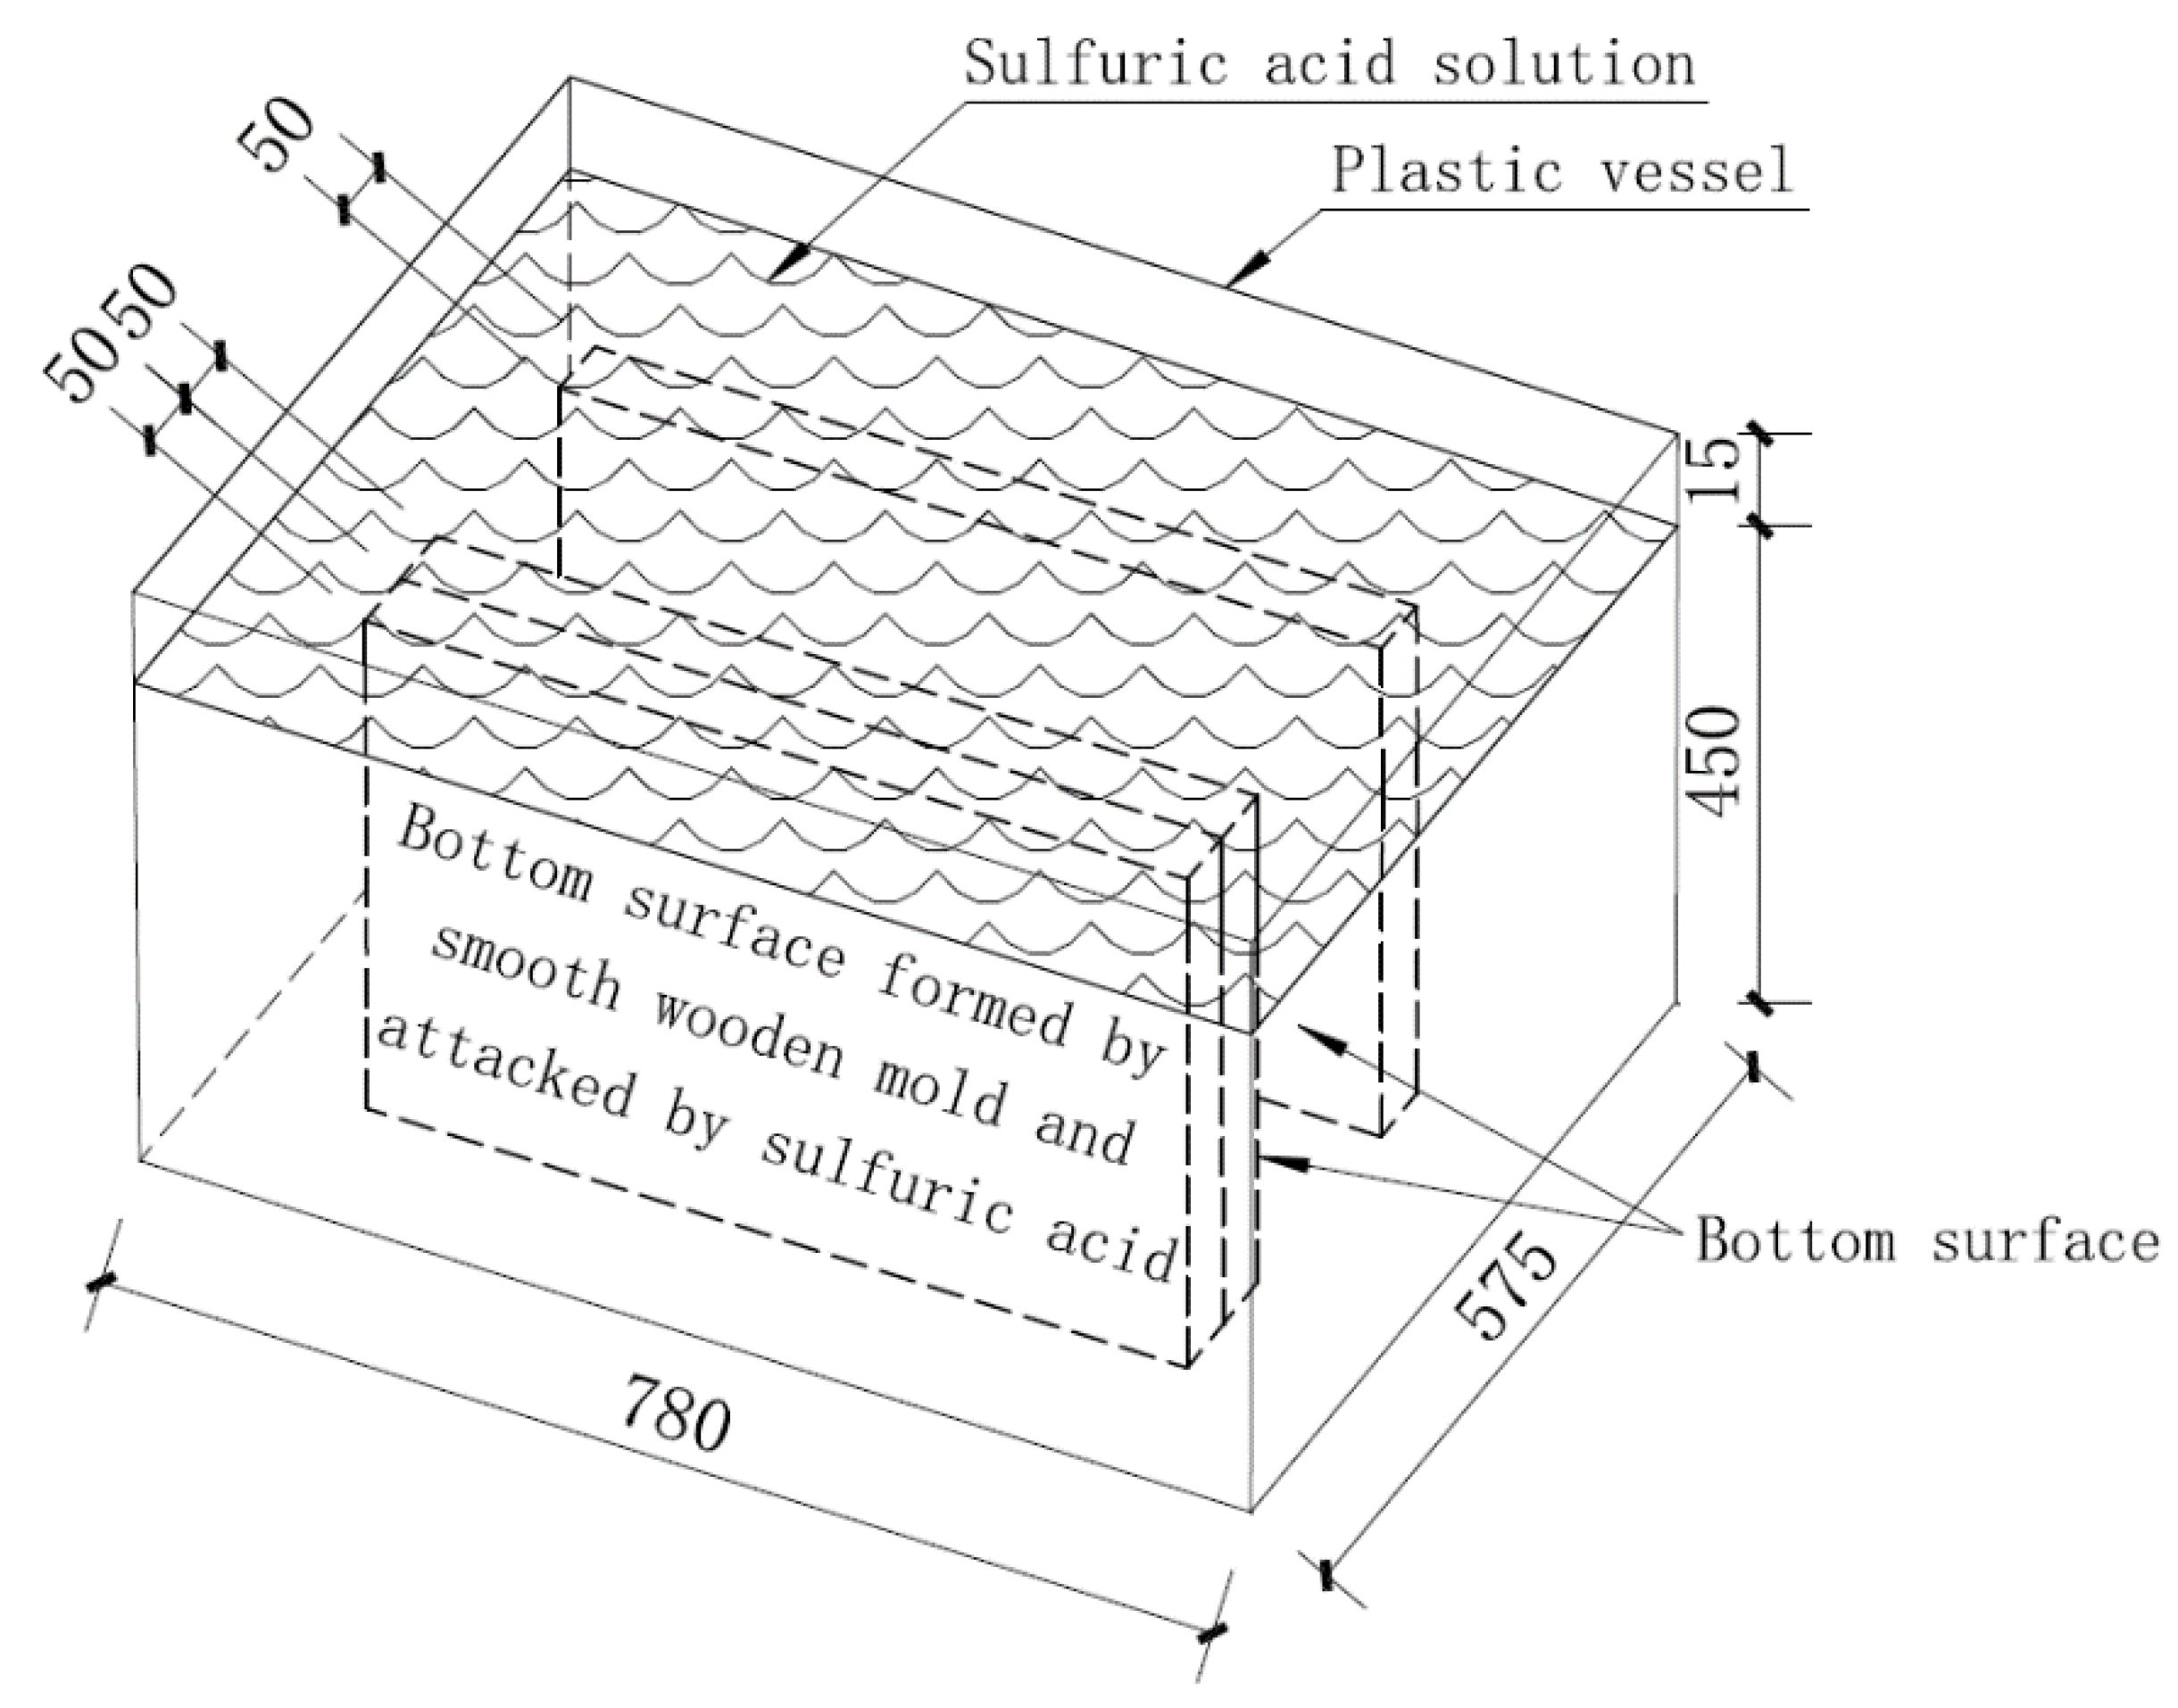
2.2. Concrete Plate
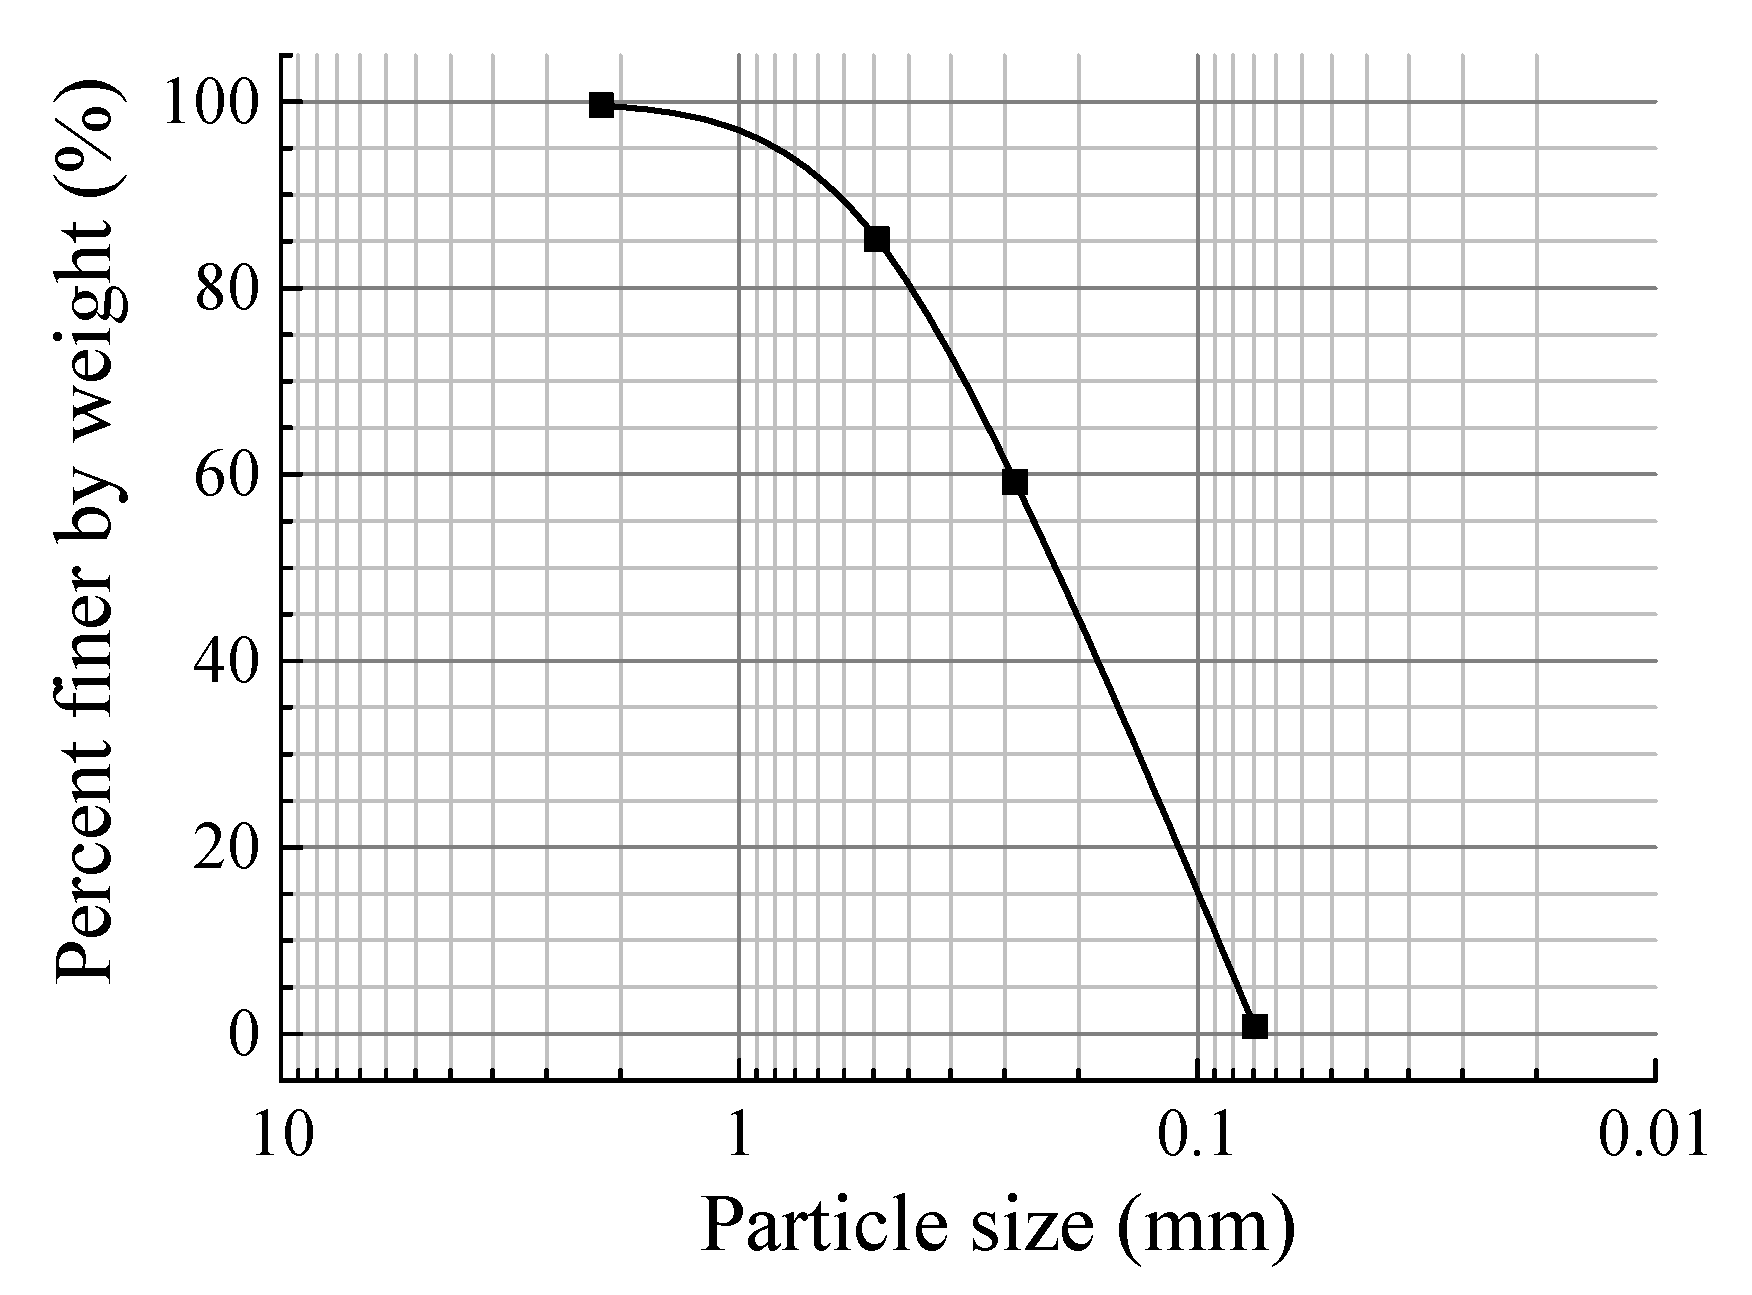
2.3. Soil Sample
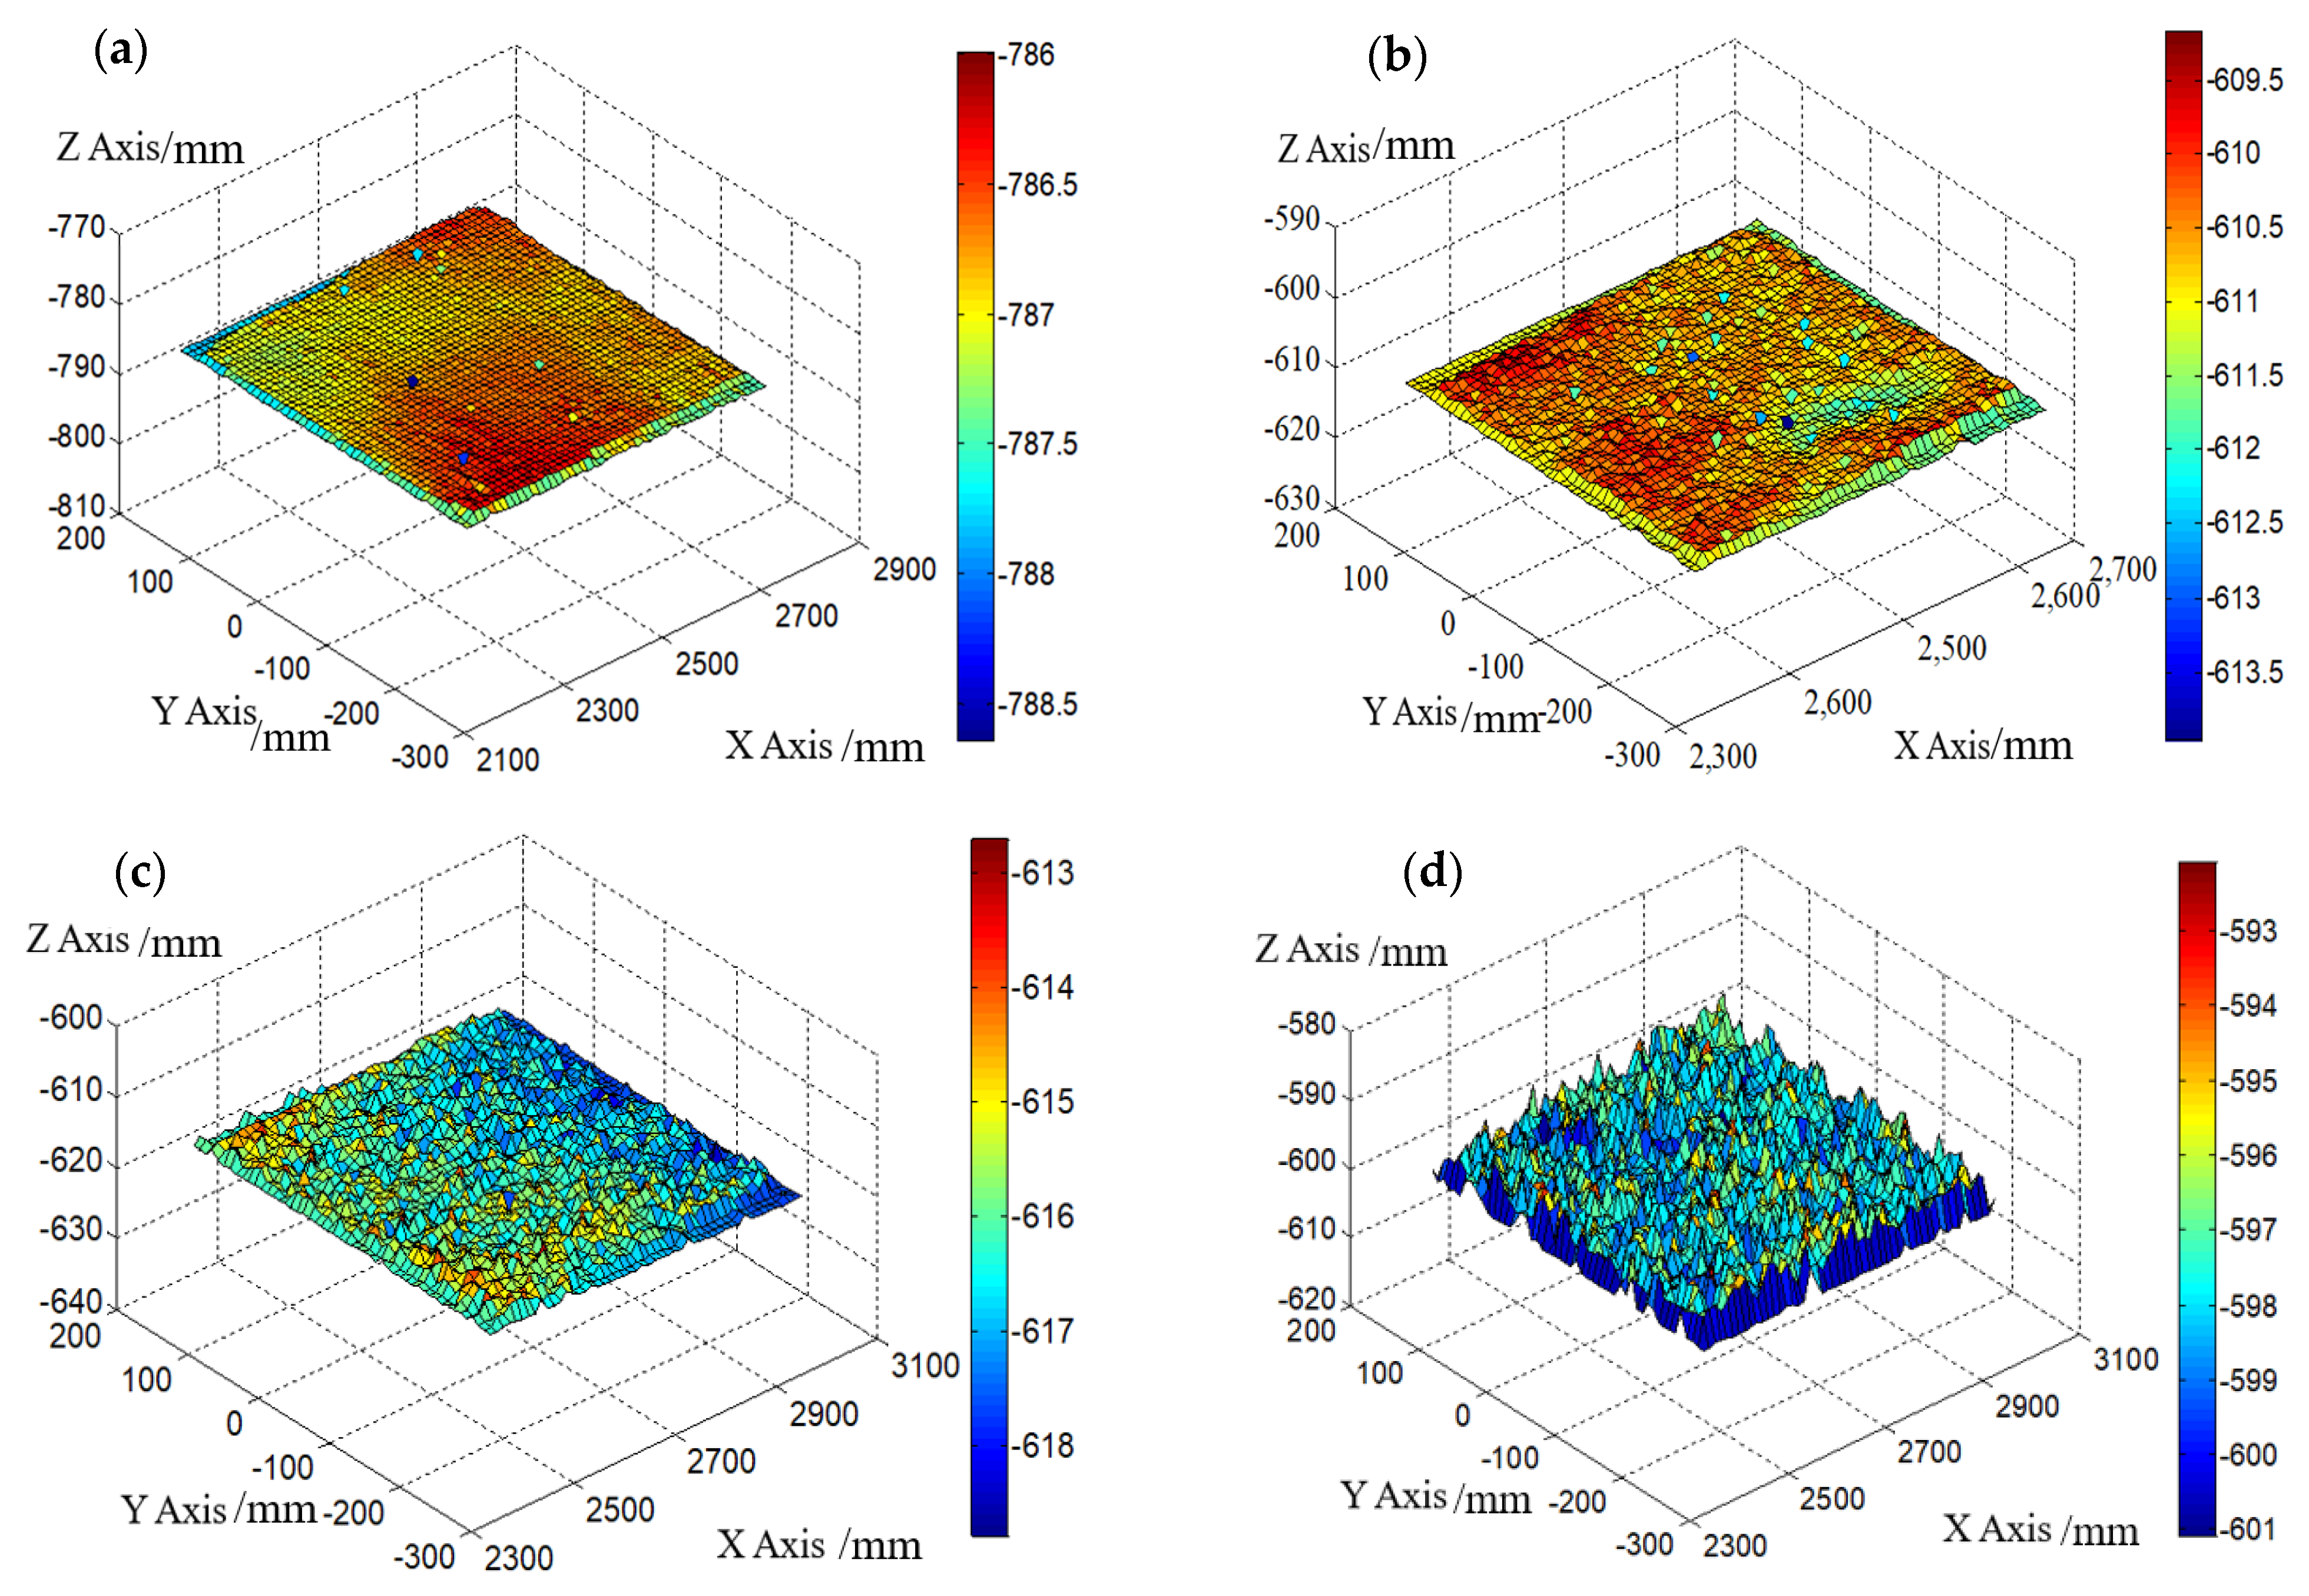
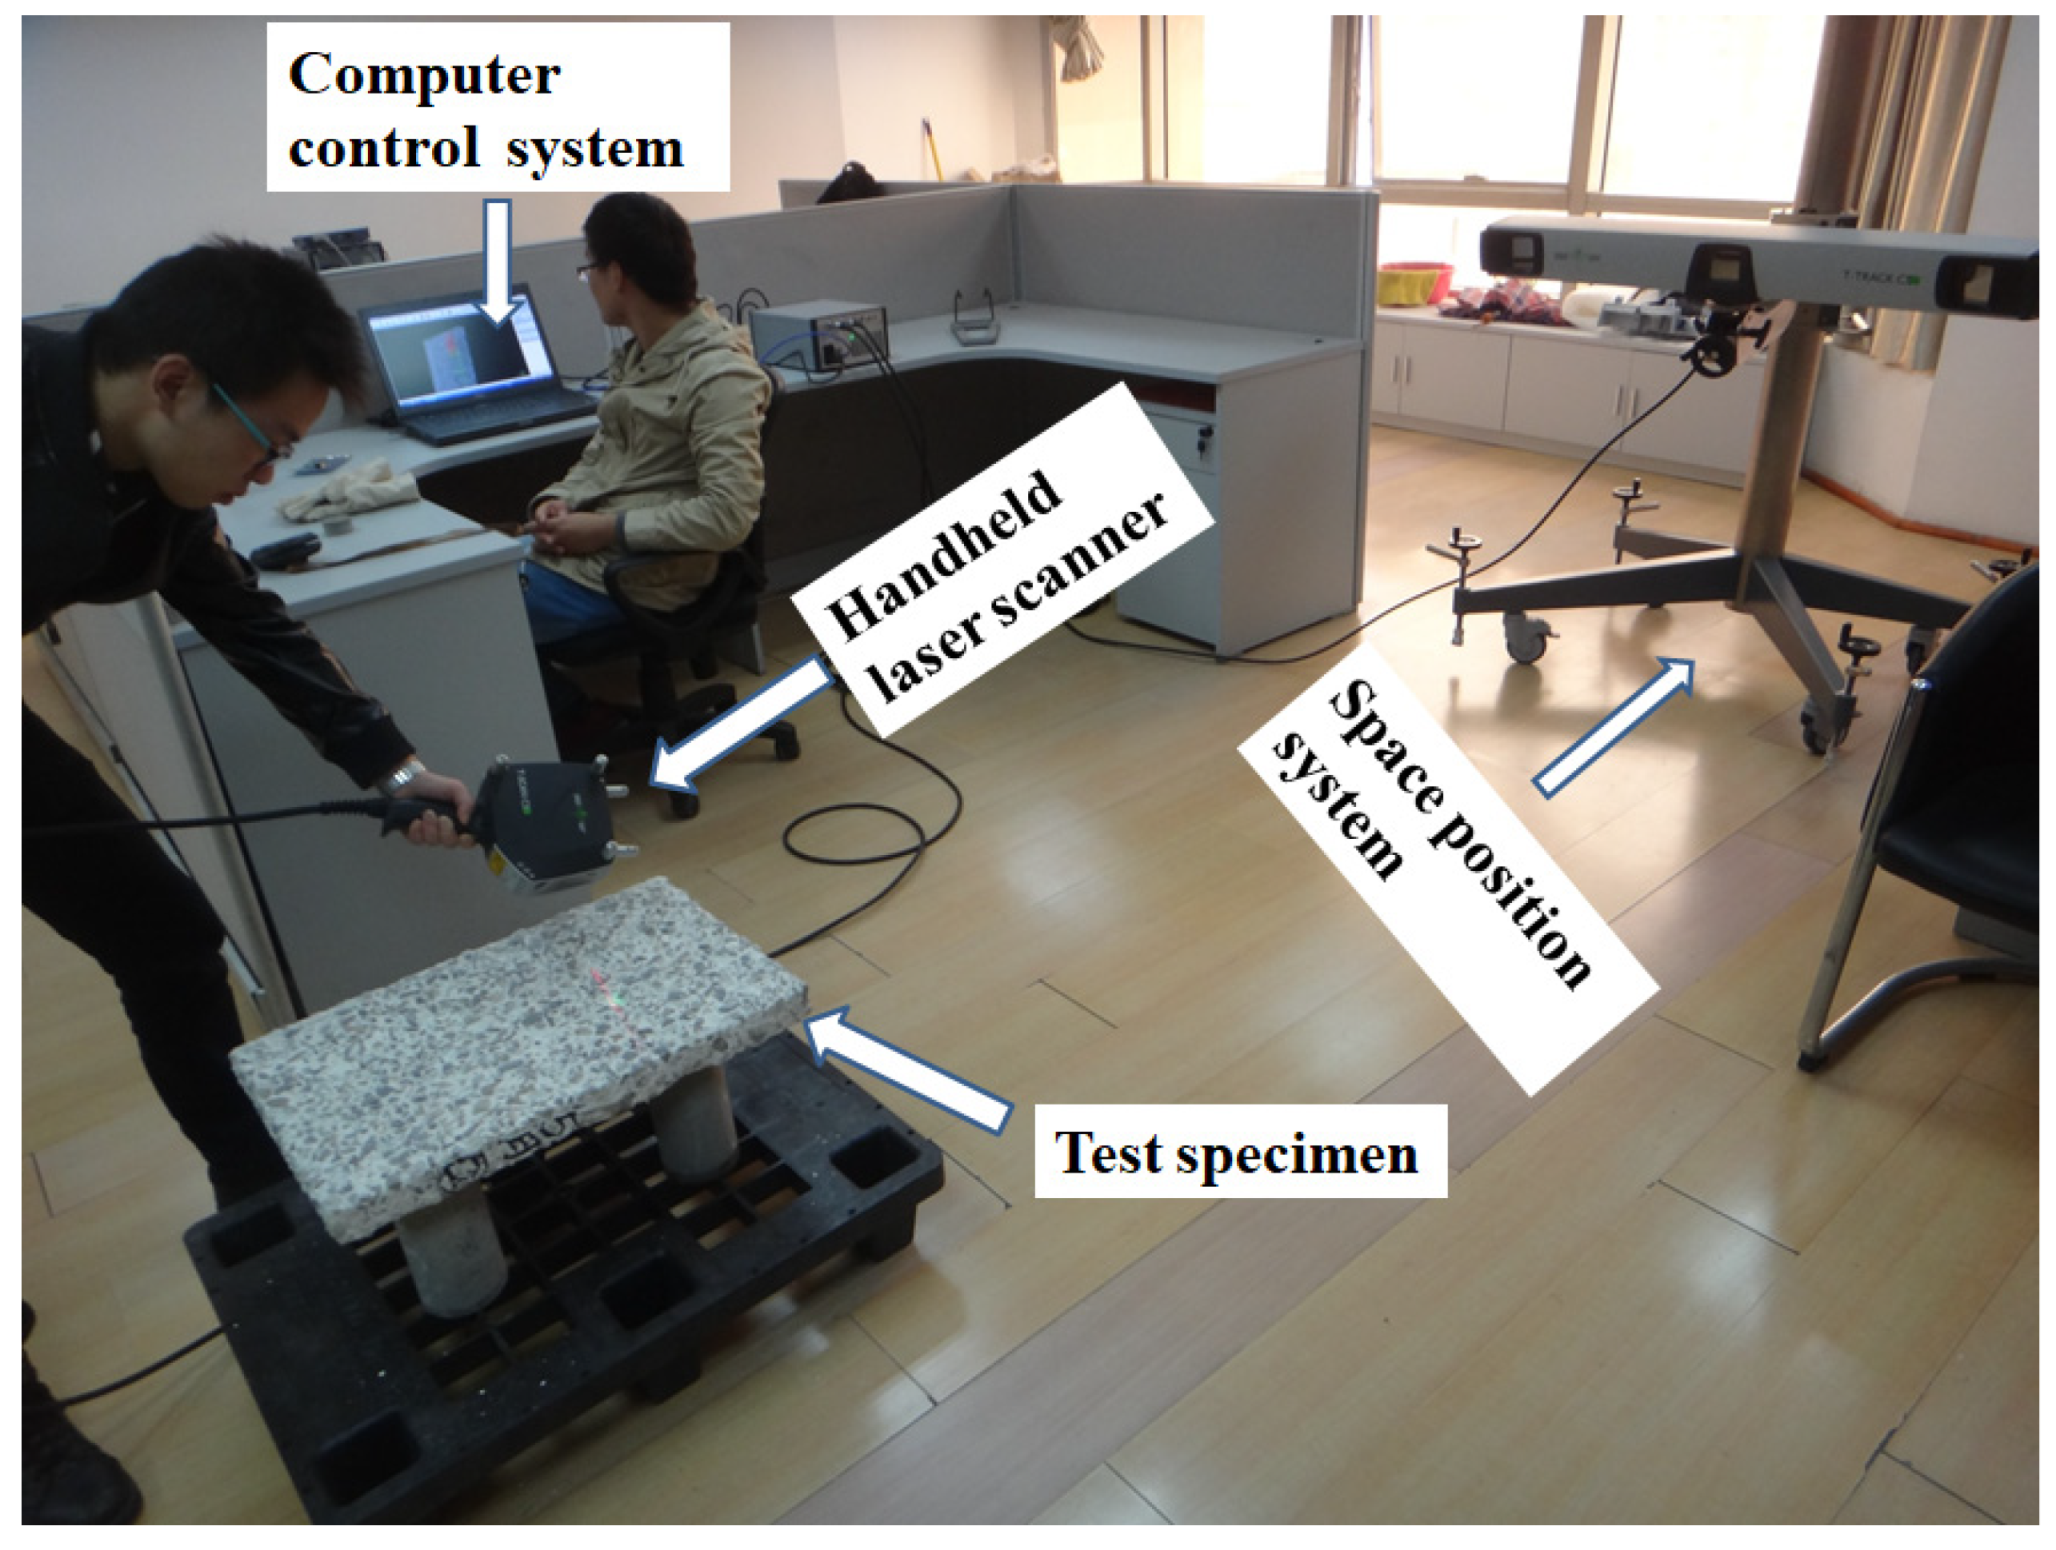
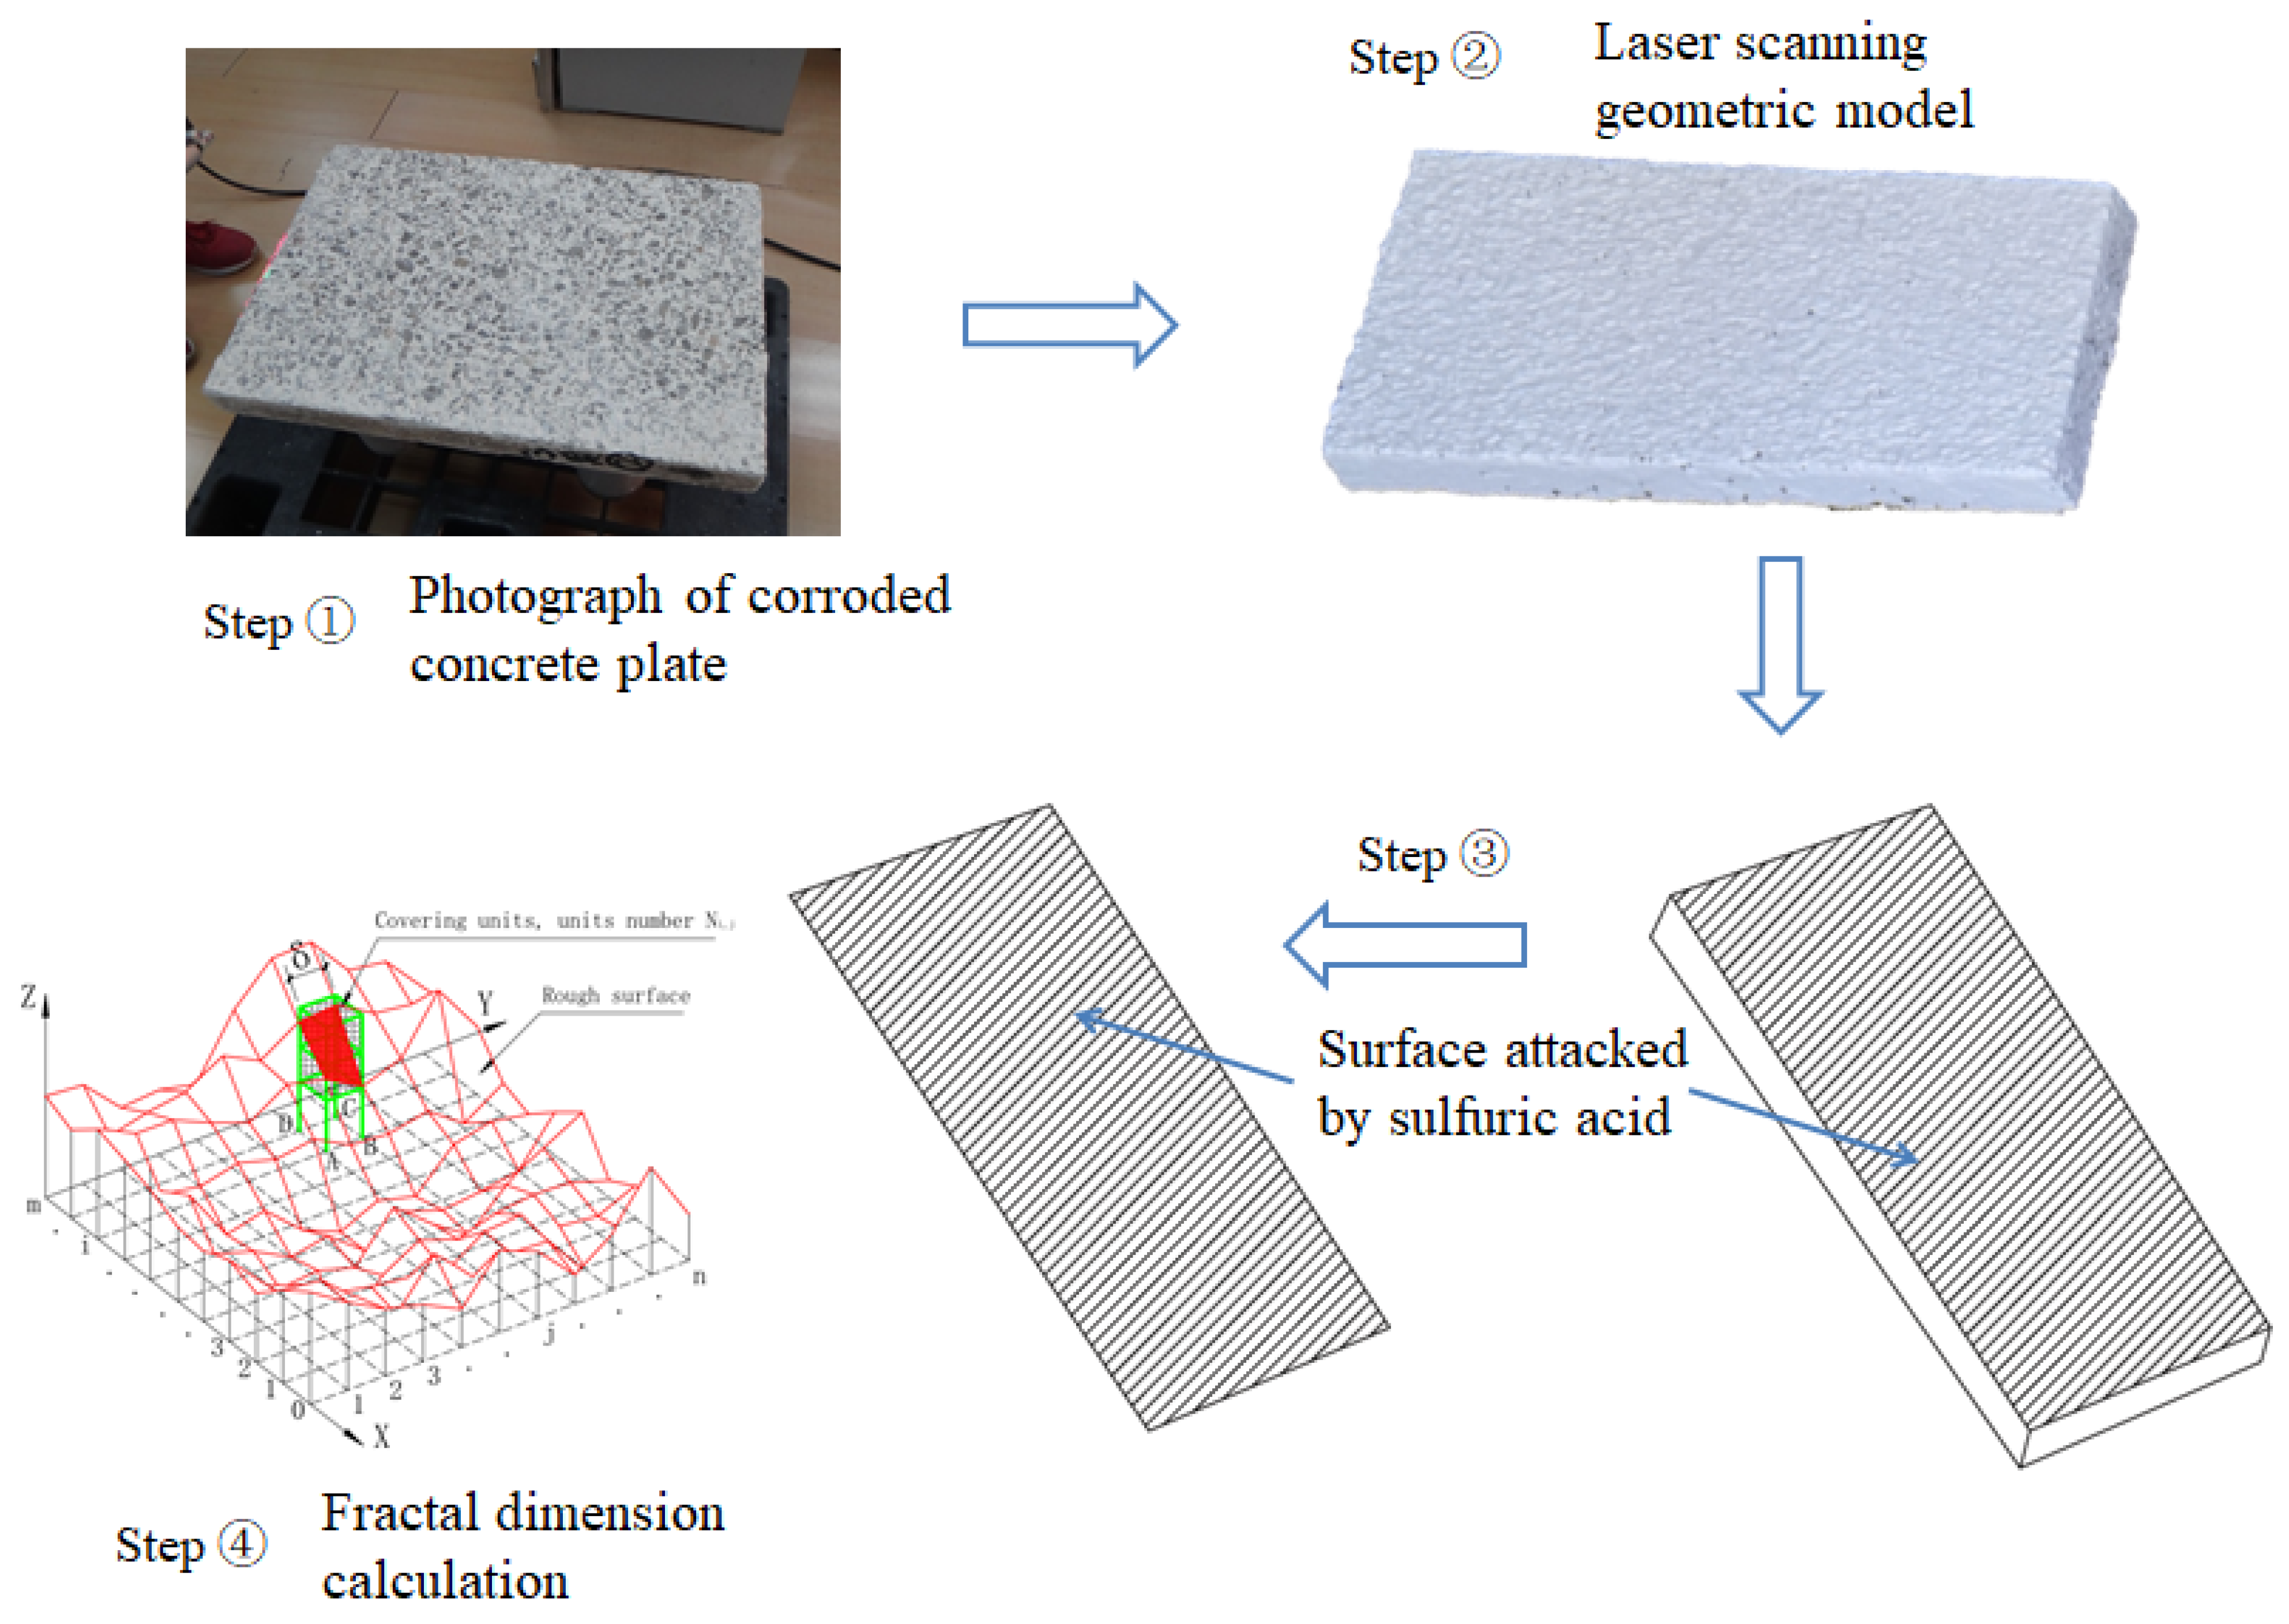
2.4. The Morphology of Corroded Surface Acquired by Laser Scanning Technique
2.5. Direct Shear Experiment for Interface between Sand and Corroded Concrete Plate
3. Experiment Results and Analysis
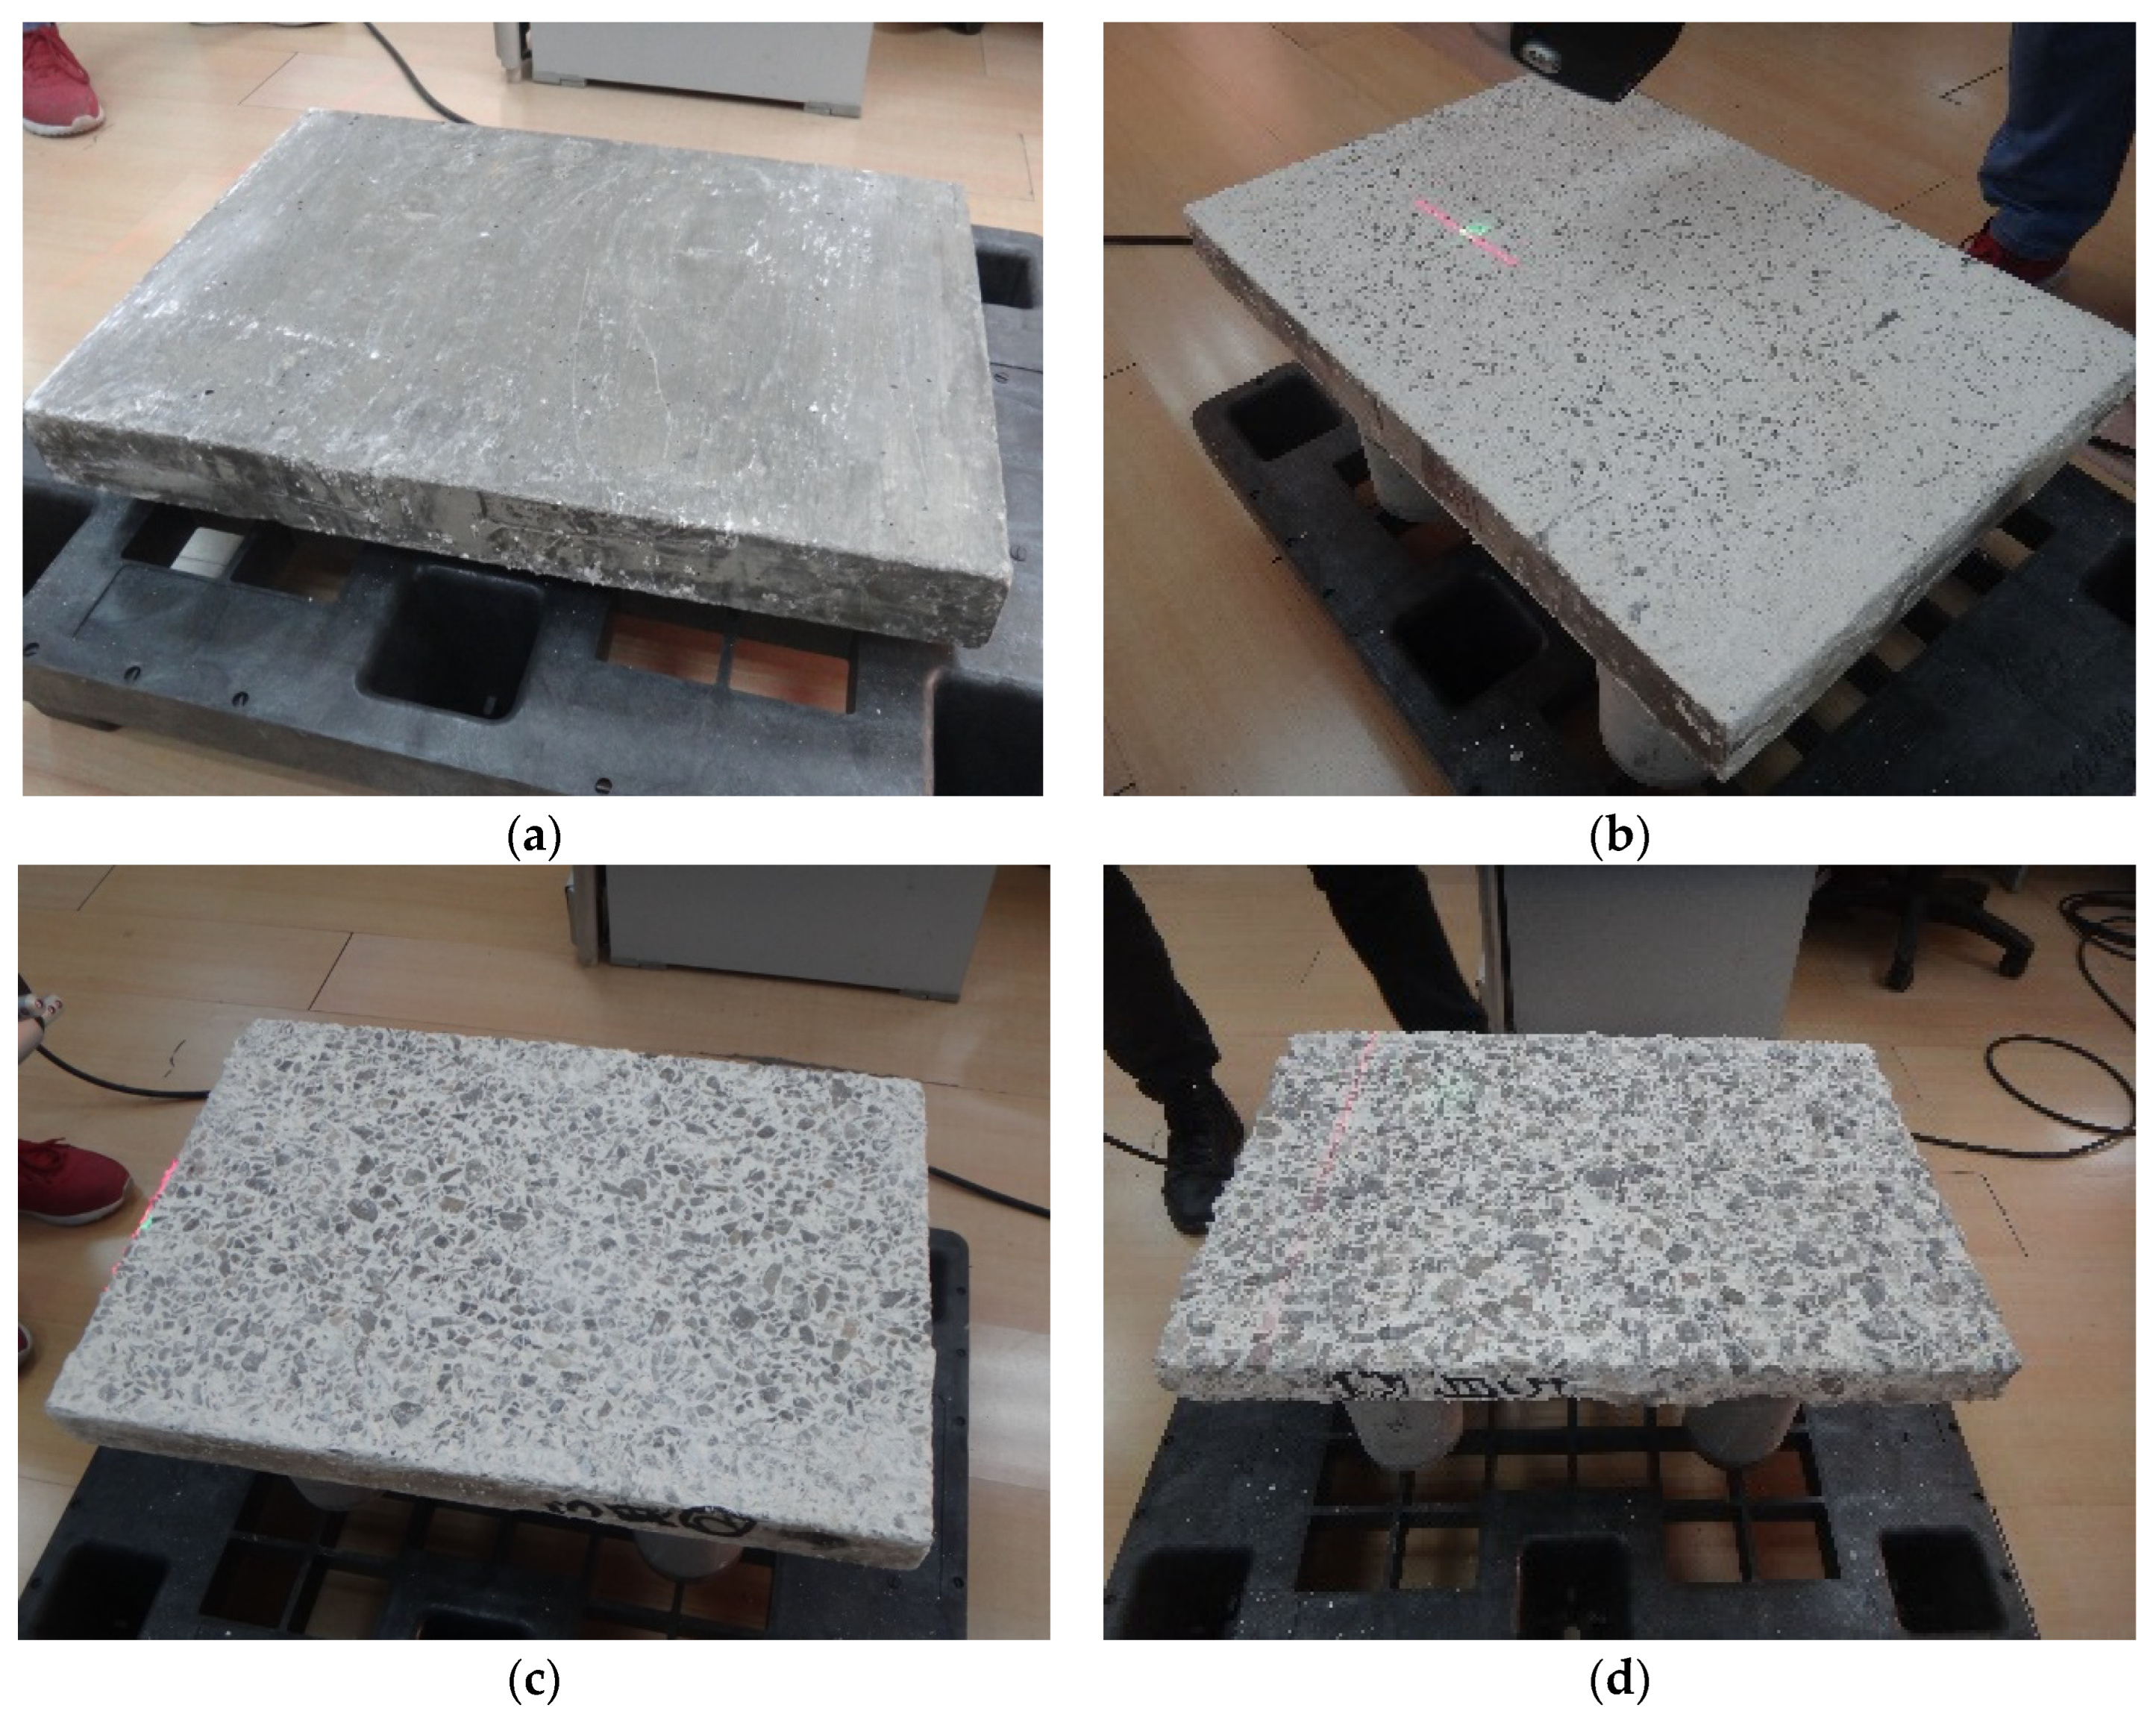
3.1. Appearance
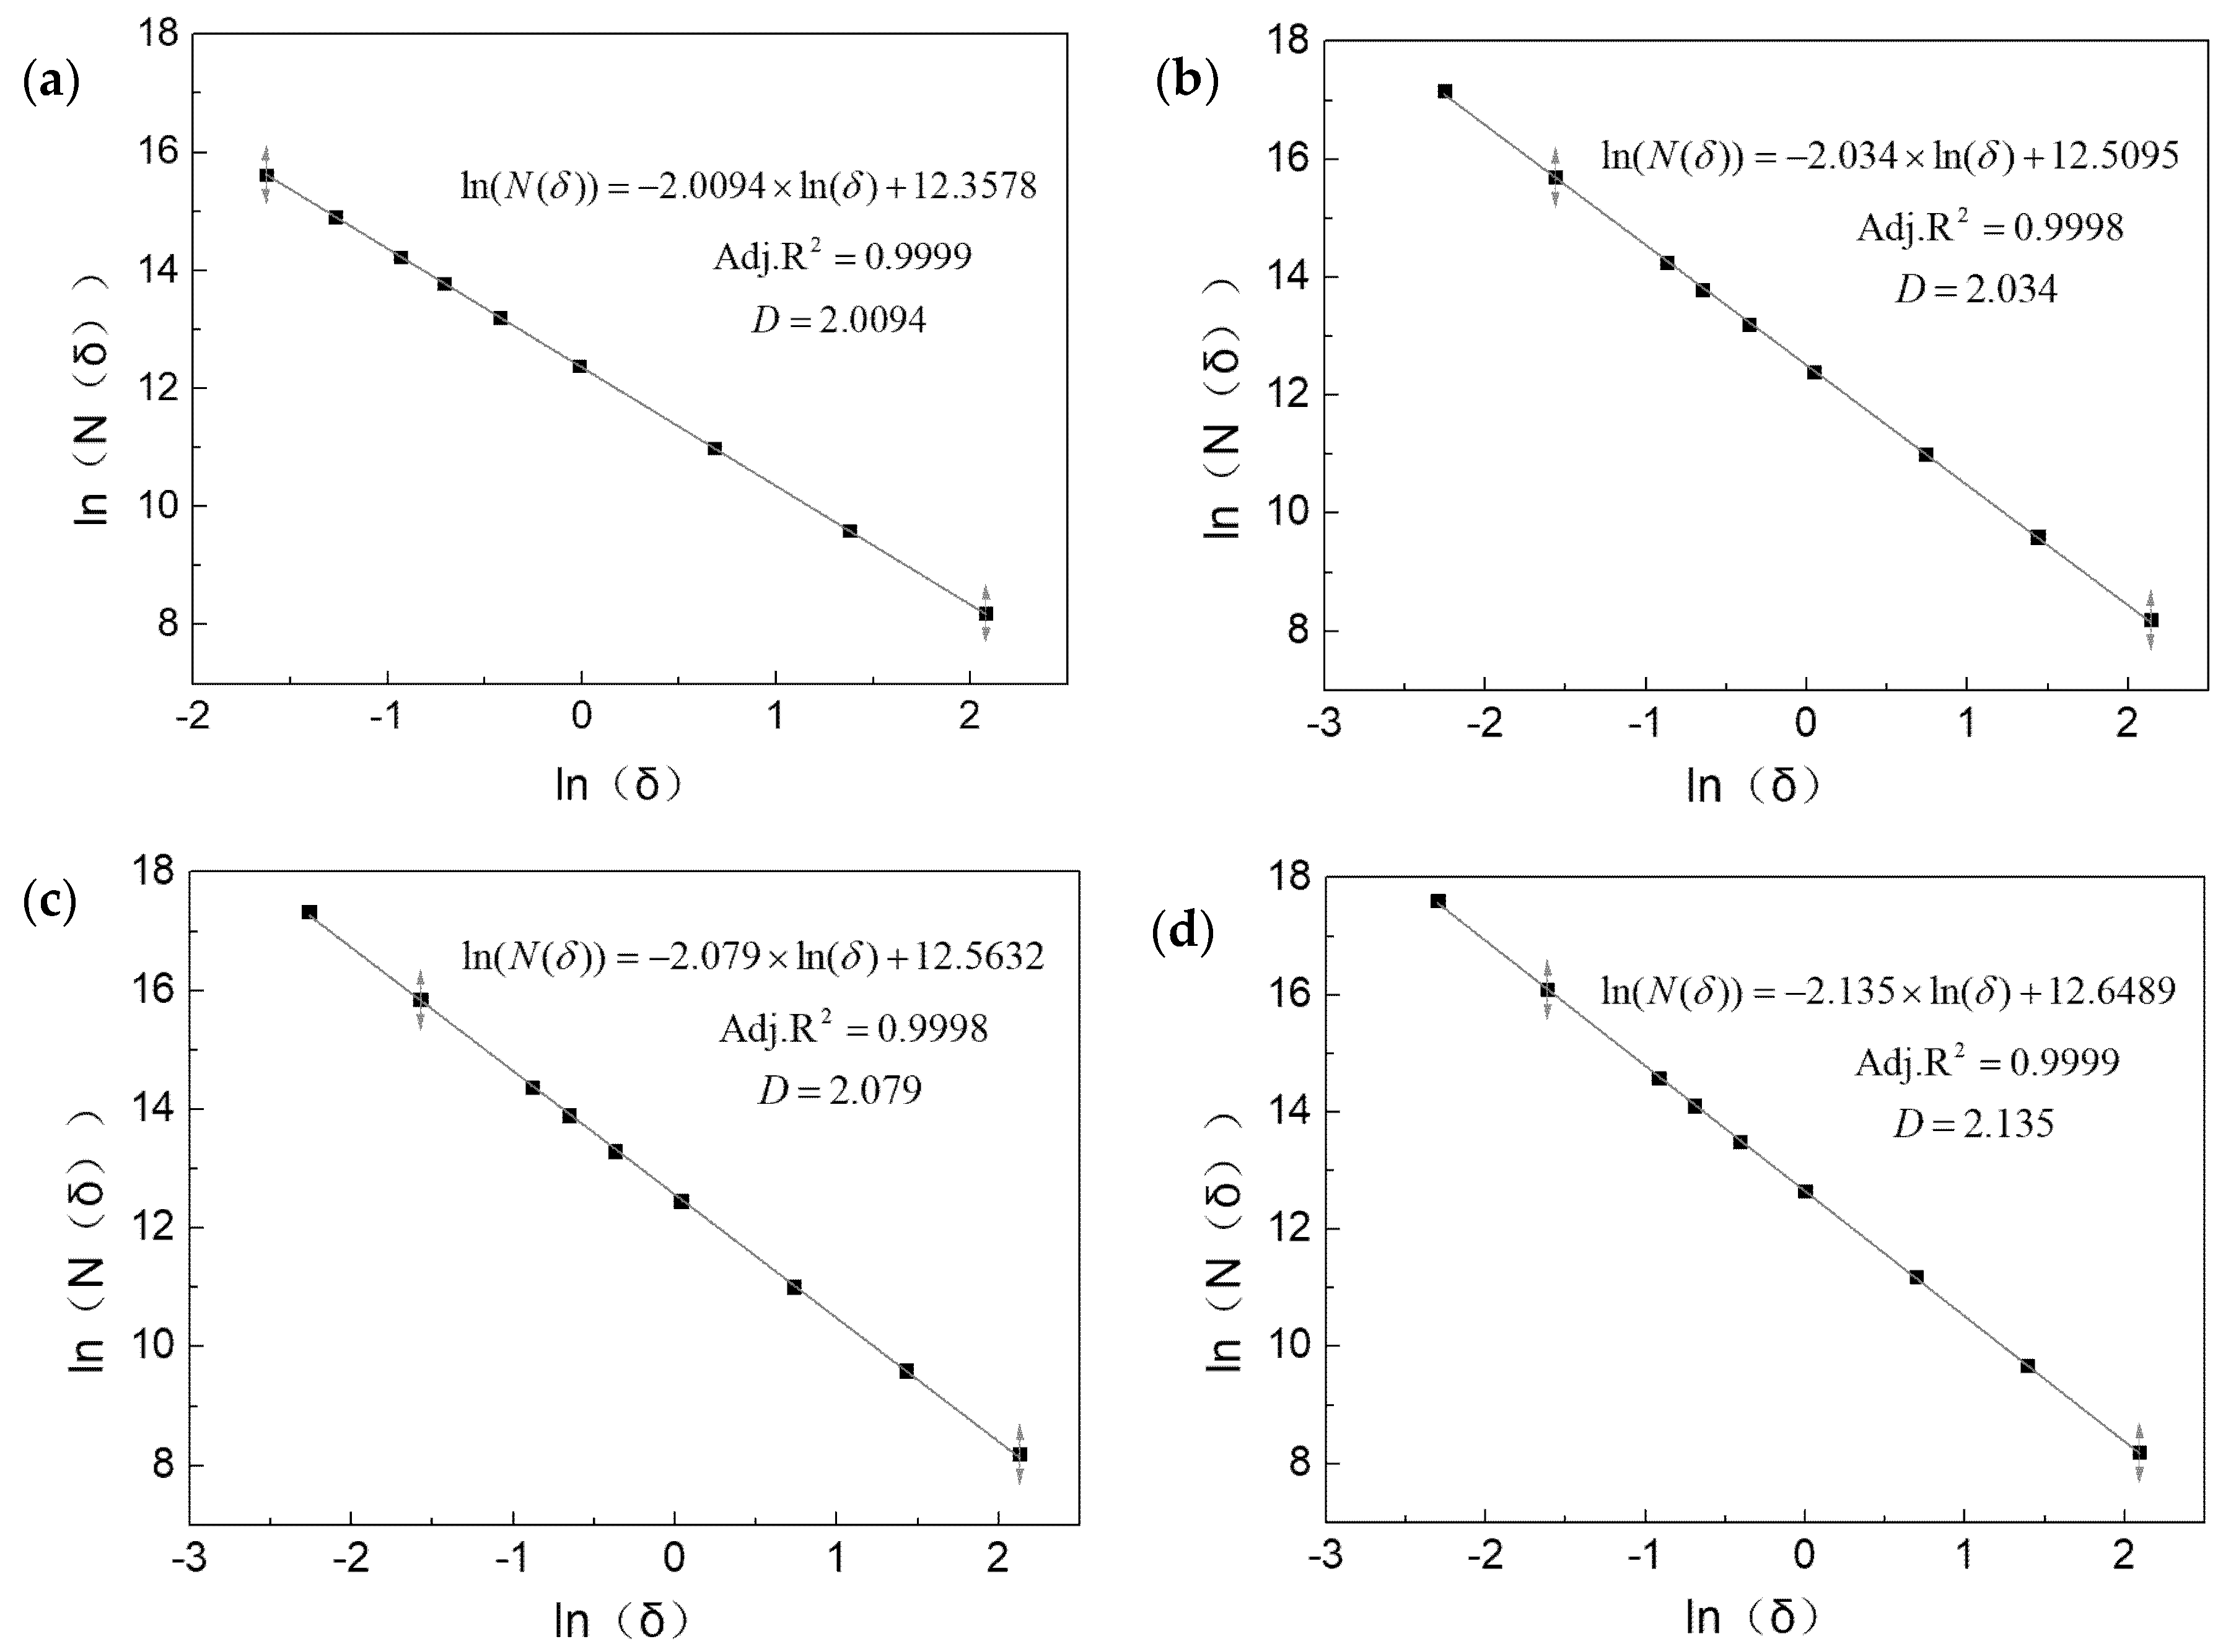
3.2. The Fractal Dimension Calculated Results
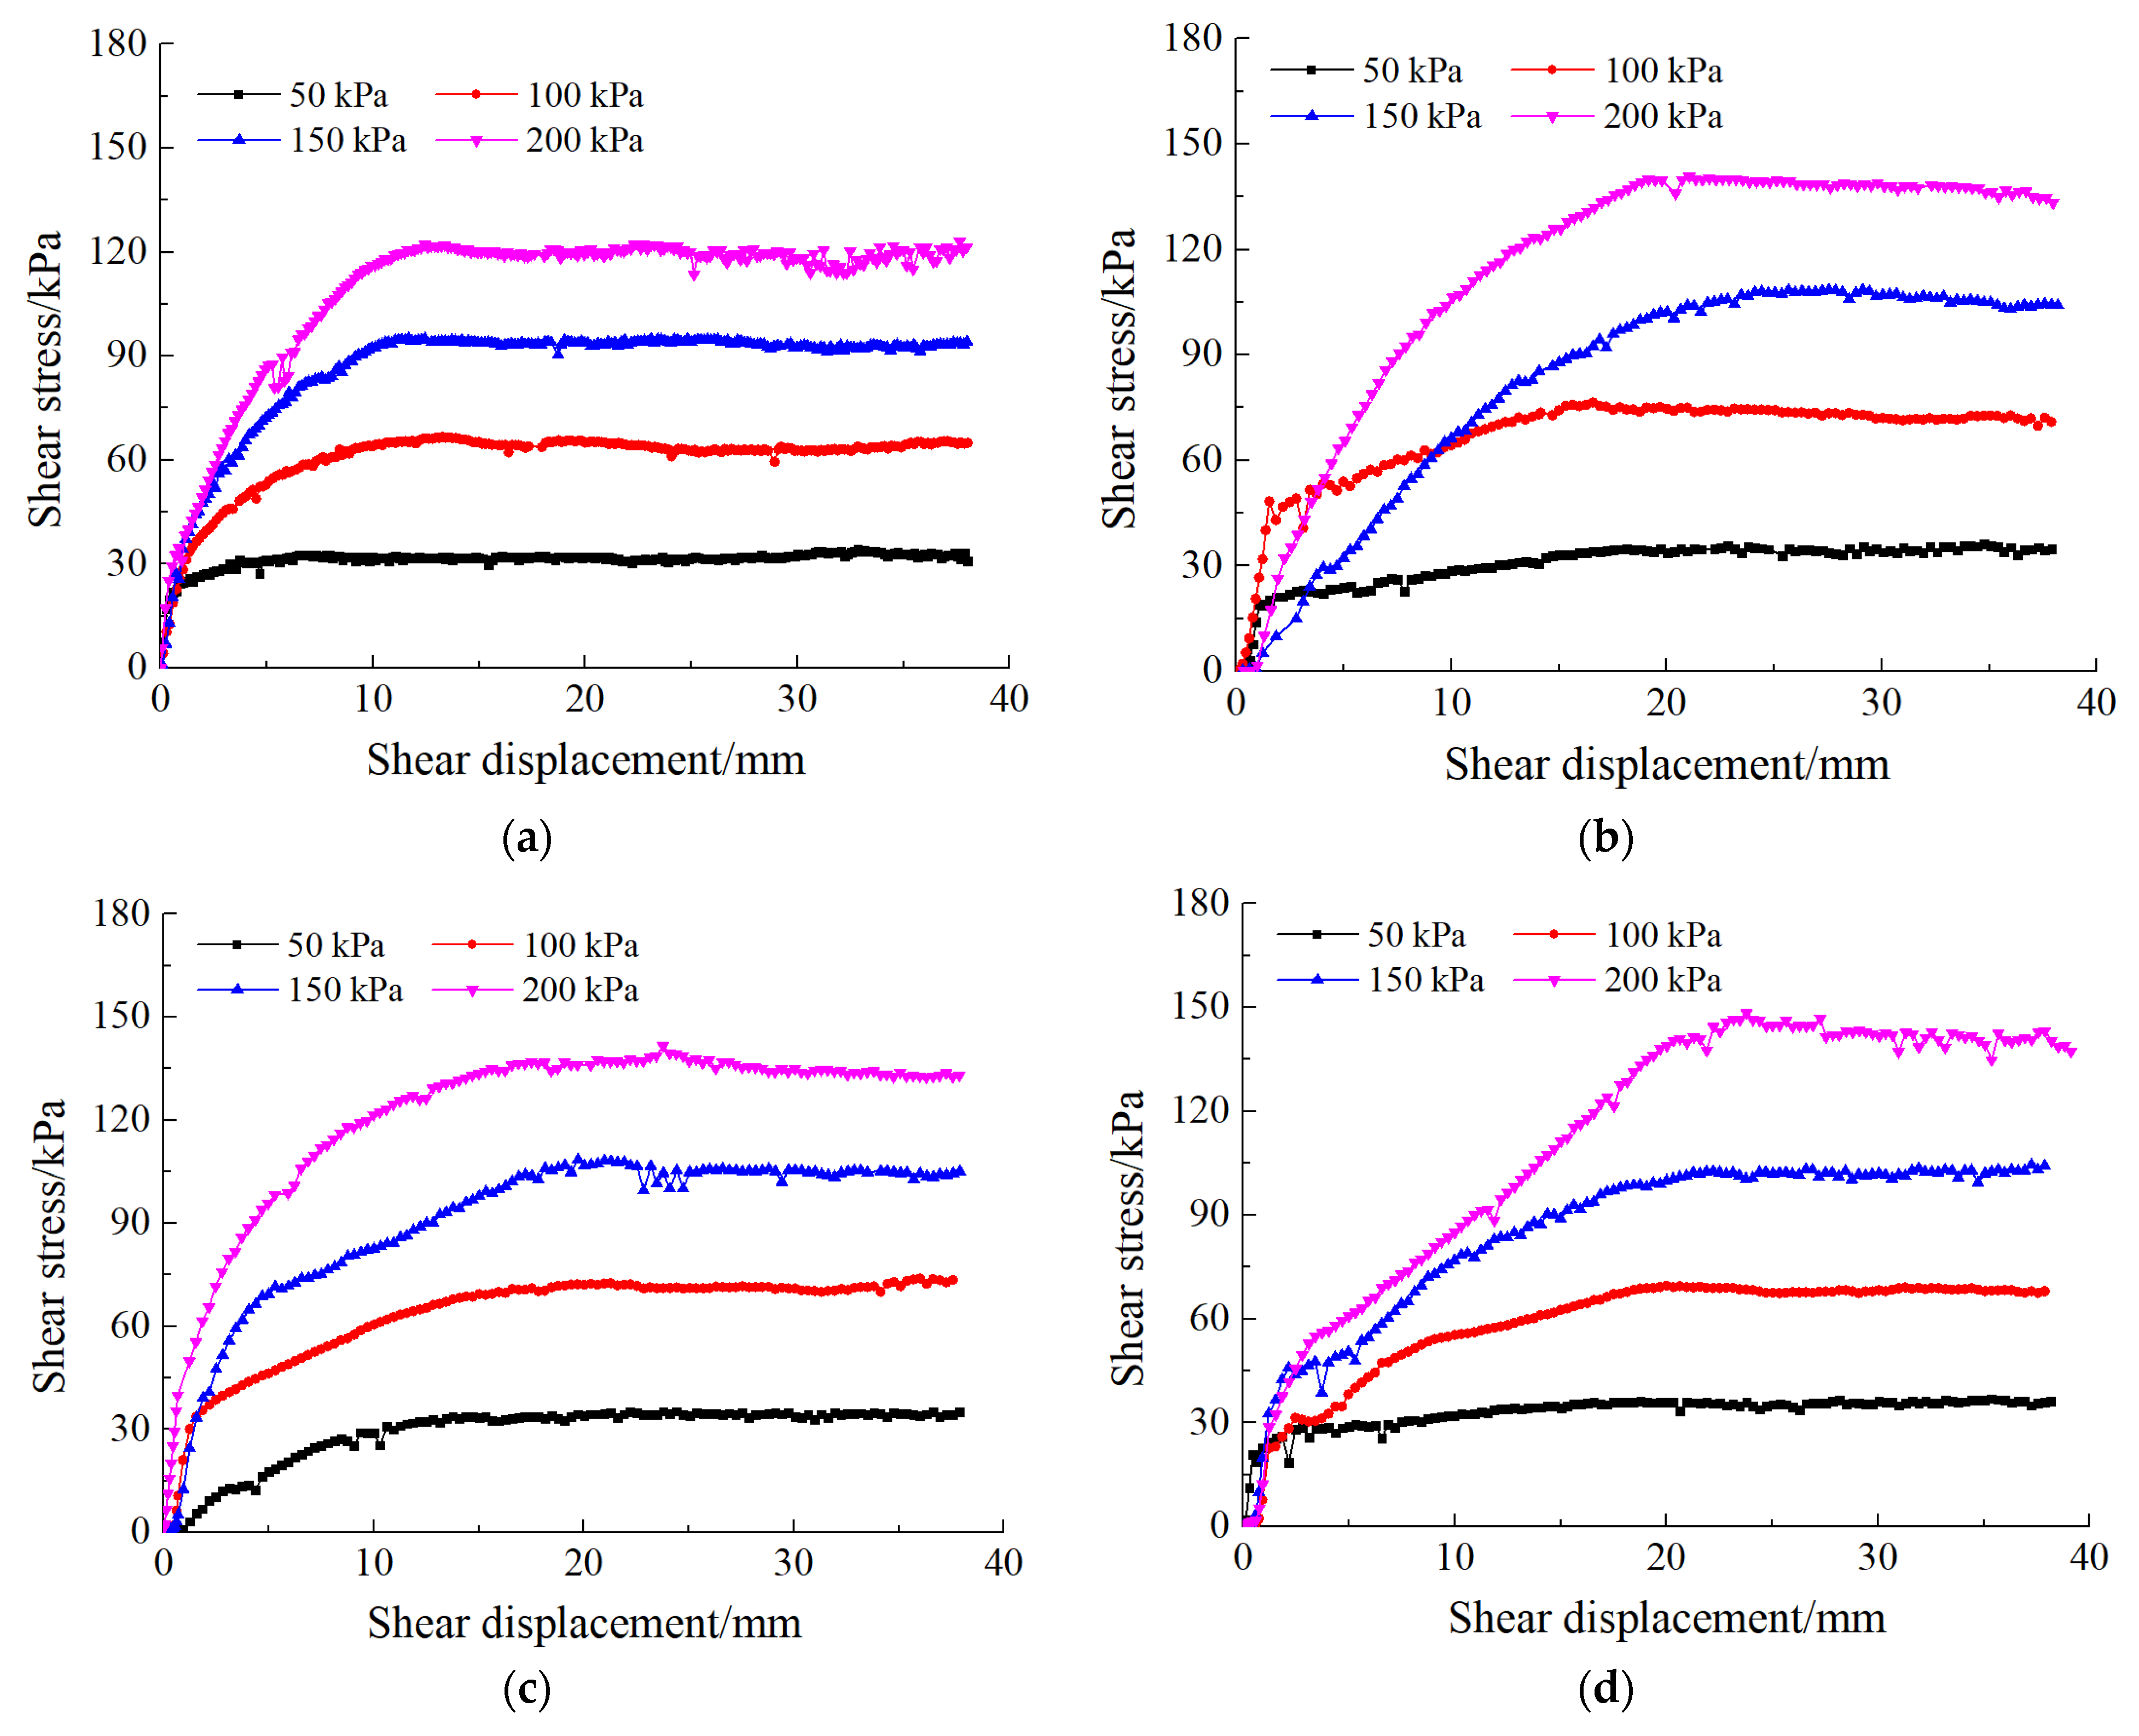
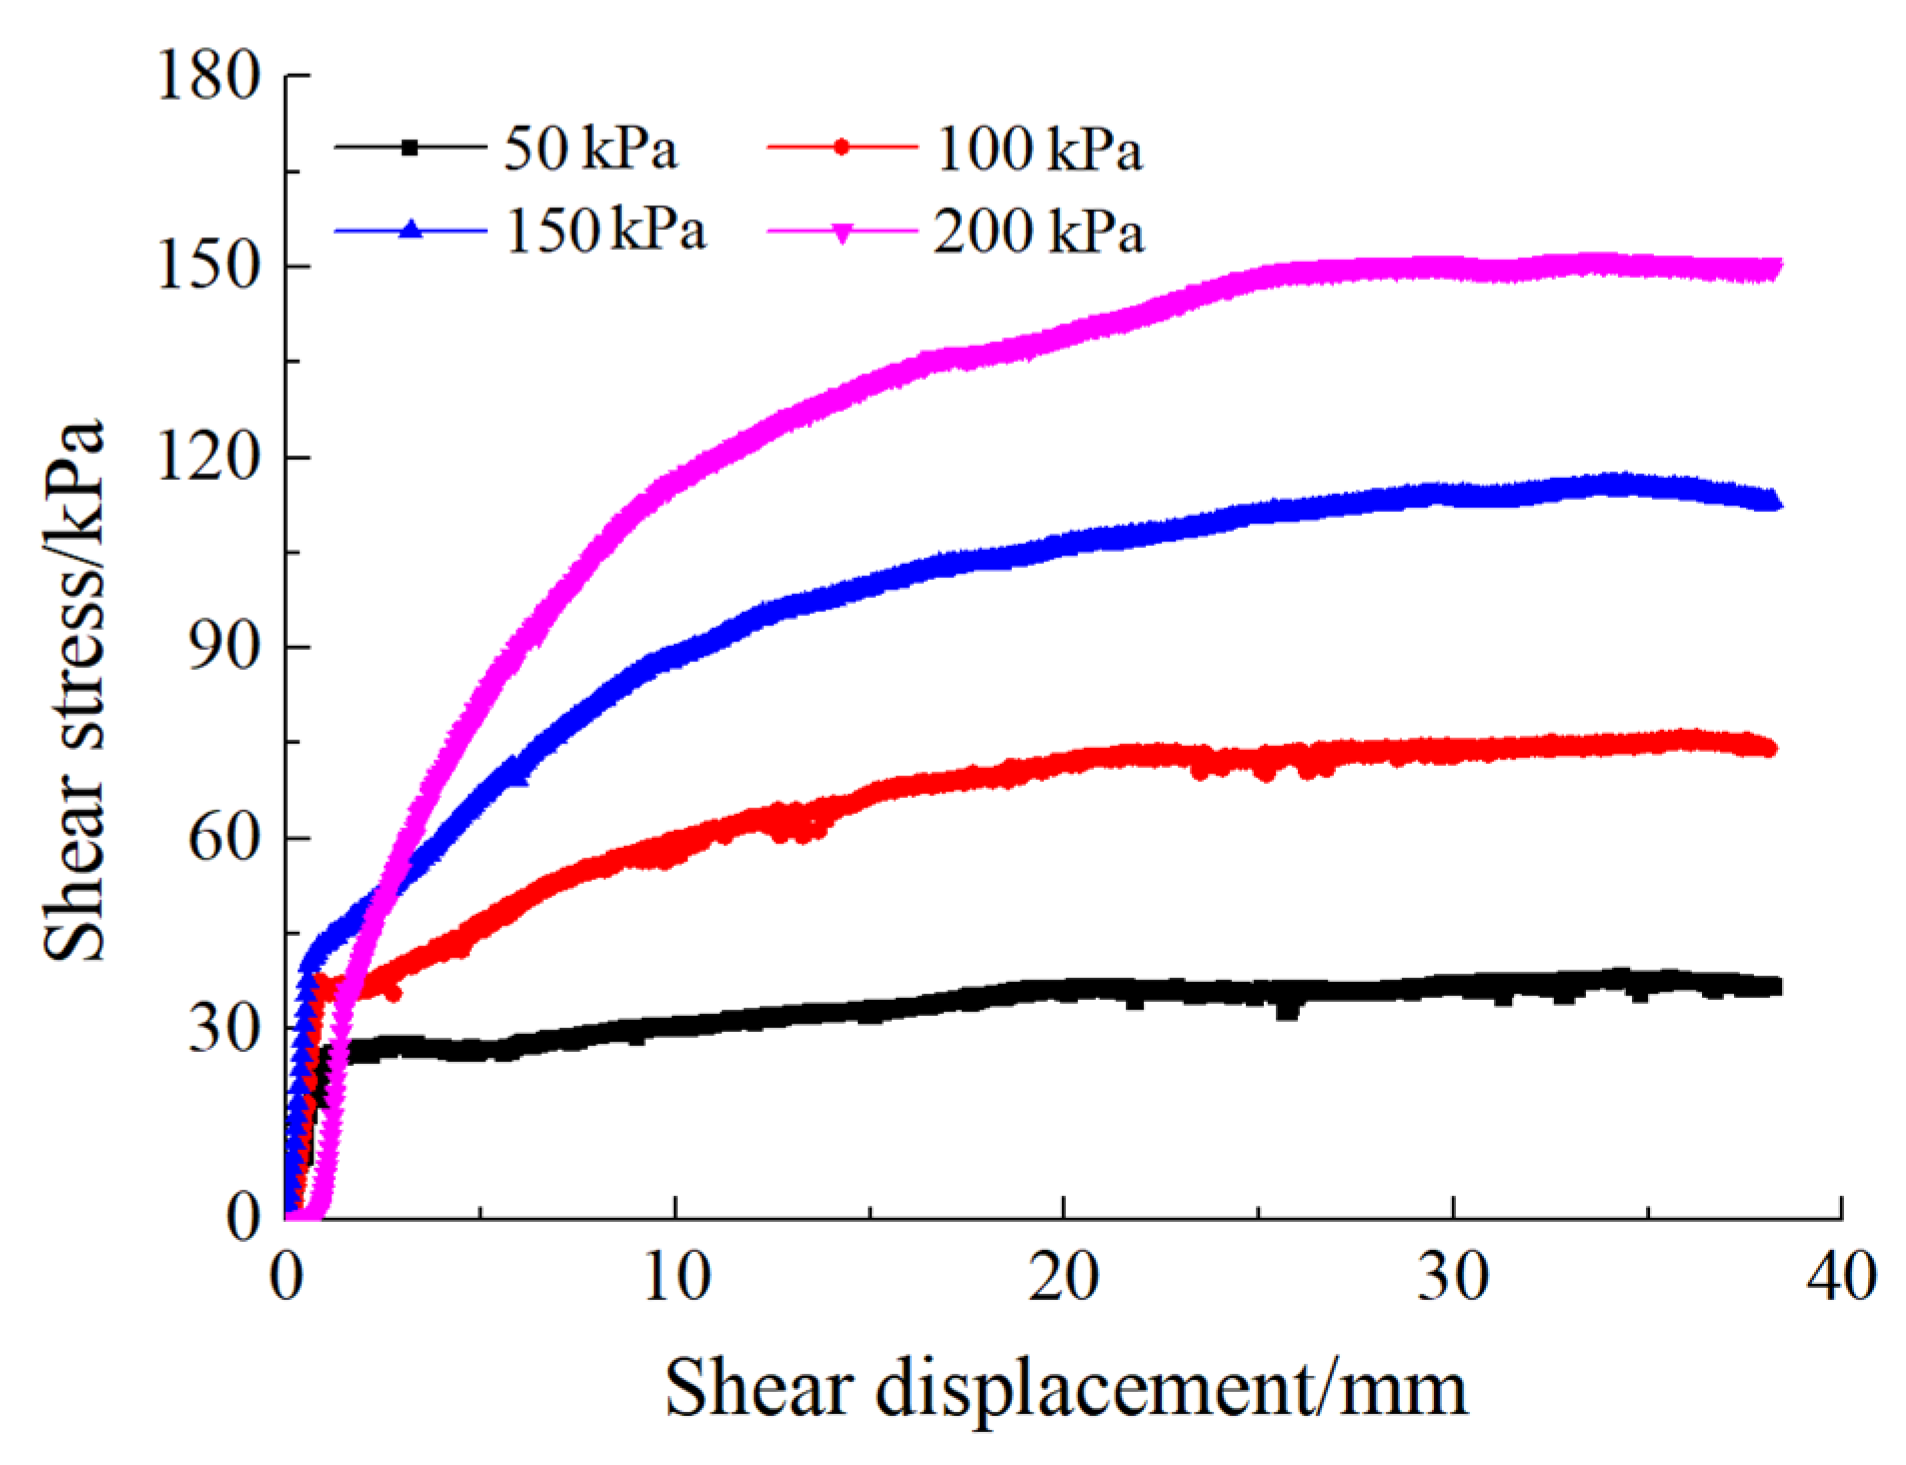
3.3. Direct Shear Experimental Results of the Interface
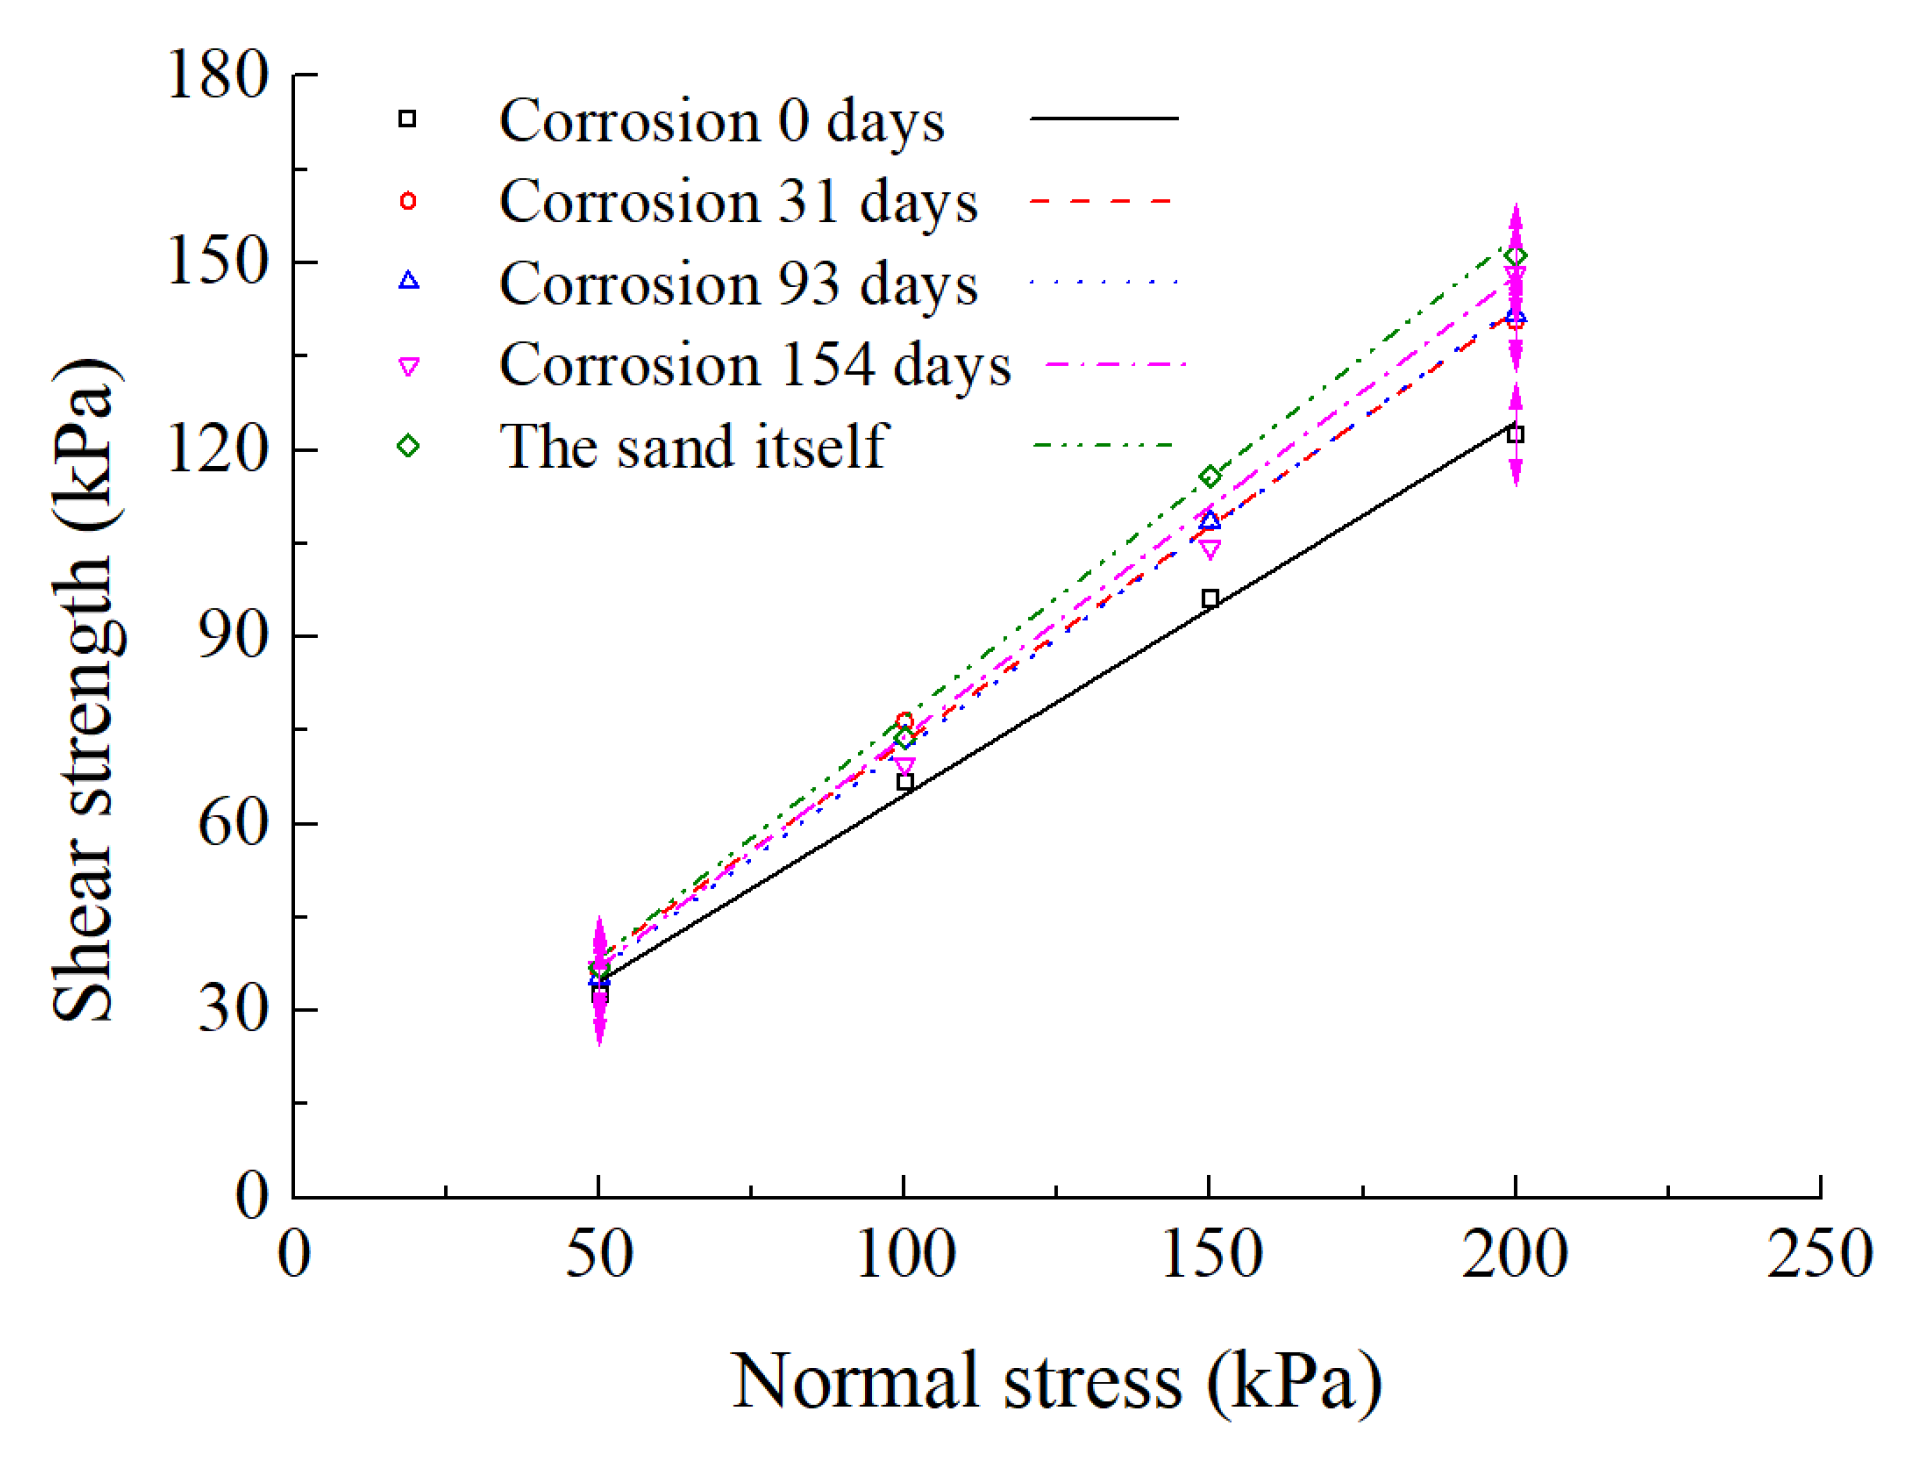
3.4. Correlation between Interface Shear Strength and Fractal Dimension
3.5. Influence of Fine Marble Aggregate on Interface Properties
4. Discussion
5. Conclusions
- (1)
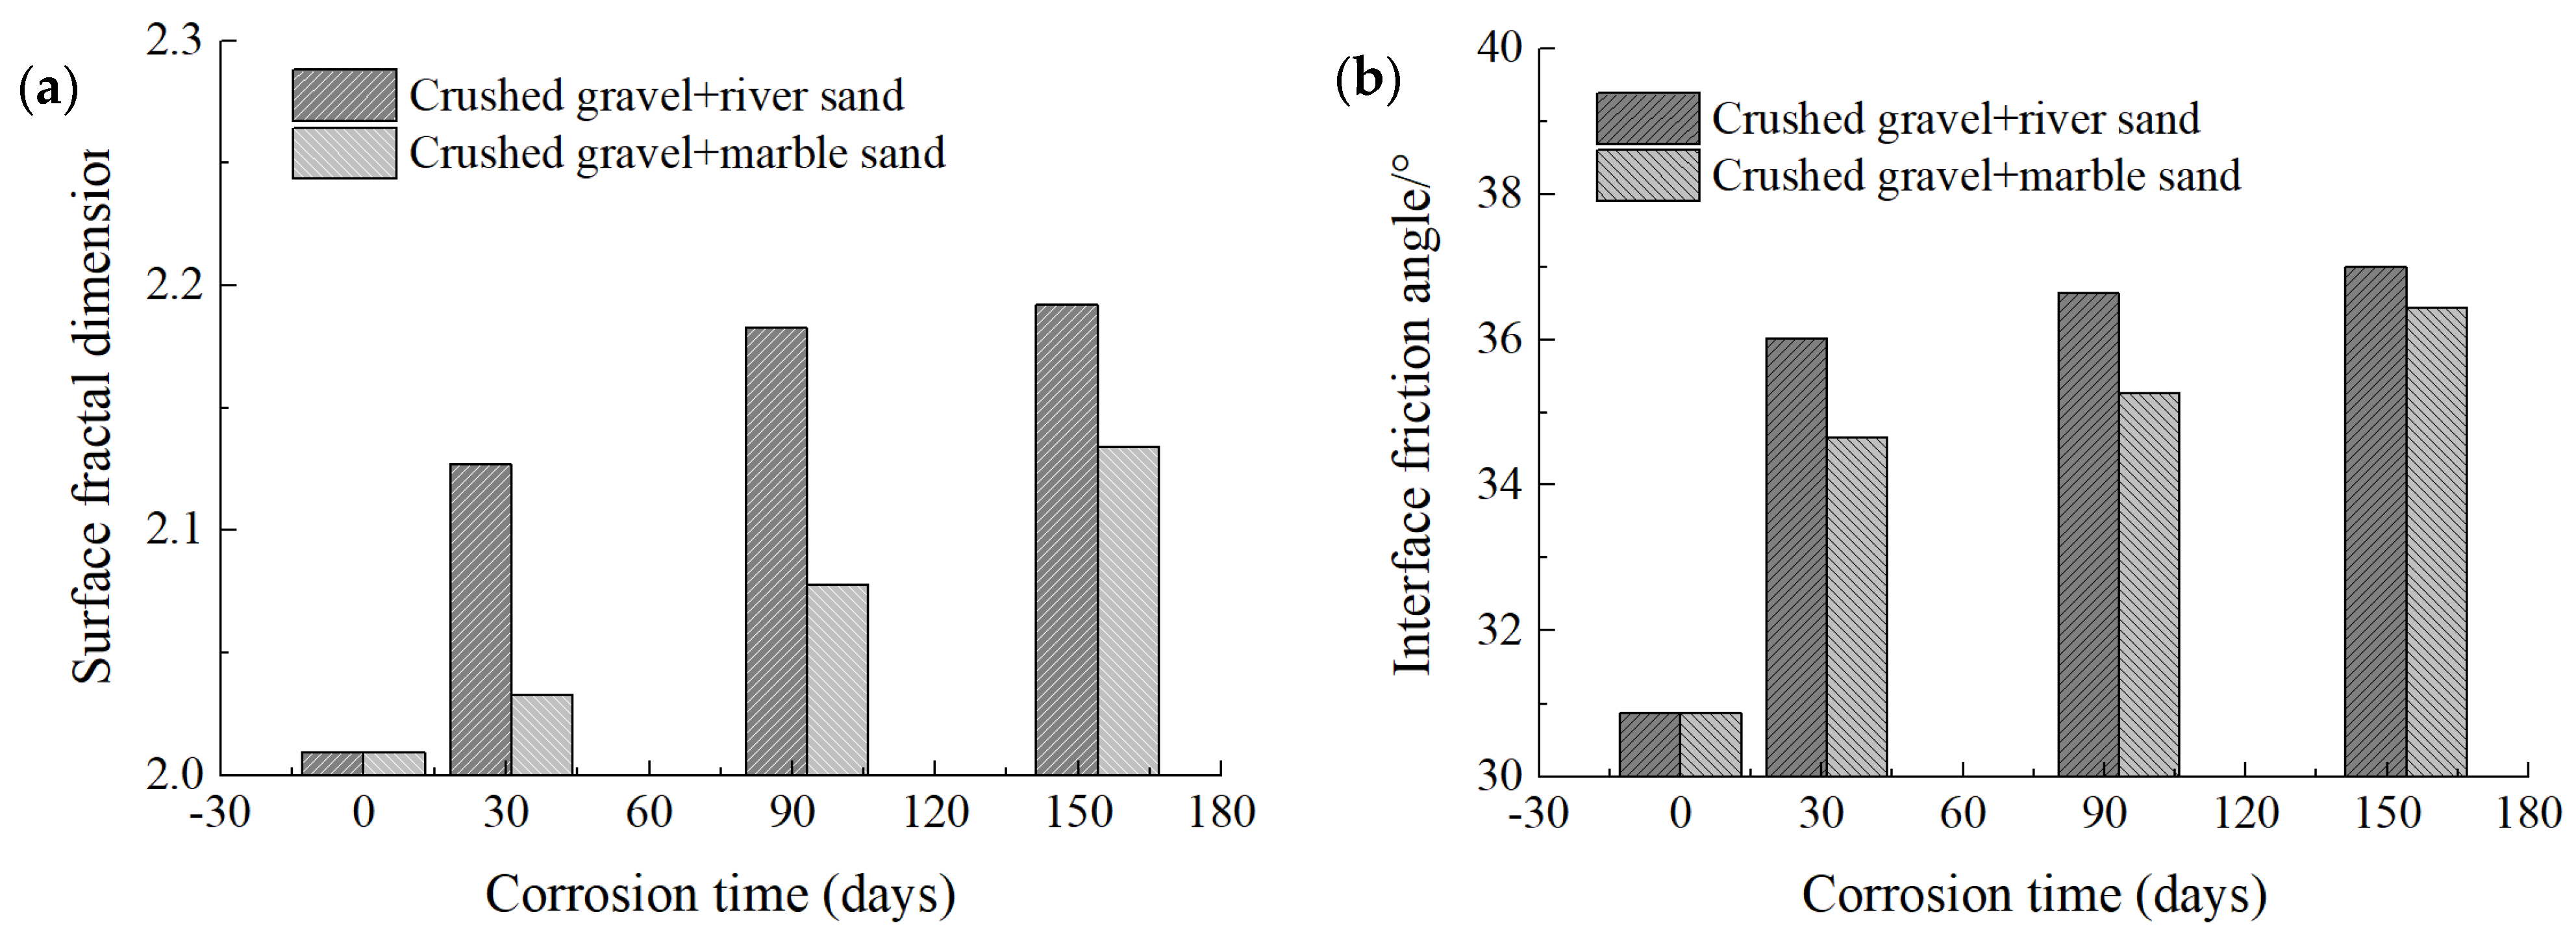
- The surface of the concrete cast with crushed gravel and marble sand as aggregates exhibited fractal characteristics after being corroded by sulfuric acid. The surface fractal dimensions of the corroded concrete plate under sulfuric acid environment increased with the increase of the corrosion time.
- (2)
- The shear strength of the interface increased linearly as the normal stress increased, and the relationship between the interface shear strength and the interface normal stress complied with the Mohr–Coulomb rule. The interface friction angle between sand and the corroded concrete plate was smaller than that of sand itself.
- (3)
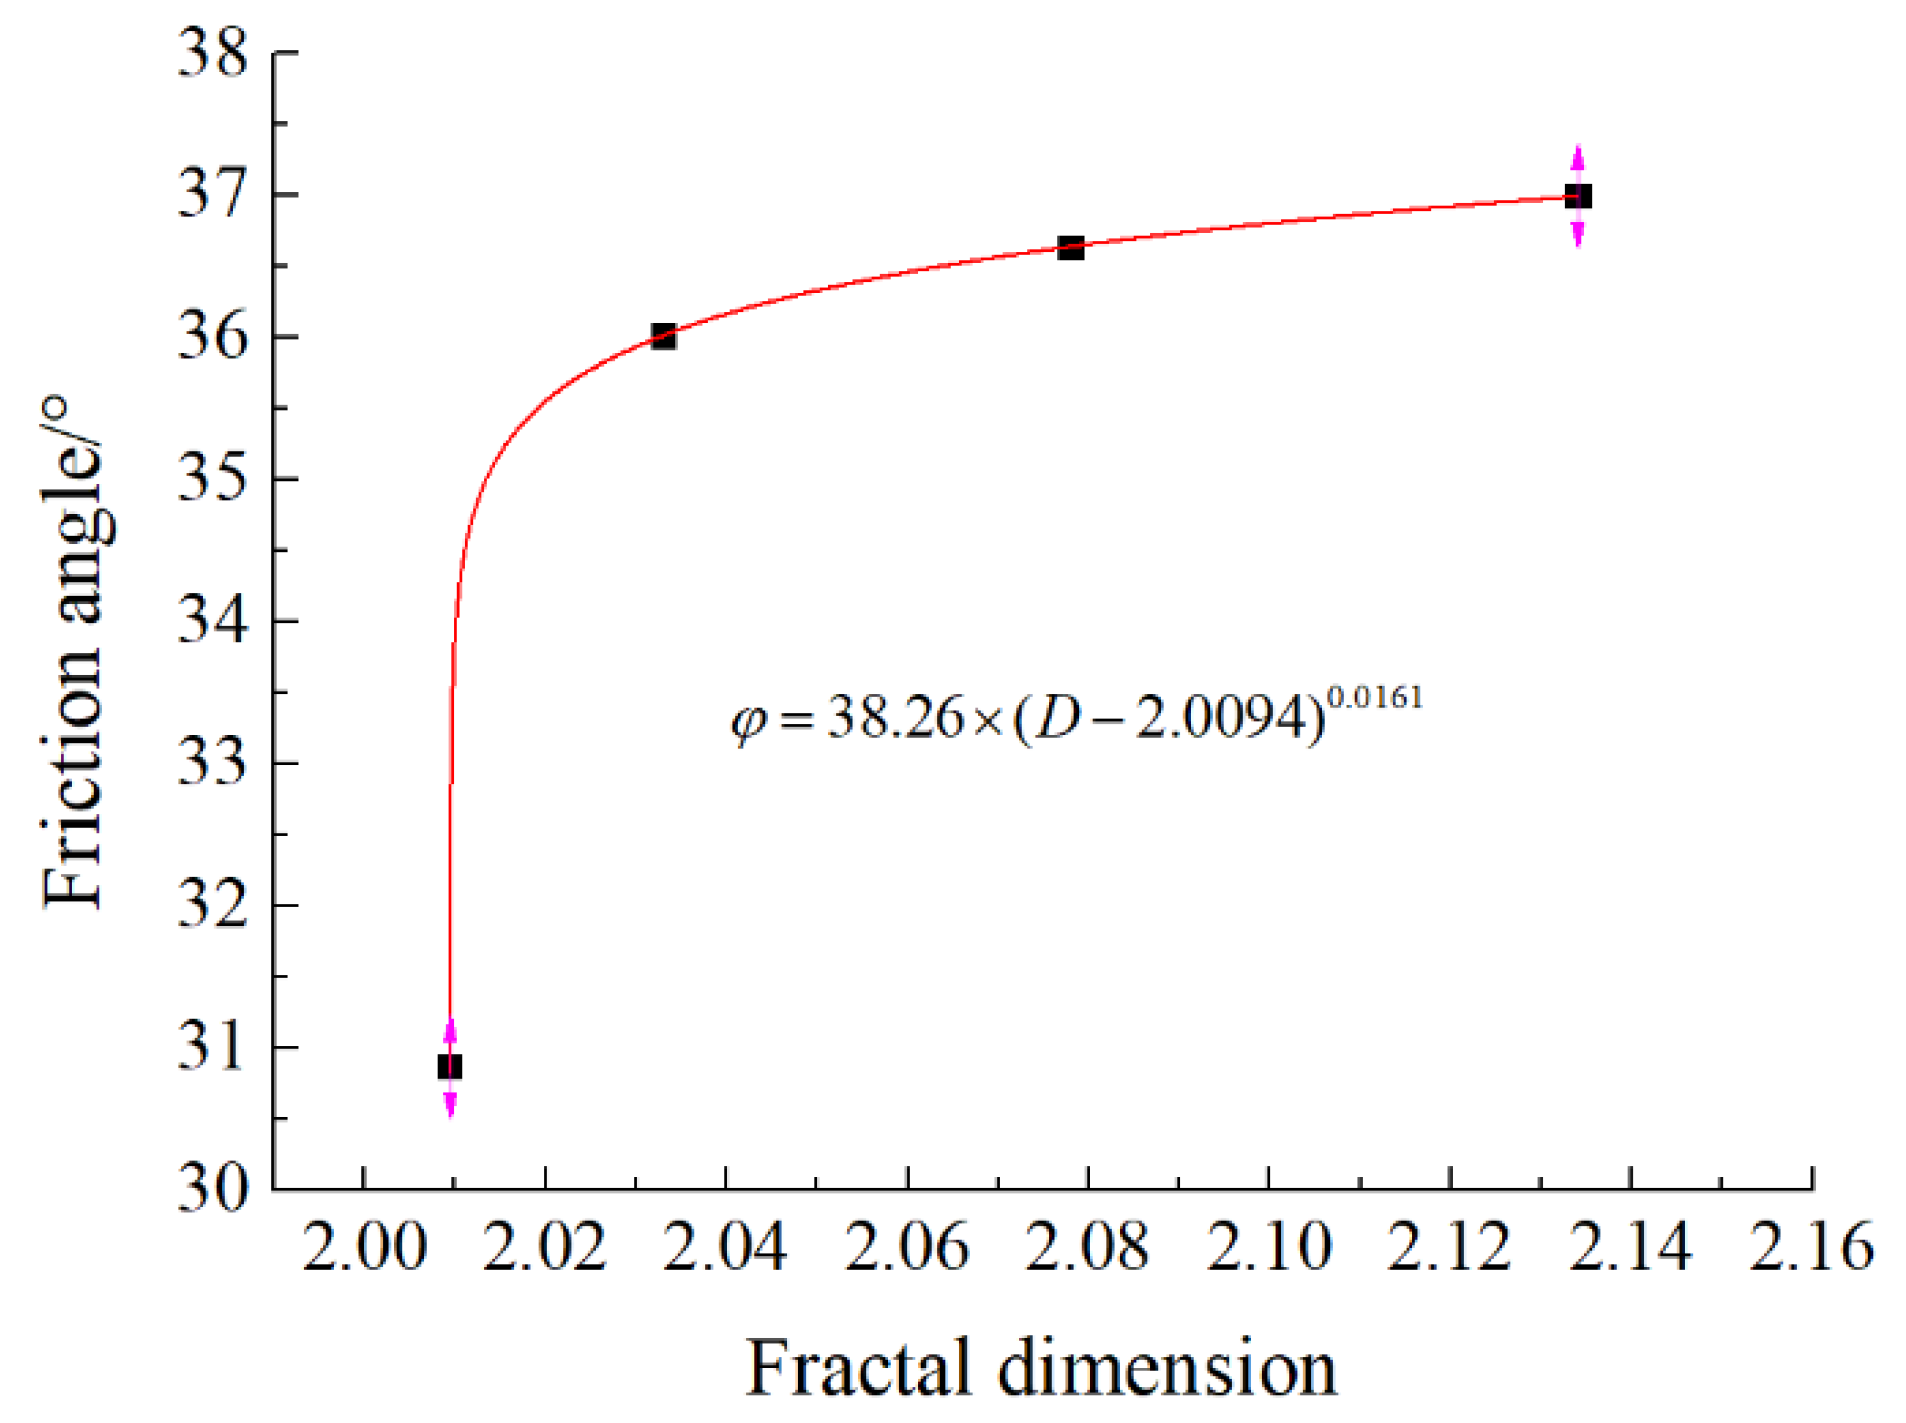
- As the corrosion days increased, the surface of the concrete plate became gradually rougher, and the friction angle of the interface became greater. In the initial stage, the friction angle increased rapidly with the increase of the fractal dimension from 30.87° to 34.65°, but in the later stage, the growth rate of the friction angle decreased with the increase of the fractal dimension and tended to be stable from 34.65° to 36.44°.
- (4)
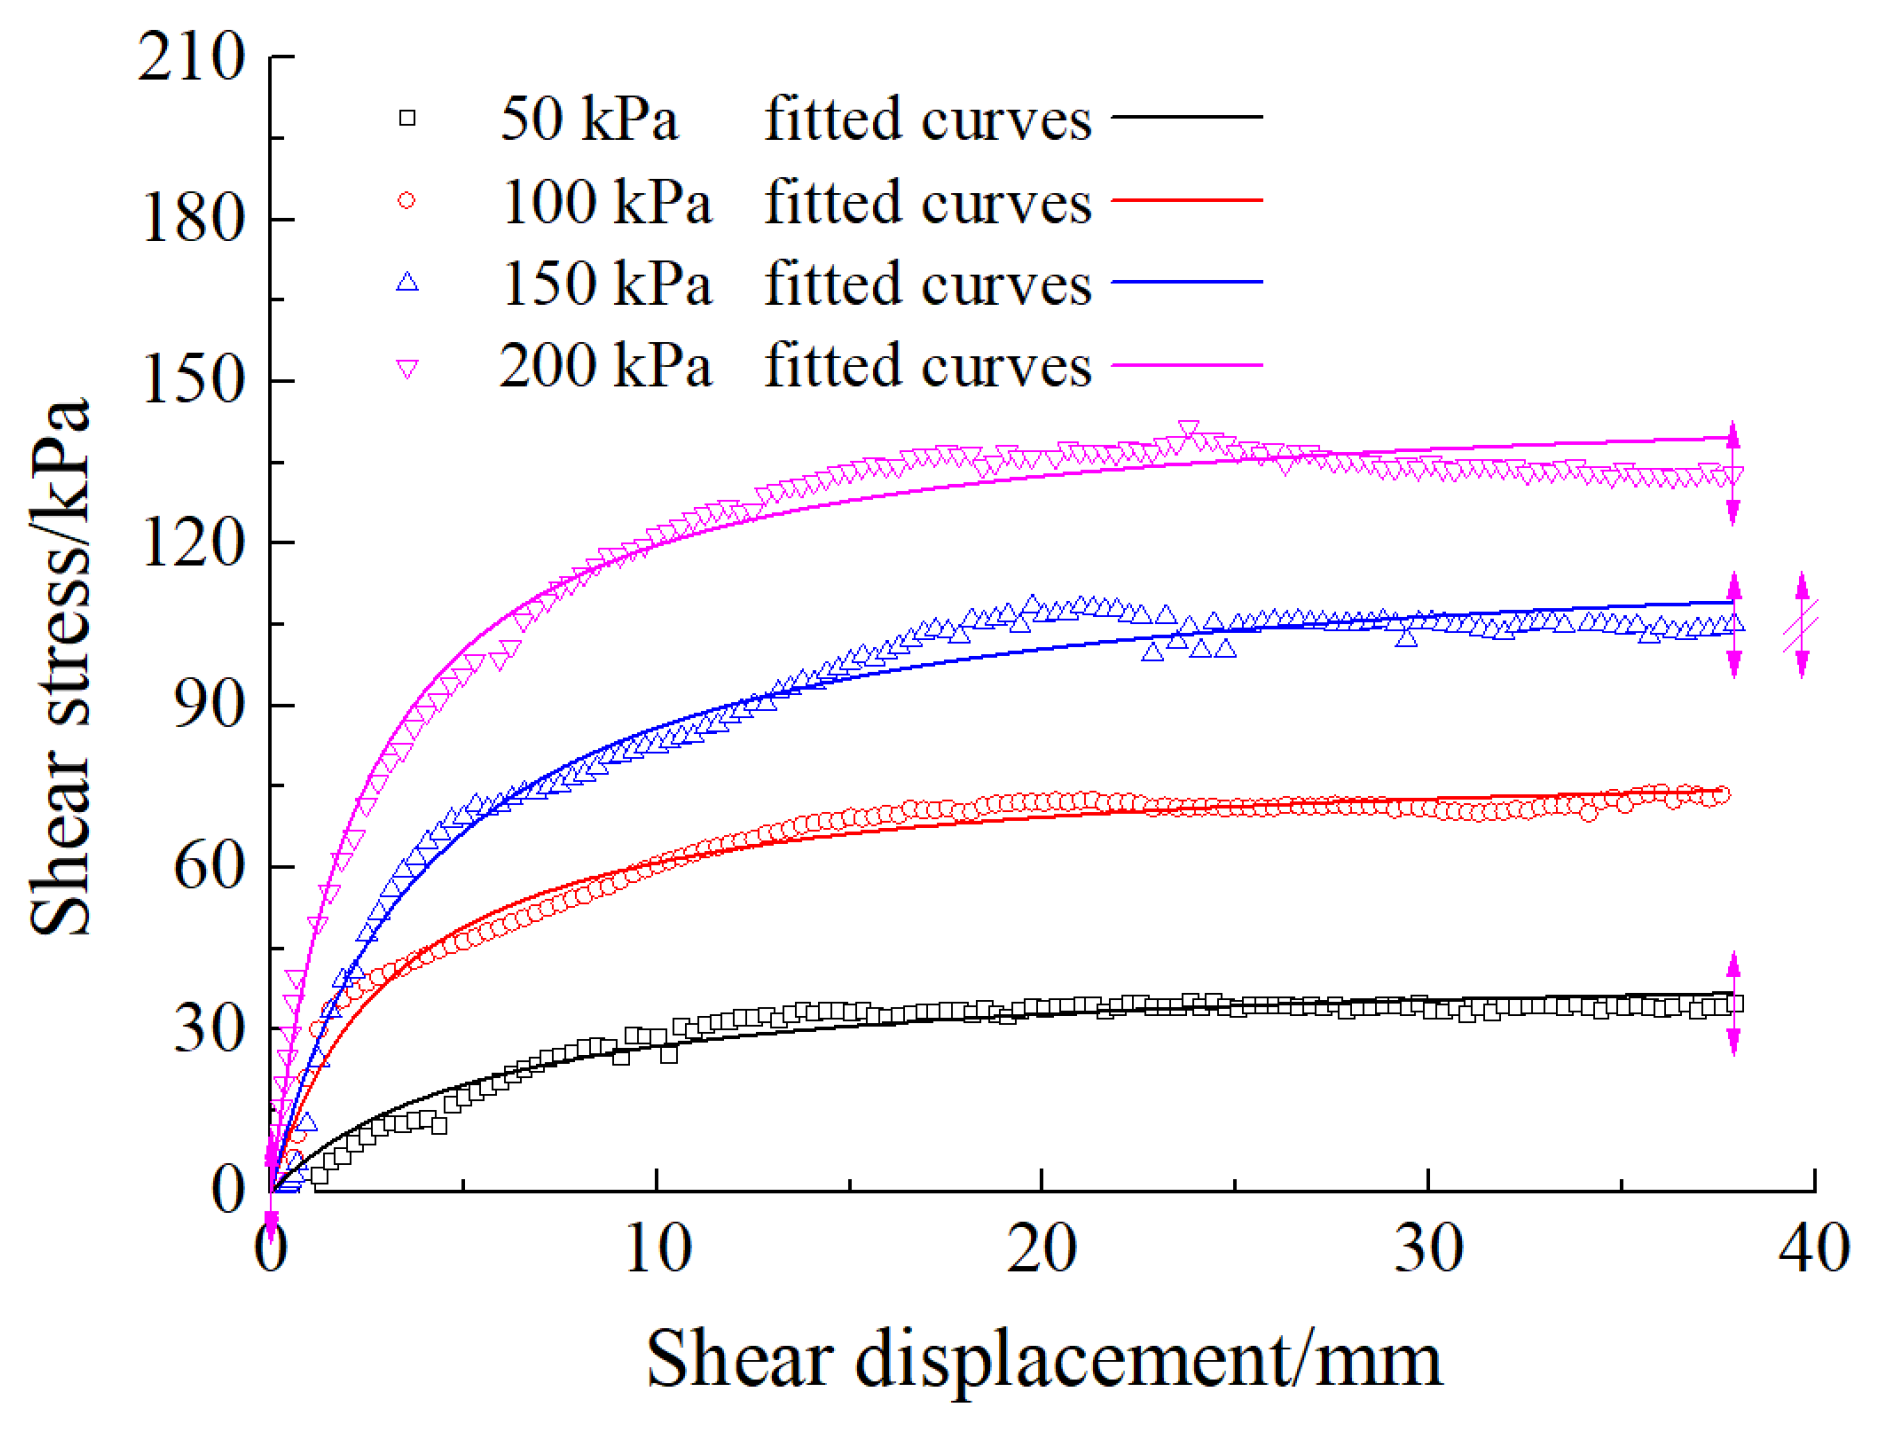
- The hyperbolic constitutive model proposed by Clough and Duncan was used to regress the relation between the shear stress and shear displacement of the corroded concrete-sand inteface. Parameters a and b in the hyperbolic constitutive model were achieved by fitting the test data.
- (5)
- The friction angle of the interface and the surface fractal dimension of the concrete plate containing crushed gravel and marble sand were smaller that that of the concrete plate containing crushed gravel and river sand.
Author Contributions
Funding
Institutional Review Board Statement
Informed Consent Statement
Data Availability Statement
Acknowledgments
Conflicts of Interest
Nomenclature
| LVDTs | linear variable different transformers |
| the maximum density of the sand | |
| the minimum density of the sand | |
| the maximum void ratio of the sand | |
| the minimum void ratio of the sand | |
| the coefficient of uniformity of the sand | |
| the coefficient of curvature of the sand | |
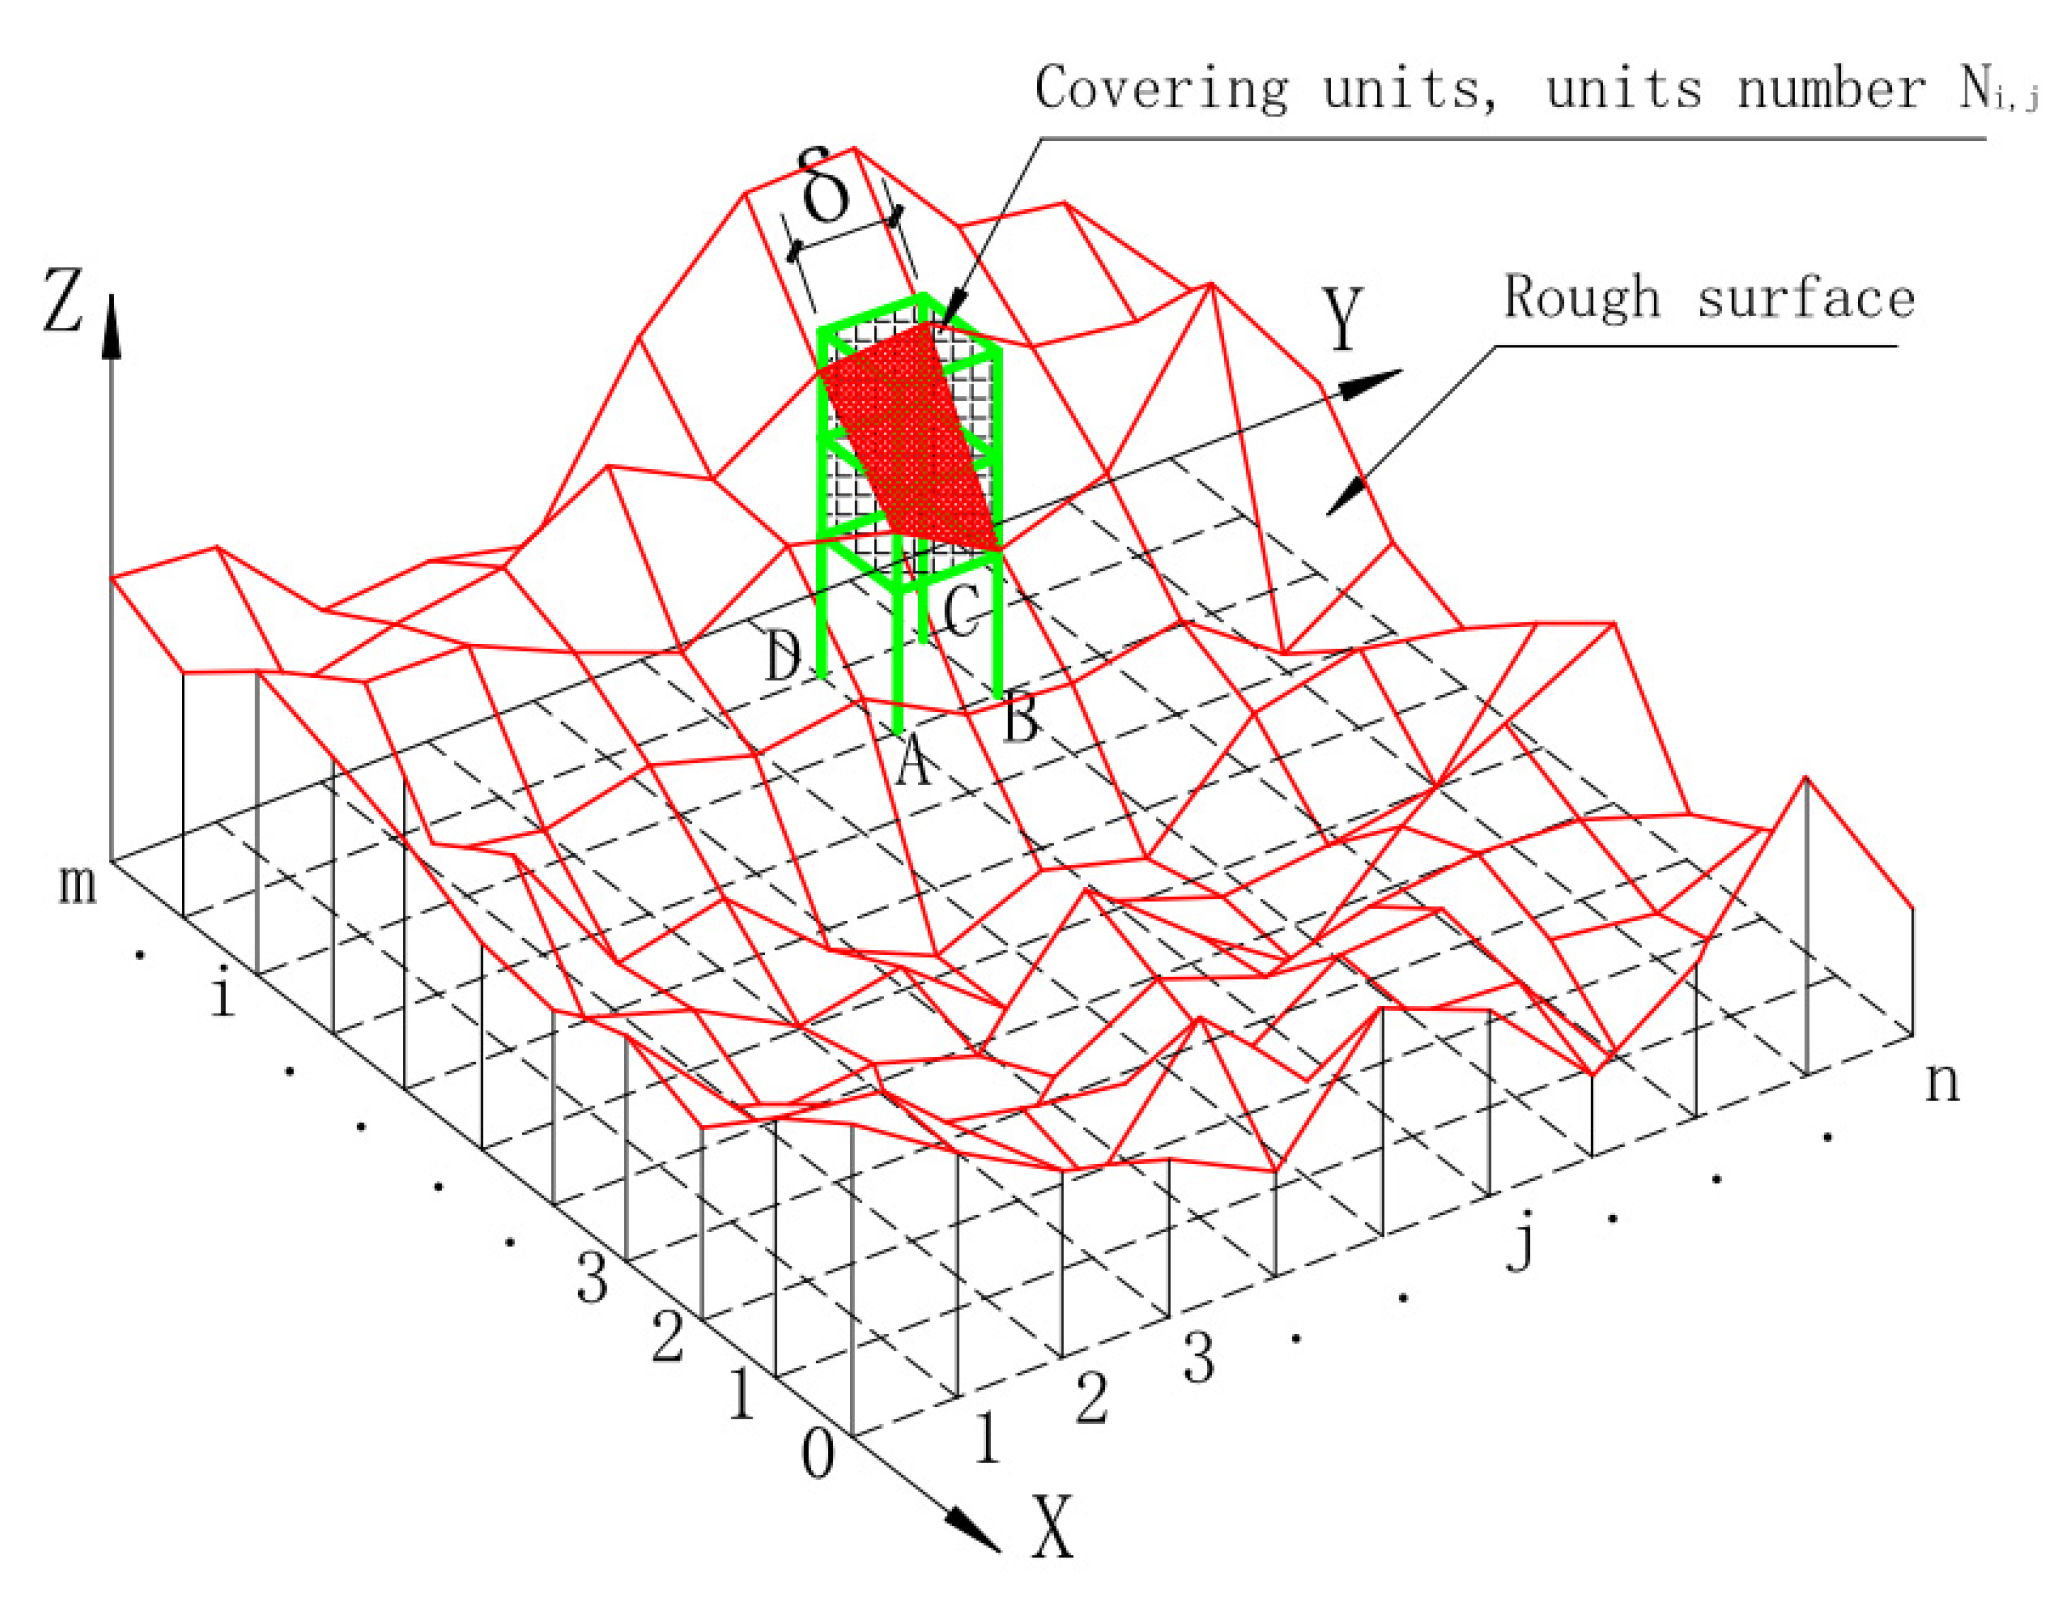
| h(i, j), h(i + 1, j), h(i, j + 1) and h(i + 1, j + 1) (where 1 ≤ i ≤ n − 1, 1 ≤ j ≤ m − 1) | the four corners of the square grid ABCD correspond to four altitudes of the rough sur-face of corroded concrete plate |
| n | the total sampling points of the rough surface along the x-axis directions |
| m | the total sampling points of the rough surface along the y-axis directions |
| when its side length is , the number of cubes required to cover the rough surface in the ABCD grid area | |
| when its side length is , the number of cubes required to cover the total rough surface | |
| D | the fractal dimension of the concrete irregular surface |
| the interface shear stress | |
| the shear displacement between corroded concrete and sand | |
| a and b | parameters obtained by fitting the test data of the shear stress and shear displacement |
| the ultimate shear stress | |
| the initial shear stiffness | |
| the ultimate strain | |
| a and b | regression parameters in the constitutive relation proposed by Guo |
| the displacement at peak stress | |
| cohesive | |
| friction angle | |
| normal stress | |
| Sa | the average surface roughness evaluated over the complete 3D surface |
References
- Yuan, B.X.; Li, Z.H.; Zhao, Z.Q.; Ni, H.; Su, Z.L.; Li, Z.J. Experimental study of displacement field of layered soils surrounding laterally loaded pile based on transparent soil. J. Soils Sediments 2021, 21, 3072–3083. [Google Scholar] [CrossRef]
- Yuan, B.X.; Li, Z.H.; Su, Z.L.; Luo, Q.Z.; Chen, M.J.; Zhao, Z.Q. Sensitivity of Multistage Fill Slope Based on Finite Element Model. Adv. Civ. Eng. 2021, 2021, 6622936. [Google Scholar] [CrossRef]
- Yuan, B.X.; Li, Z.H.; Chen, Y.M.; Ni, H.; Zhao, Z.Q.; Chen, W.J.; Zhao, J. Mechanical and microstructural properties of recycling granite residual soil reinforced with glass fiber and liquid-modified polyvinyl alcohol polymer. Chemosphere 2022, 286, 131652. [Google Scholar] [CrossRef]
- Boulon, M. Basic features of soil structure interface behaviour. Comput. Geotech. 1989, 7, 115–131. [Google Scholar] [CrossRef]
- Hu, L.M.; Pu, J.L. Testing and modeling of soil-structure interface. J. Geotech. Geoenviron. Eng. 2004, 130, 851–860. [Google Scholar] [CrossRef]
- Martinez, A.; Frost, J.D. The influence of surface roughness form on the strength of sand-structure interfaces. Geotech. Lett. 2017, 7, 104–111. [Google Scholar] [CrossRef]
- DeJong, J.T.; Westgate, Z.J. Role of Initial State, Material Properties, and Confinement Condition on Local and Global Soil-Structure Interface Behavior. J. Geotech. Geoenviron. Eng. 2009, 135, 1646–1660. [Google Scholar] [CrossRef]
- Feligha, M.; Hammoud, F.; Belachia, M.; Nouaouria, M.S. Experimental Investigation of Frictional Behavior Between Cohesive Soils and Solid Materials Using Direct Shear Apparatus. Geotech. Geol. Eng. 2016, 34, 567–578. [Google Scholar] [CrossRef]
- Huang, W.X.; Bauer, E.; Sloan, S.W. Behaviour of interfacial layer along granular soil-structure interfaces. Struct. Eng. Mech. 2003, 15, 315–329. [Google Scholar] [CrossRef] [Green Version]
- Jeong, S.W.; Park, S.S. Effect of the Surface Roughness on the Shear Strength of Granular Materials in Ring Shear Tests. Appl. Sci. 2019, 9, 2977. [Google Scholar] [CrossRef] [Green Version]
- Lei, W.; Mj, A.; Sz, D.; St, E.; Xiao, L.A. Investigation of microstructure of C-S-H and micro-mechanics of cement pastes under NH 4 NO 3 dissolution by 29 Si MAS NMR and microhardness. Measurement 2021, 185, 110019. [Google Scholar] [CrossRef]
- Wang, L.; Guo, F.X.; Lin, Y.Q.; Yang, H.M.; Tang, S.W. Comparison between the effects of phosphorous slag and fly ash on the C-S-H structure, long-term hydration heat and volume deformation of cement-based materials. Constr. Build. Mater. 2020, 250, 118807. [Google Scholar] [CrossRef]
- Wang, L.; Li, G.; Li, X.; Guo, F.; Tang, S.; Lu, X.; Haniff, A. Influence of reactivity and dosage of MgO expansive agent on shrinkage and crack resistance of face slab concrete. Cem. Concr. Compos. 2022, 126, 104333. [Google Scholar] [CrossRef]
- Wang, L.; Zeng, X.; Yang, H.; Lv, X.; Guo, F.; Shi, Y.; Hanif, A. Investigation and Application of Fractal Theory in Cement-Based Materials: A Review. Fractal Fract. 2021, 5, 247. [Google Scholar] [CrossRef]
- Lam, L.; Huang, L.; Xie, J.-H.; Chen, J.-F. Compressive behavior of ultra-high performance concrete confined with FRP. Compos. Struct. 2021, 274, 114321. [Google Scholar] [CrossRef]
- Gomez, J.E.; Fiz, G.M.; Ebeling, R.M.; Dove, J.E. Sand-to-concrete interface response to complex load paths in a large displacement shear box. Geotech. Test. J. 2008, 31, 358–369. [Google Scholar]
- Clough, G.W.; Duncan, J.M. Finite Element Analyses of Retaining Wall Behavior. J. Soil Mech. Found. Div. 1971, 97, 1657–1673. [Google Scholar] [CrossRef]
- Desai, C.S.; Drumm, C.E.; Zaman, M.M. Cyclic testing and modeling of interfaces. ASCE J. Geotech. Eng. 1985, 111, 793–815. [Google Scholar] [CrossRef]
- Evgin, E.; Fakharian, K. Effect of stress paths on the behaviour of sand-steel interfaces. Can. Geotech. J. 1996, 33, 853–865. [Google Scholar] [CrossRef]
- Wu, Y.; Zhao, C.; Zhao, C.; Wang, Y.; Fei, Y. Effect of grout conditions on the mechanical behaviors of unloading sand-concrete interface for reinforcing bored pile foundation. Constr. Build. Mater. 2020, 243, 118218. [Google Scholar] [CrossRef]
- Potyondy, J.G.; Potyondy, J.G. Skin friction between various soils and construction materials. Géotechnique 1961, 11, 339–353. [Google Scholar] [CrossRef]
- Uesugi, M.; Kishida, H.; Tsubakihara, Y. Behavior of sand particles in sand-steel friction. Soils Found. 1988, 28, 107–118. [Google Scholar] [CrossRef] [Green Version]
- Sharma, M.; Samanta, M.; Sarkar, S. A study on interface shear behaviour of soil nails from pullout and direct shear tests. Int. J. Phys. Model. Geotech. 2020, 20, 24–37. [Google Scholar] [CrossRef]
- Taha, A.; Fall, M. Shear Behavior of Sensitive Marine Clay-Concrete Interfaces. J. Geotech. Geoenviron. Eng. 2013, 139, 644–650. [Google Scholar] [CrossRef]
- Qian, J.G.; Gao, Q.; Xue, J.F.; Chen, H.W.; Huang, M.S. Soil and ribbed concrete slab interface modeling using large shear box and 3D FEM. Geomech. Eng. 2017, 12, 295–312. [Google Scholar] [CrossRef]
- Kou, H.L.; Diao, W.Z.; Zhang, W.C.; Zheng, J.B.; Ni, P.P.; Jang, B.A.; Wu, C.Z. Experimental Study of Interface Shearing between Calcareous Sand and Steel Plate Considering Surface Roughness and Particle Size. Appl. Ocean Res. 2021, 107, 102490. [Google Scholar] [CrossRef]
- Zhao, C.F.; Wu, Y.; Zhao, C.; Tao, G.X. Experimental Research on the Clay-Concrete Interface Shear Behaviors Considering the Roughness and Unloading Effect. In Proceedings of the GeoShanghai 2018 International Conference, Shanghai, China, 27–30 May 2018; pp. 522–530. [Google Scholar]
- Zhao, C.; Zhang, R.; Zhao, C.F.; Wang, W.D.; Wang, Y.B. A Three-Dimensional Evaluation of Interface Shear Behavior between Granular Material and Rough Surface. J. Test. Eval. 2021, 49, 713–727. [Google Scholar] [CrossRef]
- Zhang, M.Y.; Sang, S.K.; Wang, Y.H.; Bai, X.Y. Factors Influencing the Mechanical Characteristics of a Pile-Soil Interface in Clay Soil. Front. Earth Sci. 2020, 7, 11. [Google Scholar] [CrossRef]
- Li, Y.H.; Lv, M.F.; Guo, Y.C.; Huang, M.S. Effects of the soil water content and relative roughness on the shear strength of silt and steel plate interface. Measurement 2021, 174, 109003. [Google Scholar] [CrossRef]
- Su, L.J.; Zhou, W.H.; Chen, W.B.; Jie, X.X. Effects of relative roughness and mean particle size on the shear strength of sand-steel interface. Measurement 2018, 122, 339–346. [Google Scholar] [CrossRef]
- Chu, L.-M.; Yin, J. Study on soil–cement grout interface shear strength of soil nailing by direct shear box testing method. Geomech. Geoeng. Int. J. 2006, 1, 259–273. [Google Scholar] [CrossRef]
- Wang, X.; Wang, X.Z.; Zhu, C.Q.; Meng, Q.S. Shear tests of interfaces between calcareous sand and steel. Mar. Georesour. Geotechnol. 2019, 37, 1095–1104. [Google Scholar] [CrossRef]
- Chen, X.B.; Zhang, J.S.; Xiao, Y.J.; Li, J. Effect of roughness on shear behavior of red clay—Concrete interface in large-scale direct shear tests. Can. Geotech. J. 2015, 52, 1122–1135. [Google Scholar] [CrossRef]
- Sengoz, B.; Topal, A.; Tanyel, S. Comparison of pavement surface texture determination by sand patch test and 3D laser scanning. Period. Polytech. Civ. Eng. 2012, 45, 73–78. [Google Scholar] [CrossRef]
- Courard, L.; Nelis, M. Surface analysis of mineral substrates for repair works: Roughness evaluation by profilometry and surfometry analysis. Mag. Concr. Res. 2003, 55, 355–366. [Google Scholar] [CrossRef]
- Zhang, W.; Zhou, B.; Gu, X.; Dai, H. Probability distribution model for cross-sectional area of corroded reinforcing steel bars. J. Mater. Civ. Eng. 2013, 26, 822–832. [Google Scholar] [CrossRef]
- Kim, M.K.; Sohn, H.; Chang, C.C. Active Dimensional Quality Assessment of Precast Concrete Using 3D Laser Scanning. Am. Soc. Civ. Eng. 2014, 2013, 622–628. [Google Scholar]
- Dove, J.E.; Frost, J.D. Peak friction behavior of smooth geomembrane-particle interfaces. J. Geotech. Geoenviron. Eng. 1999, 125, 544–555. [Google Scholar] [CrossRef]
- Yoshimi, Y.; Kishida, T. A Ring Torsion Apparatus for Evaluating Friction Between Soil and Metal Surfaces. Geotech. Test. J. 1981, 4, 145–152. [Google Scholar] [CrossRef]
- Uesugi, M.; Kishida, H. Frictional resistance at yield between dry sand and mild steel. Soils Found. 1986, 26, 139–149. [Google Scholar] [CrossRef] [Green Version]
- Chen, W.B.; Zhou, W.H.; Sadowski, L.; Yin, Z.Y. Metaheuristic model for the interface shear strength between granular soil and structure considering surface morphology. Comput. Geotech. 2021, 135, 104141. [Google Scholar] [CrossRef]
- Wang, L.; Luo, R.Y.; Zhang, W.; Jin, M.M.; Tang, S.W. Effects of fineness and content of phosphorus slag on cement hydration, permeability, pore structure and fractal dimension of concrete. Fractals-Complex Geom. Patterns Scaling Nat. Soc. 2021, 29, 2140004. [Google Scholar] [CrossRef]
- Wang, L.; Guo, F.X.; Yang, H.M.; Wang, Y.; Tang, S.W. Comparison of fly ash, PVA fiber, MgO and shrinkage-reducing admixture on the frost resistance of face slab concrete via pore structural and fractal analysis. Fractals-Complex Geom. Patterns Scaling Nat. Soc. 2021, 29, 2140002. [Google Scholar] [CrossRef]
- Wang, L.; Jin, M.M.; Guo, F.X.; Wang, Y.; Tang, S.W. Pore structural and fractal analysis of the influence of fly ash and silica fume on the mechanical property and abrasion resistance of concrete. Fractals-Complex Geom. Patterns Scaling Nat. Soc. 2021, 29, 2140003. [Google Scholar] [CrossRef]
- Huang, J.; Li, W.; Huang, D.; Wang, L.; Chen, E.; Wu, C.; Wang, B.; Deng, H.; Tang, S.; Shi, Y.; et al. Fractal Analysis on Pore Structure and Hydration of Magnesium Oxysulfate Cements by First Principle, Thermodynamic and Microstructure-Based Methods. Fractal Fract. 2021, 5, 164. [Google Scholar] [CrossRef]
- Lin, N.; Guo, J.; Xie, F.; Zou, J.; Tian, W.; Yao, X.; Zhang, H.; Tang, B. Comparison of surface fractal dimensions of chromizing coating and P110 steel for corrosion resistance estimation. Appl. Surf. Sci. 2014, 311, 330–338. [Google Scholar] [CrossRef]
- Liang, C.; Zhang, W. Fractal characteristic of pits distribution on 304 stainless steel corroded surface and its application in corrosion diagnosis. J. Wuhan Univ. Technol. Mater. Sci. Ed. 2007, 22, 389–393. [Google Scholar] [CrossRef]
- Chen, X.; Zhou, J.; Ding, N. Fractal characterization of pore system evolution in cementitious materials. KSCE J. Mater. Civ. Eng. 2015, 19, 719–724. [Google Scholar] [CrossRef]
- Xie, H.; Wang, J.; Xie, W. Fractal effects of surface roughness on the mechanical behavior of rock joints. Chaos Soliton Fractals 1997, 8, 221–252. [Google Scholar] [CrossRef]
- Zhou, H.; Xie, H. Direct estimation of the fractal dimensions of a fracture surface of rock. Surf. Rev. Lett. 2003, 10, 751–762. [Google Scholar] [CrossRef]
- Xu, Y.D.; Qian, C.X. Fractal characterization of corroded surface profile in reinforcing steel bars. Adv. Mater. Res. 2011, 163–167, 3118–3121. [Google Scholar] [CrossRef]
- Wang, L.; He, T.S.; Zhou, Y.X.; Tang, S.W.; Tan, J.J.; Liu, Z.T.; Su, J.W. The influence of fiber type and length on the cracking resistance, durability and pore structure of face slab concrete. Constr. Build. Mater. 2021, 282, 122706. [Google Scholar] [CrossRef]
- Li, L.G.; Feng, J.J.; Zhu, J.; Chu, S.H.; Kwan, A.K.H. Pervious concrete: Effects of porosity on permeability and strength. Mag. Concr. Res. 2021, 73, 69–79. [Google Scholar] [CrossRef]
- Huang, B.T.; Wu, J.Q.; Yu, J.; Dai, J.G.; Leung, C.K.Y.; Li, V.C. Seawater sea-sand engineered/strain-hardening cementitious composites (ECC/SHCC): Assessment and modeling of crack characteristics. Cem. Concr. Res. 2021, 140, 106292. [Google Scholar] [CrossRef]
- Zhou, J.Y.; Sun, Z.; Wei, B.; Zhang, L.W.; Zeng, P. Deflection-based multilevel structural condition assessment of long-span prestressed concrete girder bridges using a connected pipe system. Measurement 2021, 169, 108352. [Google Scholar] [CrossRef]
- Zhou, J.Y.; Caprani, C.C.; Zhang, L.W. On the structural safety of long-span bridges under traffic loadings caused by maintenance works. Eng. Struct. 2021, 240, 112407. [Google Scholar] [CrossRef]
- Zou, R.; Liu, F.; Xiong, Z.; He, S.H.; Li, L.J.; Wei, W.; Xiong, Z.; Lin, L.; Qiao, S.; Li, L.; et al. Axial performance of seawater sea-sand concrete columns reinforced with basalt fibre-reinforced polymer bars under concentric compressive load. J. Build. Eng. 2022, 47, 103828. [Google Scholar] [CrossRef]
- Qu, F.; Li, W.; Wang, K.J.; Tam, V.W.Y.; Zhang, S.S. Effects of seawater and undesalted sea sand on the hydration products, mechanical properties and microstructures of cement mortar. Constr. Build. Mater. 2021, 310, 125229. [Google Scholar] [CrossRef]
- Luo, Z.; Li, W.; Wang, K.; Shah, S.P.; Sheng, D. Nano/micromechanical characterisation and image analysis on the properties and heterogeneity of ITZs in geopolymer concrete. Cem. Concr. Res. 2022, 152, 106677. [Google Scholar] [CrossRef]
- Dong, W.; Li, W.; Guo, Y.; Qu, F.; Wang, K.; Sheng, D. Piezoresistive performance of hydrophobic cement-based sensors under moisture and chloride-rich environments. Cem. Concr. Compos. 2022, 126, 104379. [Google Scholar] [CrossRef]
- Yu, K.Q.; McGee, W.; Ng, T.Y.; Zhu, H.; Li, V.C. 3D-printable engineered cementitious composites (3DP-ECC): Fresh and hardened properties. Cem. Concr. Res. 2021, 143, 106388. [Google Scholar] [CrossRef]
- Cai, Z.W.; Liu, F.C.; Yu, J.T.; Yu, K.Q.; Tian, L.K. Development of ultra-high ductility engineered cementitious composites as a novel and resilient fireproof coating. Constr. Build. Mater. 2021, 288, 123090. [Google Scholar] [CrossRef]
- Ding, Y.; Yu, K.; Li, M. A review on high-strength engineered cementitious composites (HS-ECC): Design, mechanical property and structural application. Structures 2022, 35, 903–921. [Google Scholar] [CrossRef]
- Xiao, J.; Long, X.; Qu, W.J.; Li, L.; Jiang, H.B.; Zhong, Z.C. Influence of sulfuric acid corrosion on concrete stress-strain relationship under uniaxial compression. Measurement 2022, 187, 110318. [Google Scholar] [CrossRef]
- Chandra, A.P.; Gerson, A.R. The mechanisms of pyrite oxidation and leaching: A fundamental perspective. Surf. Sci. Rep. 2010, 65, 293–315. [Google Scholar] [CrossRef]
- Fan, Y.; Hu, Z.; Zhang, Y.; Liu, J. Deterioration of compressive property of concrete under simulated acid rain environment. Constr. Build. Mater. 2010, 24, 1975–1983. [Google Scholar] [CrossRef]
- Xie, S.; Qi, L.; Zhou, D. Investigation of the effects of acid rain on the deterioration of cement concrete using accelerated tests established in laboratory. Atmos. Environ. 2004, 38, 4457–4466. [Google Scholar] [CrossRef]
- Li, X.; Lin, X.; Lin, K.; Ji, T. Study on the degradation mechanism of sulphoaluminate cement sea sand concrete eroded by biological sulfuric acid. Constr. Build. Mater. 2017, 157, 331–336. [Google Scholar] [CrossRef]
- O’Connell, M.; McNally, C.; Richardson, M.G. Performance of concrete incorporating GGBS in aggressive wastewater environments. Constr. Build. Mater. 2012, 27, 368–374. [Google Scholar] [CrossRef]
- Chang, Z.T.; Song, X.J.; Munn, R.; Marosszeky, M. Using limestone aggregates and different cements for enhancing resistance of concrete to sulphuric acid attack. Cem. Concr. Res. 2005, 35, 1486–1494. [Google Scholar] [CrossRef]
- De Belie, N.; Monteny, J.; Beeldens, A.; Vincke, E.; Van Gemert, D.; Verstraete, W. Experimental research and prediction of the effect of chemical and biogenic sulfuric acid on different types of commercially produced concrete sewer pipes. Cem. Concr. Res. 2004, 34, 2223–2236. [Google Scholar] [CrossRef]
- Hughes, B.P.; Guest, J.E. Limestone and siliceous aggregate concretes subjected to sulphuric acid attack. Mag. Concr. Res. 1978, 30, 11–18. [Google Scholar] [CrossRef]
- Xiao, J.; Qu, W.J.; Jiang, H.B.; Li, L.; Huang, J.; Chen, L. Fractal characterization and mechanical behavior of pile-soil interface subjected to sulfuric acid. Fractals-Complex Geom. Patterns Scaling Nat. Soc. 2021, 29, 2140010. [Google Scholar] [CrossRef]
- Mahmoodian, M.; Alani, A.M. Effect of Temperature and Acidity of Sulfuric Acid on Concrete Properties. J. Mater. Civ. Eng. 2017, 29, 04017154. [Google Scholar] [CrossRef] [Green Version]
- ISO-ISO16610-21; 2011-Geometrical Product Specifications (Gps)—Filtration—Part 21: Linear Profile Filters: Gaussian Filters. ISO: Geneva, Switzerland, 2011. Available online: https://www.iso.org/standard/50176.html (accessed on 1 December 2021).
- Macek, W. Correlation between Fractal Dimension and Areal Surface Parameters for Fracture Analysis after Bending-Torsion Fatigue. Metals 2021, 11, 1790. [Google Scholar] [CrossRef]
- Zhao, Z.H.; Lv, X.Z.; Wang, W.M.; Tan, Y.L. Damage evolution of bi-body model composed of weakly cemented soft rock and coal considering different interface effect. Springerplus 2016, 5, 19. [Google Scholar] [CrossRef] [Green Version]
- Yin, Z.Z.; Zhu, H.; Xu, G.H. A study of deformation in the interface between soil and concrete. Comput. Geotech. 1995, 17, 75–92. [Google Scholar]
- Gao, H.H.; Ma, B.J.; Singh, R.P.; Yang, H. Areal Surface Roughness of AZ31B Magnesium Alloy Processed by Dry Face Turning: An Experimental Framework Combined with Regression Analysis. Materials 2020, 13, 2303. [Google Scholar] [CrossRef] [PubMed]


| Shear Box Net Size/mm | Maximum Load/kN | Maximum Displacement/mm | Shear Rate/(mm/min) | Accuracy in Measurement/% | ||
|---|---|---|---|---|---|---|
| Normal Direction | Tangential Direction | Normal Direction | Tangential Direction | |||
| 600 × 400 × 200 | 200 | 200 | 50 | 150 | 0.1–50 | 0.5 |
| Specific Gravity | Water Content/% | Density/g/cm3 | Void Ratio | Coefficient of Uniformity | Coefficient of Curvature | ||
|---|---|---|---|---|---|---|---|
| 2.58 | 0.04 | 1.726 | 1.453 | 0.776 | 0.495 | 2.78 | 1.00 |
| Measurement depth | ±50 mm |
| Line width | up to 125 mm |
| Mean working distance | 150 mm |
| Line frequency | up to 330 Hz |
| Data acquisition rate | 210,000 points/second |
| Weight | 1100 g |
| Sensor dimensions (incl. handle and IR pins) | 300 × 170 × 150 mm |
| Cable length | 10 m |
| Mean point distance | 0.075 mm |
| Laser class (IEC 60825-1:2014) | Class 2M (eye-safe) |
| Test Plan | Corrosion Time/Days | Normal Stress /kPa | Direct Interface Shear Experimental Results | Fitting Parameters | ||||||
|---|---|---|---|---|---|---|---|---|---|---|
| Peak Stress /kPa | Displacement at Peak Stress /mm | Cohesive /kPa | Friction Angle /° | |||||||
| Direct shear test for sand and concrete specimens immersed in sulfuric acid for different days | 0 | 50 | 32.79 | 6.57 | 3.39 | 30.87 | 0.996 | 0.0197 | 0.0303 | 0.997 |
| 100 | 66.88 | 13.25 | 0.0170 | 0.0149 | 0.996 | |||||
| 150 | 96.15 | 11.97 | 0.0126 | 0.0103 | 0.997 | |||||
| 200 | 122.58 | 12.82 | 0.0121 | 0.0080 | 0.994 | |||||
| 31 | 50 | 35.33 | 8.79 | 4.09 | 34.65 | 0.995 | 0.0622 | 0.0269 | 0.936 | |
| 100 | 82.07 | 20.05 | 0.0252 | 0.0126 | 0.957 | |||||
| 150 | 110.16 | 18.63 | 0.0845 | 0.0065 | 0.952 | |||||
| 200 | 147.10 | 18.78 | 0.0399 | 0.0057 | 0.955 | |||||
| 93 | 50 | 37.28 | 15.30 | 1.43 | 35.27 | 0.999 | 0.1337 | 0.0237 | 0.962 | |
| 100 | 75.36 | 16.78 | 0.0399 | 0.0124 | 0.980 | |||||
| 150 | 110.25 | 18.30 | 0.0338 | 0.0083 | 0.980 | |||||
| 200 | 149.61 | 19.17 | 0.0162 | 0.0067 | 0.986 | |||||
| 154 | 50 | 35.34 | 16.90 | 0.243 | 36.44 | 0.991 | 0.0230 | 0.0276 | 0.909 | |
| 100 | 76.58 | 21.88 | 0.0580 | 0.0124 | 0.978 | |||||
| 150 | 107.97 | 22.98 | 0.0478 | 0.0081 | 0.975 | |||||
| 200 | 150.46 | 34.54 | 0.0544 | 0.0052 | 0.964 | |||||
| Direct shear test for the sand itself | 50 | 36.98 | 20.04 | 0.055 | 37.61 | 0.998 | 0.0626 | 0.0250 | 0.996 | |
| 100 | 73.77 | 22.20 | 0.0438 | 0.0121 | 0.998 | |||||
| 150 | 115.87 | 34.03 | 0.0349 | 0.0077 | 0.999 | |||||
| 200 | 151.36 | 33.48 | 0.0231 | 0.0059 | 0.997 | |||||
| Corrosion Time/Days | In This Paper | In the Reference [74] | |
|---|---|---|---|
| Coarse aggregate | Crushed gravel | Crushed gravel | |
| Fine aggregate | Marble sand | River sand | |
| Interface friction angle/° | 0 | 30.87 | 30.87 |
| 31 | 36.02 | 34.65 | |
| 93 | 36.64 | 35.27 | |
| 154 | 37.00 | 36.44 | |
| Surface fractal dimension | 0 | 2.0094 | 2.0094 |
| 31 | 2.1269 | 2.033 | |
| 93 days | 2.1827 | 2.078 | |
| 154 days | 2.192 | 2.134 |
Publisher’s Note: MDPI stays neutral with regard to jurisdictional claims in published maps and institutional affiliations. |
© 2021 by the authors. Licensee MDPI, Basel, Switzerland. This article is an open access article distributed under the terms and conditions of the Creative Commons Attribution (CC BY) license (https://creativecommons.org/licenses/by/4.0/).
Share and Cite
Xiao, J.; Xu, Z.; Murong, Y.; Wang, L.; Lei, B.; Chu, L.; Jiang, H.; Qu, W. Effect of Chemical Composition of Fine Aggregate on the Frictional Behavior of Concrete–Soil Interface under Sulfuric Acid Environment. Fractal Fract. 2022, 6, 22. https://doi.org/10.3390/fractalfract6010022
Xiao J, Xu Z, Murong Y, Wang L, Lei B, Chu L, Jiang H, Qu W. Effect of Chemical Composition of Fine Aggregate on the Frictional Behavior of Concrete–Soil Interface under Sulfuric Acid Environment. Fractal and Fractional. 2022; 6(1):22. https://doi.org/10.3390/fractalfract6010022
Chicago/Turabian StyleXiao, Jie, Zhenming Xu, Yikang Murong, Lei Wang, Bin Lei, Lijing Chu, Haibo Jiang, and Wenjun Qu. 2022. "Effect of Chemical Composition of Fine Aggregate on the Frictional Behavior of Concrete–Soil Interface under Sulfuric Acid Environment" Fractal and Fractional 6, no. 1: 22. https://doi.org/10.3390/fractalfract6010022
APA StyleXiao, J., Xu, Z., Murong, Y., Wang, L., Lei, B., Chu, L., Jiang, H., & Qu, W. (2022). Effect of Chemical Composition of Fine Aggregate on the Frictional Behavior of Concrete–Soil Interface under Sulfuric Acid Environment. Fractal and Fractional, 6(1), 22. https://doi.org/10.3390/fractalfract6010022