1. Introduction
Geopolymer is an inorganic polymer composed of silicon oxide and alumina, which has good mechanical properties [
1]. Similar to cement, it is an alkali-activated gel material. It also has the potential to replace cement because of its acid and alkali resistance, fire resistance, and high temperature resistance. The cement industry is under serious pressure to reduce emissions because of the large amount of carbon dioxide emitted during the preparation of cement. The preparation process of geopolymers is more energy efficient and environmentally friendly, and can also consume industrial waste, such as slag and construction waste. Therefore, geopolymers are sustainable materials with applications in construction materials [
2], high-strength materials [
3], and high-temperature-resistant materials [
4].
However, geopolymer concrete exhibits a high brittleness, which is a serious drawback [
5]. In order to improve the mechanical properties of brittle materials, various types of fiber-reinforced geopolymer concrete have received extensive attention [
6,
7,
8,
9,
10,
11]. The fibers are added to the geopolymer not only to stop crack expansion, but also to bridge the cracks. Korniejenko et al. reviewed the mechanical performance of polypropylene (PP), polyethylene, and polylactic acid fiber-reinforced geopolymer [
12]. The review showed that the PP fiber significantly improves the bending strength of the geopolymer composite. Among the various types of fibers, PP fiber is the most commonly used for thermal insulation purposes and as lightweight materials. Other reasons for the greater usage of PP fibers in geopolymer concrete also include economical advantages and an excellent resistance to environmental aggressiveness. Alomayri et al. described the synthesis and mechanical properties of cotton fiber-reinforced geopolymer composites [
13]. The experimental results showed that composites containing up to 0.5 wt.% cotton fibers were optimally enhanced in terms of its stiffness, compressive strength, and impact resistance. However, a further increase in the cotton fiber content will lead to fiber agglomeration, an increase in viscosity and the formation of voids, resulting in a decline in mechanical properties. He et al. investigated the effect of high-temperature heat treatment on the mechanical properties of carbon fiber-reinforced geopolymer composites [
14]. The experiments showed that the mechanical properties of the composites were substantially improved when they were heat-treated in the temperature range of 1100 °C to 1300 °C. The mechanical properties of the composites heat-treated at 1400 °C were significantly reduced due to the severe degradation of the carbon fibers and melting of the matrix. Carabba et al. studied the effect of an alkaline environment on the bonding behavior between steel fibers and geopolymer matrices [
15]. The experimental results showed that the lower the molar concentration of the NaOH solution, the better the interfacial bonding behavior between the matrix and the fiber. Bernal et al. investigated the mechanical properties of refractory aluminosilicate particles and fiber-reinforced metakaolin-based polymers after high-temperature treatment [
16]. The experimental results showed that the composites shrink less in the temperature range of 600 °C to 1000 °C and contain a higher content of particles and fibers while maintaining good mechanical strength. Ganesh et al. conducted many experimental studies on the utilization rate of an alkaline solution, slag powder, and glass fiber in geopolymer concrete under different curing conditions [
17]. The experimental results showed that the optimum mass concentration of sodium hydroxide was 13 M, and the optimum utilization of slag was 100% for environmental maintenance and 20% for thermal maintenance. In addition, the energy absorption capacity of geopolymer concrete with glass fiber was significantly improved by approximately 10 times, and the brittleness was significantly reduced. Bhutta et al. investigated the effect of the microfiber type (high-strength steel, scrap steel wool, polyvinyl alcohol, PP, polyester, and carbon) and fiber volume fraction (0.5% and 1.0%) on the physical properties and bending behavior of the geopolymer [
18]. The experimental results showed the least change in workability for high-strength steel fibers and the lowest fluidity for polyester fibers. Polyester fiber-reinforced mortar also has the highest porosity, followed by steel wool and PP. Particularly in steel and polyvinyl alcohol fibers, the bending properties and compressive strength are significantly improved due to microfiber reinforcement. Polyester, steel wool, and carbon fiber-reinforced geopolymer mortars have very poor overall flexural properties.
Various types of fibers can effectively improve the mechanical properties of composite materials. The increased toughness of the geopolymer will change its crack development in the stressed state. Meanwhile, the bridging effect of fibers will change the propagation mode, morphology, fractal, and characteristic parameters of the crack. Guo et al. investigated the effects of different tensile strains and curing conditions on the compressive strength, apparent density, tensile properties, and microcracking characteristics of geopolymers by performing tensile tests [
19]. The experimental results showed that the number and width of the cracks increased with increasing strain. High-temperature curing increases the strength of the geopolymer but reduces the width of the cracks. Khan et al. studied the effect of early shrinkage and tensile creep on the early cracking of geopolymer concrete [
20]. Experimental results showed that thermally cured geopolymer concrete can relieve the stresses caused by confined shrinkage and reduce the risk of early cracking. Xie et al. studied the fracture behavior of geopolymer concrete [
21]. The displacement fields of concrete beams were measured using digital image correction (DIC) to obtain the crack extension lengths and mid-span deflections. Albitar et al. conducted an experimental study on the behavior of geopolymer concrete prisms under uniaxial tension [
22]. The results showed that the expansion of the concrete cross-section will lead to delayed transverse tensile cracking. Mathew et al. discussed the buckling behavior of geopolymer concrete beams with fly ash at high temperatures [
23]. The experimental results showed that the ductility of the geopolymer concrete beams decreases rapidly with the increase in temperature. Finally, they proposed approximate equations to predict the crack width of geopolymer concrete beams after high-ground-temperature treatment. Aravind et al. used machine learning to determine the causes (bending, shear, and compression) of cracks appearing in geopolymer concrete beams [
24]. They claimed that the proposed classifier has a 100% recognition accuracy. The crack extension behavior of geopolymer concrete has received little attention. This may be due to the difficulty of extracting cracks accurately by conventional measurement techniques. With the rapid development of deep learning, it has achieved remarkable results in the field of image processing [
25,
26,
27,
28,
29,
30]. Among them, the semantic segmentation network can be used to extract concrete surface cracks accurately [
31,
32]. The accurately extracted cracks can be used to further calculate various parameters, such as the fractal dimension, area, length, and width. These parameters can be used to quantitatively analyze the cracking characteristics of geopolymer composites. For instance, fractal is an important parameter in the study of construction materials [
33,
34,
35]. It can be used to analyze the distribution of coarse aggregates in construction materials and thus to study the gradation of aggregates. In addition, the distribution pattern of surface cracks on specimens is complex, and fractal can represent the distribution of cracks from a global perspective. However, the crack fractal study depends on the accurate extraction of cracks. Currently, most cracking analyses are unable to measure cracks quickly and accurately for all samples. Therefore, deep learning has a large potential in the study of the cracking characteristics of geopolymers.
In this paper, flexural tests of PP fiber-reinforced geopolymers were carried out, and their cracking and fractal characteristics were specifically investigated. First, deep learning was used to accurately extract the surface cracks of the specimen after the three-point bending experiment. Second, image processing techniques were used to obtain the characteristic parameters of the cracks, such as the length, area, maximum width, median width, and fractal dimension. Then, the relationship between the raw materials (water–binder ratio, fiber aspect ratio, fiber volume fraction) and crack characteristic parameters was quantitatively analyzed. In addition, the quantitative relationships between the mechanical properties of the specimens, such as flexural properties and the characteristic parameters of the cracks, were further analyzed. The quantitative analysis of the cracking and fractal properties can help to explore the factors affecting the mechanical properties of fiber-reinforced geopolymers. It is also important for the analysis of crack development in large scale members during practical applications.
2. Specimen Preparation
Silica fume, fly ash, and slag were bought from the Henan Dingnuo Purification Material Co., Ltd. in Zhengzhou, China, Shaanxi Weihe Power Plant in Xianyang, China and Xi’an Delong Powder Engineering Materials Co. Ltd. in Xi’an, China, respectively. The chemical compositions of mineral materials were tested by X-ray fluorescence (XRF, HORIBA XGT-5200, Shanghai, China), as presented in
Table 1. The alkaline activator with modulus (M = n(SiO
2)/n(Na
2O)) of 1.5 were compounded by sodium silicate and sodium hydroxide. Sodium silicate has molar ratio SiO
2/Na
2O of 3.22, produced by Changlong Water Glass Factory, Gongyi, China. NaOH (analytically pure, Guangdong Guanghua Sci-Tech Co. Ltd., Shantou, China) was employed to adjust the modulus of alkaline activator. The water/binder (w/b) ratio of the fresh geopolymer mortars was set to 0.45 and 0.48, and the alkali content was fixed at 7%. Marketable PP fibers with 6 and 12 mm lengths were also used. Dimensions and mechanical properties of the PP fibers are shown in
Table 2. The river sand came from the Wei River, Yangling, China.
In this research, 26 groups were planned in which two lengths of PP fibers at various volume fractions (0, 0.3, 0.6, 0.9, 1.2, 1.5, and 1.8% by volume of geopolymer mortar) and two values of w/b ratio (0.45 and 0.48) were designed. Two series of geopolymers, specifically the 0.45 series (low w/b ratio) and 0.48 series (high w/b ratio), were measured in this research. All of the mixture proportions are presented in
Table 3. For the group number of A-B-C, A stands for water–binder ratio, B stands for fiber length, and C stands for fiber volume fraction.
Dry raw materials, including slag, fly ash, silica fume, and river sand, were added and mixed for 4 min. Afterwards, the activator and water were added into the mixer and mixed for 3 min. Then, the PP fibers were added manually for 2 min. Finally, another 2 min of mixing was carried out in order to reach a good distribution of PP fiber. After mixing, the fresh mortars were cast in the molds and vibrated for 30 s. The specimens were demolded 24 h after casting and were kept in a standard curing room with 20 ± 2 °C and humidity above 95% until being tested at 28 days. Three-point bending test was performed according to ISO 679:2009 [
36].
3. Crack Parameter Extraction Using Deep Learning
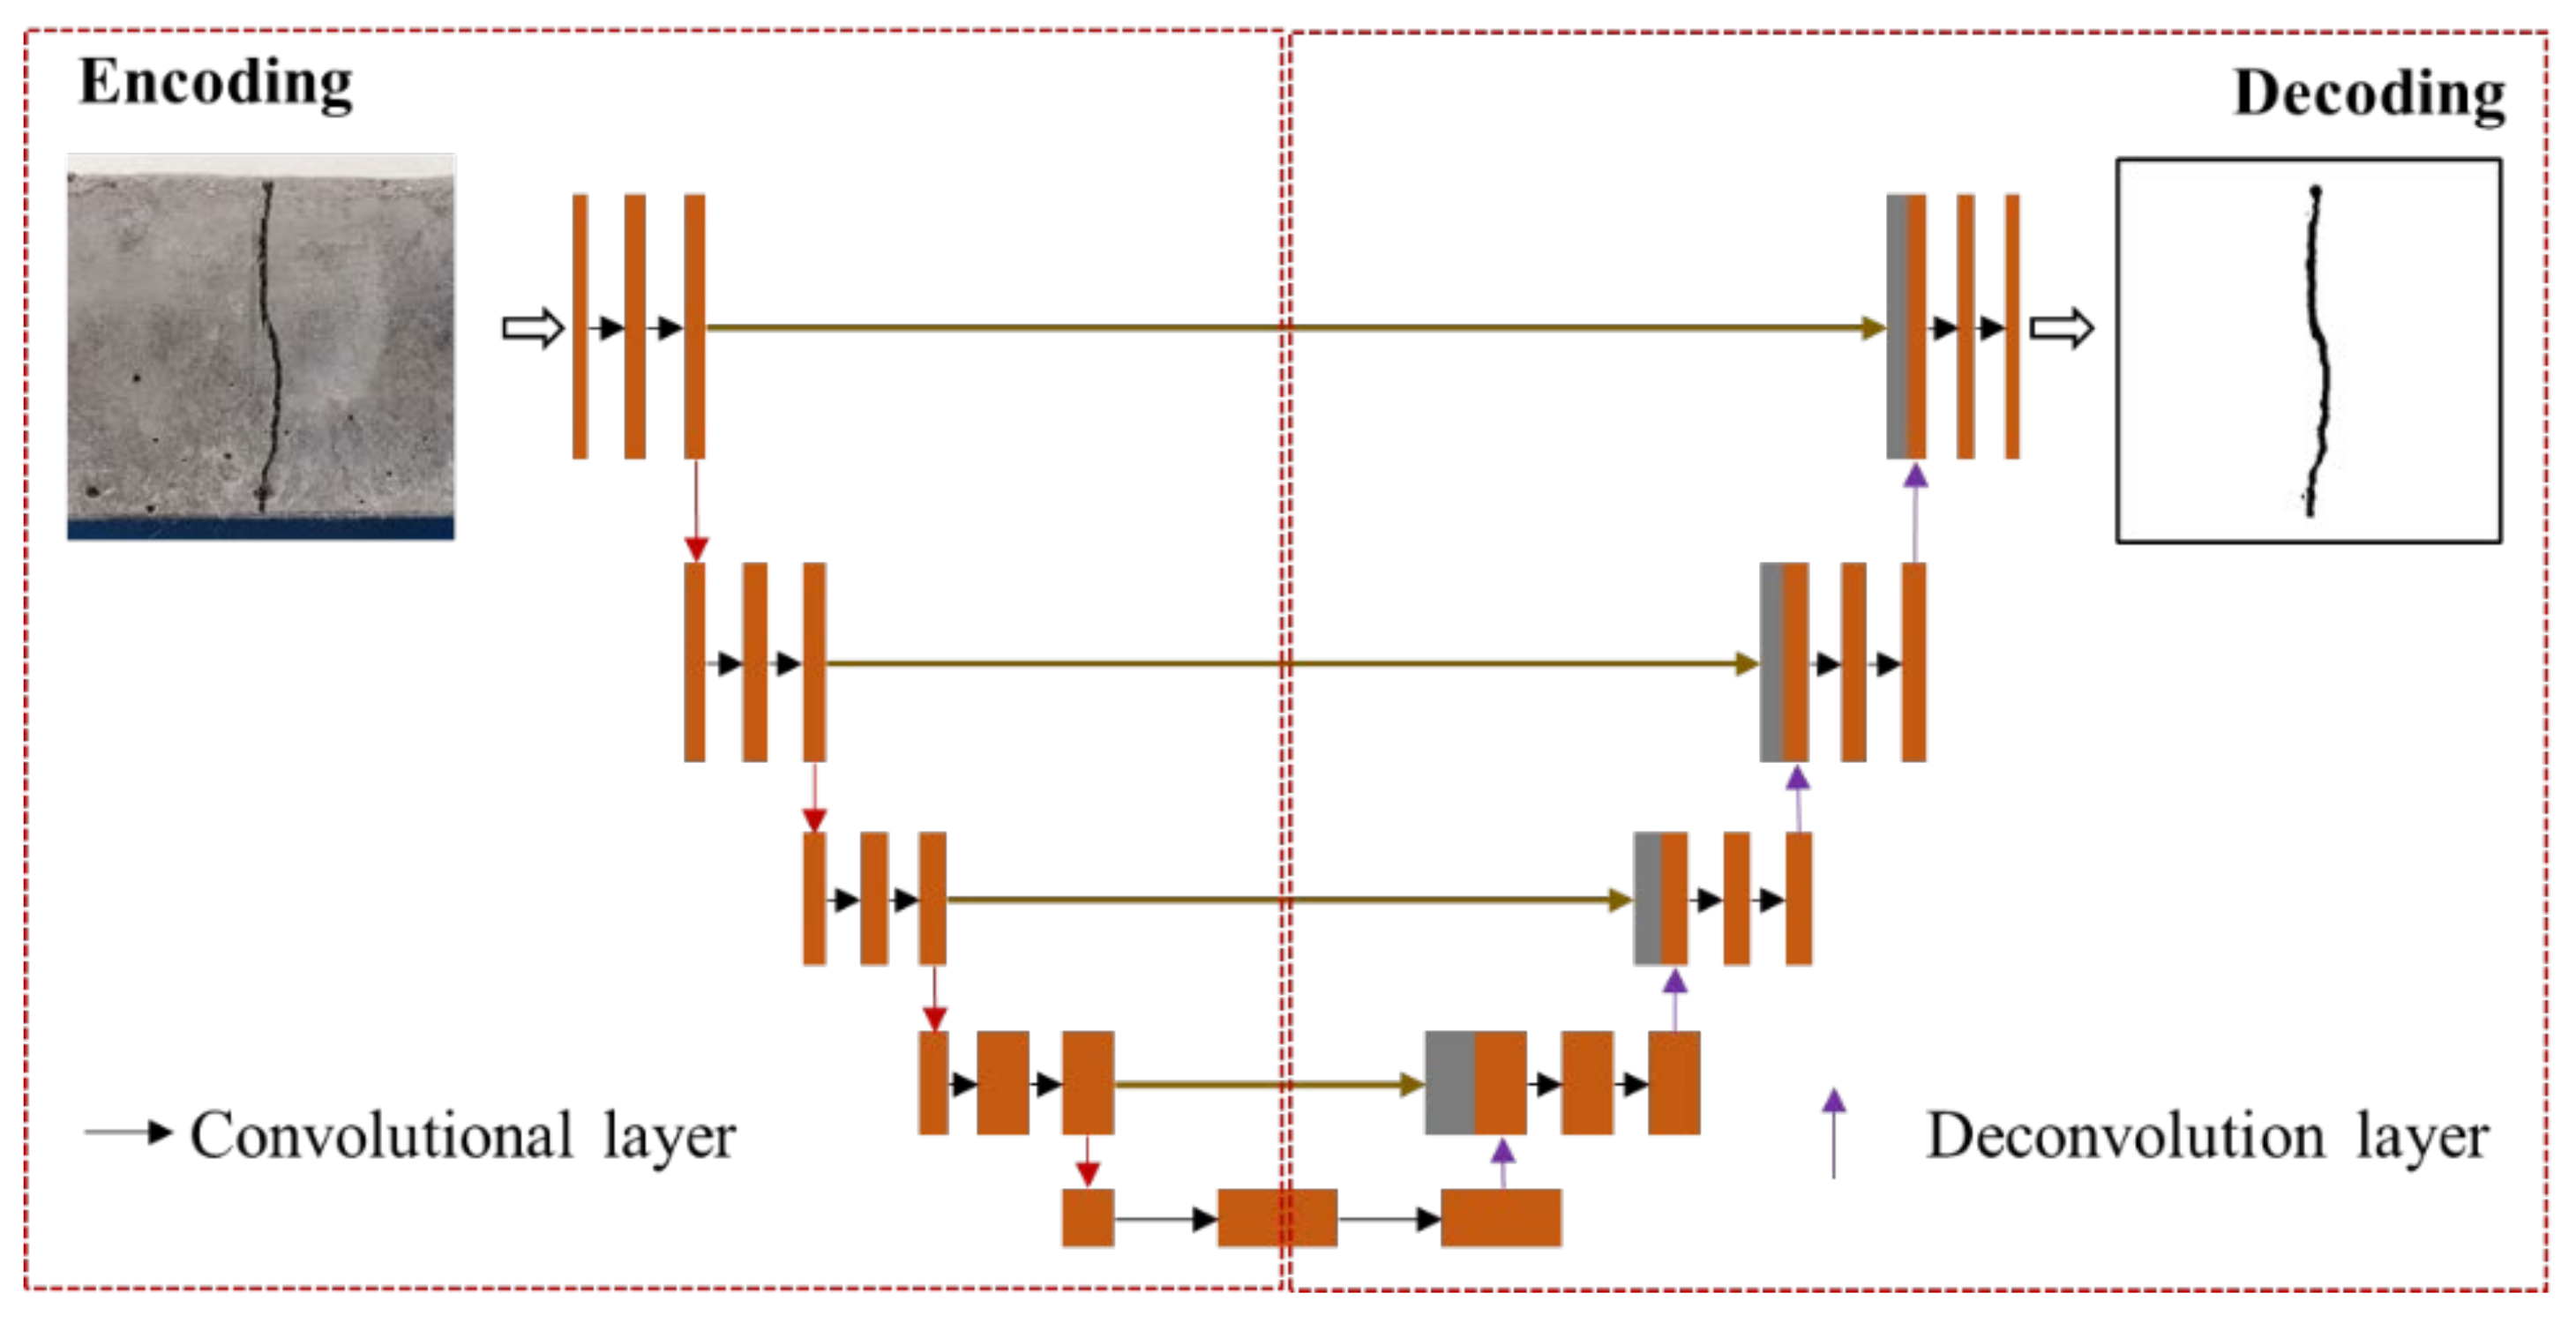
In order to analyze the flexural properties of different specimens, a three-point bending test was implemented. The surface of the specimens may develop cracks after the flexural test. The development of cracks is related to the raw material (fiber length, fiber volume fraction, and water–binder ratio) and is an external manifestation of the flexural performance of the specimens. However, the development of cracks on the surface of the specimens is relatively fragmented. It is difficult for general image processing techniques to accomplish a complete and accurate crack extraction. With the rapid development of deep learning, it has achieved good results in many image processing tasks. In this paper, a semantic segmentation network based on deep learning is used for the pixel-level extraction of cracks on the surface of specimens. The network was built under the framework of Keras. In the process of data annotation, LabelMe was used to label the cracks in the images. The semantic segmentation network contains an encoding structure and a decoding structure, as shown in
Figure 1. The coding structure mainly consists of convolutional and pooling layers, which are used to extract the features of input images and obtain multiple feature maps. The decoding structure mainly consists of a deconvolution layer, which up-samples and fuses the obtained feature maps. Finally, a crack extraction map is output.
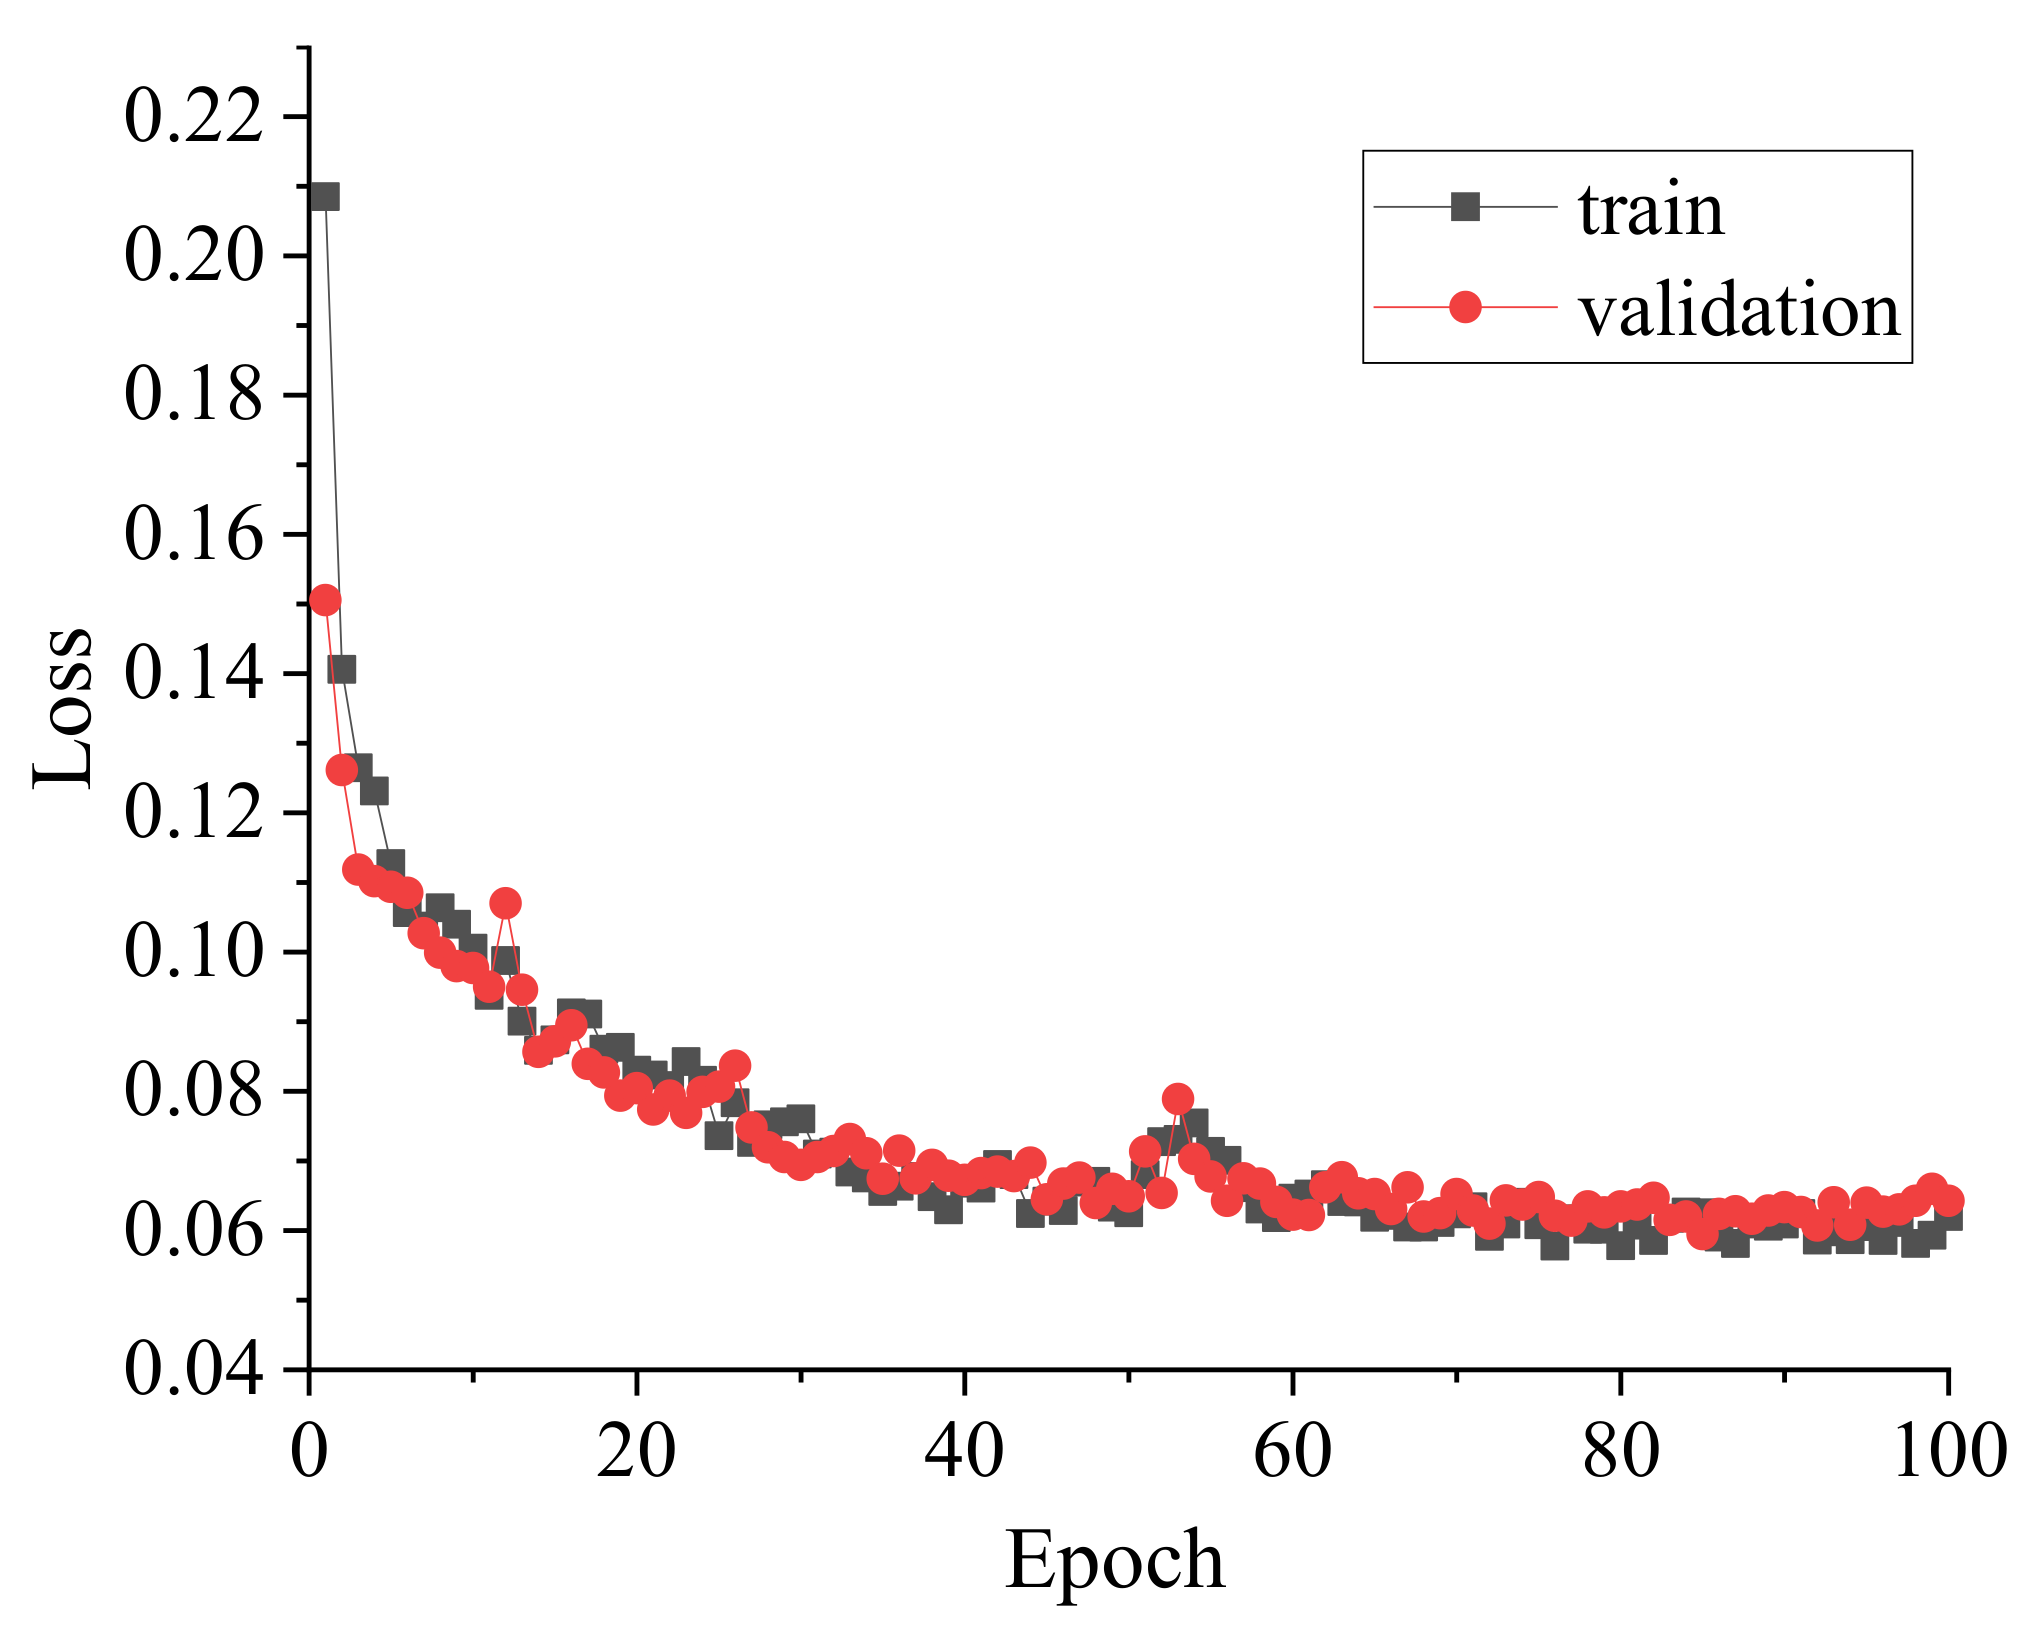
In order to create a surface crack dataset, the surface of each specimen is photographed. The cracks in the images were marked by LabelMe. In order to improve the diversity of data, data augmentation methods, such as color jitter and rotation, are adopted. Finally, a crack segmentation dataset containing 1035 images was constructed. Among them, 662 samples were used as the training set, 166 samples were used as the validation set, and 207 samples were used as the testing set. The model was trained and tested in the Keras framework. The training loss and validation loss curves are shown in
Figure 2. As can be seen from the figure, the loss curve gradually stabilized, indicating that the model converged. To evaluate the accuracy of the crack extraction model, two evaluation parameters, the mean intersection over union (mIoU) and mean pixel accuracy (mPA), were used. The mIoU and mPA of the background were 0.9974 and 0.9986, respectively; the mIoU and mPA of the crack were 0.8451 and 0.9213, respectively. Therefore, the trained crack extraction model can extract cracks with a high accuracy.
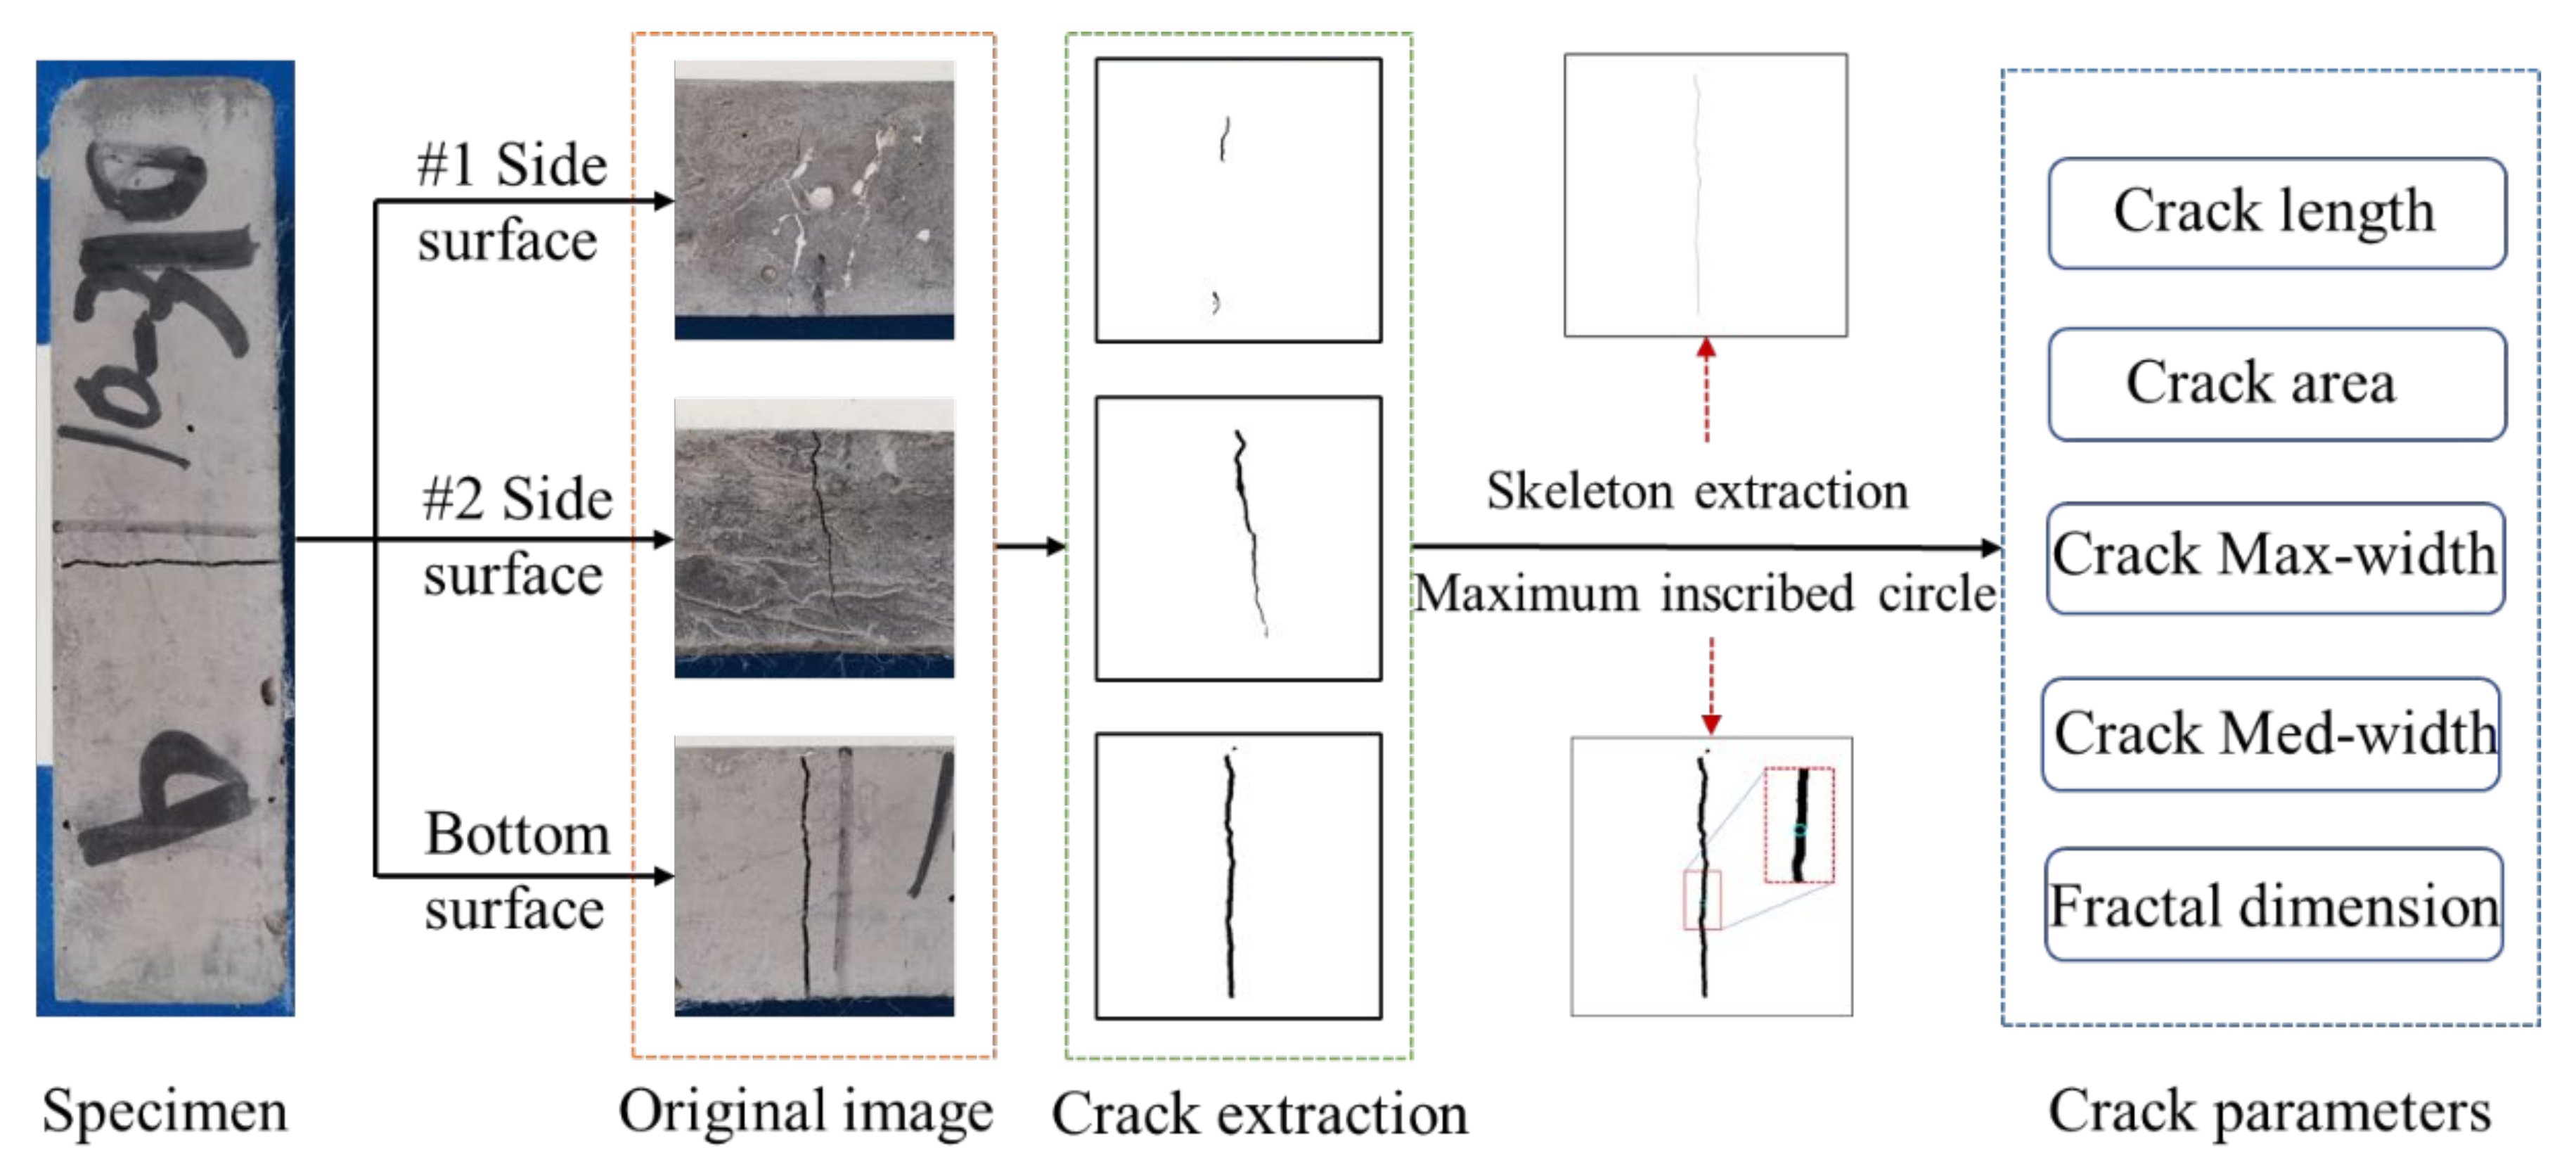
In this paper, deep learning and image processing techniques were used to extract the parameters of cracks on the bottom and side of specimens, and the process is shown in
Figure 3. First, two side surfaces and one bottom surface of a specimen are photographed. Second, these original images are cropped and input into the crack extraction model to obtain the crack extraction map. Then, various parameters are calculated based on the crack binary image. The crack area can be obtained directly from the pixel count; the crack length can be obtained by skeleton extraction; the crack width can be obtained by the inner tangent circle method. In addition to the above characteristic parameters, fractal is also a very important index. In this paper, the box-counting dimension was used to quantitatively describe the fractal of the cracks. This is a calculation method to measure the fractal dimension in the distance space. The crack was placed on a uniformly divided box, and the minimum number of boxes needed to cover the crack completely was calculated. The box was refined step by step and the change in the required box number was recorded in order to calculate the box dimension. Suppose the box has side length
a, the space is divided into
N boxes, and the fractal dimension is defined as:
4. Influence of Fiber Volume Fraction on Cracks
In order to analyze the effect of the fiber volume fraction on the cracking characteristics of geopolymers, eight types of specimens with different fiber volume fractions (0.3%, 0.6%, 0.9%, 1.2%, 1.5%, and 1.8%) were prepared. Meanwhile, the two types of water–binder ratios are 0.45 and 0.48, and the two types of fiber lengths are 6 mm and 12 mm, respectively. After the specimens were subjected to three-point bending experiments, the characteristic parameters of the specimen surface cracks were accurately obtained using deep learning and image processing techniques. In this section, the relationships between the fiber volume fraction and the crack length, width, area, and fractal dimension are shown separately.
4.1. Crack Length
Cracks may occur on two side surfaces and one bottom surface of the specimen during the three-point bending experiment. Therefore, the relationship between the length of side, bottom, and all cracks and the fiber volume fraction were analyzed, respectively, as shown in
Figure 4. As shown in
Figure 4a, the crack length on the side surface of the specimen increases with the increase in the fiber volume fraction. The crack length grows rapidly when the fiber content is small, and the growth of the crack length gradually slows down as the fiber content increases, and even drops slightly after the fiber volume fraction reaches 1.5%. The larger the fiber content, the more significant the bridging effect of the fiber on the cracks in geopolymer specimens. The cracks are more fully extended and the energy dissipation capacity of the specimen is stronger when the specimen is damaged. The fibers with an appropriate content can be dispersed evenly in the matrix of the geomembrane, thus bridging the cracks more effectively; when the fiber content is too large, the fiber is easily dispersed unevenly and even agglomerated, which leads to the degradation of the fiber bridging the cracks.
The larger the water–binder ratio, the greater the crack length on the side surface. This is mainly because the specimens with a large water–binder ratio have a relatively poor matrix compactness and high porosity, and cracks are easy to expand. Meanwhile, the matrix viscosity of the specimens with a large water–binder ratio is smaller, and the fibers are more easily dispersed. The effect of uniformly dispersed fibers bridging the cracks is more significant. Therefore, the cracks develop more fully. As can be seen from the figure, the longer the fiber length, the longer the crack length on the side surface. It is obvious that long fibers have a more significant bridging effect on the cracks and that the cracks are more fully developed. Therefore, the longest cracks were found in the geopolymer specimens with a water–binder ratio of 0.48 and a fiber length of 12 mm. Specifically, when the fiber volume fraction was 1.5%, the crack length of the 0.48-12 group was 65% higher than that of the 0.45-6 group.
As shown in
Figure 4b,c, cracks on both the bottom surface and all surfaces are longer in length than those on the side surface. The length of the bottom crack is similar to that of the side crack, but the length of the bottom crack varies slightly with the fiber volume fraction. Except for the 0.48-12 group, the crack length of the bottom surface is basically stable at approximately 40 mm. The reason is that the cracks on the bottom surface of the specimen have been fully developed. When the cracks are all single cracks, the crack length changes little. However, due to the longer fiber length and uniform fiber dispersion in the 0.48-12 group, the phenomenon of multi-slit cracking occurred in different degrees. Therefore, the crack length is nearly 100% higher than the other groups. This also means that the 0.48-12 group showed some degree of flexural hardening and that the energy dissipation capacity was significantly improved.
In addition, comparing
Figure 4a–c, it can be found that the variation trend of the bottom crack length with the fiber content is basically consistent with that of all crack lengths. Therefore, in experimental research and engineering, the variation of the bottom crack length can be used to represent the overall crack variation pattern in order to reduce the difficulty and workload of collecting cracks.
4.2. Crack Width
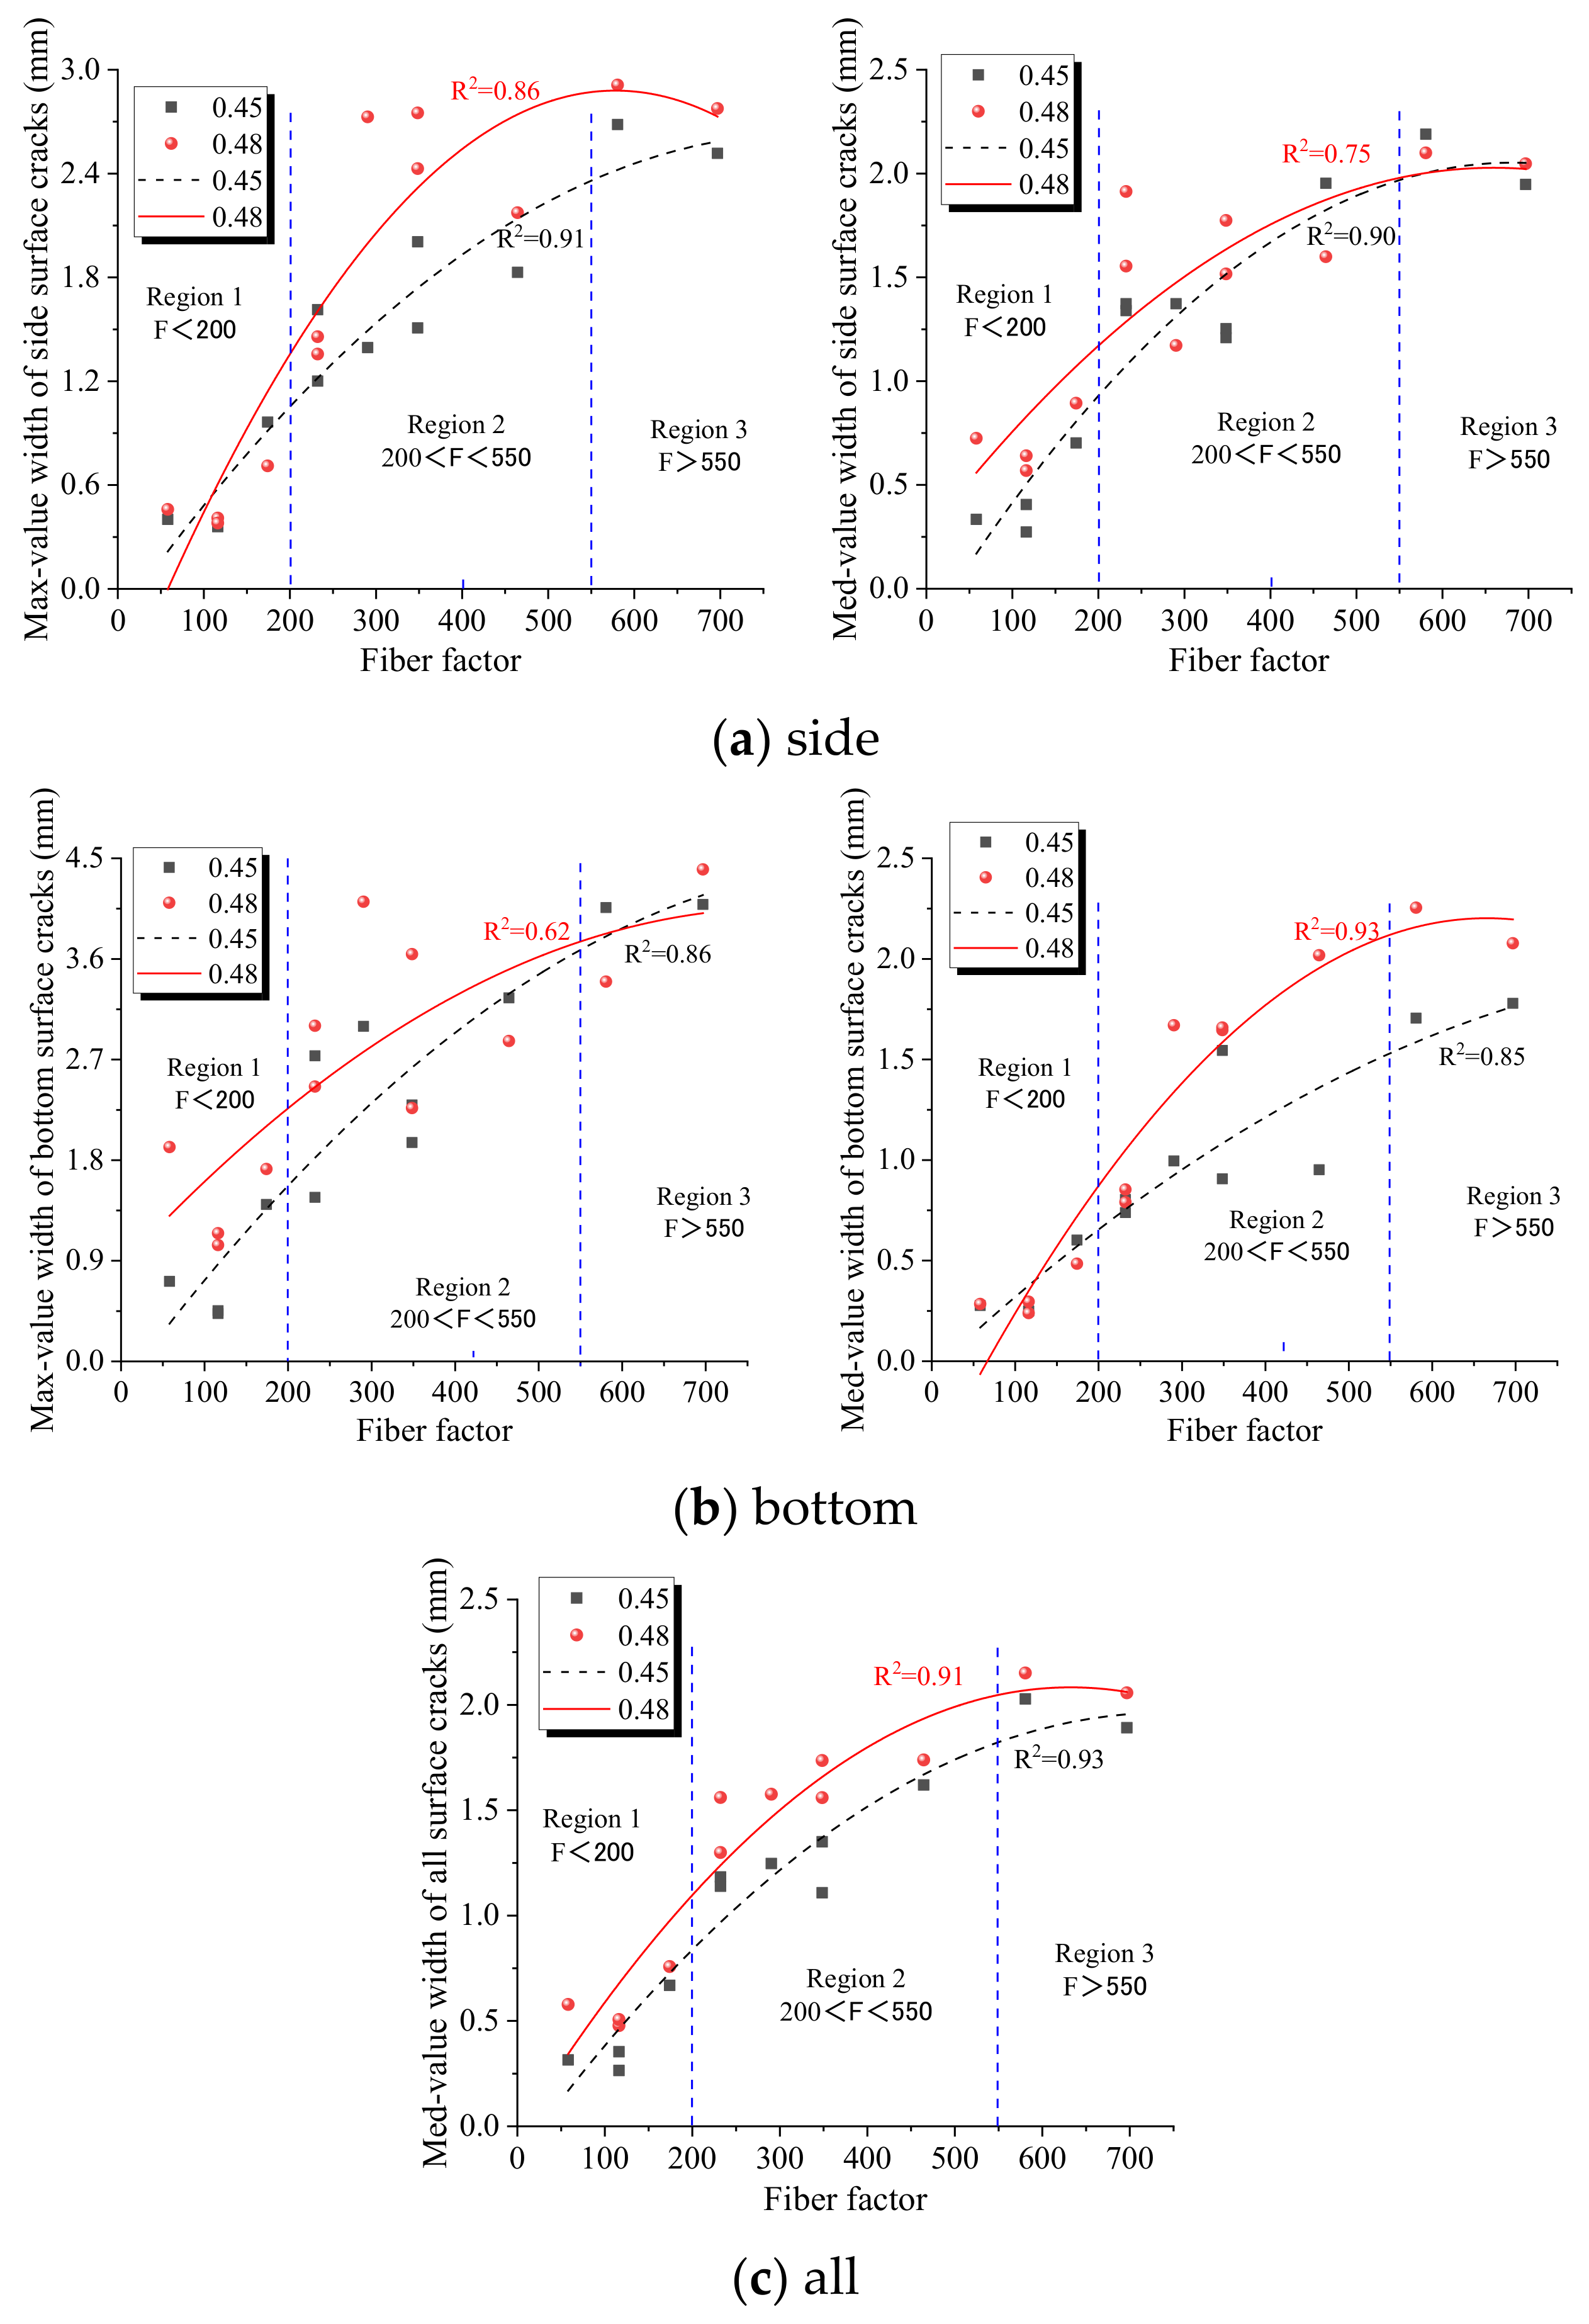
Crack width is an important parameter in concrete structures and can seriously affect the mechanical properties of structures. Therefore, the maximum and median widths of the cracks were counted separately. The variation curves of these two parameters with the fiber volume fraction are shown in
Figure 5.
Figure 5a shows the curves of the maximum width (left side) and median width (right side) of the side surface cracks with the fiber volume fraction. Both the maximum (Max) and median (Med) crack widths increased with the increase in the fiber volume fraction. This indicates that the cracks in the specimens were fully developed as the fiber content increased. In this paper, only the crack morphology at the end of the test is extracted for the parameters. Therefore, the larger crack width indicates the better mechanical properties of the geopolymer composite. For the 0.45-12 group and 0.48-12 group, the maximum and median crack widths gradually moderated or even slightly decreased after the fiber volume fraction reached 1.5%. This is caused by the uneven dispersion when the fiber content is too large. In contrast, for the 0.45-6 group and 0.48-6 group, the maximum width of the cracks continued to increase with the fiber content. The reason is that 12 mm fibers tend to disperse unevenly and agglomerate, whereas 6 mm fibers are shorter and less likely to agglomerate. Therefore, the 6 mm fiber can continue to play a role in high content.
The crack width increases with the increase in the water–binder ratio and fiber length, but the effect of the fiber length on the crack width is greater than that of the water–binder ratio. When the fiber volume fraction is 1.5%, the ranking of the maximum crack width is the 0.48-12 group, 0.48-6 group, 0.45-12 group, and 0.45-6 group, in that order. Among them, the maximum crack width of the 0.48-6 group and 0.45-12 group are almost the same. The maximum crack width of the 0.48-12 group is more than twice as large as that of the 0.45-6 group. The reason is that the bridging effect of long fibers on cracks is significantly greater than that of short fibers. Therefore, the crack development of specimens with 12 mm fibers was more adequate than that of specimens with 6 mm fibers. The order of the median crack widths is the 0.45-12 group, 0.48-12 group, 0.45-6 group, and 0.48-6 group, in that order. Among them, the median crack width of the 0.48-12 group and 0.45-12 group are almost the same. The difference between the median crack widths of the 0.45-6 group and 0.48-6 group is not significant. Overall, the median crack curve is somewhat smoother than the maximum crack curve. The crack width of the specimen with a large water–binder ratio is larger than that of the specimen with a small water–binder ratio.
From
Figure 5b, it can be seen that the bottom surface crack width curve is almost the same as that of the side surface cracks. However, the maximum width of the bottom surface cracks is generally larger than that of the side surface cracks. When the fiber volume fraction is 0.9%, the maximum width of the side surface cracks is 2.7 mm and the maximum width of the bottom surface cracks is 3.6 mm for the 0.48-12 group. The median width of the bottom surface crack does not differ much from that of the side surface cracks. When the fiber volume fraction is 0.9%, the median width of the side surface cracks is 1.75 mm and the median width of the bottom surface cracks is 1.70 mm for the 0.48-12 group. This indicates that the evaluation of crack characteristics using the median crack width is not sensitive to the location of cracks.
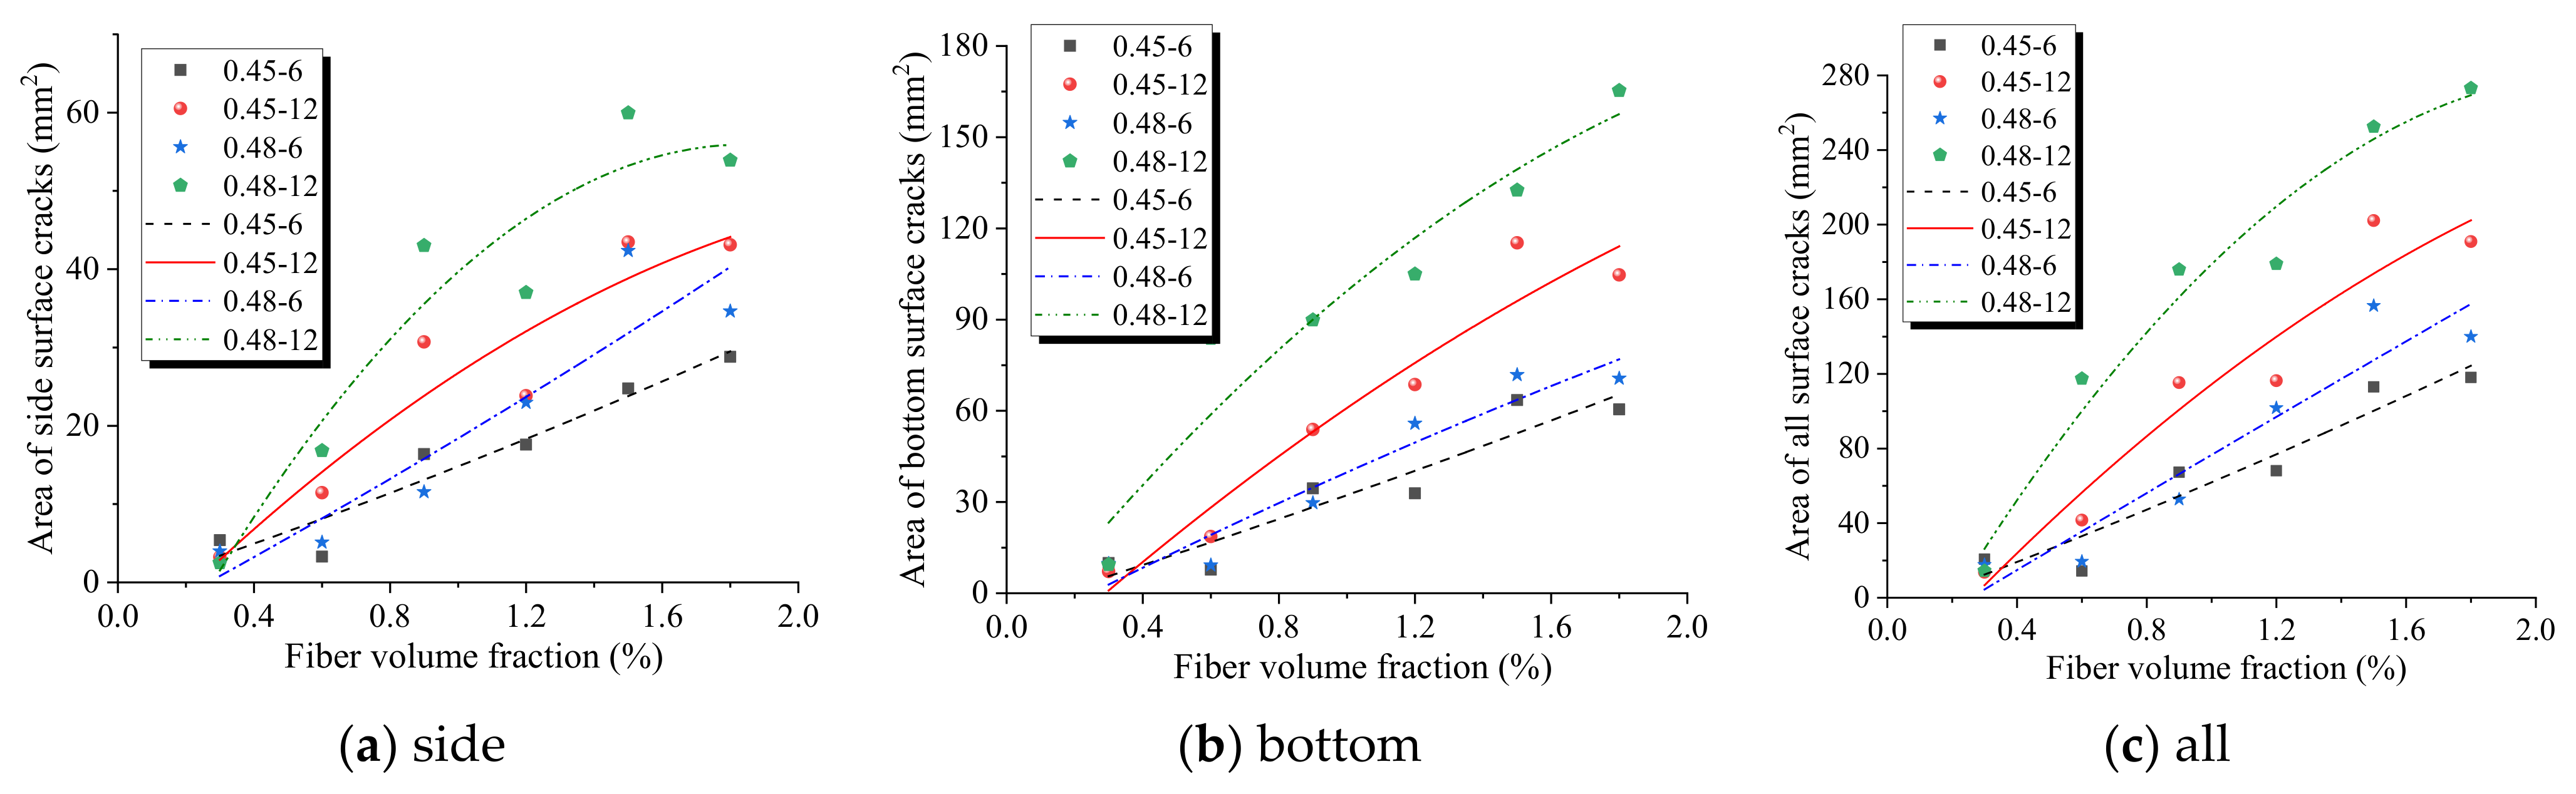
4.3. Crack Area
The crack area can be combined with both the crack length and width to measure the damage severity and energy dissipation capacity of the specimen surface. The relationship between the crack area and fiber volume fraction is shown in
Figure 6. Except for the 0.48-12 group, an almost standard linear relationship between the crack area and fiber volume fraction was observed. For the 0.48-12 group, the side surface crack area tends to level off gradually when the fiber volume fraction reaches 1.5%, as shown in
Figure 6a. However, the bottom surface cracks and all surface crack areas of the 0.48-12 group continue to increase with the increase in the fiber volume fraction, as shown in
Figure 6b,c. This is because the bottom surface of the specimen is the first to be damaged by the tensile stress, and the cracks gradually expand from the bottom to the side. The side surface cracks are not sufficiently developed, so the bottom surface cracks better reflect the effect of the fibers. The area of the cracks on the bottom surface is approximately three times the area of the cracks on the side surfaces. When the fiber volume fraction is 1.2%, the side surface crack area of the 1.48-12 group is approximately 36 mm
2 and the bottom surface crack area is approximately 105 mm
2.
Similar to the crack length and width, the crack area increases with the increase in the water–binder ratio and fiber length. When the fiber volume fraction is 1.5%, the crack areas of the specimens are ranked as follows: 0.48-12 group; 0.45-12 group; 0.48-6 group; 0.45-6 group. Among them, the total area of the cracks in the 0.48-12 group is approximately 60 mm2; the total area of the cracks in both the 0.45-12 group and 0.48-6 group is approximately 40 mm2; the total area of cracks in the 0.45-6 group is approximately 23 mm2. Thus, the effect of the fiber length on the crack area is much greater than that of the water–binder ratio, which also proves the effectiveness of introducing fibers in geopolymer composites.
In addition, comparing
Figure 6a–c, it can be found that the variation trend of the bottom and side crack area with the fiber content is basically consistent with that of all crack areas. Therefore, in experimental research and engineering, the variation of the bottom or side crack area can be used to represent the overall crack variation pattern in order to reduce the difficulty and workload of collecting cracks.
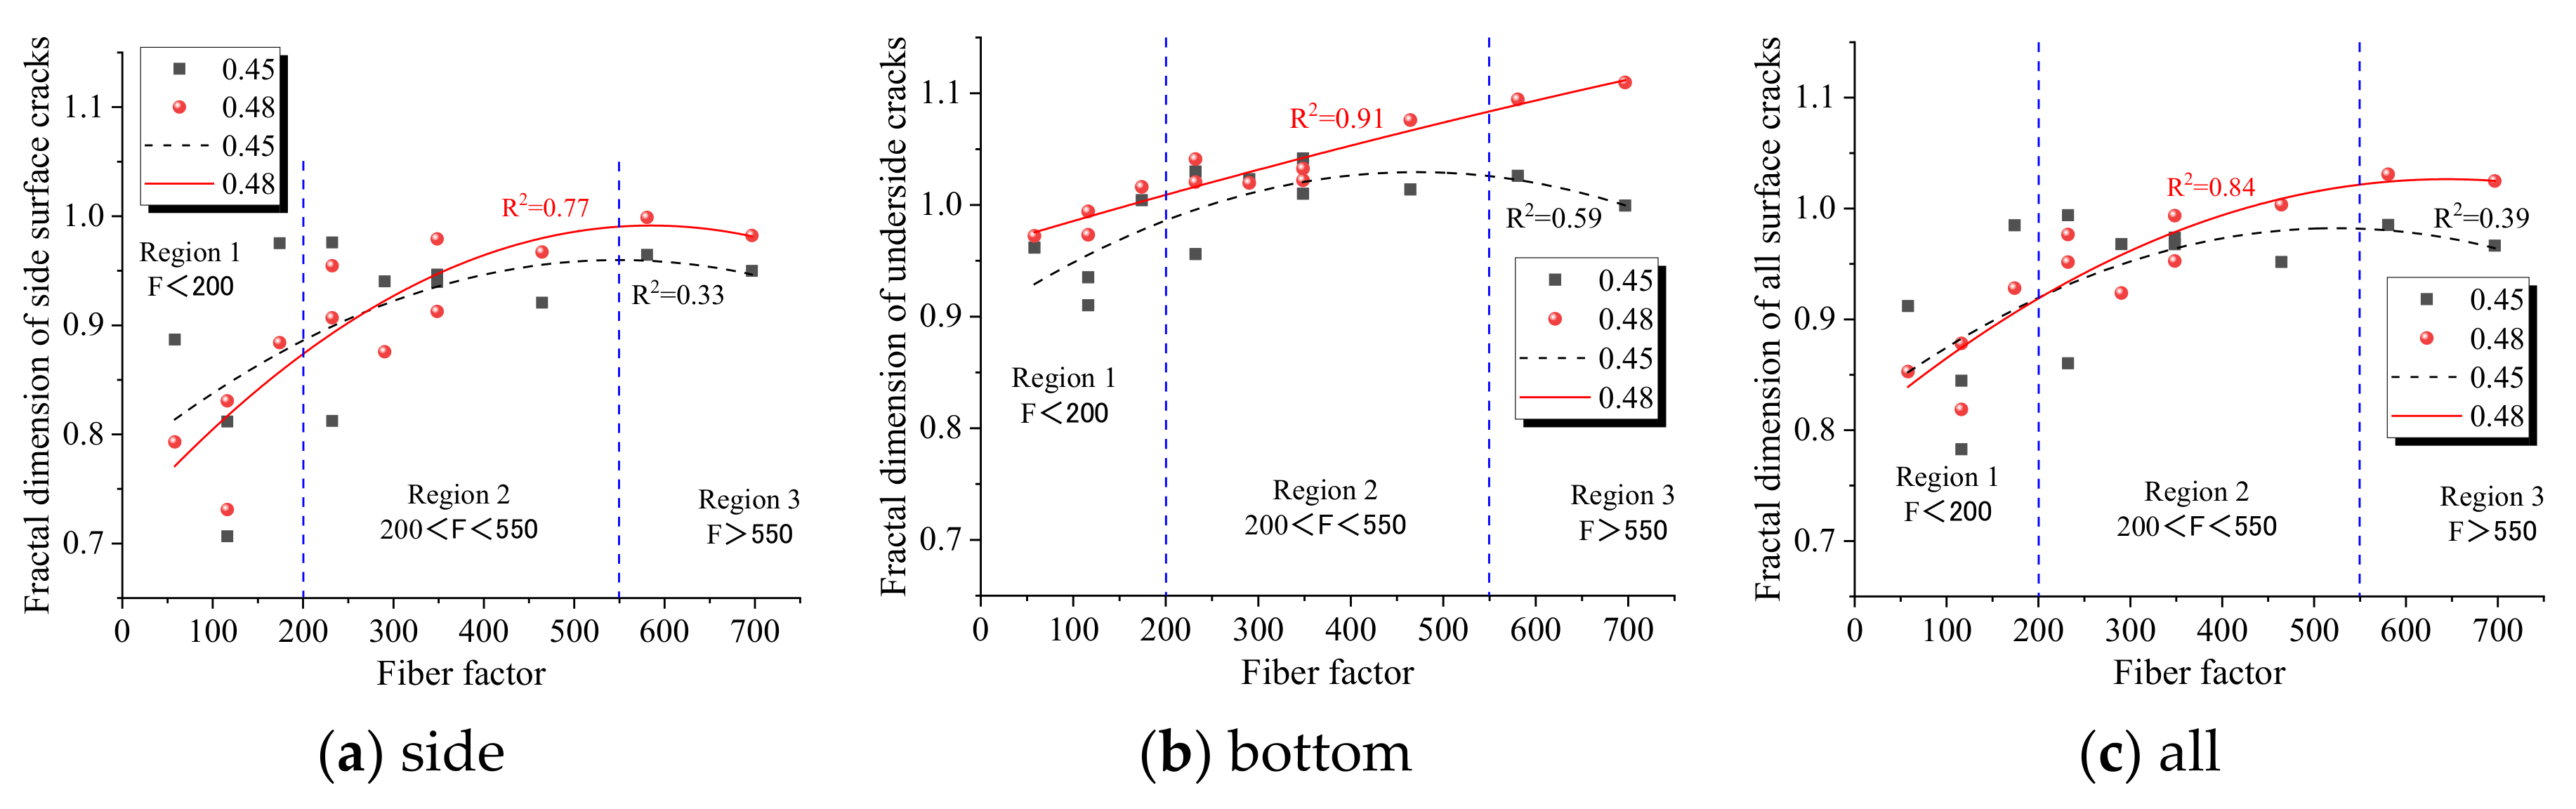
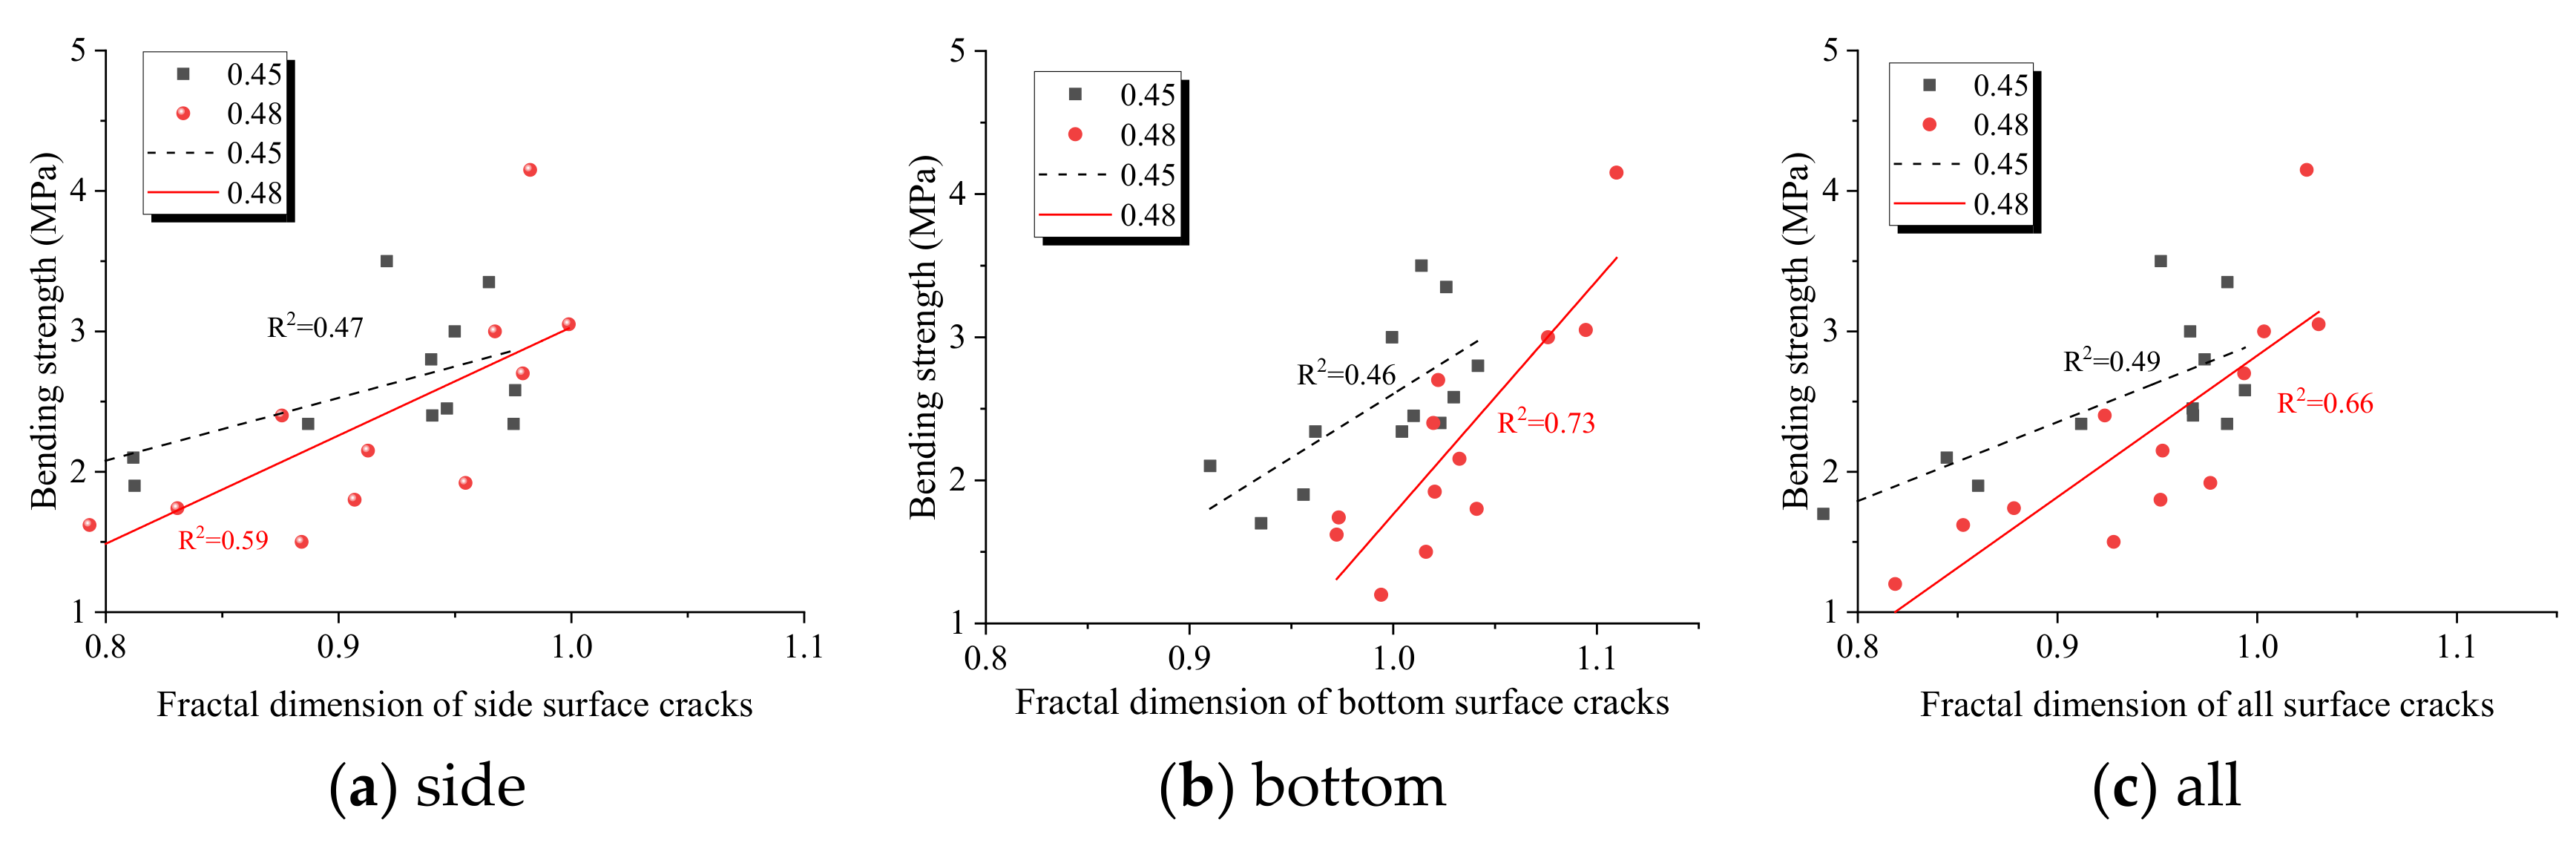
4.4. Crack Fractal Dimension
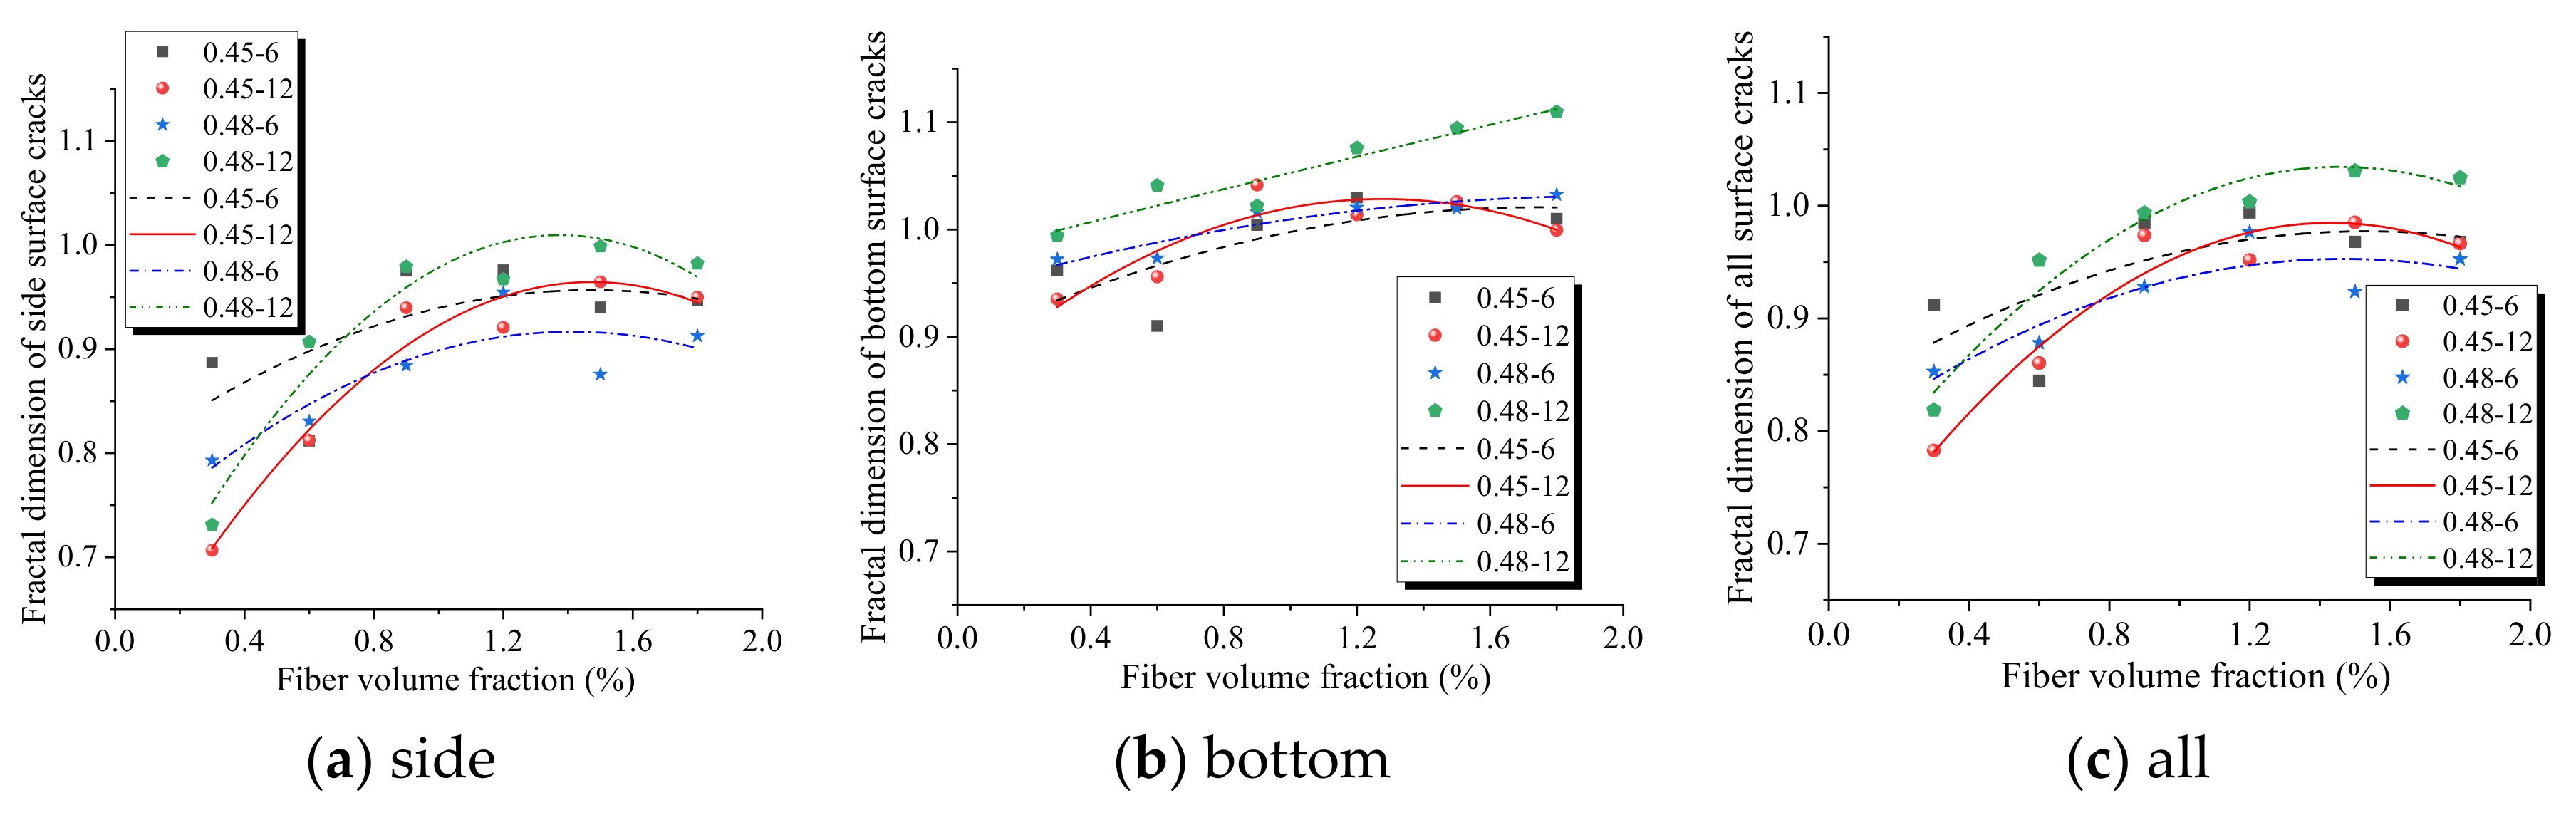
Parameters such as area, length, and width can only express cracks quantitatively in one dimension, and mainly reflect the degree of crack development. However, the distribution pattern of cracks is very complex, and it is difficult to describe the crack pattern using these parameters only. Therefore, this paper uses the fractal dimension to quantitatively express the complexity of crack morphology. The curve between the fractal dimension of the cracks and the fiber volume fraction is shown in
Figure 7. From
Figure 7a, it can be seen that the fractal dimension of the side surface cracks increases with the increase in the fiber volume fraction. When the fiber volume fraction is greater than 1.2%, the fractal dimension gradually smooths out and has a decreasing trend. The reason is the bridging action of the fibers, which allows the cracks to continue to develop and the crack complexity to increase. When the fiber volume fraction reaches 1.2%, the cracks are basically fully developed, so the complexity of the cracks does not continue to increase. Both the water–binder ratio and fiber length have an effect on the fractal dimension, but the fiber length has a greater effect on the cracks. When the fiber volume fraction was 1.5%, the fractal dimension ranking was the 0.48-12 group, 0.45-12 group, 0.45-6 group, and 0.48-6 group, in descending order. This indicates that long fibers can bridge cracks more effectively and complicate the development of cracks. The complexity of crack morphology also implies an increase in the energy dissipation capacity of the specimen.
It can be seen from
Figure 7b that the fractal dimension of the side surface cracks increases more than that of the bottom surface cracks. The fractal dimension of the side surface cracks ranged from 0.7 to 1.0, and the fractal dimension of the bottom surface cracks ranged from 0.9 to 1.1. This indicates that the side surface crack morphology is more complex and varies more than the bottom surface crack, which can characterize the effect of fibers on the crack morphology more effectively. Except for the 0.45-12 group, the other three groups are basically close to the linear relationship. The crack morphology becomes increasingly complex with the increase in fiber content, which proves that the fiber is effective in increasing the cracking resistance and the toughening of polymer composites.
In addition, comparing
Figure 7a–c, it can be found that the variation trend of the side crack fractal dimension with the fiber content is basically consistent with that of all crack fractal dimensions. Therefore, in experimental research and engineering, the variation of the side crack fractal dimension can be used to represent the overall crack variation pattern in order to reduce the difficulty and workload of collecting cracks.
7. Discussion
As reported in the literature, fibers can change the failure model of geopolymer composites from brittle to ductile [
41]. Korniejenko presented that a brittle failure occured for fly ash based geopolymers with a small amount (0.5%) of glass fiber, whereas, when more fibers (1.0%) were used, ductile failure occurred [
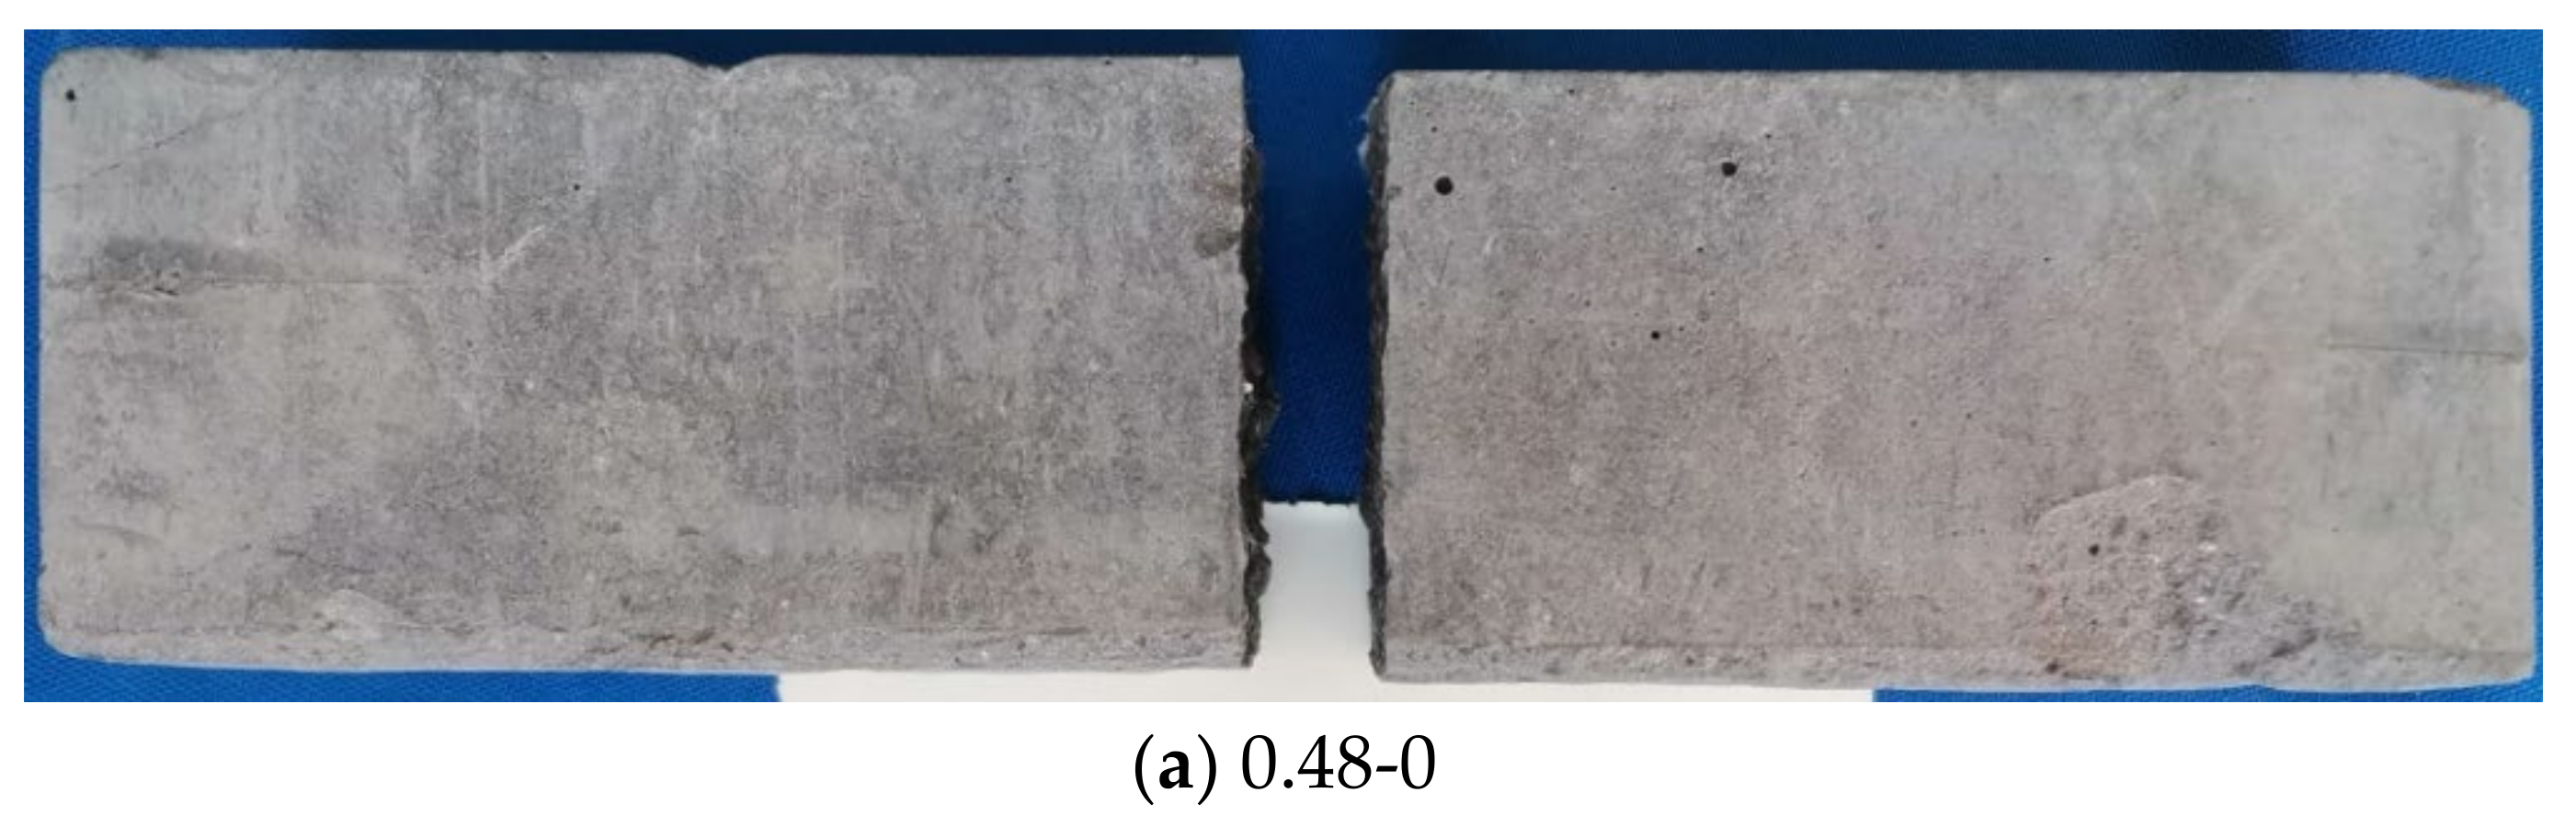
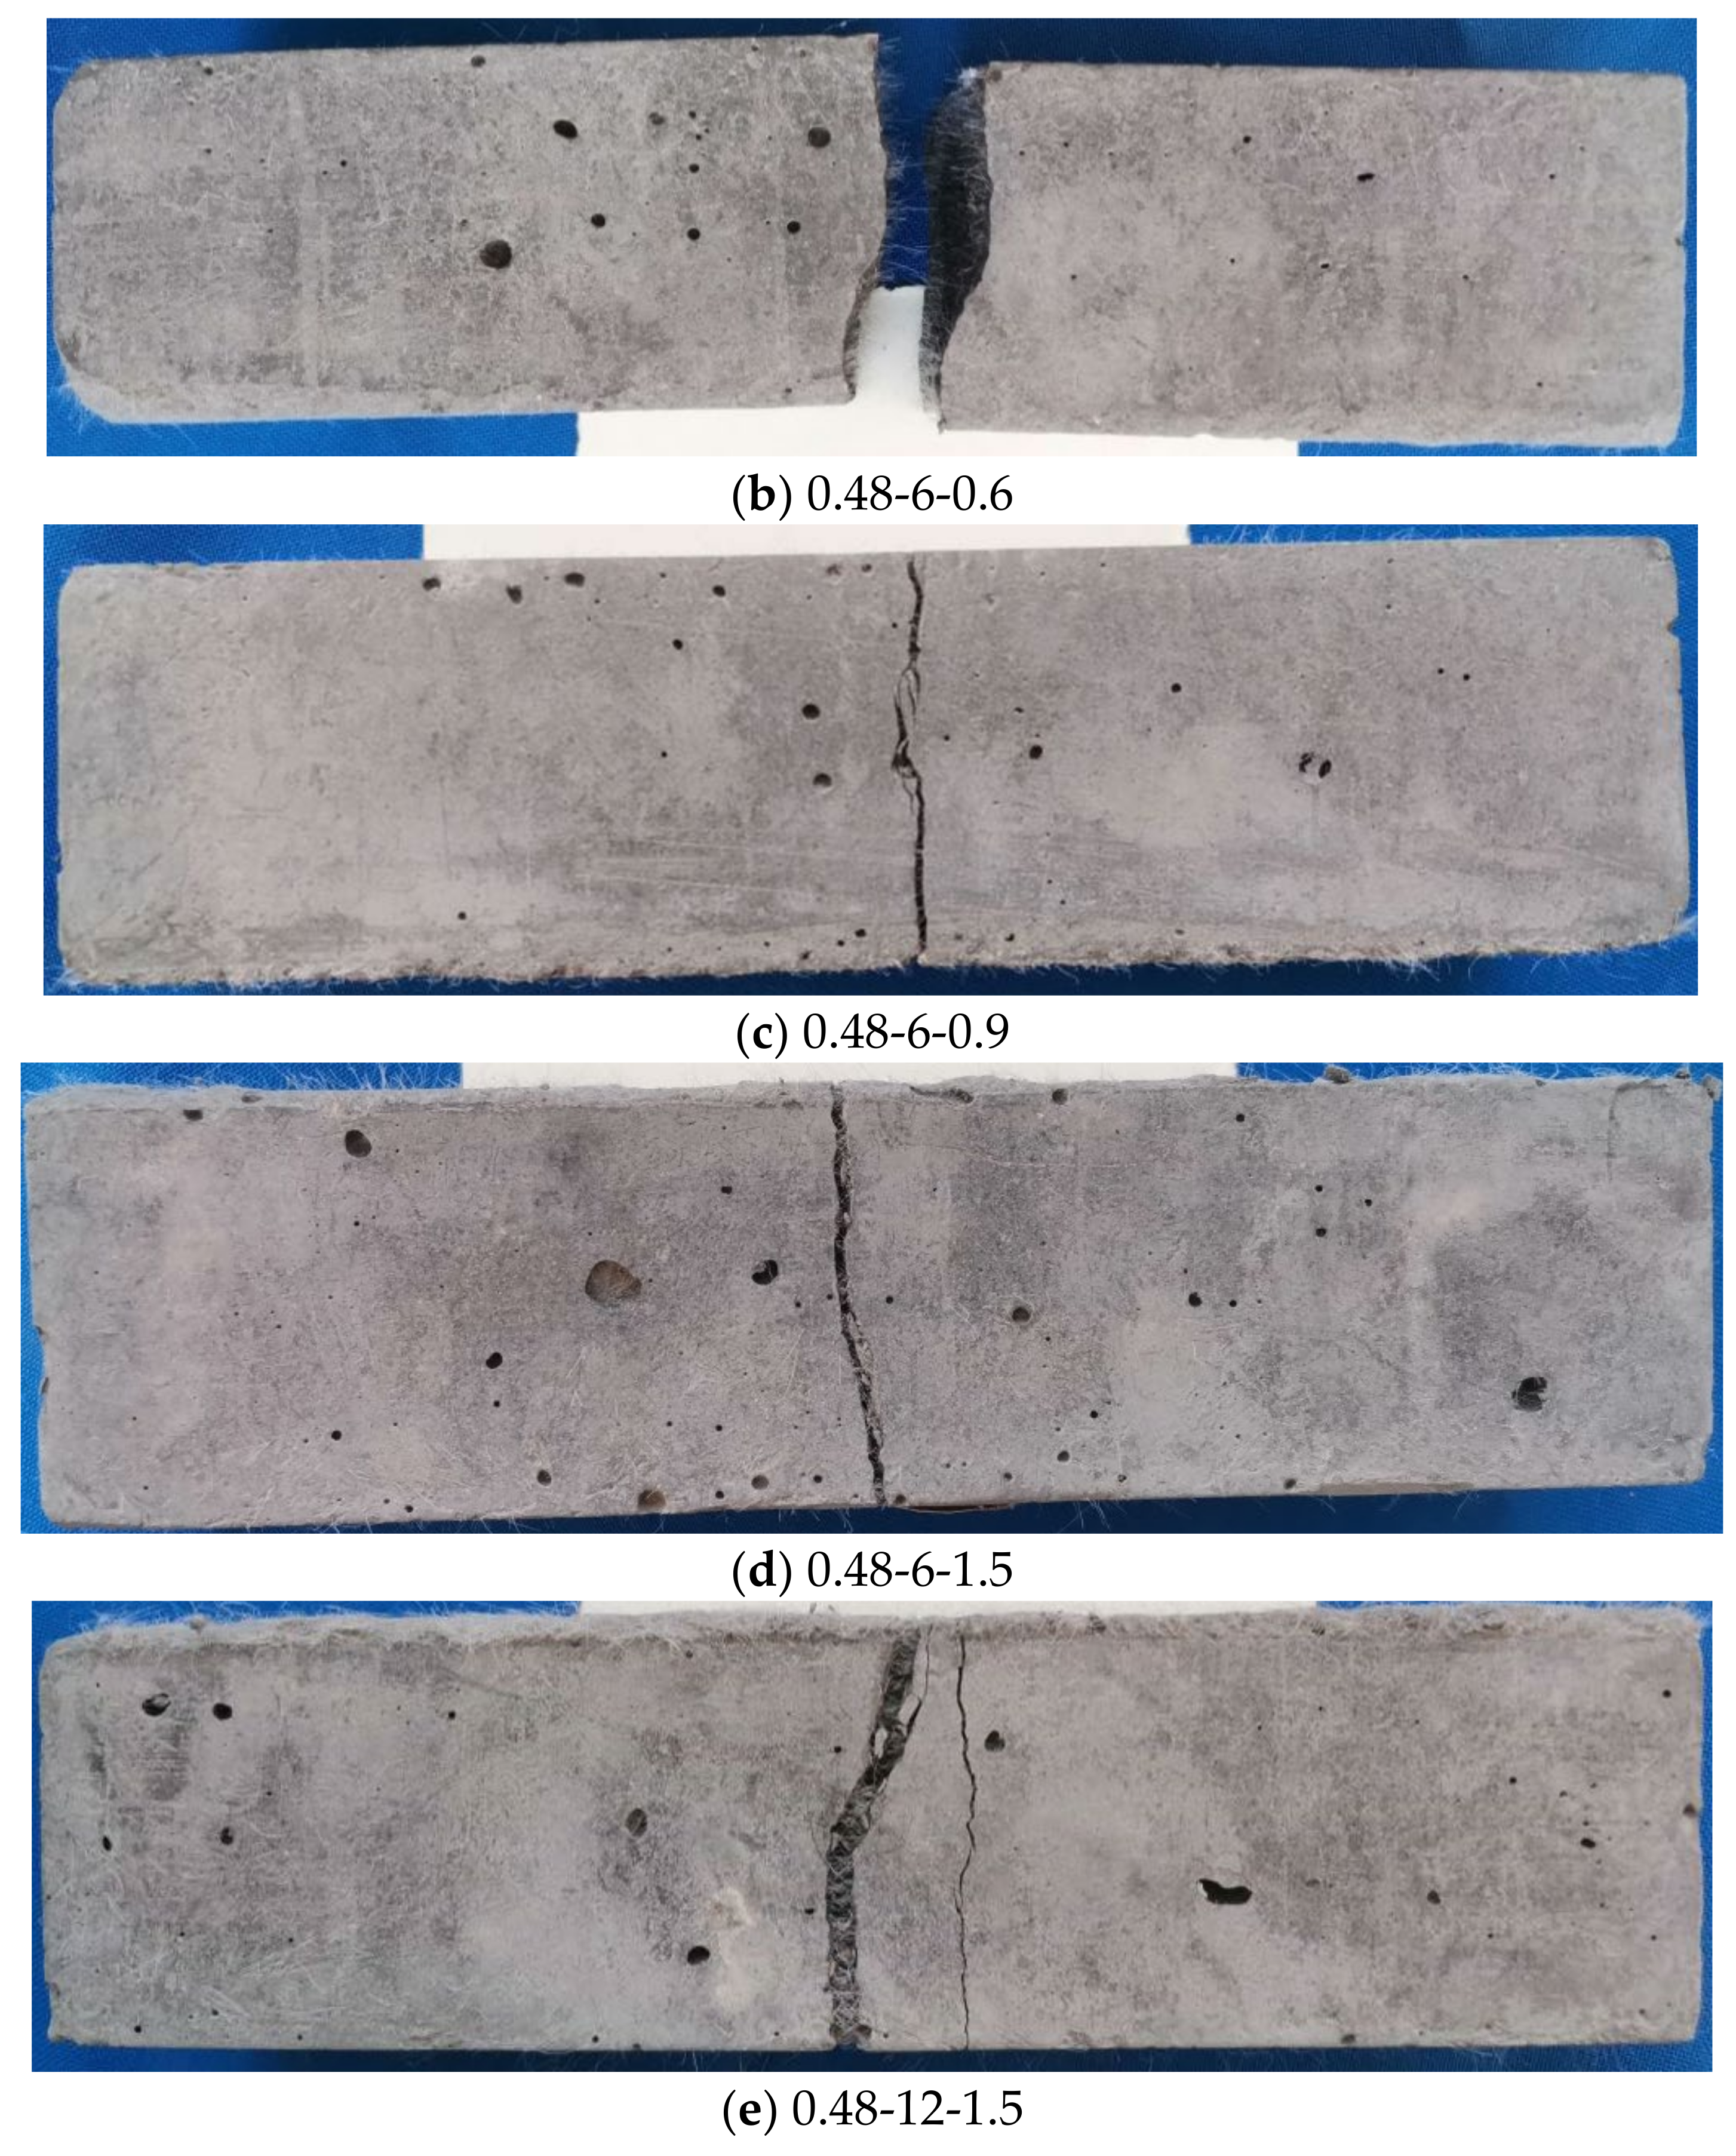
41]. It is clear that a critical fiber content or FF exists that determines the cracking characteristic of geopolymers. During the flexural test, the geopolymeric material without fibers behaved in a manner typical of a brittle fracture, with a single crack almost perpendicular to the edge of the specimen, as shown in
Figure 16a. When a small amount (0.6%) of 6 mm PP fiber was added, brittle failure may have still occurred, as shown in
Figure 16b. However, it is worth noting that the cracks become zigzagged, which means that more energy is consumed by the fracture process. When more 6 mm PP fiber (0.9%) was added, ductile failure seems to have occurred, as more than one crack was on the surface of the specimens, as shown in
Figure 16c. It is interesting to note that the FF was 174.19, which neared the Fc value (200). When the fiber content was increased continually to 1.5%, the cracking character did not change significantly, as shown in
Figure 16d. However, when 1.5% 12 mm PP fiber was used, there were more than two main cracks on the surface of the specimens, resulting from a higher FF of 580.65, which is close to the Fd value (550), as shown in
Figure 16e. These multi-crack propagations mean a significant increase in the pseudo strain-hardening behavior and ductility during bending. The potential applications of fiber-reinforced geopolymer composites include building, transportation, and water infrastructures. Generally, the usage of this material over normal concrete is suitable for higher structural resilience and structural durability.
8. Conclusions
In this paper, after flexural tests, the cracking and fractal characteristics of PP fiber-reinforced geopolymer mortar were specifically investigated. The following conclusions can be obtained.
(1) The semantic segmentation network based on deep learning can accurately extract the cracks generated on the specimen surface after the bending test. The pixel-level crack segmentation image is used to calculate various parameters. The test results showed that the mIoU and mPA of the background are 0.9974 and 0.9986, respectively, and the mIoU and mPA of the crack are 0.8451 and 0.9213, respectively;
(2) Generally, the crack length, width, area, and fractal dimension of the specimen are all increased with the increase in the fiber volume fraction. This indicates that, as the PP fiber is added in the geopolymer mortar, the cracks are more fully extended and the energy dissipation capacity of the specimen is stronger when the specimen is fractured. These crack parameters grow rapidly when the fiber content is small, and the growth of the crack parameters slows down gradually as the fiber content increases. The optimal fiber volume fraction is approximately 1.5%;
(3) The larger the water–binder ratio, the greater the crack length, width, area, and fractal dimension of the specimens. The longer the fiber length, the greater the crack length, width, area, and fractal dimension of the specimens. The fiber length is more efficient than the water–binder ratio of the matrix in bridging cracks to consume energy. Therefore, the highest crack parameters values were found in the geopolymer mortar with a water–binder ratio of 0.48 and a fiber length of 12 mm;
(4) The variation of the bottom crack length can be used to represent the overall crack variation pattern, whereas the variation of the side crack fractal dimension can be used to represent the overall crack variation pattern in order to reduce the difficulty and workload of collecting cracks;
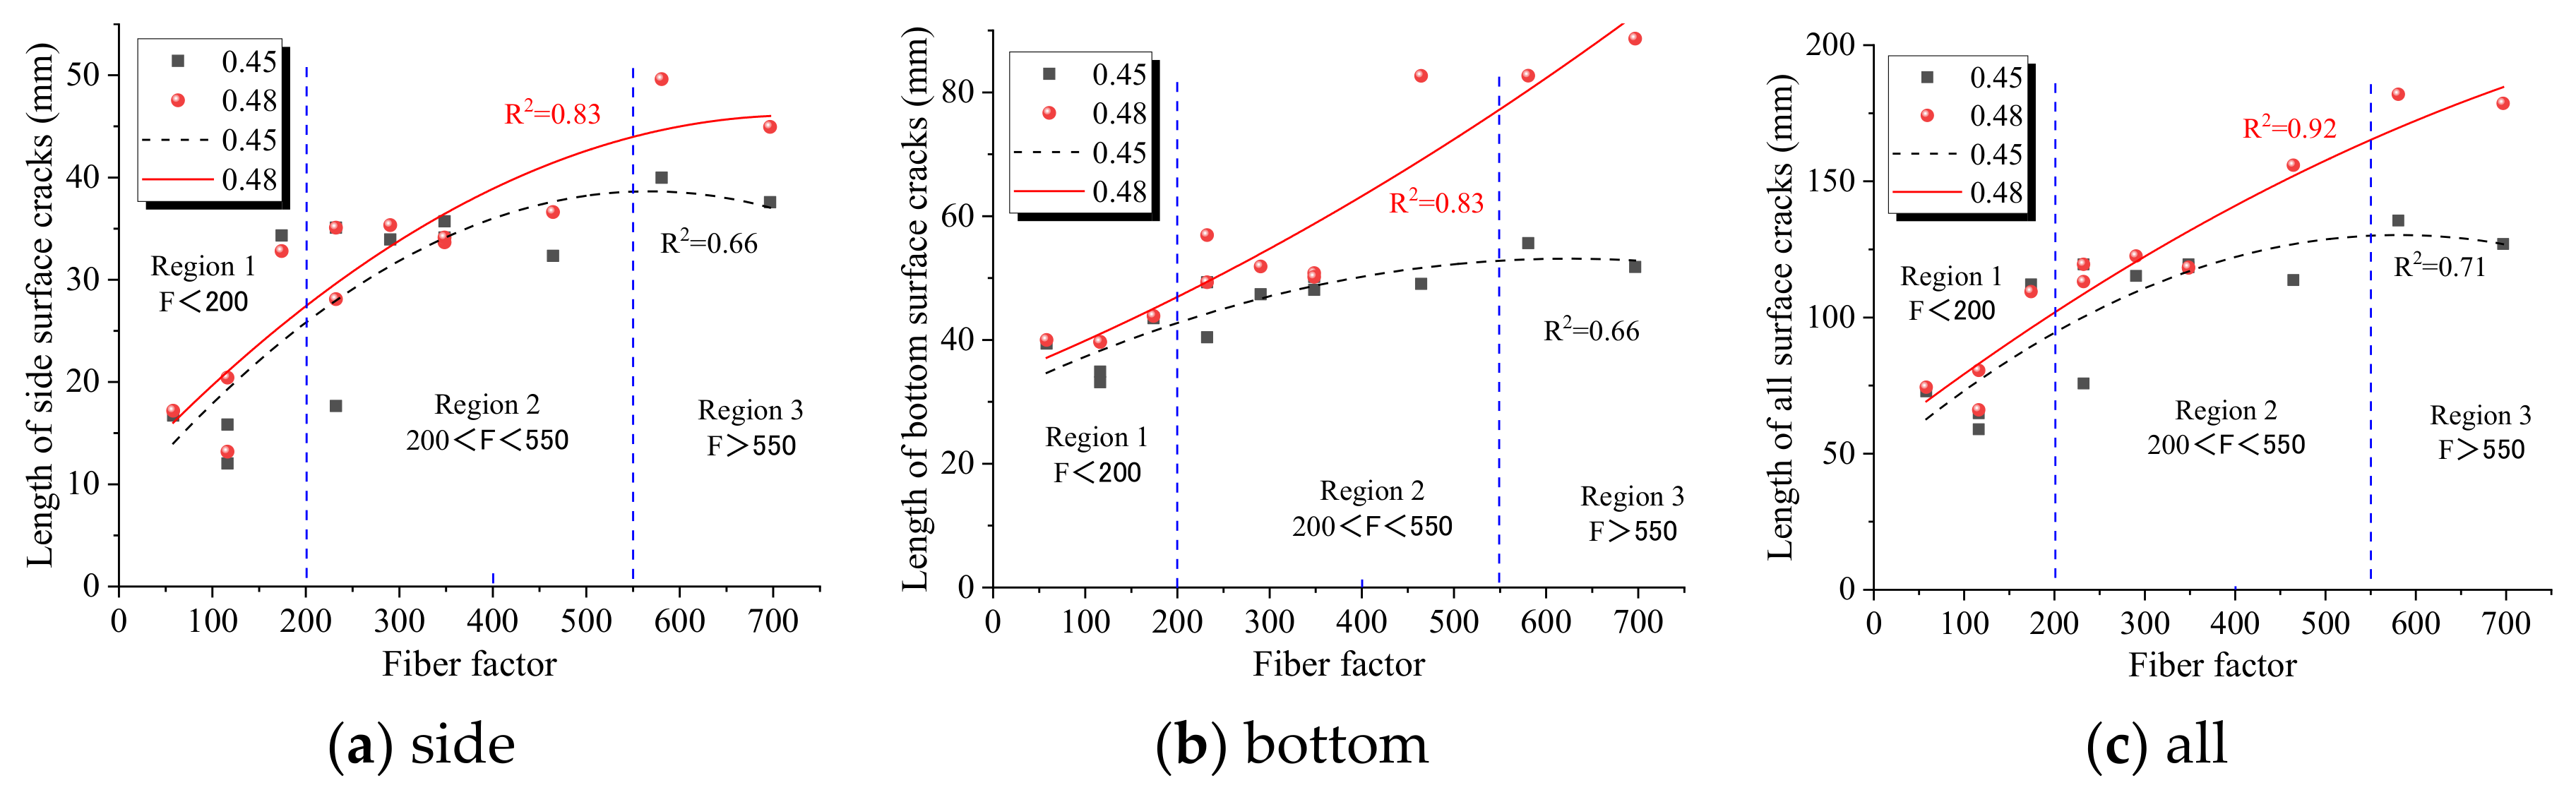
(5) Generally, the crack length, width, area, and fractal dimension of the specimen all increase with the increase in the fiber factor in a quadratic function. Most of the correlation coefficients of the regression analysis are high. Based on the crack parameters in this research, the Fc and Fd of the PP fiber-reinforced geopolymer mortar were 200 and 550, respectively. It is clear that the Fc and Fd values in this research are greater compared with that of previous studies about PP or PVA fiber-reinforced Portland cementitious composites;
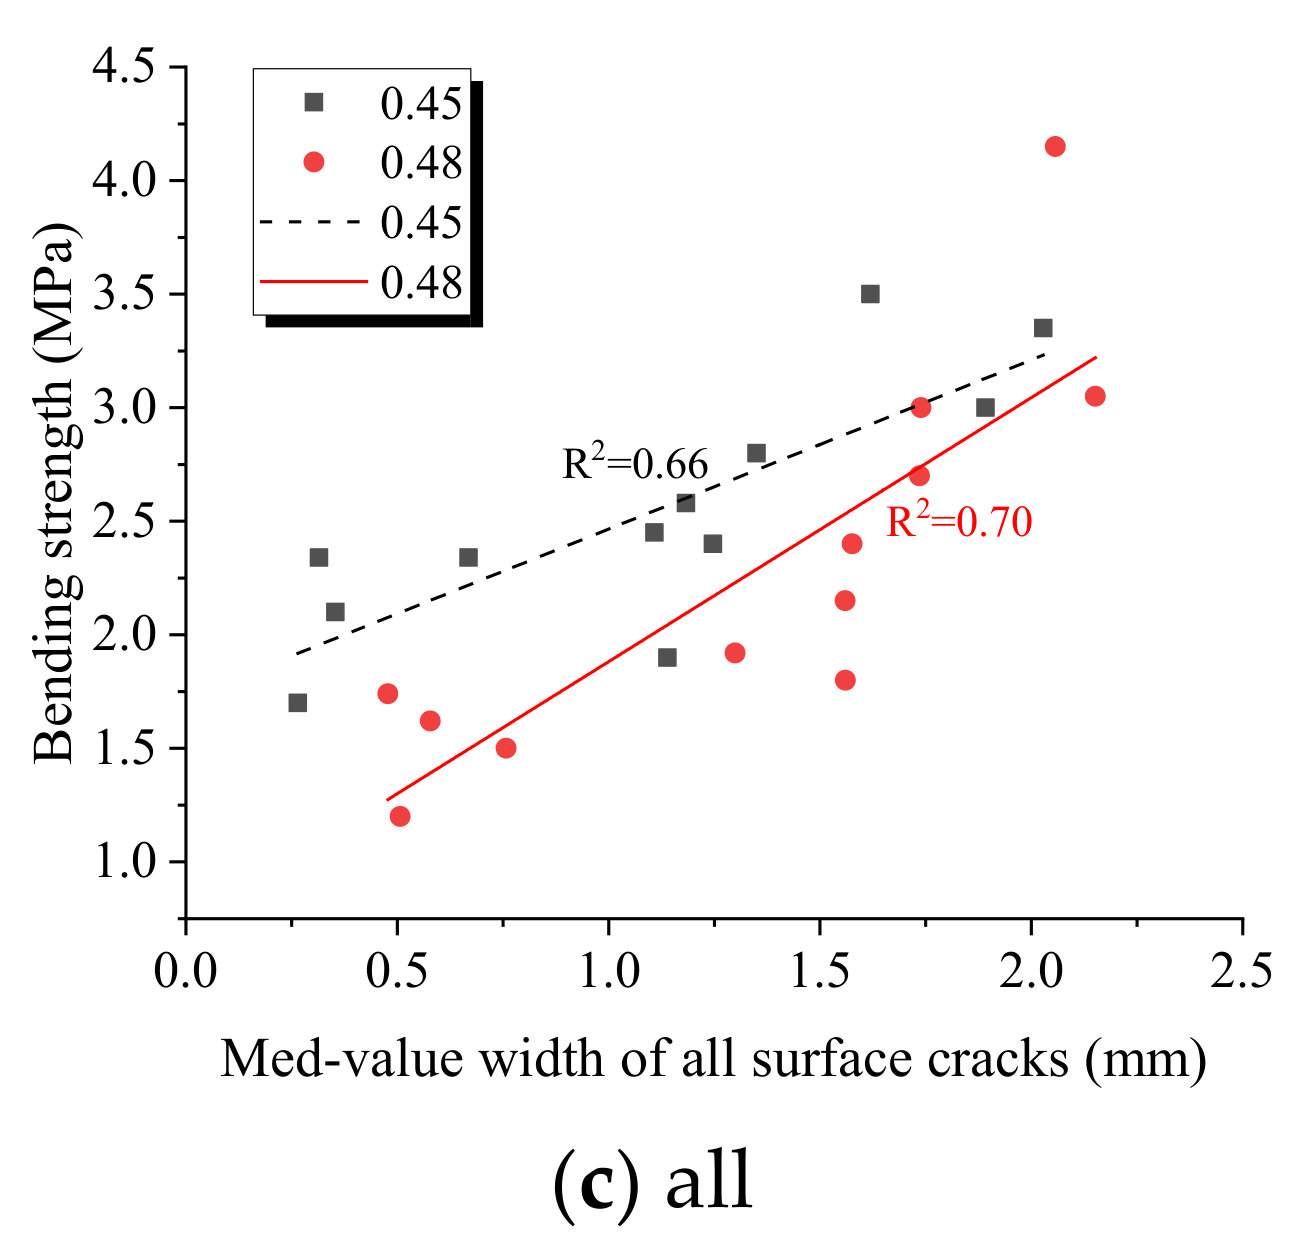
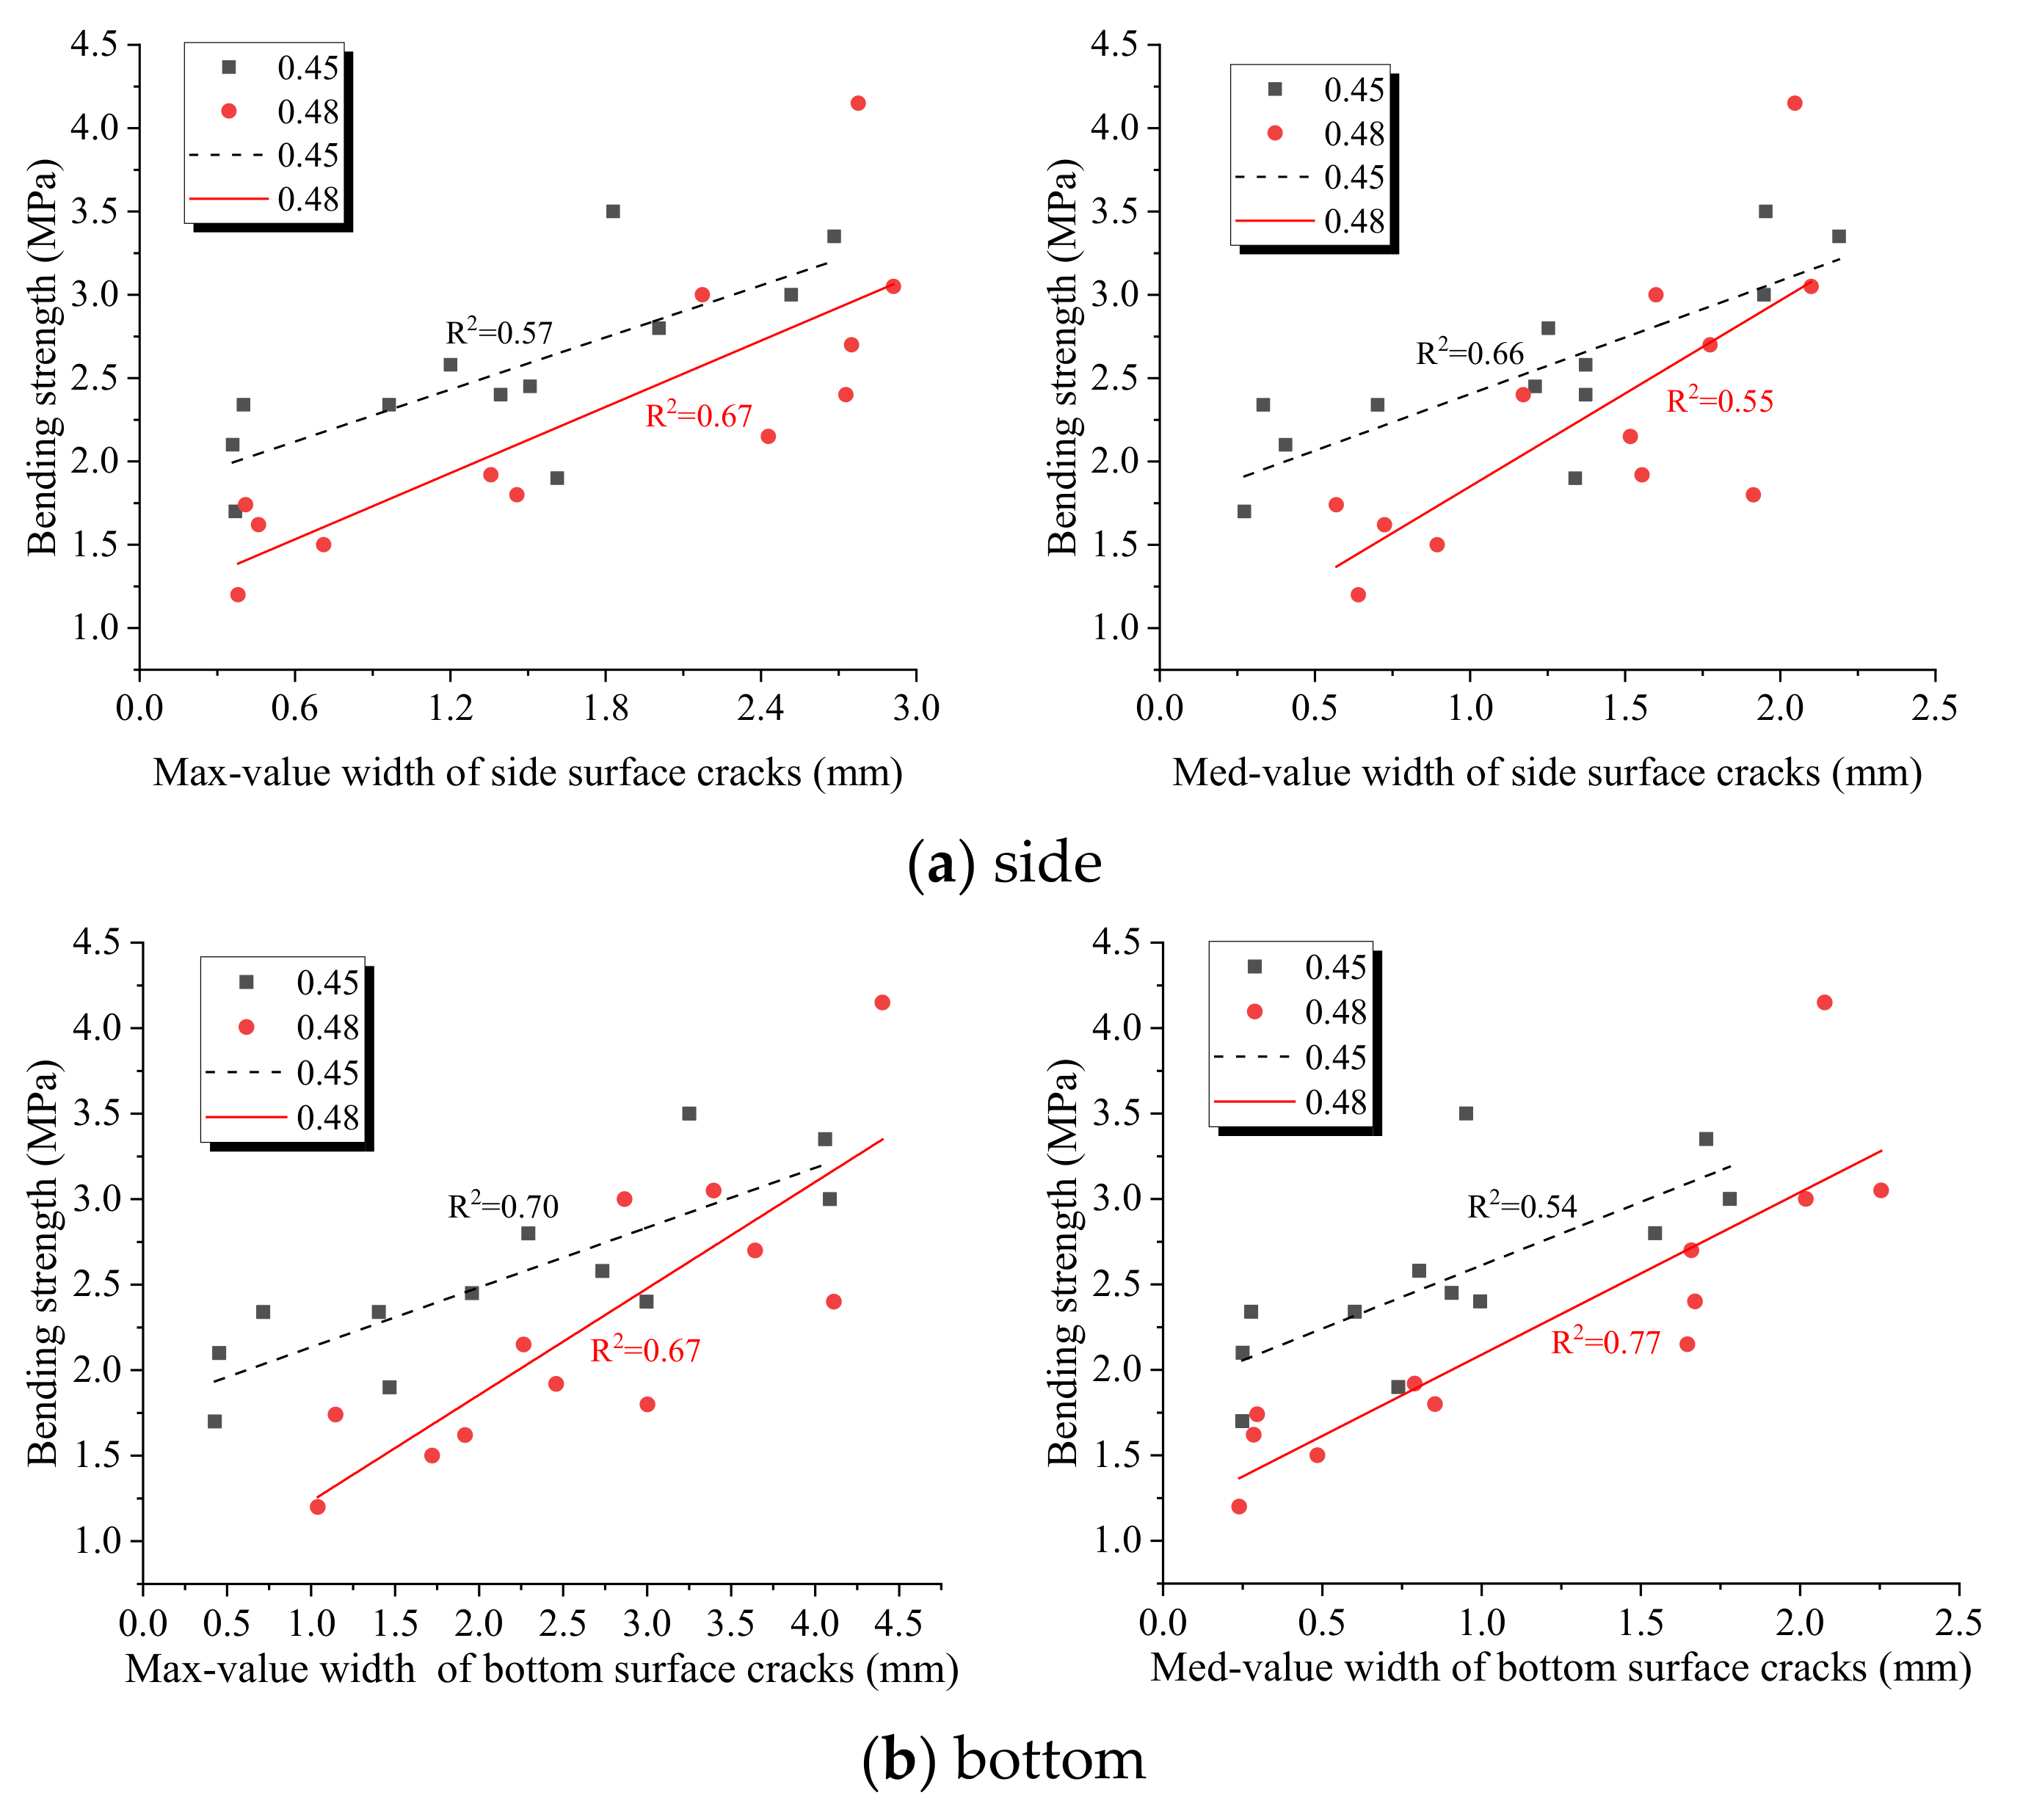
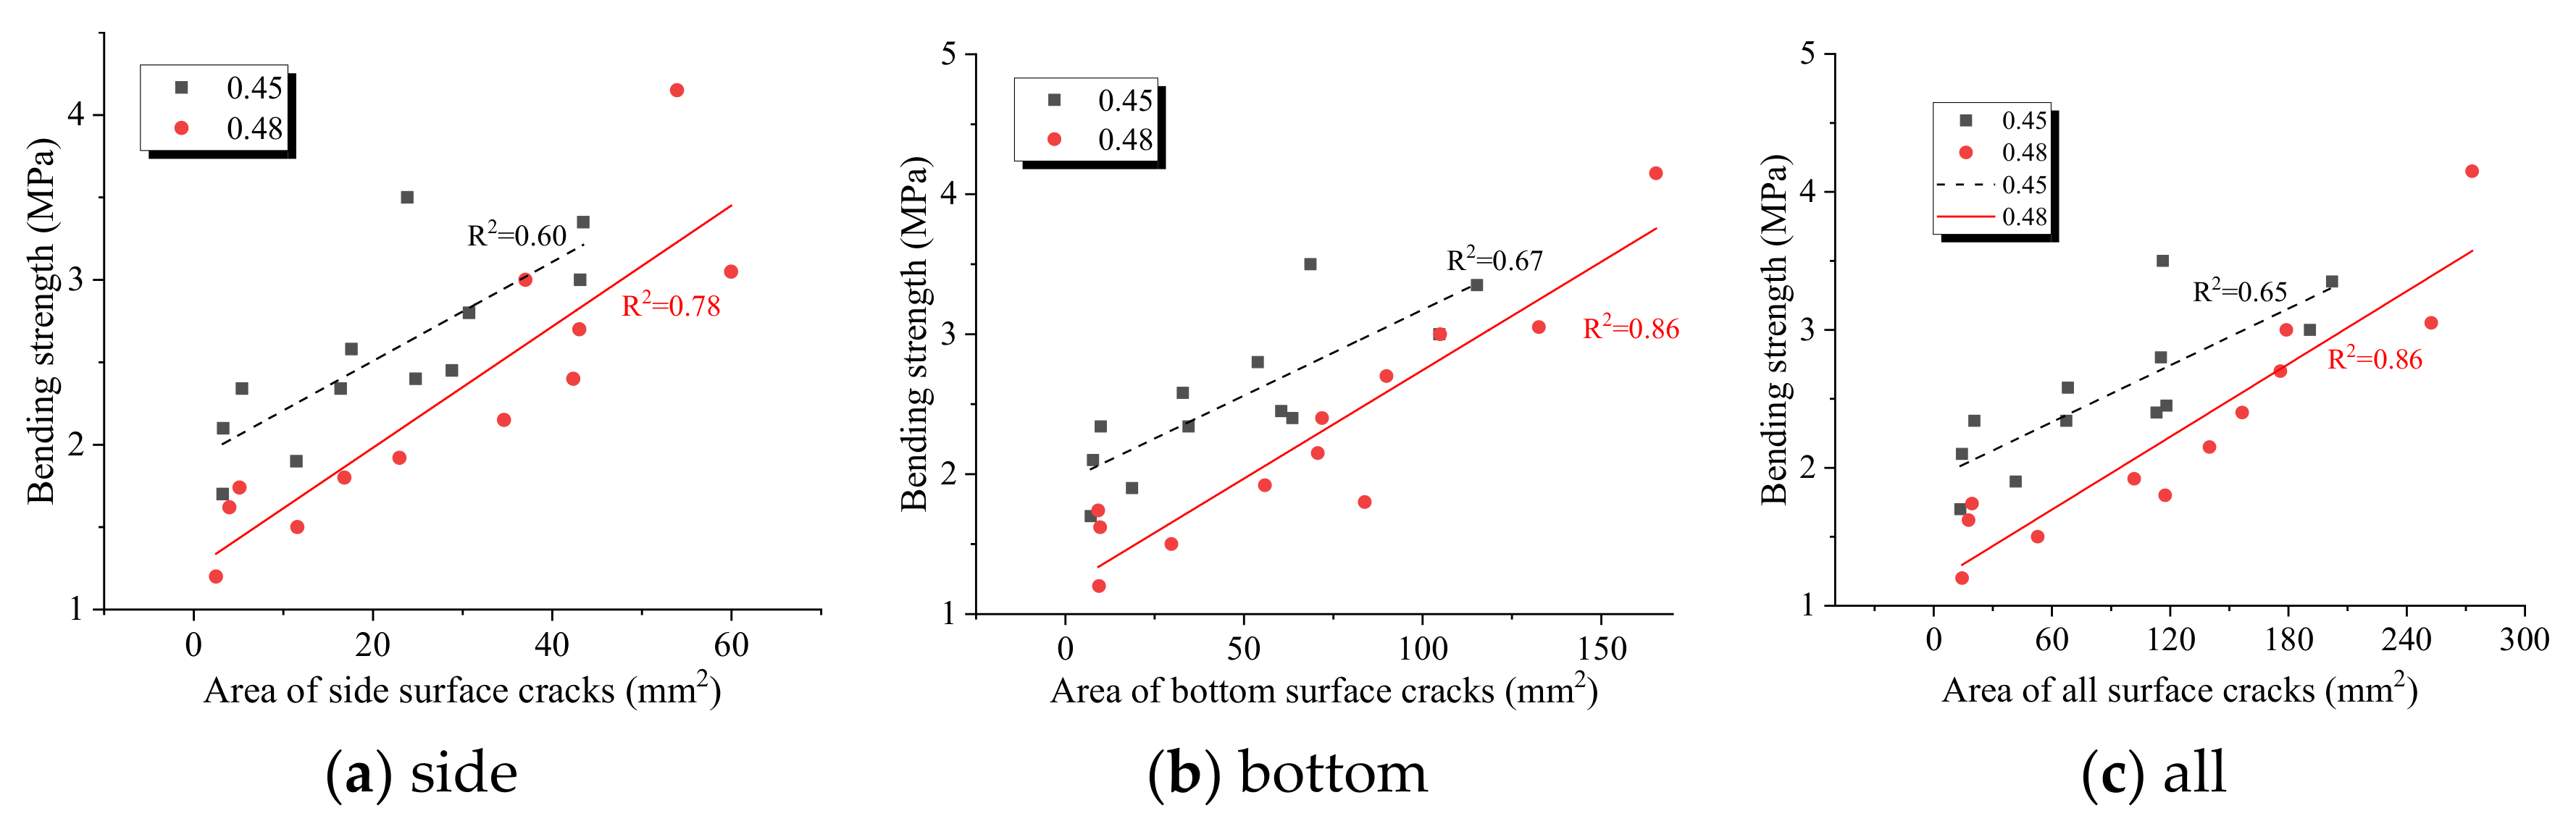
(6) The influence of various crack parameters on the flexural strength is in order of the crack area, width, length, and fractal dimension.


