Article

RMF-Net: Regional Multi-Mode Fusion Network for Fractal-Aware EEG Motor Imagery Decoding

School of Computer Science, Northwestern Polytechnical University, Xi’an 710129, China
*
Author to whom correspondence should be addressed.
Fractal Fract. 2026, 10(8), 510; https://doi.org/10.3390/fractalfract10080510
Submission received: 28 May 2026 / Revised: 14 July 2026 / Accepted: 25 July 2026 / Published: 27 July 2026

Abstract

Motor Imagery (MI) decoding based on electroencephalogram (EEG) is promising for Brain–Computer Interface (BCI) applications, yet existing methods generally suffer from two major limitations. (1) Global EEG signal analysis overlooks region-specific neural activity patterns, causing biased feature extraction and poor inter-subject generalization. (2) Few MI-EEG decoding studies adopt frequency decomposition for multi-rhythm feature extraction. Even when adopted, conventional methods rely on predefined frequency bands and suffer from mode mixing, failing to preserve the inherent fractal self-similarity and nonlinear characteristics of EEG signals, restricting the extraction of fine-grained specific features. To address these issues, we propose RMF-Net, a novel model integrating brain region division and Multi-variable Variational Mode Decomposition (MVMD). The model partitions EEG into functional brain regions based on MI neural mechanisms, performs dynamic modal feature extraction for each region via MVMD, and enables efficient cross-regional spatiotemporal feature interaction through an adaptive fusion. On the BCI Competition IV 2a open EEG MI dataset, our model achieves 80.06% accuracy in cross-session tasks and 63.05% in cross-subject tasks, outperforming other mainstream methods. Further analysis verifies that the cross-regional feature weight distribution of RMF-Net conforms to neuroanatomical principles. This work demonstrates that the spatiotemporal feature fusion framework combining brain region segmentation and fractal-aware multimodal signal decomposition is effective for EEG MI decoding tasks.

1. Introduction

Brain–Computer Interface (BCI) technology enables direct communication between the central nervous system and external devices without peripheral nerve involvement by accurately decoding neural activity signals, providing highly valuable solutions for rehabilitation training and daily assistance for individuals with motor dysfunction [1,2]. Among various BCI signal acquisition modes, EEG has become the predominant signal carrier in clinical and research applications due to its non-invasiveness, high temporal resolution, and low cost [2,3]. Among various EEG-based induction paradigms, the MI paradigm relies on dynamic neural responses from the motor cortex and associated brain regions (e.g., event-related desynchronization of μ and β waves) [4], generating labelable signals that carry the subjective intentions of the subject. This demonstrates that the decoding accuracy of MI-EEG signals is the key determinant of the practical performance of BCI systems, making it a critical research focus in this field [5].
Early MI-EEG decoding primarily employed traditional machine learning methods, such as the Common Spatial Pattern (CSP) algorithm, which extracts discriminative spatial features by maximizing the inter-class variance ratio, demonstrating remarkable performance in binary classification tasks [6]. However, these methods rely on manually designed features, making them unsuitable for multi-class classification tasks and lacking robustness to non-stationary EEG signals. The integration of deep learning enables end-to-end modeling for MI-EEG decoding: EEGNet utilizes depthwise separable convolution to extract spatiotemporal joint features, markedly boosting performance in multi-class classification tasks [7], and IFNet enhances decoding performance through multi-band feature fusion, demonstrating the value of time–frequency features [8]. Moreover, to enhance spatial modeling capabilities, several studies have incorporated Graph Neural Networks (GNNs), such as LGGNet [9], which combine graph convolution with neurophysiologically inspired priors of brain functional connectivity and demonstrate outstanding performance in classification tasks. Since then, EEG signal processing models employing frequency decomposition strategies have emerged. To effectively extract features from different frequency bands of EEG signals, only a few models apply targeted frequency decomposition operations, such as AE-FBCSP [10]. This method integrates an autoencoder with a filter bank structure to decompose EEG signals and mine frequency-related patterns, alleviating partial limitations of traditional MI-EEG decoding methods, such as insufficient frequency feature utilization. Nevertheless, such filter-bank-based schemes still rely on manually predefined frequency boundaries, lack adaptive optimization for individual EEG oscillatory characteristics, and remain susceptible to mode mixing, leaving multi-rhythm collaborative feature extraction insufficiently explored.
Although deep learning and other methods have made remarkable progress in EEG signal classification tasks in recent years, existing studies still face two limitations. Firstly, the brain can be divided into distinct functional regions based on task requirements, each with its own unique dominant oscillation frequencies, information encoding patterns, and functional roles [11,12]. For example, the motor cortex is dominated by μ (8–13 Hz) and β (13–30 Hz) rhythms responsible for encoding motor intentions and control-related information [4], whereas the sensory association cortex focuses on γ-band (above 30 Hz) signal transmission and participates in motor–sensory integration [13]. However, most studies uniformly process whole-channel EEG signals as a single entity during feature extraction without conducting targeted division or differential analysis of individual functional regions. This approach usually fails to accurately capture the unique contributions of each region in cognitive tasks such as MI and makes it difficult to elucidate the underlying patterns of inter-regional functional synergy and information exchange. Consequently, the extracted features lack regional specificity and fail to adequately reflect the physiological operational mechanisms of the brain. Secondly, EEG signals include inherently separable frequency sub-bands (e.g., μ 8–13 Hz, β 13–30 Hz, low   γ 30–45 Hz) that show complementary sensitivity to task-related neural dynamics [4]. Nevertheless, most current mainstream approaches still predominantly extract features directly from multi-channel EEG treated as a single broadband signal, which hinders the accurate capture of brain-region-specific functional neural oscillations and thus degrades the specificity and purity of extracted features. Even when conventional frequency decomposition is adopted, it still suffers from inherent drawbacks: fixed manually predefined frequency bands fail to adapt to inter-subject oscillatory discrepancies, and mode mixing makes it hard to isolate pure task-related rhythmic components. Such methods yield poor robustness against non-stationary EEG and artifacts and rely heavily on manual parameter tuning. In addition, most frequency-decomposition-based EEG decoding methods still adopt channel-wise independent decomposition without imposing global multi-channel constraints, failing to exploit multi-channel redundancy for joint denoising. They ignore electrode spatial topology and inter-channel synchronous oscillations, causing inconsistent decomposition results and difficult rhythmic alignment. Meanwhile, these conventional linear decomposition methods used in such models fail to capture the inherent nonlinearity and fractal characteristics of MI-EEG signals, which are key to reflecting the complex dynamics of neural activity, directly limiting the ability to capture and generalize complex spatiotemporal patterns of MI-EEG [14,15,16]. These two limitations restrict the performance of the model and reduce their generalization ability.
To solve the problems above, we propose the Regional Multi-mode Fusion Network (RMF-Net) for EEG signal classification. The model enhances EEG feature richness and discriminative power by partitioning raw EEG signals into distinct brain regions for independent feature processing, which conforms to the inherent independent functional operation patterns of different brain regions [17]. MVMD decomposition is applied independently to signals of each brain region. Leveraging its adaptive bandwidth optimization, modal orthogonality constraints, and multi-channel joint optimization [18], this method accommodates well the inherent nonlinear and fractal characteristics of non-stationary EEG [15] and fully exploits the multi-rhythmic collaborative encoding mechanisms inside of each functional brain region, thereby enhancing the richness and discriminability of EEG features. The mode time attention mechanism is used to assign weights to each mode component based on task relevance, and then the fused features are adaptively fused with the original signals to fully extract and enhance the brain-region-specific signal features. Finally, the channel attention and channel shuffle mechanisms are used to evaluate the importance of features and fuse information across different brain regions, thus corresponding to the optimal allocation mechanism of brain resources as well as the neural connection and information integration between brain regions [19]. RMF-Net effectively addresses the limitations of traditional methods in adapting to the spatiotemporal characteristics of brain regions and facilitating inter-regional information integration. This fully demonstrates the physiological interpretability of the model and enhances its generalization capability. The main contributions of our work are summarized as follows:
  • Neuroanatomically inspired brain region division. RMF-Net employs a brain-region-based feature extraction architecture, dividing EEG channels into independent modules based on anatomical–functional correspondences to address the neuroresponse specificity of different brain regions in MI tasks. Each module independently extracts fine features, ultimately achieving effective fusion and decoding of multi-brain-region features.
  • Fractal-aware intra-brain region MVMD decomposition. MVMD is employed in regional feature processing pathways to extract Intrinsic Mode Functions (IMFs) from EEG signals. The complementary integration of different modal features is achieved via a time attention mechanism, followed by adaptive fusion of these cross-modal features with the original signal to enhance the representation capability of the model for complex EEG signals.
  • Fusion of cross-brain region. RMF-Net employs a channel attention layer to dynamically weight regional features and a channel shuffle layer to drive full cross-region interaction. A residual branch is embedded in the module to ensure efficient and stable cross-brain-region feature integration.

2. Materials and Methods

2.1. Dataset and Data Processing

We evaluate our method on the public BCI Competition IV 2a dataset (BCIC-IV-2a), which is a classic EEG MI benchmark covering multi-channel EEG and EOG signals from 9 healthy subjects. The dataset was collected using 22 Ag/AgCl electrodes at a sampling rate of 250 Hz. The raw EEG signals were preprocessed through 0.5–100 Hz band-pass filtering and 50 Hz notch filtering to effectively suppress power frequency interference. In addition to the EEG channels, 3 additional unipolar electrodes were set up for eye movement artifact monitoring. Each subject was required to complete 4 types of MI tasks, corresponding to left-hand, right-hand, bilateral foot, and tongue movements, with each task comprising 72 trials. The experiment was conducted in 2 independent sessions, which constituted the training set and the test set, respectively, with a total of 288 experimental data points per session. The amplifier’s sensitivity was set to 100 μV to ensure signal amplitude resolution. This dataset serves as a standardized benchmark for the research and evaluation of algorithms for EEG signal processing and decoding in MI tasks [20].
We also employ the PhysioNet dataset as an extended dataset to comprehensively evaluate the cross-dataset generalization ability of the proposed model. This high-density whole-brain open EEG dataset contains recordings from 109 healthy subjects. Signals were acquired via the BCI2000 system (Wadsworth Center, New York State Department of Health, Albany, NY, USA) with a 64-electrode scalp montage (60 scalp EEG channels and 4 EOG artifact channels) following the extended international 10–10 system at a sampling rate of 160 Hz. Each subject completed 14 recording sessions, including two resting baseline runs (eyes open and eyes closed) and four motion-related paradigms consisting of two actual movement tasks and two MI tasks: single left/right fist movements and combined fist/foot movements. In this study, we select only the two MI classes for binary classification. Moreover, the original 160 Hz signals are resampled to 250 Hz to align the sampling frequency with BCIC-IV-2a dataset [21,22].

2.2. RMF-Net

Figure 1 illustrates the architecture of our proposed Regional Multi-mode Fusion Network (RMF-Net) tailored for the BCIC-IV-2a dataset, which consists of four functional brain regions and four core modules. The feature processing of brain region information corresponds to modules (a) (b), while the interactive fusion of features between brain regions (Cross-Region Fusion Block) corresponds to module (c). As shown in Figure 1a, based on anatomical principles and the characteristics of the MI task, the EEG signal channels are divided into four functional regions: motor cortex, frontal, parietal, and motor adjacent. The original signals of each brain region are decomposed into a set of IMFs via MVMD. As shown in Figure 1b, the four IMFs are fed into the time attention layer, where weights are assigned to each time point of each mode for fusion. It consists of two 1 × 1 convolutional layers: the first layer compresses the channel dimension C to C/4, and the second layer maps the compressed feature to the number of MVMD modes M. The resulting cross-modal information features, together with the original brain region signals, are then fed into the adaptive fusion, where two 1 × 1 convolutional layers (C to C and C to 2) are employed to assign weights for their aggregation. The final fused signal features are fed into the feature extraction layer, where spatiotemporal features are further extracted using spatial and temporal convolutions. All processing components within each brain region are independent and adapted to the specific rhythms of the region. As shown in Figure 1c, the features extracted from different brain regions are concatenated and fed into the Squeeze-and-Excitation (SE) Block to assign weights to each channel. The features are then fed into the Shuffle Block for channel shuffling to fuse the features from various brain regions. A residual connection is further introduced into the entire module to ensure stable feature propagation during the fusion process. As shown in Figure 1d, the fused features undergo the 1   ×   1 convolutional feature reduction, followed by the pooling and fully connected layer to produce the final classification output. The detailed layer-wise architecture and parameter statistics of RMF-Net are provided in Appendix A Table A1.
The above brain region division strategy is customized for the BCIC-IV-2a dataset. For other datasets, only the dividing rules of brain regions require adjustment corresponding to their electrode configurations, and all other modules maintain the same structure.

2.2.1. Neuroanatomically Inspired Brain Region Division

Despite inter-subject variations in scalp anatomical structure, MI-evoked neural activation intensity, and electrode contact impedance [23], we adopt a unified anatomical framework for electrode regionalization without subject-specific adjustments to brain region boundaries. Within one dataset, brain region boundaries are fixed for all subjects without subject-specific adjustments; for other datasets with distinct electrode arrangements, the brain partition settings are modified correspondingly. This unifies the detailed brain region partitioning rules for different individuals within each dataset, removes confounding artifacts from inconsistent grouping standards, and ensures fair, reproducible experimental comparisons.
Based on prior neuroscientific knowledge that MI neural activities exhibit distinct anatomical localization and that functional segregation of brain regions ensures the initiation, regulation, and integration of MI-related information [4], we thus perform functional brain region division on the EEG electrode channels of the BCIC-IV-2a dataset [20]: the C3, C1, Cz, C2, and C4 electrodes are assigned to the motor cortex region, serving as the core brain area for initiating and regulating neural activities related to MI [19]; the FC3, FC1, FC2, FC4, C5, and C6 electrodes are classified as the motor adjacent region, which is co-activated to assist the motor cortex in processing MI sensory–motor information [24]; the Fz and FCz electrodes are incorporated into the frontal region, which is primarily responsible for cognitive control of MI tasks and motor intention planning; and the CP3, CP1, CPz, CP2, CP4, P1, Pz, P2, and POz electrodes are assigned to the parietal region, involved in spatial encoding and sensory integration for MI tasks [25].
For the high-density 60-channel scalp EEG data of the extended PhysioNet dataset recorded under the extended international 10–10 electrode montage [26], we adopt the same brain region division strategy as that applied to the BCIC-IV-2a dataset to realize more refined electrode grouping. The motor cortex region includes electrodes Cz and CPz; the motor adjacent region encompasses FC3, C3, CP3, FC4, C4, CP4; the frontal region covers all prefrontal and frontocentral electrodes (FP1, FPz, FP2, AF3, AF4, F7, F3, Fz, F4, F8, FCz); and the parietal region contains the electrodes distributed over central and posterior parietal areas (CP1, CP2, P7, P3, Pz, P4, P8, PO3, POz, PO4, CP5, CP6, P5, P6, PO7, PO8). Benefiting from the full scalp coverage of high-density electrodes, we further define three extra brain regions: the temporal region consists of all bilateral temporal electrodes, FT7, T7, TP7, P7, FT8, T8, TP8, P8, T9, TP9, T10, and TP10, which participate in auxiliary somatosensory information processing [27,28]; the occipital region includes all occipital electrodes, PO9, O1, Oz, O2, PO10, and Iz, which are mainly responsible for visual processing and exhibit no distinctive neural activation in MI tasks [27]; and the peripheral region contains six outermost scalp electrodes, TP9, TP10, T9, T10, FT9, and FT10, which are far from central motor areas and deliver marginal discriminative power for MI classification [27].

2.2.2. Intra-Region MVMD Modal Decomposition

To process raw EEG signals of each brain region, we adopt Multi-variable Variational Mode Decomposition (MVMD). In the decomposition process, MVMD explicitly incorporates the spatial dimension of multi-channel signals into the optimization objective function. By imposing constraints to unify the central frequency across all electrodes and simultaneously estimating the phase and energy coupling relationships between channels, it directly integrates the cross-lead spatial collaborative structure into the modal definition [18]. The bandwidth penalty term and multi-channel consistency constraint work together to effectively suppress artifacts such as electromyographic (EMG) and electrooculographic (EOG) signals, enabling adaptive separation of typical brain rhythms, including δ , θ , α , β , and γ , while ensuring spatial topological consistency across modes [18]. As a nonlinear adaptive decomposition tool, MVMD fits the non-stationary and inherent fractal self-similarity characteristics of raw MI-EEG. The modal signals derived from MVMD exhibit enhanced physiological interpretability and spatial coherence, naturally aligning with the multi-channel and spatiotemporal coupling characteristics of EEG signals. This approach captures the frequency band with the highest concentration of neural oscillation energy in brain regions, thereby establishing a robust foundation for subsequent feature extraction.
For each trial sample n     N of raw EEG signals per brain region, the signal is denoted as x n     R C × T (C = regional channel number). MVMD decomposes it into K principal modes u n ,   k K k = 1   ( u n ,   k     R C × T ), where all channels share a common set of center frequencies ω k , and adaptive modal separation is realized via bandwidth minimization and multi-channel consistency constraints, with the optimization objective given by
  m i n u n ,   k ,   ω k k = 1 K t [ H ( u n ,   k ) e j ω k t ] 2 2                     s . t .   k = 1 K u n ,   k ( t ) = x n ( t )
where H ( x ) denotes the Hilbert transform. This constraint enforces cross-channel phase alignment to preserve spatial coordination between electrodes. The optimal solution is derived via the Alternating Direction Method of Multipliers (ADMM) [18], with the algorithm terminating when both the original and dual residuals drop below 10 2 .

2.2.3. Cross-Region Fusion Mechanism

  • Channel Attention Mechanism.
To explicitly model inter-channel dependencies, we integrate a channel attention mechanism into the Cross-Region Fusion Block. The Squeeze-and-Excitation (SE) Block adaptively adjusts channel weights to prioritize effective feature channels and suppress irrelevant ones, mimicking the neural gain regulation mechanism in the brain, which focuses on core regions (e.g., the motor cortex in MI tasks) and minimizes interference from peripheral areas [29,30].
The extracted features from each brain region are concatenated to obtain X     R B × T × C , where B and T represent batch size and time step length, respectively, and C denotes the number of channels. The SE Block consists of three core steps: Squeeze, Excitation, and Scale [31]. The overall formula is as follows:
S E ( X ) = F s c a l e ( X , F e x c ( F s q u e e z e ( X ) ) )
The first Squeeze operation performs global average pooling on the feature maps of each channel along the temporal ( T ) dimension, compressing the 2D feature maps of each channel into a global feature vector. This process aggregates temporal dimension information, mirroring the integration of neural signals from local brain regions [32]. The formula is as follows:
z C = F s q u e e z e ( X C ) = 1 T t = 1 T X C ( t )
where z R B × C represents a global mean corresponding to each channel in every sample. X C denotes the feature map of the C -th channel, where z C denotes the global feature value of this channel.
The second Excitation operation learns inter-channel dependencies via two fully connected layers and activation functions, generating adaptive weights for each channel. The formulas are as follows:
s = δ ( W 1 z )
w = σ ( W 2 s )
where W 1 R ( C / r ) × C denotes the dimension-reducing fully connected layer and W 2 R C × ( C / r ) denotes the dimension-expanding fully connected layer. δ denotes the Relu function, σ denotes the sigmoid function, and r is the reduction ratio ( r e d u c t i o n ), with the model setting r e d u c t i o n = 1 .
The final Scale operation enhances effective channels and suppresses ineffective ones by multiplying the weight w C with the feature map X C of the corresponding channel element-wise, corresponding to the neural gain regulation mechanism in the brain [33].
2.
Channel Shuffle Mechanism.
Additionally, to address the channel information isolation issue caused by independent feature extraction across brain regions, we also implement the channel shuffle mechanism (Shuffle Block) in the Cross-Region Fusion Block. This mechanism achieves information mixing through explicit channel rearrangement, relying solely on dimensional transformation throughout the process without introducing any learnable parameters or incurring additional computational overhead, ultimately enabling feature information exchange between different brain regions [34].
For the X R B × C × T obtained through SE Block processing, where B and T denote batch size and time step length, C represents the number of channels and G denotes the number of brain regions ( G = 4 in the model). The entire channel shuffling process can be decomposed into three steps: Reshape, Transpose, and Flatten [34].
The first reshape operation enables channel grouping by splitting the original channel dimension into inter-regional and intra-regional dimensions, transforming X into X r e s h a p e R B × G × C g × T , as shown in the formula below:
X r e s h a p e = r e s h a p e ( X , G , C g , T )
where G denotes the number of brain regions ( G = 4 in the model) and C g = C / G represents the number of channels allocated to each brain region.
The second Transpose operation rearranges cross-regional channels by swapping the inter-regional dimension ( G ) and the intra-regional dimension ( C g ), transforming X r e s h a p e into X t r a n s p o s e R B × C g × G × T , as shown in the formula below:
X t r a n s p o s e = t r a n s p o s e ( X r e s h a p e , d i m = 1 , d i m = 2 )
The final Flatten operation restores the original tensor structure by merging the intra-group channel dimensions with the group dimensions into a new channel dimension, flattening X t r a n s p o s e into X o u t R B × C × T , as shown in the formula below:
X o u t = r e s h a p e ( X t r a n s p o s e , B , C , T )

2.3. Experiment Settings

Unless otherwise specified, all experiments are conducted on the BCIC-IV-2a dataset. The network is trained with cross-entropy loss and the Adam optimizer using a learning rate of 2 × 10⁻⁴, weight decay of 0.01, and a batch size of 32. Unless otherwise specified, a random seed of 2024 is used for both training and testing. All experiments are implemented on an NVIDIA RTX 4060 (NVIDIA Corporation, Santa Clara, CA, USA) with PyTorch 2.7.0 and CUDA 12.8 (NVIDIA Corporation, Santa Clara, CA, USA). An early stopping mechanism with a patience of 150 epochs is employed starting from the 600th epoch. The total number of training epochs is set to 2000. To avoid repeated time-consuming decomposition operations within every training epoch, MVMD decomposition is performed as a preprocessing step prior to model training. For each subject, MVMD preprocessing for raw EEG data takes about 7 min, total training time is approximately 9–10 min, and each test epoch only requires 0.15–0.17 s. Unless stated otherwise, the default MVMD hyperparameters are set as 4 decomposition modes, bandwidth penalty factor alpha = 1000, ADMM convergence tolerance of 1 × 10⁻², and sampling rate of 1. Adaptive fusion employs convolution kernels with sizes of Cregion × Cregion and Cregion × 2, and the spatial and temporal convolution kernel sizes in each feature extraction are 64 × Cregion × 1 and 64 × 64 × 63, respectively, where Cregion denotes the number of channels corresponding to the brain region. The SE Block in the Cross-Region Fusion Block has a reduction ratio of 1. The size of the final average pooling layer is set to 125.

3. Results

3.1. Comprehensive Performance Evaluation

To comprehensively evaluate the effectiveness of our model, we conduct a cross-session comparison with nine mainstream models (ShallowNet [35], EEGNet [7], EEGTCNet [36], TS-SEFFNet [37], ATCNet [38], Conformer [39], BaseNet [40], CTNet [41], and MSCFormer [42]) on the BCIC-IV-2a dataset (Table 1). All competing models are reproduced under identical data preprocessing pipelines, training procedures, and hyperparameter configurations for fair comparison in this table. The results reveal that RMF-Net achieves better overall average performance, demonstrating its competitiveness in MI-EEG decoding.
We also adopt the Leave-One-Subject-Out (LOSO) strategy to assess the cross-subject generalization of RMF-Net on the BCIC-IV-2a dataset in Table 1. Experimental results show that the proposed model exhibits a notable advantage over other models in overall average performance, demonstrating its strong cross-subject generalization on the BCIC IV 2a dataset. The detailed classification metrics of the proposed model for each subject are listed separately in Appendix A, Table A2.
To further comprehensively assess the cross-subject generalization of our model beyond the BCIC-IV-2a dataset, we perform LOSO validation on 10 subjects selected from PhysioNet, with four baseline models included for comparison (ShallowNet [35], Conformer [39], CTNet [41], and MSCFormer [42]). All baseline models are reproduced under identical experimental setups, with detailed results presented in Table 2. Our model surpasses all baselines for over half of the subjects and attains the best overall average accuracy, confirming its superior cross-subject generalization and strong adaptability to individual EEG variability.

3.2. Attention Weight Visualization for Brain Region Segmentation

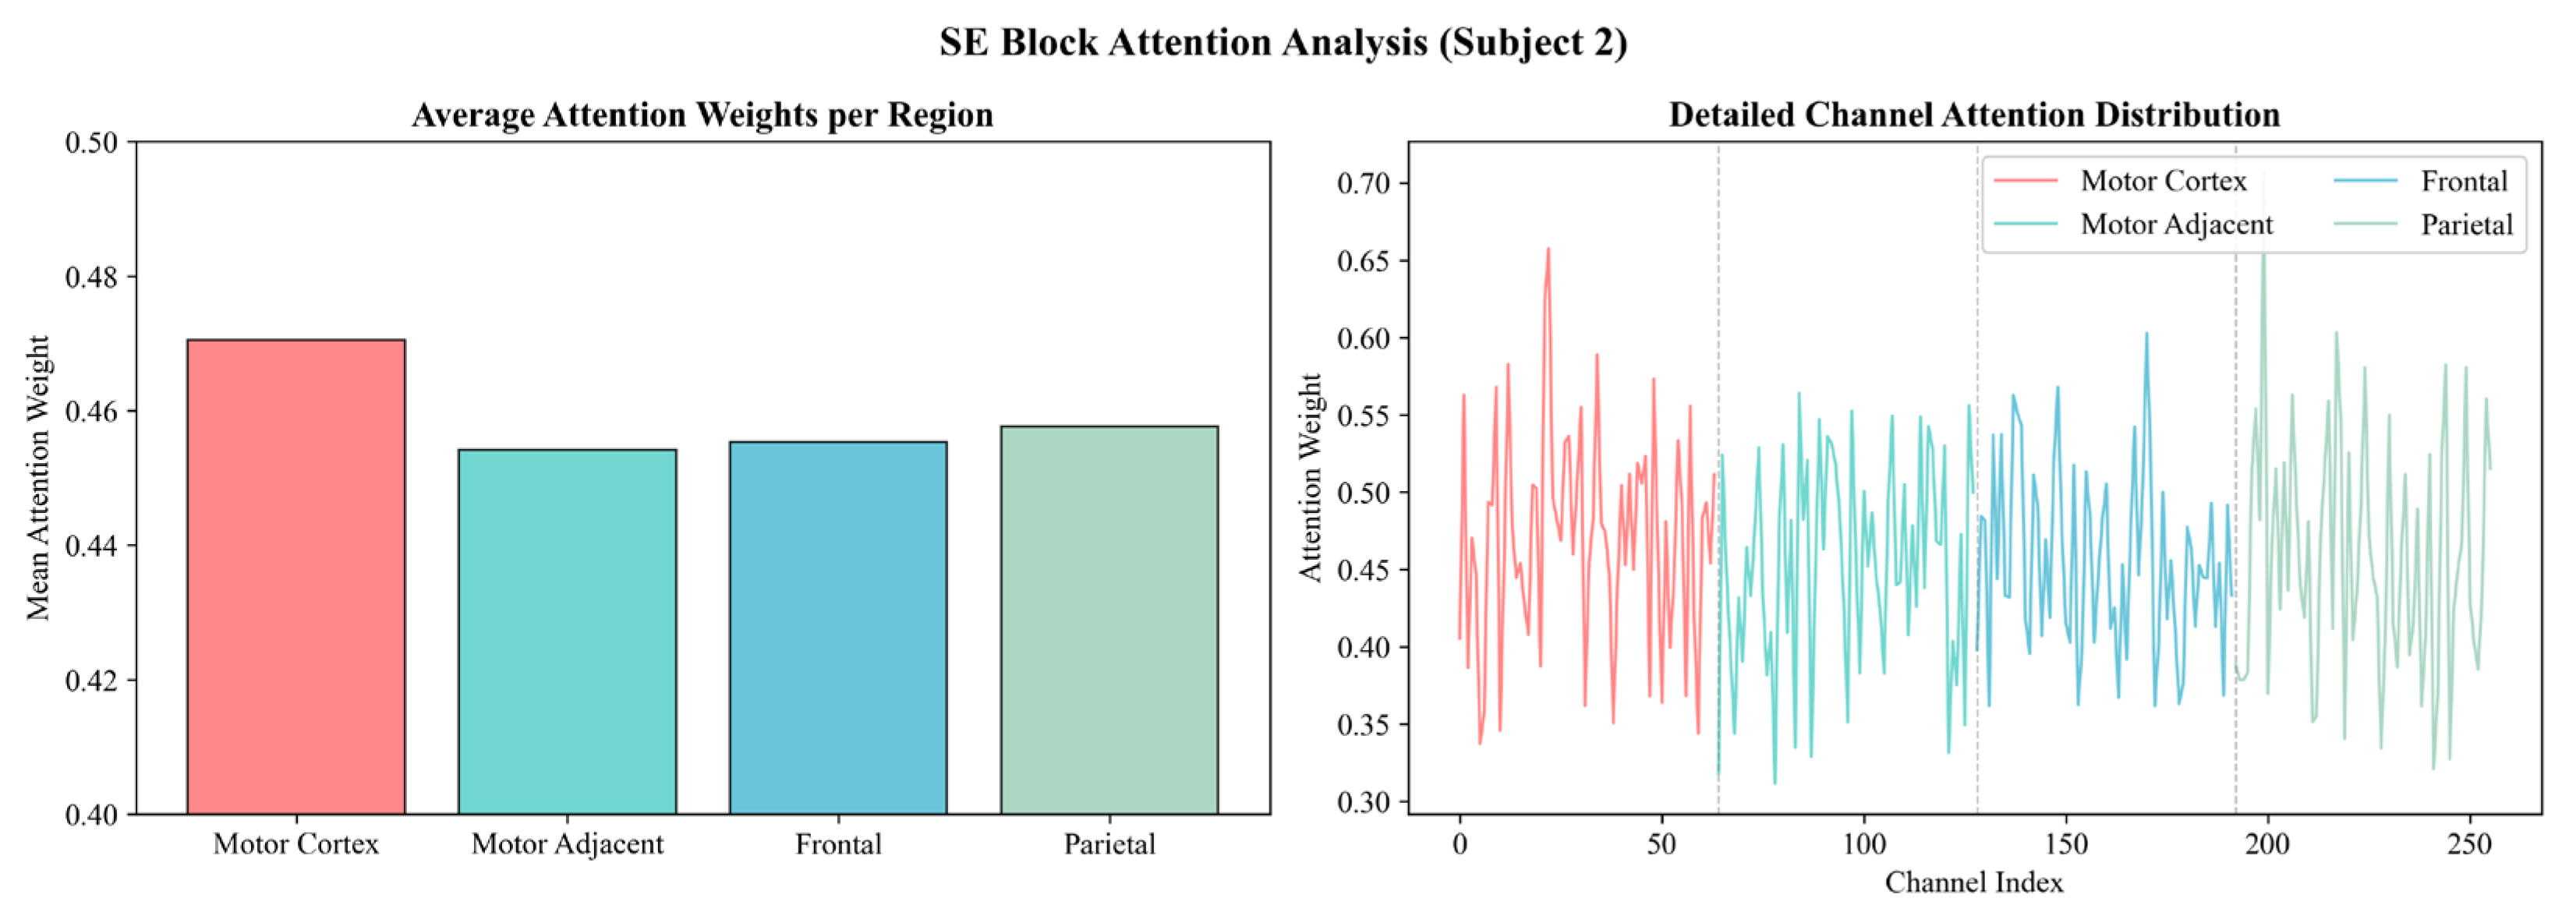
To evaluate the effectiveness of the method for brain region segmentation, we visualize the complete channel attention weights output by the SE Block in Cross-Region Fusion Block and compare the averages of each brain region of Subject 2 (Figure 2). The results show that distinct weights are assigned to the feature channels of each brain region and different brain regions receive distinct levels of emphasis. Notably, the motor cortex has the highest weights across all regions.

3.3. Analysis of MVMD Decomposition Performance

3.3.1. Fractal Feature Comparison of Different Decomposition Methods

To systematically compare the fractal characteristics of four decomposition methods (DWT [43], EMD [44], VMD [45], and MVMD [18]), we process EEG signals collected from the motor cortex of the 0-th trial sample in the training set of Subject 1. Uniform decomposition parameters are set for all algorithms to extract three fractal indicators of each IMF component—the fractal dimension (FD), Hurst exponent, and multifractal spectrum width (MFDFA width) [16,46,47,48]—with detailed results presented in Table 3.
The results reveal that raw EEG signals possess strong long-range dependence and evident multifractal features. Distinct discrepancies can be observed in the fractal metric distributions derived from different decomposition algorithms. For DWT, as the corresponding frequency of each component declines, FD decreases gradually while the Hurst exponent and MFDFA width keep rising. Valid MI rhythms are concentrated in high-order IMFs, and low-order components merely contain high-frequency noise, which manifests the issue of rhythmic distribution inversion. Although EMD exhibits a monotonic fractal trend similar to DWT, its Hurst exponent and MFDFA width evolve asynchronously. At the low-frequency IMF4, the Hurst exponent barely grows, while the MFDFA width surges sharply. This mismatch proves cross-layer leakage of multi-scale components in the nominal low-frequency mode, revealing severe mode mixing. Conventional VMD produces IMF components with scattered fractal indicators; its mid–low frequency components (IMF2) suffer sharp characteristic attenuation, leading to broken hierarchical continuity.
In contrast, the four IMFs decomposed by MVMD present regular and smooth gradient variations. FD rises steadily, while the Hurst exponent and MFDFA width decline synchronously with the increase in IMF order without abrupt characteristic mutations. Specifically, the high-order IMF3 and IMF4 decomposed by MVMD correspond to high-frequency bands, with relatively high FD, low Hurst exponents, and narrow MFDFA width. In contrast, low-order IMF1 and IMF2 cover low and mid-low frequency bands containing physiological oscillations, which exhibit low FD, Hurst exponents approaching 1, and broad MFDFA width.
Compared with DWT, EMD, and conventional VMD, MVMD provides clearer differentiation of fractal features among all IMF components. It can isolate frequency components with distinct fractal behaviors and achieves optimal multi-scale hierarchical decomposition performance.
Furthermore, we summarize the FD, Hurst exponent, and MFDFA width averaged across all trials based on motor cortex EEG signals of Subject 1 from the BCIC-IV-2a dataset (Table 4). The results demonstrate that the Hurst exponent and MFDFA width show statistically significant inter-class differences across MI categories. Combined with the superior multi-scale separation capacity of MVMD validated above, these findings jointly demonstrate that multifractal descriptors extracted via MVMD carry effective discriminative information for the four-class MI recognition of the BCIC-IV-2a dataset, thereby verifying the rationality of embedding fractal characterization into the proposed RMF-Net.

3.3.2. Optimization of MVMD Mode Number

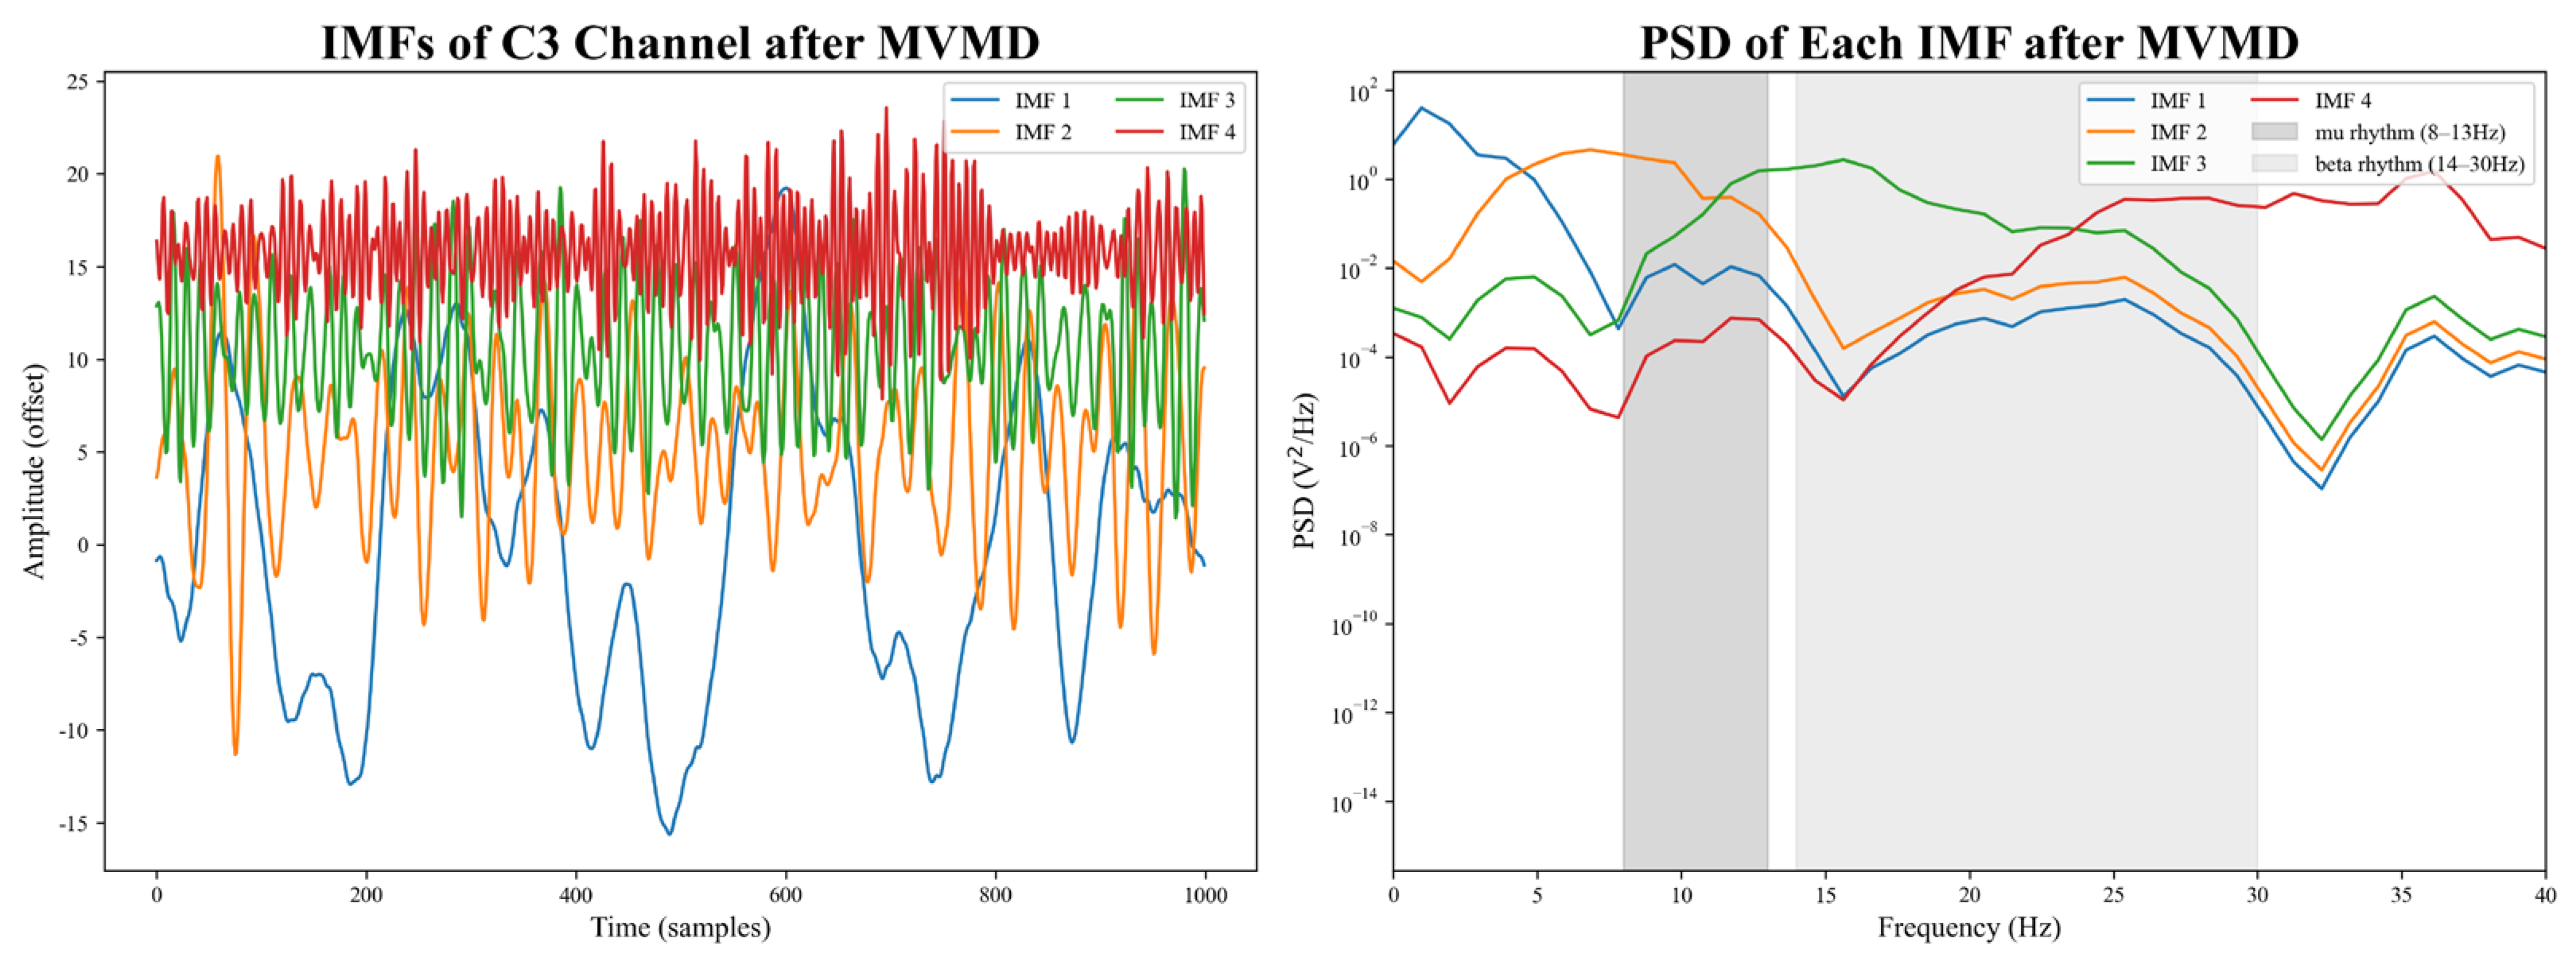
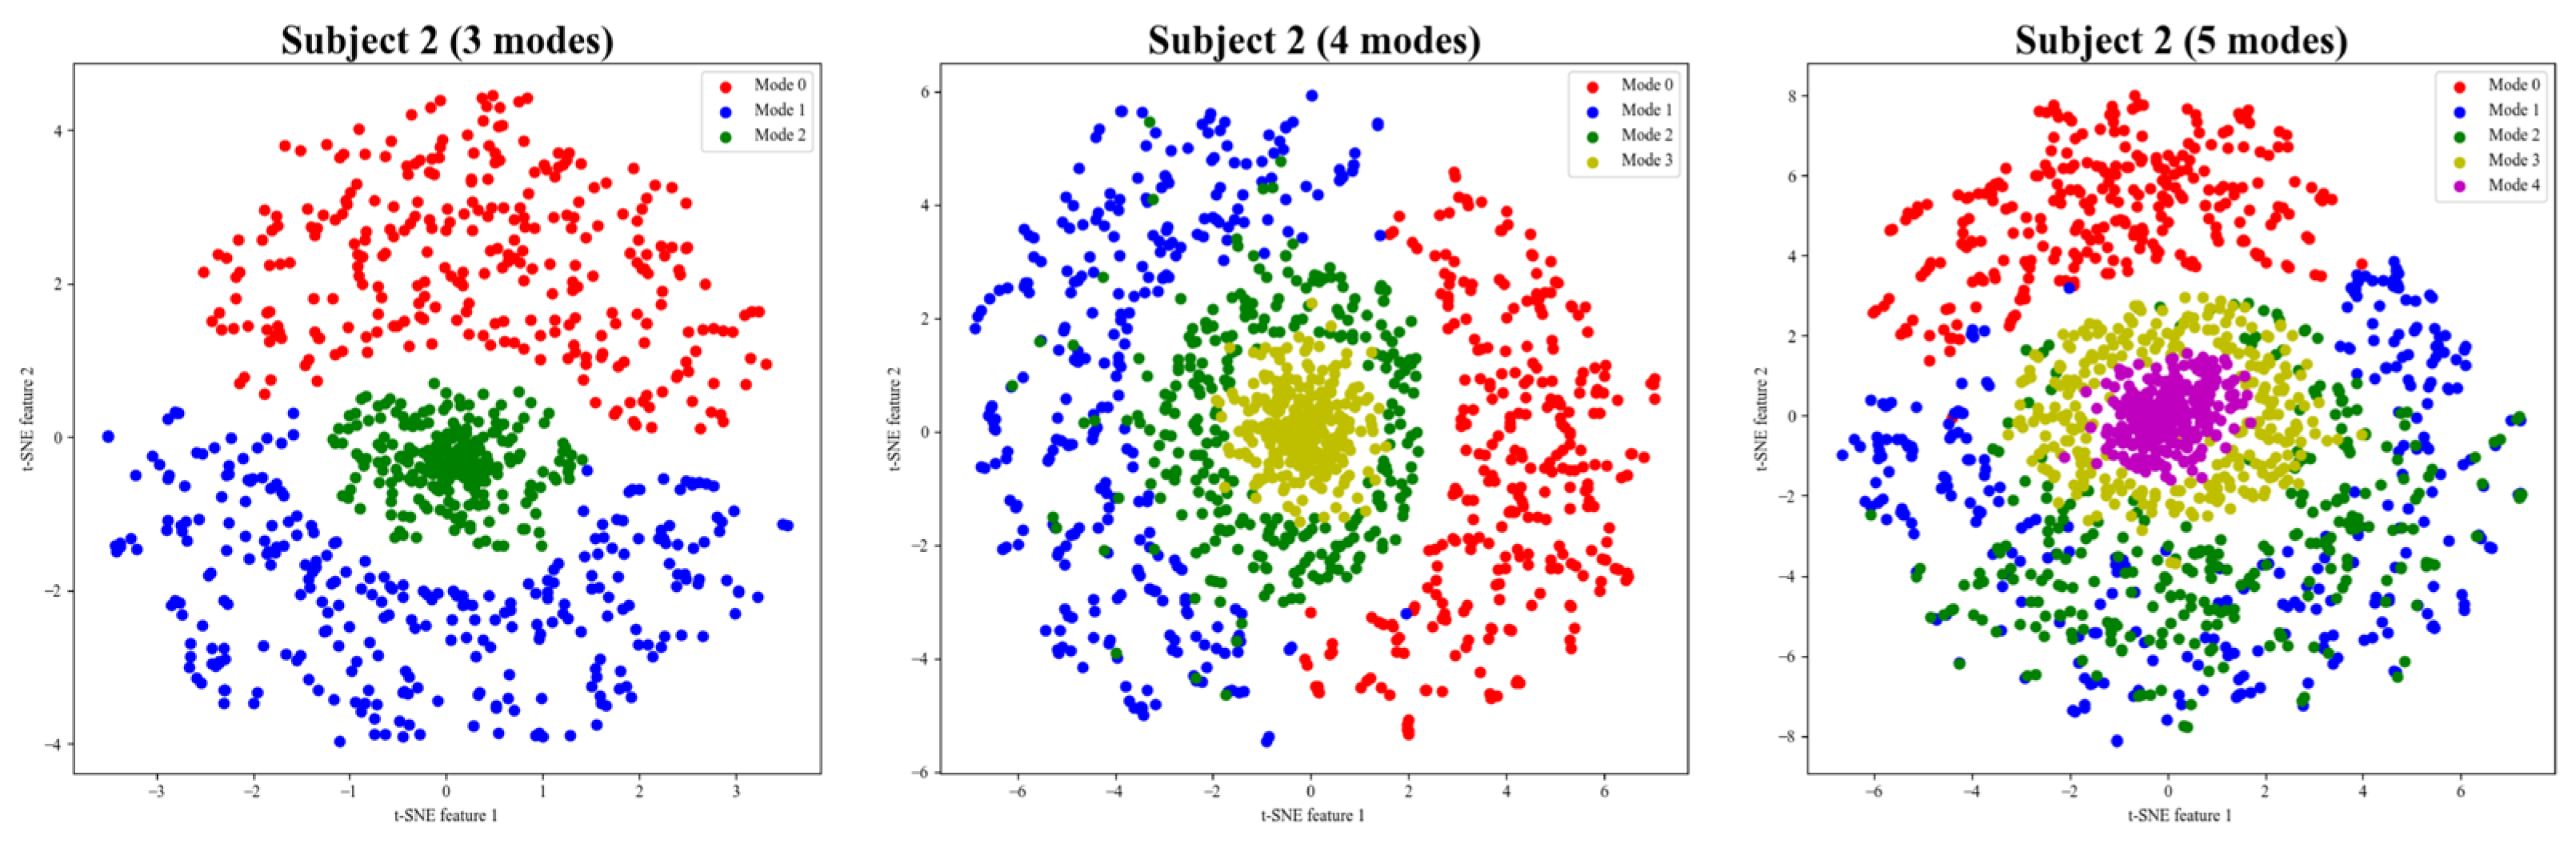
We select the C3 lead signal from the first trial of a single subject and perform Power Spectral Density (PSD) analysis on the intrinsic modal components (IMFs) obtained from MVMD. It can be observed from Figure 3 that the signal energy of each modal component is concentrated in distinct independent frequency bands. These modes exhibit distinguishable fractal complexity. Specifically, IMF2, IMF3, and IMF4 are primarily concentrated in the μ-rhythm (8–13 Hz) and β-rhythm (14–30 Hz) ranges. We also perform t-SNE visualization of Subject 2 to intuitively verify the decomposition effectiveness of MVMD with different mode numbers (Figure 4). Distinct inter-mode boundaries with no significant overlap are observed when the decomposed mode number is set to three and four, validating the effectiveness of MVMD. In contrast, an obvious overlap between Mode 1 and Mode 2 occurs at the mode number of five, indicating an over-decomposition phenomenon.
To enhance the decoding performance of the brain region processing module, we evaluate the optimal mode number for MVMD. Table 5 presents the impact of varying the number of decomposition modes (num_modes) on model performance, with the best result achieved at four modes. Furthermore, we explore the task dependence of the optimal MVMD mode number by using two typical binary tasks extracted from BCIC-IV-2a (Table 5). The optimal decoding performance is achieved with six modes. In contrast, the original four-class task performs best with four modes. These results indicate the optimal MVMD mode number is highly task-specific.

3.4. Analysis of the Cross-Region Fusion Block

To optimize model performance, we systematically evaluated the optimal reduction ratio of SE Block in the Cross-Region Fusion Block, thereby enhancing the effectiveness of the multi-region feature analysis mechanism. Table 6 demonstrates the impact of varying the reduction ratio ( r e d u c t i o n ) in SE Block on the overall model performance. The results show that when the reduction ratio is set to one, the model achieves optimal classification performance on almost half of the subjects and also reaches the highest overall average accuracy and the lowest standard deviation.
Moreover, to evaluate the contribution of each component in the Cross-Region Fusion Block to overall model performance, we also conduct ablation experiments on this module, with results in Table 7. The data shows that removing any component leads to performance degradation across different levels. The proposed model achieved the optimal results across four subjects, demonstrating the best overall performance.

3.5. Ablation Study of All Core Modules

To systematically evaluate the contribution of each core module to the overall performance, we conduct ablation experiments with all experiments using the same training parameter settings. Table 8 presents comparative results of three structural variants: (1) removing brain region division and analyzing all-channel EEG signals as a single global input; (2) removing MVMD and directly feeding raw EEG brain region signals into each brain region branch; and (3) removing the Cross-Region Fusion Block and directly concatenating the regional features from each brain region branch.
When removing the brain region division strategy, all electrode channels are fed into the network as a unified input without region-wise branch processing. Because the Cross-Region Fusion Block is designed to weight and exchange features across separate brain region branches, this module loses its functional foundation and is entirely eliminated. This setting differs from ablation case 3, where brain region division is retained while only the Cross-Region Fusion Block is discarded.
From the results, three phenomena are observed. (1) When brain region segmentation is removed, the average classification accuracy drops by a large margin, and decoding performance remains mediocre for most subjects. The overall average accuracy ranks the lowest among all three ablation variants. (2) Removing MVMD decomposition from each regional branch also compromises overall model performance. (3) After removing the Cross-Region Fusion Block, the overall performance of the model deteriorates severely. In contrast, the complete RMF-Net equipped with all three core modules achieves the optimal overall average accuracy and the smallest inter-subject performance variance across all ablation experiments.

4. Discussion

4.1. Advantages over Traditional MI-EEG Decoding Methods

4.1.1. Mechanism of Stable Decoding Across Sessions

The outstanding cross-session decoding performance of RMF-Net is primarily attributed to its comprehensive architectural design. On one hand, most traditional models employ a globally integrated approach for all EEG channels without segmenting brain regions based on neural functional attributes, thereby failing to capture the distinct response characteristics of different brain regions during MI tasks. On the other hand, even when frequency decomposition techniques are employed in some studies, they often rely on manually predefined frequency partitions, lacking the joint constraints of multi-electrode channels. Such conventional schemes are prone to mode mixing and cannot leverage multi-channel redundant information for joint noise reduction, resulting in unstable and impure multi-rhythmic time–frequency features and limiting decoding reliability in cross-session scenarios.
In contrast, RMF-Net introduces a neurofunctional-based brain region division mechanism, employing MVMD separately for frequency decomposition in each brain region. Leveraging the adaptive bandwidth optimization and modal orthogonality constraints of MVMD, the model effectively suppresses mode mixing, producing rhythmic representations with higher purity and stronger discrimination that accurately capture the unique rhythmic components specific to each brain region. Furthermore, after modeling regional features, the Cross-Region Fusion Block incorporates channel attention and channel shuffling mechanisms to adaptively select key features with greater discrimination for MI tasks across regions, suppress irrelevant interference, and enable efficient feature interaction and fusion between different brain regions, thereby enhancing inter-regional collaborative representation. This approach addresses the aforementioned limitations of traditional methods and ensures stable performance in cross-session tasks at the structural design level.

4.1.2. Mechanism of Generalization Across Subjects

The strong cross-subject generalization capability of the proposed model is also closely tied to its core design. Traditional approaches predominantly employ global channel mixing, overlooking the distinct rhythmic responses observed across different subjects in various functional brain regions, thereby weakening individual-specific neural characteristics. Additionally, they rely on predefined fixed frequency bands for decomposition, failing to adaptively accommodate the unique EEG oscillatory patterns of individual subjects or implement differentiated frequency band allocations for different brain regions. Such approaches struggle to mitigate interference caused by inherent rhythmic variations between individuals and their brain regions, resulting in inadequate cross-subject adaptation.
From the perspective of brain region modeling, the proposed approach employs a functional brain region segmentation paradigm to identify the unique fine-grained spatiotemporal features within individual brain regions across different subjects. Following the extraction of regional characteristics, the Cross-Region Fusion Block is introduced to accommodate variations in inter-regional synergy among individuals, preserving sufficient personalized representation information for cross-subject generalization. At the frequency decomposition level, the MVMD within brain regions requires no manually predefined frequency band boundaries, enabling adaptive fitting of intrinsic rhythmic oscillatory components across different subjects and brain regions. This approach highlights distinct rhythmic response patterns among subjects in various brain regions while effectively mitigating the generalization limitations associated with fixed-frequency bands. By integrating the structural advantages of brain region division, intra-regional MVMD decomposition, and the Cross-Region Fusion Block, the proposed model effectively balances spatial specificity with time–frequency individualized features, significantly enhancing its general adaptability and generalization performance in cross-subject decoding scenarios.

4.2. Effectiveness Analysis of Core Modules

4.2.1. Ablation Analysis of All Core Modules

The ablation experiment results clearly demonstrate the indispensability and strong synergistic complementary effects of the three core designs proposed in this study (Table 8). Firstly, abandoning brain region segmentation in favor of a globally integrated modeling approach fails to capture the differentiated neural response patterns of various functional brain regions during MI tasks [49,50]. The global unified feature extraction mode conflates task-relevant signals from motor-cortex-related regions with weak motor-related neural responses distributed over frontal and parietal regions. It dilutes the distinctive task-specific activation patterns of core motor functional subregions and impedes the extraction of fine local spatiotemporal signatures strongly coupled to MI intentions. Without region-wise independent processing, the model loses anatomical prior constraints derived from the scalp electrode layout, resulting in limited overall decoding performance and poor generalization ability. Secondly, the absence of regional intra-brain MVMD decomposition deprives each independent brain region branch of adaptive bandwidth optimization and multi-rhythm separation capability [51]. Without targeted per-region decomposition to isolate μ (8–13 Hz) and β (13–30 Hz) physiological oscillations contaminated by artifacts and high-frequency noise [52], the model cannot extract discriminative time–frequency representations strongly correlated with MI tasks within every functional brain area. Moreover, it loses the fractal characteristic differentiation brought by orthogonal modal decomposition, thereby constraining the precision and discrimination of regional feature extraction [16,53]. Lastly, the Cross-Region Fusion Block plays a critical role in multi-region information interaction and complementary feature recalibration. Removal of this component prevents the model from adaptively assessing the importance of channel features across different brain regions and establishing weighted complementary relationships between inter-regional features. Direct feature concatenation cannot filter redundant or interfering information from low-contribution brain regions, and it lacks the shuffle-driven cross-region information exchange, resulting in isolated regional feature spaces without sufficient mutual fusion, leading to insufficient cross-region information integration, serious feature dimension redundancy, and a significant reduction in feature utilization efficiency.
Overall, the brain division strategy, MVMD decomposition, and Cross-Region Fusion Block collectively form a comprehensive model architecture. Their synergy enables the proposed model to deeply extract multi-dimensional spatiotemporal and frequency features from non-stationary MI-EEG signals. The proposed architecture provides a practical technical reference for efficient decoding of complex MI EEG signals and the investigation of underlying neural activity mechanisms.

4.2.2. Parameter Optimization and Visual Validations of MVMD

The core advantage of MVMD lies in its ability to suppress mode mixing and extract pure physiological rhythm features through adaptive bandwidth optimization and modal orthogonality constraints [18]. The optimal number of decomposition modes (4) achieves a balance between the integrity of time–frequency features and feature redundancy and preserves the multi-scale fractal self-similarity inherent in non-stationary EEG oscillations [15]. It fully captures the time–frequency responses of core rhythms associated with MI tasks within brain regions while avoiding spurious components and computational redundancy caused by excessive decomposition modes, as well as the loss of critical time–frequency information due to insufficient modes. The rationality of this parameter setting demonstrates the adaptability of MVMD in refined EEG signal decomposition, ensuring efficient extraction of region-specific time–frequency features.
T-SNE visualization clearly demonstrates the differences in MVMD performance across various decomposition modes, intuitively highlighting the decisive impact of mode number settings on decomposition quality. With an appropriate mode number setting, MVMD can effectively separate physiological rhythm components of distinct frequencies in EEG signals while significantly suppressing mode mixing, further validating its reliability. Conversely, an excessive mode number tends to cause over-decomposition. Over-partitioning splits a single physiological rhythm into multiple redundant components and may even misclassify noise as valid modes. This pattern fully illustrates that although MVMD inherently excels at suppressing mode mixing, optimal performance in EEG signal decomposition requires a proper mode number setting to provide high-quality IMFs for subsequent spatiotemporal feature extraction.

4.2.3. Parameter Sensitivity and Ablation Analysis of the Cross-Region Fusion Block

The core value of the Cross-Region Fusion Block lies in achieving efficient integration and optimization of features from multiple brain regions, strengthening feature correlations between different brain regions, and enhancing the discriminability of decoding representations. The performance of this module primarily depends on the reduction ratio of the SE Block. A thorough analysis reveals that when the reduction ratio is too small, the insufficient compression of channel dimensions prevents the fully connected layers from efficiently mining inter-channel dependencies, resulting in inaccurate allocation of attention weights, thereby failing to precisely focus on effective features of key brain regions. Conversely, an excessively large reduction ratio will excessively compress the channel’s dimensions, which undermines the multi-scale fractal fluctuation characteristics inherent in the original EEG signals, resulting in the loss of critical physiological information and ultimately reducing the decoding accuracy of the model for MI EEG signals. An appropriate reduction ratio achieves a balance between channel feature dimensionality reduction and effective information retention, ensuring the attention mechanism reliably performs feature selection and weight modulation.
Furthermore, the results of the ablation study demonstrate the necessity and synergistic value of each component in the Cross-Region Fusion Block: channel attention and channel shuffling mechanisms suppress interference from redundant and invalid channels while enhancing feature correlations and complementarity across brain regions; the residual branch maintains the integrity of inter-regional features during forward propagation, mitigating feature degradation during network training. These components work synergistically to realize the modeling advantages of the Cross-Region Fusion Block.

4.3. Fractal Feature Analysis of EEG Signals Decomposed via DWT, EMD, VMD, and MVMD

Fractal characteristics effectively characterize the nonlinear and non-stationary properties of EEG signals [46,54]. Table 3 reveals that the four decomposition methods differ markedly in their capacity to decompose EEG signals, and the MVMD used in the proposed model achieves the best overall decomposition performance.
The two classic single-scale decomposition approaches, DWT and EMD, are subject to inherent structural drawbacks [44,55]. Although the fractal metrics of DWT-derived IMFs vary monotonically, the fixed-band segmentation mechanism yields extremely narrow MFDFA widths for high-frequency components. A large quantity of MI rhythms are retained only in low-frequency late components, forming the inverted distribution of rhythms and restricting the extraction of subtle discriminative features [55]. EMD suffers from severe mode mixing originating from its sifting procedure [44,56]. Mid-band physiological rhythms leak layer by layer and eventually accumulate in the last component, IMF4, which over-amplifies redundant trend information and distorts core task-related rhythms [56]. Conventional single-channel VMD eliminates the mode mixing problem of EMD, yet its separate iterative optimization easily converges to local optima and introduces prominent inter-band leakages [45,57]. The fractal metrics across its modes fail to form smooth transitional gradients, blurring the boundary between high- and low-frequency oscillations. Consequently, it cannot precisely isolate physiological rhythms from high-frequency electromyographic artifacts, leading to insufficient hierarchical distinguishability [57].
In contrast, MVMD inherits the strength of the variational adaptive band decomposition of VMD [45]. Relying on multi-channel collaborative optimization, it addresses the critical defects of single-channel VMD, including local optimal convergence, inter-band leakages, and disordered hierarchical distribution [18,58]. The synchronized multi-channel constraint facilitates global optimum solving and prevents the frequency offset commonly observed in independent single-channel decomposition [59]. The orderly gradient of fractal indicators further verifies that MVMD realizes clean separation of high and low frequency bands; it retains complete nonlinear intrinsic features of raw EEG while suppressing high-frequency artifacts simultaneously [58].
In conclusion, Table 3 verifies that MVMD can fully excavate multi-scale nonlinear features embedded in MI EEG and implement precise hierarchical decomposition without inter-band aliasing. The decomposed modes possess strong feature discrimination and supply low-noise, information-sufficient inputs for subsequent classification models. Compared with DWT, EMD, and single-channel VMD, MVMD delivers superior comprehensive decomposition capacity, which validates the feasibility and superiority of adopting MVMD as the preprocessing scheme for EEG MI signals.

4.4. Physiological Interpretability Analysis

4.4.1. Attention Weight Analysis of Brain Region Division

The distribution patterns of attention weights in Figure 2 directly validate the rationality and effectiveness of the brain region segmentation method employed by the proposed model. RMF-Net utilizes the SE Block in the Cross-Region Fusion Block to allocate tailored weights to various functional brain regions, accurately distinguishing their functional contributions during MI tasks and overcoming the limitations of traditional models that process EEG signals holistically while neglecting regional specificity. Notably, the motor cortex has the highest weights across all regions, which is consistent with classical neuroscience theory: the primary motor cortex (M1) serves as the core neural foundation for initiating and modulating MI activities [4]. These results not only confirm the soundness of the brain region division and the SE Block but also highlight the strong physiological interpretability of the proposed model, as its feature attention logic largely aligns with actual brain neural activity patterns.
The dynamic variation in attention weights across channels within brain regions also demonstrates the adaptive adjustment capability of the proposed model. By dynamically optimizing weight allocation among different brain regions based on individual differences and task states, the model effectively extracts core features of the motor cortex while integrating auxiliary information from other related brain areas. This dynamic allocation mechanism not only aligns with the physiological principle of multi-regional brain collaboration but also significantly enhances the ability of the model to extract EEG signal characteristics [13], providing solid support for its superior decoding performance.

4.4.2. Frequency and Task Specificity Analysis of MVMD Decomposition

The PSD distribution patterns (Figure 3) demonstrate the rationality and physiological consistency of MVMD decomposition. The modal energies exhibit inherent frequency–domain separation, with key components precisely focusing on the characteristic μ and β rhythms underlying MI task encoding. This confirms that MVMD effectively isolates task-related oscillatory components with clear physiological significance while mitigating frequency band overlap and unwanted noise interference. From a frequency–domain perspective, this further validates the necessity of differentiated feature modeling across different modes, providing both physiological and experimental justification for the fine-grained extraction of EEG time–frequency features.
The optimal MVMD decomposition mode number is task-specific, fundamentally stemming from the distinct requirements for time–frequency feature extraction across different MI tasks. Multiclassification tasks prioritize capturing shared neurophysiological rhythm characteristics across categories, whereby an appropriate mode number yields a compact feature representation that preserves core time–frequency information while effectively mitigating feature redundancy and overfitting. In contrast, binary classification tasks rely on identifying subtle inter-class differences, necessitating a finer decomposition scale to characterize weak task-specific time–frequency response patterns [60,61]. This phenomenon further demonstrates that the modes derived from MVMD decomposition are not random signals but rather EEG rhythm representations with clear neurophysiological significance. Thus, the optimal decomposition mode number for each task aligns with the required physiological rhythm information, thereby enhancing the physiological interpretability of the model.

4.5. Limitations and Future Work

4.5.1. Existing Limitations

Although the proposed RMF-Net demonstrates excellent performance in MI-EEG decoding tasks and its core design has been well-validated, the study still has several limitations that require further refinement in future work.
Firstly, the scope of dataset validation is relatively limited. This study mainly relies on two distinct public datasets for experimental verification: the BCIC-IV-2a dataset and a subset of 10 subjects selected from the PhysioNet EEG dataset. These validation schemes can effectively verify the efficacy and design rationality of core modules of the model. However, the experiments still lack sufficient samples covering diverse experimental paradigms, electrode layouts, and participant groups, so the generalizability of the derived conclusions remains to be further strengthened.
Secondly, MVMD decomposition has certain limitations in real-time performance. To achieve adaptive bandwidth adjustment and precise mode separation, MVMD adopts global joint variational constrained optimization. This global iterative optimization characteristic restricts its efficient parallel acceleration on GPU, and it can only run on CPU hardware in our experiment. According to the computational metrics evaluated on the BCIC-IV-2a dataset, the overhead introduced by MVMD is marginal. The number of model parameters and training memory remain unchanged, while only slight increases are observed in FLOPs and inference memory, with full comparison data listed in Appendix A, Table A3. Nevertheless, CPU-based decomposition brings an extra processing delay of 845.00 ms per trial, which fails to meet the low-latency real-time decoding demand of lightweight portable BCI equipment and restricts the practical industrial deployment of the overall system.
Finally, the brain region division strategy lacks flexibility. The current brain region division adopts a preset approach based on prior neuroscience knowledge, representing a fixed segmentation model that cannot adapt well to diverse application scenarios (e.g., different electrode layouts or task requirements). This limitation restricts the generalizability and applicability of the model across various practical MI-EEG decoding scenarios.

4.5.2. Future Research Directions

To address the limitations above, combined with the core design of this study and current research trends in MI-EEG decoding, future work will focus on the following directions to further boost model performance and expand its research value.
Firstly, future work will further broaden the dataset validation scope to improve the generalizability of research conclusions. Although a subset of the PhysioNet dataset has been utilized in current LOSO experiments, more diverse public datasets with distinct experimental paradigms and electrode layouts (e.g., the OpenBMI dataset) will be added, together with clinical datasets covering a broader range of subject cohorts and task scenarios. Such efforts can comprehensively validate the generalization of the model and further enhance the reliability and practicality of the research findings.
Secondly, future work will optimize the efficiency of signal decomposition to support real-time online decoding. More lightweight and efficient adaptive signal decomposition methods will be explored to replace the existing MVMD algorithm, which can substantially reduce computational complexity and decomposition latency while maintaining decomposition accuracy, suppressing mode mixing, and preserving inherent EEG physiological and fractal characteristics. In addition, optimization of the global variational iteration procedure will be conducted to improve decomposition efficiency so as to meet the deployment demands of real-time online BCI systems.
In addition, future work will develop intelligent decision making algorithms to realize adaptive brain region division. The integration of Transformer attention mechanisms or Deep Q-Network (DQN) will be explored to build an adaptive brain region segmentation model, which can reduce reliance on manual prior knowledge. By enabling the model to autonomously learn neural activity patterns under diverse task demands, the segmentation strategy can be dynamically adjusted, further improving the generalization of the model across various task scenarios.
Finally, to further boost the cross-session and cross-subject classification performance of the model, beyond the adaptive brain region modeling approach, future work may integrate domain adaptation and meta-learning frameworks. Hierarchical adversarial alignment losses could be designed to mitigate cross-subject and cross-session feature distribution shifts while narrowing inherent feature heterogeneity across different brain-region branches. In addition, the parameter searching strategy of MVMD can be optimized: rather than adopting globally fixed hyperparameters, future work may adaptively tune the decomposed mode number and bandwidth penalty factor according to the EEG signal-to-noise ratio of each subject and each session to fully extract personalized somatosensory–motor features. Moreover, diverse EEG data augmentation methods can be utilized to enlarge the feature space, which will further strengthen the generalization ability and anti-interference robustness of the model.

5. Conclusions

In this study, we propose a novel RMF-Net model to enhance the feature extraction capability and classification performance of EEG signals. Firstly, EEG channels are grouped based on neuroscience brain functional partitioning theory. Within each brain region, MVMD is employed to extract specific neural rhythm features. Finally, the Cross-Region Fusion Block based on channel attention and channel shuffling mechanisms is utilized to achieve effective analysis and integration of cross-region features. By theoretically integrating neuroscientific advances in functional brain regions and neural rhythm co-encoding, this model jointly models spatial, temporal, and structural information across multiple brain regions, providing a novel and effective strategy for MI-EEG decoding. Experimental results demonstrate that the proposed model notably outperforms existing mainstream methods on the BCIC-IV-2a dataset, exhibiting superior decoding capability for MI EEG signals (80.06%), especially in cross-subject scenarios (63.05%). Overall, the RMF-Net proposed in this study significantly enhances the decoding performance and generalization capability of MI-EEG signals by integrating functional brain division, MVMD-based adaptive rhythm extraction, and cross-region feature fusion. This provides a viable theoretical reference and technical solution for practical applications and further research in the field of BCI MI decoding.

Author Contributions

Conceptualization, Y.Z.; methodology, Y.Z.; software, Y.Z.; validation, Y.Z., X.W., and E.S.; formal analysis, Y.Z. and X.W.; investigation, Y.Z.; resources, X.W.; data curation, X.W.; writing—original draft preparation, Y.Z. and X.W.; writing—review and editing, Y.Z. and E.S.; visualization, Y.Z.; supervision, X.W. and E.S.; project administration, E.S.; funding acquisition, E.S. All authors have read and agreed to the published version of the manuscript.

Funding

This work was supported by the Innovation Foundation for Doctor Dissertation of Northwestern Polytechnical University.

Data Availability Statement

The dataset used in this study is publicly available.

Acknowledgments

The authors express sincere thanks to the anonymous referees and editors for their thoughtful and constructive review. We appreciate the organizers and contributors of the BCI Competition IV dataset 2a for publicly releasing this valuable electroencephalogram dataset. We also thank Shu Zhang for our valuable discussions. The submission and publication of this manuscript have been approved by our supervisor.

Conflicts of Interest

We declare that we have no financial and personal relationships with other people or organizations that could inappropriately influence our work. There is no professional or other personal interest of any nature or kind in any product, service, and/or company that could be construed as influencing the position presented in, or the review of, this manuscript.

Abbreviations

The following abbreviations are used in this manuscript:
MIMotor Imagery
EEGElectroencephalogram
BCIBrain–Computer Interface
MVMDMulti-variable Variational Mode Decomposition
IMFIntrinsic Mode Function
SESqueeze-and-Excitation
LOSOLeave-One-Subject-Out
PSDPower Spectral Density

Appendix A

Table A1. Architectural details of the proposed model (brain region division based on BCIC-IV-2a electrode layout).
LayerInput SizeOutput SizeParameters
Motor CortexTime Attention32 × 5 × 100032 × 4 × 10009
Adaptive Fusion32 × 5 × 100032 × 5 × 100042
Spatial Convolution32 × 5 × 100032 × 64 × 1000448
Temporal Convolution32 × 64 × 100032 × 64 × 1000258,176
Motor AdjacentTime Attention32 × 6 × 100032 × 4 × 100010
Adaptive Fusion32 × 6 × 100032 × 6 × 100056
Spatial Convolution32 × 6 × 100032 × 64 × 1000512
Temporal Convolution32 × 64 × 100032 × 64 × 1000258,176
FrontalTime Attention Layer32 × 2 × 100032 × 4 × 10006
Adaptive Fusion32 × 2 × 100032 × 2 × 100012
Spatial Convolution32 × 2 × 100032 × 64 × 1000256
Temporal Convolution32 × 64 × 100032 × 64 × 1000258,176
ParietalTime Attention32 × 9 × 100032 × 4 × 100026
Adaptive Fusion32 × 9 × 100032 × 9 × 1000110
Spatial Convolution32 × 9 × 100032 × 64 × 1000704
Temporal Convolution32 × 64 × 100032 × 64 × 1000258,176
Cross-Region Fusion Block32 × 256 × 100032 × 256 × 100098,304
Feature Reduction32 × 256 × 100032 × 64 × 100016,512
Pooling and Fully Connected Layer32 × 64 × 100032 × 42052
Total parameters: 1,151,763
Table A2. Cross-subject (LOSO) classification performance (in percentage %) of the proposed model on BCIC-IV-2a dataset.
SubjectAvg AccStdKappa
Sub 175.811.640.6775
Sub 246.411.570.2855
Sub 375.580.200.6744
Sub 461.460.920.4861
Sub 550.354.920.3380
Sub 650.000.920.3333
Sub 765.511.400.5401
Sub 876.271.450.6836
Sub 966.091.720.5479
Average63.05 ± 11.840.810.5073
“Avg Acc” and “Std” mean average accuracy and standard deviation across 3 random runs (random seeds: 2021, 2023, 2024). The “±” value denotes the standard deviation across 9 subjects.
Table A3. Computational overhead comparison of the model with and without MVMD preprocessing on BCIC-IV-2a dataset.
MethodsWithout MVMDwith MVMD
Parameters1,151,7631,151,763
FLOPs2.24 G2.28 G
Inference memory9.85 MB10.18 MB
Training memory28.48 MB28.48 MB

References

  1. Wolpaw, J.R. Brain-computer interfaces (BCIs) for communication and control. In Proceedings of the 9th International ACM SIGACCESS Conference on Computers and Accessibility; Association for Computing Machinery: New York, NY, USA, 2007. [Google Scholar]
  2. Finnis, R.; Mehmood, A.; Holle, H.; Iqbal, J. Exploring imagined movement for brain–computer interface control: An fnirs and eeg review. Brain Sci. 2025, 15, 1013. [Google Scholar] [CrossRef] [Scilit] [PubMed]
  3. Nicolas-Alonso, L.F.; Gomez-Gil, J. Brain computer interfaces, a review. Sensors 2012, 12, 1211–1279. [Google Scholar] [CrossRef] [Scilit] [PubMed]
  4. Pfurtscheller, G.; Neuper, C. Motor imagery and direct brain-computer communication. Proc. IEEE 2001, 89, 1123–1134. [Google Scholar] [CrossRef] [Scilit]
  5. Lotte, F.; Bougrain, L.; Cichocki, A.; Clerc, M.; Congedo, M.; Rakotomamonjy, A.; Yger, F. A review of classification algorithms for EEG-based brain–computer interfaces: A 10 year update. J. Neural Eng. 2018, 15, 031005. [Google Scholar] [CrossRef] [Scilit] [PubMed]
  6. Ramoser, H.; Muller-Gerking, J.; Pfurtscheller, G. Optimal spatial filtering of single trial EEG during imagined hand movement. IEEE Trans. Rehabil. Eng. 2000, 8, 441–446. [Google Scholar] [CrossRef] [Scilit] [PubMed]
  7. Lawhern, V.J.; Solon, A.J.; Waytowich, N.R.; Gordon, S.M.; Hung, C.P.; Lance, B.J. EEGNet: A compact convolutional neural network for EEG-based brain–computer interfaces. J. Neural Eng. 2018, 15, 056013. [Google Scholar] [CrossRef] [Scilit] [PubMed]
  8. Wang, J.; Yao, L.; Wang, Y. IFNet: An interactive frequency convolutional neural network for enhancing motor imagery decoding from EEG. IEEE Trans. Neural Syst. Rehabil. Eng. 2023, 31, 1900–1911. [Google Scholar] [CrossRef] [Scilit] [PubMed]
  9. Ding, Y.; Robinson, N.; Tong, C.; Zeng, Q.; Guan, C. LGGNet: Learning from local-global-graph representations for brain–computer interface. IEEE Trans. Neural Netw. Learn. Syst. 2023, 35, 9773–9786. [Google Scholar]
  10. Mammone, N.; Ieracitano, C.; Adeli, H.; Morabito, F.C. AutoEncoder filter bank common spatial patterns to decode motor imagery from EEG. IEEE J. Biomed. Health Inform. 2023, 27, 2365–2376. [Google Scholar] [CrossRef] [Scilit] [PubMed]
  11. Buzsáki, G. Rhythms of the Brain; Oxford University Press: Oxford, UK, 2006. [Google Scholar]
  12. Cohen, M.X. Analyzing Neural Time Series Data: Theory and Practice; MIT Press: Cambridge, MA, USA, 2014. [Google Scholar]
  13. Fries, P. A mechanism for cognitive dynamics: Neuronal communication through neuronal coherence. Trends Cogn. Sci. 2005, 9, 474–480. [Google Scholar] [CrossRef] [Scilit] [PubMed]
  14. Tan, S.; Tang, Z.; He, Q.; Li, Y.; Cai, Y.; Zhang, J.; Fan, D.; Guo, Z. Automatic detection and prediction of epileptic EEG signals based on nonlinear dynamics and deep learning: A review. Front. Neurosci. 2025, 19, 1630664. [Google Scholar] [CrossRef] [Scilit] [PubMed]
  15. Pakniyat, N.; Agarwal, G.; Marek, P.; Krejcar, O.; Namazi, H. Fractal Theory in Functional Brain Mapping: From Sensor Space to Source Reconstruction. Fractals 2025, 33, 2530013. [Google Scholar] [CrossRef] [Scilit]
  16. Mohamed, A.F.; Jusas, V. Advancing Fractal Dimension Techniques to Enhance Motor Imagery Tasks Using EEG for Brain–Computer Interface Applications. Appl. Sci. 2025, 15, 6021. [Google Scholar] [CrossRef] [Scilit]
  17. Hugdahl, K.; Davidson, R.J. (Eds.) The Asymmetrical Brain; MIT Press: Cambridge, MA, USA, 2003. [Google Scholar]
  18. Ur Rehman, N.; Aftab, H. Multivariate variational mode decomposition. IEEE Trans. Signal Process. 2019, 67, 6039–6052. [Google Scholar] [CrossRef] [Scilit]
  19. Betzel, R.F.; Medaglia, J.D.; Kahn, A.E.; Soffer, J.; Schonhaut, D.R.; Bassett, D.S. Structural, geometric and genetic factors predict interregional brain connectivity patterns probed by electrocorticography. Nat. Biomed. Eng. 2019, 3, 902–916. [Google Scholar] [CrossRef] [Scilit] [PubMed]
  20. Brunner, C.; Leeb, R.; Müller-Putz, G.; Schlögl, A.; Pfurtscheller, G. BCI Competition 2008–Graz data set A. Inst. Knowl. Discov. (Lab. Brain-Comput. Interfaces) Graz Univ. Technol. 2008, 16, 1. [Google Scholar] [CrossRef] [Scilit]
  21. Goldberger, A.L.; Amaral, L.A.; Glass, L.; Hausdorff, J.M.; Ivanov, P.C.; Mark, R.G.; Mietus, J.E.; Moody, G.B.; Peng, C.K.; Stanley, H.E. PhysioBank, PhysioToolkit, and PhysioNet: Components of a new research resource for complex physiologic signals. Circulation 2000, 101, e215–e220. [Google Scholar] [CrossRef] [Scilit] [PubMed]
  22. Schalk, G.; McFarland, D.J.; Hinterberger, T.; Birbaumer, N.; Wolpaw, J.R. BCI2000: A general-purpose brain-computer interface (BCI) system. IEEE Trans. Biomed. Eng. 2004, 51, 1034–1043. [Google Scholar] [CrossRef] [Scilit] [PubMed]
  23. Zhang, R.; Li, F.; Zhang, T.; Yao, D.; Xu, P. Subject inefficiency phenomenon of motor imagery brain-computer interface: Influence factors and potential solutions. Brain Sci. Adv. 2020, 6, 224–241. [Google Scholar] [CrossRef] [Scilit]
  24. Leuthardt, E.C.; Schalk, G.; Wolpaw, J.R.; Ojemann, J.G.; Moran, D.W. A brain–computer interface using electrocorticographic signals in humans. J. Neural Eng. 2004, 1, 63–71. [Google Scholar] [CrossRef] [Scilit] [PubMed]
  25. Oostenveld, R.; Fries, P.; Maris, E.; Schoffelen, J.M. FieldTrip: Open source software for advanced analysis of MEG, EEG, and invasive electrophysiological data. Comput. Intell. Neurosci. 2011, 2011, 156869. [Google Scholar] [CrossRef] [Scilit] [PubMed]
  26. Chatrian, G.E.; Lettich, E.; Nelson, P.L. Ten percent electrode system for topographic studies of spontaneous and evoked EEG activities. Am. J. EEG Technol. 1985, 25, 83–92. [Google Scholar] [CrossRef] [Scilit]
  27. Wen, H.; Zhong, Y.; Yao, L.; Wang, Y. Neural correlates of motor/tactile imagery and tactile sensation in a BCI paradigm: A high-density EEG source imaging study. Cyborg Bionic Syst. 2024, 5, 0118. [Google Scholar] [CrossRef] [Scilit] [PubMed]
  28. Mulder, T. Motor imagery and action observation: Cognitive tools for rehabilitation. J. Neural Transm. 2007, 114, 1265–1278. [Google Scholar] [CrossRef] [Scilit] [PubMed]
  29. Mejias, J.F.; Payeur, A.; Selin, E.; Maler, L.; Longin, A. Gain control via feedforward inhibition in noisy and delayed neural circuits. BMC Neurosci. 2014, 15, P111. [Google Scholar] [CrossRef] [Scilit]
  30. Buschman, T.J.; Miller, E.K. Shifting the spotlight of attention: Evidence for discrete computations in cognition. Front. Hum. Neurosci. 2010, 4, 194. [Google Scholar] [CrossRef] [Scilit] [PubMed]
  31. Hu, J.; Shen, L.; Sun, G. Squeeze-and-excitation networks. In 2018 IEEE/CVF Conference on Computer Vision and Pattern Recognition; IEEE: New York, NY, USA, 2018. [Google Scholar]
  32. Li, Y.; Zhu, X.; Qi, Y.; Wang, Y. Revealing unexpected complex encoding but simple decoding mechanisms in motor cortex via separating behaviorally relevant neural signals. eLife 2024, 12, RP87881. [Google Scholar] [CrossRef] [Scilit] [PubMed]
  33. Gippert, M.; Shih, P.C.; Heed, T.; Howard, I.S.; Jamshidi Idaji, M.; Villringer, A.; Sehm, B.; Nikulin, V.V. Motor imagery enhances performance beyond the imagined action. Proc. Natl. Acad. Sci. USA 2025, 122, e2423642122. [Google Scholar] [CrossRef] [Scilit] [PubMed]
  34. Zhang, X.; Zhou, X.; Lin, M.; Sun, J. Shufflenet: An extremely efficient convolutional neural network for mobile devices. In 2018 IEEE/CVF Conference on Computer Vision and Pattern Recognition; IEEE: New York, NY, USA, 2018. [Google Scholar]
  35. Schirrmeister, R.T.; Springenberg, J.T.; Fiederer, L.D.J.; Glasstetter, M.; Eggensperger, K.; Tangermann, M.; Hutter, F.; Burgard, W.; Ball, T. Deep learning with convolutional neural networks for EEG decoding and visualization. Hum. Brain Mapp. 2017, 38, 5391–5420. [Google Scholar] [CrossRef] [Scilit] [PubMed]
  36. Ingolfsson, T.M.; Hersche, M.; Wang, X.; Kobayashi, N.; Cavigelli, L.; Benini, L. EEG-TCNet: An accurate temporal convolutional network for embedded motor-imagery brain–machine interfaces. In 2020 IEEE International Conference on Systems, Man, and Cybernetics (SMC); IEEE: New York, NY, USA, 2020. [Google Scholar]
  37. Li, Y.; Guo, L.; Liu, Y.; Liu, J.; Meng, F. A temporal-spectral-based squeeze-and-excitation feature fusion network for motor imagery EEG decoding. IEEE Trans. Neural Syst. Rehabil. Eng. 2021, 29, 1534–1545. [Google Scholar] [CrossRef] [Scilit] [PubMed]
  38. Altaheri, H.; Muhammad, G.; Alsulaiman, M. Physics-informed attention temporal convolutional network for EEG-based motor imagery classification. IEEE Trans. Ind. Inform. 2022, 19, 2249–2258. [Google Scholar]
  39. Song, Y.; Zheng, Q.; Liu, B.; Gao, X. EEG conformer: Convolutional transformer for EEG decoding and visualization. IEEE Trans. Neural Syst. Rehabil. Eng. 2022, 31, 710–719. [Google Scholar] [CrossRef] [Scilit]
  40. Wimpff, M.; Gizzi, L.; Zerfowski, J.; Yang, B. EEG motor imagery decoding: A framework for comparative analysis with channel attention mechanisms. J. Neural Eng. 2024, 21, 036020. [Google Scholar] [CrossRef] [Scilit]
  41. Zhao, W.; Jiang, X.; Zhang, B.; Xiao, S.; Weng, S. CTNet: A convolutional transformer network for EEG-based motor imagery classification. Sci. Rep. 2024, 14, 20237. [Google Scholar] [CrossRef] [Scilit] [PubMed]
  42. Zhao, W.; Zhang, B.; Zhou, H.; Wei, D.; Huang, C.; Lan, Q. Multi-scale convolutional transformer network for motor imagery brain-computer interface. Sci. Rep. 2025, 15, 12935. [Google Scholar] [CrossRef] [Scilit] [PubMed]
  43. Daubechies, I. The wavelet transform, time-frequency localization and signal analysis. IEEE Trans. Inf. Theory 1990, 36, 961–1005. [Google Scholar] [CrossRef] [Scilit]
  44. Huang, N.E.; Shen, Z.; Long, S.R.; Wu, M.C.; Shih, H.H.; Zheng, Q.; Yen, N.C.; Tung, C.C.; Liu, H.H. The empirical mode decomposition and the Hilbert spectrum for nonlinear and non-stationary time series analysis. Proc. R. Soc. London. Ser. A Math. Phys. Eng. Sci. 1998, 454, 903–995. [Google Scholar] [CrossRef] [Scilit]
  45. Dragomiretskiy, K.; Zosso, D. Variational mode decomposition. IEEE Trans. Signal Process. 2013, 62, 531–544. [Google Scholar] [CrossRef] [Scilit]
  46. Kantelhardt, J.W.; Zschiegner, S.A.; Koscielny-Bunde, E.; Havlin, S.; Bunde, A.; Stanley, H.E. Multifractal detrended fluctuation analysis of nonstationary time series. Phys. A Stat. Mech. Its Appl. 2002, 316, 87–114. [Google Scholar] [CrossRef] [Scilit]
  47. França, L.G.S.; Miranda, J.G.; Leite, M.; Sharma, N.K.; Walker, M.C.; Lemieux, L.; Wang, Y. Fractal and multifractal properties of electrographic recordings of human brain activity: Toward its use as a sig-nal feature for machine learning in clinical applications. Front. Physiol. 2018, 9, 1767. [Google Scholar] [CrossRef] [Scilit] [PubMed]
  48. Harrou, F.; Zeroual, A.; Hittawe, M.M.; Sun, Y. Traffic congestion detection: Data-based techniques. In Road Traffic Modeling and Management; Elsevier: Amsterdam, The Netherlands, 2022; pp. 141–195. [Google Scholar] [CrossRef] [Scilit]
  49. Yazici, M.; Ulutas, M.; Okuyan, M. A comprehensive sLORETA study on the contribution of cortical somatomotor regions to motor imagery. Brain Sci. 2019, 9, 372. [Google Scholar] [CrossRef] [Scilit] [PubMed]
  50. Srinivasan, K.J.; Periasamy, P.; Gunasekaran, S. Motor Imagery and Motor Execution: A Narrative Review of Electroencephalographic (EEG) Signatures, Methodological Consistency, and Translational Applications. Cureus 2025, 17, e93011. [Google Scholar] [CrossRef] [Scilit]
  51. Jian, J.; Wu, D.; Cao, J.; Dong, F.; Liu, J.; Wang, D.; Zhang, S. Grouped multivariate variational mode decomposition with application to EEG analysis. IEEE Trans. Biomed. Eng. 2023, 71, 1332–1344. [Google Scholar] [CrossRef] [Scilit]
  52. Singh, A.; Hussain, A.A.; Lal, S.; Guesgen, H.W. A comprehensive review on critical issues and possible solutions of motor imagery based electroencephalography brain-computer interface. Sensors 2021, 21, 2173. [Google Scholar] [CrossRef] [Scilit] [PubMed]
  53. Moaveninejad, S.; D’Onofrio, V.; Tecchio, F.; Ferracuti, F.; Iarlori, S.; Monteriù, A.; Porcaro, C. Fractal Dimension as a discriminative feature for high accuracy classification in motor imagery EEG-based brain-computer interface. Comput. Methods Programs Biomed. 2024, 244, 107944. [Google Scholar] [CrossRef] [Scilit] [PubMed]
  54. Avramidis, K.; Zlatintsi, A.; Garoufis, C.; Maragos, P. Multiscale fractal analysis on EEG signals for music-induced emotion recognition. In 2021 29th European Signal Processing Conference (EUSIPCO); IEEE: New York, NY, USA, 2021. [Google Scholar]
  55. Siino, M.; Bonomo, G.; Sorbello, R.; Tinnirello, I. Investigating the impact of rational dilated wavelet transform on motor imagery EEG decoding with deep learning models. IEEE Access 2025, 13, 214223–214235. [Google Scholar] [CrossRef] [Scilit]
  56. Ho, R.; Hung, K. A comparative investigation of mode mixing in EEG decomposition using EMD, EEMD and M-EMD. In 2020 IEEE 10th Symposium on Computer Applications & Industrial Electronics (ISCAIE); IEEE: New York, NY, USA, 2020. [Google Scholar]
  57. Liu, C.; Zhang, C. Remove artifacts from a single-channel EEG based on VMD and SOBI. Sensors 2022, 22, 6698. [Google Scholar] [CrossRef] [Scilit] [PubMed]
  58. Zhang, S.; Liu, G.; Sun, S.; Cai, J. Deep Learning Method Based on Multivariate Variational Mode Decomposition for Classification of Epileptic Signals. Brain Sci. 2025, 15, 933. [Google Scholar] [CrossRef] [Scilit] [PubMed]
  59. Fazzini, P.; Tona, G.L.; Diez, M.; Montuori, M.; Piazza, M.C.D. Multi-channel neighborhood-constrained variational mode decomposition. TechRxiv 2025. [Google Scholar] [CrossRef] [Scilit] [PubMed]
  60. Pfurtscheller, G.; Flotzinger, D.; Neuper, C. Differentiation between finger, toe and tongue movement in man based on 40 Hz EEG. Electroencephalogr. Clin. Neurophysiol. 1994, 90, 456–460. [Google Scholar] [CrossRef] [Scilit] [PubMed]
  61. Pfurtscheller, G.; Lopes da Silva, F.H. Event-related EEG/MEG synchronization and desynchronization: Basic principles. Clin. Neurophysiol. 1999, 110, 1842–1857. [Google Scholar] [CrossRef] [Scilit] [PubMed]
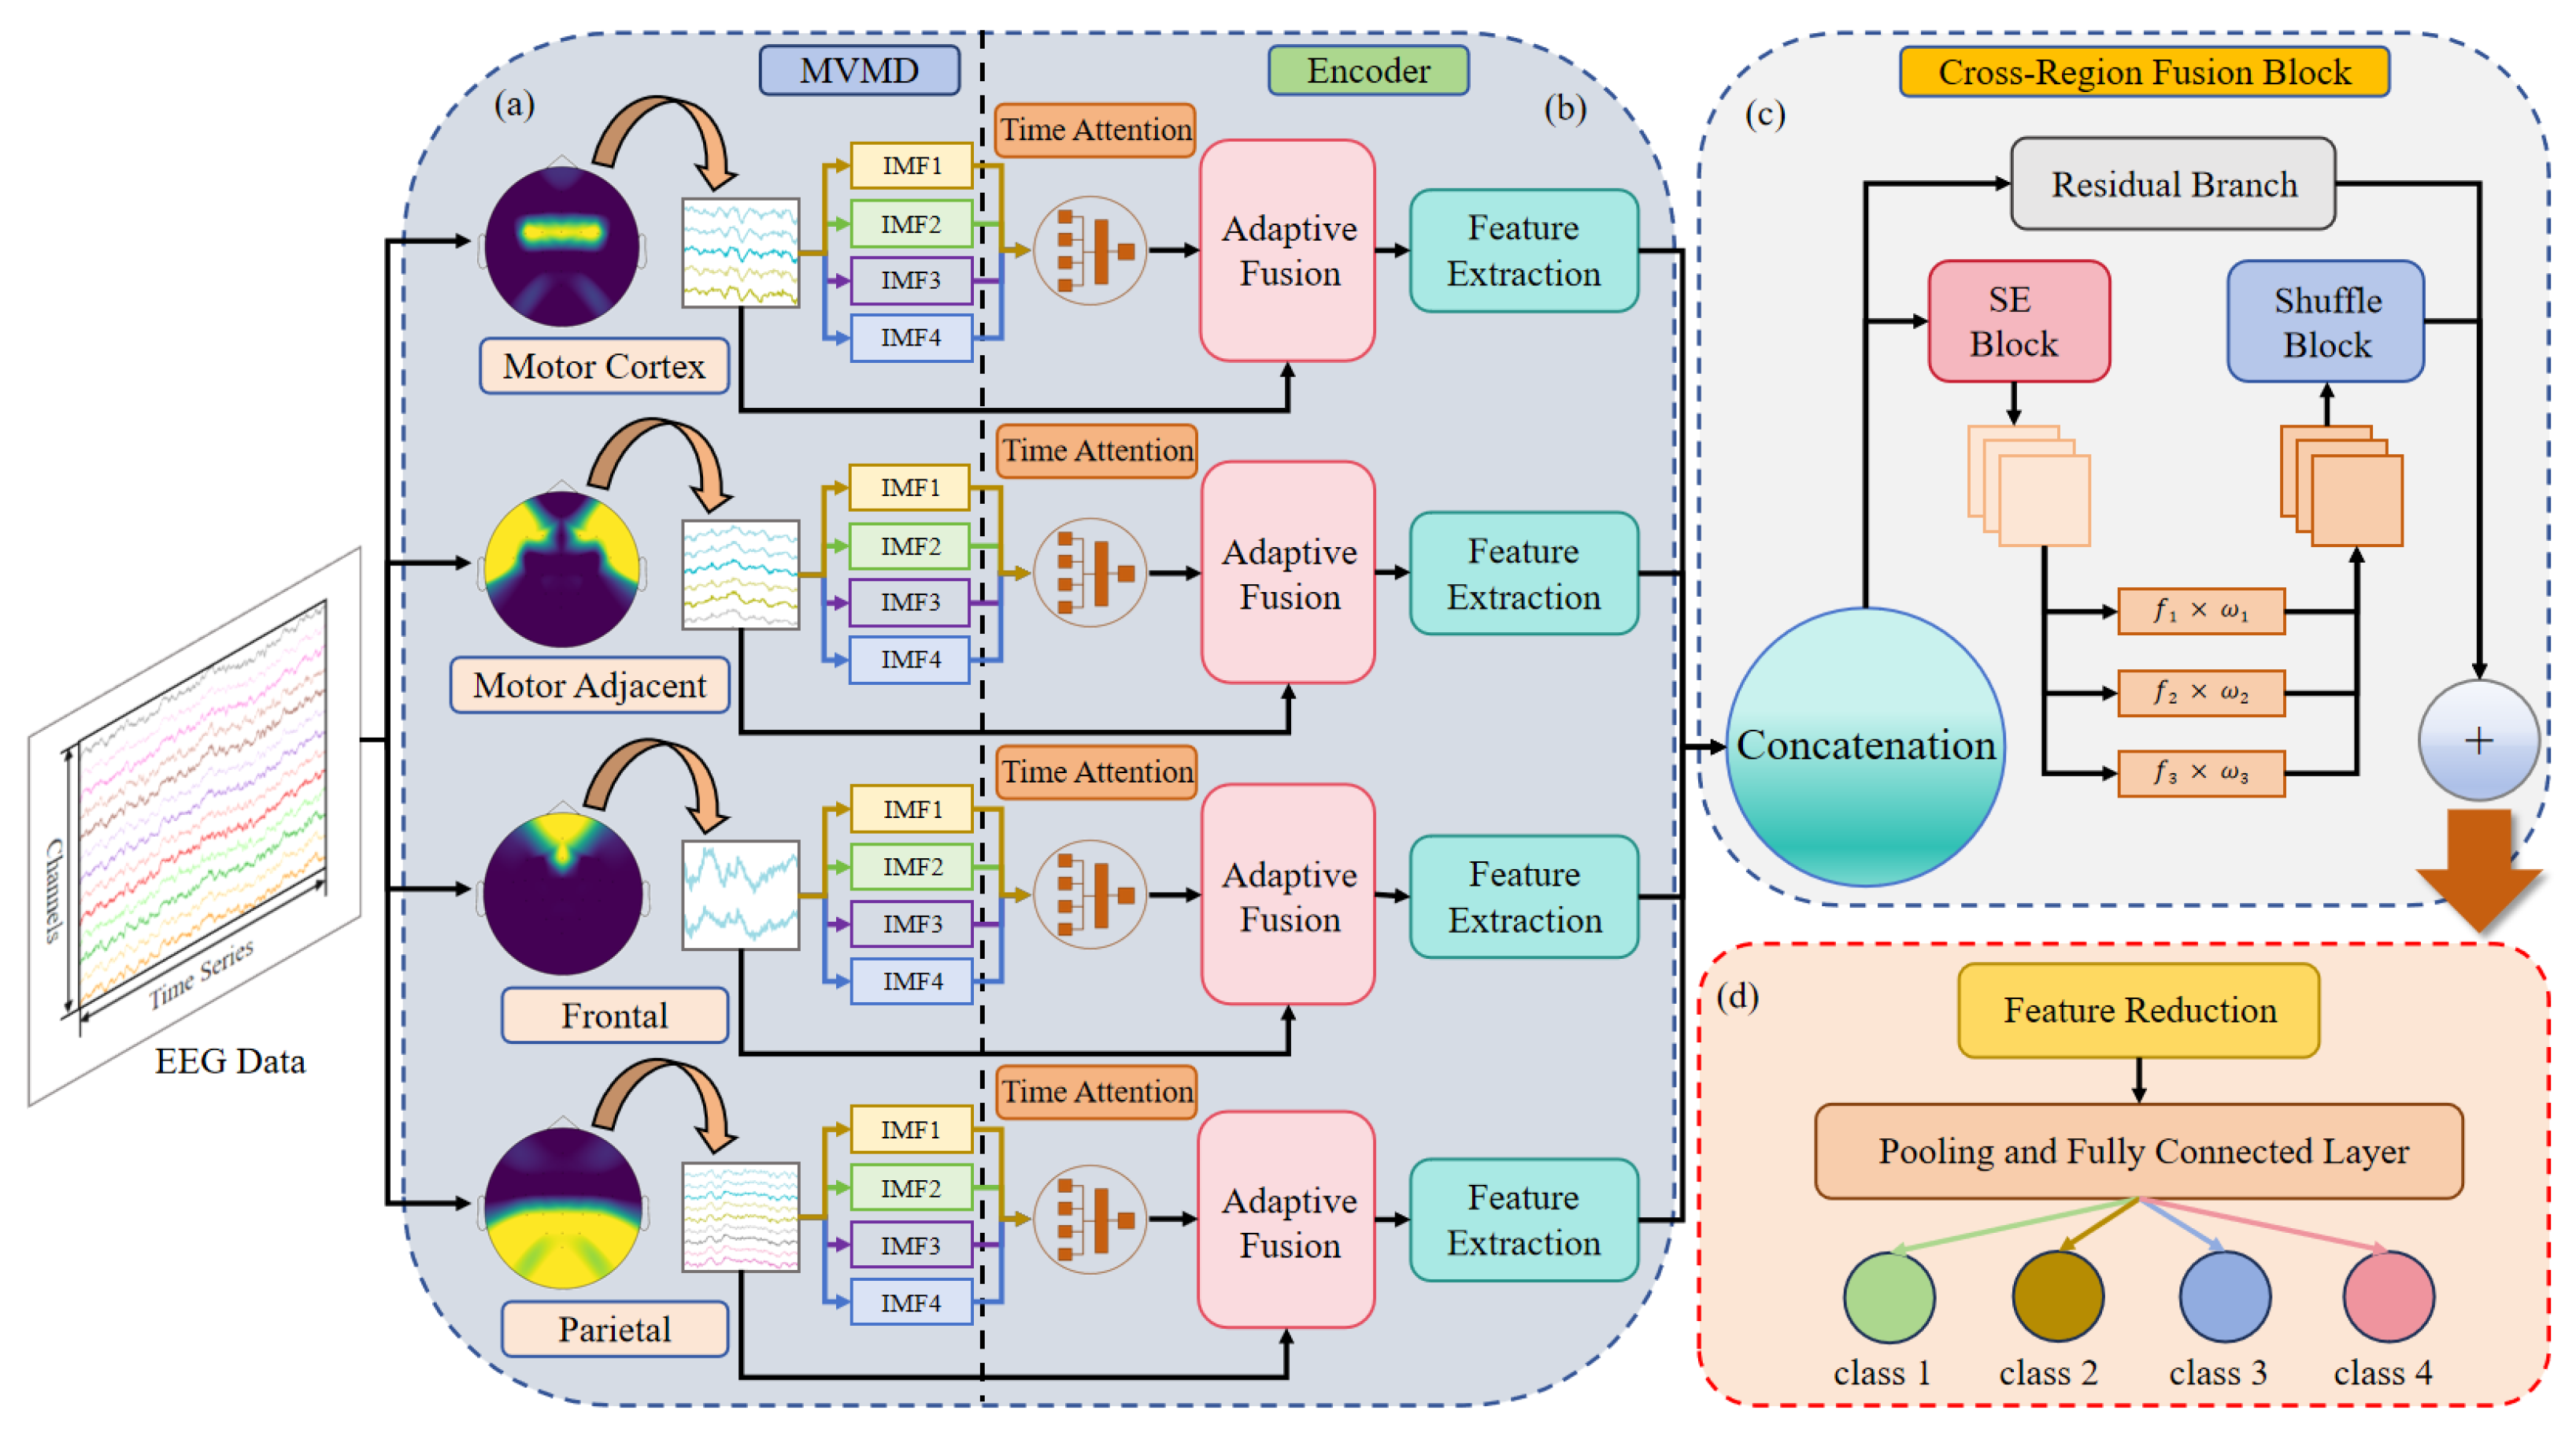
Figure 1. The architecture of the RMF-Net we proposed: (a,b) represent region-specific feature processing; (c) represents cross-regional feature interactive fusion; (d) represents final feature reduction and classification. Brain region division adapts to the BCIC-IV-2a dataset, while other modules are dataset-agnostic.
Fractalfract 10 00510 g001
Figure 2. SE Block weight visualization for the first sample of Subject 2.
Fractalfract 10 00510 g002
Figure 3. The waveforms of IMF signals and the corresponding PSD plot after MVMD decomposition of C3 channel EEG signal from motor–cortex brain region of the first subject in the first trial.
Fractalfract 10 00510 g003
Figure 4. T-SNE visualization of MVMD-decomposed EEG signals from the motor-adjacent brain region of Subject 2 with 3, 4, and 5 modes.
Fractalfract 10 00510 g004
Table 1. Cross-session and cross-subject (LOSO) classification accuracies (in percentage %) and Cohen’s kappa coefficients of different algorithms on the BCIC-IV-2a dataset.
MethodsYearCross-SessionCross-Subject
Avg Acc ± StdKappaAvg Acc ± StdKappa
ShallowNet [35]201760.50 ± 2.18 **0.47 ± 0.0348.83 ± 0.99 **0.32 ± 0.01
EEGNet [7]201870.39 ± 0.48 **0.61 ± 0.0152.01 ± 1.22 **0.36 ± 0.02
EEGTCNet [36]202075.62 ± 1.04 *0.68 ± 0.0155.09 ± 1.13 **0.40 ± 0.02
TS-SEFFNet [37]202176.65 ± 0.58 **0.69 ± 0.0156.74 ± 0.83 **0.42 ± 0.01
ATCNet [38]202379.08 ± 0.430.72 ± 0.0157.81 ± 2.00 *0.44 ± 0.03
Conformer [39]202375.79 ± 0.26 **0.72 ± 0.0045.44 ± 0.95 **0.27 ± 0.01
BaseNet [40]202476.45 ± 0.69 *0.69 ± 0.0157.82 ± 1.01 *0.44 ± 0.01
CTNet [41]202478.08 ± 1.280.71 ± 0.0259.67 ± 2.040.46 ± 0.03
MSCFormer [42]202575.25 ± 0.44 **0.67 ± 0.0152.04 ± 2.82 *0.36 ± 0.04
Ours202680.06 ± 0.200.73 ± 0.0063.05 ± 0.810.51 ± 0.01
*: p < 0.05 and **: p < 0 01 represent the t-test difference between the performance of our model and the given model. “Avg Acc ± Std” means average accuracy and standard deviation across 3 random runs (random seeds: 2021, 2023, 2024). Bold values indicate the best performance among all competing methods.
Table 2. Cross-subject (LOSO) classification accuracies (in percentage %) of different algorithms on the PhysioNet dataset.
MethodsSubjectAvg Acc ± Std
1102030405060708090
ShallowNet [35]88.8975.5678.8985.5693.3386.6785.5610065.5696.6785.67 ± 10.27 **
Conformer [39]88.8977.7888.8987.7888.8991.1188.8998.8965.5697.7887.45 ± 9.62 *
CTNet [41]94.4472.2284.4487.7896.6787.7881.1110068.8997.7887.11 ± 10.66 **
MSCFormer [42]93.3378.8983.3387.7897.7893.3386.6798.8973.3395.5688.89 ± 8.45
Ours96.8878.1385.9495.3195.3193.7585.9410073.4498.4490.31 ± 9.04
*: p < 0.1 and **: p < 0 01 represent the t-test difference between the performance of our model and the given model. “Avg Acc ± Std” means average accuracy and standard deviation. Bold values indicate the best performance among all competing methods.
Table 3. Fractal feature statistics of raw EEG signals and four IMF components decomposed using different preprocessing methods.
MethodsFDHurstMFDFA Width
Raw1.47470.885811.9939
DWT [43]IMF11.69410.27820.7558
IMF21.60790.36001.5263
IMF31.45780.79809.8554
IMF41.34220.912413.9777
EMD [44]IMF11.66000.51823.6730
IMF21.48410.70299.1295
IMF31.32050.934617.0701
IMF41.08030.999325.5846
VMD [45]IMF11.10400.994523.4678
IMF21.67520.30351.3257
IMF31.59200.49005.1446
IMF41.39020.827211.9741
MVMD [18]IMF11.11520.994722.9744
IMF21.39460.821911.7257
IMF31.60510.47944.8349
IMF41.67970.29851.1821
Analysis is performed on signals collected from the motor cortex region of the 0-th trial sample in the training set of Subject 1.
Table 4. Fractal descriptors of four MI classes from the BCIC-IV-2a dataset.
MI ClassFDHurst **MFDFA Width *
Left Hand1.4884 ± 0.02970.8769 ± 0.025811.3845 ± 0.7232
Right Hand1.4853 ± 0.02820.8798 ± 0.022511.4421 ± 0.6592
Feet1.4836 ± 0.02930.8736 ± 0.025711.3603 ± 0.6881
Tongue1.4914 ± 0.02790.8640 ± 0.025711.1709 ± 0.7241
Analysis is performed on signals collected from the motor cortex region of Subject 1. The “±” values denote the standard deviation across all 144 trials per class, covering both training and test sets. One-way ANOVA is adopted to test inter-class statistical differences (*: p < 0.01 and **: p < 0.001).
Table 5. The performance of the whole model (in percentage %) with different modal decomposition numbers on different tasks of BCIC-IV-2a.
MethodsNum_Modes
3456
Original 4-class task79.4480.2979.2179.32
Foot–tongue binary task91.1591.5891.5892.01
Left–right hand binary task90.9791.3291.2392.36
Bold values indicate the best performance under different modal decomposition numbers.
Table 6. The performance of the whole model (in percentage %) with different reduction ratios of SE Block.
ReductionSubjectAvg Acc ± Std
123456789
0.2589.5862.1593.4080.5667.0162.1579.1789.9384.3878.70 ± 12.15
0.588.1964.9393.7576.0468.7562.8579.5188.5482.9978.39 ± 11.06
187.5068.7593.7583.3365.9769.1079.8691.6782.6480.29 ± 10.25
287.8567.3694.1077.0867.3662.1582.2989.5882.6478.93 ± 11.19
488.5468.0695.8379.1767.3664.9380.2189.9383.6879.75 ± 10.98
888.8966.3294.1077.7867.3664.2479.5187.8580.2178.47 ± 10.72
“Avg Acc ± Std” means average accuracy and standard deviation. Bold values indicate the best performance among all competing methods.
Table 7. Analysis (in percentage %) of the Cross-Region Fusion Block.
MethodsSubjectAvg Acc ± Std
123456789
Without SE Block87.5067.0196.1877.4366.6765.9780.5689.5880.9079.09 ± 10.92
Without Shuffle Block88.1967.0194.1078.1369.4463.1979.8688.8981.2578.90 ± 10.62
Without residual connection87.8566.6794.1078.1369.4460.7681.2588.8984.3879.05 ± 11.26
Ours87.5068.7593.7583.3365.9769.1079.8691.6782.6480.29 ± 10.25
“Avg Acc ± Std” means average accuracy and standard deviation. Bold values indicate the best performance among all competing methods.
Table 8. Ablation experiments comparison (in percentage %) of the proposed model.
MethodsSubjectAvg ± Std
123456789
No Brain Region Division86.4667.3693.4065.9765.6360.0787.1583.3384.0377.04 ± 12.15
No MVMD Decomposition88.5466.6794.1075.3564.5864.9381.6090.2885.4279.05 ± 11.54
No Cross-Region Fusion Block87.1565.6395.1476.0467.0163.1976.3990.2883.3378.24 ± 11.49
Ours87.5068.7593.7583.3365.9769.1079.8691.6782.6480.29 ± 10.25
“Avg Acc ± Std” means average accuracy and standard deviation. “No Brain Region Division” represents the model without region-wise branches and the Cross-Region Fusion Block; “No Cross-Region Fusion Block” represents the direct concatenation of inter-regional features. Bold values indicate the best performance among all competing methods.
Disclaimer/Publisher’s Note: The statements, opinions and data contained in all publications are solely those of the individual author(s) and contributor(s) and not of MDPI and/or the editor(s). MDPI and/or the editor(s) disclaim responsibility for any injury to people or property resulting from any ideas, methods, instructions or products referred to in the content.