1. Introduction
Emotions play a crucial role in human interaction, influencing how we make decisions, solve problems, and relate to our environment. Their study has been a recurring topic of interest in various fields, ranging from philosophy to research. These fields have demonstrated that emotions have a complex background, linking cognitive and physiological processes, and suggest that specific emotional patterns are innate.
Interpreting facial expressions related to emotions is a skill that humans practice every day. Instinctively, we can identify when someone is happy, sad, or angry. Ekman [
1] postulates in his research that individual facial muscle movements can model universal basic emotions and are consistent across different cultures. Based on this premise, this work aims to develop a model that enables the identification of frustration as an emotion. Although somewhat neglected in research and given little attention compared to other emotions, such as happiness, sadness, and anger, frustration has a significant impact on the educational context. This emotion emerges when a person encounters obstacles that prevent them from achieving their goals, affecting their performance, motivation, and confidence. In an educational setting, detecting and mitigating frustration is crucial to promoting effective learning and fostering a more inclusive environment that improves student well-being. However, research on this emotion remains limited, underscoring the need for further investigation.
This work uses computer vision algorithms, specifically convolutional neural networks (CNNs), which have revolutionized emotion detection and other image-related areas. These networks are particularly effective at identifying complex visual patterns in images, making them an ideal tool for analyzing facial expressions and gestures that characterize frustration.
Since no dataset exists in the literature that would allow us to perform the frustration detection task, we designed an experimental protocol to create one. The experiment consists of two cognitive tasks that students at the Escuela Superior de Cómputo of the Instituto Politécnico Nacional are required to solve. Meanwhile, we record them as genuine expressions, avoiding posed ones like many published emotion datasets. Thus, this in-the-wild dataset opens up new possibilities for future research in the field.
In summary, this work aims to enhance the understanding of frustration through facial expressions, promoting the creation of practical tools that can transform educational environments and foster well-being and motivation in students.
2. State of the Art
Facial Expression Recognition (FER) is a computer vision task that identifies and classifies emotions represented in the human face. This task has gained significant popularity in recent years thanks to the power of artificial neural networks (ANNs) in general and convolutional neural networks (CNNs) specifically when working with images. These networks can extract abstract features that may or may not align with what the human eye can see, enabling strong performance in this task.
In the work of Yao et al. (2021) [
2], a study on the classification of action units (AUs) from the
Facial Action Coding System (FACS) was proposed, using a support vector machine (SVM). The experimental results indicate that the proposed algorithm effectively suppresses correlated noise and achieves a higher recognition rate than other methods, including Principal Component Analysis (PCA) and human observers. The CK dataset [
3] was used to train the model. The authors obtain an accuracy of
.
The article by Roy et al. (2024) [
4] shows the best results obtained using the FER2013 [
5] dataset; this dataset is widely used to train and evaluate facial emotion recognition models and appears as part of a facial expression recognition competition. It is composed of grayscale images of human faces with dimensions of
pixels. The emotional categories are anger, disgust, fear, happiness, sadness, surprise, and neutral; it has a total of 35,887 images. The model they propose, named
ResEmoteNet, combines convolutional neural networks, residual blocks, and squeeze-and-excitation (SE) blocks. The SE block allows the model to focus on the most relevant features and suppress less important ones. Residual blocks facilitate training by allowing direct connections that avoid problems such as gradient vanishing. With this architecture, they achieve an accuracy of
.
The article proposed by Her et al. (2024) [
6] obtains one of the best results recorded for the
AffectNet [
7] dataset. The model proposed in this article is called
Batch Transformer Network (BTN); the result obtained is
accuracy for eight classes, indicating that there is still space for improvement in this challenging task.
The article published by Grafsgaard et al. (2013) [
8] presents research on how facial movements can predict affective states and learning outcomes during computer-based tutoring sessions. The dataset was collected using a web interface that facilitated learning tasks in the field of programming. The results obtained show that when a student is frustrated, they usually lower their eyebrows (AU04) [
9]. However, they do not present classification results.
In the article proposed by Hoque et al. (2012) [
10], the research focuses on classifying facial expressions of frustration and delight. They formed two data sets: acted emotions and spontaneous emotions. The best results for the dataset with spontaneous emotions were
accuracy using SVM. This work focused on detecting smiling, and defined frustration as the absence of smiling; it did not study frustration itself.
In the work of Grewe et al. (2019) [
11], the authors propose a system that utilizes deep learning, computer vision, and natural language processing to support students in online learning.
Ulearn, as they call the system, aims to detect frustration in students and offer content-related support to what they see on the screen. The application monitors the student by keeping the camera on. To detect emotions, they utilized the convolutional network proposed by Arriaga et al. (2017) [
12], which consists of 17 layers, including the output layer. This network was trained on the FER-2013 dataset [
5]. This model only detects the following emotions: anger, disgust, fear, happiness, sadness, surprise, and neutral. Since the emotion of frustration is not explicitly studied, they decided to consider a user as frustrated when any of the “negative” emotions were present: anger, disgust, fear, sadness, or surprise. To the best of our knowledge, there is no study on directly detecting the emotion of frustration.
3. Frustration and Cognitive Tests
This section will describe the frustration emotion and the cognitive tests used in the experiment.
3.1. Frustration
Below, we will provide two definitions of frustration:
According to [
13], frustration is the inability to satisfy a desire or achieve a goal, which can evoke emotional responses such as disappointment or anger. This emotion is so complex because it coexists with other emotions and has a direct negative impact on our perception and the way we approach our goals.
According to [
14], frustration is the typical emotional response we experience when we have a desire, goal, or need that fails to satisfy. We may experience annoyance, anger, and disappointment. An entirely negative emotion arises when we realize we cannot achieve something meaningful. If an individual cannot achieve their goal, they are likely to experience anger, depression, stress, and loss of confidence.
The aforementioned is of utmost importance to our work, as we can directly relate it to the field of education. A person experiencing frustration may lose self-confidence, which is a significant problem in academic settings.
When students face frustration in the school environment, their motivation and confidence often decrease, leading to a blockage that prevents them from achieving their goals. This emotion can occur, for example, when we fail to understand a topic thoroughly and the class continues to move forward, generating anxiety over the accumulation of pending material. Furthermore, students often perceive the academic environment as unsupportive; some teachers are unempathetic or ignore their students because they focus on completing the coursework. Likewise, a competitive environment among peers can intensify the feeling of frustration, further hindering the ability to learn.
3.2. Cognitive Test: PASAT
The Paced Auditory Serial Addition Test (PASAT) [
15] is a tool used in neuropsychological evaluations of participants. This test measures cognitive abilities, including processing speed, working memory, and concentration [
16], as well as assessing the ability to perform calculations and divided attention [
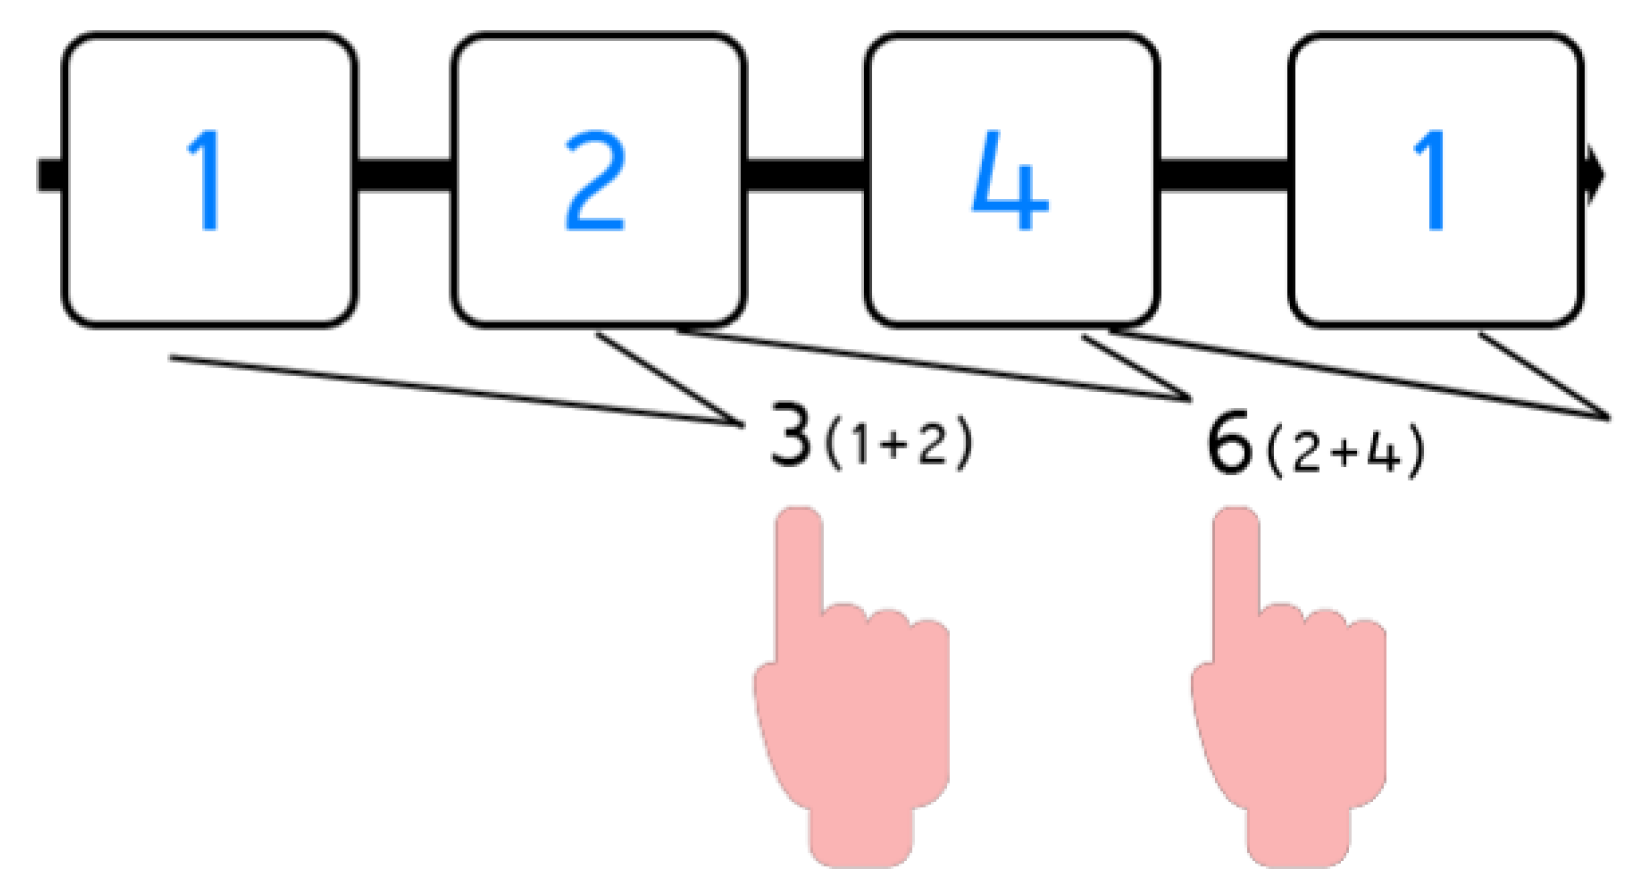
17]. This test involves hearing a number. After a predefined period, the system says another number. The participant must add these two numbers and select the answer with the mouse on a panel with different possible numbers; the system repeats this task until the sequence of numbers that make up a round is complete. We implemented the test with four rounds. Here is an example.
Example: PASAT test
First step: As seen in
Figure 1, the system says one (blue one in the Figure); the participant must wait for the second number.
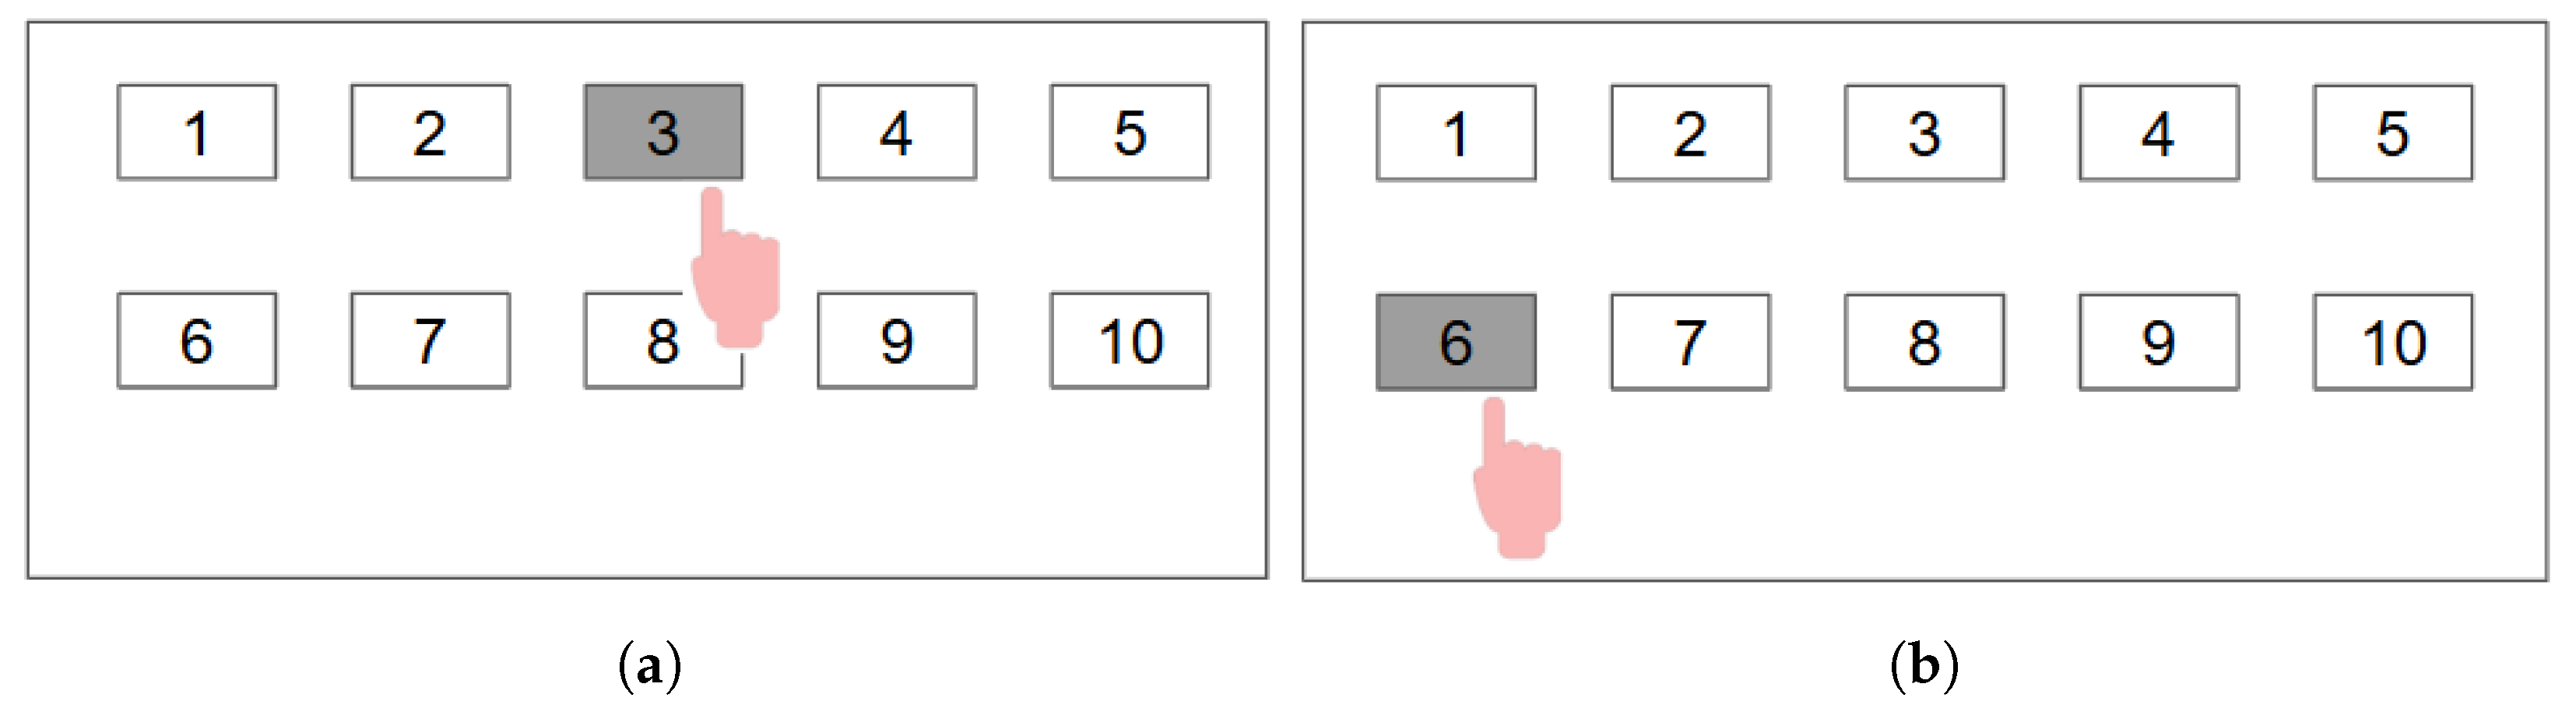
Second step: The system says two (2); now, the participant must sum both numbers, 1 + 2 = 3, and select the number three from the panel in
Figure 2a.
Third step: The system says four (4); now, the participant must add the last two numbers, so the correct operation is 2 + 4 = 6. The participant must select number six from the panel in
Figure 2b.
3.3. Cognitive Test: N-Back
The N-back test is a classic training task used for two purposes: training one or more cognitive processes and measuring an individual’s ability in those domains. This test presents various sequences of stimuli, including letters, numbers, colors, shapes, and spatial points. The N-back test generally identifies whether the stimulus presented is the same as the stimulus presented
N iterations earlier. Wayne [
18] developed the N-back test to conduct his research on short-term memory. His research applied a series of visual stimuli to young and older participants. The results showed that younger people made fewer errors and responded less randomly. In clinical settings, doctors often use this test in research on neurological disorders, such as attention deficit/hyperactivity disorder (ADHD) and cognitive impairment.
In this test, there are two kinds of stimuli: auditory and visual. Here are some examples.
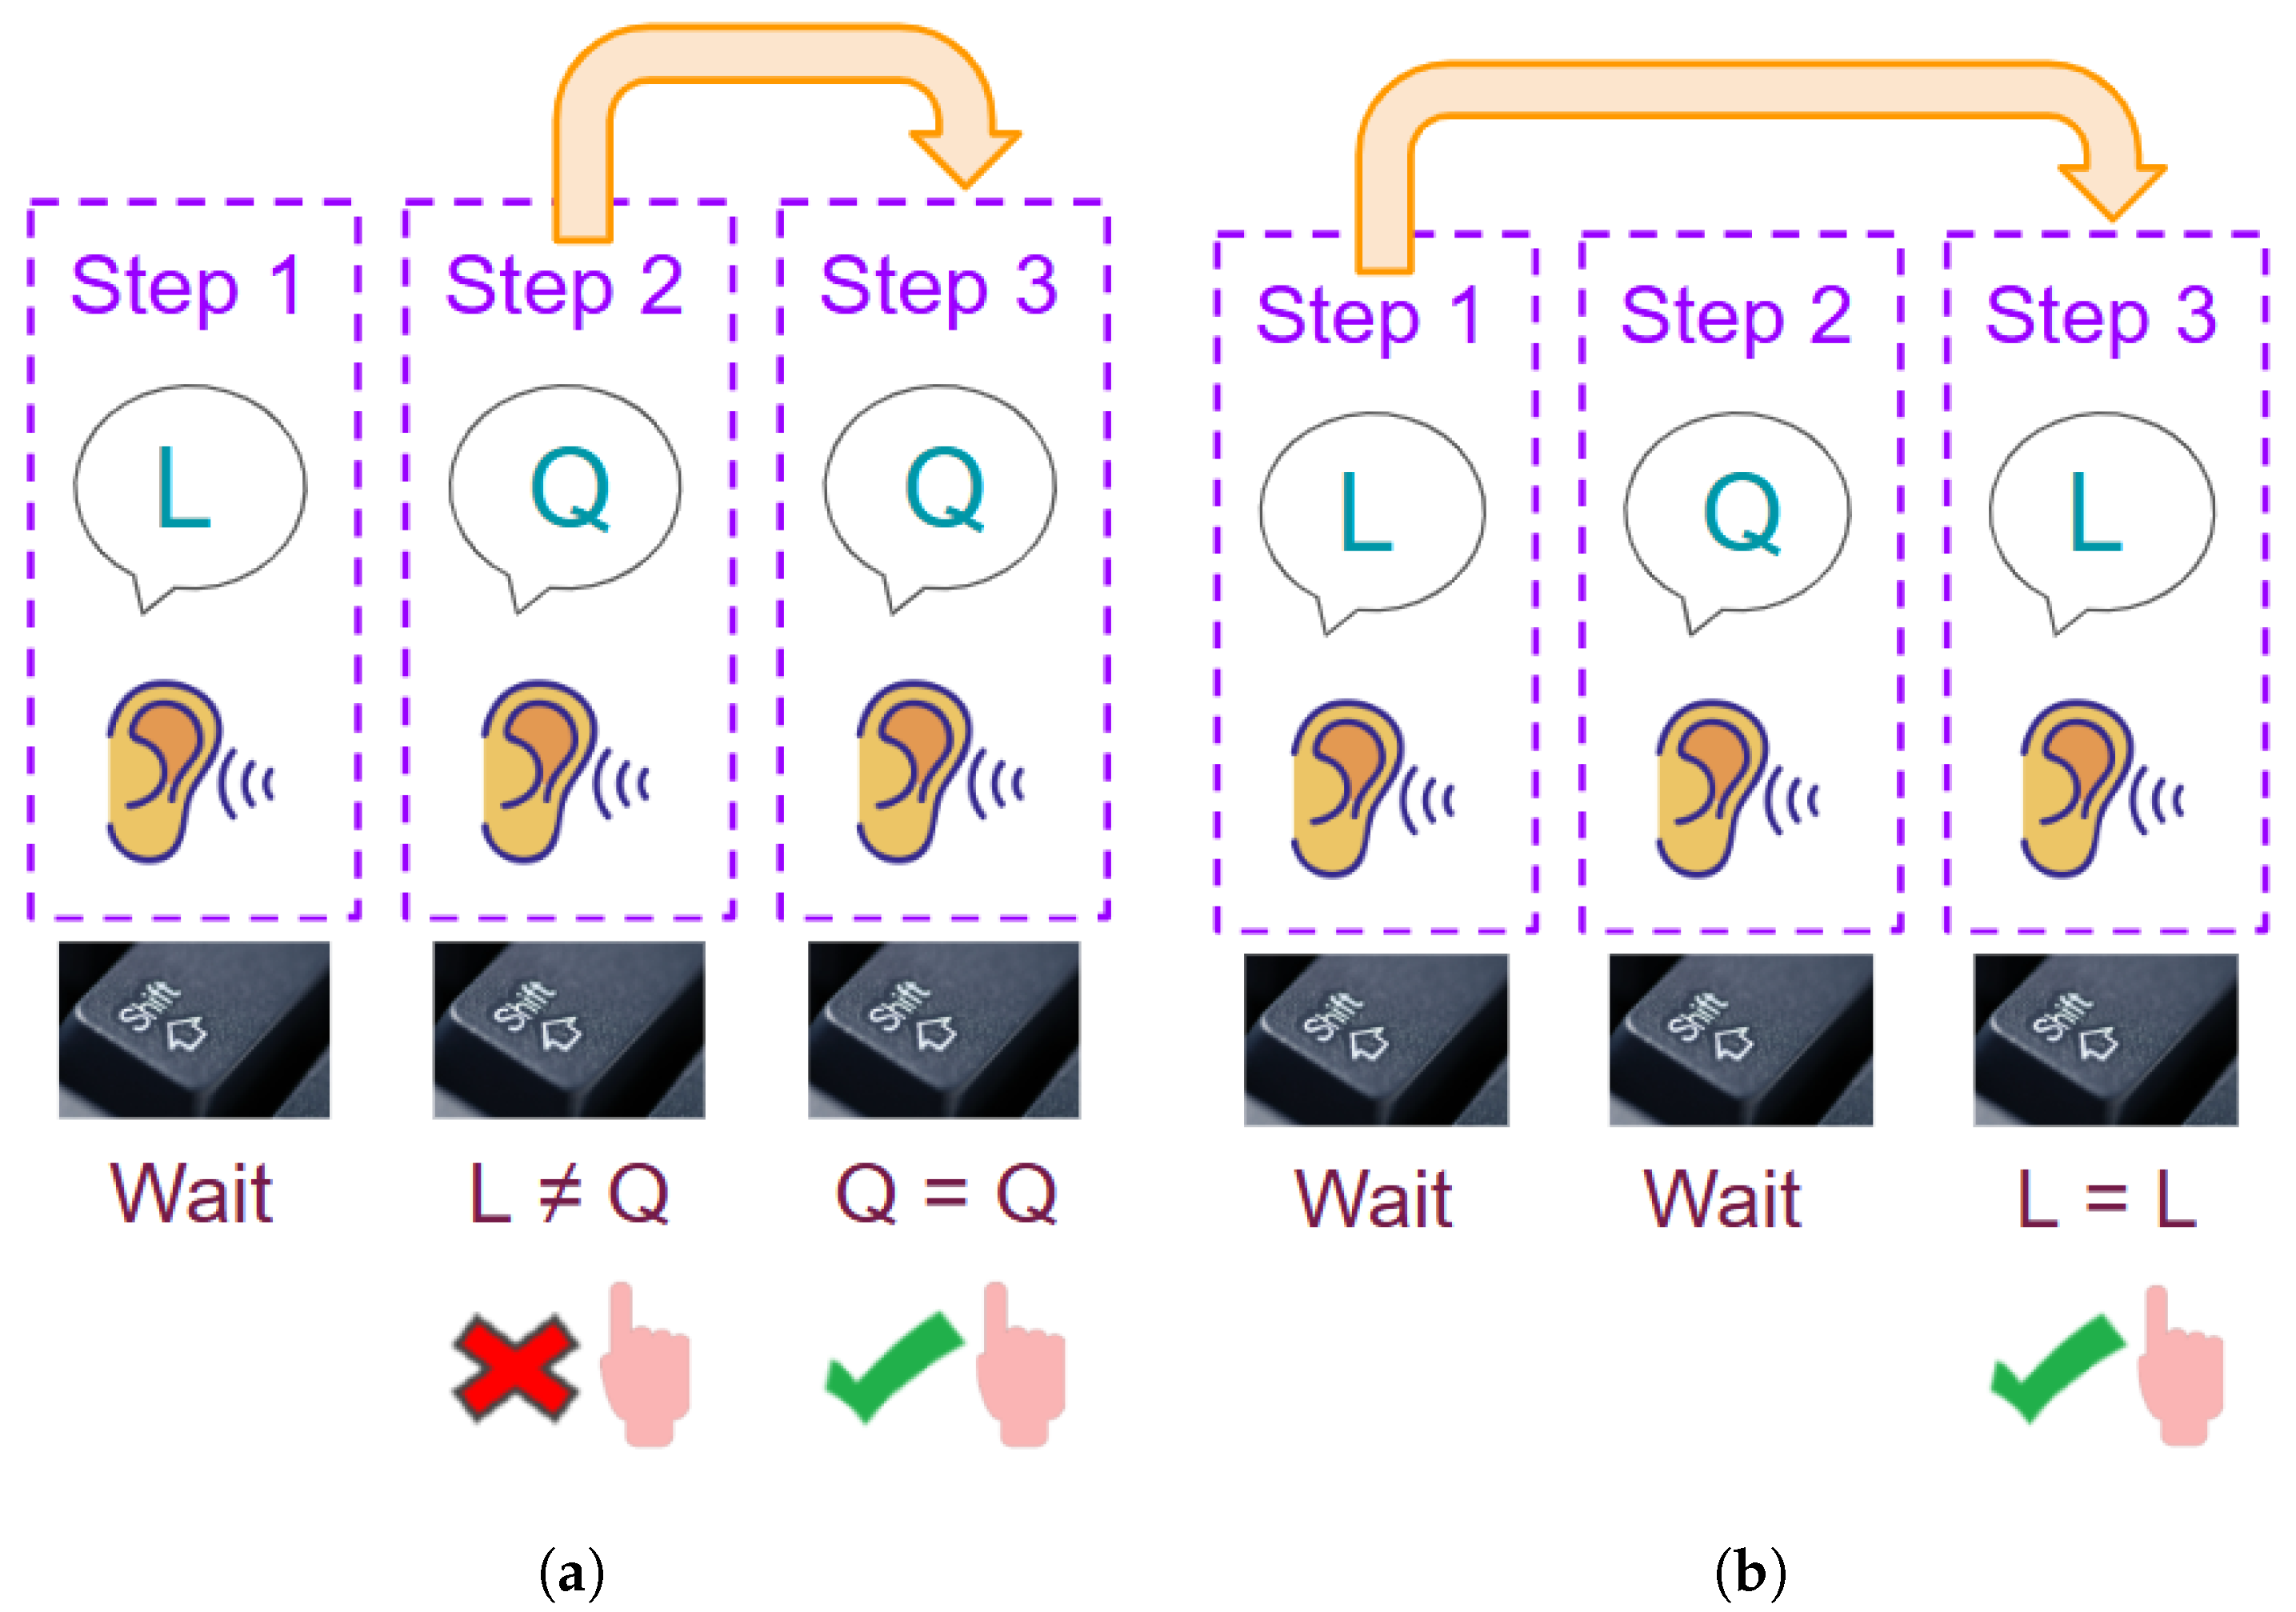
1-back, auditory stimuli example: As seen in
Figure 3a, the first auditory stimulus is the letter “L”. Then, “Q” is heard in the second step, so it does not match using the 1-back rule (
). The following letter is another “Q”; since the previous letter was a Q, it matches, so the participant presses the left shift key.
2-back, auditory stimuli example: As seen in
Figure 3b, first, an “L” is heard. In the second step, a “Q” is heard. In the third step, the letter is an “L”, which matches the stimulus from two steps earlier. Therefore, the participant must press the left shift key.
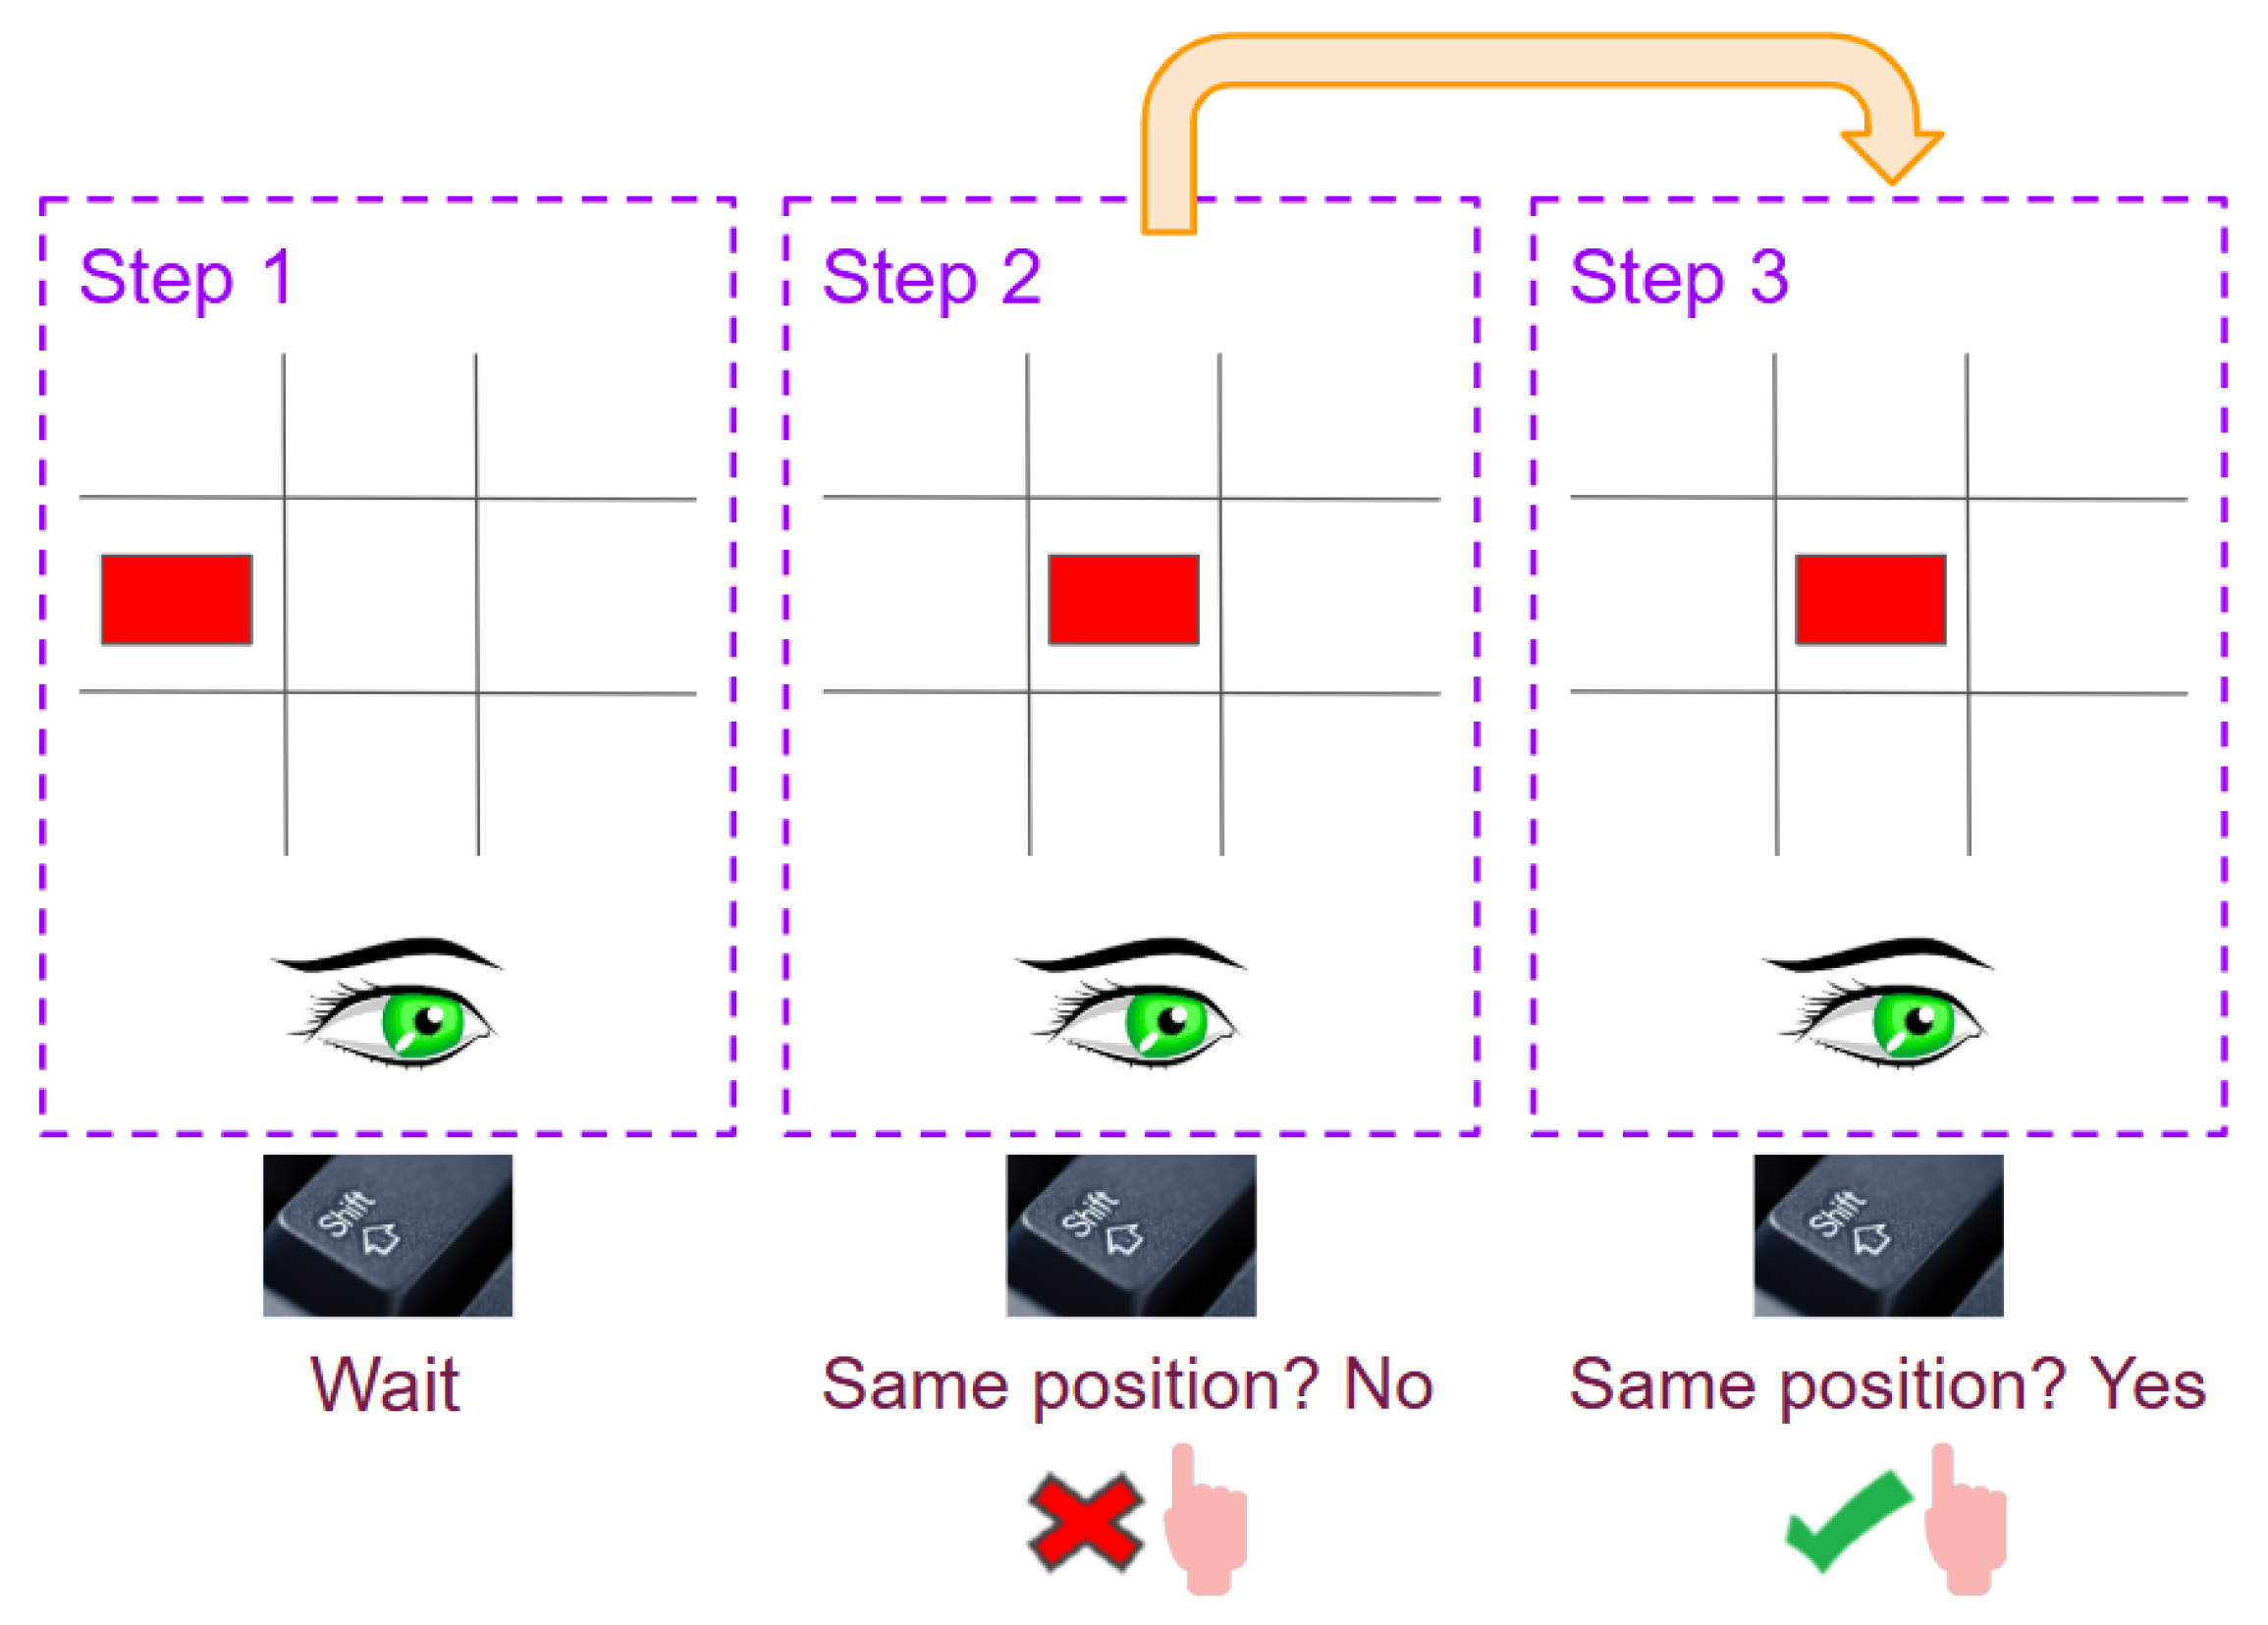
Now, we will show an example of the test using visual stimuli and a 1-back rule. In this case, we will need to remember the position of a box within a grid. For this type of stimulus, the participant must press the right shift key when a match occurs.
1-back, visual stimuli example: As seen in
Figure 4, in the first step, the red box is displayed in the center left. In the second step, the red box appears in the center of the grid. In the third step, the red box is displayed again in the center of the grid, which matches the 1-back rule, so the participant must press the right shift key.
In the case of 2-back visual stimuli, the participant must wait at least three iterations before responding; this means that if the position of the box repeats in the third iteration, it is a match.
4. Methodology
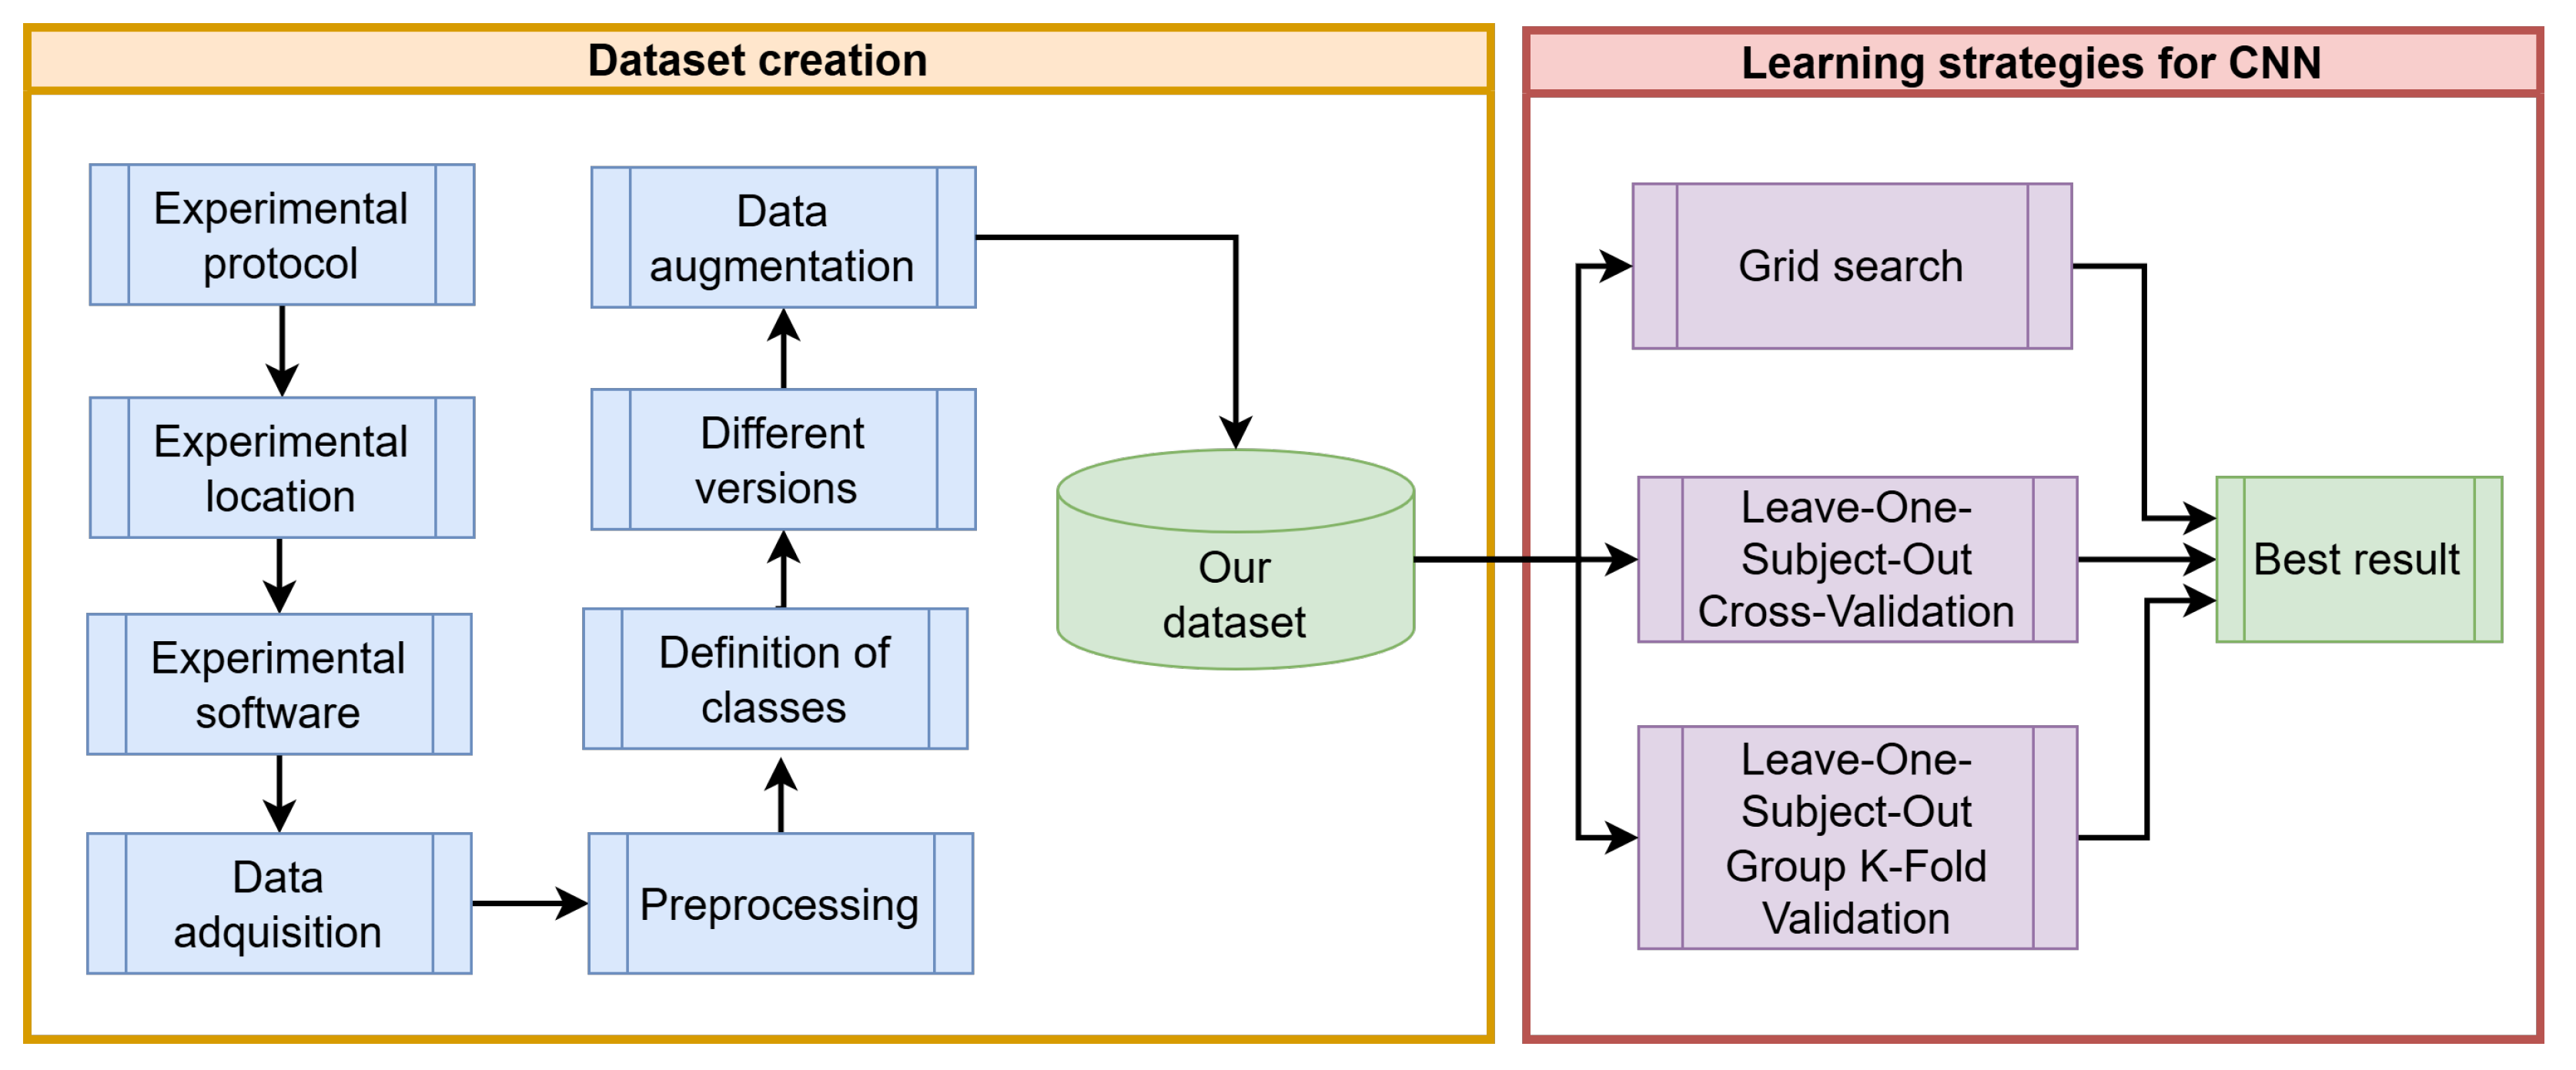
Figure 5 illustrates the proposed methodology for generating a novel dataset in the wild and a novel deep learning model to infer emotions of frustration and confidence accurately.
4.1. Experimental Protocol
The target population must be defined for research purposes, allowing the research to focus on a smaller, more specific group and propose a more targeted solution. As mentioned in [
19], we need to define the inclusion, exclusion, and elimination criteria.
4.1.1. Inclusion Criteria
These criteria refer to the main characteristics that allow an individual to be considered eligible to participate in the project. The inclusion criteria are as follows:
Be a university student (male or female) at the Escuela Superior de Cómputo (ESCOM) of the Instituto Politécnico Nacional: To solve the proposed problem, we do not consider it necessary to distinguish between men and women.
Be between 18 and 24 years of age: This age range encompasses the majority of the university population.
Have 40 min to complete the tests.
4.1.2. Exclusion Criteria
Exclusion criteria are characteristics that enable us to exclude potential participants from the study. Thus, if the potential participant meets any exclusion criteria, they will not be admitted to the project, even if they meet all the inclusion criteria. Our exclusion criteria are as follows:
Needing glasses for close-up vision: Because we focus on detecting frustration in university students through their facial expressions, we considered that glasses could make some gestures less visible and introduce noise for the classification models.
Not being able to tie hair away from the face: If the participant cannot do it, it may limit the ability to see some gestures and increase noise in the image.
Not signing the consent form: If the potential participant does not agree to sign the consent form, they will not be able to participate.
4.1.3. Elimination Criteria
Elimination criteria are characteristics that allow us to eliminate an admitted participant. Our elimination criteria are as follows:
The face is not in the frame: The person may get too close to the screen, causing the face not to be captured correctly, or they may have held up their hand or some object, obscuring their face.
The participant was not expressive.
The participant did not understand the instructions: The participant may take the tests without fully understanding them, which may be grounds for elimination.
4.2. Experimental Location
It is essential to have adequate space to standardize the conditions of use and maintain a consistent environment for all participants when conducting the tests. The recording location is shown in
Figure 6 under the following conditions: a white background, controlled lighting with a ring light, and a closed space to minimize excess noise. The camera used was a
Logitech WEBCAM C920 HD PRO, and it was placed at the height of the ring light so that the images were more centered. We used external computer speakers to ensure that the sound was sufficiently loud.
4.3. Experiment Software
We develop a software program (see [
20]) that includes modules for performing relaxation exercises, the PASAT and N-back tests, and facilitates the administration of a survey at the end of each test. Integrating all these functionalities enables the efficient implementation of experiments, ensures consistency, and facilitates the collection of data.
During the test, each participant will receive immediate on-screen feedback based on their performance during each trial. This feedback will display either “correct” or “incorrect” messages, depending on whether the answer was correct or incorrect. These visual stimuli are the ones we used, in the hope of fulfilling our hypothesis that we can capture faces that reflect the emotional state of frustration. In this way, each participant will receive a different number of stimuli of each type, depending on their performance; this clearly shows that we cannot force everyone to receive the same stimulus, thereby complicating the problem.
4.4. Data Acquisition
It is essential to note that the data were collected using the stimulus–response technique. This technique aims to elicit a specific response by presenting a particular stimulus. In this case, the goal is to induce emotional frustration in the participants by administering the PASAT and N-back tests. The hypothesis is that the difficulty of these tests will allow us to capture moments in which the face reflects visible signs of frustration. However, as [
21] mentions, getting a stimulus and its response to behave identically on two successive occasions is difficult, so multiple gestures reflecting frustration are expected. On the other hand, it is essential to note that detecting the emotional state of frustration presents significant challenges, primarily due to the complexity of this emotion and its various forms of manifestation, such as frowning, pursing the lips, or a nervous smile.
Over two months, ESCOM students arrived at the CIC. Those who met the requirements (
Section 4.1) and signed the consent and rights session forms (see them in [
22]) were eligible to participate in the experiment. We videotaped them, with an average of 40 min per session. The total number of admitted participants is shown in
Table 1.
4.5. Survey
At the end of each test, participants completed a survey, enabling us to gain a deeper understanding of each individual’s emotional state. The survey included questions on a four-item Likert-type scale that assessed participants’ perceived frustration and difficulty during the test, allowing us to collect data on their experiences and analyze how these responses related to their performance. The survey includes the following questions:
How would you rate the level of frustration you experienced during the test? Select one of the following: None, A little, Moderately, A lot.
Did you have difficulty remembering what you were doing during the PASAT/N-back test? Select one of the following: None, A little, Moderately, A lot.
How do you feel you did on the PASAT/N-back test? Open answer.
Was there a moment during the test when you were so overwhelmed that you stopped responding consciously?
Write a short text describing your experience while taking this exercise.
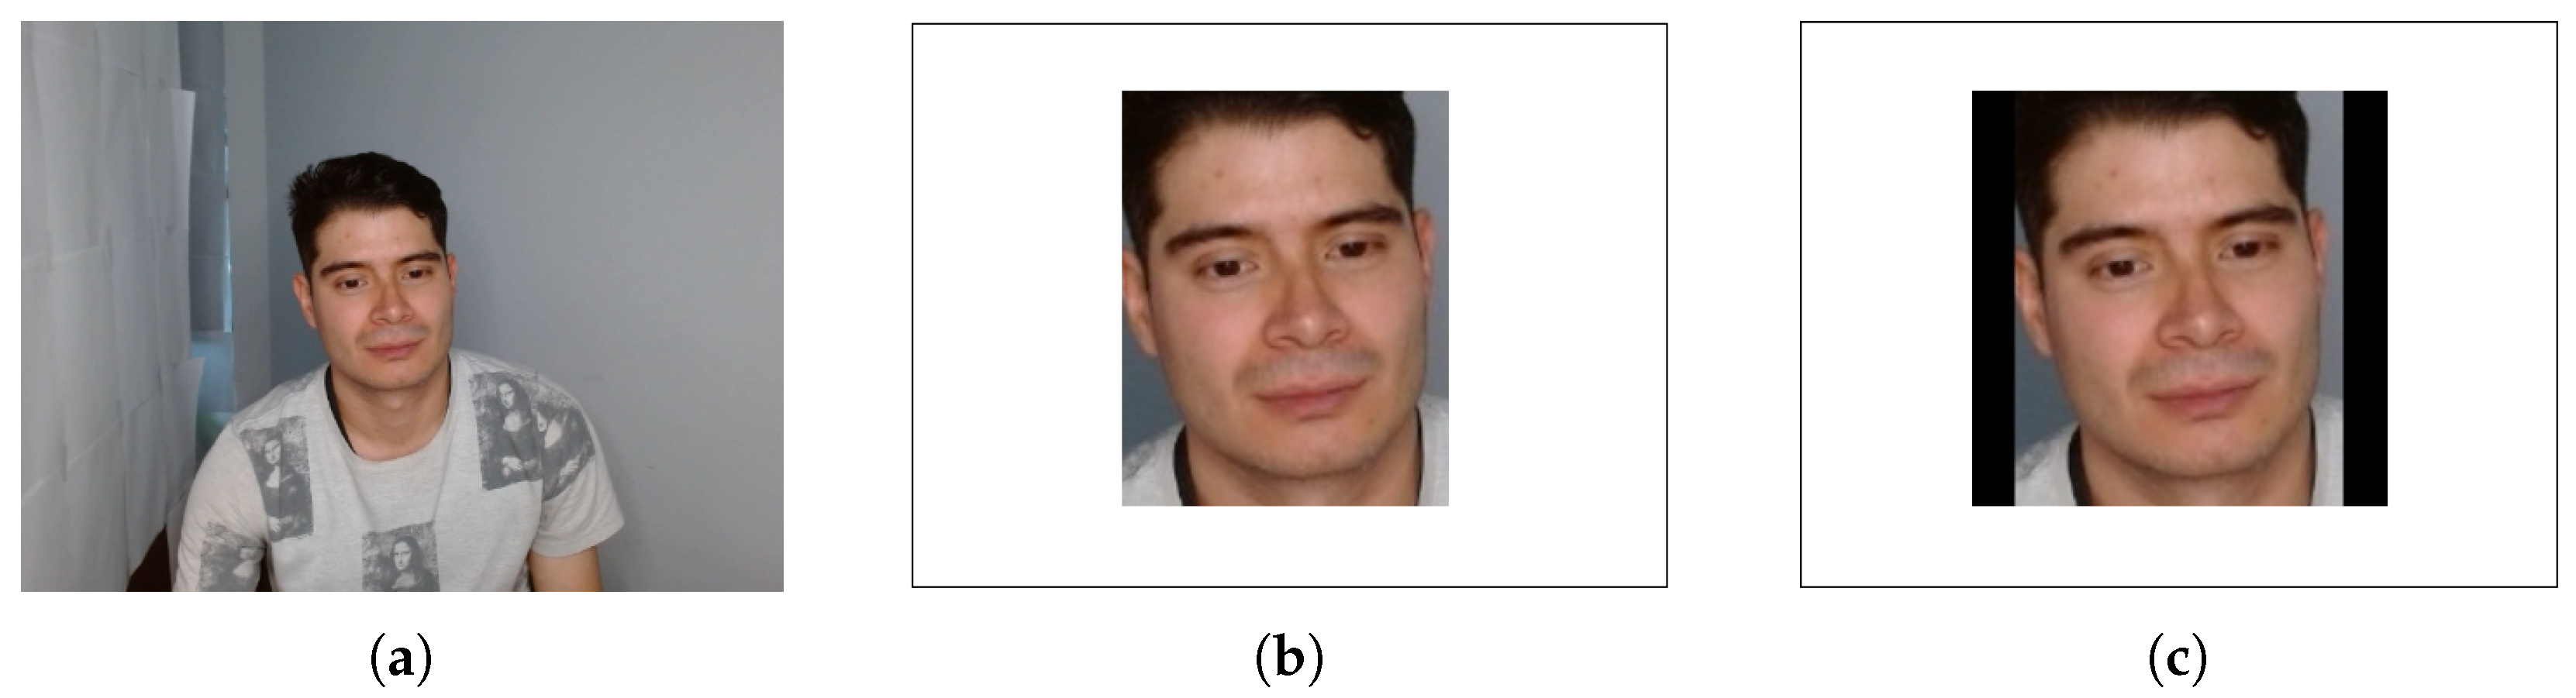
4.6. Preprocessing
Since our task is to detect frustration with students’ gestures, a face must be present in the image. Thus, we eliminated frames without a face. We carried out the face detection using the
MediaPipe [
23] face point detector.
Figure 7a shows an original frame where the half body of the participant appears. In
Figure 7b, we show the face cropped. Finally, in
Figure 7c, the face appears centered, and the image is of the desired size of
.
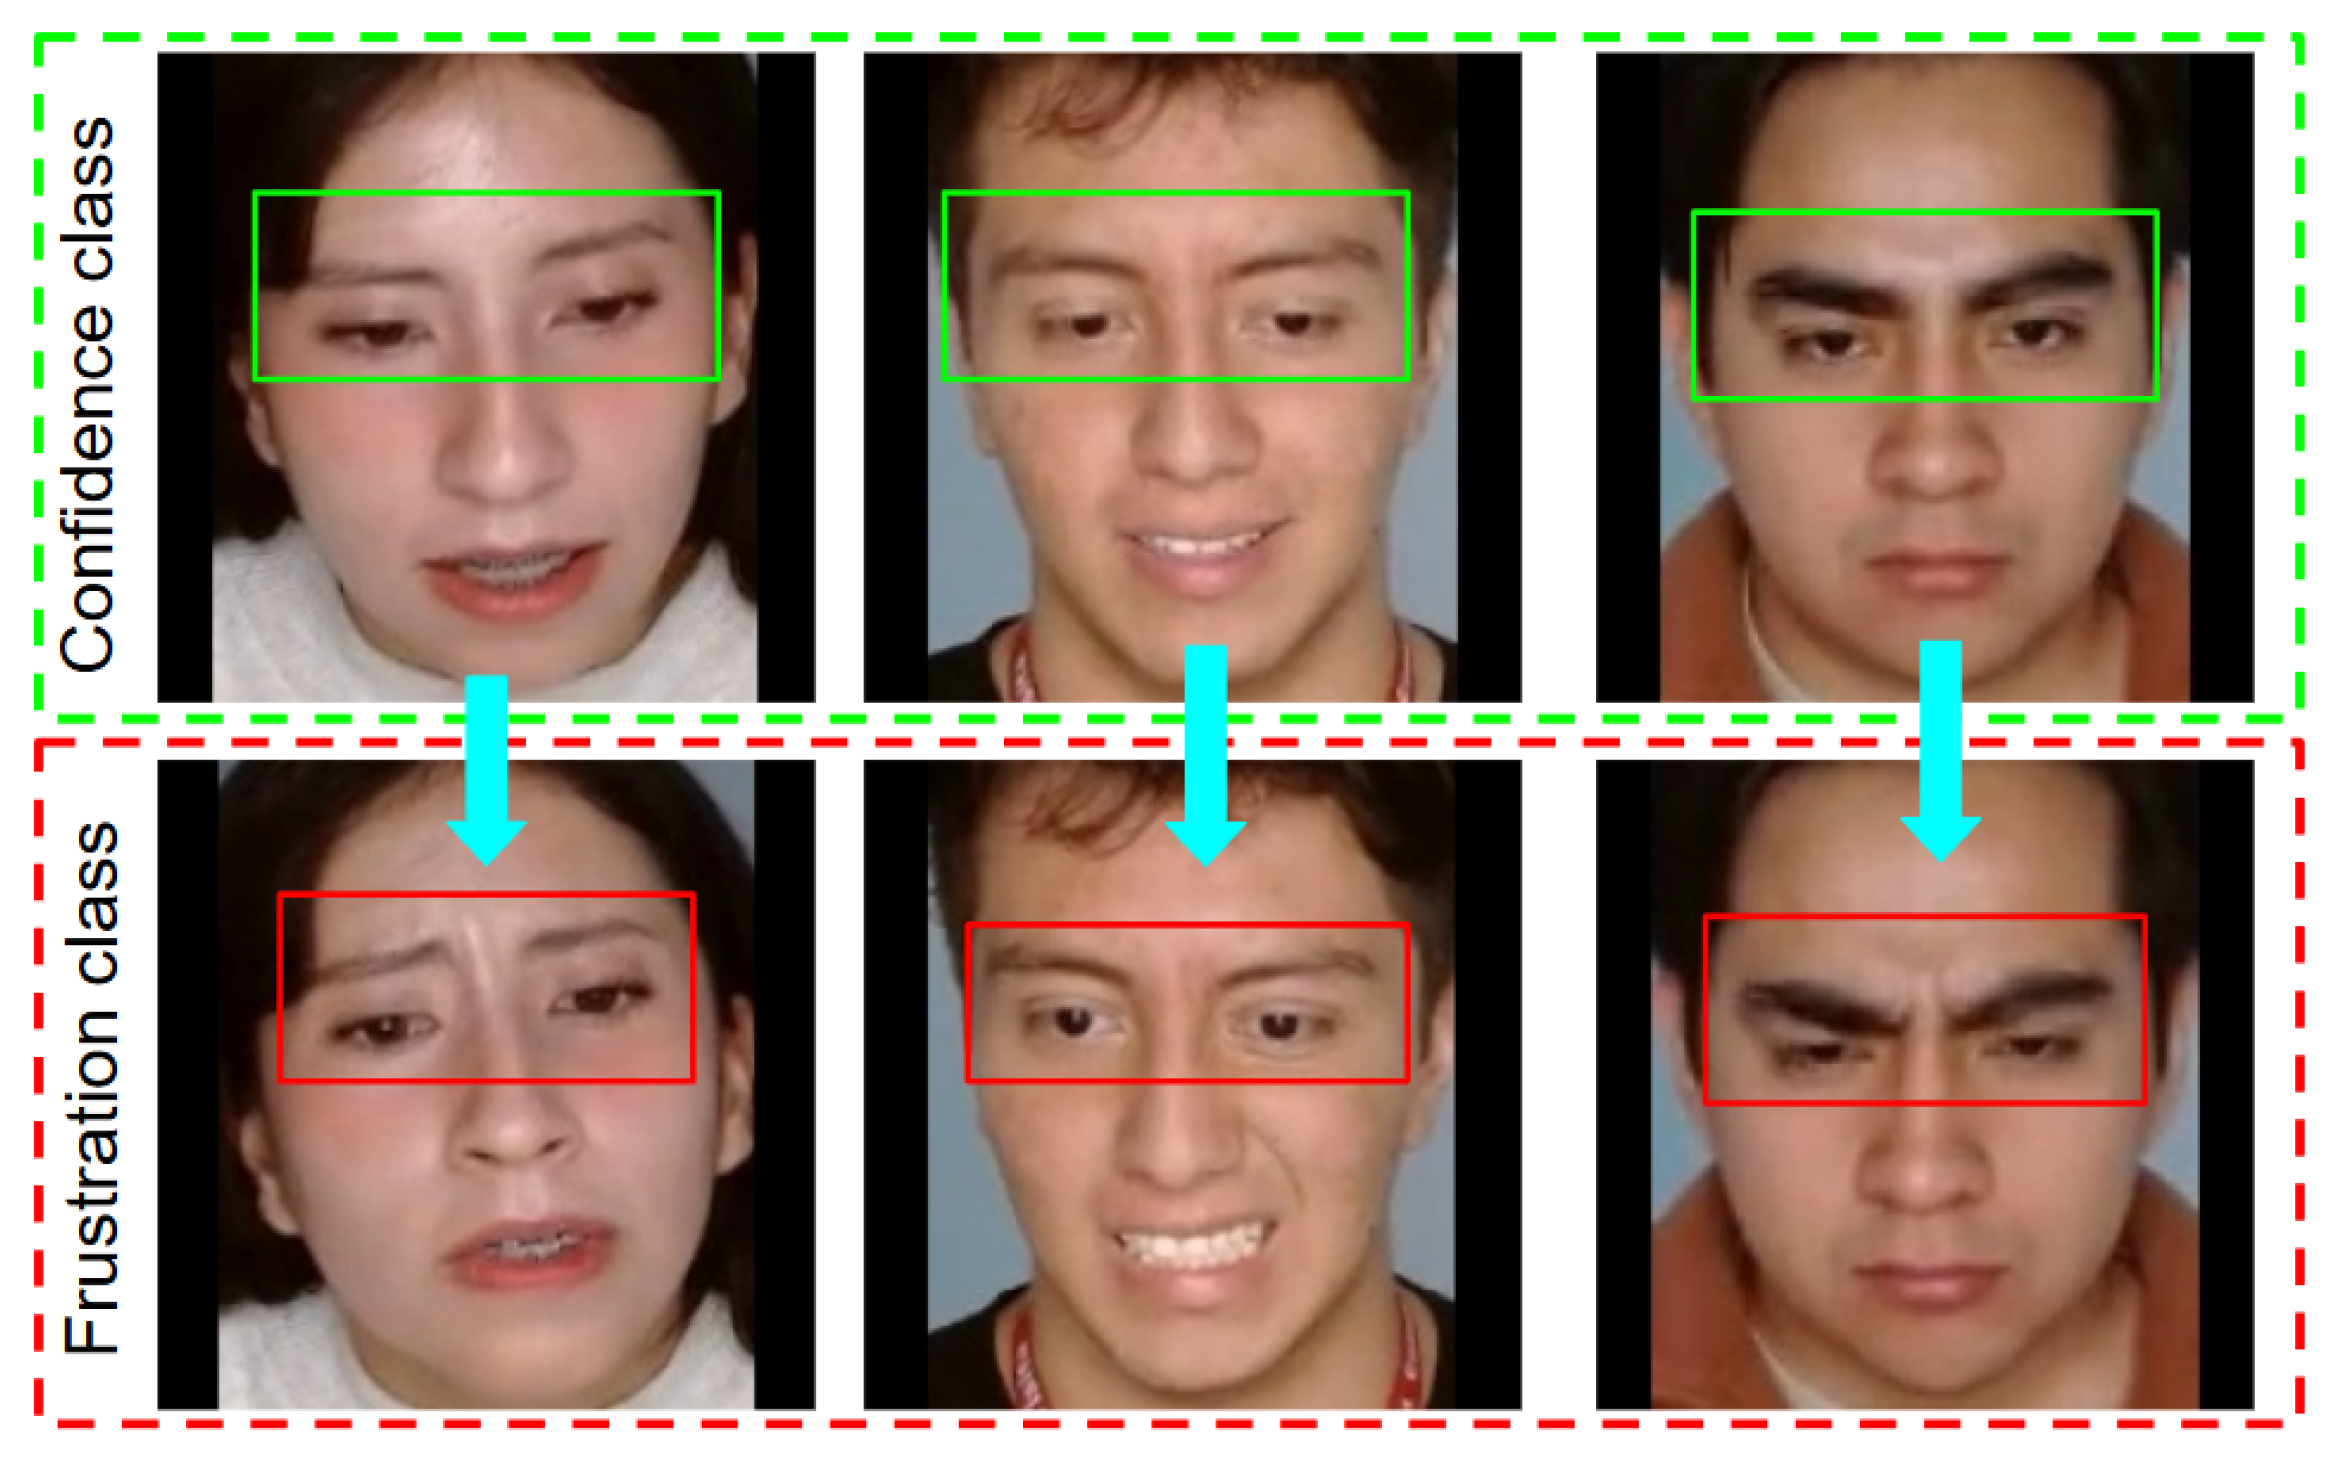
4.7. Definition of Classes
We have divided our dataset into two main classes: frustration and confidence. Following the methodology described in works such as [
24,
25], we utilize the model of emotion families derived from basic emotions to support the selection of these classes.
“Frustration” is our primary class of interest, and this model enables us to identify opposing emotions. This led us to select “confidence” as the counterpart to frustration, which in turn enables us to build a contrasting framework for emotion classification. In
Figure 8, we present some representative examples of each class. Notice that when the participant is confident, their face is relaxed, and when they experience frustration, their brow furrows, and sometimes their mouth opens or purses.
4.8. Different Versions of the Dataset
To study the phenomenon from different perspectives, we proposed three distinct datasets. The first one focuses on balancing the classes, and the second one on increasing the size of the data. Additionally, we create a third one, only for testing purposes.
4.8.1. Dataset Version 1
We carried out frame selection with great care. We created a first version of the dataset (V1), consisting of 1218 frames, distributed equally between the two classes, with 609 frames each.
Table 2 summarizes the V1 dataset.
4.8.2. Dataset Version 2
One persistent problem with the V1 dataset is that some participants have a significantly low number of images, which could negatively impact the dataset balance and model performance. Therefore, we decided to create a second version (V2) through more careful analysis, selecting frames that better represented the classes of interest. This allowed for the inclusion of a larger number of participants and a greater total number of images for each class, as shown in
Table 3.
4.8.3. Dataset Version 3
We group the images from participants who did not fit into the V2 dataset into this set (V3). We used the final models to test performance and thus compare the evaluations.
Table 4 shows the distribution by participant in the set of images
test_202, where the frustration class has 202 images and the confidence class has 200.
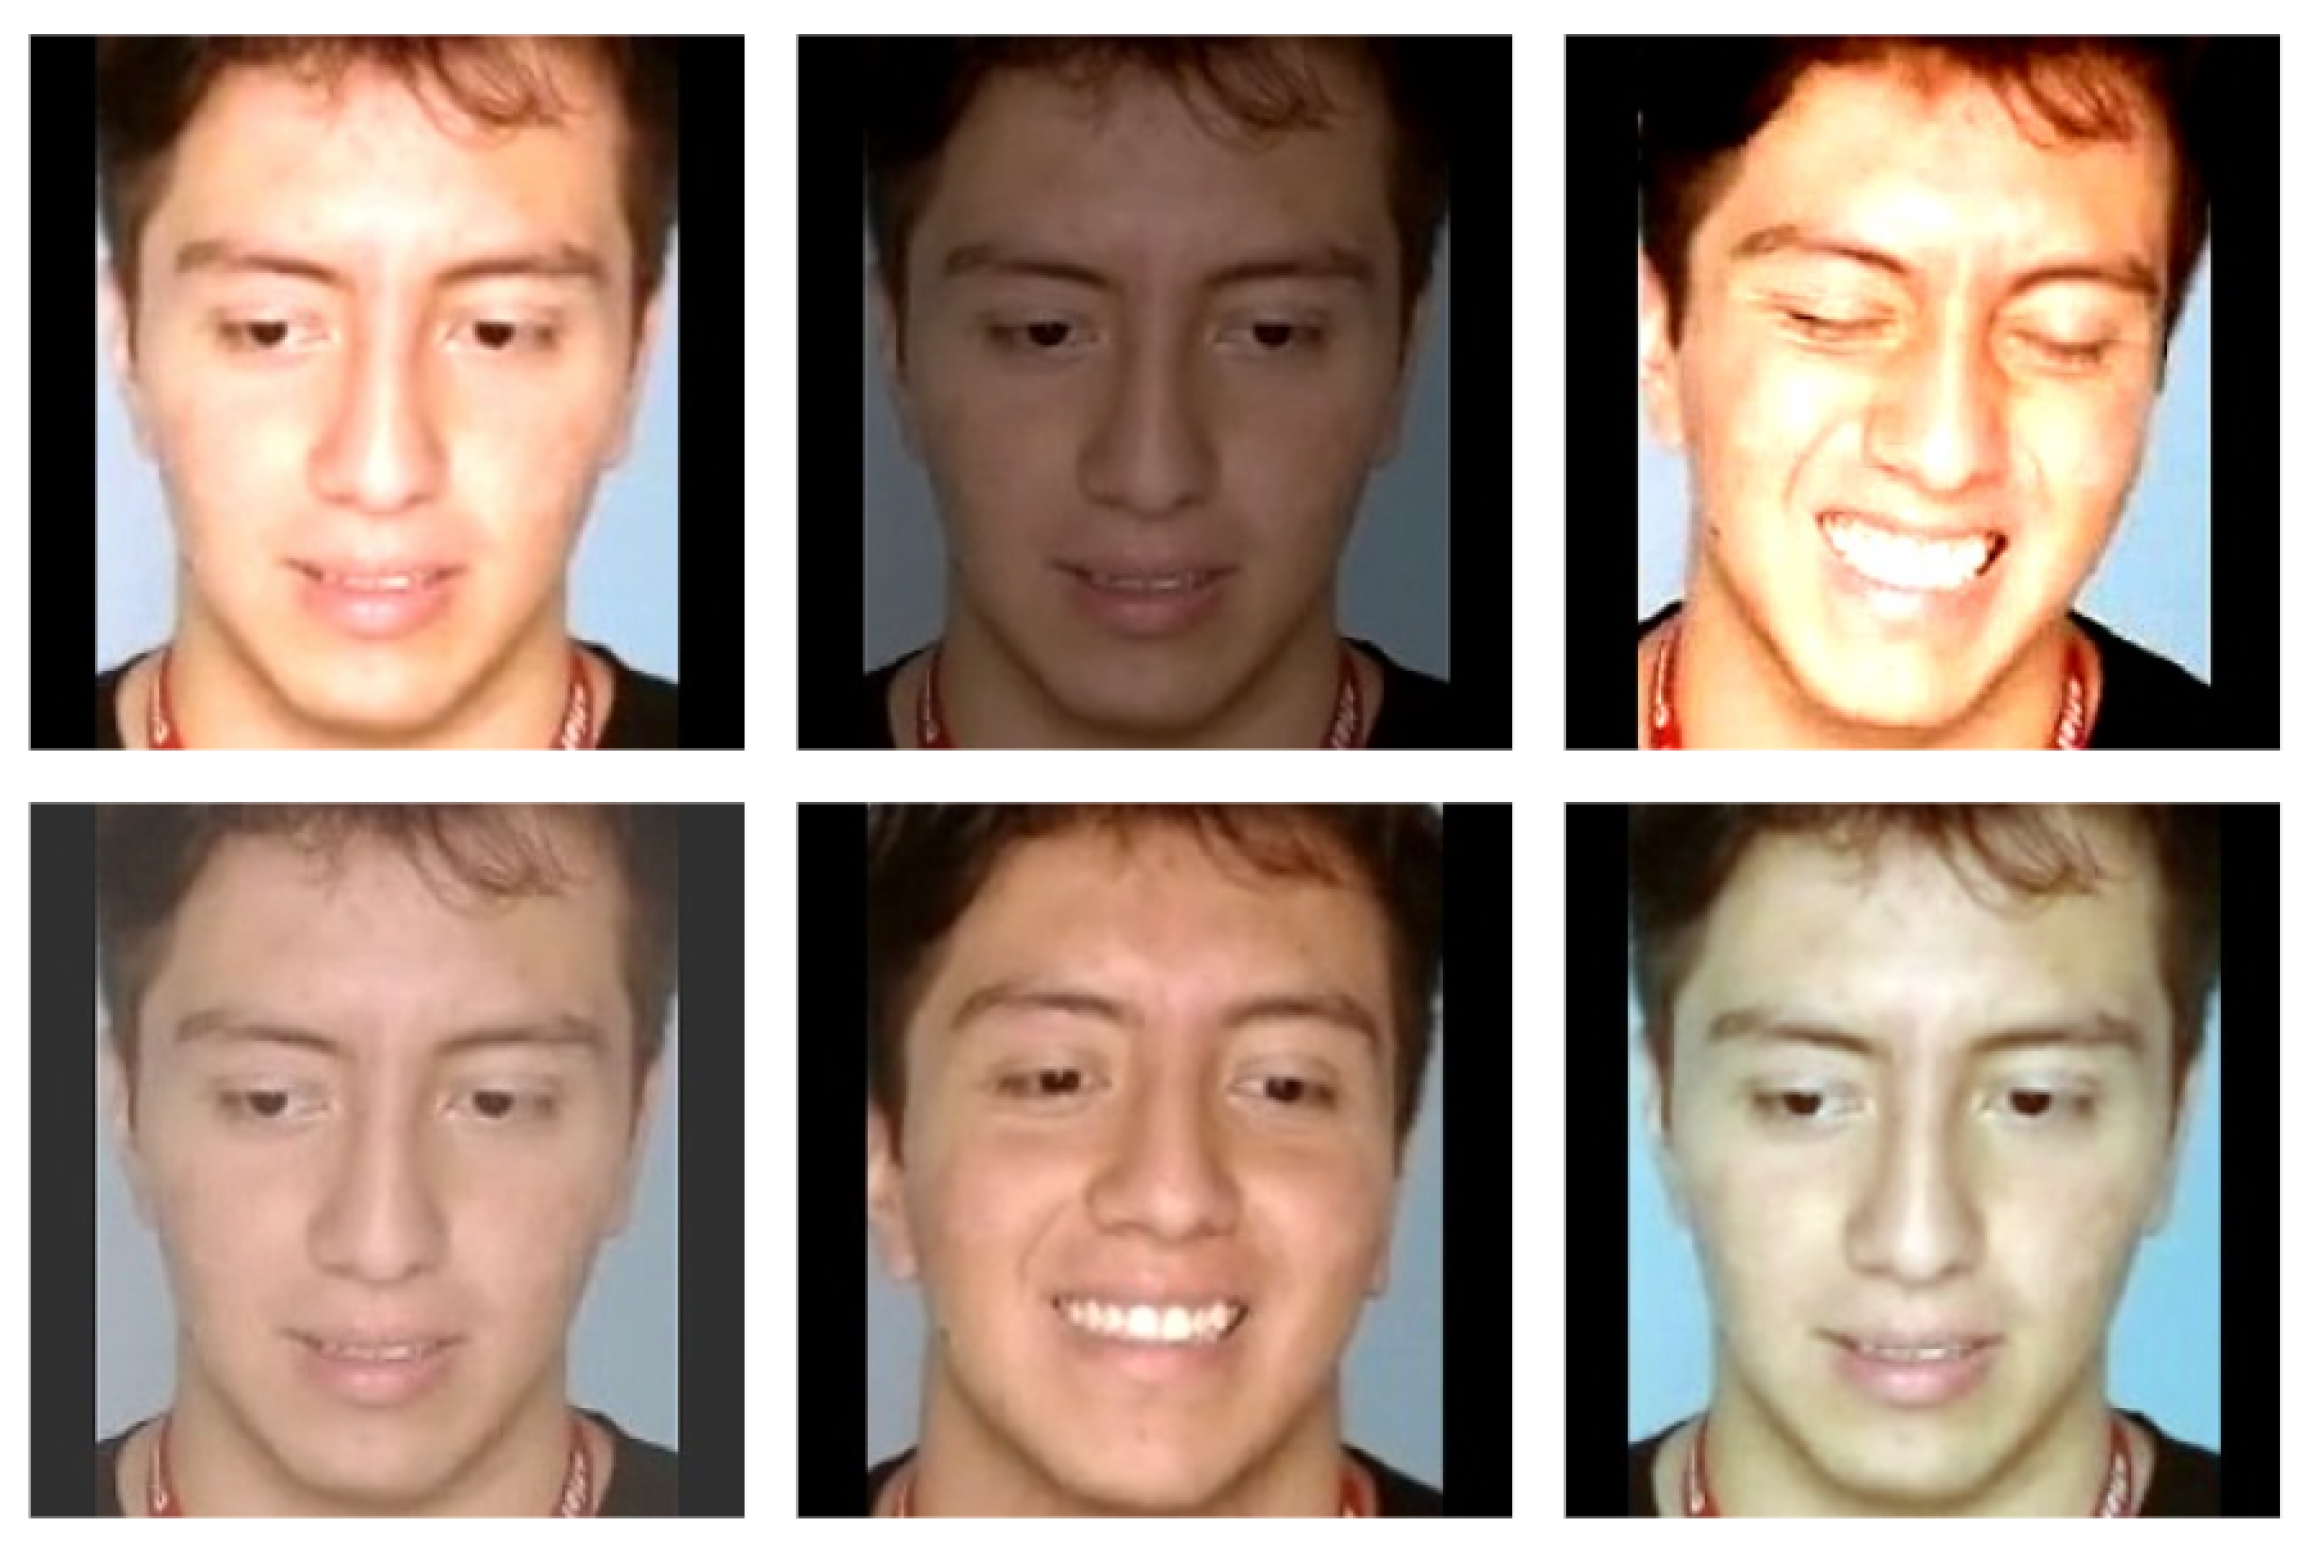
4.9. Data Augmentation
Data augmentation was performed online during training using the
PyTorch [
26] library. These transformations are performed randomly with a probability
. The transformations performed are as follows:
RandomAutocontrast: Contrast can be randomly varied by up to in either direction.
RandomHorizontalFlip: Performs a random horizontal flip of the image.
RandomAdjustSharpness: This can double the sharpness of the original image.
We carefully selected these transformations to preserve key facial features without altering their shape or obscuring essential parts of the images; some examples randomly taken from this operation are shown in
Figure 9. In each epoch of the training, it may or may not apply each transformation.
4.10. Proposed CNN Model: FrustNet
The neural network model proposed for this work was developed through trial and error, based on the LeNet [
27] model. The optimal configuration is shown in
Figure 10 and detailed in
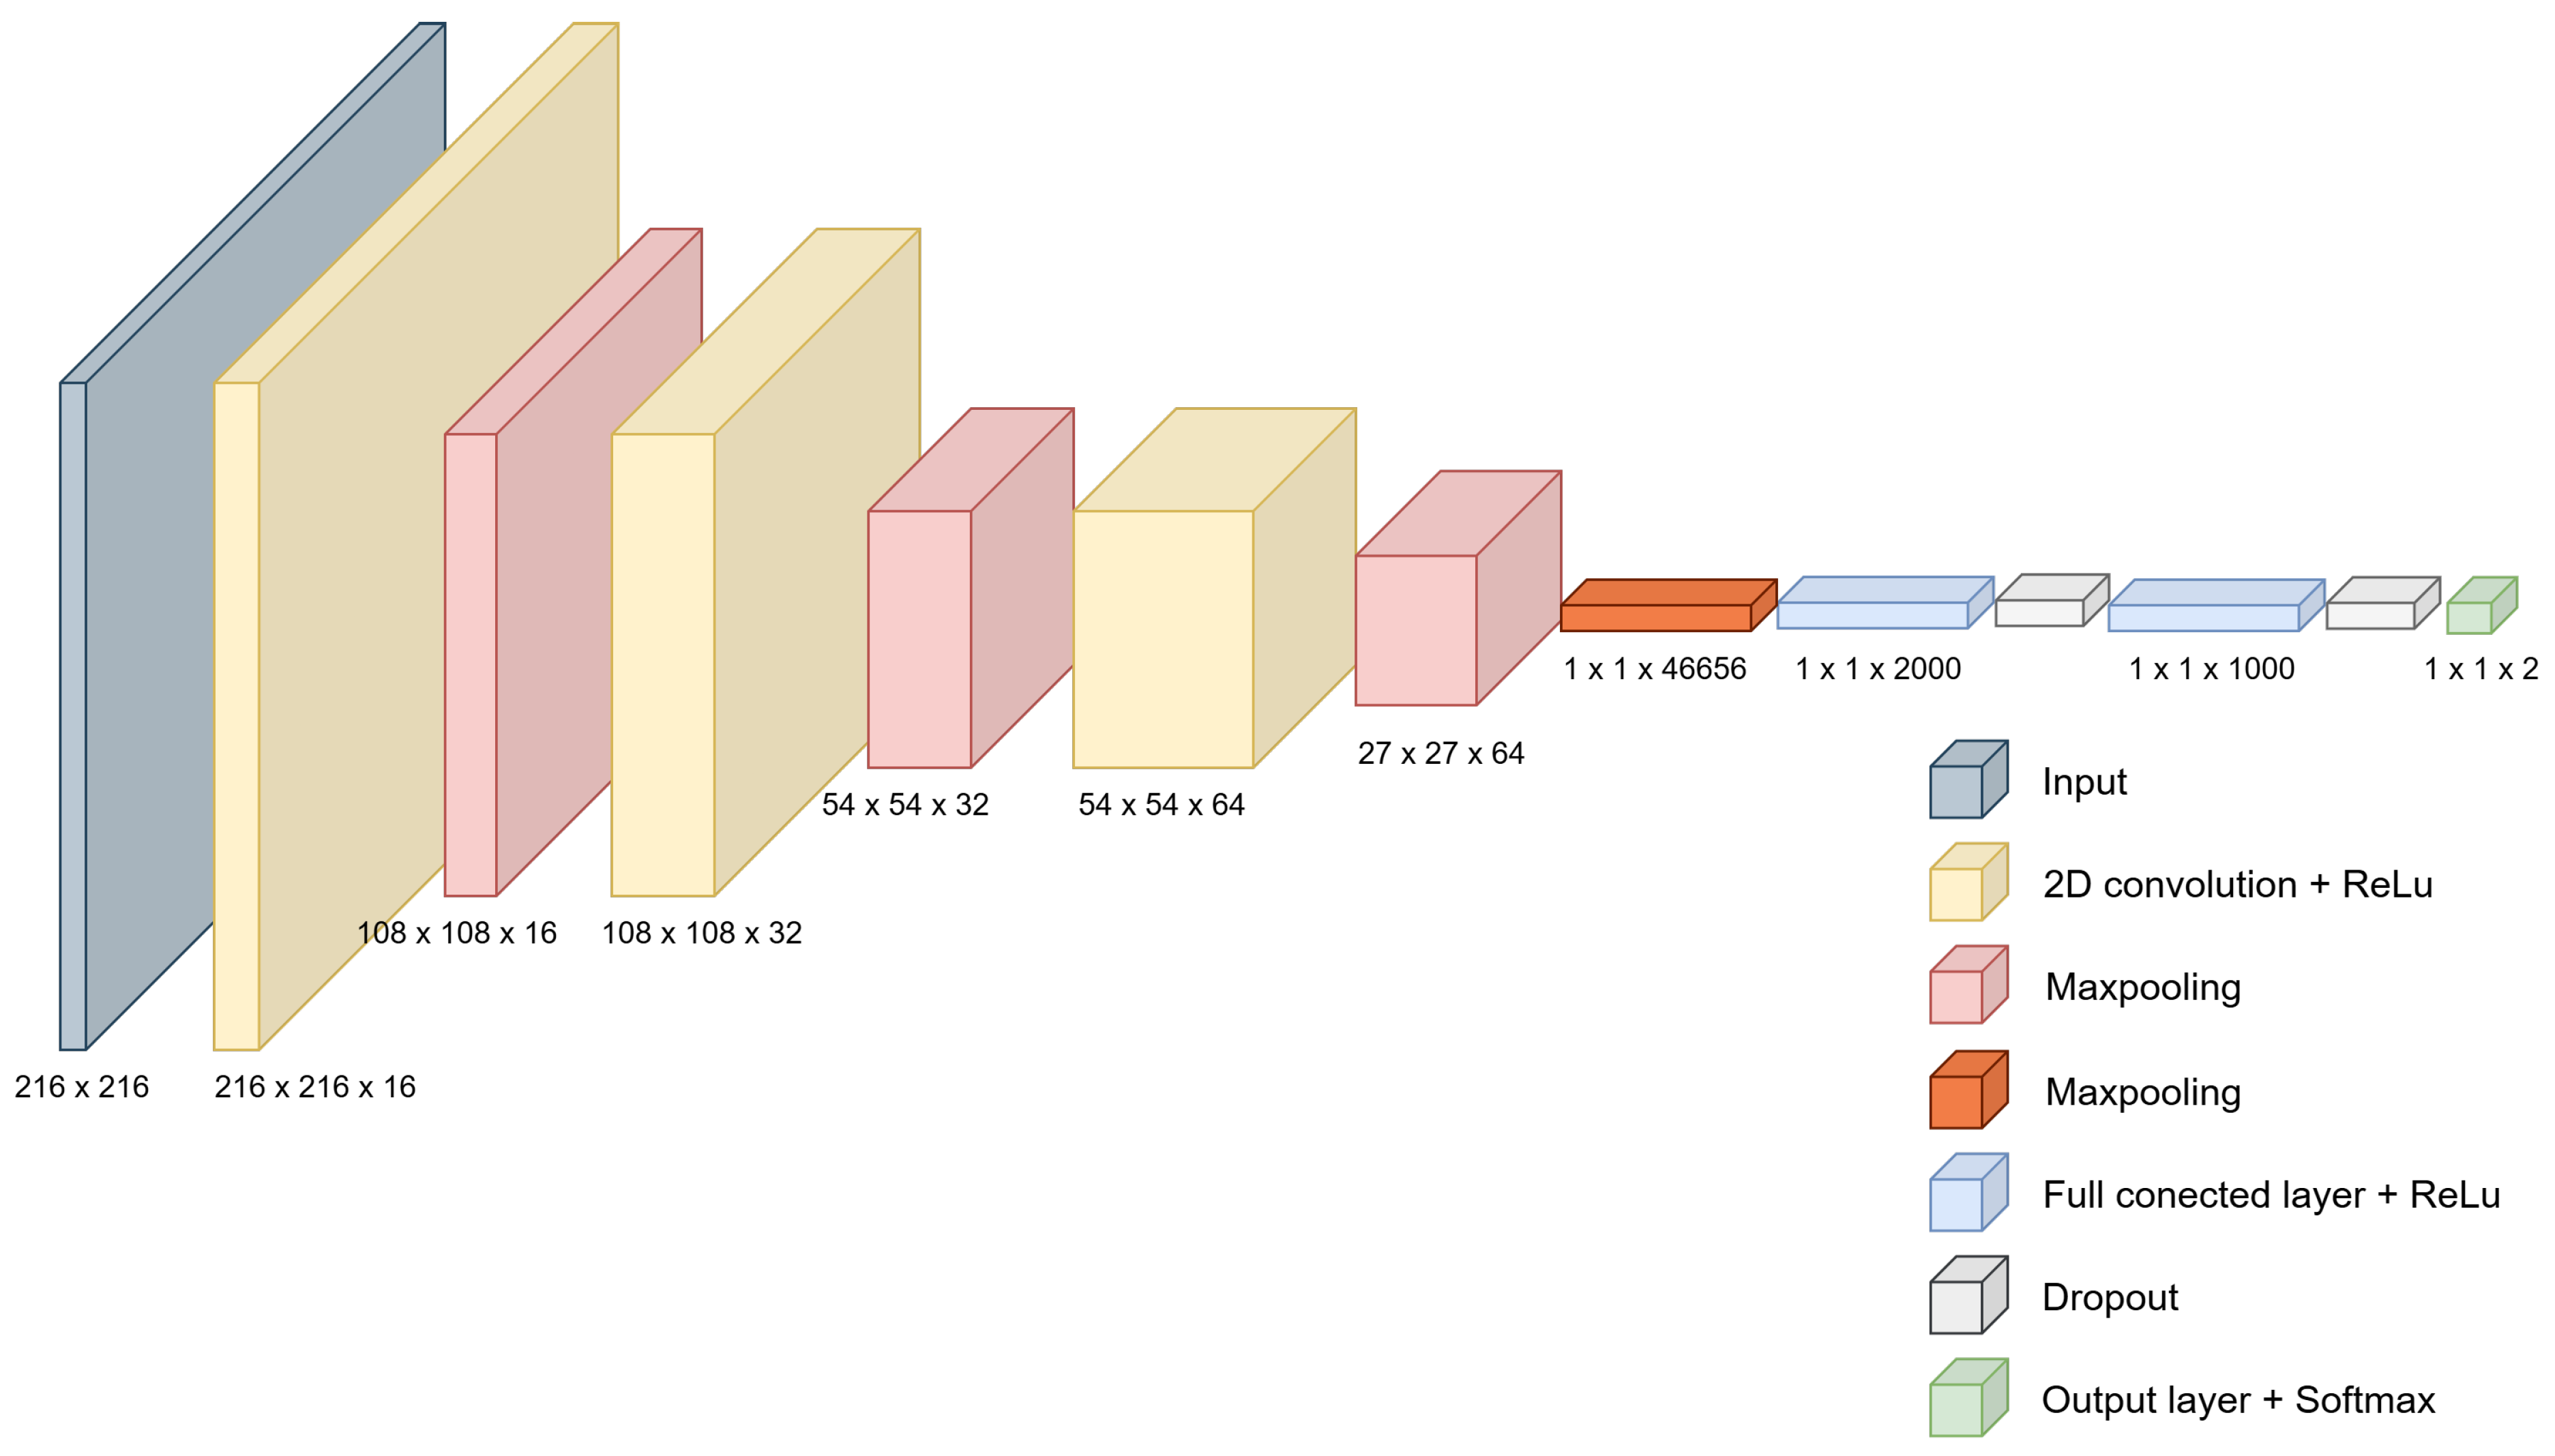
Table 5. This model consists of a first stage of feature extraction, comprising three convolutional layers with a 3 × 3 kernel size, the ReLU activation function, and varying numbers of kernels in each layer, followed by 2 × 2 max-pooling layers. Once we extracted the features, we flattened the output of the last max-pooling layer. It passes through the second classification stage, which consists of two fully connected layers: the first with 2000 neurons and the second with 1000 neurons, both of which use the ReLU activation function. The output layer consists of 2 neurons with softmax as the activation function, which represent the frustrated and confident classes. Additionally, the final hyperparameters used to train the model are data normalization, Adam as the network optimizer, categorical cross-entropy as the loss function, and a learning rate of 0.0001. The implementation of our model is available in [
28].
4.11. Reported Metrics
The metrics used to evaluate the classification model are Recall, Precision, F1, and Accuracy [
29]. We obtained these values by calculating the confusion matrix [
30].
5. Results
This section presents different approaches to obtain the best possible model.
5.1. Experiments with the V1 Dataset
We presented the results obtained by training the FrustNet model without data augmentation in
Table 6. In general, the values are not very good. F1-score is particularly important since it helps to understand a model’s actual effectiveness in real-world scenarios, going beyond just overall accuracy. In this case, we obtain an F1-score of
. So there is space for improvement.
On the other hand,
Table 7 details the metrics corresponding to the model trained using data augmentation. As can be seen, we obtain a better result for the frustration class, increasing the F1-score from
to
; this demonstrates the practical impact of data augmentation on our study. However, it could still be better.
5.2. Experiments with LOSO-CV and Dataset V2
We conducted this experiment using the V2 dataset with the Leave-One-Subject-Out Cross-Validation (LOSO-CV) technique. This technique is helpful in problems where data come from multiple participants, and the goal is to evaluate the model while avoiding bias due to dependent data. In each validation iteration, we excluded one participant from the test. In contrast, the data from the other participants are used for training, using [
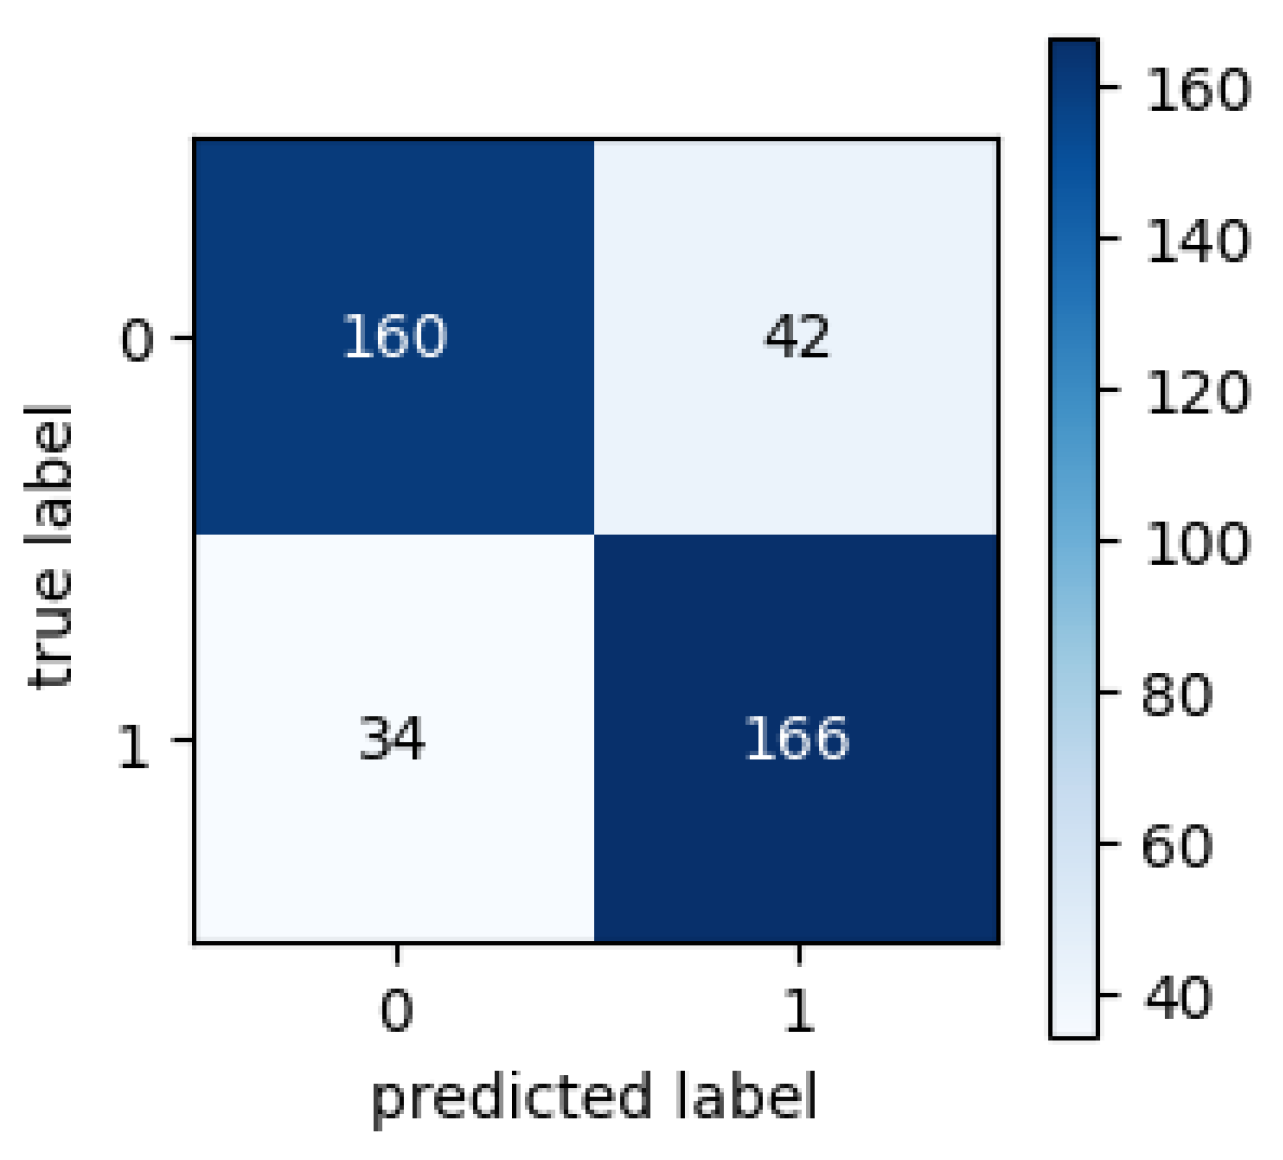
31] cross-validation; this process finishes when all participants have been used once as the test set. LOSO-CV allows the model to generalize to new subjects not seen during training. Following this, we tested the FrustNet model using dataset V3, and the obtained confusion matrix is shown in
Figure 11, where there were 167 true positives and 35 false negatives, which is a notable performance.
Table 8 shows the performance of the best model, where the F1-score of the frustration class was
, which is an improvement over the best result with dataset v1.
5.3. Experiments with LOSO-GKFV and Dataset V2
For this experiment, we utilized the V2 dataset with the Leave-One-Subject-Out (LOSO) Generalized K-Fold Validation (GKFV) technique. This strategy also seeks to evaluate the model by minimizing the bias that could be introduced by having a large amount of data from multiple participants. As in the LOSO-CV technique, one participant is left out for use as the test in each iteration [
32]. However, in this case, the remaining participants are grouped into
folds, ensuring that all images from the same participant belong to only one group within the training and validation sets. This process iterates until all participants have been used once as the test set. This strategy is helpful in cases where inter-subject variability can affect model performance. Next, we tested dataset V3, and present the obtained confusion matrix in
Figure 12, which shows a balanced performance for both classes.
Table 9 shows the performance of the best model, where we obtain an F1-score of
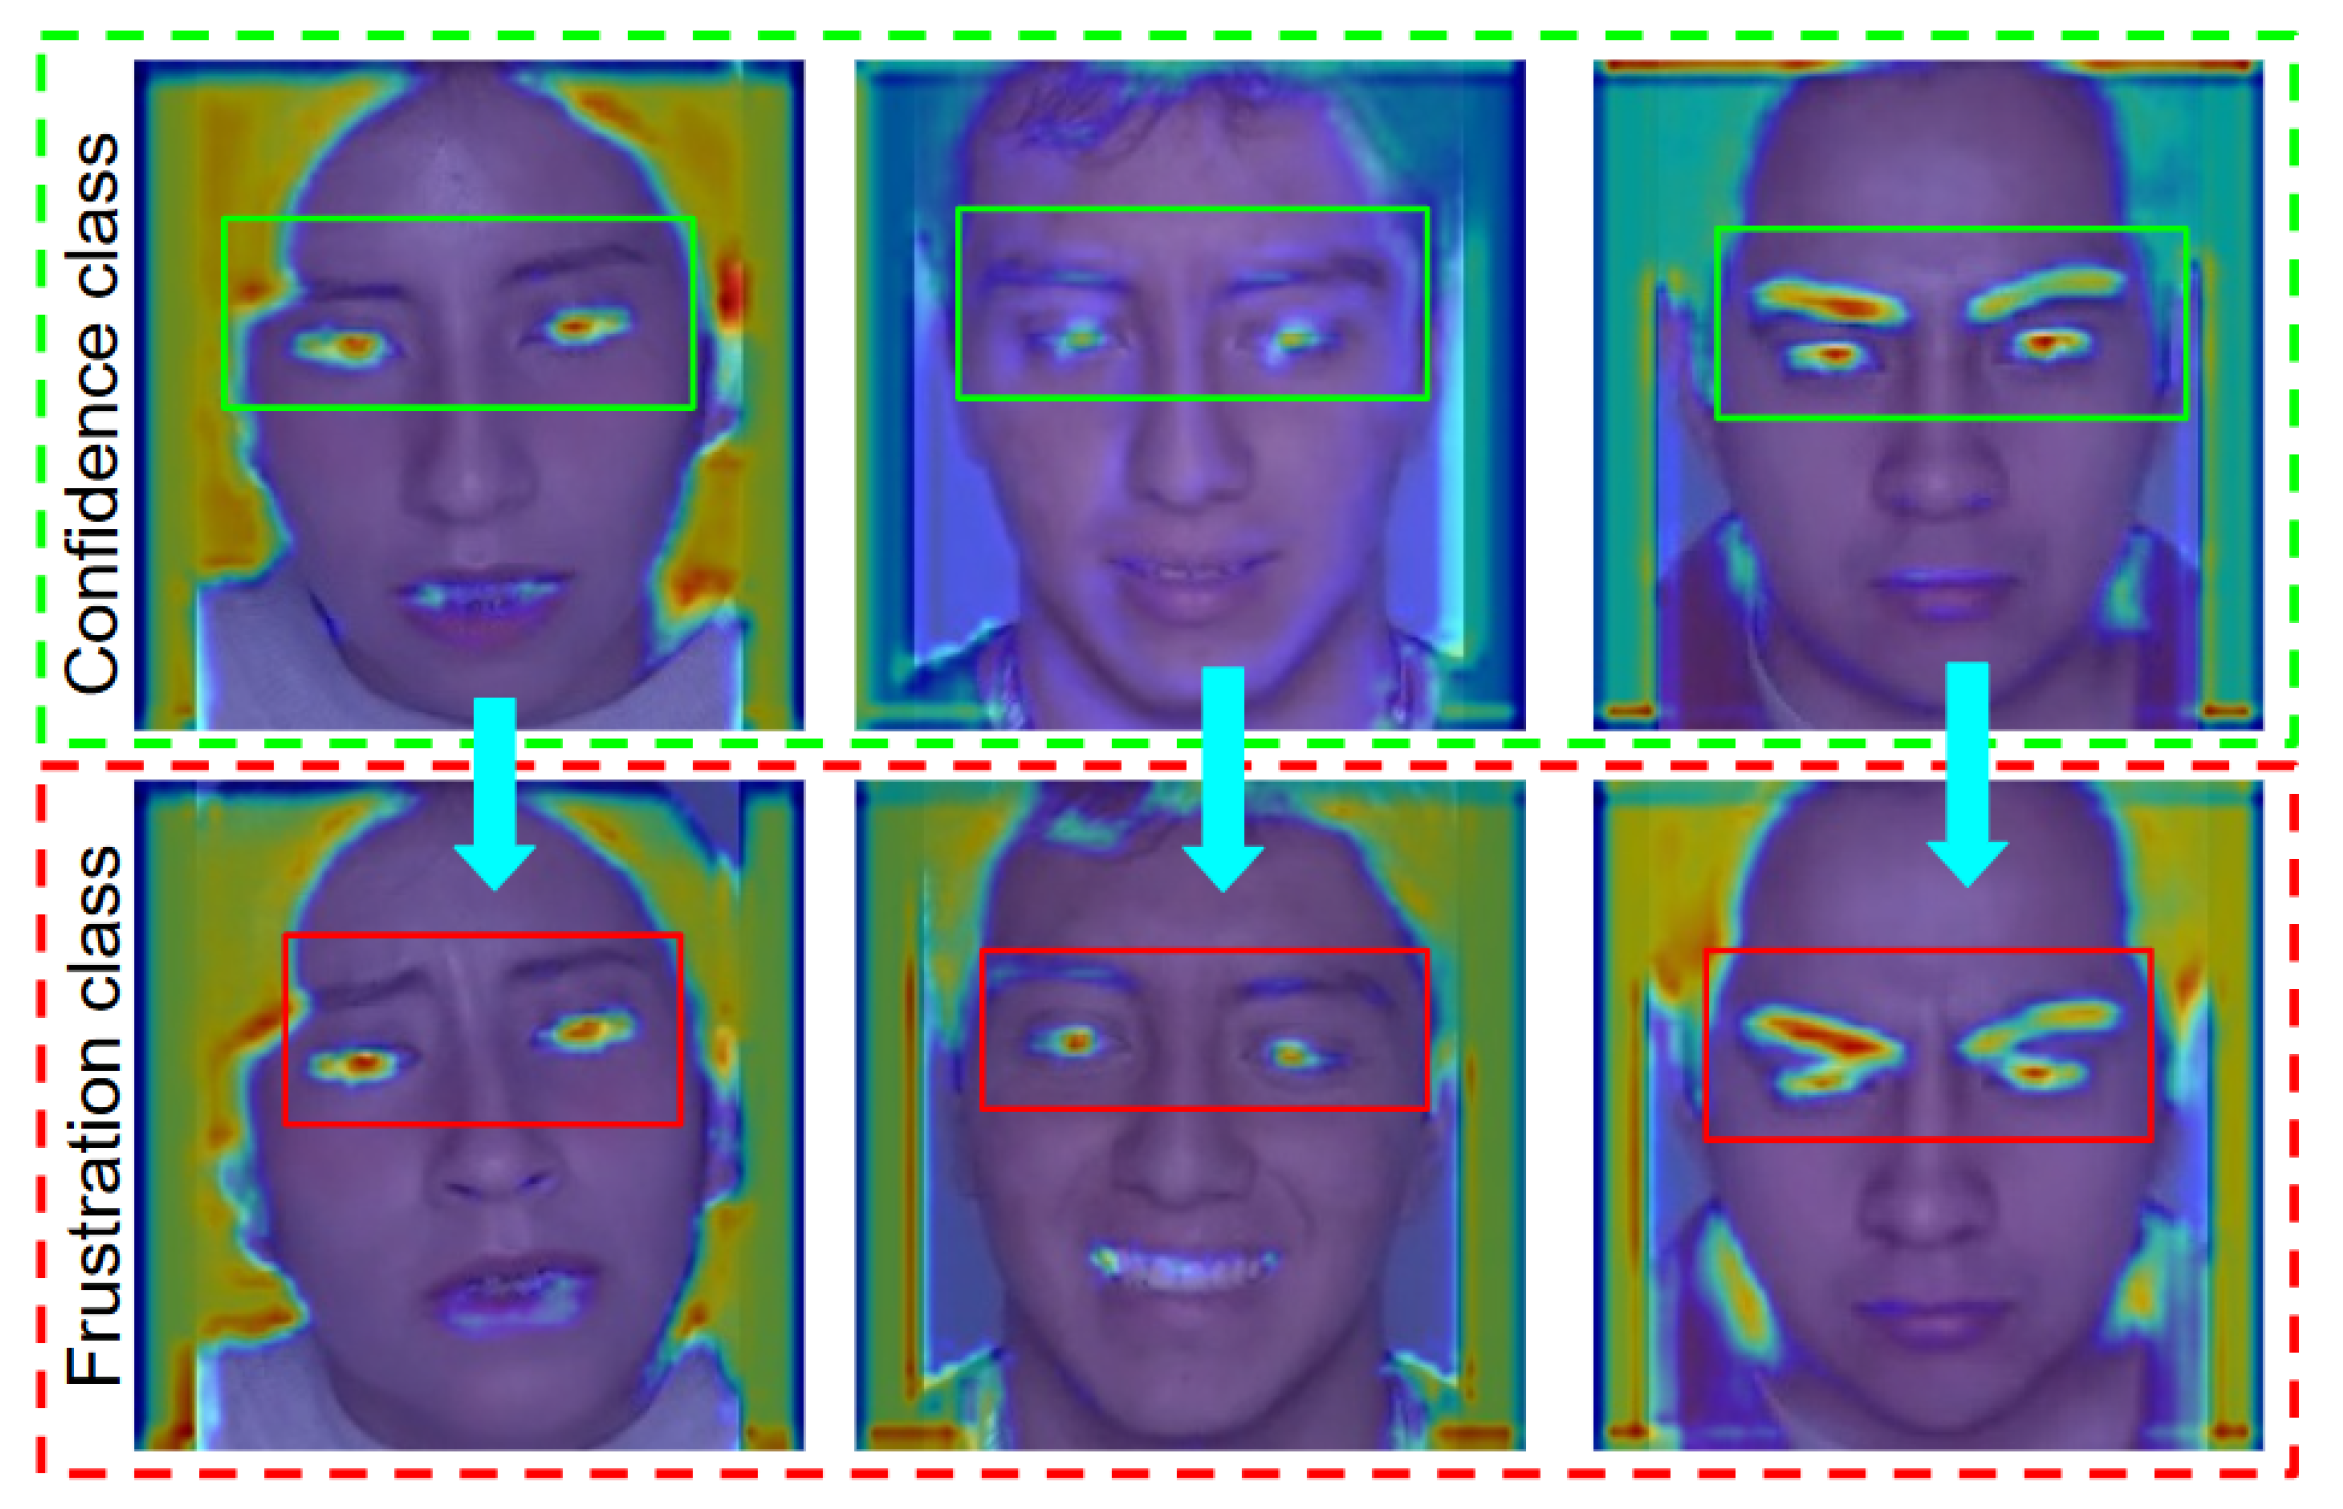
for the frustration class; this is a relevant result for a first-time task and can serve as the baseline for future comparisons. Finally, in
Figure 13 we present some visual results of our best model. Note that our model takes into account the eyes and eyebrows to support its inference; we obtain this result using the Grad-CAM algorithm [
33].
5.4. State of the Art Comparison
As a complement to the above results,
Table 10 recalls the most important works reported in the state of the art and provides a detailed analysis of the most relevant aspects for our study.
5.5. Statistical Analysis
This section presents statistical results derived from data collected using the PASAT and N-back tests.
5.5.1. PASAT
For this test, the software allows participants to perform several practice runs with additions before starting the test; we store these results in the system. Since only a few participants decided to participate in this run-through, the number of answers varied among them. Therefore, we considered the percentage of incorrect answers instead of using this data.
In
Figure 14a, we show the number of participants by the percentage of incorrect answers and their perceived difficulty. We can see that of the seven people with fewer than
of errors, six considered the test somewhat tricky, and one considered it moderately strenuous. On the other hand, most participants considered it somewhat difficult, followed by moderately complex.
Figure 14b shows the number of participants by the percentage of incorrect answers and their level of frustration. We highlight that most people with fewer than
of incorrect answers experienced some frustration. On the other hand, as the percentage of incorrect answers increases, the level of frustration also increases, except for the person with the highest percentage, who experienced only a slight frustration.
An interesting result of this analysis is determining whether there is a correlation between the percentage of incorrect answers and the level of frustration experienced during the PASAT test. We first assessed whether the data followed a normal distribution to identify the most appropriate type of correlation. This study used the Shapiro–Wilk test [
34] to verify the normality of the distributions.
Applying the test, we obtained a p-value of for the percentage of incorrect answers and a p-value of for the level of perceived frustration. Considering a standard significance level of , we conclude that the percentage of incorrect answers is normally distributed (p-value ). However, the level of frustration does not meet this condition (p-value ).
Since one of the variables does not follow a normal distribution, Pearson’s correlation coefficient is not appropriate. Instead, we employed Spearman’s correlation, a suitable nonparametric alternative for this case.
The analysis yielded a Spearman’s correlation coefficient of , with an associated p-value of , calculated using the Student’s t-test. These results indicate a statistically significant, moderately positive correlation between the percentage of incorrect answers and the level of perceived frustration.
5.5.2. N-Back
Below, we will show some results obtained from the N-back test. To make them understandable, we must mention how the types of responses are composed. The correct responses are those that are correct; the maximum number of correct responses possible is 40. The incorrect responses do not correspond to a
match. Also, if there is a
match, but the participant does not answer, it is added to the correct answers. So, for participant
i, the total number of incorrect answers is shown in Equation (
1).
That said,
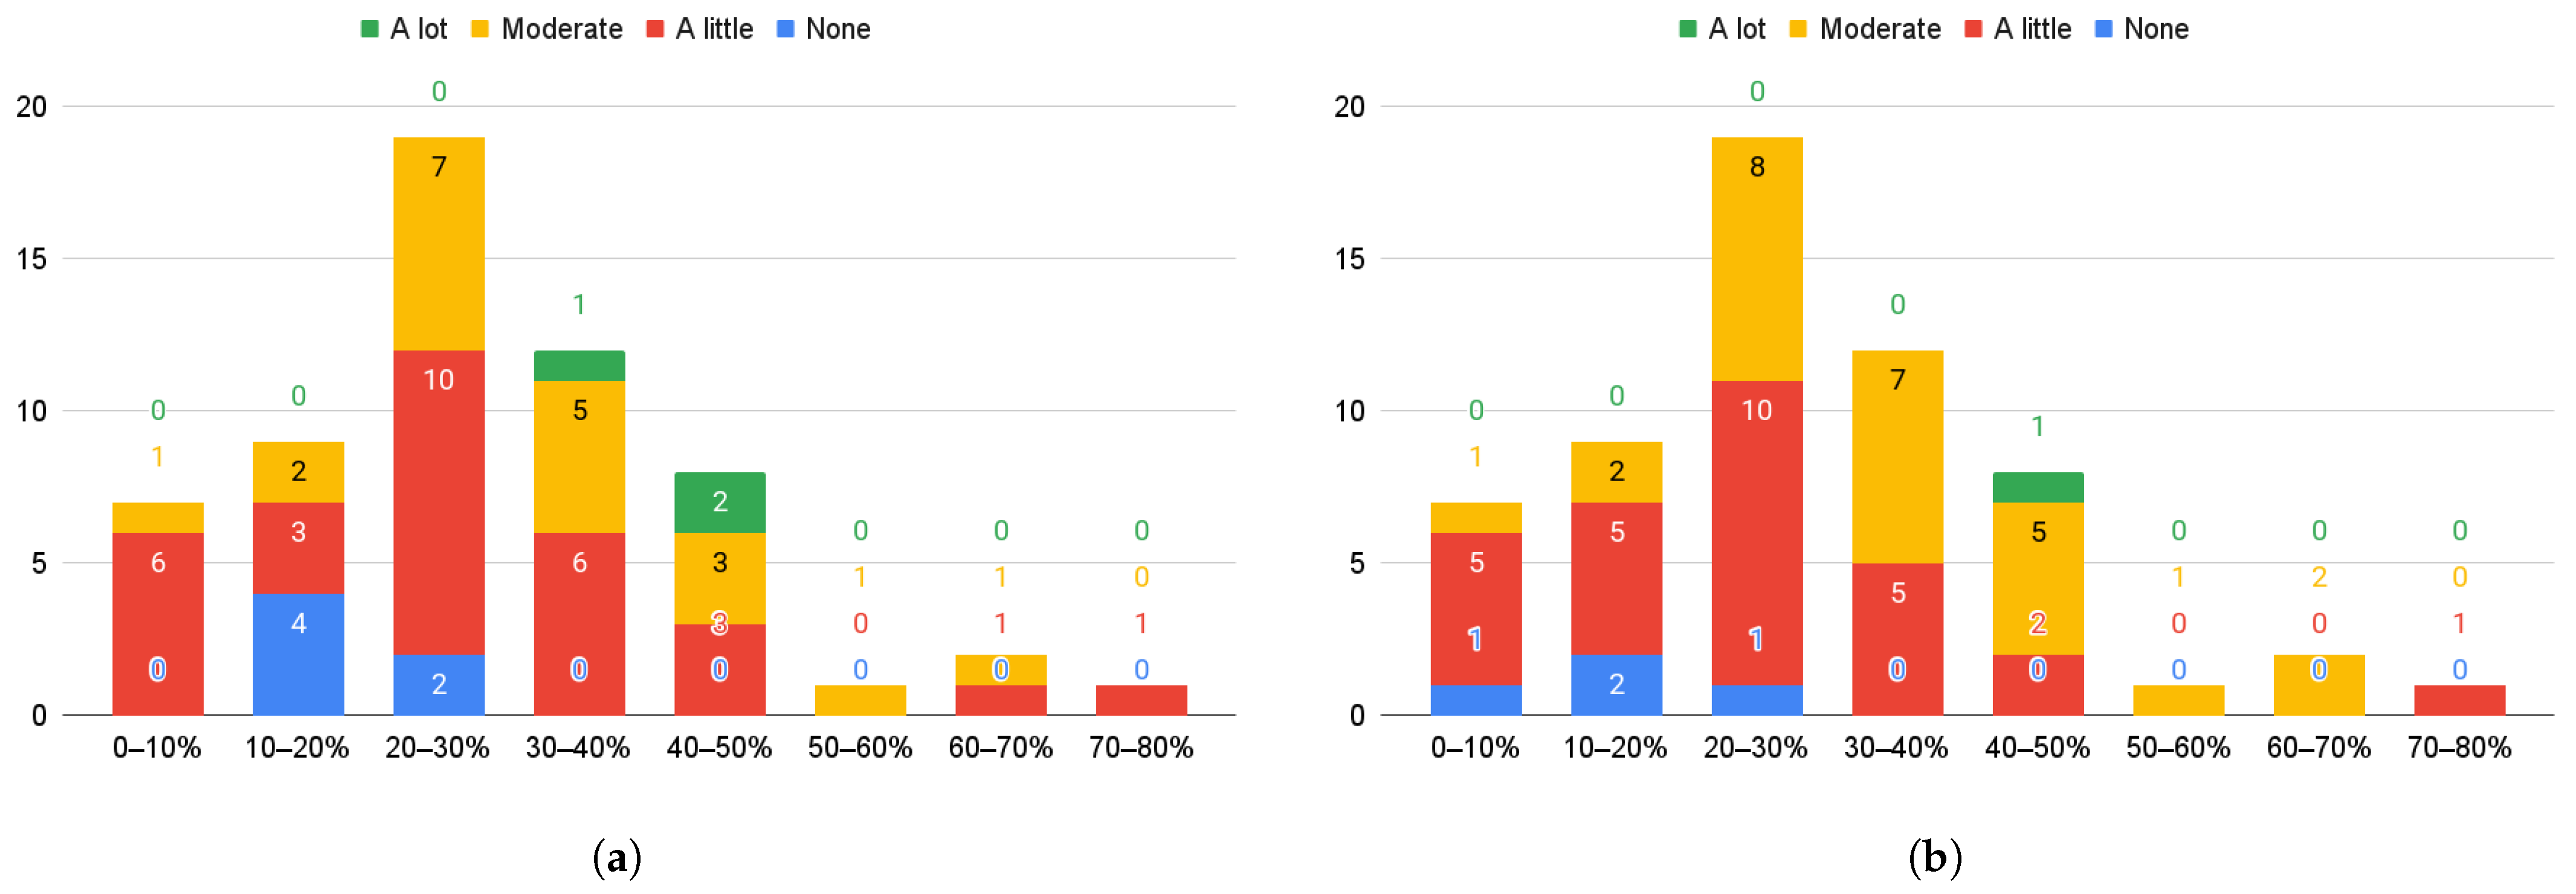
Figure 15a presents the number of participants by the number of incorrect answers and the perceived level of difficulty for the N-back test. We can observe that only eight participants had fewer than 10 incorrect answers and experienced little or moderate difficulty; on the other hand, the majority had between 10 and 20 incorrect answers, with moderate difficulty being the most perceived level, while three people had between 30 and 40 incorrect answers and only reported a moderate level of difficulty.
Figure 15b shows the number of participants by the number of incorrect answers and the level of frustration experienced during the N-back test. We can see that of the eight people who had between 0 and 9 incorrect answers, seven experienced only a little frustration, while in the range between 10 and 19 incorrect answers, the majority experienced a moderate level of frustration and only four a high level; on the other hand, of the three participants who had more than 30 incorrect answers, two of them had little frustration and only one of them had a moderate level.
As in the PASAT test, we applied the Shapiro–Wilk test to determine whether the number of incorrect answers and the level of perceived frustration in the N-back test follow normal distributions. The results yielded a p-value of for the number of incorrect answers and a p-value of for the level of frustration. Considering a significance level of , we conclude that neither variable follows a normal distribution.
We used Spearman’s correlation, which is appropriate for data that do not meet the assumption of normality. The analysis yielded a Spearman’s correlation coefficient of , accompanied by a p-value of . These results indicate a moderate, statistically significant positive correlation between the number of incorrect answers and the level of perceived frustration in the N-back test.
6. Discussion
Considering the results presented, our final insights are as follows:
After a careful review of the state of the art, we did not find a direct study of the frustration emotion, nor a dataset with images that represent this emotion. To address this gap, we set out to create an
in-the-wild dataset focused explicitly on this emotion. To obtain a solid product, we dedicated seven months to this task, from conception to the final result, with the support of a psychologist, as reported in
Section 4.8.
As reported in
Section 4.8.1, the first version of our dataset was small and balanced, which proved useful as a first approach. The second version of the dataset was bigger, and we selected the images more carefully (
Section 4.8.2). As a complement, the dataset
was crucial for testing the results of the experiments (
Section 5.2 and
Section 5.3). Using independent data to test a trained model is not usual, but we encourage the scientific community to do it.
As a result of the grid search technique, we obtain a novel CNN (see
Section 5.1); this CNN uses only
parameters and, as a result of the experiments in
Section 5.2 and
Section 5.3, we reach an F1-score of
.
The techniques LOSO-CV and LOSO-GKFV enable a thorough exploration of models with optimal performance.
The auto-diagnostics survey answer for each participant provides insightful information about their perceived frustration during the tests. Through our statistical analysis, we confirm that we implemented the stimulus–response technique adequately, as evidenced by a moderately positive correlation between incorrect answers and the level of perceived frustration.
From
Table 10, the frustration emotion is not frequently studied or partially analyzed, as in Grafsgaard et al. (2013) [
8], where only the AU4 action unit is related to frustration and does not present classification metrics results. Similarly, in Hoque et al. (2012) [
10], the authors only consider the frustration smiles, leaving out other types of face expressions; they also do not present classification metrics results.
Also in
Table 10, examining the accuracy values, our work achieves the best value:
. Note that for the case of Hoque et al. (2012) [
10], for a fair comparison, we only report the
in-the-wild result.
7. Conclusions
In this work, we have developed a methodology to detect complex emotions, such as frustration and confidence, by creating a dataset that enables their detection through a proposed convolutional neural network model. With this resource, we can detect these emotions, as we did not find similar datasets or those that solve the task in the same way in the state-of-the-art literature. Therefore, we cannot directly compare ourselves with them. We found that it is possible to detect these emotions using a few images and online data augmentation techniques to add variability to the data. We also found that the N-back and PASAT tests helped us evoke the emotion of frustration, allowing us to create the necessary images for the dataset. Similarly, we determined the optimal hyperparameters for the proposed model using cross-validation techniques. The proposed neural network model demonstrated that, with just a few convolutional layers, we can extract the features necessary to solve the task, and that it captures characteristics that help us discriminate the proposed emotions.
In summary, the proposed method’s strengths include a novel approach to detecting frustration emotions and the use of cognitive tests, which enable capturing frustration in the wild. As weaknesses, there is room for further improvement in the metric values; additionally, obtaining more images of the phenomenon would be beneficial. Finally, we observe that the method fails when the participants are very inexpressive, which does not allow for extracting adequate characteristics to discriminate between whether they are frustrated or confident.
As future work, we propose incorporating self-attention mechanisms into our proposed model to investigate whether they can extract more information about faces or utilizing visual transformers to enhance the results obtained. Additionally, we propose using videos to detect frustration as a temporal phenomenon, which will enable us to identify it in real-life situations.
Author Contributions
Conceptualization, M.A.M.-A., J.M.-R., and J.E.V.-R.; methodology, M.A.M.-A. and J.E.V.-R.; Software, J.M.-R. and R.Q.; validation, R.Q. and V.H.P.-P.; formal analysis, M.A.M.-A. and J.E.V.-R.; investigation, J.M.-R., R.Q. and V.H.P.-P.; resources, R.Q. and V.H.P.-P.; data curation, J.M.-R.; writing—original draft preparation, M.A.M.-A.; writing—review and editing, J.E.V.-R., R.Q., and V.H.P.-P.; visualization, J.M.-R.; supervision, J.M.-R., R.Q., and V.H.P.-P.; project administration, M.A.M.-A.; funding acquisition, J.E.V.-R. All authors have read and agreed to the published version of the manuscript.
Funding
This work was supported by Instituto Politécnico Nacional (IPN) through Secretaría de Investigación y Posgrado (IPN-SIP) research grants SIP-2259, SIP-20250071, SIP-20251352, SIP-20251124, and SIP-20253439; Comisión de Operación y Fomento de Actividades Académicas del IPN (IPN-COFAA) and Programa de Estímulos al Desempeño de los Investigadores (IPN-EDI) and Secretaría de Ciencia, Humanidades, Tecnología e Innovación, Sistema Nacional de Investigadores (SECIHTI-SNII).
Institutional Review Board Statement
Informed Consent Statement
Informed consent was obtained from all subjects involved in the study.
Data Availability Statement
The data presented in this study are available upon request from the corresponding author, as the data obtained are currently being copyrighted by the Mexican Institute of Industrial Property of the Mexican government.
Acknowledgments
We are grateful to Jessica Paola Becerra Arcos, a psychologist who supported us in designing the experimental protocol, and to Jaime Arturo Lara Cázares, who assisted us in programming the software used to capture the data.
Conflicts of Interest
The authors declare no conflicts of interest.
References
- Ekman, P.; Keltner, D. Universal facial expressions of emotion. Calif. Ment. Health Res. Dig. 1970, 8, 151–158. [Google Scholar]
- Yao, L.; Wan, Y.; Ni, H.; Xu, B. Action unit classification for facial expression recognition using active learning and SVM. Multimed. Tools Appl. 2021, 80, 24287–24301. [Google Scholar] [CrossRef]
- Lucey, P.; Cohn, J.F.; Kanade, T.; Saragih, J.; Ambadar, Z.; Matthews, I. The extended cohn-kanade dataset (ck+): A complete dataset for action unit and emotion-specified expression. In Proceedings of the 2010 IEEE Computer Society Conference on Computer Vision and Pattern Recognition-Workshops, San Francisco, CA, USA, 13–18 June 2010; pp. 94–101. [Google Scholar]
- Roy, A.K.; Kathania, H.K.; Sharma, A.; Dey, A.; Ansari, M.S.A. ResEmoteNet: Bridging Accuracy and Loss Reduction in Facial Emotion Recognition. arXiv 2024, arXiv:2409.10545. [Google Scholar] [CrossRef]
- Dumitru.; Goodfellow, I.; Cukierski, W.; Bengio, Y. Challenges in Representation Learning: Facial Expression Recognition Challenge. Kaggle. 2013. Available online: https://kaggle.com/competitions/challenges-in-representation-learning-facial-expression-recognition-challenge (accessed on 23 July 2025).
- Her, M.B.; Jeong, J.; Song, H.; Han, J.H. Batch Transformer: Look for Attention in Batch. arXiv 2024, arXiv:2407.04218. [Google Scholar] [CrossRef]
- Mollahosseini, A.; Hasani, B.; Mahoor, M.H. Affectnet: A database for facial expression, valence, and arousal computing in the wild. IEEE Trans. Affect. Comput. 2017, 10, 18–31. [Google Scholar] [CrossRef]
- Grafsgaard, J.; Wiggins, J.B.; Boyer, K.E.; Wiebe, E.N.; Lester, J. Automatically recognizing facial expression: Predicting engagement and frustration. In Proceedings of the Educational Data Mining, Memphis, TN, USA, 6–9 July 2013. [Google Scholar]
- Facial Action Coding System (FACS)—A Visual Guidebook. Available online: https://imotions.com/blog/learning/research-fundamentals/facial-action-coding-system/ (accessed on 16 June 2025).
- Hoque, M.E.; McDuff, D.J.; Picard, R.W. Exploring temporal patterns in classifying frustrated and delighted smiles. IEEE Trans. Affect. Comput. 2012, 3, 323–334. [Google Scholar] [CrossRef]
- Grewe, L.; Hu, C. ULearn: Understanding and reacting to student frustration using deep learning, mobile vision and NLP. In Proceedings of the Signal Processing, Sensor/Information Fusion, and Target Recognition XXVIII; SPIE: Bellingham, WA, USA, 2019; Volume 11018, pp. 254–266. [Google Scholar]
- Arriaga, O.; Valdenegro-Toro, M.; Plöger, P. Real-time convolutional neural networks for emotion and gender classification. arXiv 2017, arXiv:1710.07557. [Google Scholar] [CrossRef]
- La Frustración, ¿cómo Manejarla? Available online: https://www.unisabana.edu.co/portaldenoticias/al-dia/la-frustracion-como-manejarla/ (accessed on 16 November 2024).
- Trabajemos en la Tolerancia a la Frustración. 2022. Available online: https://www.gaceta.unam.mx/trabajemos-en-la-tolerancia-a-la-frustracion/#:~:text=La%20frustraci%C3%B3n%20es%20la%20respuesta,mayor%20ser%C3%A1%20la%20frustraci%C3%B3n%20resultante (accessed on 16 November 2024).
- Gronwall, D. Paced auditory serial-addition task: A measure of recovery from concussion. Percept. Mot. Ski. 1977, 44, 367–373. [Google Scholar] [CrossRef] [PubMed]
- Cores, E.; Vanotti, S.; Moyano, P.; Osorio, M.; Politis, D.; Garcea, O. Estrategias de resolución del PASAT en pacientes con Esclerosis Múltiple y viabili-dad de una versión corta del test. Rev. Chil. Neuropsicol. 2011, 6, 80–84. [Google Scholar] [CrossRef]
- Baghdadi, G.; Towhidkhah, F.; Rajabi, M. Chapter 7—Assessment methods. In Neurocognitive Mechanisms of Attention; Baghdadi, G., Towhidkhah, F., Rajabi, M., Eds.; Academic Press: Cambridge, MA, USA, 2021; pp. 203–250. [Google Scholar] [CrossRef]
- Kirchner, W.K. Age differences in short-term retention of rapidly changing information. J. Exp. Psychol. 1958, 55, 352. [Google Scholar] [CrossRef] [PubMed]
- Castiglia, V. Requisitos metodológicos y estadísticos para publicaciones científicas: Parte I. Rev. Asoc. Argent. Ortop. Traumatol. 2000, 66, 70–74. [Google Scholar]
- Cognitive Software. Available online: https://drive.google.com/file/d/1kXCgibJm32hVxH0JOFU6oC72GpwtQuIA/view?usp=sharing (accessed on 19 June 2025).
- Skinner, B. La naturaleza genérica de los conceptos de estímulo y respuesta. J. Gen. Psychol. 1935, 12, 40–65. [Google Scholar] [CrossRef]
- Consent and Rights Session Forms of Frustration Dataset. Available online: https://drive.google.com/file/d/1eL6n-jTmK-PNocTYgcEey03AMDTqAHel/view?usp=sharing (accessed on 14 June 2025).
- Google. Guía de Detección de Puntos de Referencia Facial para Python. Available online: https://ai.google.dev/edge/mediapipe/solutions/vision/face_landmarker/python?hl=es-419 (accessed on 15 August 2024).
- Paredes, L. Emociones Básicas y Complejas. 2024. Available online: https://psicologalorenaparedes.wordpress.com/2024/03/28/emociones-basicas-y-complejas/ (accessed on 15 October 2024).
- Díaz, J.L.; Enrique, F. La estructura de la emoción humana: Un modelo cromático del sistema afectivo. Salud Ment. 2001, 24, 20–35. [Google Scholar]
- Transforming and Augmenting Images. Available online: https://pytorch.org/vision/0.12/transforms.html#transforming-and-augmenting-images (accessed on 20 October 2024).
- LeCun, Y.; Bottou, L.; Bengio, Y.; Haffner, P. Gradient-based learning applied to document recognition. Proc. IEEE 2002, 86, 2278–2324. [Google Scholar] [CrossRef]
- FrustNet. Available online: https://github.com/EduardoValdezRdz/FrustNet (accessed on 14 July 2025).
- Hossin, M.; Sulaiman, M.N. A review on evaluation metrics for data classification evaluations. Int. J. Data Min. Knowl. Manag. Process 2015, 5, 1–11. [Google Scholar]
- Amin, F.; Mahmoud, M. Confusion matrix in binary classification problems: A step-by-step tutorial. J. Eng. Res. 2022, 6, 1. [Google Scholar]
- Gholamiangonabadi, D.; Kiselov, N.; Grolinger, K. Deep Neural Networks for Human Activity Recognition With Wearable Sensors: Leave-One-Subject-Out Cross-Validation for Model Selection. IEEE Access 2020, 8, 133982–133994. [Google Scholar] [CrossRef]
- Kuhn, M.; Johnson, K. Over-Fitting and Model Tuning. In Applied Predictive Modeling; Springer: New York, NY, USA, 2013; pp. 61–92. [Google Scholar] [CrossRef]
- Selvaraju, R.R.; Cogswell, M.; Das, A.; Vedantam, R.; Parikh, D.; Batra, D. Grad-cam: Visual explanations from deep networks via gradient-based localization. In Proceedings of the IEEE International Conference on Computer Vision, Venice, Italy, 22–29 October 2017; pp. 618–626. [Google Scholar]
- King, A.P.; Eckersley, R.J. Chapter 7—Inferential Statistics IV: Choosing a Hypothesis Test. In Statistics for Biomedical Engineers and Scientists; King, A.P., Eckersley, R.J., Eds.; Academic Press: Cambridge, MA, USA, 2019; pp. 147–171. [Google Scholar] [CrossRef]
Figure 1.
PASAT sequence.
Figure 1.
PASAT sequence.
Figure 2.
PASAT board. (a) The correct answer is three. (b) The correct answer is six.
Figure 2.
PASAT board. (a) The correct answer is three. (b) The correct answer is six.
Figure 3.
N-back auditory stimuli. (a) 1-Back. (b) 2-Back.
Figure 3.
N-back auditory stimuli. (a) 1-Back. (b) 2-Back.
Figure 4.
1-back visual stimuli.
Figure 4.
1-back visual stimuli.
Figure 5.
The two main challenges.
Figure 5.
The two main challenges.
Figure 6.
Recording set for the experiments.
Figure 6.
Recording set for the experiments.
Figure 7.
Preprocessing steps. (a) Original frame. (b) Face-cropped frame. (c) Final frame.
Figure 7.
Preprocessing steps. (a) Original frame. (b) Face-cropped frame. (c) Final frame.
Figure 8.
Representative images of each class.
Figure 8.
Representative images of each class.
Figure 9.
Images taken randomly from the data augmentation operation.
Figure 9.
Images taken randomly from the data augmentation operation.
Figure 11.
Confusion matrix for the second experiment.
Figure 11.
Confusion matrix for the second experiment.
Figure 12.
Confusion matrix for the third experiment.
Figure 12.
Confusion matrix for the third experiment.
Figure 13.
Visual results of the final classification results.
Figure 13.
Visual results of the final classification results.
Figure 14.
Survey answers vs. participant performance for the PASAT test. (a) Perceived level of difficulty. (b) Level of frustration experienced.
Figure 14.
Survey answers vs. participant performance for the PASAT test. (a) Perceived level of difficulty. (b) Level of frustration experienced.
Figure 15.
Survey answers vs. participant performance for the N-back test. (a) Perceived level of difficulty. (b) Level of frustration experienced.
Figure 15.
Survey answers vs. participant performance for the N-back test. (a) Perceived level of difficulty. (b) Level of frustration experienced.
Table 1.
Statistics of the participants.
Table 1.
Statistics of the participants.
| Gender | Participants | Age |
|---|
| Male | 45 | 21.66 ± 1.14 |
| Female | 14 | 20.09 ± 0.84 |
| Total | 59 | 21.27 ± 1.29 |
Table 2.
Distribution of dataset V1.
Table 2.
Distribution of dataset V1.
| ID | Frustration | Confidence |
|---|
| 27 | 70 | 80 |
| 30 | 6 | 10 |
| 38 | 4 | 4 |
| 40 | 26 | 26 |
| 44 | 27 | 27 |
| 46 | 13 | 13 |
| 47 | 35 | 27 |
| 50 | 64 | 41 |
| 51 | 12 | 10 |
| 52 | 32 | 30 |
| 56 | 6 | 11 |
| 58 | 19 | 41 |
| 59 | 24 | 16 |
| 63 | 28 | 25 |
| 74 | 83 | 48 |
| 77 | 13 | 24 |
| 80 | 42 | 32 |
| 87 | 29 | 29 |
| 99 | 76 | 142 |
| 19 participants selected | 609 | 609 |
Table 3.
Distribution of dataset V2.
Table 3.
Distribution of dataset V2.
| ID | Frustration | Confidence |
|---|
| 27 | 172 | 179 |
| 36 | 51 | 45 |
| 38 | 215 | 160 |
| 40 | 92 | 87 |
| 44 | 95 | 89 |
| 46 | 23 | 24 |
| 47 | 122 | 123 |
| 50 | 119 | 120 |
| 51 | 37 | 36 |
| 52 | 101 | 99 |
| 56 | 21 | 23 |
| 59 | 66 | 67 |
| 62 | 66 | 66 |
| 63 | 70 | 69 |
| 74 | 207 | 204 |
| 79 | 19 | 21 |
| 80 | 168 | 171 |
| 84 | 33 | 33 |
| 87 | 60 | 60 |
| 90 | 18 | 18 |
| 99 | 529 | 486 |
| 21 participants selected | 2284 | 2180 |
Table 4.
Distribution of dataset V3.
Table 4.
Distribution of dataset V3.
| ID | Frustration | Confidence |
|---|
| 36 | 51 | 45 |
| 46 | 23 | 24 |
| 51 | 37 | 36 |
| 56 | 21 | 23 |
| 79 | 19 | 21 |
| 84 | 33 | 33 |
| 90 | 18 | 18 |
| 7 participants selected | 202 | 200 |
Table 5.
Our CNN architecture.
Table 5.
Our CNN architecture.
| Layer | Dimension | Activation Function |
|---|
| Conv | 3 × 3 × 16 | ReLU |
| Maxpooling | 2 × 2 | - |
| Conv | 3 × 3 × 32 | ReLU |
| Maxpooling | 2 × 2 | - |
| Conv | 3 × 3 × 64 | ReLU |
| Maxpooling | 2 × 2 | - |
| Flatten | - | - |
| Full Connected | 1 × 2000 | ReLU |
| Dropout | - | - |
| Full Connected | 1 × 1000 | ReLU |
| Dropout | - | - |
| Output | 1 × 2 | Softmax |
Table 6.
Results obtained without using data augmentation.
Table 6.
Results obtained without using data augmentation.
| Class | Recall | Precision | F1 | Accuracy |
|---|
| Frustration | 0.6447 | 0.7102 | 0.6758 | 0.6967 |
| Confidence | 0.7468 | 0.6860 | 0.7151 | 0.6967 |
Table 7.
Results obtained using data augmentation.
Table 7.
Results obtained using data augmentation.
| Class | Recall | Precision | F1 | Accuracy |
|---|
| Frustration | 0.6810 | 0.7090 | 0.7250 | 0.7061 |
| Confidence | 0.7013 | 0.6976 | 0.7103 | 0.7061 |
Table 8.
Results obtained using LOSO-CV.
Table 8.
Results obtained using LOSO-CV.
| Class | Recall | Precision | F1 | Accuracy |
|---|
| Frustration | 0.8267 | 0.6987 | 0.7573 | 0.7338 |
| Confidence | 0.6400 | 0.7852 | 0.7052 | 0.7338 |
Table 9.
Results obtained using LOSO-GKFV.
Table 9.
Results obtained using LOSO-GKFV.
| Class | Recall | Precision | F1 | Accuracy |
|---|
| Frustration | 0.7920 | 0.8247 | 0.8080 | 0.8109 |
| Confidence | 0.8300 | 0.7980 | 0.8137 | 0.8109 |
Table 10.
Study of related works. *1 the dataset was not available, *2 only relates AU4 with the frustration emotion, *3 does not present classification results, *4 only considers frustrated smiles, *5 result for in-the-wild experiment, *6 determines the frustration emotion indirectly by detecting anger, disgust, fear, sadness or surprise, and *7 studied the frustration emotion directly and for any gesticulation.
| Authors | Dataset | Basic Emotions | Frustation Emotion | Accuracy |
|---|
| Yao et al. (2021) [2] | CK | Joy, sadness, anger, hate, and neutral | No | 71.50% |
| Roy et al. (2024) [4] | ResEmoteNet | Anger, disgust, fear, happiness, sadness, surprise, and neutral | No | 79.79% |
| Her et al. (2024) [6] | AffectNet | Anger, contempt, disgust, fear, happy, surprise, sad, and neutral | No | 79.79% |
| Grafsgaard et al. (2013) [8] | By the authors *1 | No | Yes *2 | No *3 |
| Hoque et al. (2012) [10] | By the authors *1 | No | Yes *4 | 48.10% *5 |
| Grewe et al. (2019) [11] | FER-2013 | Anger, disgust, fear, happy, sadness, surprise, and neutral | No *6 | No *3 |
| FrustNet | Novel dataset | No | Yes *7 | 81.09% |
| Disclaimer/Publisher’s Note: The statements, opinions and data contained in all publications are solely those of the individual author(s) and contributor(s) and not of MDPI and/or the editor(s). MDPI and/or the editor(s) disclaim responsibility for any injury to people or property resulting from any ideas, methods, instructions or products referred to in the content. |
© 2025 by the authors. Licensee MDPI, Basel, Switzerland. This article is an open access article distributed under the terms and conditions of the Creative Commons Attribution (CC BY) license (https://creativecommons.org/licenses/by/4.0/).


 ,
, 


