1. Introduction
Consensus algorithms are fundamental to blockchain and distributed systems, enabling agreement even in the presence of malicious nodes [
1]. As the technology matures, private and permissioned blockchain systems are seeing increased use in settings where secure data sharing and efficient coordination are essential [
2]. According to a 2023 ProveAI (formerly Casper Labs) survey, 87% of 603 business leaders in the UK, China, and the United States indicated plans to invest in blockchain technology within a year. China showed the strongest intent, with 55% of the respondents very likely to invest, followed by the US (47%) and the UK (42%) [
3]. Despite this growing interest, recent studies suggest that actual adoption remains relatively limited, primarily due to a lack of blockchain-related knowledge in combination with unclear technical standards [
4]. A systematic review of studies on blockchain adoption by AlShamsi et al. [
5] found that organizational adoption decisions are often influenced by factors such as lack of confidence in blockchain reliability, difficulty integrating with existing systems, and high implementation costs. In this respect, improving the performance of consensus algorithms becomes an important technical consideration, as issues such as low throughput or high latency, reported in both experimental and applied evaluations of BFT algorithms such as QBFT, PBFT, and Clique, can significantly impact blockchain scalability and hinder enterprise adoption [
6,
7,
8].
Building on this context, the present study examines the Quorum Byzantine Fault Tolerance (QBFT) algorithm, a consensus mechanism used in permissioned systems, where a limited number of trusted validators are responsible for maintaining the network through a voting-based process [
9,
10]. This work focuses on the concept of “leadership uniformity” introduced by [
11], a metric that evaluates how evenly leadership roles are distributed among nodes over time.
Since QBFT typically uses a round-robin scheme for leader rotation, it does not account for network conditions or performance variability between nodes. Inspired by techniques found in other consensus algorithms such as Raft [
12], this study introduces a timeout-based leader selection mechanism within QBFT. To simulate network delays and computational latencies, timeout values are sampled from four distributions: Uniform, normal, lognormal, and Weibull. These values serve as the sole input to the leader selection logic, allowing for controlled simulations of network behavior.
The research addresses two primary goals: The first is to assess the impact of different timeout distributions on leadership uniformity, and the second is to evaluate the role of quorum-based voting under these conditions. In order to examine both, three leader selection strategies were implemented: One that directly selected the node with the minimum timeout, and two others that introduced quorum voting, where the leader was elected from among the 20% or 30% of nodes with the shortest timeouts. The underlying rationale is that electing leaders from these subsets helps reduce selection bias caused by extreme latency values, promoting a more consistent distribution of leadership over time, while also enabling a direct comparison between purely timeout-driven selection and scenarios where rotation is influenced by QBFT’s quorum voting.
Experiments were conducted on a network of 10 nodes across 200 election rounds, using the four timeout distributions mentioned above to simulate diverse network conditions. The results indicate that uniform timeout assignment does not consistently lead to fair leadership distribution. More specifically, the Weibull distribution with shape
, which was chosen for its moderate skewness [
13] and its ability to reflect delay patterns observed in real-world systems [
14,
15], achieved the best overall fairness and leader rotation consistency. This suggests that leadership distribution benefits from timeout behavior that more accurately reflects real-world network conditions. Furthermore, incorporating quorum-based selection from the top 20% and 30% of nodes further improved the balance of leadership across rounds. In this sense, consistently favoring the nodes with the shortest timeouts may restrict leader rotation over time, while introducing limited randomness helps mitigate this effect and improve fairness. These findings suggest that incorporating timeout-aware strategies into QBFT can complement or enhance round-robin selection by making leader election more adaptive to network conditions, highlighting how timeout-driven randomness may contribute to fairer leadership distribution in permissioned BFT consensus and informing the design of future QBFT variants.
From a broader perspective, the present work relates to the field of distributed and decentralized computing by enhancing leader selection strategies in Byzantine Fault-Tolerant (BFT) consensus. By modeling network latencies and evaluating adaptive quorum-based mechanisms, it offers design insights for building more resilient and equitable consensus protocols in latency-sensitive systems.
The main contributions of this paper are as follows:
Propose and evaluate a simulated timeout-based leader selection approach for QBFT, combining node timeouts with quorum-based voting to model network variability and assess its impact on fairness.
Simulate and compare four timeout distributions (uniform, normal, lognormal, Weibull) to assess their impact on leadership uniformity.
Demonstrate through simulation that the Weibull distribution, when combined with structured quorum-based voting, results in improved fairness and lower error rates compared to other tested distributions.
Provide simulation-backed insights to inform the design of more adaptive, latency-aware BFT consensus strategies for permissioned blockchain networks.
Section 2 of this paper provides a brief historical overview of the development of BFT algorithms and examines the use of BFT-Proof of Authority (PoA) mechanisms in private blockchain networks. Next,
Section 3 provides a detailed overview of the simulation framework, explaining the rationale behind timeout-based voting and the various testing scenarios that were implemented.
Section 4 presents the results of the study, which are then interpreted and discussed in detail, along with limitations and directions for future research in
Section 5. Finally,
Section 6 summarizes the key findings.
3. Materials and Methods
This section outlines the approach used to analyze leader selection fairness in the QBFT algorithm. The version implemented in this study is a simplified conceptual model, focusing on key aspects of the algorithm, such as leader election, message handling, and quorum validation for a more targeted analysis. It begins by detailing the QBFT protocol, motivates the shift to timeout-based leader selection, and then presents the experimental settings and evaluation metrics.
3.1. QBFT Algorithm Analysis
This subsection examines key aspects of the baseline QBFT implementation, including its leader selection mechanism, quorum logic, and overall computational and communication complexity. The purpose is to evaluate the behavior of the baseline algorithm and identify key limitations and opportunities to enhance performance and fairness.
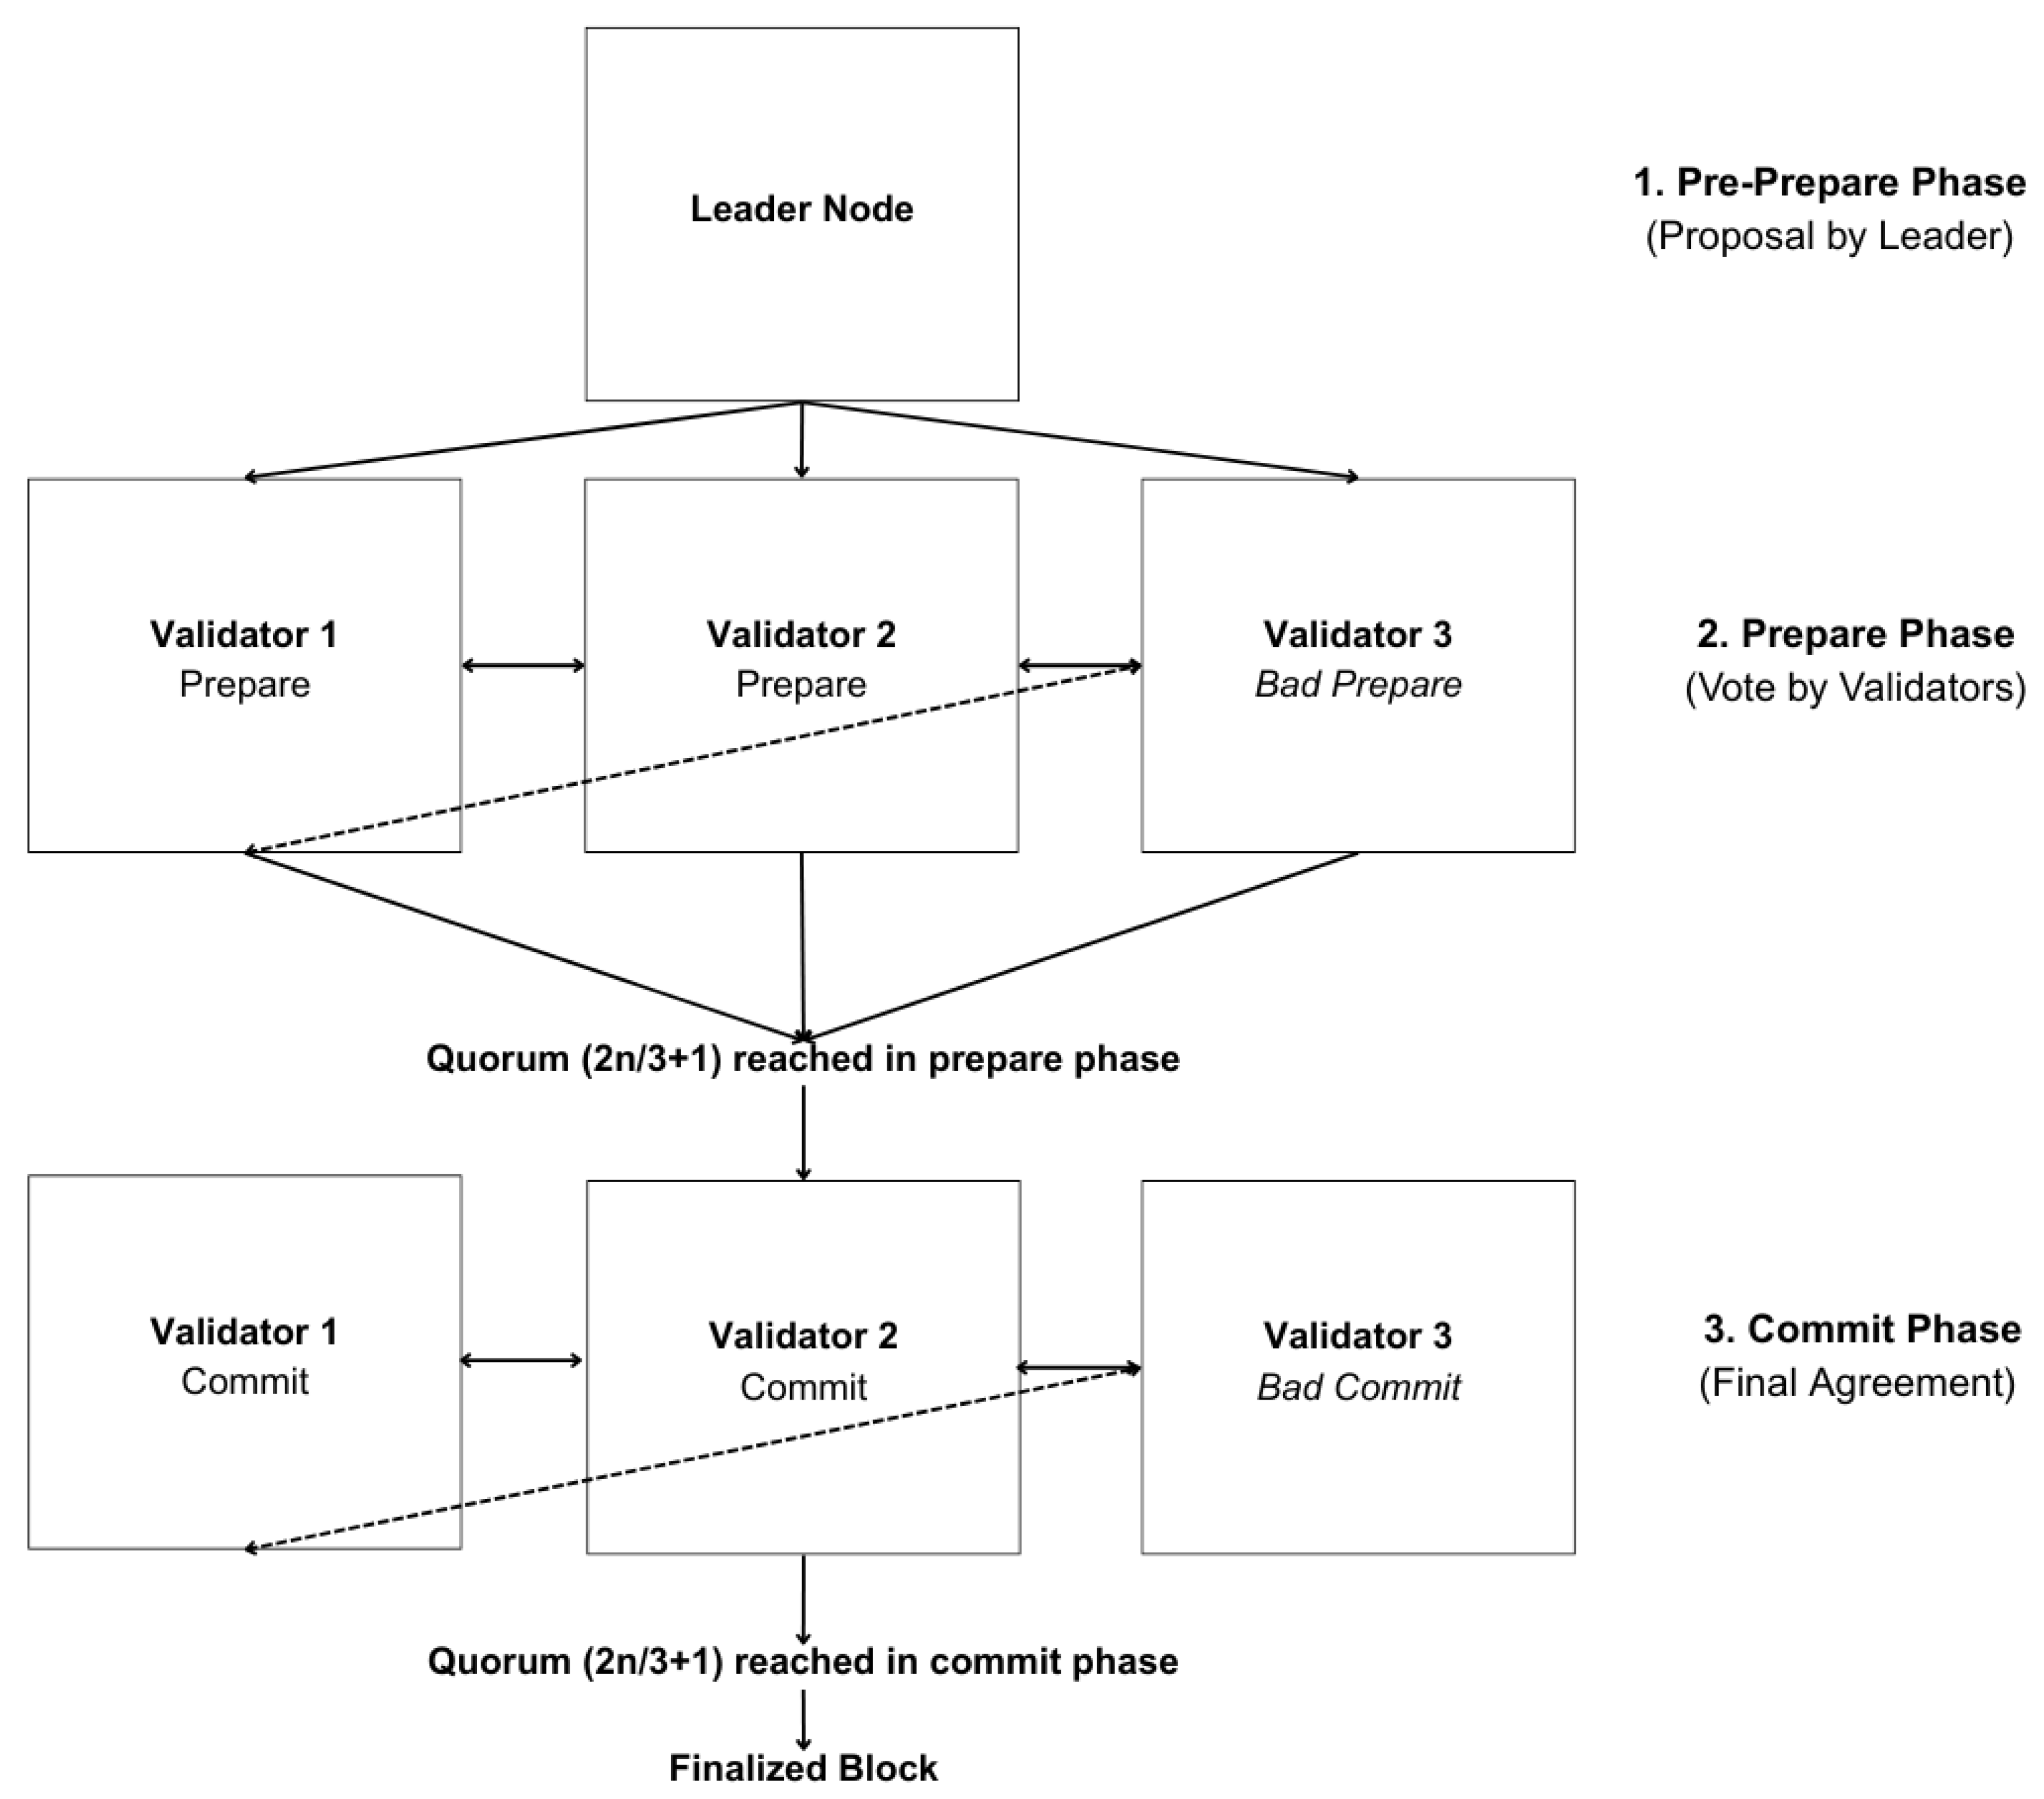
The algorithm follows a three-phase commit protocol: “Pre_Prepare”, “Prepare”, and “Commit”, in which each node exchanges messages and verifies that the leader’s proposal is valid and that a sufficient number of nodes agree before proceeding to the next phase. This results in a computational complexity of
per node for each phase, where
n is the number of participating nodes. The consensus process is illustrated in
Figure 2, depicting the progression through these three phases.
Although QBFT is typically designed to use a round-robin leader selection process [
9,
10], this study modifies the protocol to support a timeout-based leader selection model better suited for evaluating fairness under varying network conditions (see
Section 3.2).
As previously mentioned, quorum verification in QBFT ensures that at least two-thirds of the participating nodes support a proposal before a block can be finalized. This threshold is defined as , where n is the total number of nodes. To determine whether this condition is met, each node iterates through the received messages and verifies their signatures, introducing a linear computational cost () per phase.
However, scalability problems begin to arise primarily in the algorithm’s communication model, as in each phase, every node in the network transmits its message to all others [
6]. Since each node sends messages to
other nodes per phase, the number of message exchanges grows quadratically as the size of the network increases, resulting in a communication complexity of
.
In summary, the per-node computational cost of QBFT is for message handling and quorum checks, while the communication overhead is due to full message broadcasting in each phase. These properties make QBFT suitable for smaller networks, but its efficiency decreases as the number of nodes grows. In particular, the quadratic message growth becomes a limiting factor in larger networks, as bandwidth and processing demands increase rapidly with node count.
Based on this analysis, the following aspects of QBFT present opportunities for improving performance and scalability:
Optimized Communication: Reducing all-to-all broadcasting through message aggregation or grouping (i.e., sending messages to selected subsets of nodes) could help lower communication overhead.
Adjustable Quorum Size: Dynamically adjusting the quorum threshold based on network conditions could improve scalability while maintaining fault tolerance.
Improved Leader Selection: Preventing the repeated selection of the same nodes as leaders could lead to a fairer distribution of leadership over time.
Although communication and quorum improvements are important, this paper focuses specifically on refining leader selection to improve fairness via leadership uniformity. To this end, the QBFT implementation is extended to investigate whether leadership can be distributed more evenly over time by replacing the standard deterministic leader rotation with an adaptive, timeout-driven approach. More specifically, the study evaluates how effectively the proposed leader selection mechanism promotes balanced leadership across the consensus process by measuring deviations from an ideal leader distribution.
3.2. Integrating Timeout Leader Selection with QBFT Quorum Voting
This subsection outlines the simulation design, including how timeout values were generated, how leader selection was performed, and how fairness was evaluated.
This paper builds on the methodology proposed by Iosif et al. [
11], who investigated leadership uniformity in the Raft consensus algorithm. According to the authors, leadership uniformity refers to the fair and balanced distribution of leadership roles among all participating nodes over time. Their approach is adapted in this study to evaluate leader selection fairness in the context of QBFT.
As noted in
Section 2, traditional QBFT relies on a round-robin process for leader selection, which ensures that validators assume leadership roles in an ordered manner. While this approach guarantees equal participation, it does not account for variations in network conditions or computational capacity across nodes. Accordingly, this study introduces a timeout-based leader selection approach, where
represents the maximum time a node is willing to wait before timing out and initiating a leader election. Instead of rotating leadership sequentially, nodes with shorter follower timeouts
, reflecting faster network responsiveness, have a higher chance of being selected as leaders, thereby allowing the system to adjust to real-time network conditions. This approach is evaluated using three selection strategies: Minimum-timeout and randomized voting among the 20% and 30% of nodes with the shortest timeouts.
To evaluate the effects of timeout-based leader selection, each node is assigned a random timeout value
drawn from one of four probability distributions: Uniform, normal, lognormal, and Weibull. These distributions are chosen to simulate a range of network conditions, from stable environments with consistent latencies to highly variable systems characterized by sporadic delays. This design follows prior work by Iosif et al. [
11], who used similar distributions to study timing behavior in distributed consensus. The normal distribution serves as a general baseline, while the lognormal distribution captures empirically observed latency patterns in distributed systems.
This methodology incorporates the Weibull distribution as an alternative model for follower timeouts due to its flexibility in modeling real-world delay characteristics. A key parameter influencing Weibull’s behavior is
k, which controls skewness. As shown by Versluis and Straetmans [
13], the distribution becomes increasingly right-skewed as
k decreases below 1, with skewness gradually diminishing as
k approaches 1. Lower values, such as
, correspond to highly unstable networks with frequent small delays and rare latency spikes. In contrast, values closer to 1 (but still
) tend to result in more consistent response times. In the context of this study, decreasing
k leads to heavier tails and greater variability, which can result in premature leader election behavior. When applied to follower timeouts, this may compromise fairness, either by triggering elections too early or introducing rare but extreme delays, both of which can lead to irregular or biased leader selection across rounds. Meanwhile, higher values of
k may underrepresent early trigger behaviors observed in practice.
The midrange values of
k closely resemble delay patterns reported in IP-based systems, where short latencies are common but are occasionally interrupted by significant spikes [
14,
15]. For instance, Papagiannaki et al. [
14] observed that single-hop queueing delays could be approximated using a Weibull distribution with shape parameters ranging from 0.6 to 0.82. Although these previous studies focus on network-level behavior, the variability in queueing delays they describe is also relevant to permissioned distributed systems, where consensus performance is sensitive to latency fluctuations and timeout mechanisms rely on timely message delivery. Furthermore, since the Weibull distribution with
and the lognormal distribution are heavy-tailed and allow for occasional extreme delays, they are commonly used in areas such as risk theory and queuing theory to model rare but impactful events, such as large losses or extended waiting times [
32,
33]. Consequently, these distributions provide a useful way to simulate less predictable network conditions, where infrequent but high-latency timeout values may influence which nodes are selected as leaders.
Based on the above, the present study adopts a fixed value of , which falls within this empirically grounded range and represents a moderately skewed configuration. This value captures early-timeout behavior typical of real-world network delays while avoiding extreme variance. While other k values are discussed above to illustrate the Weibull distribution’s flexibility, all simulations in this study use to ensure consistency and practical relevance.
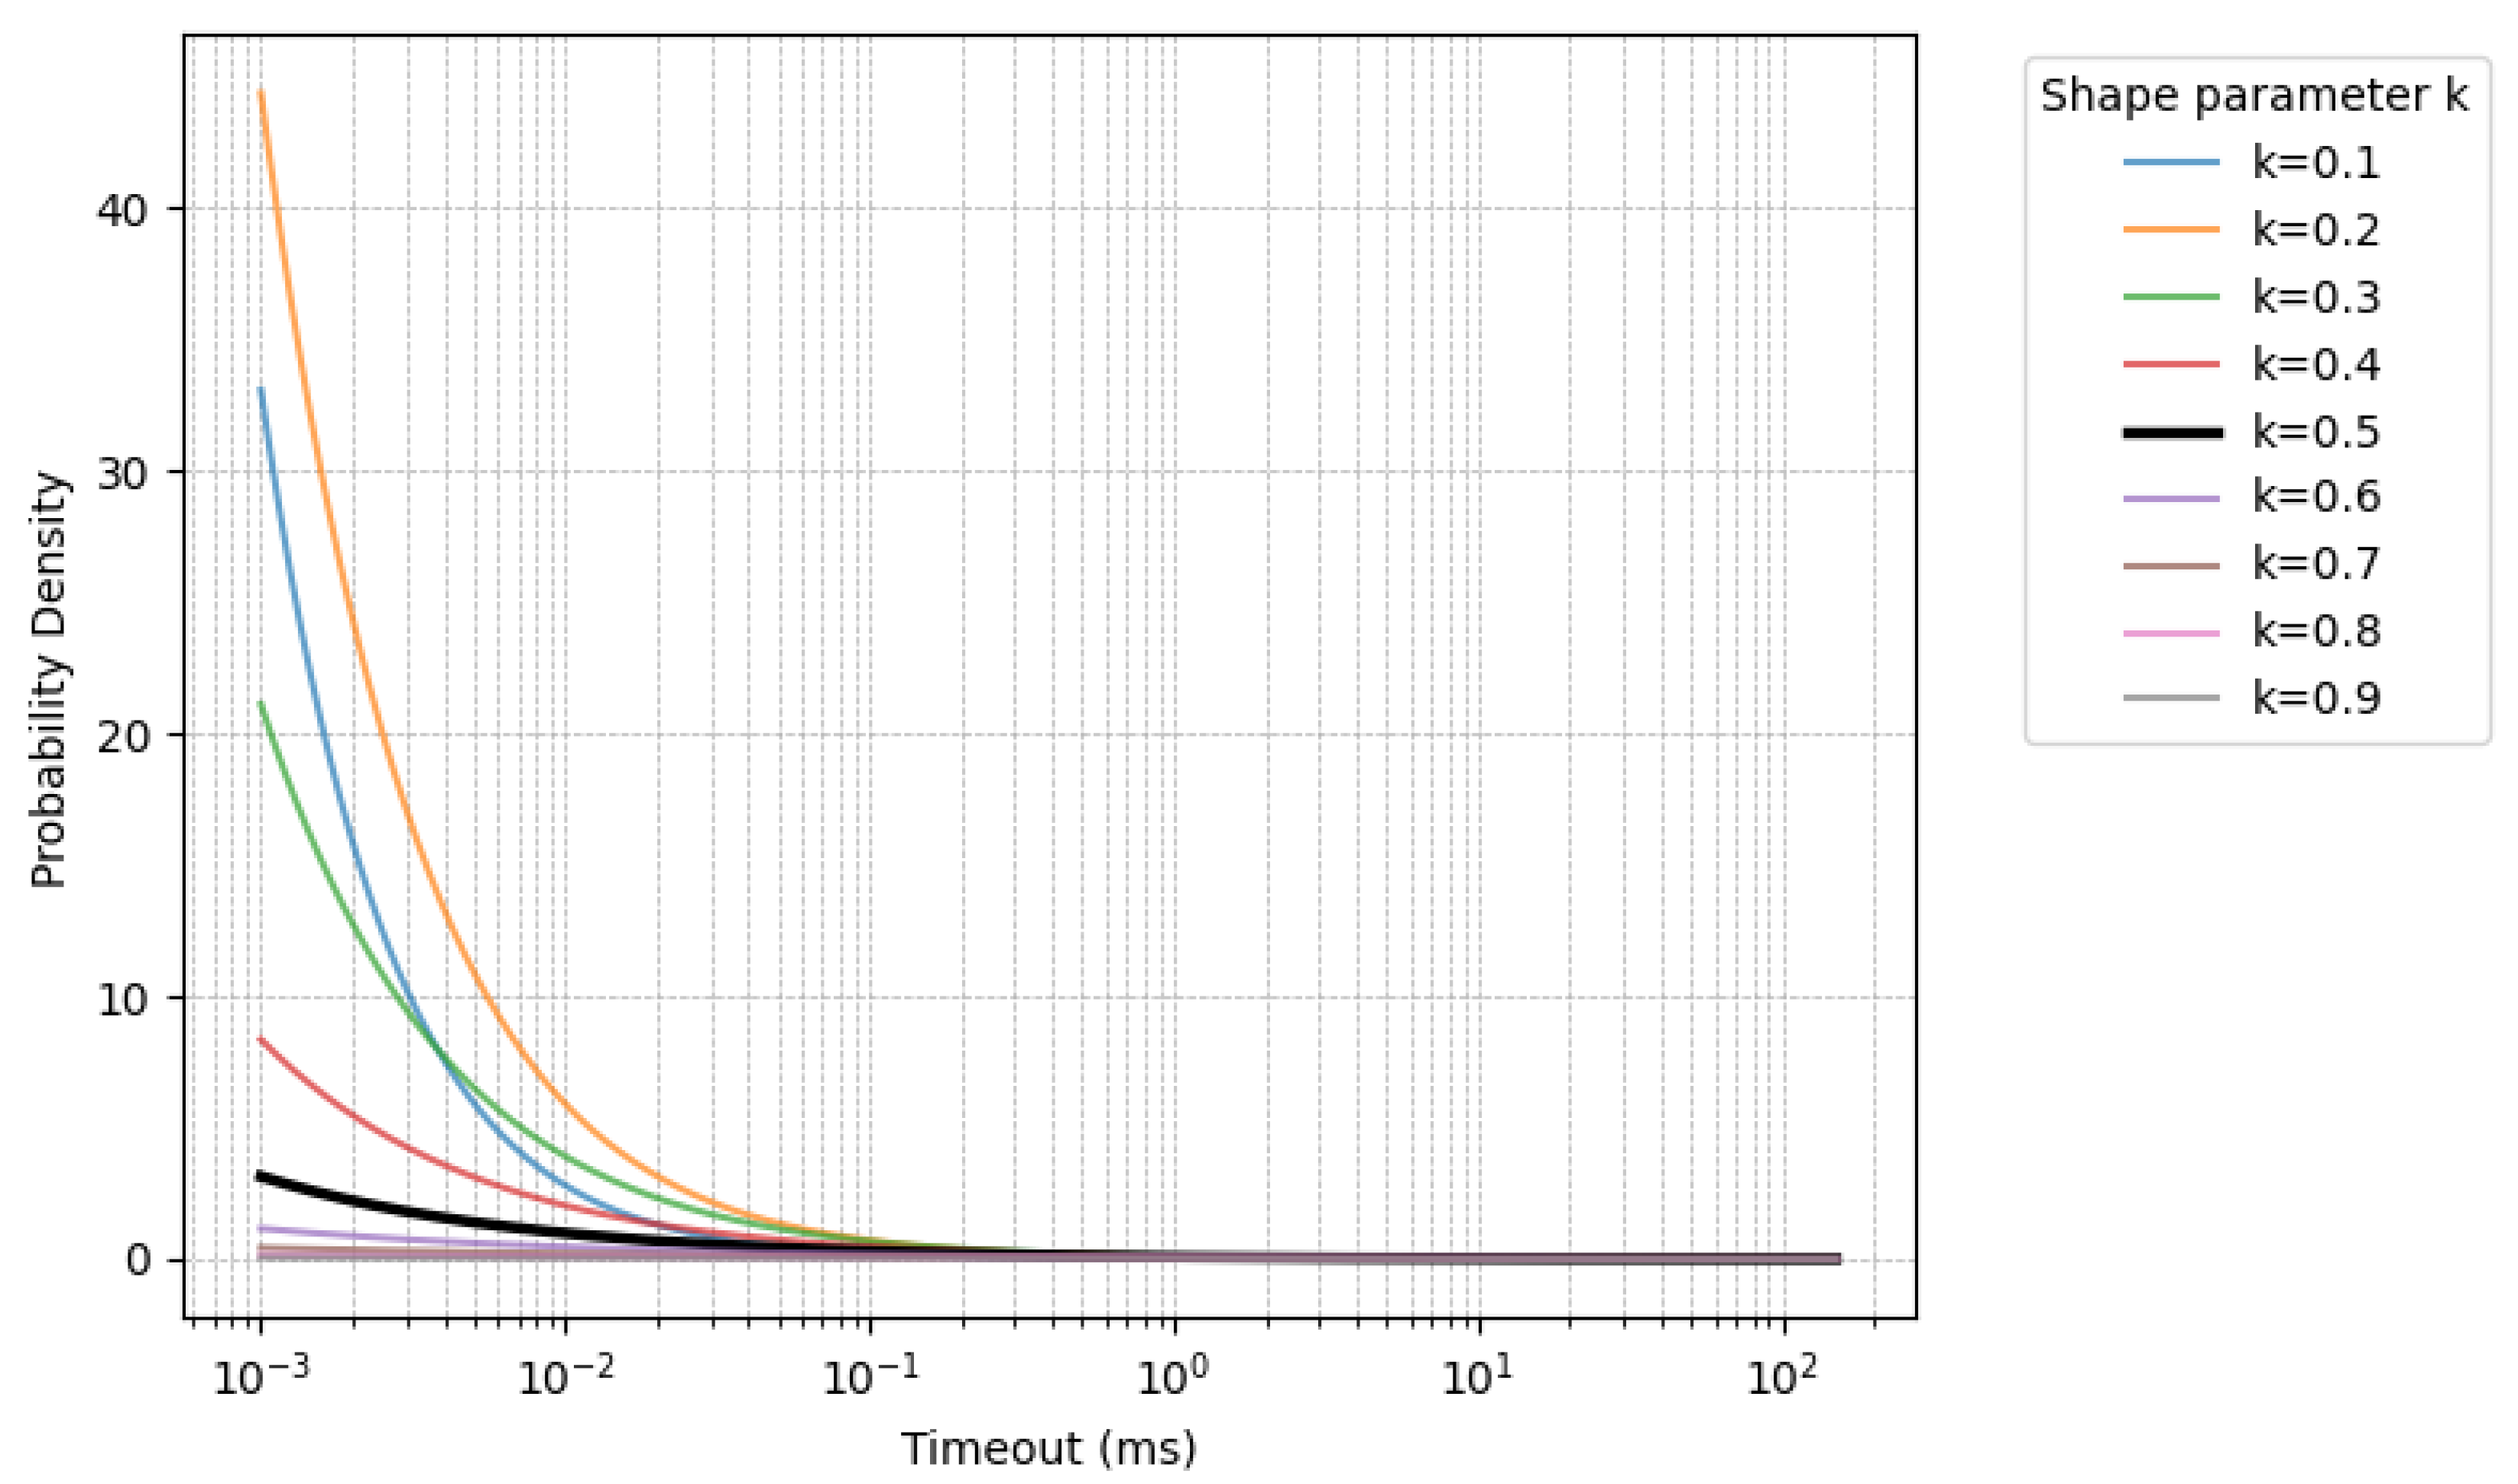
The shape parameter’s behavior is summarized in
Table 2 and illustrated in
Figure 3, which plots Weibull probability density functions for various shape parameters on a logarithmic timeout scale, normalized to a mean of 50 ms. The curves demonstrate how changes in
k affect the skewness and concentration of the distribution, particularly in the low-timeout region. The x-axis spans timeouts from 0.01 to 150 ms on a logarithmic scale to highlight differences in the early and long-tail behavior of each distribution.
In order to ensure that leader selection is not solely determined by timeout values, the proposed approach incorporates a structured mechanism consisting of three selection strategies, each evaluated for its impact on leadership uniformity:
Minimum Timeout Selection: The leader is chosen as the node with the lowest , serving as a baseline. This case provides clear results on the effects of different distributions, as it is purely timeout-based and not influenced by QBFT’s quorum voting mechanism.
Randomized Selection from 20% Shortest Timeouts: A candidate pool is formed from the 20% of nodes with the lowest values. Each node casts a vote for a randomly selected candidate within this pool, with candidates voting for themselves. The candidate receiving the most votes is elected leader. This approach ensures that the process is influenced not only by timeout values, but also by QBFT’s quorum-based voting mechanism.
Randomized Selection from 30% Shortest Timeouts: Similar to the previous case, a candidate pool is formed from the 30% of nodes with the shortest timeouts. The broader selection pool increases variability in voting outcomes, thus amplifying the role of quorum approval and further reducing the dependence of leader selection on exact timeout ranking.
The first method selects the leader deterministically, while the second and third incorporate quorum voting among candidates with the shortest timeouts. These thresholds were chosen to balance variability and quorum formation efficiency, while avoiding excessive vote fragmentation. Collectively, these three leader selection strategies offer a comparative framework to evaluate how timeout-driven randomness and QBFT’s quorum mechanism jointly affect leadership fairness and distribution. This deviation from the traditional round-robin QBFT approach provides valuable insight into how timeout-based leader selection and quorum-based validation interact in a permissioned blockchain setting. By integrating network delays and voting dynamics, the proposed method aims to achieve a more adaptive and equitable consensus process. The primary objectives of this experiment are, first, to investigate whether specific timeout distributions result in fairer leader selection, and second, to assess how the quorum mechanism, along with the three proposed selection strategies, influences the overall uniformity of leadership distribution.
Finally, although timeout values in this study are sampled from multiple distributions, the inclusion of the Weibull distribution is further supported by Extreme Value Theory (EVT), which establishes that the minimum of a set of independent and identically distributed random variables, when appropriately scaled, converges to a Weibull-type distribution under suitable conditions [
34]. This theoretical result is particularly relevant to the first leader selection strategy, where the node with the minimum timeout is deterministically chosen, providing a strong theoretical basis for modeling this behavior.
3.3. Experimental Settings
This subsection outlines the simulation parameters used to evaluate the fairness of leader selection under varying network conditions. The goal is to understand how different timeout distributions and selection strategies influence the distribution of leadership over time.
The experiments implement the three leader selection strategies and four timeout distributions described in
Section 3.2. Given the differences in how each distribution shapes the spread of
values, it is useful to examine which configurations lead to more balanced leadership rotation. While some distributions may lead to more frequent changes in leadership, others can cause certain nodes to be chosen repeatedly across rounds.
Since leader selection in QBFT also depends on quorum voting rather than timeout ranking alone, the simulation (specifically in the second and third strategies) requires each candidate to secure the approval of at least nodes in the network. If no quorum is reached, the round is repeated, introducing further variability and helping prevent leadership monopolization. Simulations were conducted using nodes over rounds.
To ensure comparability, the mean timeout is fixed across all configurations. To simulate a range of baseline network conditions, leader selection performance is evaluated across five follower timeout values: ms. This models environments ranging from highly responsive to high-delay networks.
Additionally, to reflect different levels of network variability, the uniform, normal, and lognormal distributions are evaluated at three standard deviation settings:
,
, and
. In contrast, the Weibull distribution is evaluated using a fixed shape parameter
, while the scale parameter
is adjusted to preserve the mean
. Although the standard deviation of the Weibull distribution is not explicitly set, it is determined by
k and
, resulting in a consistent variability level. Consequently, Weibull is evaluated only once per
, unlike the other distributions, which are tested at multiple variability levels (see
Section 3.2).
Figure 4 visualizes the four timeout distributions used in this study on a linear x-axis scale, each normalized to a mean timeout of
ms and a standard deviation of
. The plot highlights differences in skewness and tail behavior, which play an important role in how timeout values affect leader selection under each strategy.
For the uniform distribution, timeout values are sampled from a range
, where:
Thus, the values are drawn from the interval , which is symmetrically centered around the mean , so the mean is given by . Here, defines the spread of the distribution, resulting in a total range of .
The normal distribution distribution is centered around , with and standard deviation .
For the lognormal distribution, the parameters are adjusted so that the distribution has an expected value (i.e., the mean, denoted
) equal to the desired
. The expected value of a lognormal distribution is given by:
Here, and are the mean and standard deviation of the underlying normal distribution (i.e., the distribution of ), while denotes the desired standard deviation of the lognormal distribution.
Solving for
and
in terms of
and
:
The Weibull distribution allows variability through both the shape and scale parameters. The shape parameter is fixed at , and only the scale parameter is adjusted in order to maintain a constant mean timeout .
To ensure that
, the scale parameter is computed as:
Here, denotes the gamma function, a generalization of the factorial function to real and complex numbers.
The standard deviation of the Weibull distribution is given by:
Substituting
yields:
Thus, the standard deviation is approximately , establishing a fixed level of variability for the Weibull distribution relative to its mean.
Table 3 summarizes the key properties and parameter settings of the timeout distributions used in the experiments. For all distributions, the mean timeout is set to
to ensure consistency across comparisons. For the uniform, normal, and lognormal distributions, this is achieved by varying the standard deviation
, while the Weibull distribution uses a shape parameter and achieves the desired mean by solving for the appropriate scale parameter.
3.4. Leadership Uniformity Evaluation Metrics
Leader selection performance is evaluated by measuring deviation from the ideal leadership uniformity. This uniformity is represented by
, defined as the ideal number of leadership opportunities per node across all trials. It is calculated as follows:
where:
For this study, the number of consensus rounds is set to , and the number of participating nodes is . Therefore, the ideal number of leadership opportunities per node is .
To assess leader selection performance under different distributions, two key error metrics are used: Mean Absolute Error (MAE) and Mean Squared Error (MSE).
MAE measures the average absolute deviation between the actual number of times each node is elected as a leader and the ideal value
, representing a perfectly uniform distribution.
where
represents the number of times node
i was elected as a leader across all consensus rounds.
MSE is a variation of MAE that considers the squared differences from the ideal leader distribution:
These metrics (MAE and MSE) are used to quantify leadership fairness across different configurations. The objective is to identify which combinations of timeout distributions and leader selection strategies produce the most uniform distribution of leadership roles under QBFT. Overall, the three primary experimental variables are: The type of timeout distribution, the level of variability (controlled by the standard deviation or shape parameter), and the leader selection strategy. Each configuration is evaluated across five timeout means and assessed using MAE and MSE relative to the ideal uniform rotation.
4. Results
This section presents the evaluation of leader selection performance across different timeout distributions and variability levels. The results are presented in
Table 4,
Table 5, and
Table 6, which report, respectively, the MAE and MSE across all
values, the corresponding average performance for each
(and under Weibull’s fixed spread), and an overall performance comparison across all distributions for the minimum timeout selection strategy. Similarly,
Table 7,
Table 8, and
Table 9 present the same metrics for the 20% timeout selection strategy, followed by
Table 10,
Table 11, and
Table 12 for the 30% timeout selection strategy. In the final subsection,
Table 13 presents the overall average MAE and MSE values for each timeout selection strategy, while
Table 14 compares the average performance across all strategies and distributions, highlighting overall trends.
4.1. Case 1: Minimum Timeout Selection
In this scenario, leader selection is performed by choosing the node with the absolute minimum timeout. This approach does not involve quorum mechanics and is driven purely by the timeout distributions with no coordination between nodes.
Table 4 presents the results for leader selection using the minimum timeout approach across five follower timeout values (
) and three different standard deviations (
). More specifically, it compares the performance of uniform, normal, lognormal, and Weibull distributions in terms of MAE and MSE, illustrating how each distribution performs under varying timeout conditions and levels of variability. As described in
Section 3, quorum voting is not applied in this case, allowing a direct comparison of the effects of the different timeout distributions without the influence of QBFT. For the Weibull distribution, only a single configuration is included for each
, due to the fixed spread resulting from its shape parameter. Its MAE and MSE values remain within a competitive range across all timeout values. The normal distribution demonstrates moderate consistency in MAE across midrange timeout values but shows increased variability at higher
. The lognormal distribution consistently achieves the lowest MAE at higher timeout values, particularly when
is small.
Table 5 summarizes the average MAE and MSE leader selection values for the minimum timeout case. For
, the lognormal distribution yields the lowest MAE (2.6) and MSE (11.6). At
, the uniform distribution performs best with an MAE of 3.1 and an MSE of 16.6. In contrast, the highest error is observed for the uniform distribution at
, reaching an MAE of 4.2 and MSE of 28.4. The Weibull distribution, tested at a single variability level, achieves an average MAE of 3.3 and MSE of 14.8.
Table 6 presents the overall performance comparison for the minimum timeout selection method. As shown, the lognormal and Weibull distributions exhibit the lowest errors, with both achieving an MAE of 3.3, as well as an almost identical MSE of 18.6 and 14.8, respectively. Although the Weibull distribution is evaluated one per
, its averaged results across all timeout values remain highly competitive. The uniform and normal distributions show slightly higher average errors overall. Finally, for this case, the overall average MAE is 3.4 and the average MSE is 19.6.
4.2. Case 2: Quorum-Based Leader Selection from the Fastest 20% of Nodes
This approach selects a leader from the fastest 20% of nodes based on their timeout values. Unlike the previous method, this strategy combines timeout information with QBFT quorum mechanics, as nodes vote randomly among the eligible candidates and a quorum is required to finalize the election. The results for this strategy across all distributions are provided below.
Table 7 presents the leader selection results for the 20% shortest timeout selection strategy across the five follower timeout values (
) and three different standard deviations (
). This case incorporates quorum-based voting, adding variability to the selection process as nodes vote for candidates from within a pool. At
, the Weibull distribution achieves the lowest MAE (1.6) across all configurations. The uniform distribution performs best at
with
, where it records the lowest overall MAE of 1.4. Meanwhile, the lognormal distribution remains competitive at higher timeout values under low variability, while the normal distribution shows relatively stable performance but does not achieve the lowest error in any setting.
Table 8 summarizes the average MAE and MSE values for the second case. For
, the uniform distribution achieves the lowest MAE (2.9) and MSE (15.0). At both
and
, the uniform distribution again performs best, reaching an MAE of 3.1 and an MSE of 15.4 in the former, and an MAE of 2.9 and an MSE of 12.9 in the latter. The Weibull distribution records the lowest overall error in the table, with an MAE of 2.0 and an MSE of 6.5.
Table 9 presents the overall performance comparison for the 20% shortest timeout selection method. The Weibull distribution records the lowest overall error, with an MAE of 2.0 and an MSE of 6.5 under a single configuration. Among the remaining distributions, the uniform distribution performs best, achieving an overall MAE of 3.0 and an MSE of 14.4, followed closely by the lognormal distribution with an MAE of 3.4 and an MSE of 18.5. Finally, in this case, the overall average MAE is 3.0, and the average MSE is 14.5.
4.3. Case 3: Quorum-Based Leader Selection from the Fastest 30% of Nodes
Similarly to the previous approach, this method integrates timeout-based selection with QBFT quorum mechanics. In this case, the leader is selected from the fastest 30% of nodes, slightly expanding the candidate pool while still requiring quorum agreement. The performance metrics for this strategy across distributions are shown in the table below.
Table 10 presents the leader selection results using the 30% shortest timeout selection strategy, evaluated across five follower timeout values (
) and three different standard deviations (
). As with
Table 4 and
Table 7, it compares the MAE and MSE values for uniform, normal, lognormal, and Weibull distributions. In this case, the normal distribution performs best at
and
, achieving the lowest MAE of 1.8. Similarly, the Weibull distribution reaches an MAE of 1.2 at both
and
, the lowest values recorded. On the other hand, the lognormal distribution shows a higher error at higher timeout values, particularly at
, where MAE remains above 3.8 across all levels of
.
Table 11 summarizes the average MAE and MSE values for the final case of 30% shortest timeouts. For
, the uniform distribution records the lowest MAE (2.6) and MSE (11.8). At
, the lognormal distribution performs best, with an MAE of 2.8 and an MSE of 14.0. Finally, under the
setting, the Weibull distribution achieves the lowest error overall, reaching an MAE of 2.6 and an MSE of 12.0 under its fixed spread per
.
Table 12 presents the overall performance comparison for the 30% shortest timeout selection method. As shown, the normal distribution achieves the lowest error overall, with an MAE of 3.1 and an MSE of 15.5. The uniform and lognormal distributions follow closely, both with MAEs of 3.2 and MSEs of 17.0 and 16.8, respectively. In particular, the Weibull distribution records the lowest absolute values in the table, with an MAE of 2.6 and an MSE of 12.0. Finally, in this case, the overall average MAE is 3.0, and the average MSE is 15.3.
4.4. Performance Comparison Across Timeout Selection Strategies and Distributions
This subsection provides a consolidated comparison of the average performance for each selection strategy and timeout distribution. The results highlight overall trends and help identify the most balanced distribution in terms of leadership uniformity.
Table 13 presents the overall average MAE and MSE values for each timeout selection strategy, providing a clear comparison of performance across the minimum timeout selection, followed by the 20% and 30% shortest timeout methods, regardless of the timeout distribution. The second strategy performs best with an MAE of 3.0 and an MSE of 14.5.
Table 14 presents the overall average MAE and MSE values per distribution across all three timeout selection strategies. The results show almost identical performance among the uniform, normal, and lognormal distributions, with average MAEs around 3.3 and MSEs between 18.0 and 18.8. However, the Weibull distribution stands out, achieving a substantially lower average MAE of 2.7 and MSE of 11.1, highlighting its strong and consistent performance.
5. Discussion
This paper evaluated the concept of leadership uniformity, as introduced by Iosif et al. [
11], and its interaction with the QBFT consensus model in a timeout-based simulation. In each consensus round, nodes were assigned random timeout values drawn from one of four probability distributions. These timeouts modeled network variability, capturing how nodes may respond at different speeds. Nodes with shorter timeouts were, therefore, more likely to be selected as leader candidates.
The simulations followed three distinct scenarios. In the first, the node with the minimum timeout was automatically selected as the round leader. This provided a baseline where leader selection depended solely on timeout values, without QBFT’s voting mechanism. Furthermore, in order to evaluate the influence of QBFT’s voting mechanism in combination with node timeouts, two additional scenarios were considered, where candidates were selected from among pools of the 20% or 30% of nodes with the shortest timeouts. In both cases, the candidate nodes voted for themselves, while the remaining nodes cast their votes randomly among the candidates. In order to be elected as the round leader, a candidate had to secure both a majority vote and also meet the quorum threshold. If these conditions were not met, the voting process was repeated until a leader was selected.
All distributions were evaluated across five different values, with results representing averages across these. In addition, the uniform, normal, and lognormal distributions were evaluated under different standard deviations (). The Weibull distribution, by contrast, was assessed at a fixed standard deviation determined by its shape parameter . Although this limited direct comparison, the averaging of results across standard deviations preserved overall comparability.
The key finding is that the uniform distribution did not consistently promote leadership uniformity. While the uniform, normal, and lognormal distributions exhibited comparable performance with average MAEs around 3.3 and MSEs between 18.0 and 18.8, the Weibull distribution achieved a significantly lower average MAE of 2.7 and MSE of 11.1 (
Table 14). This highlights its strong performance and indicates that the Weibull distribution, with
, supports a fairer distribution of leadership roles compared to the other models. The Weibull distribution’s heavy-tailed shape with
effectively models real-world network delays, where frequent fast responses are interspersed with occasional high-latency spikes. The fact that the Weibull distribution both reflects real-world delay patterns and outperforms other models in fairness metrics underscores its practical relevance as a model for timeout-driven leader selection in QBFT.
Further examining the results, under minimum-timeout selection, the lognormal and Weibull distributions had the lowest MAEs (3.3), with MSEs of 18.6 and 14.8, respectively (
Table 6). However, quorum-based selection from the 20% or 30% fastest nodes led to even lower error rates. The best overall performance was observed with the Weibull distribution in the 20% scenario (MAE = 2.0, MSE = 6.5) (
Table 9). Similarly, in the 30% selection scenario, the Weibull distribution recorded the lowest error, with an MAE of 2.6 and an MSE of 12.0. Meanwhile, the other distributions showed very similar outcomes, with MAEs ranging from 3.1 to 3.2 and MSEs between 15.5 and 17.0 (
Table 12).
Across all distributions, quorum-based strategies reduced error: The minimum-timeout method yielded an overall MAE of 3.4 and an MSE of 19.6, while the 20% and 30% shortest-timeout strategies each achieved an MAE of 3.0, with the 20% method achieving a lower MSE (14.5), compared to 15.3 for the 30% method (
Table 13). Although selecting the node with the lowest timeout improves per-round responsiveness, it may lead to uneven leadership distribution over time, particularly under low-variability timeout distributions where the same nodes are more likely to be repeatedly selected by chance. In contrast, incorporating controlled randomness through quorum-based voting fosters a more balanced distribution by reducing the statistical likelihood of repeated selection of the same nodes. These findings suggest that timeout-based quorum voting not only lowers cumulative error rates but also supports more adaptive leader distribution in QBFT. By leveraging latency variability, especially in scenarios with heavy-tailed delays, this approach shows promise for enhancing fairness in timeout-driven BFT consensus schemes.
The choice of quorum size, typically set at , also played a significant role. While lower candidate selection thresholds (20% and 30%) improved fairness and reduced error rates, preliminary testing showed that higher thresholds (40% and 50%) led to election deadlocks. More specifically, self-voting candidates combined with randomized voting from the remaining nodes caused excessive vote fragmentation, making it difficult for any candidate to reach quorum. For example, in a 10-node network, if four candidates each voted for themselves and the remaining six cast votes randomly, quorum was rarely achieved, leading to stalled leader elections. These simulation results highlight the importance of carefully designing quorum mechanisms, particularly in smaller networks, to maintain liveness and ensure efficient leader rotation.
Overall, the results show that leadership uniformity in timeout-based QBFT depends on both the timeout distribution and the leader selection strategy. Furthermore, incorporating timeouts into the voting process improves fairness by promoting a more balanced distribution of leadership over time. This highlights timeout-aware selection as a practical alternative to static rotation, particularly in permissioned networks with heterogeneous validator performance, and demonstrates how timeout-driven randomness can support more adaptive QBFT designs.
This study has several limitations: First, extreme conditions such as infinitely high timeouts (representing failures or severe latency) were not modeled. Future approaches should explore these scenarios and evaluate their impact on consensus fairness. Second, standard deviations for MAE and MSE were not reported, which limits statistical depth. Additionally, the impact of varying network sizes was not examined, narrowing the generalizability of results to larger systems. Only a single shape parameter was analyzed for the Weibull distribution, as it represents a moderately skewed setting that balances early timeout responsiveness with tail stability. However, this choice limits insights into how varying degrees of skewness might affect leader rotation under varying network conditions. Finally, the current model independently resampled timeouts in each round, without persistent node characteristics. Behaviors such as consistent latency patterns or faulty nodes, which could potentially affect leader selection dynamics, were not captured.
Future work could pursue several extensions: One promising direction is to test QBFT performance on larger and more heterogeneous blockchain networks to evaluate scalability. Another direction is to integrate real-time latency feedback into the leader selection logic, together with the verification process, to enable more adaptive behavior under dynamic network conditions. It would also be valuable to compare the proposed timeout-based mechanism with other BFT consensus algorithms using equivalent timeout models to benchmark relative performance and fairness. Additionally, future research could explore more sophisticated voting mechanisms, such as weighted schemes, and, with further modifications, integrate a timeout-based voting mechanism into a real-world QBFT setting. For example, dynamic leader scoring or timeout-based reputation systems could be used to reward consistently responsive nodes, while view-change logic may be optimized using timeout-aware triggers. Another possible direction is to explore formal asymptotic analysis, especially to understand how minimum-timeout selection behaves under different timeout distributions. In summary, this study provides a foundation for exploring more dynamic and equitable leader selection in permissioned BFT systems, and contributes design insights into timeout distributions, candidate selection thresholds, and quorum strategies tailored to latency-sensitive environments.
6. Conclusions
This study demonstrated that leadership uniformity in QBFT can be influenced by both timeout distributions and quorum-based voting mechanisms. The experimental setup explored three leader selection strategies and evaluated their impact under four distinct timeout distributions: Uniform, normal, lognormal, and Weibull.
The findings showed that the uniform distribution, while often assumed to ensure fairness, does not necessarily produce the most balanced leader rotation. In contrast, the Weibull distribution (with shape ) consistently achieved lower error rates, with an overall average MAE of 2.7 and MSE of 11.1 across scenarios. While the other distributions were evaluated across multiple standard deviations, the Weibull distribution was assessed only once per mean due to its fixed variance. These results suggest that under network conditions modeled by a Weibull distribution, leader selection can be fairer and more consistent.
The introduction of quorum-based voting, in which leaders are elected from among nodes with the shortest timeouts, further improved fairness between rounds. Both the 20% and 30% strategies outperformed minimum-timeout selection (MAE = 3.4, MSE = 19.6), achieving average MAEs of 3.0. The 20% strategy yielded the lowest average MSE (14.5), followed by the 30% strategy (15.3). In particular, when using the Weibull distribution, the 20% selection strategy achieved the best overall performance (MAE = 2.0, MSE = 6.5), with the 30% variant also showing strong results (MAE = 2.6, MSE = 12.0). While minimum-timeout selection improves responsiveness in individual rounds, it does not necessarily promote long-term fairness, as it may lead to repeated selection of the same nodes under low-variability timeout distributions. In contrast, quorum-based selection introduces controlled randomness, which helps mitigate this effect and fosters a more balanced distribution of leadership over time.
Overall, the results suggest that timeout-based dynamics offer a promising direction to improve fairness in BFT consensus protocols. By leveraging latency variability, especially under heavy-tailed delay distributions, timeout-based quorum leader selection demonstrates improved fairness in leader rotation and offers a practical path to more equitable timeout-based BFT protocols. By modifying leader selection to incorporate both distribution-based timeouts and structured voting, the consensus process can become more balanced, less susceptible to selection bias, and better suited to dynamic environments. These simulation-backed findings highlight how timeout-driven randomness, shaped by distribution properties and quorum design, can inform the development of adaptive and equitable QBFT variants for permissioned, latency-sensitive networks.
While the results offer meaningful insights, the study was conducted in a controlled environment with fixed network size and a single Weibull shape parameter (). Furthermore, it did not model failure scenarios or report statistical variance across trials, limiting broader generalizability. Future research could explore a broader range of timeout conditions, incorporate real-time latency feedback, compare performance against other BFT algorithms, and assess scalability in larger or more heterogeneous networks.


