1. Introduction
Software reliability, availability, and security lie at the heart of modern computing research. A method that has gained traction in the past years that helps to improve the dependability of software systems is
fault or bug prediction—the estimation of which parts of a codebase are likely to contain defects. By guiding developers in prioritizing testing and maintenance efforts, fault prediction mitigates the risks of vulnerabilities, downtime, and expensive post-release fixes [
1].
Over the years, numerous bug-prediction models and metrics have been explored, ranging from static code measures (e.g., Halstead metrics) to process-centric metrics (e.g., code churn) [
2,
3,
4]. However, many existing studies—including those leveraging modern machine learning approaches—rely on limited or narrowly scoped datasets [
1]. For instance, many benchmarks provide only static measures of older projects [
5] or focus on a small number of open-source repositories with restricted metric suites [
6]. Consequently, these datasets may not fully capture the real-world diversity of domains, commit practices, or code-change characteristics found in contemporary software ecosystems.
In this paper, we address these limitations by leveraging a large and diverse set of open-source projects—ranging from data processing frameworks to healthcare and security tools—encompassing millions of commits. We analyze each project at the file level on a per-commit basis over its entire lifetime, providing a granular perspective on code evolution.
To analyze this diverse dataset and predict error-prone code therein, we employed
CatBoost [
7,
8], a gradient boosting algorithm known for its strong performance across a variety of problems.
As model inputs, we used code complexity metrics to extract information from each commit across all repositories, along with an indicator of whether a bug fix occurred. This resulted in a dataset comprising a selection of code metrics and a target variable indicating the presence or absence of a bug fix. We then trained the machine learning model on this dataset to predict whether a given commit was more likely to introduce a bug or resolve one.
Beyond its predictive capabilities, we also leveraged
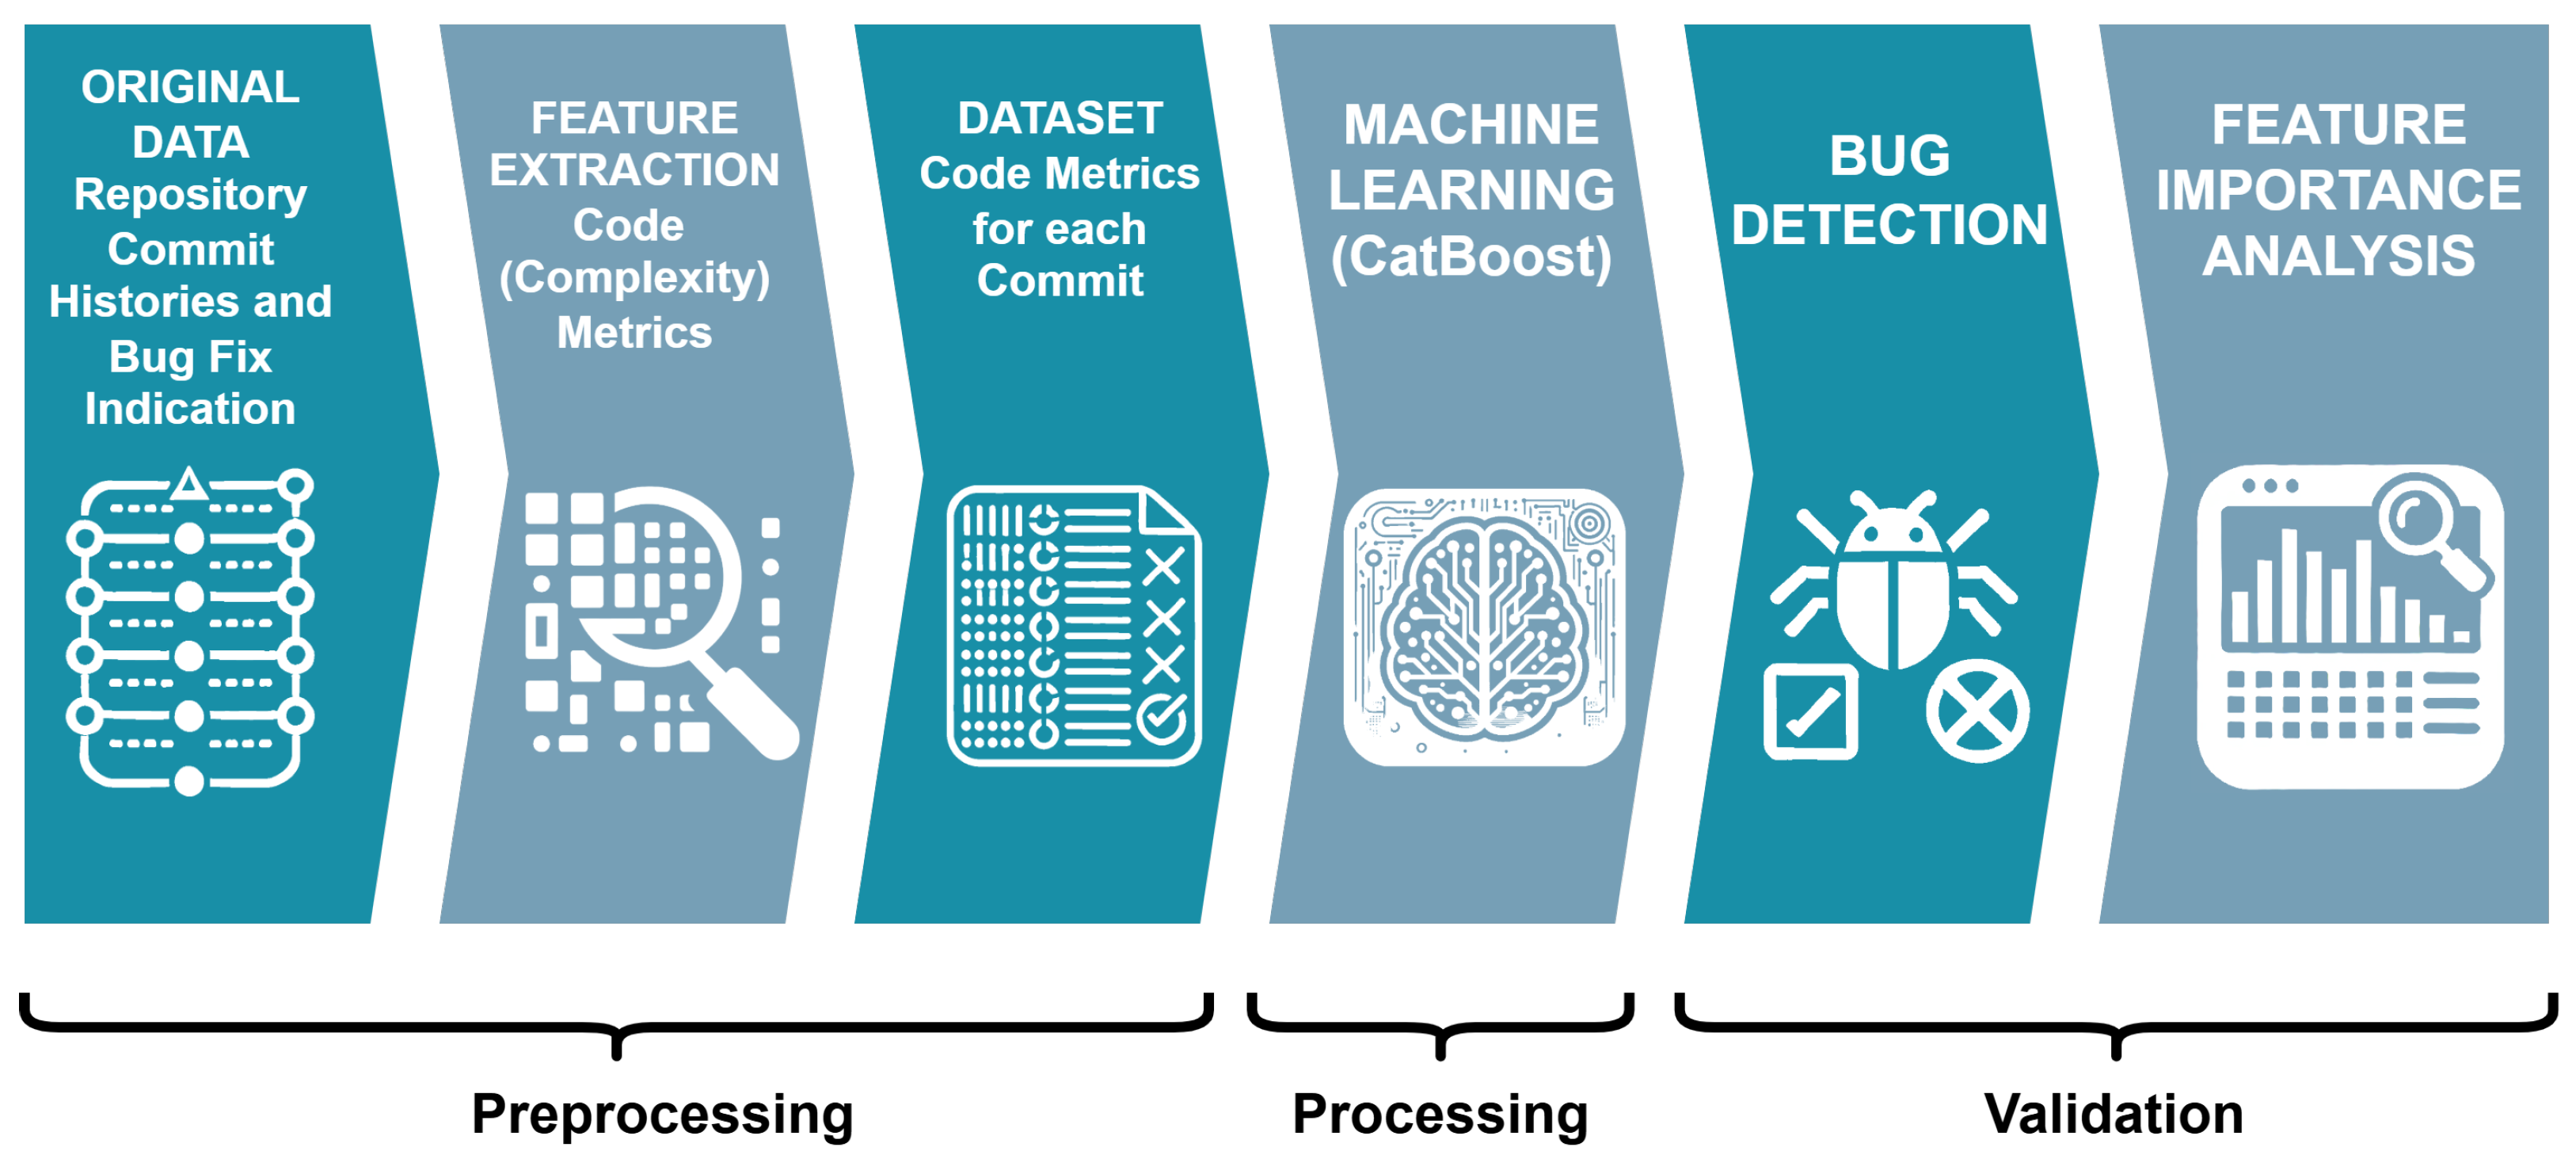
CatBoost in reverse—using a feature importance analysis to determine which factors (i.e., model inputs) had the greatest influence on classification outcomes. This allowed us to identify key factors and how they contribute to code quality and bug-proneness, providing deeper insights into software evolution patterns and informing best practices for improving software reliability. The entire process is illustrated in
Figure 1, which outlines the six key steps of our approach.
In summary, the contributions of this work are as follows:
Large-Scale Multi-Project Analysis: We collect and preprocess commits from 33 open-source projects, yielding a rich, heterogeneous dataset that spans domains, programming languages, and repository sizes.
Commit-Level Feature Extraction: Beyond standard static metrics, we incorporate process-centric (e.g., churn, revision frequency, age) and entropy-based features by analyzing changes commit by commit at the file level, thereby capturing the scattered nature of code evolution over time.
Robust Boost Classifier Implementation: We integrate a Bayesian-optimized CatBoost classifier with a sophisticated undersampling strategy to achieve maximal generalizability and accuracy.
Empirical Evaluation and Feature Importance: We validate our model’s performance using standard metrics (precision, recall, F1-score) on real-world data and provide a detailed feature importance analysis, identifying how churn, age, and entropy measures synergize in indicating defect risk.
Our work’s key contribution lies in showcasing how a feature importance study—in conjunction with a broad metric suite and a realistic dataset—produce both strong predictive performance and concrete, actionable insights for practitioners. This clarity is especially needed in modern software projects, where understanding why certain files are risky can be as critical as predicting which files to inspect.
The remainder of this paper is structured as follows:
Section 2 reviews related work on bug prediction approaches and datasets, highlighting existing gaps.
Section 3 details our methodology and experimental setup, including the dataset, labeling strategy, and metric extraction process. We present our results—including our machine learning predictions and corresponding feature importance analysis—in
Section 4, and discuss threats to validity in
Section 5. Finally,
Section 6 draws conclusions and offers directions for future work.
2. Related Work
One finds a wide range of approaches for predicting bugs and faults in software, spanning from traditional correlation-based metric analyses to modern machine learning and artificial intelligence (AI)-driven methods. Our proposed approach bridges the gap between these classical metric-based techniques and contemporary AI models. In the following, we discuss related work and examine historical datasets relevant to defect prediction.
Bug Prediction Datasets. Many defect prediction approaches often rely on datasets like the NASA MDP repository or the PROMISE dataset, which typically offer limited static code metrics from a small number of projects [
1,
5,
6]. While such benchmarks help researchers compare machine learning models, their narrow scope does not reflect modern development practices. More recent studies included data from open-source projects, yet often remained confined to language-specific or small-scale samples, limiting generalizability [
9].
Machine Learning Approaches and CatBoost. Techniques such as Random Forest, Logistic Regression, and XGBoost have shown promise for fault prediction methods [
10,
11].
CatBoost, a gradient boosting framework notable for handling high-cardinality categorical features and missing values [
7,
8], has likewise been tested in defect prediction. However, these CatBoost-based efforts typically rely on either NASA MDP-like datasets or constrained open-source repositories, inheriting the same limitations in project diversity and metric variety [
10,
12,
13,
14,
15,
16]. Moreover, many of these studies apply only rudimentary parameter tuning, potentially overlooking CatBoost’s full capabilities. Despite CatBoost’s potential, prior works remain limited to small, static datasets or do not explore advanced tuning, leaving a significant opportunity for more robust evaluation.
Although advanced boosting models can provide high predictive accuracy, software engineering practitioners often need to understand
why certain files or commits are labeled as defect-prone. In bug prediction contexts, such interpretability can illuminate
which code metrics drive predictions, enabling project teams to better allocate testing resources and grasp emergent risk factors. Despite this growing emphasis, many prior bug-prediction studies treat boosting models as largely “black-box” methods, providing minimal clarity on how each metric contributes to final decisions [
10,
17].
Process Metrics. Recent studies increasingly prioritize
process-centric features over purely static code measures for fault prediction [
4]. Graves et al. [
18] pioneered a rich set of
change metrics that capture how frequently and in what manner a file is modified over its lifecycle. This was later expanded by Moser et al. [
19] and includes attributes such as the
number of revisions and
Code Churn and
age, which tracks a file’s lifespan. Beyond this original definition,
relative churn emerged as a set of metrics to normalize churn by the total lines of code, enabling comparisons across files of varying sizes [
3]. Likewise,
size metrics such as
totalLoc help gauge the scope of each code unit at commit time [
20].
Entropy-based features, another type of process metrics, complement these change metrics by focusing on
how and
where changes occur within a project. Hassan et al. presented the concept of code-change entropy [
21], which quantifies the
scattering of modifications across multiple files during a certain time window, providing insight into whether developers introduce small, localized edits or large, system-wide alterations. High entropy has been linked to fault-proneness, as widespread changes can be harder for developers to track and may mask newly introduced issues [
21]. Yet, while there have been efforts to integrate such entropy-based features in bug prediction, few adopt a
commit-by-commit perspective across multiple domains. In this study, we unify size metrics, Moser-inspired change metrics (including our own
relative variants), and Hassan’s entropy measures, aiming to yield a more holistic view of code evolution and its relationship to defects, combined with a rigorously tuned CatBoost model.
3. Methodology
This study aims to develop a robust machine learning approach for bug prediction that can generalize across a diverse set of open-source repositories. To achieve this, we employ a commit-level feature extraction process and a careful hyperparameter-tuning pipeline, prioritizing both predictive performance and interpretability. While we use CatBoost as our primary boosting algorithm—chosen for its strong handling of categorical data and support for advanced feature-importance analysis—our overarching goal is to validate a high-performing, explainable ML method for heterogeneous software environments. The following sections detail our data collection, labeling, feature engineering, and modeling techniques, laying out how we combine different metrics with a robust boosting framework to predict fault-prone code.
3.1. Data Collection
Table 1 summarizes the 33 open-source projects in our dataset, spanning a wide range of domains (e.g., security, healthcare, data processing, and web servers), with project ages up to over a decade and sizes ranging from a few dozen to tens of thousands of commits. In total, we collected
2,407,917 commits across these repositories, each annotated with code complexity and process metrics (see
Section 3.2). We labeled commits as bugfix or non-bugfix based on commit-message keywords (
Section 3), yielding a binary target variable
isBugfix. Notably, the dataset exhibits class imbalance:
1,992,334 (82.7%) non-bugfix commits vs.
415,583 (17.3%) bugfix commits. This diversity in domain, language, and repository size provides a robust foundation for evaluating CatBoost’s effectiveness in realistic, heterogeneous software development environments.
All commit data in this study was extracted from
Git repositories. Each commit provides code changes along with metadata (author, timestamp, message), forming the basis for our bug prediction dataset. While some projects link commits to external issue trackers (e.g., Jira, GitHub Issues), aligning such data across multiple repositories is often infeasible—especially for older projects spanning many years. Instead, we employ a keyword-based approach inspired by Mockus et al. [
22], parsing commit messages for trigger words (
fix,
bug,
fail, and
correct) to label a commit as a
bugfix. Before matching, we normalize and stem each message, ensuring variations like
[Bug#1234] or
bugfixed are detected correctly. Spot checks confirm sufficient accuracy for our repositories, enabling efficient bugfix identification without extensive manual annotation or third-party data.
3.2. Code Metrics
We gather features that capture how files change (process metrics), as well as how large (size metrics) and how “chaotic” (entropy metrics) these changes are. We treat each commit as a set of inserted, deleted, or replaced lines, thereby allowing richer churn-based calculations than simply taking the net difference in lines of code.
Absolute Modifications (modified). Each file’s commit-level changes are summarized by the total number of lines added, deleted, or replaced. Replacements are split into a removed portion and an added portion, ensuring that even zero-sum modifications (e.g., swapping lines of code) register as nontrivial changes. We intentionally treat additions and deletions equivalently in this metric, as our focus is on capturing the overall magnitude of change rather than its direction, based on the assumption that extensive modifications of any type correlate with increased fault risk.
Relative Modifications (relativeAdded, relativeReplaced). Beyond counting raw changes, we normalize them by the file’s current size. RelativeAdded is the fraction of added lines over the total number of lines in the new version, and relativeReplaced is the fraction of how many have been replaced. This highlights smaller files where even minimal changes may have a significant impact on maintainability. Note that while our absolute ’modified’ metric accounts for deletions, we do not include a separate ’relativeDeleted’ metric because deletions reference code that no longer exists in the current file state, making normalization less straightforward.
Revision Count (revision). We track how many times a file has been revised, offering a straightforward indicator of its edit frequency.
Total Lines of Code (totalLoc). This size metric quantifies the file’s scale at each commit. Large files might accumulate high modified values purely due to their size, so combining totalLoc with relative metrics helps contextualize high-churn files of varying scales.
Entropy-Based Metrics (hcpf1, hcpf2, and hcm2). To capture how scattered file modifications are over time, we adopt an
entropy-based view of code changes inspired by Hassan [
21]. Intuitively,
entropy should be higher when changes are spread across many files and lower when edits concentrate in fewer files. This provides finer granularity than simple churn alone, which merely aggregates how many lines of code have changed.
Sliding-Window Computation. Concretely, for each commit
c with timestamp
, we examine all prior commits in the repository whose timestamps fall within a specified
recently modified window (in our case, 180 days) before
. Let
S be the set of such commits. We then gather every file-level code edit from each commit in
S, summing the absolute lines changed to obtain a global total
. For each file
f appearing in the set
S, we denote by
the total lines changed in
f over those same 180 days. We define
to be the fraction of lines changed in file
f relative to the entire window. For newly introduced files within the sliding window,
includes all lines of the initial file creation (counted as “added” lines) plus any subsequent modifications to that file within the same 180-day window. This approach ensures that new files contribute to entropy calculations proportionally to their size and any early evolution they undergo. The
entropy of these changes is then:
where
F is the set of all files touched in
S, and we use log with a base (e.g., 2 or
) that is consistent across the entire study.
hcpf1 and hcpf2. We assign this computed entropy
H to every file
f changed
in the current commit c as the
hcpf1 metric: it captures how “scattered” the broader development context is around the time
c. In addition, we define:
which scales
H by the proportion
of lines changed in
f over the previous 180 days. As a result,
hcpf2 reflects both the scattering of changes
and the file’s relative contribution in that window.
HCM2. Finally, we accumulate these entropy values over multiple preceding intervals to reflect the historical “entropy baggage” of a file. Let
be all prior commits affecting file
f, and let
be the entropy values computed at each of those commits in their respective sliding windows. The
hcm2 metric is then:
This summation reflects how persistently a file has undergone development activity in
high-entropy contexts. A large
hcm2 value implies that the file has repeatedly experienced widely distributed changes over its history, potentially correlating with elevated fault risk [
21].
Overall, we obtain three main entropy-based metrics per file and commit: hcpf1, hcpf2, and the cumulative hcm2. They collectively offer a view of short-term scattering (via hcpf1 and hcpf2) and long-term historical complexity (via hcm2), complementing churn- or size-based features for more robust bug prediction.
-
Age (age). We quantify a file’s longevity at each commit by measuring its age in seconds. Concretely, this is the elapsed time between the file’s first appearance in the repository and the current commit timestamp. Using seconds allows for a precise chronological scale, ensuring even short-lived files or rapid iteration phases can be captured. For all files, including short-lived ones, age precisely reflects their actual duration of existence in the project, calculated as the elapsed time between the file’s first appearance and the current commit being analyzed. When files are deleted, their age is no longer tracked, as they cease to appear in subsequent commits. In practice, older files may accumulate technical debt or undergo incremental degradations, making age a potentially strong predictor of fault-proneness.
We provide standard statistics for all discussed metrics in
Table 2.
Among the features, hcpf1 shows a relatively high mean (0.9165) and low standard deviation (0.1234), while hcpf2 remains close to zero. The hcm2 metric follows a similar distribution but exhibits a maximum value of 1.5072.
The modified metric is highly skewed, with an extreme maximum of 629,569 modified lines, suggesting the presence of large commits in the dataset. The age metric shows a significant range spanning from 0 to over 729 million seconds. The revision metric shows a maximum of 6569 revisions per file.
The totalLoc metric ranges from 0 to 800,376 lines, emphasizing the presence of large-scale software projects.
We additionally provide these statistics for each programming language (e.g., Java) in
Appendix A for interested readers. Across the four language groups, JavaScript projects exhibit the highest mean revision count, pointing to frequent iterative changes, while Python shows the greatest present- and cumulative-entropy values (
hcpf1,
hcm2), indicating more widely scattered modifications. Java repositories contain the oldest and, on average, largest files, whereas TypeScript tops the average lines-of-code metric; despite these differences, churn-related measures remain of similar magnitude across languages, supporting the presented language-agnostic approach.
Overall, the dataset presents a mix of numerical and categorical features, with varying levels of completeness and skewness. The high imbalance in the isBugfix variable suggests that specialized resampling techniques, such as undersampling or synthetic data generation, may be necessary to enhance model performance in detecting bugfix commits effectively.
3.3. Machine Learning
For our machine learning approach, we employed CatBoost, a modern boosting classifier [
7,
8]. Decision trees, the fundamental building blocks of boosting methods, are non-parametric supervised learning models used for both classification and regression tasks [
23].
Boosting classifiers extend the basic concept of decision trees by sequentially training a series of weak learners, typically simple decision trees, and combining their predictions to form a strong, robust model. Unlike bagging techniques, which build multiple independent models in parallel, boosting methods iteratively focus on correcting the errors of their predecessors. Prominent examples of boosting methods include Random Forest [
24], XGBoost [
25], and LightGBM [
26].
CatBoost is a gradient boosting algorithm that uses a permutation-driven approach to handle categorical features natively, reducing the need for extensive preprocessing. It is reported to achieve high accuracy and strong performance across diverse problem domains, even when used out of the box, requiring minimal hyperparameter optimization [
27,
28]. Moreover, CatBoost has proven particularly effective when leveraging complexity metrics and other derived features, in, e.g., software testing or agriculture [
29,
30].
In addition, CatBoost is appreciated for its ease of implementation and built-in GPU support, features that are essential for efficiently processing large datasets.
Furthermore, selecting appropriate hyperparameters is crucial for obtaining optimal performance in any machine learning approach. Hyperparameter tuning involves fine-tuning parameters such as learning rate, tree depth, and regularization coefficients to balance bias and variance. For our study, we employed Bayesian optimization, a probabilistic model-based approach that explores the hyperparameter space by balancing exploration and exploitation [
31]. In particular, we utilized the scikit-opt Python package [
32] to automate this process.
3.4. Feature Importance Analysis
Understanding the contribution of each feature to the model’s predictions is essential for model interpretability and for identifying potential areas of improvement. To achieve this, we utilized CatBoost’s feature importance method, which calculates the importance of each feature based on its contribution to the model’s predictions [
33].
In our analysis, we employed the PredictionValuesChange method, which measures the average change in the model’s prediction when a feature’s value is altered. This method estimates how much the model output shifts when a given feature is perturbed, making it the default for non-ranking metrics. Using this approach, we identified which features significantly influence prediction outcomes, thereby providing insights into the underlying patterns within the data.
3.5. Experimental Setup
The actual dataset for our machine learning experiments consists of all commits from all projects under study. Consequently, for each file and each commit, we obtained a collection of code (complexity) metrics and a target variable indicating whether a bugfix occurred or not.
We conducted our experiments using a two-step data splitting procedure. First, the data was divided into a training set and a final test set with an 80/20 split to ensure that the final evaluation remained unbiased. Further, this initial split was performed randomly using shuffling, stratified with respect to the binary target. The training set was then undersampled: we selected 80% of the minority class (Bugfix) and an equal amount from the majority class (No Bugfix). This undersampled set was repeatedly split into training and validation subsets for model development and parameter tuning. This iterative approach reduced variance in performance estimates and mitigated overfitting.
Additionally, for each undersampled train/test split within the training data for our CatBoost model, we applied Bayesian optimization combined with three-fold cross-validation to systematically search for optimal hyperparameters.
The final Model performance was assessed on the initially split test set using accuracy, precision, recall, F1-score, and confusion matrices [
34]. All metrics were accumulated and averaged over repeated undersampling (100 iterations) to further address class imbalance, ensuring robust and balanced model behavior and evaluation.
Moreover, we conducted a feature importance analysis to understand the relative contribution of different metrics in the classification process. This analysis provides insights into how various process-centric, size-based, and entropy-based features influence the model’s predictions and supports interpretability in bug prediction tasks.
Additionally, for the top four features identified by our feature importance analysis, we analyzed the distributions of the predicted classes, specifically how values are distributed between Bugfix and No Bugfix for each feature. We again employed undersampling to generate representative distributions by bootstrapping, selecting 50% of the minority class and an equivalent amount from the majority class (No Bugfix). This procedure was repeated 100 times for both Bugfix and No Bugfix classes to generate boxplots illustrating the value ranges for the top four features.
4. Results and Discussion
The classification results show that our CatBoost-based model achieved an overall accuracy of 0.7674 on the final test dataset, which was entirely separated from the training and validation processes to ensure an unbiased evaluation.
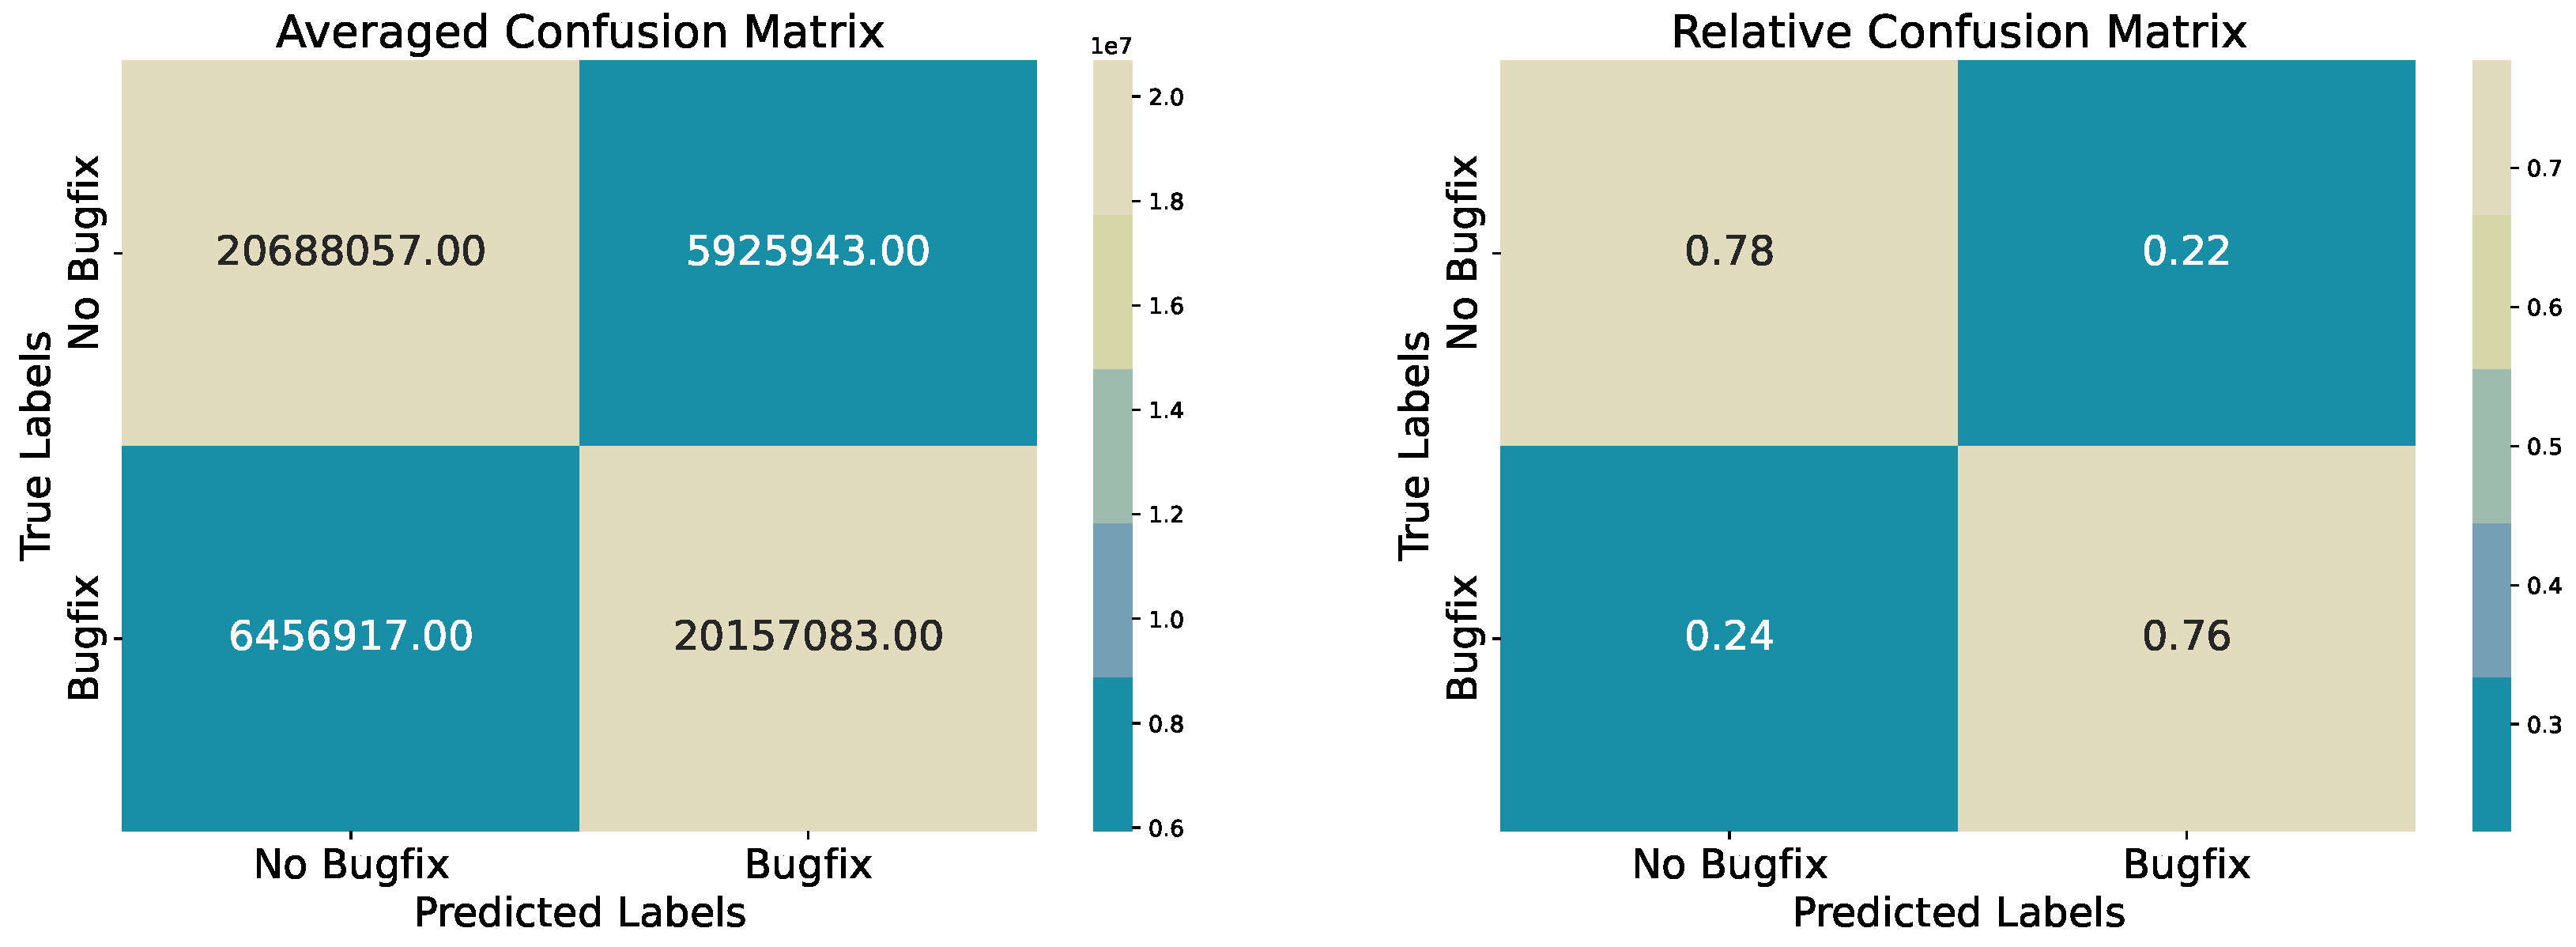
To evaluate these results, we conducted 100 iterations, each time randomly sampling 80% of the minority class and an equal number from the majority class, creating balanced subsets of the test data. We assessed the model’s performance on the final validation dataset by aggregating classification metrics and confusion matrices across all iterations. The final report and matrices reflect averaged results from these accumulations, i.e., balanced, randomly selected subsets from the initially split test data. Additionally, we normalized the confusion matrices to depict relative proportions, as illustrated in
Figure 2.
Figure 2 provides further insight into classification performance. We see that the model classifies most non-bugfix commits correctly, but it also misclassifies a notable proportion of bugfix commits.
From the relative confusion matrix, approximately 77.7% of non-bugfix commits are correctly classified, and 75.7% of bugfix commits are identified accurately (
Table 3).
4.1. Feature Importance and Metric Synergy
Feature-importance analysis here is not merely a check on whether our model is leveraging each variable appropriately. Instead, we employ it to reveal
how the different metrics drive predictions, offering deeper interpretability and insights into bug-prone code attributes. In essence, identifying the relative contribution of our features helps us understand
why certain commits are deemed risky, guiding developers in prioritizing reviews or refactoring efforts.
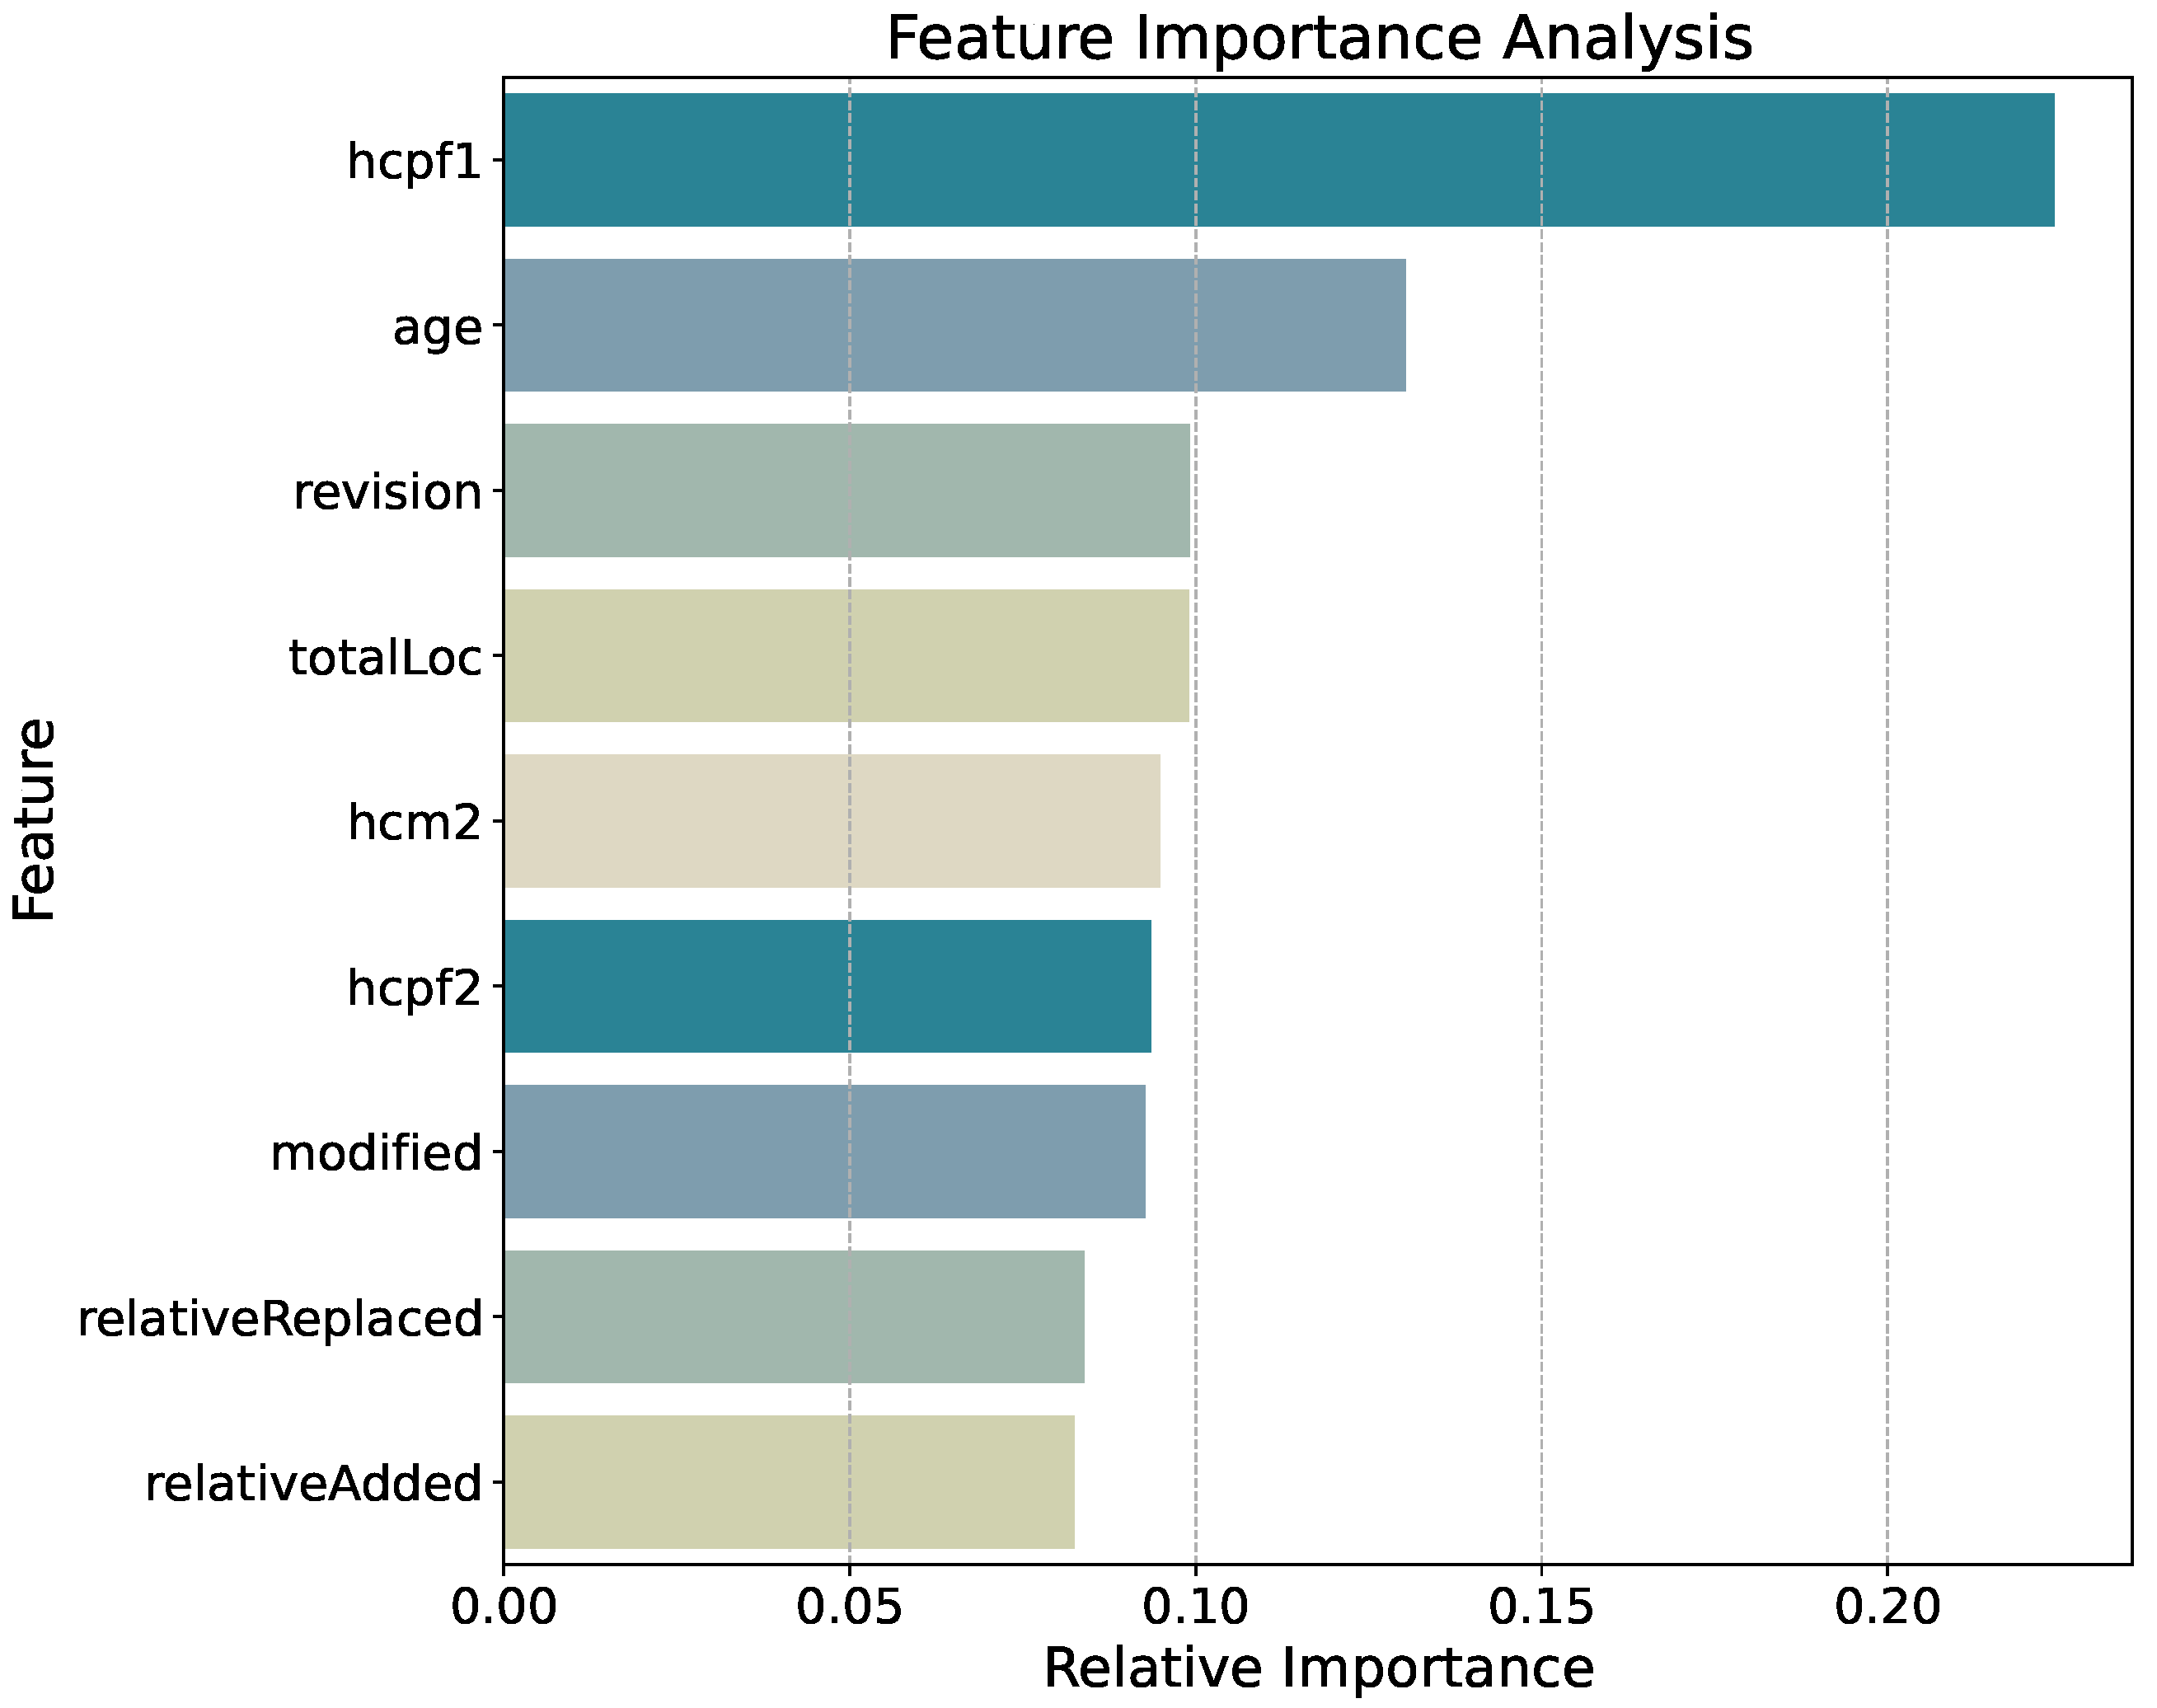
Figure 3 highlights the relative importance of each metric in the CatBoost model’s predictions. Here,
hcpf1 emerges as the most influential feature. This aligns with the hypothesis that
widespread,
system-wide modifications are more prone to defects, especially when multiple files are changed within the same time window [
21]. This is captured by
hcpf1 because it measures how strongly changes were distributed across files in the preceding 180-day window; large-scale or widely scattered modifications lead to higher entropy values, indicating a higher defect risk. Close behind is
age, indicating that older files, or those maintained over extended periods, are more likely to accumulate technical debt or incremental design flaws that can trigger bugs. The
revision metric, which counts how often a file has been updated, ranks next. This finding is consistent with existing literature on
process-centric metrics [
18,
19], where frequent revisions often correlate with elevated fault-proneness.
Beyond these top three, other metrics such as totalLoc, hcm2, and modified also contribute appreciably. Notably, the relative measures (relativeReplaced and relativeAdded) carry non-negligible weight, demonstrating that a spread of metrics capturing size, churn, and entropy together yields a stronger predictive signal than any single type of feature. This synergy suggests that bug proneness reflects a multifaceted process, where historical complexity (entropy), accumulated edits (revision, age), and localized changes (churn, lines added or replaced) all intertwine. Our results extend this conclusion beyond the common benchmark datasets to a large, real-world, and diverse set of repositories.
4.2. Expected vs. Observed Outcomes
From a theoretical standpoint, one might anticipate that
age and
revision would rank among the leading predictors, given that older or frequently edited files often accumulate design decay and thus become more fault-prone [
35]. The prominence of
hcpf1 is likewise unsurprising, given previous research linking
scattering or
spread of changes to higher fault risk [
21].
However, our boxplot analysis (
Figure 4) reveals a somewhat counterintuitive trend: commits labeled as bugfix tend to exhibit
lower average values for
hcpf1 than non-bugfix commits. This finding stands in contrast to the typical assumption that “more scattering leads to more defects” and indicates the importance of recognizing that these are
bug-fixing commits, not necessarily
fault-introducing commits. Indeed, many large-scale bug prediction studies—in the interest of practicality—employ fix-based commit labeling, since it is far simpler to detect terms like “fix” or “bug” in commit messages than to pinpoint exactly where a defect was introduced. Consequently, if a file incurred a bug
during a period of high entropy, developers might only push the fix after that broader scattering subsides, producing lower measured
hcpf1 values at fix time.
By illustrating that hcpf1 can be lower for fix-labeled commits, our analysis highlights the nuanced relationship between scattering and defects, and cautions that the “chaotic” conditions under which a bug is introduced may differ markedly from those under which it is fixed. Meanwhile, hcpf2, which scales hcpf1 by the fraction of lines changed, retains notable importance, suggesting that not just where changes occur but also how intensively a file is edited refines risk. In contrast, relativeAdded and relativeReplaced—though influential—do not surpass top features such as hcpf1, age, and revision, reflecting that in large-scale, heterogeneous projects, global entropy and historical file metrics can overshadow local churn ratios. Overall, the overlapping distributions and unexpected behavior of hcpf1 emphasize the complexity of the problem, affirming that bug prediction cannot rely solely on linear or single-metric assumptions.
4.3. Implications for Practice
Multiple moderately influential metrics reinforce the notion that bug prediction benefits from a diverse metric suite. Our analysis shows that churn, entropy, and change-based measures each contribute distinct predictive signals, indicating that tools focusing solely on static complexity could overlook crucial indicators of fault-proneness. Moreover, the synergy among these metrics offers actionable insights for project managers: for instance, an older file that undergoes a large, scattered edit might warrant deeper code reviews or additional testing. Overall, our feature ranking supports the argument that combining process-centric, entropy-based, and size-related metrics yields a robust and explainable bug prediction model. Nonetheless, it is crucial to interpret entropy values in the light of fix-based labeling conventions, bearing in mind that bug-introducing commits may appear in a higher-entropy state than the eventual fixes.
Overall, these results show that CatBoost is a viable method for bug prediction across highly diverse repositories. The top features (hcpf1, age, revision, etc.) underscore that project history and scattered edits can strongly correlate with bug risk. However, improvements in precision may be achieved through class weighting, refined feature selection, or alternative sampling strategies.
5. Threats to Validity
While our study provides valuable insights into bug prediction across multiple repositories, certain limitations must be acknowledged. These potential threats to validity arise from factors such as dataset composition, labeling methodology, and the scope of selected features, which may influence the generalizability and interpretability of our findings. Below, we outline key aspects related to internal and construct validity.
-
Internal Validity. Our labeling approach for bug-fix commits relies on keyword matching in commit messages (e.g., “fix”, “bug”, “fail”), following prior work [
22]. Although manual spot checks suggested reasonable accuracy, some bug fixes may not be labeled if developers do not use such keywords. Conversely, commits mentioning “fix” in unrelated contexts could be falsely flagged. Furthermore, developers often batch multiple changes into a single commit, complicating the link between a labeled bug-fix and the actual fault-introducing code.
-
Construct Validity. Our chosen code metrics may not capture all facets of software complexity—such as concurrency issues or architectural smells. In particular, large commits with multiple refactorings can inflate churn measures without necessarily increasing true fault-proneness. Similarly, some bug-prone patterns might stem from design decisions not reflected in these metrics.
-
Testing Practices and Bug Patterns. Another limitation, common in fault prediction research, is the absence of testing-related metrics in our feature set. Testing practices, including code coverage, test density, and continuous integration configurations, likely influence both the detection and introduction of bugs across projects, yet these factors are rarely incorporated into prediction models. Repositories with comprehensive test suites and robust CI pipelines may show different defect patterns than those with minimal testing infrastructure. These testing characteristics could potentially explain some of the variation in bug patterns we observed across projects and might help disambiguate the causal factors behind defect-prone files. Future work should incorporate these testing metrics to provide a more complete picture of the relationship between development practices and defect prediction.
6. Conclusions and Future Work
This paper presents a CatBoost-based approach for bug prediction across a diverse set of 33 open-source projects, spanning domains such as security, healthcare, and data processing. By examining commits at a granular, file-level scope, the study highlighted the importance of combining process-centric metrics, including churn, file age, revision frequency, and entropy-based features, in accurately distinguishing bugfix commits. Notably, hcpf1, file age, revision, and totalloc emerged as the most important factors influencing the decision of our model.
Based on the distributions of our predicted classes, we found that increased values for age, revision, and totalloc are indicative of bugs, whereas, counterintuitively, decreased values of hcpf1 (the present entropy) were observed. However, the remaining metrics also contributed substantially, indicating that a broad combination of file history, churn, and size factors yields a strong predictive model.
Thus, overall, we conclude that predicting bugs in code is not a straightforward linear task but rather a complex challenge with many nuances, requiring different perspectives—in terms of metrics—and sophisticated machine learning approaches such as CatBoost and other modern boosted classifiers.
The empirical results demonstrate that a properly tuned CatBoost classifier is capable of handling large, imbalanced real-world datasets while providing reasonable predictive performance in terms of an overall accuracy of 76.7%. Moreover, the successful application of this model to projects of various sizes, ages, and programming languages underscores its generalizability.
In summary, we contribute the following:
A large-scale, multi-repository dataset with varied metrics;
A code-metric-based feature extraction taking into account process, size, and entropy factors;
A Bayesian-optimized CatBoost model tailored together with undersampling for maximal generalizability for imbalanced data;
A feature importance analysis of our trained model highlighting the importance of age, entropy, and churn.
In practice, such a bug prediction tool can assist developers and maintainers in allocating resources more efficiently, ultimately enhancing the dependability of software systems.
Future work could expand this approach beyond open-source repositories by applying it to private, industrial codebases and by incorporating additional developer-related or architectural metrics that capture complexity at broader levels. Furthermore, the methodology could be extended to focus on specific types of vulnerabilities, complementing risk-based assessment strategies. By refining both the metric set and modeling techniques, future research can push the boundaries of robust, transparent, and actionable bug prediction in real-world software development contexts.
Another trajectory for future work would be to integrate our historically grounded fault prediction approach based on long-term commit- and file-level metrics across large-scale repositories, with retrieval-augmented generation (RAG)-based copilot systems such as [
36]. Combining predictive insights from past code evolution with real-time context embeddings and dynamic graph updates could enable synchronized, context-aware bug detection and proactive code suggestions during development.
Further, our evaluation relies on established classification metrics such as precision, recall, and F1-score to quantify the predictive accuracy of our models in identifying buggy commits. In contrast, the Copilot for Testing system [
36] is evaluated through a combination of objective and subjective metrics tailored to interactive, AI-assisted workflows. Specifically, their metrics emphasize accuracy (via bug detection rates, similar to our approach), efficiency (through fix/test case acceptance rates and developer feedback), and coverage (focused on high-impact code paths). While their evaluation aligns with the usability demands of AI pair programming, our selection of metrics captures performance in large-scale historical prediction scenarios. Integrating both perspectives, predictive classification and developer-in-the-loop effectiveness, represents a promising avenue for future hybrid evaluation protocols and would further improve current limitations of our approach, such as internal validity, i.e., the reliance on bug-fix commit filters.
Author Contributions
Conceptualization, P.K. and S.R.; methodology, P.K., S.R., D.T. and F.O.; software, P.K., S.R., D.T. and F.O.; validation, P.K., S.R., D.T., F.O. and C.K.; formal analysis, P.K., S.R., D.T. and F.O.; investigation, P.K. and S.R.; resources, A.S. and K.M.; data curation, P.K., S.R., D.T. and F.O.; writing—original draft preparation, P.K. and S.R.; writing—review and editing, P.K., S.R., C.K., A.S. and K.M.; visualization, S.R.; supervision, A.S. and K.M.; project administration, P.K., A.S. and K.M.; funding acquisition, P.K., A.S. and K.M. All authors have read and agreed to the published version of the manuscript.
Funding
The financial support by the Austrian Federal Ministry of Labour and Economy, the National Foundation for Research, Technology, and Development, and the Christian Doppler Research Association is gratefully acknowledged. SBA Research (SBA-K1 NGC) is a COMET Center within the COMET—Competence Centers for Excellent Technologies Programme and funded by BMIMI, BMWET, and the federal state of Vienna. The COMET Programme is managed by FFG. The authors acknowledge the funding by TU Wien Bibliothek for financial support through its Open Access Funding Program.
Data Availability Statement
The data used in this study is currently part of a larger project and cannot be shared at this stage, but it will be made available in future publications by the authors related to this topic.
Conflicts of Interest
Authors Philip König, Sebastian Raubitzek, Dennis Toth, Fabian Obermann and Kevin Mallinger were employed by the company SBA Research gGmbH. The remaining authors declare that the research was conducted in the absence of any commercial or financial relationships that could be construed as a potential conflict of interest.
Appendix A. Language-Specific Code-Complexity Metrics
This appendix provides the summary statistics for all code-complexity features examined in the study. For each primary programming language—JavaScript, Java, Python, and TypeScript—we list the mean, standard deviation, minimum, and maximum values of every metric used in the analysis. These tables complement the results in
Section 3 by documenting the full empirical distribution of the underlying data.
Table A1.
Summary statistics of key features for JavaScript repositories.
Table A1.
Summary statistics of key features for JavaScript repositories.
| Feature | Mean | Std. Dev. | Min | Max |
|---|
| hcpf1 | 0.7716 | 0.1183 | 0.3291 | 1.9183 |
| hcpf2 | 0.0016 | 0.0107 | 0.0000 | 1.2789 |
| hcm2 | 0.0087 | 0.0799 | 0.0000 | 1.5072 |
| modified | 62.5496 | 1118.7253 | 0 | 235,984 |
| age | 39,075,072.1569 | 43,938,929.9307 | 0 | 266,159,297 |
| revision | 240.1124 | 536.6532 | 0 | 3574 |
| totalLoc | 1252.6035 | 6225.6154 | –20,994 | 165,420 |
| relativeReplaced | 0.0395 | 0.1142 | –11.0000 | 8.5000 |
| relativeAdded | 0.0881 | 0.2398 | –11.0000 | 35.0000 |
Table A2.
Summary statistics of key features for Java repositories.
Table A2.
Summary statistics of key features for Java repositories.
| Feature | Mean | Std. Dev. | Min | Max |
|---|
| hcpf1 | 0.9188 | 0.1007 | 0.3115 | 1.5151 |
| hcpf2 | 0.0014 | 0.0085 | 0.0000 | 0.6563 |
| hcm2 | 0.0072 | 0.0374 | 0.0000 | 1.1659 |
| modified | 59.9954 | 930.6493 | 0 | 410,270 |
| age | 73,370,696.9635 | 108,411,689.9427 | –64,472,991 | 729,206,297 |
| revision | 62.9542 | 364.4293 | 0 | 6569 |
| totalLoc | 699.1993 | 3425.9644 | –266,792 | 800,376 |
| relativeReplaced | 0.0307 | 0.4685 | –118.0000 | 178.0000 |
| relativeAdded | 0.0810 | 6.7391 | –8936.0000 | 702.0000 |
Table A3.
Summary statistics of key features for Python repositories.
Table A3.
Summary statistics of key features for Python repositories.
| Feature | Mean | Std. Dev. | Min | Max |
|---|
| hcpf1 | 1.0455 | 0.1861 | 0.0615 | 2.6513 |
| hcpf2 | 0.0048 | 0.0215 | 0.0000 | 1.8096 |
| hcm2 | 0.0251 | 0.0949 | 0.0000 | 1.3396 |
| modified | 61.8068 | 3485.5183 | 0 | 629,569 |
| age | 44,234,789.8377 | 56,339,843.2555 | 0 | 453,642,525 |
| revision | 26.5250 | 46.4008 | 0 | 531 |
| totalLoc | 548.1044 | 4379.3585 | –18,222 | 629,569 |
| relativeReplaced | 0.0240 | 0.1574 | –16.0000 | 35.0000 |
| relativeAdded | 0.0412 | 0.1972 | –56.6667 | 12.0000 |
Table A4.
Summary statistics of key features for TypeScript repositories.
Table A4.
Summary statistics of key features for TypeScript repositories.
| Feature | Mean | Std. Dev. | Min | Max |
|---|
| hcpf1 | 0.7697 | 0.1073 | 0.3902 | 1.0072 |
| hcpf2 | 0.0078 | 0.0465 | 0.0000 | 0.4547 |
| hcm2 | 0.0129 | 0.0827 | 0.0000 | 0.9675 |
| modified | 58.3682 | 977.2964 | 1 | 75,288 |
| age | 27,797,963.1990 | 24,321,847.4456 | 0 | 156,951,163 |
| revision | 46.7624 | 60.1226 | 0 | 357 |
| totalLoc | 1340.1495 | 7845.6898 | –2431 | 75,288 |
| relativeReplaced | 0.0419 | 0.6879 | –89.0000 | 8.3333 |
| relativeAdded | 0.0626 | 0.2903 | –24.0000 | 6.2727 |
References
- Catal, C.; Diri, B. Investigating the effect of dataset size, metrics sets, and feature selection techniques on software fault prediction problem. Inf. Sci. 2009, 179, 1040–1058. [Google Scholar] [CrossRef]
- Li, Z.; Jing, X.Y.; Zhu, X. Progress on approaches to software defect prediction. IET Softw. 2018, 12, 161–175. [Google Scholar] [CrossRef]
- Nagappan, N.; Ball, T. Use of relative code churn measures to predict system defect density. In Proceedings of the 27th International Conference on Software Engineering, ICSE ’05, New York, NY, USA, 15–21 May 2005; pp. 284–292. [Google Scholar] [CrossRef]
- Rathore, S.S.; Kumar, S. A study on software fault prediction techniques. Artif. Intell. Rev. 2019, 51, 255–327. [Google Scholar] [CrossRef]
- Shepperd, M.; Song, Q.; Sun, Z.; Mair, C. NASA MDP Software Defects Data Sets. IEEE Trans. Softw. Eng. 2018, 39, 1208–1215. [Google Scholar] [CrossRef]
- D’Ambros, M.; Lanza, M.; Robbes, R. An Extensive Comparison of Bug Prediction Approaches. In Proceedings of the MSR 2010 (7th IEEE Working Conference on Mining Software Repositories), Cape Town, South Africa, 2–3 May 2010; IEEE CS Press: Piscataway, NJ, USA, 2010; pp. 31–41. [Google Scholar]
- Prokhorenkova, L.; Gusev, G.; Vorobev, A.; Dorogush, A.V.; Gulin, A. CatBoost: unbiased boosting with categorical features. In Proceedings of the Advances in Neural Information Processing Systems (NeurIPS), Montreal, QC, Canada, 3–8 December 2018; pp. 6638–6648. [Google Scholar]
- Dorogush, A.V.; Ershov, V.; Gulin, A. CatBoost: gradient boosting with categorical features support. In Proceedings of the Workshop on ML Systems at NeurIPS, Long Beach, CA, USA, 8 December 2017. [Google Scholar]
- Bhandari, K.; Kumar, K.; Sangal, A.L. Data quality issues in software fault prediction: a systematic literature review. Artif. Intell. Rev. 2023, 56, 7839–7908. [Google Scholar] [CrossRef]
- Gunda, S.K. Software Defect Prediction Using Advanced Ensemble Techniques: A Focus on Boosting and Voting Method. In Proceedings of the 2024 International Conference on Electronic Systems and Intelligent Computing (ICESIC), Chennai, India, 22–23 November 2024; pp. 157–161. [Google Scholar] [CrossRef]
- Choudhary, G.R.; Kumar, S.; Kumar, K.; Mishra, A.; Catal, C. Empirical analysis of change metrics for software fault prediction. Comput. Electr. Eng. 2018, 67, 15–24. [Google Scholar] [CrossRef]
- Aljamaan, H.; Alazba, A. Software defect prediction using tree-based ensembles. In Proceedings of the 16th ACM International Conference on Predictive Models and Data Analytics in Software Engineering, PROMISE 2020, New York, NY, USA, 8–9 November 2020; pp. 1–10. [Google Scholar] [CrossRef]
- Akbar, A.M.; Herteno, R.; Saputro, S.W.; Faisal, M.R.; Nugroho, R.A. Optimizing Software Defect Prediction Models: Integrating Hybrid Grey Wolf and Particle Swarm Optimization for Enhanced Feature Selection with Popular Gradient Boosting Algorithm. J. Electron. Electromed. Eng. Med. Inform. 2024, 6, 169–181. [Google Scholar] [CrossRef]
- Al-Smadi, Y.; Eshtay, M.; Al-Qerem, A.; Nashwan, S.; Ouda, O.; Abd El-Aziz, A. Reliable prediction of software defects using Shapley interpretable machine learning models. Egypt. Inform. J. 2023, 24, 100386. [Google Scholar] [CrossRef]
- Zahan, M. Prediction of Faults in Embedded Software Using Machine Learning Approaches. In Proceedings of the 2023 International Conference on Information and Communication Technology for Sustainable Development (ICICT4SD), Dhaka, Bangladesh, 21–23 September 2023; pp. 352–356. [Google Scholar] [CrossRef]
- Uddin, M.N.; Li, B.; Mondol, M.N.; Rahman, M.M.; Mia, M.S.; Mondol, E.L. SDP-ML: An Automated Approach of Software Defect Prediction employing Machine Learning Techniques. In Proceedings of the 2021 International Conference on Electronics, Communications and Information Technology (ICECIT), Virtual, 14–16 September 2021; pp. 1–4. [Google Scholar] [CrossRef]
- Gupta, A.; Sharma, S.; Goyal, S.; Rashid, M. Novel XGBoost Tuned Machine Learning Model for Software Bug Prediction. In Proceedings of the 2020 International Conference on Intelligent Engineering and Management (ICIEM), London, UK, 17–19 June 2020; pp. 376–380. [Google Scholar] [CrossRef]
- Graves, T.; Karr, A.; Marron, J.; Siy, H. Predicting fault incidence using software change history. IEEE Trans. Softw. Eng. 2000, 26, 653–661. [Google Scholar] [CrossRef]
- Moser, R.; Pedrycz, W.; Succi, G. A comparative analysis of the efficiency of change metrics and static code attributes for defect prediction. In Proceedings of the 30th International Conference on Software Engineering, ICSE ’08, New York, NY, USA, 10–18 May 2008; pp. 181–190. [Google Scholar] [CrossRef]
- Basili, V.R.; Perricone, B.T. Software errors and complexity: an empirical investigation0. Commun. ACM 1984, 27, 42–52. [Google Scholar] [CrossRef]
- Hassan, A.E. Predicting faults using the complexity of code changes. In Proceedings of the 2009 IEEE 31st International Conference on Software Engineering, Vancouver, BC, Canada, 16–24 May 2009; pp. 78–88. [Google Scholar] [CrossRef]
- Mockus.; Votta. Identifying reasons for software changes using historic databases. In Proceedings of the 2000 International Conference on Software Maintenance, San Jose, CA, USA, 11–14 October 2000; pp. 120–130. [Google Scholar] [CrossRef]
- Quinlan, J.R. Induction of Decision Trees. Mach. Learn. 1986, 1, 81–106. [Google Scholar] [CrossRef]
- Breiman, L. Random Forests. Mach. Learn. 2001, 45, 5–32. [Google Scholar] [CrossRef]
- Chen, T.; Guestrin, C. XGBoost: A Scalable Tree Boosting System. In Proceedings of the 22nd ACM SIGKDD International Conference on Knowledge Discovery and Data Mining, KDD ’16, New York, NY, USA, 13–17 August 2016; pp. 785–794. [Google Scholar] [CrossRef]
- Ke, G.; Meng, Q.; Finley, T.; Wang, T.; Chen, W.; Ma, W.; Ye, Q.; Liu, T.Y. LightGBM: a highly efficient gradient boosting decision tree. In Proceedings of the 31st International Conference on Neural Information Processing Systems, NIPS’17, Red Hook, NY, USA, 4–9 December 2017; pp. 3149–3157. [Google Scholar]
- Raubitzek, S.; Corpaci, L.; Hofer, R.; Mallinger, K. Scaling Exponents of Time Series Data: A Machine Learning Approach. Entropy 2023, 25, 1671. [Google Scholar] [CrossRef] [PubMed]
- Raubitzek, S.; Mallinger, K. On the Applicability of Quantum Machine Learning. Entropy 2023, 25, 992. [Google Scholar] [CrossRef] [PubMed]
- Corpaci, L.; Wagner, M.; Raubitzek, S.; Kampel, L.; Mallinger, K.; Simos, D.E. Estimating Combinatorial t-Way Coverage Based on Matrix Complexity Metrics. In Proceedings of the Testing Software and Systems, Naples, Italy, 31 March–4 April 2025; Menéndez, H.D., Bello-Orgaz, G., Barnard, P., Bautista, J.R., Farahi, A., Dash, S., Han, D., Fortz, S., Rodriguez-Fernandez, V., Eds.; Springer: Cham, Switzerland, 2025; pp. 3–20. [Google Scholar]
- Mallinger, K.; Raubitzek, S.; Neubauer, T.; Lade, S. Potentials and limitations of complexity research for environmental sciences and modern farming applications. Curr. Opin. Environ. Sustain. 2024, 67, 101429. [Google Scholar] [CrossRef]
- Snoek, J.; Larochelle, H.; Adams, R.P. Practical Bayesian Optimization of Machine Learning Algorithms. arXiv 2012. [Google Scholar]
- Head, T.; Kumar, M.; Nahrstaedt, H.; Louppe, G.; Shcherbatyi, I. Scikit-Optimize/Scikit-Optimize (v0.9.0). 2021. Available online: https://scikit-optimize.github.io/stable/ (accessed on 1 July 2025).
- Developers, C. Feature Importance Calculation in CatBoost. 2024. Available online: https://catboost.ai/docs/en/features/feature-importances-calculation (accessed on 10 March 2025).
- Pedregosa, F.; Varoquaux, G.; Gramfort, A.; Michel, V.; Thirion, B.; Grisel, O.; Blondel, M.; Prettenhofer, P.; Weiss, R.; Dubourg, V.; et al. Scikit-learn: Machine Learning in Python. J. Mach. Learn. Res. 2011, 12, 2825–2830. [Google Scholar]
- Parnas, D. Software aging. In Proceedings of the 16th International Conference on Software Engineering, Sorrento, Italy, 16–21 May 1994; pp. 279–287. [Google Scholar] [CrossRef]
- Wang, Y.; Guo, S.; Tan, C. From Code Generation to Software Testing: AI Copilot with Context-Based RAG. IEEE Softw. 2025, 42, 34–42. [Google Scholar] [CrossRef]
| Disclaimer/Publisher’s Note: The statements, opinions and data contained in all publications are solely those of the individual author(s) and contributor(s) and not of MDPI and/or the editor(s). MDPI and/or the editor(s) disclaim responsibility for any injury to people or property resulting from any ideas, methods, instructions or products referred to in the content. |
© 2025 by the authors. Licensee MDPI, Basel, Switzerland. This article is an open access article distributed under the terms and conditions of the Creative Commons Attribution (CC BY) license (https://creativecommons.org/licenses/by/4.0/).

 ,
, 