
Modeling the Effect of Prior Knowledge on Memory Efficiency for the Study of Transfer of Learning: A Spiking Neural Network Approach


Abstract
1. Introduction
1.1. Challenges in Studying the TL
1.2. Cognitive Load
1.3. Learning Programming as a Context for Studying the TL
1.4. Research Question and Contributions
2. Materials and Methods
2.1. Using an EEG to Collect Brain Activity Data
2.2. Spiking Neural Networks and the NeuCube Architecture for EEG Data Analysis
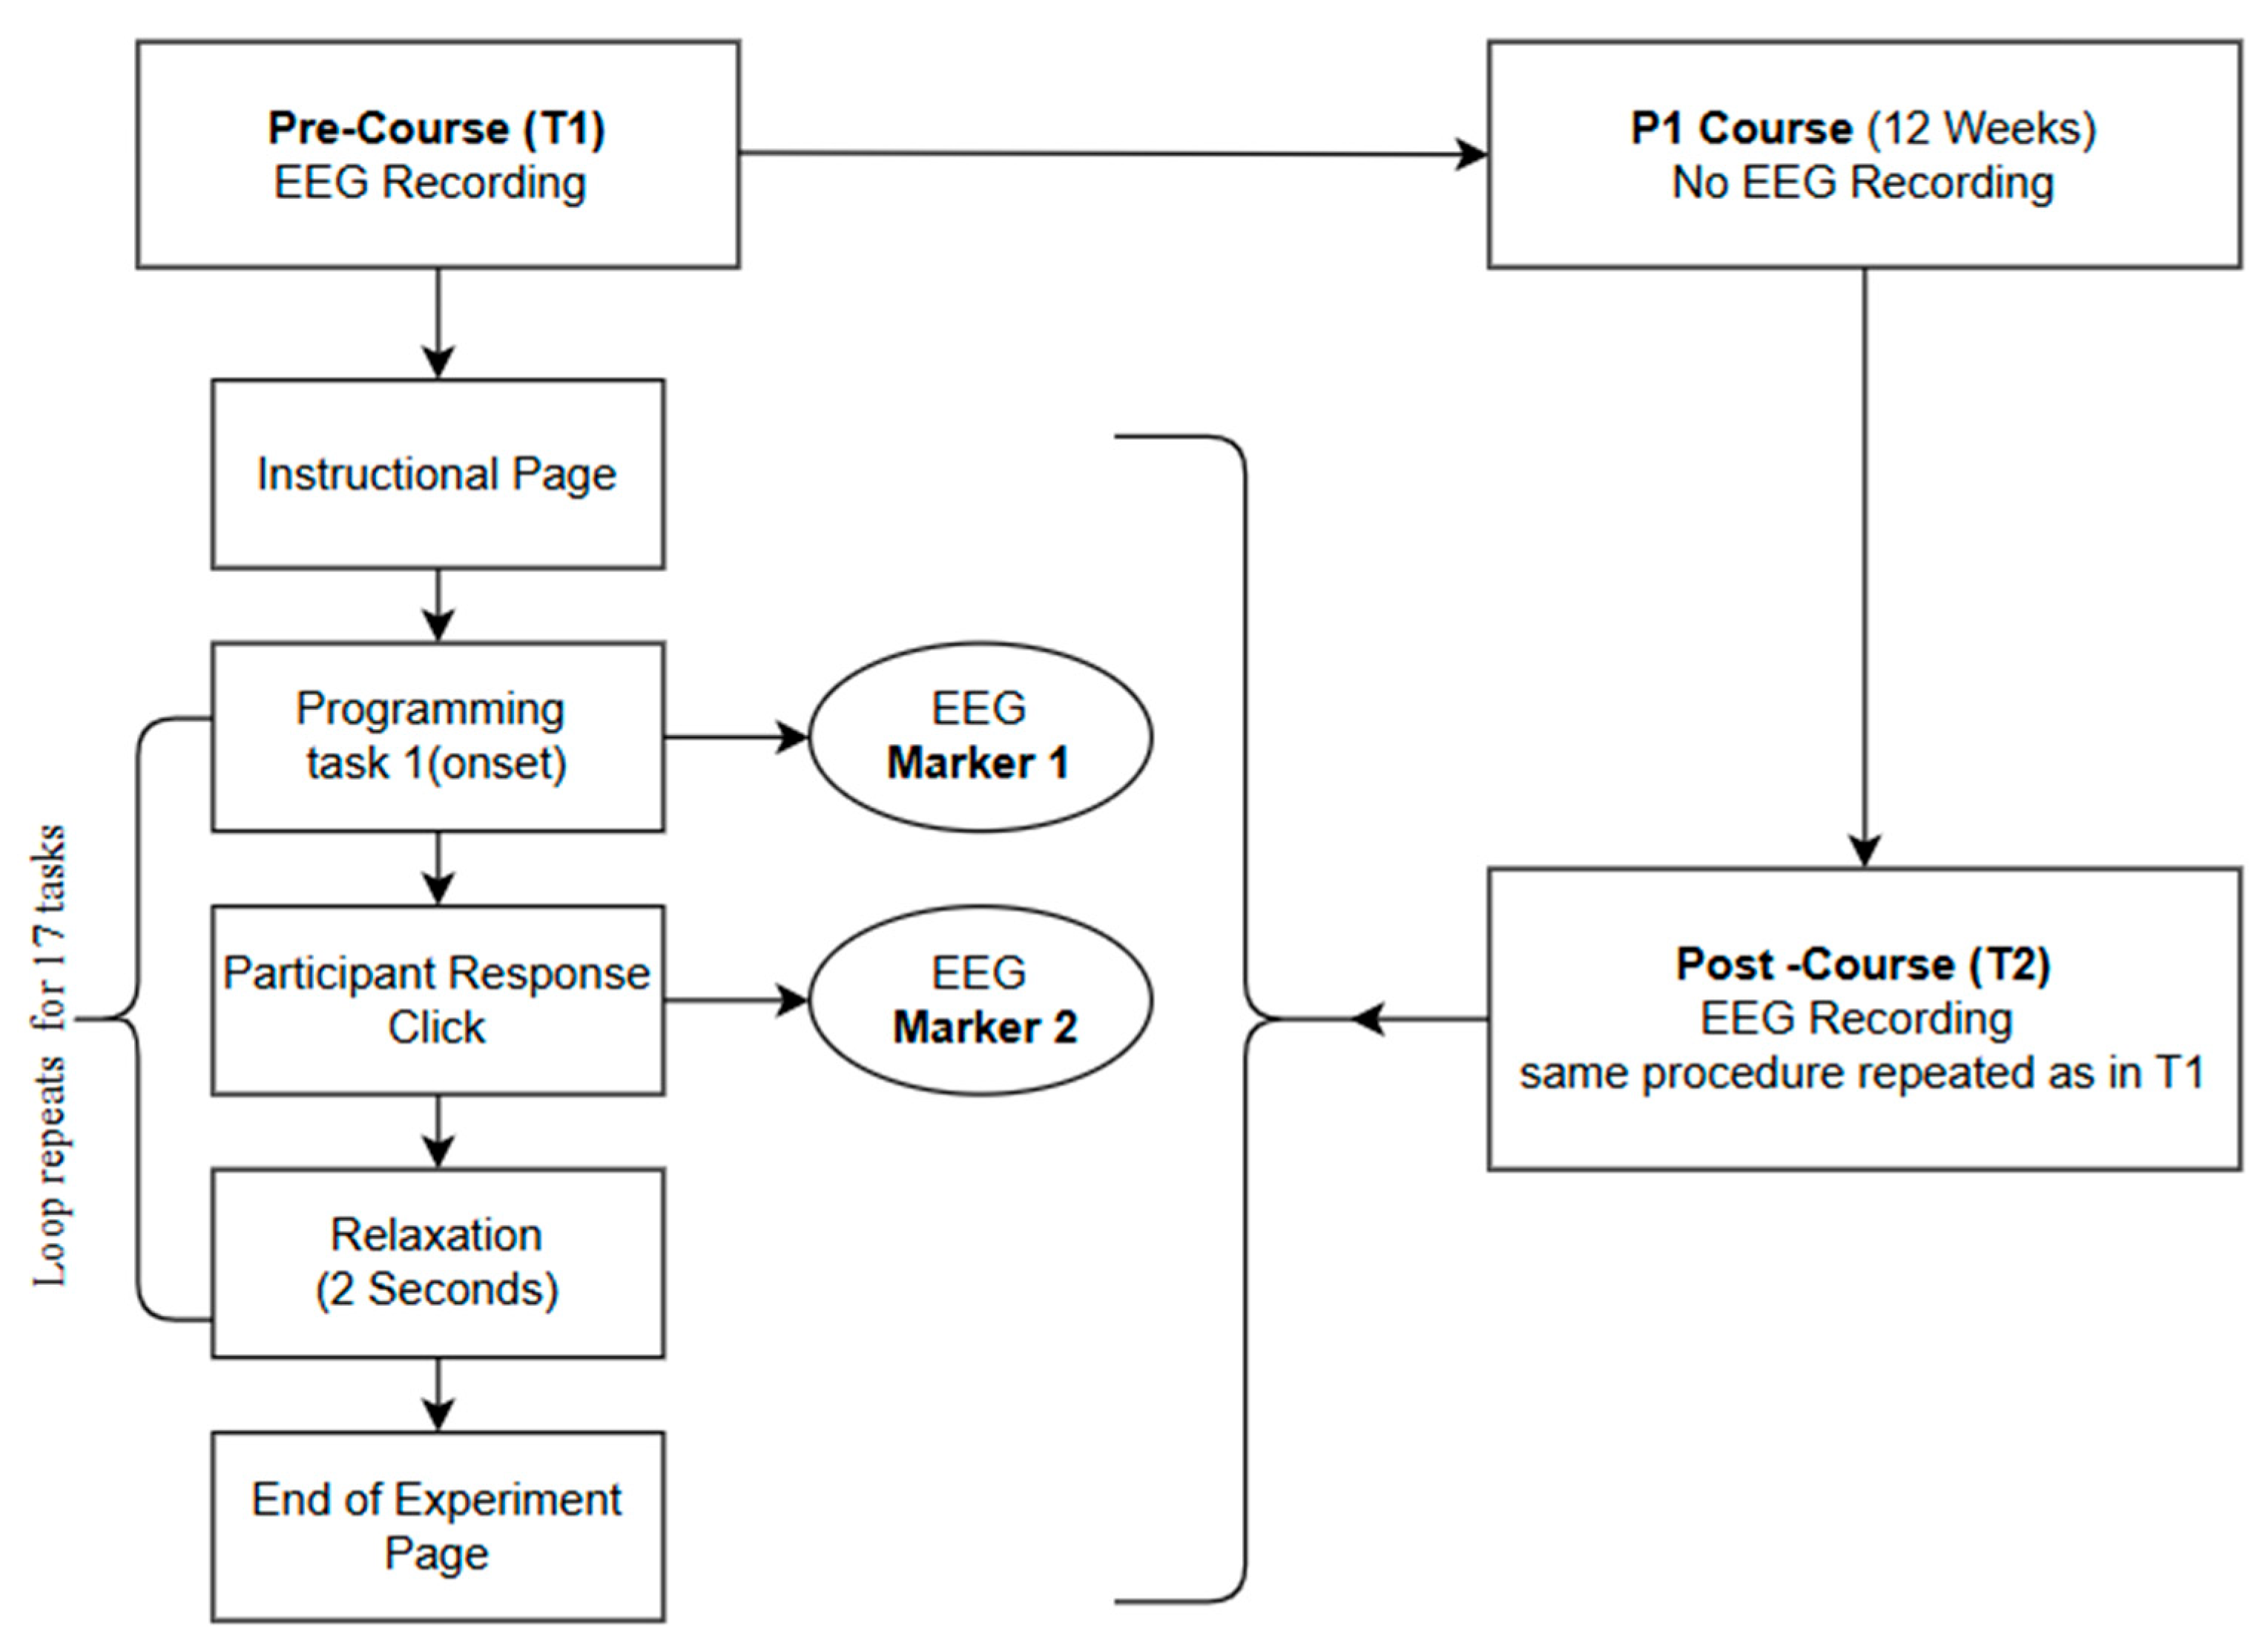
2.3. Experiment Design
2.3.1. Research Participants
2.3.2. Learning Tasks Design and Presentation
2.3.3. Data Collection Method
2.4. Data Pre-Processing and Data Sampling
3. Analysis and Results
3.1. Identifying the Most Active Brain Regions
3.2. Computing Neuronal Activity Patterns at Time Point T1
3.2.1. Change Patterns in the Alpha and Theta Frequency Bands in the Brain’s Left Frontal Lobe (EEG Channel F7) at Time Point T1
3.2.2. Change Patterns in the Alpha and Theta Frequency Bands in the Brain’s Left Temporal Lobe (EEG Channel T7) at Timepoint T1
3.3. Comparing Neuronal Activity Patterns at Time Points T1 and T2
3.3.1. Change Patterns in the Alpha and Theta Wavebands in the Brain’s Left Frontal Lobe (EEG Channel F7)
3.3.2. Change Patterns in the Alpha and Theta Wavebands in the Brain’s Left Temporal Lobe (Channel T7)
4. Discussion and Conclusions
4.1. Prior Knowledge and Cognitive Load
4.1.1. The Effect of Prior Knowledge on Cognitive Load at Time Point T1
4.1.2. The Effect of Prior Knowledge on Cognitive Load at Time Point T2
4.2. Prior Knowledge and Memory Efficiency
4.3. Comparison with Prior Work and Study Contributions
- This study identifies neural patterns in the alpha and theta wavebands that demonstrate the effect of prior knowledge on cognitive load, and validates their use as a framework for the evaluation of cognitive load in the context of studying a programming language.
- This study proposes and validates the use of cognitive load as an indicator of memory efficiency in the context of studying a programming language.
- By integrating advanced computational models with neuroscience-based techniques, this study introduces a replicable framework for investigating the cognitive effects of prior knowledge. The novel SNN methodology for investigating the TL processes using spatio-temporal neural patterns emerging from the EEG data has the potential to be generalized and used in other educational domains.
4.4. Study Limitations and Directions for Further Research
Supplementary Materials
Author Contributions
Funding
Institutional Review Board Statement
Informed Consent Statement
Data Availability Statement
Conflicts of Interest
Abbreviations
| TL | Transfer of Learning |
| TAP | Transfer-Appropriate Processing |
| CLT | Cognitive Load Theory |
| ICL | Intrinsic Cognitive Load |
| ECL | Extraneous Cognitive Load |
| GCL | Germane Cognitive Load |
| EEG | Electroencephalogram |
| ML | Machine Learning |
| fMRI | Functional Magnetic Resonance Imaging |
| ICA | Independent Component Analysis |
| SNNs | Spiking Neural Networks |
| ANNs | Artificial Neural Networks |
| STBD | Spatio-Temporal Brain Data |
| ms | Milliseconds |
| IPK | Insufficient Prior Knowledge |
| SPK | Sufficient Prior Knowledge |
| TBR | Threshold-Based Representation |
| SNNc | Spiking Neural Network Cube |
| STDP | Spike Time Dependent Plasticity |
| deSNN | Dynamic Evolving SNN |
| FIR | High Pass Finite Impulse Response |
Appendix A

| Test | Condition | Group | Waveband | Mean (SD) | t-Value | p-Value | Cohen’s d |
|---|---|---|---|---|---|---|---|
| Test 1 (F7) | Within group (T1) | IPK (n = 14) | Alpha vs. Theta | A: 13.86 (7.03) T: 15.07 (4.60) | 0.44 | 0.66 | 0.12 |
| SPK (n = 12) | Alpha vs. Theta | A: 16.25 (7.92) T: 12.92 (6.55) | −2.85 | 0.016 | 0.82 | ||
| Test 2 (F7) | Between group (T1) | IPK vs. SPK | Alpha | IPK: 13.07 (6.58) SPK: 16.25 (7.92) | −1.53 | 0.14 | −0.42 |
| Theta | IPK: 15.14 (4.67) SPK: 12.92 (6.55) | 2.53 | 0.019 | 0.38 | |||
| Test 5 (F7) | Within group (T2) | IPK (n = 8) | Alpha vs. Theta | A: 16.62 (7.01) T: 9.50 (3.85) | 4.26 | 0.004 | 1.06 |
| SPK (n = 5) | Alpha vs. Theta | A: 16.60 (3.36) T: 10.50 (0.84) | 7.44 | 0.002 | 2.83 | ||
| Test 7 (F7) | Longitudinal (IPK) | T1 vs. T2 | Alpha | T1: 13.00 (7.41) T2: 16.63 (6.81) | −1.60 | 0.153 | 0.57 |
| Theta | T1: 15.63 (4.66) T2: 9.50 (3.87) | 2.32 | 0.053 | 0.82 | |||
| Test 8 (F7) | Longitudinal (SPK) | T1 vs. T2 | Alpha | T1: 15.40 (4.93) T2: 19.60 (3.36) | −1.57 | 0.159 | −1.00 |
| Theta | T1: 14.80 (5.63) T2: 10.40 (0.89) | 1.73 | 0.156 | 1.09 | |||
| Test 9 (T7) | Within group (T1) | IPK(n = 14) | Alpha vs. Theta | A: 16.50 (6.33) T: 13.79 (4.76) | 0.99 | 0.34 | 0.26 |
| SPK(n = 12) | Alpha vs. Theta | A: 15.50 (8.05) T: 13.00 (6.90) | 0.65 | 0.53 | 0.19 | ||
| Test 10 (T7) | Between group | IPK vs SPK | Alpha | IPK:16.50 (6.33) SPK:15.50 (8.05) | 0.35 | 0.73 | 0.14 |
| Theta | IPK: 13.79 (4.76) SPK: 13.00 (6.90) | 0.33 | 0.74 | 0.13 | |||
| Test 11 (T7) | Within group (T2) | IPK(n = 8) | Alpha vs. Theta | A: 19.12 (4.32) T: 8.75 (6.45) | 3.27 | 0.014 | 1.16 |
| SPK(n = 5) | Alpha vs. theta | A:15.60 (4.98) T: 19.60 (5.32) | −1.14 | 0.32 | −0.51 | ||
| Test 11A (T7) | Between groups (T2) | IPK vs. SPK | Alpha | IPK: 19.12 (4.32) SPK: 15.60 (4.98) | 1.30 | 0.23 | 0.77 |
| Theta | IPK: 8.75(6.54) SPK: 19.50(5.32) | −3.27 | 0.008 | −1.77 | |||
| Test 12 (T7) | Longitudinal (IPK) | T1 vs. T2 | Alpha | T1: 14.88 (9.40) T2: 19.12 (4.32) | 1.16 | 0.27 | 0.58 |
| Theta | T1:14.12 T2: 8.75 | −1.77 | 0.10 | −0.88 | |||
| Test 13 (T7) | Longitudinal (SPK) | T1 vs. T2 | Alpha | T1: 14.20 (11.82) T2: 15.60 (4.98) | 0.24 | 0.82 | 0.15 |
| Theta | T1: 14.80 (8.64) T2: 19.60 (5.32) | 1.06 | 0.33 | 0.67 |
References
- Gardner, H. The Disciplined Mind: What All Students Should Understand; Simon & Schuster: New York, NY, USA, 1999. [Google Scholar]
- Detterman, D.K. The case for the prosecution: Transfer as an epiphenomenon. In Transfer on Trial: Intelligence, Cognition, and Instruction; Ablex Publishing: Westport, CT, USA, 1993; pp. 1–24. [Google Scholar]
- Langbroek, S.; Duchatelet, D.; Joosten-Ten Brinke, D.; Camp, G. Enhancing teachers’ instruction on how to study: An exploration of the effectiveness of learning strategies for particular secondary school subjects. Proc. Front. Educ. 2024, 9, 1340120. Available online: https://www.frontiersin.org/journals/education/articles/10.3389/feduc.2024.1340120/full (accessed on 23 June 2025). [CrossRef]
- Pellegrino, J.W.; Hilton, M.L. Education for Life and Work: Developing Transferable Knowledge and Skills in the 21st Century; The National Academies Press: Washington, DC, USA, 2012. [Google Scholar]
- Woltz, D.J.; Gardner, M.K.; Gyll, S.P. The role of attention processes in near transfer of cognitive skills. Learn. Individ. Differ. 2000, 12, 209–251. [Google Scholar] [CrossRef]
- Perkins, D.N.; Salomon, G. Transfer of learning. In International Encyclopedia of Education; Husten, T., Ed.; Elsevier: Amsterdam, The Netherlands, 1992; Volume 2. [Google Scholar]
- Sala, G.; Aksayli, N.D.; Tatlidil, K.S.; Tatsumi, T.; Gondo, Y.; Gobet, F. Near and far transfer in cognitive training: A second-order meta-analysis. Collabra Psychol. 2019, 5, 18. [Google Scholar] [CrossRef]
- Woodworth, R.S.; Thorndike, E.L. The influence of improvement in one mental function upon the efficiency of other functions. (I). Psychol. Rev. 1901, 8, 247. [Google Scholar] [CrossRef]
- Sala, G.; Gobet, F. Does far transfer exist? Negative evidence from chess, music, and working memory training. Curr. Dir. Psychol. Sci. 2017, 26, 515–520. [Google Scholar] [CrossRef] [PubMed]
- Hajian, S. The Benefits and Challenges of Analogical Comparison in Learning and Transfer: Can Self-Explanation Scaffold Analogy in the Process of Learning? SFU Educ. Rev. 2018, 11, 61–74. [Google Scholar] [CrossRef]
- Gick, M.; Holyoak, K. Analogical problem solving. Cogn. Psychol. 1980, 12, 306–355. [Google Scholar] [CrossRef]
- Spiro, R.J. Cognitive Flexibility Theory: Advanced Knowledge Acquisition in Ill-Structured Domains; Technical Report No. 441; University of Illinois at Urbana-Champaign: Champaign, IL, USA, 1988. [Google Scholar]
- Salden, R.J.; Koedinger, K.R.; Renkl, A.; Aleven, V.; McLaren, B.M. Accounting for beneficial effects of worked examples in tutored problem solving. Educ. Psychol. Rev. 2010, 22, 379–392. [Google Scholar] [CrossRef]
- Forrester, S.H. Transfer of Learning and Music Understanding: A Review of Literature. Update Appl. Res. Music Educ. 2018, 37, 30–35. [Google Scholar] [CrossRef]
- Corinne, B.; Paula, A.C. Learning Transfer: The Missing Link to Learning among School Leaders in Burkina Faso and Ghana. Front. Educ. 2018, 2, 69. [Google Scholar] [CrossRef]
- Siegmund, J.; Kästner, C.; Apel, S.; Parnin, C.; Bethmann, A.; Leich, T.; Saake, G.; Brechmann, A. Understanding understanding source code with functional magnetic resonance imaging. In Proceedings of the 36th International Conference on Software Engineering, Hyderabad, India, 31 May–7 June 2014; pp. 378–389. [Google Scholar]
- Crk, I.; Kluthe, T.; Stefik, A. Understanding programming expertise: An empirical study of phasic brain wave changes. ACM Trans. Comput. Hum. Interact. (TOCHI) 2015, 23, 2. [Google Scholar] [CrossRef]
- Padiri, G.R. Using EEG to Assess Programming Expertise Against Self-Reported Data; Iowa State University: Ames, IA, USA, 2018. [Google Scholar]
- Lee, S.; Matteson, A.; Hooshyar, D.; Kim, S.; Jung, J.; Nam, G.; Lim, H. Comparing Programming Language Comprehension between Novice and Expert Programmers Using EEG Analysis. In Proceedings of the 2016 IEEE 16th International Conference on Bioinformatics and Bioengineering (BIBE), Taichung, Taiwan, 31 October–2 November 2016; pp. 350–355. [Google Scholar]
- Mulligan, N.W.; Lozito, J.P. An asymmetry between memory encoding and retrieval: Revelation, generation, and transfer-appropriate processing. Psychol. Sci. 2006, 17, 7–11. [Google Scholar] [CrossRef]
- Morris, C.D.; Bransford, J.D.; Franks, J.J. Levels of processing versus transfer appropriate processing. J. Verbal Learn. Verbal Behav. 1977, 16, 519–533. [Google Scholar] [CrossRef]
- Sweller, J. Cognitive load theory, learning difficulty, and instructional design. Learn. Instr. 1994, 4, 295–312. [Google Scholar] [CrossRef]
- De Jong, T. Cognitive load theory, educational research, and instructional design: Some food for thought. Instr. Sci. 2010, 38, 105–134. [Google Scholar] [CrossRef]
- Jordan, J.; Wagner, J.; Manthey, D.E.; Wolff, M.; Santen, S.; Cico, S.J. Optimizing lectures from a cognitive load perspective. AEM Educ. Train. 2020, 4, 306–312. [Google Scholar] [CrossRef]
- Morrison, B.B.; Dorn, B.; Guzdial, M. Measuring cognitive load in introductory CS: Adaptation of an instrument. In Proceedings of the 10th Annual Conference on International Computing Education Research, Glasgow, UK, 11–13 August 2014; pp. 131–138. [Google Scholar]
- Mills, C.; Fridman, I.; Soussou, W.; Waghray, D.; Olney, A.M.; D’Mello, S.K. Put your thinking cap on: Detecting cognitive load using EEG during learning. In Proceedings of the Seventh International Learning Analytics & Knowledge Conference, Vancouver, BC, Canada, 13–17 March 2017; pp. 80–89. [Google Scholar]
- Abrantes, A.; Comitz, E.; Mosaly, P.; Mazur, L. Classification of eeg features for prediction of working memory load. In Advances in The Human Side of Service Engineering: Proceedings of the AHFE 2016 International Conference on the Human Side of Service Engineering, Orlando, FL, USA, 27–31 July 2016; Walt Disney World®: Orlando, FL, USA, 2017; pp. 115–126. [Google Scholar]
- Poikonen, H.; Zaluska, T.; Wang, X.; Magno, M.; Kapur, M. Nonlinear and machine learning analyses on high-density eeg data of math experts and novices. Sci. Rep. 2023, 13, 8012. [Google Scholar] [CrossRef]
- Cheah, C.S. Factors contributing to the difficulties in teaching and learning of computer programming: A literature review. Contemp. Educ. Technol. 2020, 12, ep272. [Google Scholar] [CrossRef]
- Hsiao, T.-C.; Chuang, Y.-H.; Chen, T.-L.; Chang, C.-Y.; Chen, C.-C. Students’ Performances in Computer Programming of Higher Education for Sustainable Development: The Effects of a Peer-Evaluation System. Front. Psychol. 2022, 13, 911417. [Google Scholar] [CrossRef]
- Bingöl, B. The Importance of Staying Current with Industry Trends. Sertifier Blog, 1 May 2024. Available online: https://sertifier.com/blog/staying-current-with-industry-trends/ (accessed on 31 August 2024).
- Simonsmeier, B.A.; Flaig, M.; Deiglmayr, A.; Schalk, L.; Schneider, M. Domain-specific prior knowledge and learning: A meta-analysis. Educ. Psychol. 2022, 57, 31–54. [Google Scholar] [CrossRef]
- Tricot, A.; Sweller, J. Domain-specific knowledge and why teaching generic skills does not work. Educ. Psychol. Rev. 2014, 26, 265–283. [Google Scholar] [CrossRef]
- Owens, M.T.; Tanner, K.D. Teaching as brain changing: Exploring connections between neuroscience and innovative teaching. CBE Life Sci. Educ. 2017, 16, fe2. [Google Scholar] [CrossRef]
- Park, D.C.; Bischof, G.N. The aging mind: Neuroplasticity in response to cognitive training. Dialogues Clin. Neurosci. 2013, 15, 109–119. [Google Scholar] [CrossRef] [PubMed]
- Mateos-Aparicio, P.; Rodríguez-Moreno, A. The Impact of Studying Brain Plasticity. Front. Cell. Neurosci. 2019, 13, 66. [Google Scholar] [CrossRef]
- Mansvelder, H.D.; Verhoog, M.B.; Goriounova, N.A. Synaptic plasticity in human cortical circuits: Cellular mechanisms of learning and memory in the human brain? Curr. Opin. Neurobiol. 2019, 54, 186–193. [Google Scholar] [CrossRef] [PubMed]
- Saeidi, M.; Karwowski, W.; Farahani, F.V.; Fiok, K.; Taiar, R.; Hancock, P.A.; Al-Juaid, A. Neural decoding of EEG signals with machine learning: A systematic review. Brain Sci. 2021, 11, 1525. [Google Scholar] [CrossRef]
- Yen, C.; Lin, C.-L.; Chiang, M.-C. Exploring the frontiers of neuroimaging: A review of recent advances in understanding brain functioning and disorders. Life 2023, 13, 1472. [Google Scholar] [CrossRef]
- Douglas, P.K.; Lau, E.; Anderson, A.; Head, A.; Kerr, W.; Wollner, M.; Moyer, D.; Li, W.; Durnhofer, M.; Bramen, J. Single trial decoding of belief decision making from EEG and fMRI data using independent components features. Front. Hum. Neurosci. 2013, 7, 392. [Google Scholar] [CrossRef]
- Hanslmayr, S.; Staudigl, T.; Fellner, M.-C. Oscillatory power decreases and long-term memory: The information via desynchronization hypothesis. Front. Hum. Neurosci. 2012, 6, 74. [Google Scholar] [CrossRef]
- Daly, I.; Bourgaize, J.; Vernitski, A. Mathematical mindsets increase student motivation: Evidence from the EEG. Trends Neurosci. Educ. 2019, 15, 18–28. [Google Scholar] [CrossRef] [PubMed]
- Friedman, N.; Fekete, T.; Gal, Y.A.K.; Shriki, O. EEG-based Prediction of Cognitive Load in Intelligence Tests. Front. Hum. Neurosci. 2019, 13, 191. [Google Scholar] [CrossRef] [PubMed]
- Conrad, C.D.; Bliemel, M. Psychophysiological Measures of Cognitive Absorption and Cognitive Load in E-Learning Applications. 2016. Available online: https://colinconrad.com/wp-content/uploads/2019/10/2016_Conrad-Psychophysiological_Measures.pdf (accessed on 30 October 2023).
- Zarjam, P.; Epps, J.; Chen, F. Characterizing working memory load using EEG delta activity. In Proceedings of the 19th European Signal Processing Conference, Barcelona, Spain, 29 August–2 September 2011; pp. 1554–1558. [Google Scholar]
- Klimesch, W. EEG alpha and theta oscillations reflect cognitive and memory performance: A review and analysis. Brain Res. Rev. 1999, 29, 169–195. [Google Scholar] [CrossRef] [PubMed]
- Dora, S.; Kasabov, N. Spiking neural networks for computational intelligence: An overview. Big Data Cogn. Comput. 2021, 5, 67. [Google Scholar] [CrossRef]
- Ponulak, F.; Kasinski, A. Introduction to spiking neural networks: Information processing, learning and applications. Acta Neurobiol. Exp. 2011, 71, 409–433. [Google Scholar] [CrossRef]
- Kasabov, N.; Dhoble, K.; Nuntalid, N.; Indiveri, G. Dynamic evolving spiking neural networks for on-line spatio- and spectro-temporal pattern recognition. Neural Netw. 2013, 41, 188–201. [Google Scholar] [CrossRef]
- Tavanaei, A.; Ghodrati, M.; Kheradpisheh, S.R.; Masquelier, T.; Maida, A. Deep learning in spiking neural networks. Neural Netw. 2019, 111, 47–63. [Google Scholar] [CrossRef]
- Kasabov, N.K. NeuCube: A spiking neural network architecture for mapping, learning and understanding of spatio-temporal brain data. Neural Netw. 2014, 52, 62–76. [Google Scholar] [CrossRef]
- Kasabov, N.K.; Tan, Y.; Doborjeh, M.; Tu, E.; Yang, J.; Goh, W.; Lee, J. Transfer Learning of Fuzzy Spatio-Temporal Rules in a Brain-Inspired Spiking Neural Network Architecture: A Case Study on Spatio-Temporal Brain Data. IEEE Trans. Fuzzy Syst. 2023, 31, 4542–4552. [Google Scholar] [CrossRef]
- Fard, M.H.; Petrova, K.; Kasabov, N.; Wang, G.Y. Studying transfer of learning using a brain-inspired spiking neural network in the context of learning a new programming language. In Proceedings of the 2021 IEEE Asia-Pacific Conference on Computer Science and Data Engineering (CSDE), Brisbane, Australia, 8–10 December 2021; pp. 1–6. [Google Scholar]
- Gholami, M.; Kasabov, N. Dynamic 3D Clustering of Spatio-temporal Brain Data in the NeuCube Spiking Neural Network Architecture on a Case Study of fMRI and EEG Data; Springer: Berlin/Heidelberg, Germany, 2015. [Google Scholar]
- Malenka, R.C.; Bear, M.F. LTP and LTD: An embarrassment of riches. Neuron 2004, 44, 521. [Google Scholar] [CrossRef]
- Kasabov, N.K. Time-Space, Spiking Neural Networks and Brain-Inspired Artificial Intelligence; Springer: Berlin/Heidelberg, Germany, 2019. [Google Scholar]
- AUT Knowledge Engineering & Discovery Research Innovation. NeuCube. Available online: https://kedri.aut.ac.nz/neucube (accessed on 30 May 2025).
- Cohen, M.X. Analyzing Neural Time Series Data: Theory and Practice; The MIT Press: Cambridge, MA, USA, 2014. [Google Scholar]
- OpenSesame/OpenSesame Documentation. Available online: https://osdoc.cogsci.nl/ (accessed on 10 March 2025).
- Emotiv. Emotiv Epoch X [14-Channel EEG Device]. Available online: https://www.emotiv.com/epoc-x/ (accessed on 23 December 2024).
- Capecci, E.; Kasabov, N.; Wang, G.Y. Analysis of connectivity in NeuCube spiking neural network models trained on EEG data for the understanding of functional changes in the brain: A case study on opiate dependence treatment. Neural Netw. 2015, 68, 62–77. [Google Scholar] [CrossRef] [PubMed]
- Doborjeh, M.G.; Wang, G.Y.; Kasabov, N.K.; Kydd, R.; Russell, B. A spiking neural network methodology and system for learning and comparative analysis of EEG data from healthy versus addiction treated versus addiction not treated subjects. IEEE Trans. Biomed. Eng. 2015, 63, 1830–1841. [Google Scholar] [CrossRef] [PubMed]
- Crinion, J.T.; Lambon-Ralph, M.A.; Warburton, E.A.; Howard, D.; Wise, R.J. Temporal lobe regions engaged during normal speech comprehension. Brain 2003, 126, 1193–1201. [Google Scholar] [CrossRef] [PubMed]
- Klimesch, W.; Doppelmayr, M.; Russegger, H.; Pachinger, T. Theta band power in the human scalp EEG and the encoding of new information. Neuroreport 1996, 7, 1235–1240. [Google Scholar] [CrossRef]
- Wang, L.; Schoot, L.; Brothers, T.; Alexander, E.; Warnke, L.; Kim, M.; Khan, S.; Hämäläinen, M.; Kuperberg, G.R. Predictive coding across the left fronto-temporal hierarchy during language comprehension. Cereb. Cortex 2023, 33, 4478–4497. [Google Scholar] [CrossRef]
- Zhou, Y.; Huang, S.; Xu, Z.; Wang, P.; Wu, X.; Zhang, D. Cognitive workload recognition using EEG signals and machine learning: A review. IEEE Trans. Cogn. Dev. Syst. 2021, 14, 799–818. [Google Scholar] [CrossRef]
- Hickok, G.; Poeppel, D. The cortical organization of speech processing. Nat. Rev. Neurosci. 2007, 8, 393–402. [Google Scholar] [CrossRef]
- Crk, I.; Kluthe, T. Toward using alpha and theta brain waves to quantify programmer expertise. In Proceedings of the 36th Annual International Conference of the IEEE Engineering in Medicine and Biology Society, Chicago, IL, USA, 26–30 August 2014; pp. 5373–5376. [Google Scholar]
- Min, B.-K.; Park, H.-J. Task-related modulation of anterior theta and posterior alpha EEG reflects top-down preparation. BMC Neurosci. 2010, 11, 79. [Google Scholar] [CrossRef]
- Attar, E.T. Review of electroencephalography signals approaches for mental stress assessment. Neurosci. J. 2022, 27, 209–215. [Google Scholar] [CrossRef]
- Van Diepen, R.M.; Foxe, J.J.; Mazaheri, A. The functional role of alpha-band activity in attentional processing: The current zeitgeist and future outlook. Curr. Opin. Psychol. 2019, 29, 229–238. [Google Scholar] [CrossRef]
- Kim, H. Neural activity during working memory encoding, maintenance, and retrieval: A network-based model and meta-analysis. Hum. Brain Mapp. 2019, 40, 4912–4933. [Google Scholar] [CrossRef] [PubMed]
- Sarnthein, J.; Petsche, H.; Rappelsberger, P.; Shaw, G.L.; von Stein, A. Synchronization between prefrontal and posterior association cortex during human working memory. Proc. Natl. Acad. Sci. USA 1998, 95, 7092–7096. [Google Scholar] [CrossRef] [PubMed]
- Klimesch, W.; Doppelmayr, M.; Stadler, W.; Pöllhuber, D.; Sauseng, P.; Röhm, D. Episodic retrieval is reflected by a process specific increase in human electroencephalographic theta activity. Neurosci. Lett. 2001, 302, 49–52. [Google Scholar] [CrossRef]
- Sauseng, P.; Klimesch, W.; Gruber, W.R.; Birbaumer, N. Cross-frequency phase synchronization: A brain mechanism of memory matching and attention. Neuroimage 2008, 40, 308–317. [Google Scholar] [CrossRef] [PubMed]
- Cooper, N.R.; Croft, R.J.; Dominey, S.J.; Burgess, A.P.; Gruzelier, J.H. Paradox lost? Exploring the role of alpha oscillations during externally vs. internally directed attention and the implications for idling and inhibition hypotheses. Int. J. Psychophysiol. 2003, 47, 65–74. [Google Scholar] [CrossRef]
- Payne, L.; Guillory, S.; Sekuler, R. Attention-modulated alpha-band oscillations protect against intrusion of irrelevant information. J. Cogn. Neurosci. 2013, 25, 1463–1476. [Google Scholar] [CrossRef]
- Wendiggensen, P.; Prochnow, A.; Pscherer, C.; Münchau, A.; Frings, C.; Beste, C. Interplay between alpha and theta band activity enables management of perception-action representations for goal-directed behavior. Commun. Biol. 2023, 6, 494. [Google Scholar] [CrossRef]
- Borgheai, S.B.; Deligani, R.; McLinden, J.; Abtahi, M.; Ostadabbas, S.; Mankodiya, K.; Shahriari, Y. Multimodal evaluation of mental workload using a hybrid EEG-fNIRS brain-computer interface system. In Proceedings of the 2019 9th International IEEE/EMBS Conference on Neural Engineering (NER), San Francisco, CA, USA, 20–23 March 2019; pp. 973–976. [Google Scholar]
- Chen, F.; Zhou, J.; Wang, Y.; Yu, K.; Arshad, S.Z.; Khawaji, A.; Conway, D. Robust Multimodal Cognitive Load Measurement; Springer Publishing Company, Incorporated: Berlin/Heidelberg, Germany, 2016. [Google Scholar]


| Step | Description |
|---|---|
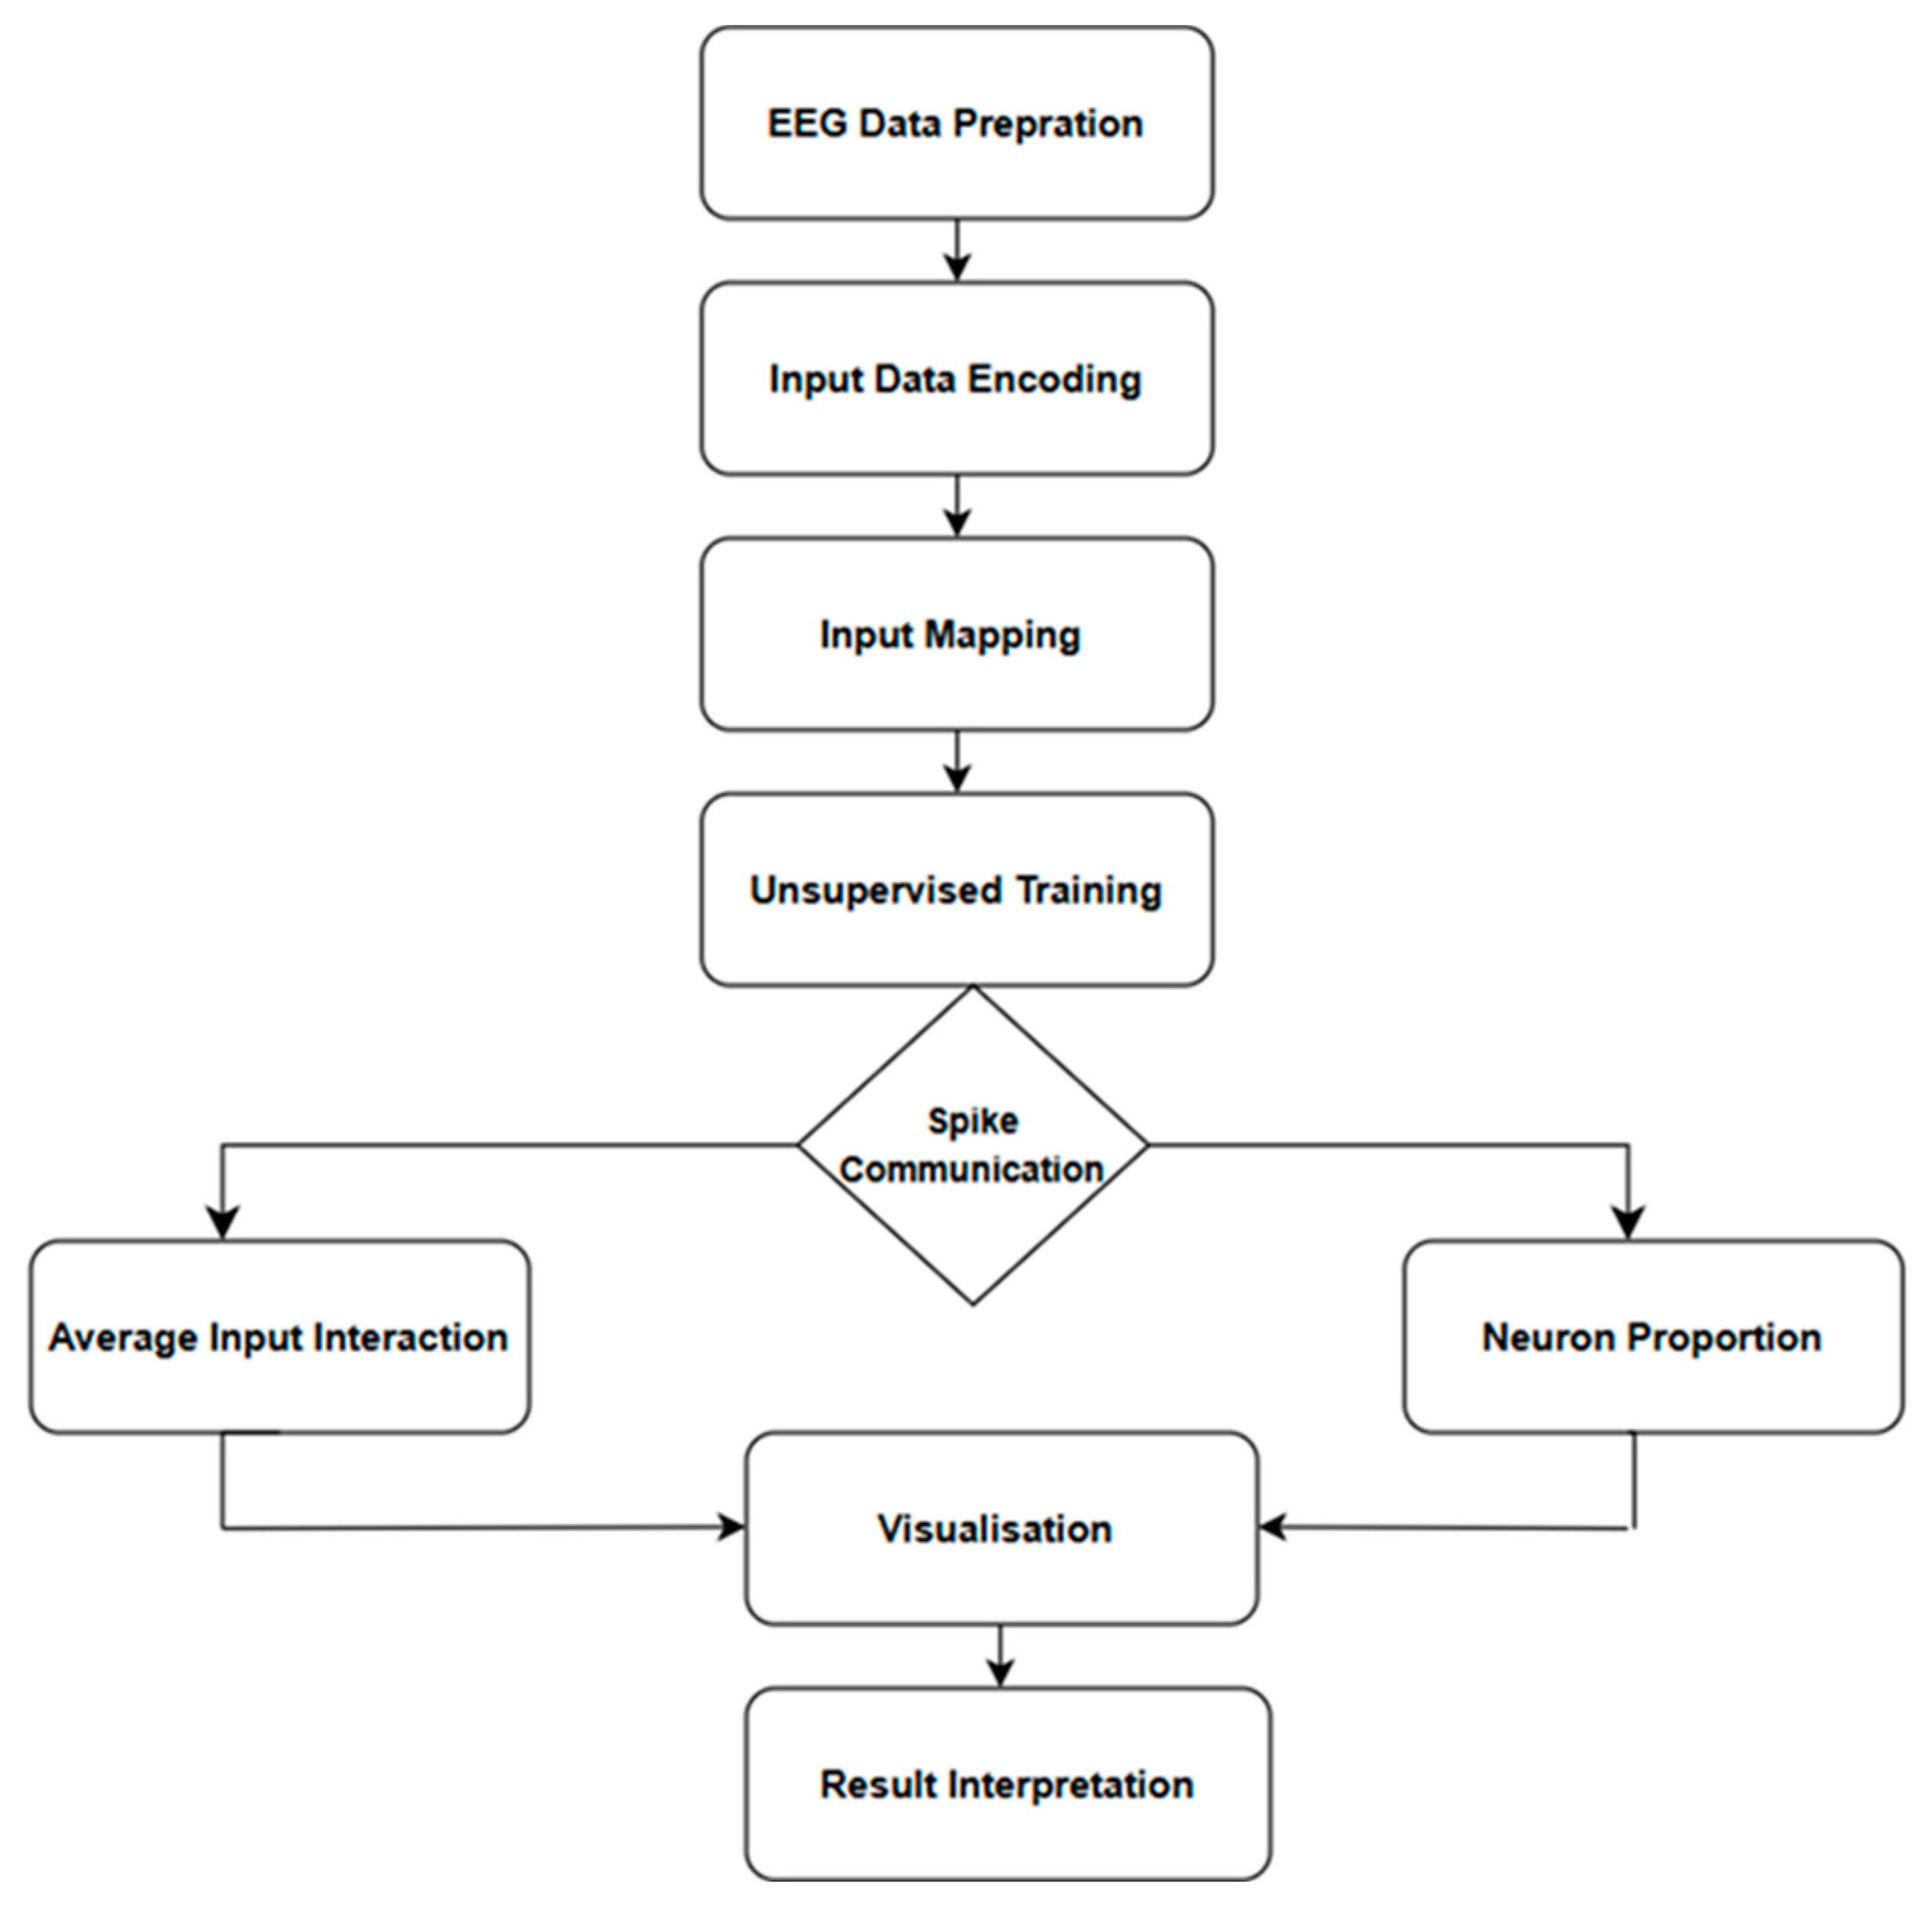
| 1 | Convert continuous EEG data into discrete spike trains using the TBR encoding method. |
| 2 | Map each of the 14 EEG channels to the corresponding input neurons in the SNNc 3D small-world architecture using Talairach template. |
| 3 | Train the SNNc using the STDP learning rule (unsupervised training). |
| 4 | Perform spike communication analysis by calculating the average input interaction for 14 EEG channels. |
| 5 | Visualize spike activity patterns and identify the most active brain regions during the experimental task. |
| 6 | Interpret the results; thicker lines represent higher interaction and spike communication among channels. |
| 7 | Use the identified channels to inform subsequent analyses. |
| Step | Description |
|---|---|
| 1 | Extract power spectrum from channels identified in previous analysis. |
| 2 | Convert continuous EEG data into discrete spike trains using the TBR encoding method. |
| 3.1–3.5 | For each identified channel:
|
| IPK Group Neuron Proportion (in %) | SPK Group Neuron Proportion (in %) | ||||
|---|---|---|---|---|---|
| Participant Dataset ID | Theta | Alpha | Participant Datasets ID | Theta | Alpha |
| 2 | 23 | 5 | 18 | 18 | 8 |
| 3 | 19 | 10 | 13 | 12 | 24 |
| 19 | 13 | 28 | 4 | 1 | 23 |
| 9 | 14 | 13 | 25 | 12 | 17 |
| 11 | 10 | 16 | 7 | 9 | 17 |
| 17 | 19 | 11 | 20 | 18 | 10 |
| 6 | 10 | 16 | 14 | 13 | 24 |
| 8 | 12 | 22 | 16 | 5 | 16 |
| 23 | 17 | 10 | 26 | 3 | 17 |
| 15 | 12 | 23 | 12 | 11 | 24 |
| 1 | 10 | 6 | 10 | 7 | 17 |
| 24 | 12 | 18 | 22 | 12 | 14 |
| 21 | 23 | 11 | |||
| 5 | 17 | 5 | |||
| Average | 15.07 | 13.85 | Average | 10.08 | 17.58 |
| IPK Group Neuron Proportion (in %) | SPK Group Neuron Proportion (in %) | ||||
|---|---|---|---|---|---|
| Participant Dataset ID | Theta | Alpha | Participant Dataset ID | Theta | Alpha |
| 2 | 19 | 7 | 18 | 17 | 12 |
| 3 | 10 | 17 | 13 | 1 | 24 |
| 19 | 12 | 25 | 4 | 15 | 10 |
| 9 | 7 | 19 | 25 | 13 | 29 |
| 11 | 12 | 22 | 7 | 16 | 7 |
| 17 | 9 | 17 | 20 | 22 | 1 |
| 6 | 12 | 22 | 14 | 13 | 24 |
| 8 | 11 | 23 | 16 | 1 | 20 |
| 23 | 14 | 11 | 26 | 8 | 18 |
| 15 | 13 | 23 | 12 | 23 | 14 |
| 1 | 23 | 10 | 10 | 13 | 17 |
| 24 | 12 | 18 | 22 | 14 | 10 |
| 21 | 22 | 10 | |||
| 5 | 17 | 7 | |||
| Average | 13.78 | 16.50 | Average | 13.00 | 15.50 |
| Dataset ID | Participant Scores | Neuron Proportion at Time Point T1 | Neuron Proportion at Time Point T2 | |||
|---|---|---|---|---|---|---|
| T1 | T2 | Theta | Alpha | Theta | Alpha | |
| 2 | 6 | 11 | 23 | 5 | 4 | 8 |
| 3 | 4 | 11 | 19 | 10 | 12 | 24 |
| 19 | 5 | 8 | 13 | 28 | 12 | 24 |
| 9 | 3 | 8 | 14 | 13 | 12 | 24 |
| 11 | 6 | 14 | 10 | 16 | 6 | 13 |
| 17 | 7 | 8 | 19 | 11 | 9 | 17 |
| 6 | 7 | 10 | 10 | 16 | 6 | 16 |
| 13 | 9 | 10 | 12 | 22 | 11 | 24 |
| 25 | 9 | 8 | 12 | 17 | 11 | 17 |
| 7 | 11 | 10 | 9 | 17 | 10 | 16 |
| 20 | 8 | 12 | 18 | 10 | 11 | 22 |
| 21 | 8 | 10 | 23 | 11 | 9 | 19 |
| 5 | 7 | 11 | 17 | 5 | 15 | 7 |
| Dataset ID | Participants Scores | Neuron Proportion at Time Point T1 | Neuron Proportion Time Point T2 | |||
|---|---|---|---|---|---|---|
| T1 | T2 | Theta | Alpha | Theta | Alpha | |
| 2 | 6 | 11 | 19 | 7 | 1 | 20 |
| 3 | 4 | 11 | 24 | 1 | 13 | 10 |
| 19 | 5 | 8 | 12 | 25 | 9 | 20 |
| 9 | 3 | 8 | 11 | 24 | 10 | 22 |
| 11 | 6 | 14 | 12 | 22 | 12 | 24 |
| 17 | 7 | 18 | 6 | 11 | 1 | 22 |
| 6 | 7 | 10 | 12 | 22 | 20 | 17 |
| 13 | 9 | 10 | 1 | 24 | 24 | 16 |
| 25 | 9 | 8 | 13 | 29 | 23 | 16 |
| 7 | 11 | 10 | 16 | 7 | 16 | 8 |
| 20 | 8 | 12 | 22 | 1 | 12 | 22 |
| 21 | 8 | 10 | 22 | 10 | 23 | 16 |
| 5 | 7 | 11 | 17 | 7 | 4 | 18 |
Disclaimer/Publisher’s Note: The statements, opinions and data contained in all publications are solely those of the individual author(s) and contributor(s) and not of MDPI and/or the editor(s). MDPI and/or the editor(s) disclaim responsibility for any injury to people or property resulting from any ideas, methods, instructions or products referred to in the content. |
© 2025 by the authors. Licensee MDPI, Basel, Switzerland. This article is an open access article distributed under the terms and conditions of the Creative Commons Attribution (CC BY) license (https://creativecommons.org/licenses/by/4.0/).
Share and Cite
Hafezi Fard, M.; Petrova, K.; Kasabov, N.K.; Wang, G.Y. Modeling the Effect of Prior Knowledge on Memory Efficiency for the Study of Transfer of Learning: A Spiking Neural Network Approach. Big Data Cogn. Comput. 2025, 9, 173. https://doi.org/10.3390/bdcc9070173
Hafezi Fard M, Petrova K, Kasabov NK, Wang GY. Modeling the Effect of Prior Knowledge on Memory Efficiency for the Study of Transfer of Learning: A Spiking Neural Network Approach. Big Data and Cognitive Computing. 2025; 9(7):173. https://doi.org/10.3390/bdcc9070173
Chicago/Turabian StyleHafezi Fard, Mojgan, Krassie Petrova, Nikola Kirilov Kasabov, and Grace Y. Wang. 2025. "Modeling the Effect of Prior Knowledge on Memory Efficiency for the Study of Transfer of Learning: A Spiking Neural Network Approach" Big Data and Cognitive Computing 9, no. 7: 173. https://doi.org/10.3390/bdcc9070173
APA StyleHafezi Fard, M., Petrova, K., Kasabov, N. K., & Wang, G. Y. (2025). Modeling the Effect of Prior Knowledge on Memory Efficiency for the Study of Transfer of Learning: A Spiking Neural Network Approach. Big Data and Cognitive Computing, 9(7), 173. https://doi.org/10.3390/bdcc9070173