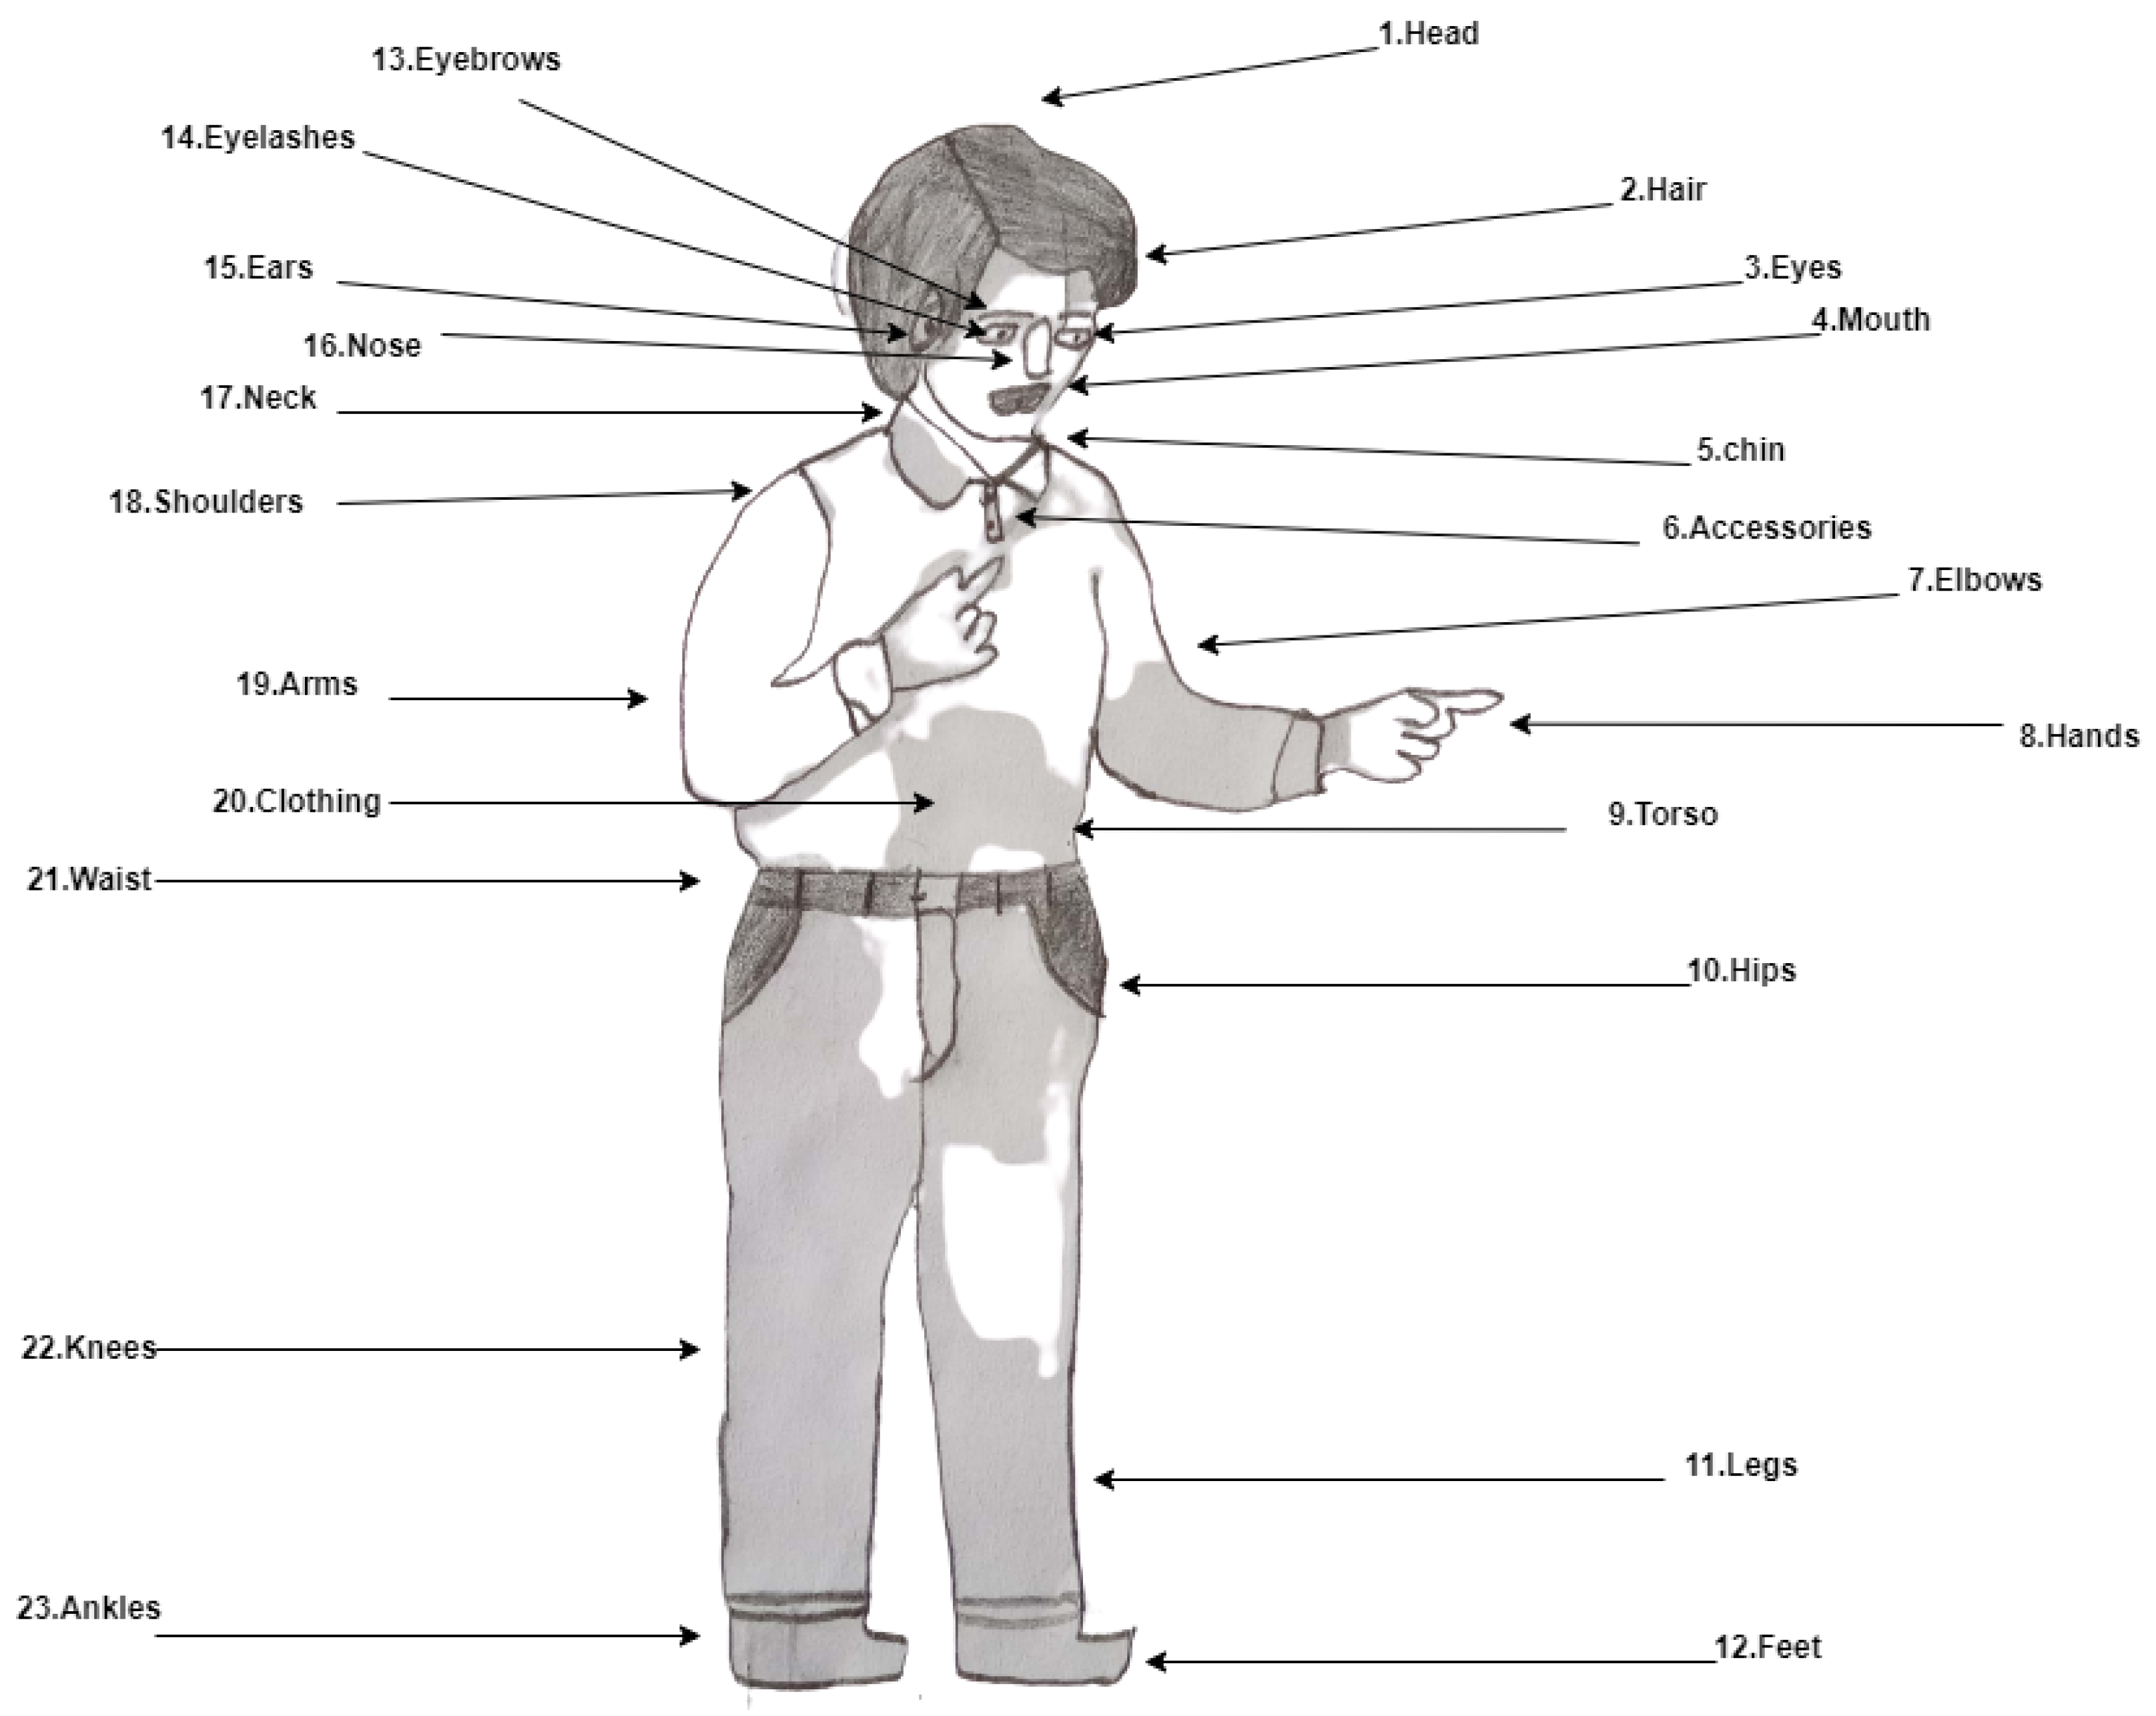
Article

Deep Learning-Based Draw-a-Person Intelligence Quotient Screening

by
Shafaat Hussain
1,
Toqeer Ehsan
1,*,
Hassan Alhuzali
2 and
Ali Al-Laith
3
1
Department of Computer Science, University of Gujrat, Gujrat 50700, Pakistan
2
Department of Computer Science and Artificial Intelligence, Umm Al-Qura University, Makkah 24382, Saudi Arabia
3
Computer Science Department, Copenhagen University, 2300 Copenhagen, Denmark
*
Author to whom correspondence should be addressed.
Big Data Cogn. Comput. 2025, 9(7), 164; https://doi.org/10.3390/bdcc9070164
Submission received: 25 March 2025 / Revised: 18 May 2025 / Accepted: 16 June 2025 / Published: 24 June 2025

Abstract

The Draw-A-Person Intellectual Ability test for children, adolescents, and adults is a widely used tool in psychology for assessing intellectual ability. This test relies on human drawings for initial raw scoring, with the subsequent conversion of data into IQ ranges through manual procedures. However, this manual scoring and IQ assessment process can be time-consuming, particularly for busy psychologists dealing with a high caseload of children and adolescents. Presently, DAP-IQ screening continues to be a manual endeavor conducted by psychologists. The primary objective of our research is to streamline the IQ screening process for psychologists by leveraging deep learning algorithms. In this study, we utilized the DAP-IQ manual to derive IQ measurements and categorized the entire dataset into seven distinct classes: Very Superior, Superior, High Average, Average, Below Average, Significantly Impaired, and Mildly Impaired. The dataset for IQ screening was sourced from primary to high school students aged from 8 to 17, comprising over 1100 sketches, which were subsequently manually classified under the DAP-IQ manual. Subsequently, the manual classified dataset was converted into digital images. To develop the artificial intelligence-based models, various deep learning algorithms were employed, including Convolutional Neural Network (CNN) and state-of-the-art CNN (Transfer Learning) models such as Mobile-Net, Xception, InceptionResNetV2, and InceptionV3. The Mobile-Net model demonstrated remarkable performance, achieving a classification accuracy of 98.68%, surpassing the capabilities of existing methodologies. This research represents a significant step towards expediting and enhancing the IQ screening for psychologists working with diverse age groups.

1. Introduction

Human intelligence has been a hot topic among psychologists for centuries. However, there is no definite consensus on the definition and measurement of intelligence. Galton [1] believed that it is a mental ability to solve mostly genetically determined problems and a unitary construct. Likewise, Spearman, et al. [2] divided this general ability into general and specific factors. However, we believe in primary mental abilities, in contrast to a single construct in which we describe seven basic mental capacities. Thurston [3] divided intelligence into fluid intelligence and crystallized intelligence. According to Selman [4], human intellectual ability is rooted in a genetic code and a fully complete evolutionary experience of life on earth. Neurologically, human intelligence is controlled by the brain and its neural augmentation in the human body. Intelligence can be measured by valid and reliable intelligence tests and is described as the intelligence quotient (IQ).
In the last decade, several reliable tests have been made available to measure human intellectual ability. The most famous and reliable are the Wechsler intelligence scales [5], which measure intelligence by dividing it into verbal and non-verbal components. Verbal intelligence tests require vocabulary and comprehension in the given languages, but in non-verbal tests, there is no need for a specific language, instead requiring the manipulation of a given set of problems, which may be pictures, drawings, and blocks [6]. DAP-IQ is one of them, which may be categorized as a non-verbal intelligence test. Recent approaches to the measurement of intelligence are often time-consuming and costly. As the demand for measuring and screening intelligence has increased in schools and colleges, there is a need for the quick screening of I.Q., and DAP-IQ is one of the most recent and famous techniques used to screen human intelligence.
Raven’s Progressive Matrices (RPM) is also widely recognized for its objectivity and high psychometric validity [7]. However, the Draw-A-Person IQ (DAP-IQ) test offers distinct advantages in specific contexts, particularly when working with young children, non-verbal individuals, or populations in low-resource settings [8]. DAP-IQ is inherently engaging, culturally adaptable, and cost-effective, requiring only basic materials such as a pencil and paper. In addition, it facilitates a more natural assessment environment, reducing test-related anxiety and allowing subjects to express cognitive and emotional traits by drawing in freehand [9]. These features make DAP-IQ especially suitable for early developmental screening. Integrating deep learning techniques allows for the automated and objective evaluation of DAP drawings, helping to overcome subjectivity and inter-rater variability concerns. Given these strengths and the compatibility of the test with image-based AI models, DAP-IQ presents a compelling alternative to traditional cognitive assessments such as RPM in certain research and clinical contexts.
Dr. Florence Goodenough invented the Draw-a-Person test in 1926 (Goodenough, 1926), which is specially designed to measure children’s mental age through figure drawings. It measures the learning, visual, cognitive, and motor capabilities by having individuals draw a human figure, assessing the quality of the drawing, and comparing the figure score with children’s typical rate of acquisition. Later on, the scoring system was developed by Koppitz et al. [10]. All these tests of HFDs have different scoring systems, but one feature is common, which is the assessment of cognitive abilities. The most updated form of HFD is the DAP-IQ ( Draw-A-Person Intellectual Ability Test for Children, Adolescents, and Adults) [11]. DAP-IQ is one of the most interesting screening human figure drawing-based tests used to measure the intellectual ability of humans aged between 4 years and 89 years old. Many psychologists use this test manually in their daily practice to rule out the intellectual functioning of children and adults. A manual assessment takes much time to evaluate the individuals And there is a need to automate these screening processes. DAP-IQ is a simple screening test that uses a blank page and an lead pencil. This test is specially made for those aged between 4 years and 89 years old. The examiner gives the instructions to the clients to draw a human figure as soon as possible within 8 to 15 min. There are 23 indicators or features counted in every HFD, such as head, hair, eyes, eyelashes, eyebrows, etc. Full details are given in Figure 1.
Every indicator has 0 to 2, 3, 4, and 5 scores. For the conversion of raw scoring into standard scoring, there is a chronological age table that is presented using this Equation (IQ = mental age/chronological age × 100). After converting into a standard scoring system, there are seven further classes which are Significantly Impaired, Mildly Impaired, Below Average, Average, High Average, Superior, and Very Superior. These are the final and main classes that show the actual intelligence of persons [12].
As DAP-IQ takes much time for manual assessment, we need an AI-based system that automatically does this work within a more reasonable time. To streamline the work of psychologists and reduce the required time for assessment, a model is essential for recognizing and categorizing the outcomes of the DAP-IQ test. This model incorporates a specialized layer known as the convolutional layer, which enables the network to extract patterns from different parts of the images, simplifying the classification process. Utilizing Convolutional Neural Network (CNN) and transfer learning models like MobileNet, Inception, and Xception architecture allows the model to handle images with multiple classes efficiently, contributing to enhanced performance in image learning with multi-class output. CNNs have been extensively employed in prior research for image recognition and have demonstrated remarkable levels of accuracy. Consequently, the Convolutional Neural Network and Transfer learning models are the ideal choice for this research as they expedite and fortify the evaluation of DAP-IQ test results, empowering psychologists to efficiently analyze the test outcomes and provide timely and effective insights.
The paper is organized as follows: Section 2 reviews the related work, while Section 3 provides details about our methodology. Section 5 describes the experimental setup and results. Section 5.12 provides the discussion, including limitations and ethical considerations. Finally, Section 6 concludes with a summary of key insights and directions for future research.

2. Related Work

As a psychological concept, intelligence encompasses a range of dynamic cognitive abilities, including reasoning, communication, comprehension, problem solving, learning, emotions, and critical thinking. Interestingly, certain manifestations of intelligence have also been observed in animals and plants. Over the past three centuries, numerous researchers and scholars have dedicated their efforts to the study of intelligence, resulting in a multitude of definitions and theories. This exploration has been ongoing since the late 19th and mid-20th centuries, leading to various assumptions aimed at defining and measuring human intellectual capabilities.
Several studies have been conducted to assess the intelligence quotient within different groups using the DAP-IQ test. Some studies presented promising results for the DAP-IQ test; however, other studies showed contradicting results, questioning the reliability of the results. In 2005, the most recently updated form of human figure drawings (HFDs) was the DAP-IQ (Draw-A-Person Intellectual Ability Test for Children, Adolescents, and Adults). Twenty-three indicators were used for feature selection and mental age counting. Every indicator further has 2 to 4 different features mentioned in the given manual, such as the mouth indicator, shown in the following Figure 2. Authors also experimented to check the compatibility with other intelligence quotient tests.
In Egypt, a study was conducted among 1000 primary school children to assess their intellectual ability through the DAP-IQ test. The findings of the study indicate that there was a positive correlation between DAP-IQ scores and academic achievement, as well as socioeconomic status and residence [13].
Another study by Troncone, A. [14] showed a correlation between DAP-IQ and the Raven Progressive Matrices test; however, the author advises against using DAP-IQ, as it was not able to differentiate between borderline and deficient individuals. A research study was conducted among 500 adolescents to assess the difference in emotional intelligence, aggression, and academic achievement based on intellectual level. They used the DAP-1Q test to assess different levels of intelligence. Their findings reveal that there was a significant difference based on intelligence level on emotional intelligence and academic achievement, and there was no difference in the level of aggression among adolescents. These studies’ results indicate that DAP-IQ can be used for assessing adolescents’ level of intellectual functioning [15].
Next year, a well-known company plans to utilize a convolutional neural network for assessing applicants through the psychological testing tree drawing test. This test focuses on key indicators such as roots, leaves, flowers, canopy, fruits, and the various types of tree roots, which are manually scored. The dataset is classified into the following three categories: small, medium, and large trees. The training and test processes involve using 70% of the data for training the neural network and the remaining 30% for evaluation its performance. Impressively, the model achieved an overall accuracy of 74.07% on the predetermined dataset. Furthermore, when tested on a new iteration of the dataset, the accuracy remained high at 75 percent [16]. Furthermore, House-Tree-Person (HTP) was used to assess the different aspects of human personality. Most of the time, different therapists have used this test for aggressive and depressive detection in clients. After some image preprocessing, the authors trained a transfer learning model like Res-Net152 and achieved the highest accuracy at 66% [17].
Moreover, a transfer learning approach was employed for sketch recognition, wherein the authors utilized a ResNet-50 algorithm for classification purposes. The TU-Berlin dataset served as the training corpus, comprising 10,000 sketches. Notably, the model attained an accuracy rate of 74, surpassing the performance of other prevailing state-of-the-art models Authors: reviewed [18]. Similarly, another work was done by using children’s drawings like the tree drawing test underwent automation to streamline the psychologist’s workflow. Before This automation, the assessment process was time-consuming. Convolutional neural networks were employed to train the models, yielding accuracies of 63% for the superego class and 79% for the ego class [19].
To facilitate and shorten the assessment time of psychologists, Widiyanto and Abuhasan trained a convolutional neural network using the Draw-A-Person test. The dataset was a simple human figure drawing on blank pages labeled with the help of a psychologist. Four emotional indicators were used as classifiers with assessments Big, A Bit Big, Normal, and incomplete. The deep learning (CNN) model was used as a classifier, and 99.48% accuracy was obtained from the training phase and 72.08% from the evaluation phase [20]. Most recently, House-Tree-Person (HTP) was used to assess the different aspects of human personality. Most of the time, different therapists have used this test for aggressive and depressive detection in clients. After some image preprocessing, the authors trained a transfer learning model like ResNet152 and achieved the highest accuracy of 66% [17].
The difference between this research and the above research is that we will first manually derive the IQ using the DAP-IQ manual and classify the dataset into seven different classes such as Significantly Impaired, Mildly Impaired, Below Average, Average, High Average, Superior, and Very Superior, and finally, we will apply deep learning algorithms for the classification.

3. Methodology

The methodology of this research has multiple steps that start from data collection and manual scoring and end with deep neural network modeling. Figure 3 shows our proposed research methodology in the form of a block diagram.

3.1. Data Collection and Preparation

In this step, we discuss the data collection and preparation procedure. Figure 4 shows the complete circle of data collection.

3.1.1. Moral Ethics

Before data collection, informed written consent from school authorities and verbal consent from all participants were obtained. The researcher informed the participants in detail about the research purpose, confidentiality, data protection, and use of information for the research study. Participants were also informed that their participation is voluntary and they have the option to leave the research without any hesitation. Most of the students enjoyed this activity without any stress.

3.1.2. Contributors

All the public educational institutions from the Gujrat District (Pakistan) were selected for this study. All students aged between 8 and 17 years, from 5th grade to 10th grade, were selected for data collection. Data were gathered from 5th- to 10th-grade students aged from 8 to 17 years. More than 1200 human drawings were collected, and after removing the meaningless images, 1117 instances were left.

3.1.3. Main Process

During the data collection process, students were given a blank page and a lead pencil and were asked to draw a human figure drawing as best as possible. All the drawings hanging in the classroom were eliminated before this process. To avoid duplication in the dataset due to copying, all the processes were monitored by teachers. More than 10 min were given to the students to finish the test’s requirements. After completion, the sketches were collected to be used for the subsequent process.

3.1.4. Manual Scoring and Classification

Three trained raters, two experienced school teachers and one licensed psychologist, participated in the manual scoring process, following the standardized Draw-A-Person IQ (DAP-IQ) manual. The psychologist had more than 8 years of clinical experience in psychological assessment and projective techniques, while both teachers had more than 5 years of educational experience and received training specific to the DAP-IQ scoring system. A total of 23 indicators were assessed for each drawing, and a cumulative score was calculated by adding individual indicator scores. To ensure objectivity and consistency, the raters independently scored each drawing. The reliability between raters was calculated using Cohen’s kappa, resulting in a value of 0.97, indicating substantial agreement among the raters. A detailed discussion on Cohen’s kappa is shown in the next section. Based on the final scores, the dataset was classified into seven different classes corresponding to mental age groups ranging from 8 to 17 years. These categories are illustrated in Figure 5.

3.1.5. Inter-Rater Reliability

To evaluate the reliability of the dataset, we used Cohen’s kappa [21]. Cohen’s kappa, often called just“kappa”, is the most commonly used measure for inter-rater agreement (IRA) or inter-rater reliability (IRR). It gives a way to adjust for agreement that might happen just by chance when two raters evaluate items using a nominal scale. This index is especially useful when the same two raters are scoring each item [21]. Kappa is measured by Equation (1)
Kappa = Observed agreement Expected agreement by chance 1 Expected agreement by chance
We randomly selected 10% of the samples from our proposed classes and gave them to a trained psychologist for evaluation. The psychologist spent a week reviewing these samples. After he completed their assessment, we calculated Cohen’s kappa to measure the agreement between our evaluations. The statistics indicate a kappa value of 0.97. Figure 6 provides an overview of the statistics related to the kappa value.

3.2. Sample Size and Distribution

In this study, we employed the proportionate random sampling technique. Proportionate sampling is a method utilized when dealing with populations comprising distinct subgroups. In this approach, The DAP-IQ dataset, which focuses on children and adolescents aged from 8 to 17, captures a crucial period in human development, making it highly relevant for understanding broader population trends. This age range covers significant milestones, from late childhood to teenage years, where cognitive, emotional, and social developments are most pronounced. By concentrating on this specific age group, the dataset allows us to explore how these formative years shape individuals’ overall development. Although it does not encompass the entire population, it reflects a vital demographic that can inform broader studies, especially those related to education, mental health, and behavioral patterns in youth. This targeted approach ensures that while the dataset is age-specific, its findings can still contribute valuable insights applicable to larger population dynamics, particularly in understanding youth development. The population was stratified into two subgroups as follows: male and female. A sample size of 784 males and 333 females was selected, with a proportionality rate of 29.81 percent for females and 70.18 percent for male students. For the ages of students, there were 220 students aged 12, 221 aged 13, 159 aged 14, 100 aged 15, 97 aged 16, 60 aged 17, 90 aged 10 years, 99 aged 11, and 71 aged 9. As we discussed, we selected the public schools in Gujrat District, Pakistan, in which there were approximately 1400 primary and secondary schools. Ten primary and secondary schools with male and female students were selected for our study.

3.3. Data Digitization and Pre-Processing Techniques

In this section, we discuss the complete process of converting the paper’s dataset into a digital format, and we also discuss the different augmentation techniques.

3.3.1. Data Digitization

For the classification of the whole dataset, we first converted the images one by one into digital form using the best Android scanner application, “Cam Scanner”. Cam Scanner is one of the latest and best mobile applications used for scanning any type of document or image. This application utilizes the mobile camera to capture images of documents and then applies image processing techniques to enhance the image’s quality and clarity. The application also allowed the users to edit, crop, and adjust the available images.
So, we first installed the Android version of this application using the Google Play Store. After signing up and signing in to the account used for this application, we accessed all available options. The whole dataset was captured using two Android mobile sets; the first was Vivo-1812, and the second was Galaxy A02s.

3.3.2. Our Purposed Augmentation Techniques, Training, Test, and Validation Dataset

The selection of data augmentation techniques for the experiments was predominantly influenced by prior research, demonstrating the substantial impact of these methods on classification performance. Data preprocessing involves applying image augmentation techniques to each image in the dataset. The Cam Scanner Android Application performs manual cropping. The Image Data Generator function in the Keras library is utilized for these purposes. The augmentation parameters are adjusted for the training image data as follows: re-scaling to 1/255, rotation range of 20 degrees, width shift range of 0.05, height shift range of 0.05, zoom range of 0.05, and horizontal flipping set to true. Following the application of these techniques, the derived datasets are shown in Table 1. However, validation and test datasets are excluded from image augmentation. This choice is driven by the fact that only the training dataset requires diverse shapes and transformations to enable the Convolutional Neural Network to learn image patterns effectively.
The Flow from Directory method, available in the Keras library, is employed to feed the dataset directly to the CNN during training. The parameters for this method are configured with a target size of 300 × 300 and a categorical class mode. These generator parameters are applied uniformly to the train, validation, and test datasets. 80 % of the dataset was used for training the models and 20 % for test and validation purposes.

4. Deep Learning Algorithms

Deep learning, as a sub-branch of machine learning, mainly focuses on artificial neural network training, learning, and predictions of the given datasets. It is inspired by the human brain’s functions and complex structure, and its algorithm aims to develop a model that can automatically learn features from the representation of the dataset with the help of interconnected neurons [22].
Deep learning has made remarkable strides in various artificial intelligence domains, such as computer vision, natural language processing (NLP), reinforcement learning, speech recognition, etc. Convolutional neural networks perform best in computer vision tasks, while recurrent neural networks are most famous for use in sequence-based tasks like natural language processing and DNA-related problems. For the best performance, deep learning models need powerful and reliable computational CPU and GPU to train and test the dataset [23].

4.1. Convolutional Neural Network (CNN)

Convolutional Neural Networks are a specialized category of neural networks explicitly tailored for handling multi-array sequential or grid-like topological data. These powerful networks have demonstrated remarkable success in a wide range of applications, including natural language processing, time-series forecasting, speech recognition, and computer vision (CV).

4.1.1. How CNN Works

The training process of convolutional neural networks involves the following two main stages: the feed-forward stage and the backward stage. In the feed-forward stage, the CNN takes an input and applies learnable kernels with specific parameters to extract a set of features known as feature maps. These feature maps are then propagated through a stack of layers in a feed-forward manner until the final output is estimated.
Once the output is predicted, it is compared with the ground truth, and the error is computed based on their difference. In the backward stage, the gradient is computed using the chain rule, and it is back-propagated layer by layer through the network. This allows the CNN to update its weights based on the computed gradient. These updated weights are then used in the subsequent feed-forward stage. The training process is iterated multiple times through a learning phase until the network has learned sufficiently, and the loss is reduced to a certain threshold. This iterative process fine-tunes the network’s parameters to improve its performance on the given task.

4.1.2. Activation Functions

The activation function serves as a transformative operation that aids in capturing the intricate nonlinearities present in complex patterns. It charts the course for features to inhabit a designated range and determines the activation or suppression of individual neurons. The selection of an activation function bears substantial influence on the process of learning and training within a neural network [24].

4.1.3. ReLU Function

ReLU stands as the most widely employed activation function within the realm of practitioners and researchers in deep learning. The triumph of ReLU is rooted in its exceptional training efficacy [25], surpassing alternative activation functions like the logistic sigmoid and hyperbolic tangent.
The definition of the Rectified Linear unit function is as follows:
ReLU ( x ) = max ( 0 , x )
ReLU function behaves linearly for all positive inputs and produces zero for all negative inputs. Despite this, its output values span from 0 to infinity.

4.1.4. Softmax Function

The Softmax function is essentially a composite of multiple sigmoid functions. Sigmoid functions output values between 0 and 1, which can be interpreted as probabilities for individual class data points. Unlike sigmoid functions that are typically used for binary classification, the Softmax function is suitable for multi-class classification problems. Calculate the probability for each data point across all individual classes.
σ ( z ) j = e z j k = 1 K e z k for j = 1 , , K
When constructing a network or model for multi-class classification, the output layer of the network will consist of several neurons equal to the total number of classes in the target.

4.2. State-of-the-Art Convolutional Neural Networks

Some of the most advanced and latest CNN architectures are discussed as follows:

4.2.1. Inception V3

Inception v3 primarily centers around conserving computational resources through refinements to the earlier inception architectures, Inception v1 and v2. This concept was introduced in the research paper [26]. When compared to VGGNet, Inception Networks have demonstrated greater computational efficiency. This efficiency is evident both in the reduction of parameters generated by the network and in the minimized costs incurred, encompassing memory and other resources.

4.2.2. Inception Res-Net V2

The network generates a sequence of forecaster class probabilities, given an image input size of 299 by 299 pixels. This architecture is a fusion of the Inception design and Residual connections. Within the Inception-Res-Net code block, convolutions using filters of different dimensions are amalgamated alongside residual connections. This approach not only mitigates the problem of performance deterioration associated with deep structures but also effectively trims down training duration, courtesy of the utilization of residual connections [26]. Furthermore, Res-Net connections are presented by He et al. [27]. Opting for residual connection in place of the filter fusion stage in the Inception architecture is a logical choice due to the inherently substantial nature of Inception networks. By doing so, Inception networks can leverage the benefits of the residual approach while still upholding their computational efficiency [28].

4.2.3. Xception Model

Xception, a Convolutional Neural Network developed by Google, is available as an open source solution [29]. The term “Xception” stands for “Extreme version of Inception,” with inception itself being a prior iteration of Google’s CNN design. Xception introduces a unique convolutional structure, combining point-wise convolution with subsequent depth-wise convolution [29]. This innovative combination has been demonstrated to yield enhanced accuracy for image classification tasks.

4.2.4. Mobile-Net Model

Mobile Nets represent a series of computer vision models primarily crafted for TensorFlow, prioritizing mobile usage. Their core design goal is to achieve optimal accuracy while accommodating for the limited resources typical of on-device or embedded applications. These models are characterized by their compact size, minimal processing delay, and efficient energy consumption. They are configured with parameters that align with the constraints of various devices in terms of resources. Mobile Nets can be tailored for tasks such as classification, detection, embedding generation, and segmentation [30].

5. Results and Discussion

Section 4 delves into a comprehensive discussion of the deep learning models and architectures in this paper. These models draw inspiration from the following four distinct CNN frameworks: transfer learning, elementary CNN models, and the hierarchy of CNN models. Our research endeavors encompass the formulation and execution of 10 distinctive experiments, aimed at tackling the Best DAP-IQ assessment challenges. This section will provide a comprehensive introduction to these 10 experiments, elucidating pertinent details such as data augmentation techniques. Furthermore, the ensuing subsections will provide a detailed exposition of the test outcomes and the accompanying evaluation metrics for each experiment.

5.1. Experiment Results of the Mobile-Net Model

By employing the Mobile-Net architecture, we harnessed the pre-trained weights derived from Image-Net training for our transfer learning network. Remarkably, after applying the data augmentation techniques, we achieved the optimal outcome of 30 iterations with a training batch size of 32. Table 2 shows the hyper-parameter values and model accuracy.
Table 3 presents the single-class accuracy of the Mobile-Net model across seven IQ categories. The model performed best on the High Average and Average classes (both 0.99%), while its lowest accuracy was on the Very Superior class (0.51%), indicating difficulty distinguishing this group. Overall, the results suggest strong classification performance for mid-range IQ levels but reduced accuracy at the extremes.
Table 4 presents the classification report of our model without data augmentation, detailing the precision, recall, F1-score, and support for each class. The results indicate varied performance across different categories, with higher recall observed for classes like “Average” and “Below Average”, while classes such as “Mildly Impaired” and “Significantly Impaired” show lower recall values. The overall accuracy of the model on the test set is 49% reflecting the challenges posed by class imbalance and dataset limitations. The macro and weighted averages provide an aggregate view of the model’s effectiveness across all classes.
As shown in Table 5 presents the precision, recall, and F1-score for each class using the MobileNet model. The model performed best on the Average and Significantly Impaired classes with balanced scores, while performance was weakest on the High Average class due to a low recall 0.44%. Overall, results suggest the model is more reliable in detecting common and moderately impaired IQ levels.
Table 5 and Table 6 present the training, test, and validation accuracies and precision, recall, and F1-score for seven classes as follows: Mildly Impaired, Significantly Impaired, Superior, Average, Below Average, High Average, and Very Superior. The model demonstrates strong precision, particularly for the “Very Superior” (0.96%) and “Significantly Impaired” (0.94%) classes. However, recall values show more variability, with ”High Average” being notably low at 0.44. The F1-scores, which balance precision and recall, range from 0.58% for “High Average” to 0.87% for “Average”, indicating overall solid performance, with some room for improvement in specific categories like “Below Average” and “High Average”. This predicts the model performs well in most cases, but could benefit from refinements in handling less common classes.

5.2. Experiment Results of the Mobile-Net V2 Model

Employing the MobileNetV2 architecture, we utilized pre-trained weights derived from training on the ImageNet dataset for our transfer learning network. Noteworthy optimizations were achieved by employing data augmentation techniques over 30 iterations, ultimately yielding optimal results with a training batch size of 32. Table 7 provides a summary of the hyper-parameter values alongside the corresponding model accuracies.
Table 8 presents the classification report of our model without data augmentation, detailing the precision, recall, F1-score, and support for each class. The results indicate varied performance across different categories, with higher recall observed for classes like “Average” and “Below Average”, while classes such as “Mildly Impaired” and “Significantly Impaired” show lower recall values. The overall accuracy of the model on the test set is 56% reflecting the challenges posed by class imbalance and dataset limitations. The macro and weighted averages provide an aggregate view of the model’s effectiveness across all classes.
Table 9 shows the single-class accuracy of the MobileNet-V2 model across IQ categories. The model achieved its highest accuracy on the High Average and Average classes, 0.99%, indicating strong recognition in these groups. However, it struggled with the Very Superior class, 0.54%, suggesting lower precision in identifying extremely high IQ levels.
In the experimental Table 10 and Table 11, the performance metrics for various classes show notable variability. The “Very Superior” class achieves the highest F1-score of 0.63%, reflecting a good balance between precision and recall despite its relatively lower recall of 0.47%. On the other hand, the “Average” class exhibits the highest recall at 0.90%, but its precision value is 0.44%, resulting in an F1-score of 0.59%. “Below Average” demonstrates the highest value of 0.89% but has a lower recall of 0.46%, giving it an F1-score of 0.61%. Overall, the results highlight the trade-offs between precision and recall across different classes, with “Very Superior” and “Below Average” showing stronger F1-scores.

5.3. Experiment Results of the Xception Model

The Extreme version of the Inception model achieves the highest accuracy when combined with data augmentation techniques, yielding 97.74% accuracy during training and 86.63% accuracy when tested on unknown instances. Following extensive experimentation, it was determined that 30 iterations produced the optimal accuracy for this model configuration. Further details are provided in Table 12.
Table 13 presents the classification report of our model without data augmentation, detailing the precision, recall, F1-score, and support for each class. The results indicate varied performance across different categories, with higher recall observed for classes like “Average” and “Below Average”, while classes such as “Mildly Impaired” and “Significantly Impaired” show lower recall values. The overall accuracy of the model on the test set is 60% reflecting the challenges posed by class imbalance and dataset limitations. The macro and weighted averages provide an aggregate view of the model’s effectiveness across all classes.
Table 14 and Table 15 present the performance metrics of a classification model using training, test and validation accuracies as well as precision, recall, and F1-score across various cognitive impairment levels. The “Below Average” and “Very Superior” classes exhibit the highest overall performance, with F1-scores of 0.87% and 0.79% respectively, indicating strong alignment between precision and recall. “Mildly Impaired” has high recall (0.95%), showing effectiveness in identifying true positives, while “Significantly Impaired” has lower recall (0.44%), suggesting room for improvement in identifying those instances. The “High Average” class shows a notable trade-off between high precision (0.87%) and low recall (0.38%), reflecting a tendency to miss relevant cases.
Table 16 presents the precision, recall, and F1-score for the Xception model across IQ classes. The model performed best on the Below Average and Very Superior classes, with F1-scores of 0.87% and 0.79%, respectively. However, it showed poor balance in classes like High Average and Significantly Impaired, indicating difficulty in consistently identifying these groups.

5.4. Experiment Results of the Inception V3 Model

In this experiment, we employed the InceptionV3 model as our primary architecture. Specifically, we utilized a pre-trained Inception V3 model that had been trained on the extensive Image-Net dataset. The initial step involved importing the model, followed by the crucial process of freezing all its layers. Subsequently, we fine-tuned the model by introducing a flattening layer, a fully connected layer, and a dropout layer in the final block. The model’s training focused on this last block while maintaining the remaining layers in their pre-trained state. To provide further context, we configured our training process with a batch size of 32 and allowed a maximum of 30 epochs for convergence. Table 17 shows the optimal hyperparameter.The optimization of the model was carried out using the Adam optimizer. For the model evaluation, we mention the training accuracy and validation accuracy below.
Table 18 presents the classification report of our model without data augmentation, detailing the precision, recall, F1-score, and support for each class. The results indicate varied performance across different categories, with higher recall observed for classes like “Average” and “Below Average”, while classes such as “Mildly Impaired” and “Significantly Impaired” show lower recall values. The overall accuracy of the model on the test set is 43% reflecting the challenges posed by class imbalance and dataset limitations. The macro and weighted averages provide an aggregate view of the model’s effectiveness across all classes.
Table 19 shows the single-class accuracy of the Inception-V3 model across IQ categories. The model performed strongly on the Average, High Average, and Below Average classes, with accuracies near or at 0.98–0.99%. In contrast, it showed weaker accuracy on the Very Superior (0.51%) and Superior (0.58%) classes, indicating difficulty in recognizing high IQ extremes.
Table 20 summarizes training, test and validation accuracies, while Table 21 shows the precision, recall, and F1 scores for seven classes in a classification model. The “Below Average” class demonstrates the highest overall performance with an F1-score of 0.80%, driven by its strong precision (0.90%). “Average” also performs well, showing a balance between precision (0.71%) and recall (0.84%), resulting in a solid F1-score of 0.77%. On the other hand, the “Significantly Impaired” and “Superior” classes exhibit lower recall values (0.49% and 0.50%, respectively), leading to relatively lower F1-scores of 0.58% and 0.62%. The “High Average” class shows a notable gap between precision (0.51%) and recall (0.83%), indicating potential model improvement in handling this class. Overall, the model performs well in most categories.

5.5. Experiment Results of the CNN Model

This model is the same as previous models with the difference that this model is not pre-trained using any other huge bundle of datasets. This model is trained using five different block details from each block mentioned in Section 4.2.1. For optimization, we used different hyperparameters.
Table 22 presents the hyperparameter details of our model without data augmentation, and Table 23 shows the classification report and detailing the precision, recall, F1-score, and support for each class. The results indicate varied performance across different categories, with higher recall observed for classes like “Average” and “Below Average”, while classes such as “Mildly Impaired” and “Significantly Impaired” show lower recall values. The overall accuracy of the model on the test set is 46% reflecting the challenges posed by class imbalance and dataset limitations. The macro and weighted averages provide an aggregate view of the model’s effectiveness across all classes.
Table 24 presents the single-class accuracy of the CNN model across various IQ levels. The model showed strong performance on High Average, Average, and Mildly Impaired classes with accuracies above 0.98%. However, it performed less accurately on Very Superior (0.62%) and Superior (0.66%) classes, indicating room for improvement in identifying higher IQ ranges.
Table 25 presents the training, test, and validation accuracies, while Table 26 shows the precision, recall, and F1 scores for seven classes, highlighting the performance variations across different categories. The “Below Average” class has the highest F1-score of 0.93%, reflecting strong recall (1.00%) and precision (0.83%). In contrast, the “Significantly Impaired” class shows high precision (1.00%) but very low recall (0.19%), resulting in a low F1-score of 0.32%, indicating significant misclassifications. “Mildly Impaired” and “Average” perform well with balanced precision and recall, achieving F1-scores of 0.78%. However, classes like “High Average” and “Very Superior” have relatively lower F1 scores (0.40% and 0.44%, respectively), suggesting that the model struggles with these categories. The results suggest the need for improvements, particularly in classes with low recall.
As shown in Table 27, the custom CNN model achieved the highest Test Accuracy 93.75% outperforming all transfer learning models in terms of generalization. While Inception-V3 demonstrated the best average precision 0.75% and F1-score 0.65% CNN maintained a strong balance across all metrics. These results indicate that although pre-trained models offer competitive performance, a well-tuned custom CNN can achieve superior accuracy in classifying IQ levels from human figure drawings.

5.6. K-Fold Cross-Validation Results

In this section, we present the k-fold cross-validation result. We assigned k = 5 for the latest CNN models and the average precision of each fold to verify the validity of the whole dataset. Details of each model are mentioned in the following subsections.

5.7. Experiment for Mobile-Net Model

To obtain the validation report, we applied the 5-fold cross-validation using 10 epochs on each fold. This model gives the highest training accuracy on the third fold, which is 95.41% and the test is 93.72%.
Table 28 shows the details of all folds with training and test accuracies.

5.8. Experiment for the Xception Model

The xception model is an extreme type of inception model that gives the best accuracy after applying the 10 epochs and 5-fold cross-validation on the whole dataset. The highest accuracy achieved was 93.93% and 92.0% in training and test. More details for each fold are presented in Table 29.

5.9. Experiment for the InceptionResNetV2 Model

In this experiment, we have performed 5-fold cross-validation using the InceptionResNetV2 model. Before validation, we split the dataset into x train, y train, x test, and y test, and after applying the data augmentation techniques, we further divided the whole dataset into five different folds and applied the InceptionResNetV2 transfer learning model on each fold to finally plot the accuracy and loss of individual folds. More details are mentioned in Table 30.

5.10. Experiment for the CNN Model

The Convolutional Neural Network has five main blocks. Details of each block and their complete architecture are discussed in the previous sections. Now to achieve the best accuracy and model validity, we applied 5-fold cross-validation using the CNN model and data augmentation techniques. After 10 epochs on each fold, we obtained 82.34% and 82.35%, respectively, for training and Test Accuracy. More details are provided in Table 31.

5.11. Experiment for the Inception-V3 Model

The experiment took 10 epochs on each fold for the sake of best accuracy. Details of each epoch are mentioned in Table 32.
Table 33 presents the average accuracies obtained through K-Fold cross-validation across five models. The MobileNet model achieved the highest Test Accuracy 90.15% with strong training performance, indicating good generalization. Xception had the highest training accuracy 93.93% but showed a significant drop in Test Accuracy 82.03%, suggesting potential overfitting. InceptionResNetV2 and CNN performed consistently with balanced training and test results. Inception-V3 recorded the lowest accuracy on both ends, indicating limited effectiveness for the given task.

5.12. Discussion

In this work, we developed a deep learning-based model that assesses students using the human figure drawing test. This automation of assessment can overcome the issue with busy psychologists in relation to time and paper costs.
In this research, we have proposed a deep learning-based model using different data augmentation techniques. Moreover, we have conducted an investigation and performed a comparative evaluation of the proposed system against established human figure drawing test classification and sketch detection using human drawings. Our proposed system can be meaningfully compared to previous research efforts in a significant manner [11].
The previous literature has offered valuable insights into DAP-IQ assessment. Ref. [13] also conducted the assessment of primary school students using DAP-IQ and found a positive correlation, and similarly, we have assessed the students using deep learning models. Ref. [31] trained an Artificial Intelligence (AN)-based model for handwritten image classification and achieved very low accuracy from 71% to 76%. Moreover, in 2015, Debek and Fillip trained a (AN) model for psychological testing and obtained 82.35% accuracy. Similarly, another study was done using students’ drawings for feature extraction and classification, and 56% accuracy was achieved. By comparison, we have carried out classification using the most advanced algorithms like the CNN model, which is specially used for image classification.
Arya et al. [32] trained three transfer learning models, SVGG, VGG16, and Res-Net50, for MRI-3D images classified into four classes, Very Superior, Superior, High Average, and Average, achieving 85% accuracy. Later on, Setiawan et al. [18] utilized a Convolutional Neural Network for psychological testing tree drawing test image classification with a maximum of 74.07% accuracy. Moreover, Widiyanto and Abuhasan used a convolutional neural network for Draw-A-Person test image dataset classification and achieved 72.08% accuracy. As compared to the studies discussed above, we first manually derive the IQ using the DAP-IQ manual and classified the whole dataset into seven different classes—Significantly Impaired, Mildly Impaired, Below Average, Average, High Average, Superior, and Very Superior—conducting training with the most advanced algorithms, including Mobile-Net, Xception, etc., for DAP-IQ classification. Before the training process, we have applied data augmentation techniques such as rotation, height width changes, and cropping to overcome the over-fitting and under-fitting problems, and we also used them to increase the data size.
More specifically, we fine-tuned the transfer learning models and froze some layers. We also explored the features of CNN models, state-of-the-art CNN models, and the architecture of these models with all the necessary information about these models. For the evaluation, we applied the K-fold cross-validation using these five CNNs and a tree of CNN models such as Inception and InceptionResNetV2, etc., using data augmentation techniques. We have introduced a groundbreaking study for classifying DAP-IQ assessment utilizing a Human Figure Drawing Test and achieved the highest accuracy of up to 98.68% using a Mobile-Net fine-tuned approach.

6. Conclusions

Computer vision faces a formidable challenge when it comes to automatically classifying human figure drawings due to the striking similarities in shape. Our objective was to develop distinct convolutional neural network (CNN) and state-of-the-art CNN architectures to address the issue of DAP-IQ classification to overcome the assessment times of clients between 8 and 17 years of age. To accomplish this, we leveraged a substantial DAP-IQ dataset with 1117 images made by students using blank pages from different primary to high school systems in the Gujrat District. This dataset is split into different classes: Superior, very Superior, High Average, Average, Below Average, Significantly Impaired, and Mildly Impaired. The majority of these classes pose a significant challenge, even for human recognition, primarily due to the remarkable similarity in the size and shape of the different drawings. Before deploying the CNN models, we conducted three distinct data preprocessing steps on the DAP-IQ images. Firstly, we manually made an assessment on a one-by-one basis for each instance using the DAP-IQ manual and classified the whole dataset into seven different classes. Secondly, we digitized the whole dataset using a high-quality mobile camera and the Cam Scanner application. Lastly, we grouped the digitized dataset into seven different folders with the same name as the classes. Next, we delved into the exploration and implementation of five distinct CNN architectures aimed at addressing the classification of closely resembling DAP-IQ images. Among these, the first architecture involved transfer learning with Mobile-Net, using different data augmentation techniques such as cropping, rotations, horizontal flipping, height shift, width shift, etc., achieving an impressive 98.68% accuracy in sketch classification. The second CNN architecture encompassed various layers and parameters and contained another transfer learning with the Xception model, which obtained the second highest 97.74% accuracy. The third architecture also used the transfer learning Inception-V3 model to achieve the best accuracy of 97.05%. Mobile-Net-V2 is the fourth best-performing transfer learning model, with an accuracy of 96.49%, and lastly, Convolutional Neural Network (CNN) solved the classification problem with 92.86% accuracy.
To gauge the effectiveness of each CNN architecture, we conducted evaluations and comparisons by randomly selecting a test set from Google Derive. For more evaluations, we conducted K-fold cross-validation, using five folds on each model. In the end, we compared the accuracy of each model and plotted them using the Matplotlib (Version 3.6.3) Python Library.

6.1. Limitations

We conducted experiments with various convolutional architecture models, including the development of our custom model. However, one of these models achieved the desired results. Our research revealed that deeper convolutional architectures outperformed shallower ones in extracting the essential features needed for our objectives.
Although initially set to train our neural network for more than 30 epochs, our fit function identified over-fitting during the training process and promptly terminated it. Due to the low resolution of the images and sketch-based drawings and the limited dataset, our model was unable to optimally classify based on the test and evaluation metrics such as precision, recall, and F1 score.

6.2. Future Work

We eagerly anticipate employing more advanced and contemporary architectures, such as Efficient-Net-V2B3 and Efficient-Net-V2M, in the future to enhance efficiency. As a component of our performance testing, we will also test our model on more extensive and real-world datasets. To evaluate a broader range of real-world clients, we need to extend the dataset’s age limit beyond 17 years and include graduate-level students, among others. For model evaluation, we will use stratified k-fold cross-validation and repeated trials. Our objective is to incorporate our model into an Android application that leverages real-time images captured by a camera to accomplish the DAP-IQ classification task.
As we enhance our predictive capabilities, we will fine-tune the model and subsequently extend its application to other psychological sectors connected to the one under study.

Author Contributions

S.H.: Conceptualization, Data curation, Formal Analysis, Writing—original draft; T.E.: Supervision, Validation, Methodology, Writing—review & editing; H.A.: Project administration, Validation, Funding acquisition; A.A.-L.: Project administration, Validation, Writing—review & editing; All authors have read and agreed to the published version of the manuscript.

Funding

This research work was funded by Umm Al-Qura University, Saudi Arabia, under grant number: 25UQU4320430GSSR02.

Institutional Review Board Statement

The study was conducted according to the guidelines of the Declaration of Helsinki, and approved by the Institutional Review Board (or Ethics Committee) of University of Gujrat with the letter code UOG/ORIC/2025/240 issued on 3 June 2025.

Informed Consent Statement

Informed consent was obtained from all subjects involved in the study. Written informed consent has been obtained from participants to publish this article.

Data Availability Statement

A subset of the dataset used in this study is publicly available and can be downloaded from our GitHub repository: https://github.com/shafaat861/DAP-IQ-dataset.git (accessed on 16 June 2025).

Acknowledgments

The authors extend their appreciation to Umm Al-Qura University, Saudi Arabia, for funding this research work through grant number: 25UQU4320430GSSR02.

Conflicts of Interest

The authors declare that they have no conflicts of interest.

References

  1. Brody, N. History of theories and measurements of intelligence. In Handbook of Intelligence; Cambridge University Press: Cambridge, UK, 2000; pp. 16–33. [Google Scholar]
  2. Spearman, C. The Measurement of Intelligence; Houghton Mifflin Company: Boston, MA, USA, 1927. [Google Scholar]
  3. Gardner, M.K. Theories of Intelligence. In The Oxford Handbook of School Psychology; Oxford Academic: Oxford, UK, 2011; pp. 79–100. [Google Scholar]
  4. Selman, V.; Selman, R.C.; Selman, J.; Selman, E. Spiritual-intelligence/-quotient. Coll. Teach. Methods Styles J. (CTMS) 2005, 1, 23–30. [Google Scholar] [CrossRef]
  5. Guertin, W.H.; Ladd, C.E.; Frank, G.H.; Rabin, A.I.; Hiester, D.S. Research with the Wechsler Intelligence Scales for Adults. Psychol. Bull. 1966, 66, 385. [Google Scholar] [CrossRef] [PubMed]
  6. Parankimalil, J. Meaning, nature and characteristics of intelligence. In Educationist, Story Teller and Motivator; 2014; pp. 1–4. Available online: https://johnparankimalil.wordpress.com/2014/11/17/meaning-nature-and-characteristics-of-intelligence/ (accessed on 19 May 2025).
  7. Raven, J. Raven progressive matrices. In Handbook of Nonverbal Assessment; Springer: Berlin/Heidelberg, Germany, 2003; pp. 223–237. [Google Scholar]
  8. Hagood, M.M. The use of the Naglieri Draw-a-Person test of cognitive development: A study with clinical and research implications for art therapists working with children. Art Ther. 2003, 20, 67–76. [Google Scholar] [CrossRef]
  9. Groth-Marnat, G. Handbook of Psychological Assessment; John Wiley & Sons: Hoboken, NJ, USA, 2009. [Google Scholar]
  10. Koppitz, E.M. Psychological evaluation of children’s human figure drawings. JAMA 1968, 205, 190. [Google Scholar]
  11. Williams, T.O., Jr.; Fall, A.M.; Eaves, R.C.; Woods-Groves, S. The reliability of scores for the Draw-A-Person intellectual ability test for children, adolescents, and adults. J. Psychoeduc. Assess. 2006, 24, 137–144. [Google Scholar] [CrossRef]
  12. Kamphaus, R.; Petoskey, M.D.; Rowe, E.W. Current trends in psychological testing of children. Prof. Psychol. Res. Pract. 2000, 31, 155. [Google Scholar] [CrossRef]
  13. El-Shafie, A.M.; El Lahony, D.M.; Abd El Latif, Z.O.; Khalil, M.O. Draw-a-person test as a tool for intelligence screening in primary school children. Menoufia Med J. 2019, 32, 329. [Google Scholar]
  14. Troncone, A. Problems of “Draw-a-Person: A Quantitative Scoring System” (DAP: QSS) as a measure of intelligence. Psychol. Rep. 2014, 115, 485–498. [Google Scholar] [CrossRef] [PubMed]
  15. Mursaleen, M.; Munaf, S. Differences of emotional intelligence, aggression, and academic achievement among students with different levels of intellectual ability. Bahria J. Prof. Psychol. 2020, 19, 61–76. [Google Scholar]
  16. Setiawan, I.; Yusnitasari, T.; Nurhady, H.; Hizviani, N.V. Implementation of convolutional neural network method for classification of Baum Test. In Proceedings of the 2020 Fifth International Conference on Informatics and Computing (ICIC), IEEE, Gorontalo, Indonesia, 3–4 November 2020; pp. 1–6. [Google Scholar]
  17. Salar, A.A.; Faiyad, H.; Sönmez, E.B.; Hafton, S. Artificial Intelligence Contribution to Art-Therapy using Drawings of the House-Person-Tree Test. In Proceedings of the 2023 3rd International Conference on Electrical, Computer, Communications and Mechatronics Engineering (ICECCME), IEEE, Tenerife, Canary Islands, Spain, 19–21 July 2023; pp. 1–6. [Google Scholar]
  18. Noor, M.N.; Nazir, M.; Rehman, S.; Tariq, J. Sketch-recognition using pre-trained model. In Proceedings of the National Conference on Engineering and Computing Technology, Islamabad, Pakistan, 18 November 2021; Volume 8. [Google Scholar]
  19. Maliki, I.; Firmansyah, A.R. Personality Detection Based on Tree Drawing Using Convolutional Neural Network. In Proceedings of the 2023 International Conference on Informatics Engineering, Science & Technology (INCITEST), IEEE, Bandung, Indonesia, 25 October 2023; pp. 1–6. [Google Scholar]
  20. Widiyanto, S.; Abuhasan, J.W. Implementation the convolutional neural network method for classification the draw-A-person test. In Proceedings of the 2020 Fifth International Conference on Informatics and Computing (ICIC), IEEE, Bari, Italy, 2–5 October 2020; pp. 1–6. [Google Scholar]
  21. Cohen, J. A coefficient of agreement for nominal scales. Educ. Psychol. Meas. 1960, 20, 37–46. [Google Scholar] [CrossRef]
  22. Janiesch, C.; Zschech, P.; Heinrich, K. Machine learning and deep learning. Electron. Mark. 2021, 31, 685–695. [Google Scholar] [CrossRef]
  23. Mathew, A.; Amudha, P.; Sivakumari, S. Deep learning techniques: An overview. In Advanced Machine Learning Technologies and Applications: Proceedings of AMLTA 2020; Springer: Singapore, 2021; pp. 599–608. [Google Scholar]
  24. Gu, J.; Wang, Z.; Kuen, J.; Ma, L.; Shahroudy, A.; Shuai, B.; Liu, T.; Wang, X.; Wang, G.; Cai, J.; et al. Recent advances in convolutional neural networks. Pattern Recognit. 2018, 77, 354–377. [Google Scholar] [CrossRef]
  25. He, K.; Zhang, X.; Ren, S.; Sun, J. Delving deep into rectifiers: Surpassing human-level performance on imagenet classification. In Proceedings of the IEEE International Conference on Computer Vision, Santiago, Chile, 13–16 December 2015; pp. 1026–1034. [Google Scholar]
  26. Szegedy, C.; Vanhoucke, V.; Ioffe, S.; Shlens, J.; Wojna, Z. Rethinking the inception architecture for computer vision. In Proceedings of the IEEE Conference on Computer Vision and Pattern Recognition, Las Vegas, NV, USA, 27–30 June 2016; pp. 2818–2826. [Google Scholar]
  27. He, K.; Zhang, X.; Ren, S.; Sun, J. Deep residual learning for image recognition. In Proceedings of the IEEE Conference on Computer Vision and Pattern Recognition, Las Vegas, NV, USA, 27–30 June 2016; pp. 770–778. [Google Scholar]
  28. Dean, J.; Corrado, G.; Monga, R.; Chen, K.; Devin, M.; Mao, M.; Ranzato, M.; Senior, A.; Tucker, P.; Yang, K.; et al. Large scale distributed deep networks. Adv. Neural Inf. Process. Syst. 2012, 25, 1–11. [Google Scholar]
  29. Chollet, F. Xception: Deep learning with depthwise separable convolutions. In Proceedings of the IEEE Conference on Computer Vision and Pattern Recognition, Honolulu, HI, USA, 21–26 July 2017; pp. 1251–1258. [Google Scholar]
  30. Khasoggi, B.; Ermatita, E.; Sahmin, S. Efficient mobilenet architecture as image recognition on mobile and embedded devices. Indones. J. Electr. Eng. Comput. Sci. 2019, 16, 389–394. [Google Scholar] [CrossRef]
  31. Fallah, B.; Khotanlou, H. Identify human personality parameters based on handwriting using neural network. In Proceedings of the 2016 Artificial Intelligence and Robotics (IRANOPEN), IEEE, Qazvin, Iran, 9 April 2016; pp. 120–126. [Google Scholar]
  32. Arya, A.; Manuel, M. Intelligence Quotient Classification from Human MRI Brain Images Using Convolutional Neural Network. In Proceedings of the 2020 12th International Conference on Computational Intelligence and Communication Networks (CICN), IEEE, Bhimtal, India, 25–26 September 2020; pp. 75–80. [Google Scholar]
Figure 1. Human figure drawing with 23 indicators.
Bdcc 09 00164 g001
Figure 2. Mouth indicator scores for DAP-IQ test.
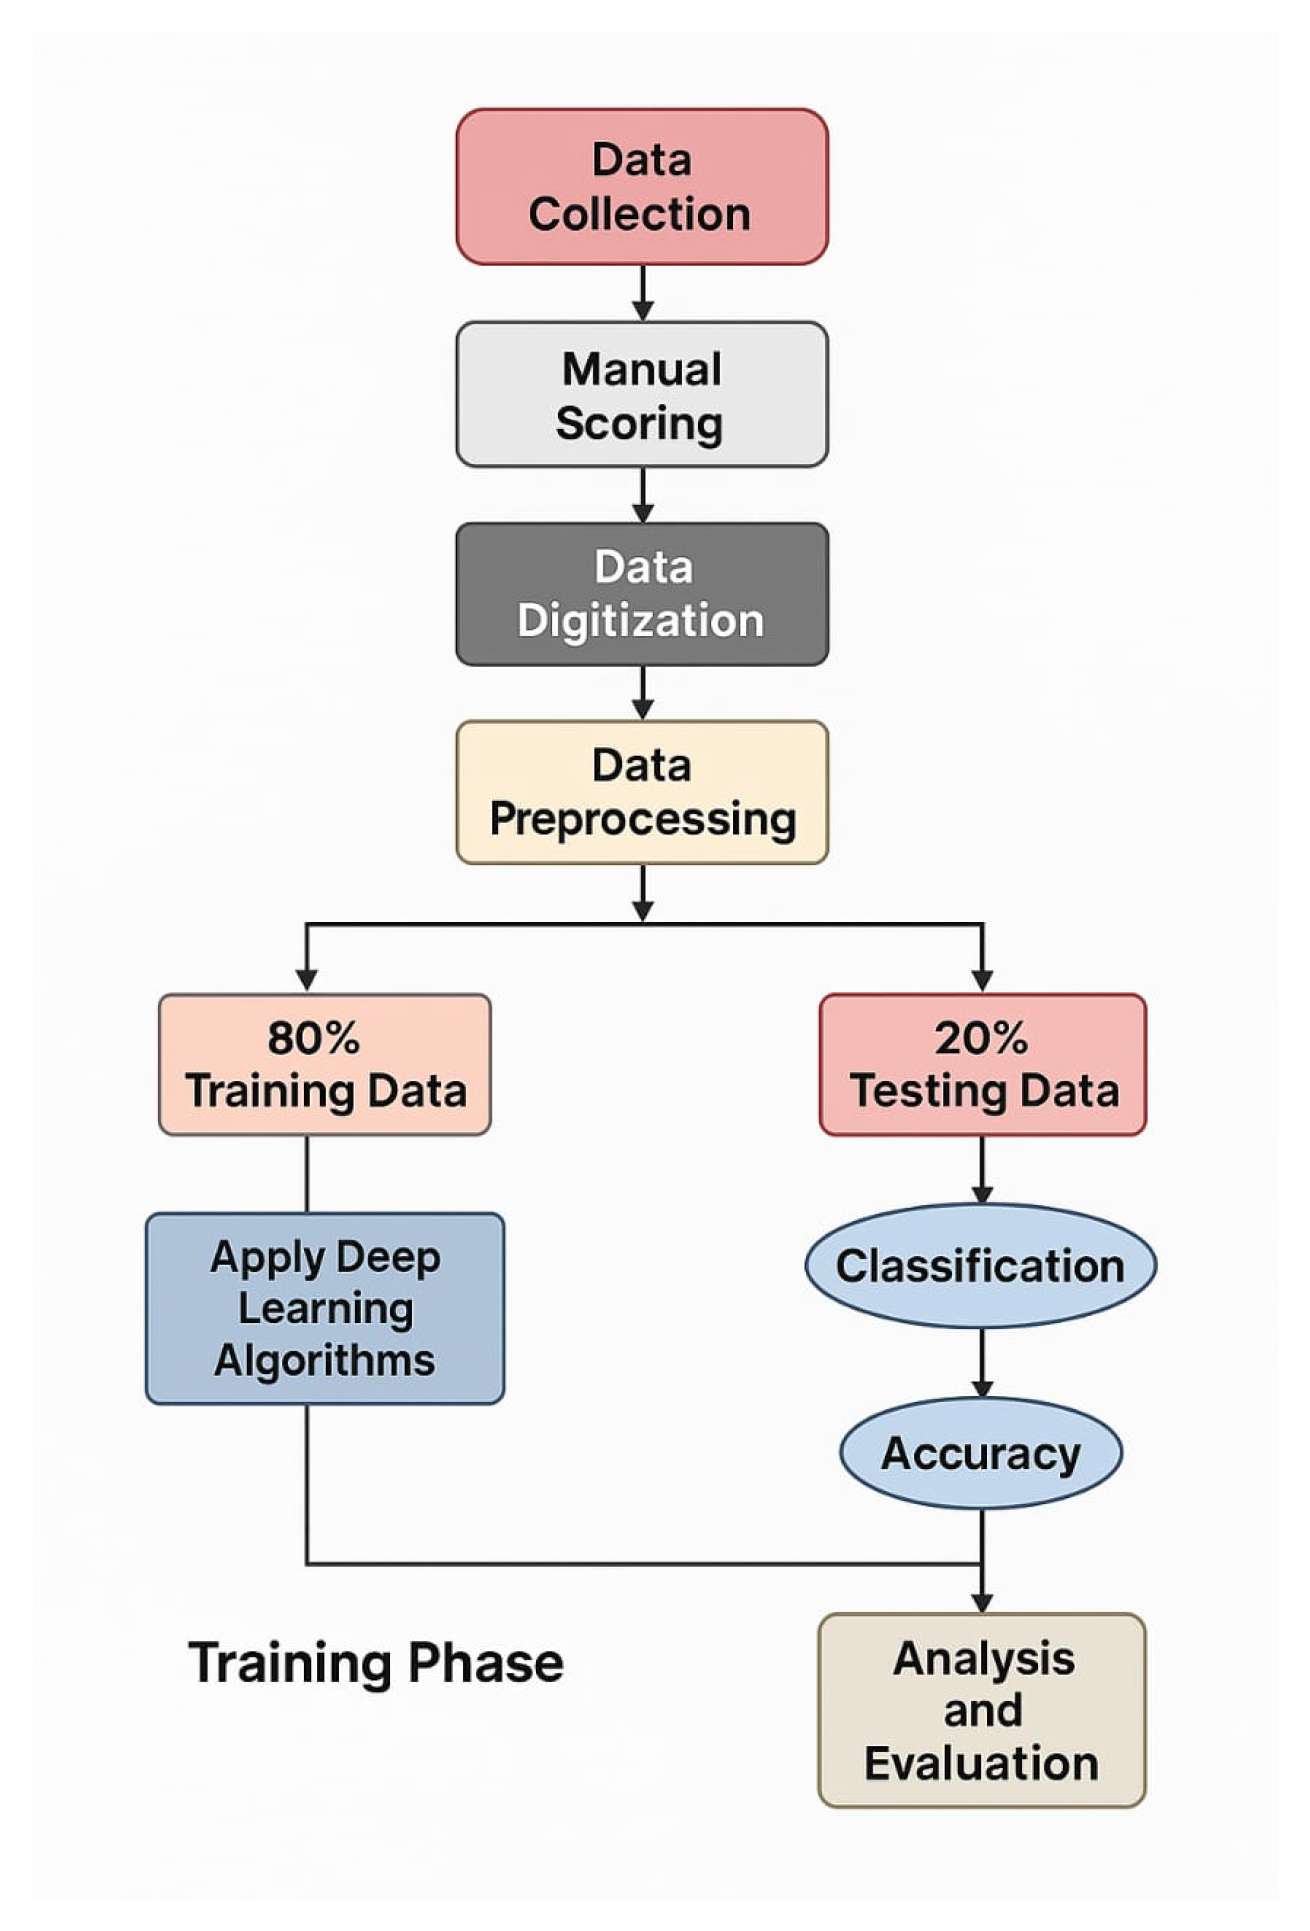
Bdcc 09 00164 g002
Figure 3. Block Diagram of our Proposed Methodology.
Bdcc 09 00164 g003
Figure 4. Block diagram for data collection.
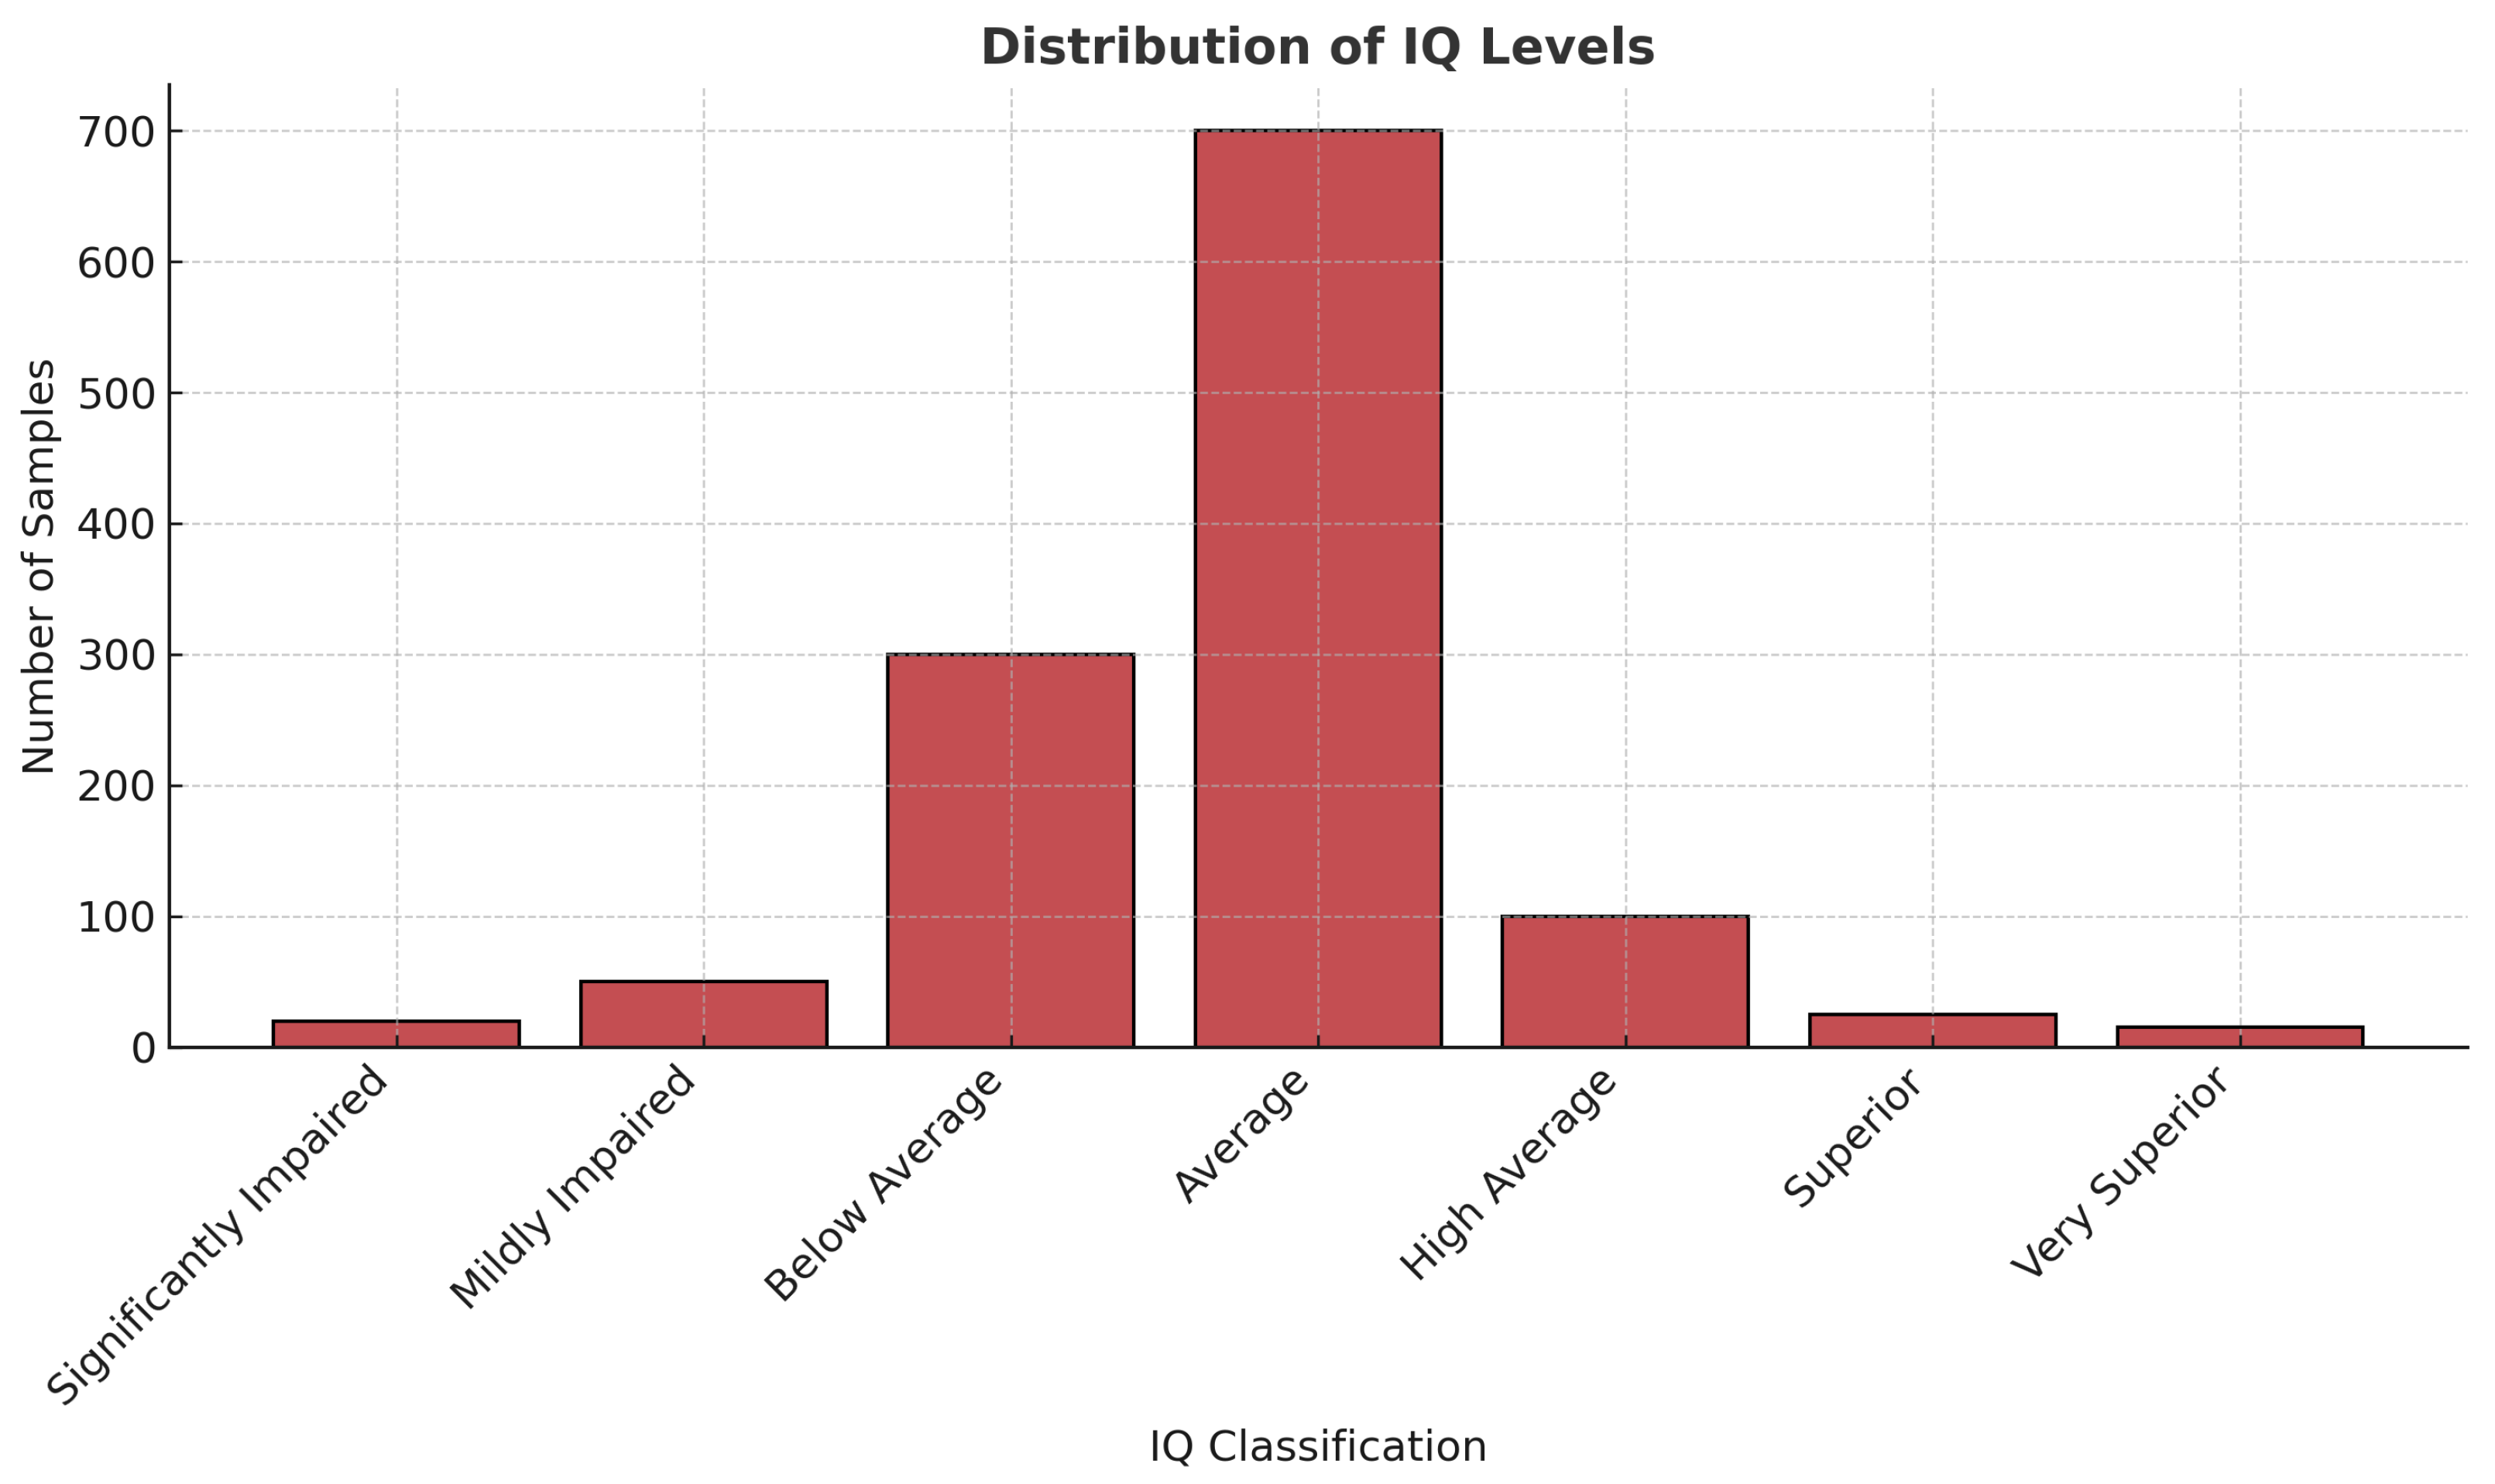
Bdcc 09 00164 g004
Figure 5. DAP-IQ dataset distribution using a column graph.
Bdcc 09 00164 g005
Figure 6. Statistics of the human annotators and psychologist by kappa.
Bdcc 09 00164 g006
Table 1. Intelligence quotient classes following the application of the data augmentation techniques.
Sr.ClassesFrequency
1Significantly Impaired66
2Mildly Impaired342
3Below Average1578
4Average4164
5High Average474
6Superior60
7Very Superior18
Table 2. Hyperparameters and configurations of the MobileNet model.
Component Value/Setting
Model Architecture
Base Model MobileNet (ImageNet weights)
Include Top False
Input Shape (224, 224, 3)
Pooling Layer GlobalAveragePooling2D
Dense Layer 512 units, ReLU
Output Layer 7 units, Softmax
Training Configuration
Batch Size 32
Epochs 30
Optimizer Adam
Loss Function Categorical Crossentropy
Metrics Accuracy
Trainable Base Model False
Data Augmentation
Rescale 1./255
Rotation Range 20
Width Shift Range 0.1
Height Shift Range 0.1
Shear Range 0.1
Zoom Range 0.2
Horizontal Flip True
Fill Mode Nearest
Evaluation Settings
Batch Size (Evaluation) 1
Shuffle False
Rescale (Evaluation) 1./255
Metric Classification report (precision, recall, F1-score)
Table 3. Single-class accuracy for Mobile-Net model.
ClassesAccuracy
Below Average0.98%
Mildly Impaired0.91%
High Average0.99%
Very Superior0.51%
Superior0.66%
Average0.99%
Significantly Impaired0.84%
Table 4. Classification report for MobileNet without data augmentation: precision, recall, and F1-score for each class.
ClassPrecisionRecallF1-ScoreSupport
Mildly Impaired0.530.170.26106
Significantly Impaired0.830.170.28117
Superior0.760.270.40126
Average0.510.750.61189
Below Average0.480.810.61139
High Average0.290.560.38108
Very Superior0.770.470.58109
Accuracy0.49894
Macro Average0.600.460.45894
Weighted Average0.590.490.46894
Table 5. Experiment for precision, recall, and F1-score (MobileNet Model).
ClassesPrecisionRecallf1-Score
Mildly Impaired0.79%0.90%0.84%
Significantly Impaired0.94%0.78%0.85%
Superior0.86%0.81%0.83%
Average0.88%0.85%0.87%
Below Average0.61 %1.00%0.76%
High Average0.83%0.44%0.58%
Very Superior0.96%0.79%0.846%
Table 6. Experiment for MobileNet-V2 model.
Training AccuracyTraining LossTest AccuracyTest Loss
98.68%0.03%89.0%0.3%
Table 7. Hyperparameters and configurations of the MobileNetV2 model.
Component Value/Setting
Model Architecture
Base Model MobileNetV2 (Pre-trained on ImageNet)
Include Top False
Input Shape (224, 224, 3)
Output Layer Dense (7); Activation: Softmax
Pooling Layer GlobalAveragePooling2D
Additional Dense Layer Dense (512); Activation: ReLU
Training Settings
Batch Size 32
Epochs 30
Optimizer Adam
Loss Function Categorical Crossentropy
Metrics Accuracy
Base Model Trainable False (frozen)
Data Augmentation Parameters
Rescale 1./255
Rotation Range 20 degrees
Width Shift Range 0.1
Height Shift Range 0.1
Shear Range 0.1
Zoom Range 0.2
Horizontal Flip True
Fill Mode Nearest
Evaluation Settings
Evaluation Rescale 1./255
Shuffle False
Evaluation Batch Size 1
Evaluation Metric Classification report (precision, recall, F1-score)
Table 8. Classification report for MobileNet V2 without data augmentation: precision, recall, and F1-score for each class.
ClassPrecisionRecallF1-ScoreSupport
Mildly Impaired0.550.180.26106
Significantly Impaired0.830.170.28117
Superior0.600.300.40126
Average0.510.750.61189
Below Average0.480.810.70139
High Average0.290.560.38108
Very Superior0.770.470.58109
Accuracy0.56894
Macro Average0.600.460.45894
Weighted Average0.590.490.46894
Table 9. Single-class accuracy for MobileNet-V2 model.
ClassesAccuracy
Below Average0.98%
Mildly Impaired0.91%
High Average0.99%
Very Superior0.54%
Superior0.69%
Average0.99%
Significantly Impaired0.88%
Table 10. Experiment for the MobileNet-V2 model.
Training AccuracyTraining LossTest AccuracyTest Loss
96.49%0.07%80.11%0.5%
Table 11. Experiment for precision, recall, and F1-score (MobileNet-V2).
ClassesPrecisionRecallF1-Score
Mildly Impaired0.68%0.43%0.53%
Significantly Impaired0.55%0.54%0.55%
Superior0.62%0.44%0.51%
Average0.44%0.90%0.59%
Below Average0.89 %0.46 %0.61%
High Average0.56%0.56%0.56%
Very Superior0.94%0.47%0.63%
Table 12. Hyperparameters and configurations of the Xception model.
Component Value/Setting
Model Architecture
Base Model Xception (Pre-trained on ImageNet)
Include Top False
Input Shape (224, 224, 3)
Output Layer Dense (7); Activation: Softmax
Pooling Layer GlobalAveragePooling2D
Additional Dense Layer Dense (512); Activation: ReLU
Training Settings
Batch Size 32
Epochs 30
Optimizer Adam
Loss Function Categorical Crossentropy
Metrics Accuracy
Base Model Trainable False (frozen)
Data Augmentation Parameters
Rescale 1./255
Rotation Range 20 degrees
Width Shift Range 0.1
Height Shift Range 0.1
Shear Range 0.1
Zoom Range 0.2
Horizontal Flip True
Fill Mode Nearest
Evaluation Rescale 1./255
Shuffle False
Evaluation Batch Size 1
Evaluation Metric Classification Report (Precision, Recall, F1-score)
Table 13. Classification Report for Xception without data augmentation: precision, recall, F1-score for each class.
ClassPrecisionRecallF1-ScoreSupport
Mildly Impaired0.530.180.26106
Significantly Impaired0.830.170.28117
Superior0.600.270.40126
Average0.510.750.61189
Below Average0.480.810.61139
High Average0.290.560.38108
Very Superior0.770.470.58109
Accuracy0.60894
Macro Average0.600.460.45894
Weighted Average0.590.490.46894
Table 14. Single-class accuracy for the Xception Model.
ClassesAccuracy
Below Average0.98%
Mildly Impaired0.91%
High Average0.98%
Very Superior0.50%
Superior0.63%
Average0.99%
Significantly Impaired0.85%
Table 15. Experiment for the Xception model.
Training AccuracyTraining LossTest AccuracyTest Loss
97.74%0.05%86.93%0.7%
Table 16. Experiment for precision, recall, and F1-score (Xception Model).
ClassesPrecisionRecallF1-Score
Mildly Impaired0.51%0.95%0.66%
Significantly Impaired0.78%0.44%0.56%
Superior0.53%0.83%0.64%
Average0.79%0.51%0.62%
Below Average0.82%0.93%0.87%
High Average0.87%0.38%0.53%
Very Superior0.79%0.78%0.79%
Table 17. Hyperparameters and configurations of the InceptionV3 model.
Component Value/Setting
Model Architecture
Base Model InceptionV3 (Pre-trained on ImageNet)
Include Top False
Input Shape (224, 224, 3)
Custom Layers GlobalAveragePooling2D, Dense (1024, ReLU), Dense (7, Softmax)
Training Settings
Batch Size 32
Epochs 30
Optimizer Adam
Loss Function Categorical Crossentropy
Metrics Accuracy
Trainable Layers Only custom layers (base frozen)
Shuffle (training) True
Data Augmentation Parameters
Rescale 1./255
Rotation Range 20 degrees
Width Shift Range 0.1
Height Shift Range 0.1
Shear Range 0.1
Zoom Range 0.2
Horizontal Flip True
Fill Mode Nearest
Evaluation Settings
Evaluation Rescale 1./255
Shuffle False
Evaluation Batch Size 1
Classification Metric Precision, recall, and F1-score (via the classification report)
Table 18. Classification report for Inception V3 without data augmentation: precision, recall, and F1-score for each class.
ClassPrecisionRecallF1-ScoreSupport
Mildly Impaired0.530.180.26106
Significantly Impaired0.830.170.28117
Superior0.610.270.40126
Average0.510.750.61189
Below Average0.500.810.61139
High Average0.290.560.38108
Very Superior0.770.470.58109
Accuracy0.43894
Macro Average0.600.460.45894
Weighted Average0.590.490.46894
Table 19. Single-class accuracy for the Inception-V3 model.
ClassesAccuracy
Below Average0.98%
Mildly Impaired0.85%
High Average0.98%
Very Superior0.51%
Superior0.58%
Average0.99%
Significantly Impaired0.85%
Table 20. Experiment for the Inception-V3 model.
Training AccuracyTraining LossTest AccuracyTest Loss
97.03%0.10%84.65%0.6%
Table 21. Experiment for precision, recall, and F1-score (Inception-V3).
ClassesPrecisionRecallF1-Score
Mildly Impaired0.66%0.70%0.68%
Significantly Impaired0.71%0.49%0.58%
Superior0.83%0.50%0.62%
Average0.71%0.84%0.77%
Below Average0.90%0.71%0.80%
High Average0.51%0.83%0.63%
Very Superior0.75%0.78%0.76%
Table 22. Hyperparameters and configurations of the custom CNN model.
Component Value/Setting
Model Architecture
Convolutional Layers 3 Conv layers (filters: 32, 64, 128)
Kernel Size 3 × 3
Activation Function ReLU
Pooling Layers MaxPooling2D after each Conv layer
Flatten Layer Yes
Dense Layers Dense (128), Dense (7)
Output Activation Softmax
Training Settings
Input Shape (224, 224, 3)
Batch Size 32
Epochs 30
Optimizer Adam
Loss Function Categorical Crossentropy
Metrics Accuracy
Shuffle (training) True
Data Augmentation Parameters
Rescale 1./255
Rotation Range 20 Degrees
Width Shift Range 0.1
Height Shift Range 0.1
Shear Range 0.1
Zoom Range 0.2
Horizontal Flip True
Fill Mode Nearest
Evaluation Settings
Evaluation Rescale 1./255
Shuffle False
Evaluation Batch Size 1
Classification Metric Precision, recall, and F1-score (via the classification report)
Table 23. Classification report for CNN without data augmentation: precision, recall, and F1-score for each class.
ClassPrecisionRecallF1-ScoreSupport
Mildly Impaired0.510.180.26106
Significantly Impaired0.530.170.28117
Superior0.600.270.40126
Average0.510.750.61189
Below Average0.480.810.61139
High Average0.300.560.38108
Very Superior0.770.470.58109
Accuracy0.46894
Macro Average0.600.460.45894
Weighted Average0.590.490.46894
Table 24. Single-class accuracy for the CNN model.
ClassesAccuracy
Below Average0.89%
Mildly Impaired0.98%
High Average0.99%
Very Superior0.62%
Superior0.66%
Average0.99%
Significantly Impaired0.83%
Table 25. Experiment for the CNN model.
Training AccuracyTraining LossTest AccuracyTest Loss
92.86%0.22%93.75%0.9%
Table 26. Experiment for precision, recall, and F1-score(CNN model).
ClassesPrecisionRecallF1-Score
Mildly Impaired0.87%0.70%0.78%
Superior0.44%0.69%0.54%
Average0.87%0.70%0.78%
Below Average0.83%1.00%0.93%
High Average0.52%0.33%0.40%
Significantly Impaired1.00%0.19%0.32%
Very Superior0.46%0.43%0.44%
Table 27. Comparison of our proposed models based on Test Accuracy and evaluation metrics.
Model Test Accuracy Avg. Precision Avg. Recall Avg. F1-Score
Mobile-Net 89.00% 0.70 0.62 0.60
Xception 86.93% 0.73 0.65 0.63
Mobile-Net-V2 80.11% 0.71 0.60 0.58
Inception-V3 84.65% 0.75 0.66 0.65
CNN (Custom) 93.75% 0.72 0.64 0.62
Table 28. K-Fold cross-validation report (Mobile-Net).
FoldsTraining AccuracyTest Accuracy
191.07%89.58%
290.48%87.05%
395.41%93.72%
491.27%89.67%
593.27%89.27%
Table 29. K-Fold cross-validation report (Xception Model).
FoldsTraining AccuracyTest Accuracy
195.74%94.64%
292.27%90.17%
394.18%95.96%
495.19%92.19%
592.28%86.54%
Table 30. K-Fold cross-validation report (InceptionResNetV2).
FoldsTraining AccuracyTest Accuracy
183.42%81.25%
297.98%92.85%
389.48%86.09%
465.43%91.92%
595.63%91.92%
Table 31. K-Fold cross-validation report (CNN).
FoldsTraining AccuracyTest Accuracy
184.42%83.03%
291.93%87.94%
371.25%73.09%
482.73%85.20%
581.31%82.51%
Table 32. K-Fold cross-validation report (Inception-V3).
FoldsTraining AccuracyTest Accuracy
176.70%76.78%
289.58%86.16%
383.89%84.72%
494.40%92.37%
547.76%46.18%
Table 33. Average accuracies of K-Fold cross-validation.
ModelsTraining AccuracyTest Accuracy
Mobile-Net91.98%90.15%
Xception93.93%82.03%
InceptionResNetV286.39%83.87%
CNN82.34%82.35%
Inception-V378.47%77.25%
Disclaimer/Publisher’s Note: The statements, opinions and data contained in all publications are solely those of the individual author(s) and contributor(s) and not of MDPI and/or the editor(s). MDPI and/or the editor(s) disclaim responsibility for any injury to people or property resulting from any ideas, methods, instructions or products referred to in the content.

