Abstract
With the rapid growth in social network comments, the need for more effective methods to classify their polarity—negative, neutral, or positive—has become essential. Sentiment analysis, powered by natural language processing, has evolved significantly with the adoption of advanced deep learning techniques. Long Short-Term Memory networks capture long-range dependencies in text, while transformers, with their attention mechanisms, excel at preserving contextual meaning and handling high-dimensional, semantically complex data. This study compares the performance of sentiment analysis models based on LSTM and BERT architectures using key evaluation metrics. The dataset consists of business reviews from the Yelp Open Dataset. We tested LSTM-based methods against BERT and its variants—RoBERTa, BERTweet, and DistilBERT—leveraging popular pipelines from the Hugging Face Hub. A class-by-class performance analysis is presented, revealing that more complex BERT-based models do not always guarantee superior results in the classification of Yelp reviews. Additionally, the use of bidirectionality in LSTMs does not necessarily lead to better performance. However, across a diversity of test sets, transformer models outperform traditional RNN-based models, as their generalization capability is greater than that of a simple LSTM model.
1. Introduction
In the field of natural language processing (NLP), sentiment analysis encompasses methods designed to model the emotions conveyed in textual opinions across various domains, including topics, products, subjects, and services. The goal is to determine whether a given text expresses positive, negative, or neutral sentiment [1,2]. Furthermore, sentiment analysis can be extended to detect specific emotions such as anger, fear, joy, sadness, or frustration [3].
Sentiment analysis is widely applied in numerous fields, including e-commerce, where it is used to assess customer satisfaction based on product reviews [4,5]. It also plays a crucial role in market research [6] and in the analysis of cryptocurrency fluctuations [7,8]. Additionally, it is instrumental in tracking public trends [9,10] and in conducting political sentiment analysis [11,12].
In the context of sentiment analysis, polarity refers to the orientation of a piece of text, indicating whether it expresses a positive, negative, or sometimes neutral sentiment. The concept originates from linguistics and psychology, where “polarity” describes the opposing ends of an emotional spectrum. It provides a straightforward way to categorize the emotional tone of textual content using a simple scale.
Polarity can be estimated using either a lexicon-based method or a deep learning-based approach. Lexicon-based methods rely on predefined sentiment dictionaries, such as VADER [13] and SentiWordNet [14], to compute a polarity score based on the presence and strength of sentiment-bearing words. Alternatively, deep learning-based approaches [15] use supervised learning models trained on labeled sentiment data. These include architectures like Long Short-Term Memory (LSTM) networks [16] and transformer-based models, such as Bidirectional Encoder Representations from Transformers (BERT) [17] and the Robustly Optimized BERT Pretraining Approach (RoBERTa) [18], which are capable of capturing complex contextual dependencies for more nuanced sentiment detection.
Sentiment analysis remains challenging, particularly on short-text platforms like Twitter, where limited contextual cues hinder accurate classification [19]. Poria et al. [19] emphasized the difficulty of extracting meaningful sentiment from short texts due to the lack of sufficient context. In contrast, Barbieri et al. [20] analyzed seven heterogeneous Twitter-specific classification tasks, including sentiment analysis, and demonstrated that leveraging existing pretrained generic language models and fine-tuning them on domain-specific corpora, such as Twitter data, improves classification performance. While Poria et al. highlighted the fundamental challenges posed by short texts, Barbieri et al. proposed a concrete method to enhance performance through additional training on specialized datasets.
BERT is a deep learning model for NLP introduced by Google in 2018. Based on the transformer architecture, BERT processes input text bidirectionally—considering both left-to-right and right-to-left contexts simultaneously—which improves its ability to understand the semantics of language in context. It was pretrained on two large text corpora, Wikipedia and BookCorpus, using masked language modeling and next-sentence prediction objectives [17]. BERT has significantly advanced performance in a wide range of NLP tasks, including question answering, sentiment analysis, named entity recognition, and text classification. In the context of sentiment analysis, BERT can be applied in two main ways. First, it can be fine-tuned on a labeled sentiment dataset, allowing the model to adapt its general language understanding to the specific classification task. Second, BERT can serve as a teacher model in a process known as knowledge distillation, where its outputs are used to train a smaller, more efficient student model that mimics its behavior, making deployment in resource-constrained environments more feasible.
Areshey et al. [21] fine-tuned a BERT model for helpfulness classification tasks, which evaluate how popular or useful a review is perceived by other users. They investigated the influence of batch size and sequence length on model performance, concluding that a sequence length above 128 words is generally sufficient for this task, as longer input lengths yield only marginal improvements. In a different context, Mutinda et al. [22] proposed a modified BERT architecture for binary polarity classification on Yelp reviews. However, their evaluation was limited, as the results were reported only for the positive sentiment class. Moreover, the absence of information about the dataset—such as its size, composition, and the definitions of polarity—makes it difficult to assess the validity and generalization of their findings.
RoBERTa (Robustly Optimized BERT Pretraining Approach [18]) models share the same architecture as BERT but differ in their training procedure. The main difference is that RoBERTa removes next-sentence prediction from its objectives—as it is unnecessary for downstream tasks—and dynamically masks tokens instead of fixing them once per epoch. Also, RoBERTa uses a larger batch size and more training steps, resulting in longer pretraining. For instance, the original BERTweet model [23] pretraining procedure is based on RoBERTa for more robust performance.
Hugging Face is a widely adopted collaborative platform that enables the sharing and distribution of open-source machine learning models and applications. It offers high-level abstractions through its “pipelines” API, which simplifies the implementation of tasks, such as sentiment analysis, using transformer-based models. These pipelines abstract away much of the underlying complexity, allowing users to easily apply state-of-the-art models to a variety of natural language processing tasks. The platform hosts numerous fine-tuned BERT variants, making them readily accessible for testing, comparison, and integration into applications. Several pipelines are available for text classification, and some of them are specifically tailored for polarity detection, such as DistilBERT [24], the Pysentimiento [25] variant of BERTweet, and RoBERTa [26].
Recurrent Neural Networks (RNNs) were among the earliest deep learning architectures applied to NLP tasks due to their ability to model sequential information, effectively incorporating prior word context through a memory mechanism. However, traditional RNNs suffer from vanishing and exploding gradient problems, limiting their capacity to learn long-range dependencies. To address this limitation, Long Short-Term Memory (LSTM) networks were introduced. These models incorporate gating mechanisms to retain and control information over longer sequences. Bidirectional LSTMs (Bi-LSTMs) extend this architecture by processing input sequences in both the forward and backward directions, thus capturing both the preceding and following contexts for each token [27]. Despite their theoretical advantages, relatively few studies have systematically evaluated the actual performance gains (or potential trade-offs) of Bi-LSTMs compared to standard LSTMs in practical classification tasks.
Basiri et al. [28] evaluated various machine learning approaches, including LSTM and Bi-LSTM, on a small Persian dataset of online doctor reviews comprising only 700 samples. While their results provided insight into sentiment classification techniques, the limited dataset size restricts the applicability of their findings. Similarly, Wang et al. [29] conducted a comparative study between LSTM and traditional machine learning methods such as Naive Bayes, Maximum Entropy, Support Vector Machines (SVMs), and Convolutional Neural Networks (CNNs). However, their evaluation was based on a labeled dataset of just 177 negative and 182 positive Tweets, and model performance was assessed solely using accuracy—a metric insufficient for capturing the full effectiveness of classification models, especially in imbalanced settings. Kapali et al. [30] also performed a brief comparison of LSTM and Bi-LSTM models using a corpus of only 800 Bengali-language samples. They reported similar performance between the two architectures; however, the LSTM model employed a single-layer configuration, while the Bi-LSTM used a deeper, two-layer architecture. As with the previous studies, the small size and linguistic specificity of the dataset limit the robustness and applicability of the results.
Using a substantially larger dataset, Sadikin and Fauzan [31] compared the performance of Long Short-Term Memory (LSTM) networks with that of Multi-Layer Perceptrons (MLPs) for binary sentiment classification, using a test set of 20,000 Yelp reviews. Their study examined the influence of batch size on model performance. The LSTM model achieved a significantly higher accuracy of 91% compared to 75% for the MLP. However, the evaluation was limited to accuracy alone, with no reporting of complementary metrics such as recall, precision, or F1 score, which are essential for a more comprehensive assessment of classification effectiveness.
Chandra et al. [32] conducted a comparative study of LSTM, Bi-LSTM, and BERT models on vaccine-related Tweets, focusing on a multi-label sentiment classification task with 11 possible categories (e.g., optimistic, pessimistic, and denial). This type of classification differs fundamentally from polarity detection, as each text instance can be assigned multiple sentiment labels simultaneously. As such, their findings are not directly transferable to polarity classification tasks. Furthermore, the authors did not report any details regarding the architectural configurations of the LSTM and Bi-LSTM models, limiting the interpretability and reproducibility of their results.
Chandra and Saini [33] proposed a framework for modeling the outcome of the 2020 U.S. general elections based on sentiment analysis of Twitter data, using LSTM and BERT language models. Both models were trained or fine-tuned on the Internet Movie Database (IMDB) movie review dataset, a widely used benchmark in sentiment analysis containing labeled positive and negative film reviews, to evaluate their ability to capture sentiment. The authors reported that BERT and LSTM performed similarly in terms of training accuracy and F1 score. However, these results were limited to the IMDB dataset and were not the primary focus of the study. The main objective was to estimate state-level election results by computing the average polarity scores per state based on model predictions. In this context, BERT served as a general-purpose tool for modeling voting outcomes and suggested a victory for Biden. The LSTM model, while offering valuable insights for identifying swing states, struggled to capture voting dynamics effectively, largely due to its tendency to classify a large number of Tweets as neutral.
Bello et al. [34] explored the integration of BERT with CNN, RNN, and Bi-LSTM architectures for three-class sentiment classification using a large dataset of over 42,000 Tweets sourced from Kaggle. Their results indicated that combining BERT with these neural architectures leads to superior performance—generally exceeding 91% in terms of accuracy, recall, precision, and F1 score—compared to using CNNs or Bi-LSTMs alone. However, several methodological concerns limit the interpretability of their findings. The structure of the Bi-LSTM model was not thoroughly described, other than the mention of a single layer. Moreover, the performance of the standalone BERT-base model was not reported, which is a notable omission given its role as a baseline. A further concern relates to data quality: Tweets typically lack explicit user ratings, and the Kaggle dataset does not document how the sentiment labels were assigned. This absence of transparency raises questions about whether the Tweets were annotated manually or through automated heuristics, thereby casting doubt on the reliability of the labels and the validity of the conclusions drawn from the study.
While prior studies have provided valuable insights into sentiment classification using LSTM- and BERT-based architectures, they often differ in scope, dataset size, evaluation metrics, or the level of detail provided regarding model design. Consequently, there remains a gap in the literature for a clear, systematic comparison between these two families of models under consistent conditions. This study aims to address this gap by offering a comprehensive comparison of LSTM- and BERT-based approaches for sentiment polarity classification. It does so using a large and well-balanced dataset of Yelp reviews and reports results across standard evaluation metrics commonly used in the NLP community: accuracy, precision, recall, and F1 score. The architectures employed are described with clarity and rigor to support reproducibility, and the experimental setup is designed to provide a fair and transparent benchmark.
The remainder of this article is organized as follows. The next section describes the dataset and experimental protocol, including the preprocessing steps and model configurations. Section 3 presents the evaluation metrics and results obtained for each model. Section 4 discusses the findings in light of prior research, highlighting strengths and limitations. Finally, the last section concludes this study and outlines directions for future work.
2. Materials and Methods
2.1. Dataset of Yelp Reviews
The data were collected from the Yelp website (www.yelp.com/dataset accessed on 17 December 2024) for scientific research and educational purposes. The sentiment analysis in this study focuses on reviews from the city of Saint Louis, located in the state of Missouri, USA. This city was selected because it provided a sufficiently large number of reviews for meaningful analysis. These reviews concern geolocated businesses across various sectors, such as restaurants, bars, and retail, primarily in the USA and in Edmonton, Canada. Figure 1 displays the geographical distribution of the reviews, along with their total number, city by city. Eleven major cities are registered, as well as some other related suburban municipalities with fewer reviews.
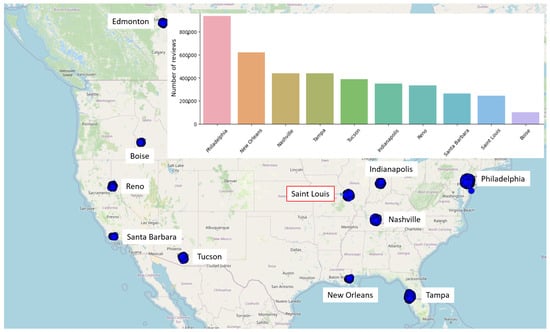
Figure 1.
Number of reviews for the most represented cities and category types in the Yelp dataset. Cartography: OpenStreetMap.
All reviews relating to the city of Saint Louis were exhaustively selected. Each review is labeled as one of three classes: negative, neutral, and positive. These emotional polarities are defined based on the stars given by users. The stars are converted to labels as follows: 1–2 stars for negative sentiments, 3 stars for neutral sentiments, and 4–5 stars for positive sentiments. In order to balance the number of reviews per class, the dataset was limited to a total of 107,946 reviews, consisting of 35,982 reviews in each sentiment class (negative, neutral, and positive). The distribution of data for training, validation, and testing is presented in Table 1.

Table 1.
Data split for 107,946 samples: number of Yelp reviews per polarity.
2.2. Methodology
2.2.1. Data Preprocessing
The preprocessing step aims to clean the raw text and retain only the essential information to be used as input to the models. Numerous techniques are available, each with a varying impact on the extraction of meaningful textual features [35]. In this study, several standard natural language processing operations were applied to transform text into numerical sequences. For each sentence, we perform lemmatization, the removal of stop words, conversion to lowercase, tokenization, and padding. These operations standardize the inputs and prepare them for ingestion by deep learning architectures.
The embedding layer transforms tokens into dense numerical vectors that capture semantic information. This transformation relies on lexical semantics, encoding similarity, and analogical relationships between words. The embedding process operates on the vocabulary of the tokenized input and converts each token into a fixed-dimensional vector representation, enabling the model to learn patterns in the data based on the contextual meaning of words.
BERT pipeline models have their own built-in embedding layers, pretrained on large corpora. In contrast, for the LSTM and Bi-LSTM models, we define a vocabulary of the 10,000 most frequent tokens from the training set. This vocabulary serves as the basis for generating input sequences for the embedding layer. Each text sequence is composed of N tokens: longer sentences are truncated after N words, and shorter texts are padded with zeros to reach the size N. Each token is then transformed into a dense vector of size 128. As a result, the embedding layer for the LSTM and Bi-LSTM models contains 1,280,000 trainable parameters, corresponding to the product of the vocabulary size (10,000) and the embedding dimension (128).
2.2.2. LSTM: Long Short-Term Memory
The Long Short-Term Memory (LSTM) model, introduced by Hochreiter et al. [36], is an improved variant of the Recurrent Neural Network (RNN), specifically designed to address the vanishing gradient problem encountered during the training of RNNs on long sequences. LSTM introduces a memory cell regulated by three gates: an input gate, a forget gate, and an output gate. These gates control the flow of information, determining what to retain, update, or discard over time. Internally, the LSTM architecture consists of four dense layers, each with the same number of hidden neurons. The input gate includes two layers: a sigmoid activation and a tanh activation. The forget gate and the output gate each contain a single dense layer with sigmoid activation. The input to each gate is formed by concatenating the current input token vector with the previous hidden state. The number of neurons in each dense layer corresponds to the dimensionality of the hidden state, ensuring consistency across all gates.
An LSTM network propagates two flows of information: the cell state (yellow arrows in Figure 2) and the hidden state . The flow of information for the hidden state is depicted by pink arrows in Figure 2. It is a folded representation of the word processing in a sequence of tokens, which is given by Equation (1):
where is the token currently processed from left to right in the sequence, starting with zero cell and hidden states.
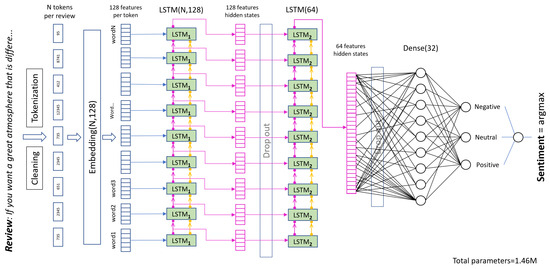
Figure 2.
Architecture of the two-layer LSTM: unfolded representation.
The LSTM model implemented for sentiment analysis consists of two LSTM layers. The first layer is LSTM(128), with 128 hidden neurons per dense layer in a many-to-many mode, as the output from each unfolded RNN cell is returned instead of only the last cell. The second layer is LSTM(64), with 64 hidden neurons per dense layer in a many-to-one configuration, where only the output from the final time step is returned. Figure 2 illustrates the unfolded representation of the LSTM model: each LSTM layer consists of a single cell that sequentially processes input tokens from left to right, updating its hidden and cell states after each word.
The final hidden-state value of the last LSTM layer is passed to an MLP (Multi-Layer Perceptron) for classification purposes. Two dense layers are used to process , the output hidden state of the second LSTM layer:
where is the rectified linear unit activation function and s is the softmax function. and are learnable weights and biases that optimize feature extraction.
The predicted sentiment polarity corresponds to the class with the highest probability in the output layer z. The total number of trainable parameters in this model is 1,463,171.
In multi-class sentiment analysis, the sparse categorical cross-entropy can be applied to measure prediction error. It does so by computing the log-probability of the correct class using the following formula:
It calculates the difference between the predicted probability distribution and the actual class label, where N is the number of examples in the batch, is the index of the correct class for example i, and is the predicted probability for sample i.
The Adaptive Moment Estimation (Adam) optimizer [37] was used for model training. We performed an extensive grid search over the hyperparameter space defined in Table 2, evaluating all combinations of learning rates, batch sizes, and dropout rates. For each configuration, we trained the model multiple times with different random initializations to assess training stability and performance variability.
Table 2.
Hyperparameter search space for LSTM and Bi-LSTM training.
The final selected hyperparameters, with a learning rate of , a batch size of 32, and a dropout rate of 0.2, were chosen based on their consistent performance across initializations, measured in terms of validation accuracy and convergence behavior. The selected batch size offers a favorable balance between convergence speed and generalization, while the chosen dropout rate helps prevent overfitting without degrading learning dynamics. These values were used for all experiments involving LSTM and Bi-LSTM models reported in the Results section.
2.2.3. Bi-LSTM: Bidirectional Long Short-Term Memory
The Bidirectional Long Short-Term Memory (Bi-LSTM) model meets the same requirements as the standard LSTM in terms of capturing long-range dependencies within sequential data. Its distinctive feature lies in its ability to process information in both temporal directions simultaneously—left to right and right to left. To achieve this, a Bi-LSTM network is composed of two directional LSTM layers: one dedicated to forward processing and the other to backward processing. The outputs from these two layers are combined to provide the model with contextual information from both past and future tokens, enhancing its predictive capabilities.
The architecture of the Bi-LSTM used in this study is illustrated in Figure 3a. It consists of two stacked Bi-LSTM layers with decreasing hidden layer sizes. The total number of trainable parameters is 1,424,387. The hyperparameters explored during training were the same as those used for the LSTM model and are detailed in Table 2.
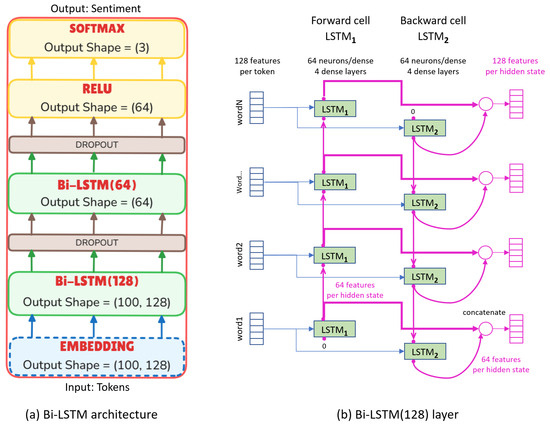
Figure 3.
(a) Architecture of the Bi-LSTM model with its number of parameters. (b) Diagram of the principle of a Bi-LSTM layer: unfolded representation.
The optimal parameters used to train the Bi-LSTM for the subsequent tests were as follows: learning rate = , batch size = 64, and dropout rate = 0.2.
Figure 3b illustrates the principle of a Bi-LSTM layer in a many-to-many configuration. The example shown corresponds to Bi-LSTM(128), where cell states are omitted for clarity. The layer consists of two separate LSTM cells: LSTM1 processes the input sequence from left to right, while LSTM2 processes it in reverse. Each cell propagates a hidden state with 64 features. After both LSTM1 and LSTM2 have processed a given token, their respective output hidden states are concatenated. This combined representation is then passed to the next stacked Bi-LSTM layer.
2.2.4. BERT: Bidirectional Encoder Representations from Transformers
BERT (Bidirectional Encoder Representations from Transformers) is a transformer-based model that captures the context of words by analyzing them in both directions simultaneously, allowing it to understand each word’s meaning based on its surrounding context. BERT was pretrained based on two key objectives: masked language modeling, in which random tokens in the input are masked and the model is required to predict them, and next-sentence prediction, which aims to model relationships between consecutive sentences. To solve these tasks, BERT consists of a stack of identical transformer encoder blocks. After tokenization, each input sequence is converted into word embeddings and passed through the encoder layers. Each encoder produces an output vector of size 768 in the base model. Although the encoder layers share the same structure, their weights are independent. Each encoder is composed of two sub-layers: a multi-head self-attention mechanism and a feed-forward neural network. All input sequences are represented as a list of n-dimensional vectors: in the first encoder, these vectors correspond to word embeddings, starting with a special [CLS] token and terminating with an [SEP] token. In the subsequent layers, the input is the output from the previous encoder, as illustrated in Figure 4.
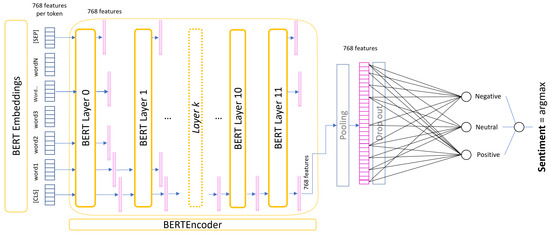
Figure 4.
Architecture of a BERT-base model fine-tuned for sentiment analysis.
Computing self-attention begins by generating three vectors from each of the encoder’s input representations, called query (Q), key (K), and value (V) vectors. For the first encoder layer, each word of the input sequence is embedded into a matrix X; subsequent encoders take as input the output X from the preceding encoder. The matrix X is then multiplied by three trainable weight matrices, , , and , to compute the corresponding Q, K, and V matrices, as defined by Equation (5):
Each row in Q, K, and V represents the projection of a token onto the corresponding query, key, and value spaces. These projections are used to compute attention scores between the token of interest and all other tokens in the sequence. The attention score is computed as the dot product between the query vector of a given token and the key vectors of all other tokens. Thus, each token is associated with as many attention scores as there are tokens in the sequence.
These raw scores are then normalized using a softmax function to produce a probability distribution over all tokens, reflecting how much attention the current token should pay to each other token in the sequence. The final output of the self-attention mechanism is computed as a weighted sum of the value vectors, where the weights are given by the softmax scores. This is formalized in the scaled dot-product attention formula (Equation (6)):
Here, is the dimensionality of the feature vectors. The scaling factor is introduced to prevent large dot-product values, which could lead to vanishing gradients after the softmax. Each row of the resulting matrix Z is a 768-dimensional vector representing the contextualized representation of a token after the self-attention operation.
A core property of transformer models is that each token follows its own processing path within the encoder, and the self-attention mechanism models dependencies between tokens. Each token vector is then passed through the same feed-forward network, resulting in 768-dimensional output vectors forwarded to the next encoder. The BERT-base architecture includes 12 encoder layers, each with a hidden size of 768 and 12 attention heads, amounting to a total of 110 million parameters.
BERT is a foundational model in natural language processing, capable of performing a wide range of tasks and frequently serving as a base for specialized applications through transfer learning. Its pretraining on a large corpus, comprising 11,000 unpublished books from BookCorpus and English Wikipedia, makes it highly adaptable across domains. BERT generates contextualized vector representations for each token in a sequence. The final representation of the special [CLS] token can be used as input for downstream tasks such as sentiment analysis. As illustrated in Figure 4, this [CLS] token embedding is passed to a Multi-Layer Perceptron (MLP) classification head, which is fine-tuned on a task-specific labeled dataset provided by the user. The pooling applied to the [CLS] representation is performed by a dense layer with a activation function, and the dropout layer randomly sets 10% of the input units to 0 at each step during training. In addition to fine-tuning, BERT can also serve as a teacher model in knowledge distillation—a process in which its knowledge is transferred to a smaller, faster model that is pretrained on the same dataset. This enables the deployment of efficient models while retaining much of BERT’s predictive capacity.
On the Hugging Face Hub, four pipelines are very popular for sentiment analysis, as summarized in Table 3. These include DistilBERT, the default pipeline for sentiment analysis; RoBERTa and BERTweet; and the BERT model fine-tuned by the user community that goes by the name "nlptown".
Table 3.
Details of the pipelines investigated. BERT-base has 110M parameters.
The DistilBERT pipeline (https://huggingface.co/distilbert/distilbert-base-uncased-finetuned-sst-2-english, accessed on 18 May 2025) was developed by the Hugging Face team [24]. It is a smaller and faster version of BERT, created through knowledge distillation and trained on the same corpus as BERT. Its architecture consists of 6 transformer blocks totaling 67 million parameters. BERT was trained on approximately 3.3 billion words, sourced from two large text corpora: BooksCorpus (800 million words), a dataset of unpublished books, and English Wikipedia (2.5 billion words). This corresponds to roughly 160 to 250 million sentences. In Table 3, we reported +200M as a rough estimate of the number of BERT-base training samples used as the basis for the DistilBERT and BERT pipelines.
DistilBERT was fine-tuned on 67,349 sentences from the Stanford Sentiment Treebank dataset [38], which contains individual sentences from movie reviews annotated by three human annotators. The binary classification version of SST-2 (with the neutral labels removed) was used and is available at (https://huggingface.co/datasets/stanfordnlp/sst2 accessed on 18 April 2025). DistilBERT is currently the most downloaded pipeline for text classification on the Hugging Face Hub, although it outputs only two sentiment classes.
The RoBERTa pipeline (https://huggingface.co/cardiffnlp/twitter-roberta-base-sentiment-latest, accessed on 18 May 2025) was developed by the Research Group in Natural Language Processing at Cardiff University [26,39]. It is a RoBERTa-base model pretrained on 124 million Tweets and fine-tuned for sentiment analysis with 45k annotated samples from the TweetEval dataset [20]. The RoBERTa pipeline comprises approximately 124 million parameters. It is the second most downloaded pipeline for polarity detection on the Hugging Face Hub and the most popular among those supporting multi-class sentiment classification.
The BERTweet pipeline (https://huggingface.co/finiteautomata/bertweet-base-sentiment-analysis, accessed on 18 May 2025) was developed by Juan Manuel Pérez [25]. It is a fine-tuned version of the original BERTweet model by Nguyen et al. [23]. The pipeline method is referred to as Pysentimiento in [25] because it is part of a multilingual text classification framework that adapts to various tasks—sentiment, emotion, hate speech, and irony—across different languages. For English sentiment analysis, the backbone of the method is BERTweet, which is the name retained in this article. BERTweet was pretrained on 850 million English Tweets using the RoBERTa training procedure and fine-tuned on 40k sentiment-labeled Tweets. It contains approximately 135 million parameters and ranks among the top five most downloaded pipelines for polarity detection on the Hugging Face Hub.
The BERT pipeline (https://huggingface.co/nlptown/bert-base-multilingual-uncased-sentiment, accessed on 18 May 2025), developed by NLP Town, is one of the most downloaded pipelines for text classification on the Hugging Face Hub—second in popularity among tri-polarity models, following the CardiffNLP team pipelines. It is a BERT-base model fine-tuned on 630k product reviews in multiple languages. The model contains a total of 167 million parameters. Originally designed for fine-grained sentiment classification, this pipeline outputs sentiments on a 1-to-5-star scale. For the purpose of this study, we converted the outputs to a tri-class format: reviews with 1–2 stars were labeled as negative, 3 stars as neutral, and 4–5 stars as positive.
The interest of these pipelines is twofold: they are highly reproducible and very light and easy to use. Their usage only requires one instruction for loading the BERT model and one instruction for the classification of a sentence; for instance, to predict the sentiment of the sentence “This restaurant is very good!”, the following code is necessary: 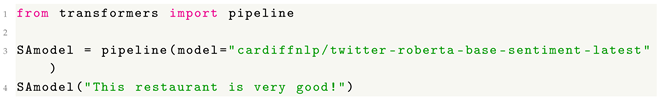
The last instruction computes the sentiment prediction over the input sentence. We used some of the most popular pipelines from Hugging Face, but users can select a specific sentiment analysis model better suited to their specific use case (e.g., Tweets, products, financial reviews, or emotion detection) or language by providing the name of a model from the available catalog.
3. Results
3.1. Performance Indicators
Accuracy is the ratio of correctly predicted labels to the total number of reviews. Precision is the ratio of correctly predicted positive labels to the total number of predicted positive labels. Recall is the ratio of correctly predicted positive labels to the total number of actual positive labels. A more balanced metric is the F1 score, which is the harmonic mean of precision and recall. The F1 score ranges from 0 to 1, with 1 being the best possible score. A confusion matrix is a more thorough way to visualize and analyze the performance of a sentiment analysis model: it is a table that shows the distribution of predicted labels versus actual labels for each class. It is used to identify precisely where the model is making mistakes and which classes are more difficult to classify.
Accuracy measures the overall correctness:
Precision measures how many predicted positive sentiments are actually correct:
Recall (sensitivity) measures the proportion of actual positive sentiments correctly identified:
The F1 score combines precision and recall, providing a balanced assessment of the model’s performance in predicting each sentiment category:
Except for accuracy, these metrics require defining the notions of true positives (TPs), false positives (FPs), and false negatives (FNs); these notions are related to the target sentiment considered. For instance, for the negative sentiment class, a true positive is a review labeled as negative and correctly predicted as negative.
When evaluating a sentiment analysis model with two outputs—negative and positive—it is standard practice to treat it as a binary classification problem. In such cases, the F1 score, precision, and recall are typically calculated separately for each class, meaning one has precision and recall for the positive class and precision and recall for the negative class. This approach gives a clearer picture of how well the model performs in each sentiment category, although some works [40] only report the results for the positive class, which can be impractical if the dataset is imbalanced (e.g., more positive than negative samples) or if one class is more important to classify correctly than the other.
For a three-class classification problem, with negative, neutral, or positive as possible outputs, the TPs, FPs, and FNs are also defined for each class separately. For instance, for the positive sentiment class, a TP is a sample predicted by the model as positive that is actually positive, an FP is a sample predicted by the model as positive that is actually negative or neutral, and an FN is a sample predicted by the model as negative or neutral that is actually positive. For the positive class, recall measures how many of the actual positive sentiments the model correctly identified, out of all actual positive sentiments, and precision measures how many of the reviews predicted as positive are actually positive.
Therefore, the performance in each class is measured using three metrics—precision, recall, and F1 score—each supported by a certain number of test samples. We can globally assess the model by its accuracy and the macro-averages of precision, recall, and F1 score.
3.2. Experimental Results on Yelp Reviews
Table 4 reports the complete results obtained for each class on the test set containing 10,795 Yelp reviews. LSTM, which was trained on substantially less data than the BERT pipeline methods, attained the best overall results, with an accuracy of 77%, followed closely by the Bi-LSTM method (75%). For all sentiment labels, LSTM achieved the best F1 scores with 80% for negative, 68% for neutral, and 81% for positive sentiments. Bi-LSTM achieved an F1 score performance close to that of LSTM: the bidirectionality of the method did not bring much improvement to the LSTM approach.
Table 4.
Summary of models’ performance on the test dataset. Bold percentages indicate the highest value in each column.
Positive and negative classes were well modeled, with all performance metrics in the range of 80–84% for the LSTM and 73–84% for the Bi-LSTM. For the BERT methods, the ranges were larger, with precision, recall, and F1 score values between 40% and 77% for BERTweet, between 55% and 91% for RoBERTa, and between 62% and 88% for BERT.
Neutral sentiment is harder to capture, even for a human, as this sentiment class can be very subjective. Algorithmic approaches for classifying text as neutral struggled to grasp the correct modeling for this target label, although the LSTM-based approaches performed relatively well, with a recall of about 70% on neutral sentiments, meaning that out of ten neutral reviews, seven were correctly labeled by these methods. However, for the LSTM and Bi-LSTM methods, we observed a decrease of about 10% in the F1 score for the neutral class compared to the positive and negative classes. This drop in performance was far worse for the BERT-based approaches, with F1 scores ranging from 26% for RoBERTa to 46% for BERT.
Although overall RoBERTa performed worse than LSTM, it achieved an impressive recall of 91% on positive sentiments but an F1 score of only 68%, which can be explained by the bias of the method toward positive outputs. On the other hand, BERT achieved an impressive recall of 88% on negative sentiments but with a precision of 62%, reflecting its tendency to classify text input as negative.
Figure 5 displays the distribution of predictions for each model on the Yelp test set, comprising 10,795 reviews equally distributed among the three polarities. The results highlight significant differences in the way these models classify reviews as negative, neutral, or positive. LSTM exhibited the most balanced distribution, classifying reviews almost evenly as negative, neutral, or positive. It did not strongly favor any polarity compared to transformer-based models. BERT leaned toward negative predictions (48% of its predictions), indicating a bias in how it interprets sentiment, possibly being more sensitive to negative cues. BERTweet and RoBERTa favored positive polarity, with 50% and 56% of their predictions, respectively, recognizing positive sentiment.
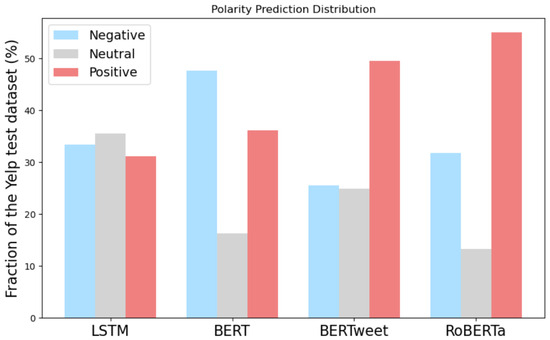
Figure 5.
Prediction distribution for each model: the Yelp dataset is balanced with an approximately equal number of negative, neutral, and positive reviews.
The confusion matrix of the LSTM model, as displayed in Figure 6, indicates that 8265 reviews out of 10,795 were correctly classified; 2915 out of 3652 negative sentiments were correctly classified, 2529 out of 3586 neutral sentiments were correctly classified, and 2821 out of 3557 positive sentiments were correctly classified. Accuracy is reflected by the diagonal elements, precision corresponds to the columns, and recall corresponds to the rows. Accuracy is indeed the sum of diagonal elements divided by the sum of all elements of the matrix: the darker the diagonal, the better the classifier. For the negative target label, for instance, precision is the number in the first cell divided by the sum of elements in the first column, while recall is the number in the first cell divided by the sum of the elements in the first row.
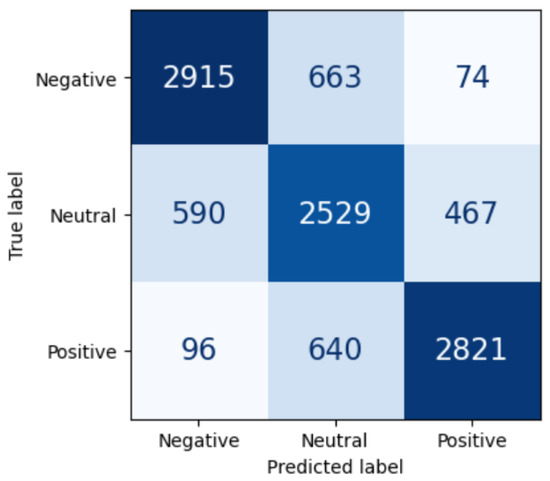
Figure 6.
Confusion matrix of the LSTM model on the Yelp test dataset.
Figure 7a depicts the confusion matrix of Bi-LSTM computed on the test dataset. It indicates that 8094 out of 10,795 reviews were correctly classified overall; 2680 out of 3652 negative sentiments were correctly classified, 2523 out of 3586 neutral sentiments were correctly classified, and 2891 out of 3557 positive sentiments were correctly classified.
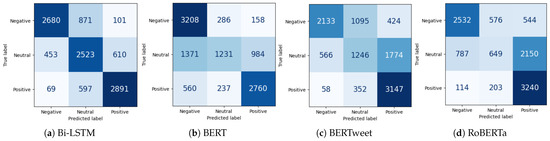
Figure 7.
Confusion matrices of the (a) Bi-LSTM method, (b) BERT pipeline, (c) BERTweet pipeline, and (d) RoBERTa pipeline on the Yelp test dataset.
The confusion matrix of the BERT pipeline shows that 7199 out of 10,795 reviews were correctly classified, as illustrated in Figure 7b. Specifically, 3208 out of 3652 negative sentiments were correctly classified, 1231 out of 3586 neutral sentiments were correctly classified, and 2760 out of 3557 positive sentiments were correctly classified. The BERT pipeline performed better than the other BERT-based pipelines and the LSTM-based models on negative sentiments, better than RoBERTa on neutral and negative sentiments, and better than BERTweet on negative sentiments.
The confusion matrix of the BERTweet pipeline shows that 6526 out of 10,795 reviews were correctly classified, as illustrated in Figure 7c. A total of 2133 out of 3652 negative sentiments were correctly classified, 1246 out of 3586 neutral sentiments were correctly classified, and 3147 out of 3557 positive sentiments were correctly classified. The BERTweet pipeline exhibited the worst performance among all the methods investigated. It achieved a recall of 88% on positive sentiments, meaning that many positive reviews were correctly predicted, but with a precision of only 59%, meaning that many reviews from other classes were also classified as positive.
Figure 7d represents the confusion matrix of the RoBERTa pipeline on the test dataset. It indicates that, overall, 6421 out of 10,795 reviews were correctly classified; 2532 out of 3652 negative sentiments were correctly classified, 649 out of 3586 neutral sentiments were correctly classified, and 3240 out of 3557 positive sentiments were correctly classified. The RoBERTa pipeline clearly performed better on positive sentiments and worse on neutral sentiments; neutral reviews tended to be classified as positive, amounting to 2150 of them (60%). Compared to the other methods, it correctly classified more positive reviews, with a recall of 91% on positive sentiments, but with a precision of only 55%, meaning that many other Yelp reviews were also incorrectly classified as positive.
It appears that RoBERTa had an overall tendency to classify text as positive, a bias it shares with BERTweet, as shown in Figure 5, where more than 50% of their predictions had a positive polarity on the Yelp dataset.
We computed the mean of the precision, recall, and F1 score across all classes to obtain the final macro-averaged precision, recall, and F1 score, as shown in Figure 8. The macro-performance indicators are represented on the x-axis, and the performance achieved on the dataset is represented on the y-axis. LSTM achieved accuracy, macro-averaged precision, recall, and F1 score values of 77%. Bi-LSTM achieved accuracy, macro-averaged precision, recall, and F1 score values of 75%, 76%, 75%, and 77%, respectively. BERT achieved accuracy, macro-averaged precision, recall, and F1 score values of 67%, 68%, 67%, and 64%, respectively. BERTweet achieved accuracy, macro-averaged precision, recall, and F1 score values of 60%, 61%, 61%, and 59%, respectively. RoBERTa achieved accuracy, macro-averaged precision, recall, and F1 score values of 59%, 58%, 60%, and 55%, respectively.
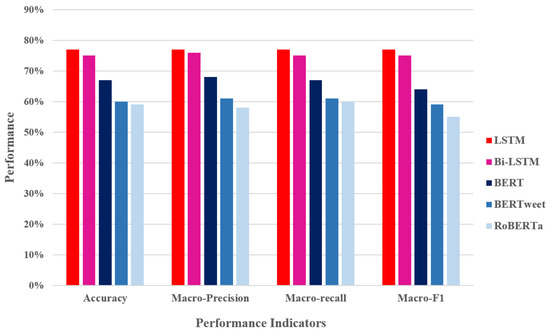
Figure 8.
Comparison of performance: macro-indicators.
Since the target classes were balanced—negative, neutral, and positive reviews were evenly distributed– this graphic of macro-indicators can be used to globally compare the performance of the methods. LSTM-based methods performed better on all accounts, with the BERT pipeline achieving superior results compared to RoBERTa and BERTweet. BERTweet and RoBERTa exhibited similar performance, but BERTweet achieved better macro-precision.
Regarding a binary polarity classification problem with only negative and positive target sentiments, we can compare the DistilBERT method with LSTM by regrouping DistilBERT’s negative and neutral output classes; the test set consisted only of 3652 negative and 3557 positive samples, as specified in Table 1.
Figure 9 illustrates the results achieved by both methods. The performance of DistilBERT and LSTM was similar, with LSTM having the advantage in terms of accuracy, precision, and recall for both classes. We can see that LSTM achieved significantly better recall on negative labels and better precision on positive labels, predicting fewer negative reviews as positive compared to DistilBERT.
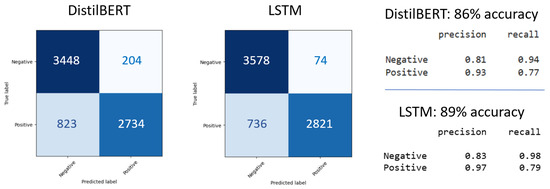
Figure 9.
Confusion matrix of DistilBERT and LSTM for binary sentiment classification on the test dataset.
3.3. Experimental Results on Other Databases
The results presented in the previous section were obtained solely on the Yelp test dataset, which may lead to domain-specific limitations. It is important to further validate the models’ effectiveness on other datasets with more diversity. We chose three datasets of a more diverse nature: Google Maps restaurant reviews, Amazon product reviews, and the SemEval 2017 Task 4 dataset. The first dataset contains comments about places, the second relates to products purchased online, and the third comprises Tweets related to more general and diverse topics.
The Google Maps restaurant reviews were collected by webscraping; software extracted 15k reviews along with their star ratings, given by customers of restaurants in the city of Paris, France. Stars were converted to labels: 1–2 stars for negative sentiments, 3 stars for neutral sentiments, and 4–5 stars for positive sentiments. We produced a balanced dataset with 5k reviews per sentiment, as reported in Table 5.
Table 5.
Google Maps restaurant reviews, Amazon product reviews, and SemEval Tweets: number of reviews per polarity.
The Amazon product review dataset was extracted from the Amazon Reviews’23 dataset [41]. We used the subset “Subscription Boxes” (https://amazon-reviews-2023.github.io/ (accessed on 23 April 2025)), comprising 16k reviews along with their ratings and metadata. The dataset is imbalanced, with two-thirds of the reviews labeled positive and one-quarter labeled negative.
The last dataset was collected from the International Workshop on Semantic Evaluation. We used the test set of the SemEval 2017 Task 4 subtask A dataset [42], containing 12k hand-labeled Tweets, including the overall sentiments of the Tweets. It is imbalanced, with half of the Tweets labeled neutral and one-third labeled negative, as reported in Table 5.
Figure 10 presents a comparative performance analysis of four sentiment analysis methods—LSTM (red), BERT (deep blue), BERTweet (light blue), and RoBERTa (lighter blue)—across four key metrics: accuracy, macro-precision, macro-recall, and macro-F1 score. The dataset used is the Google Maps restaurant reviews, containing 15.2k reviews distributed equally across sentiments.
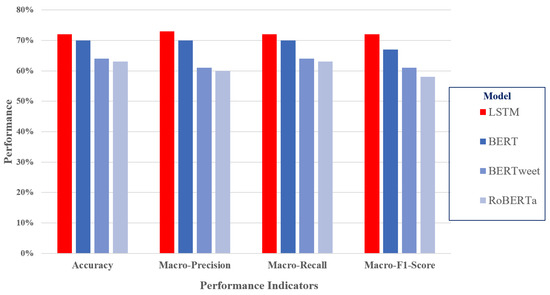
Figure 10.
Results on the Google Maps restaurant reviews dataset.
Overall, LSTM and BERT performed the best across all metrics, with values slightly above 70%. RoBERTa and BERTweet exhibited poorer performance, with values under 65%. This suggests that traditional deep learning models (LSTM) and established transformer models (BERT) are more effective for sentiment analysis compared to more specialized models such as RoBERTa and BERTweet.
LSTM and BERT maintained a strong balance between precision and recall, ensuring both accurate classification and comprehensive coverage of sentiment categories. BERTweet and RoBERTa lagged behind, indicating potential challenges in capturing nuanced variations in sentiments. Since the F1 score balances precision and recall, its trend followed the same pattern: LSTM and BERT exhibited the best performance, while RoBERTa and BERTweet exhibited weaker performance.
Figure 11 reports the performance results on the Amazon product review dataset. BERT achieved the best performance across all metrics, making it the most effective model in this comparison. This was expected since this BERT model was fine-tuned on a dataset of product reviews. BERTweet and RoBERTa performed similarly, slightly below BERT, suggesting that they are competitive but may require further optimization. LSTM trailed behind the transformer-based models, achieving lower accuracy and macro-F1 score values.
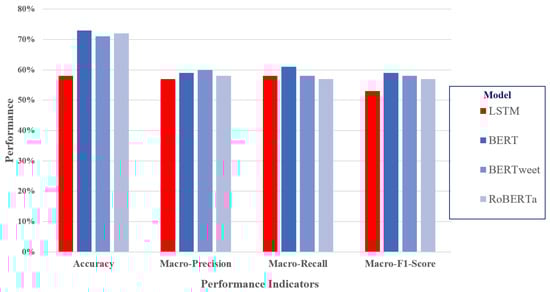
Figure 11.
Results on the Amazon product reviews dataset.
The three BERT-based methods achieved considerable accuracy values, outperforming LSTM by a noticeable margin. Since LSTM relies on sequential learning, it struggled with contextual understanding compared to the transformer-based models. LSTM was also trained on Yelp reviews, which pertain to rating businesses, whereas the other BERT-based methods were fine-tuned on product reviews or Tweets, which are closer in nature to rating a product, compared to Google Maps restaurant and Yelp reviews, which are more similar in nature. The fact that LSTM’s precision and recall values were similar to those achieved by the other methods stemmed from its better classification of the neutral class.
Figure 12 shows the performance results on the SemEval 2017 database. Both BERTweet and RoBERTa achieved consistently higher values across all metrics, with accuracy, macro-precision, macro-recall, and macro-F1 score values of around 70%. These models outperformed LSTM and BERT, highlighting the effectiveness of the domain-specific pretraining and fine-tuning of BERTweet and RoBERTa, which are based on a RoBERTa-base model trained on millions of Tweets and fine-tuned for sentiment analysis on 40 to 45k Tweets. Just like the LSTM trained on Yelp reviews performed better on a Yelp test set, these two methods are better suited for classifying Tweets.
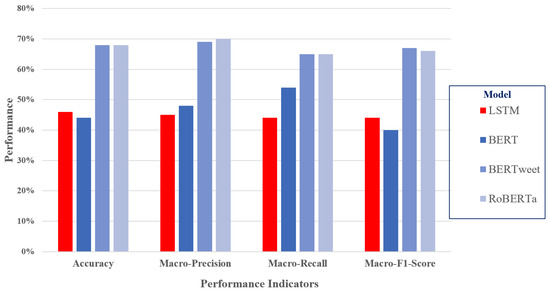
Figure 12.
Results on the SemEval 2017 Task 4 subtask A dataset.
The BERT model was trained on a more general corpus (Wikipedia and BookCorpus) and fine-tuned on a set of product reviews. It was noticeably weaker than the Tweet-trained BERTweet and RoBERTa, as was the LSTM, which lagged behind, especially in the macro-precision and macro-F1 score metrics, which were below 50%. This was due to fine-tuning limitations, where training BERT-based models on social media texts provides an advantage in sentiment detection.
4. Discussion
4.1. Findings Inferred from the Results
Overall, we can see that using a large BERT pipeline model—with hundreds of millions of parameters and trained through a time-consuming process involving a very large corpus of data—does not ensure the best performance on the Yelp reviews dataset. Training a deep neural network with two LSTM layers achieved better performance on the Yelp test set, similar to what was observed on the Google Maps restaurant reviews training set.
Across a range of test sets, transformer models generally outperformed traditional RNN-based models, especially when applying a single model to various text analysis tasks, from general comments, such as Tweets, to movie or product reviews. But LSTM still holds strong: depending on the dataset’s characteristics, training an LSTM can still be a viable option when computational efficiency is a priority. As shown in Table 6, an LSTM model can process a Tweet 20 times faster than a BERT pipeline. Memory usage refers to the peak RAM required to process the 12k Tweets of the SemEval 2017 dataset, although this metric is less important since modern hardware capabilities have reached the gigabyte range.
Table 6.
Recommended models and their computational costs based on the type of application.
Beyond architecture and data considerations, our analysis on the Yelp dataset revealed interesting behavioral differences among models. RoBERTa, for instance, demonstrated a strong bias toward predicting positive sentiments and performed poorly on neutral sentiments. BERTweet exhibited a similar tendency. Despite these shortcomings, RoBERTa achieved an impressive recall of 91% on positive sentiments, although this was accompanied by a relatively low F1 score of 68%, reflecting its over-prediction of the positive class. Conversely, BERT achieved a recall of 88% on negative sentiments but with only 62% precision, indicating a tendency to classify inputs as negative.
These patterns highlight the trade-off between class-specific performance and overall balance. While transformer-based models excel in detecting particular classes, their predictions may be skewed without fine-tuning or calibration. This reinforces the value of interpretable and customizable models like LSTM, especially when balanced performance across classes is required.
Finally, we note that although BERT-based pipelines are easier to deploy and require minimal coding skills—making them appealing for non-specialist users—training an LSTM model requires collecting domain-specific data, understanding deep learning concepts, and implementing training workflows. Thus, the choice of model should take into account not only predictive performance but also deployment constraints, technical expertise, and resource availability.
4.2. Comparison with Related Works
Bi-LSTM models are theoretically advantageous over LSTMs due to their ability to capture contextual information from both past and future tokens. However, our results do not fully support this assumption. One possible explanation is that, in the context of sentiment analysis on datasets such as Yelp reviews, sentiment is often expressed through specific keywords or phrases that are already sufficiently informative when processed in a unidirectional manner. Our findings are consistent with those reported by Hussain and Naseer [43], who conducted a comparative analysis of Logistic Regression, LSTM, and Bi-LSTM models on the IMDB movie reviews dataset. Their results showed that while Bi-LSTM achieved slightly higher accuracy than LSTM (87% vs. 86%), the improvement was marginal.
Loureiro et al. [26] reported that, on the TweetEval dataset containing 11k test Tweets (SemEval 2017 Task 4), BERTweet and the original RoBERTa-base (not fine-tuned) attained macro-recall values of 73%, while Bi-LSTM achieved only 58%. In contrast, our results (Figure 8) showed macro-recall values of 74% for Bi-LSTM and 60% for RoBERTa and BERTweet. The Bi-LSTM architecture and training details were not reported in [26], so it is difficult to interpret the difference. A possible explanation for BERTweet’s good results on TweetEval is that BERTweet was fine-tuned on a dataset of Tweets, so its performance was better on textual data of the same type and worse on Yelp reviews, as they are not the same type of comments.
Perez et al. [25] tested the BERTweet pipeline on the SemEval 2017 Task 4 dataset and reported performance using macro-F1 scores. In sentiment analysis, they reported similar macro-F1 scores of around 70% for BERT and RoBERTa, and around 72% for BERTweet. On our Yelp dataset, the macro-F1 score for BERTweet was closer to 60%. According to Perez et al. [25], the performance of BERTweet varied depending on the test dataset. For instance, on the Amazon product reviews dataset, the macro-F1 score was only 63%, similar to what we achieved on the Yelp dataset. This indicates that BERTweet is more suitable for Tweet-like textual polarity detection.
Iqbal et al. [40] compared different LSTM models for polarity detection of consumer reviews on a Yelp dataset (the authors did not report the number of samples tested). One of the models tested contained two LSTM layers (Model 3), similar to the one we built. Model 3 achieved a precision of 71%, a recall of 60%, an F1 score of 61%, and an accuracy of 81%. Our results cannot be directly compared for three reasons: first, their task was a binary problem with negative and positive target classes; second, they did not document the Yelp reviews they used; and third, they did not stipulate what target classes these metrics related to. Since they did not mention that they used macro-metrics, one can assume that the results relate to the positive sentiment target class. In this class, our LSTM model achieved a precision of 84%, an accuracy of 79%, and an F1 score of 68%, with a similar accuracy. The difference was probably due to the architecture; Iqbal et al. chose two identical consecutive layers, LSTM(100)–LSTM(100), each with 100-dimensional hidden states, whereas our architecture follows the basic principle of deep learning, with a decreasing number of units in the two LSTM layers: the first one with 128 units, and the second one with half of that, LSTM(128)–LSTM(64), which allows for better feature extraction.
4.3. Methodological Limitations
One limitation of this study is that all reviews used to train the LSTM-based methods were sourced from the Yelp Open Dataset. Although the corpus is rich and diverse, it is domain-specific. To confirm the results, further evaluations should be conducted using a training dataset that combines samples from other review datasets from different platforms or domains.
Additionally, the architecture of the LSTM used here was arbitrarily fixed to two layers. Only the training hyperparameters were optimized using grid search. In future work, we aim to explore architectural variations such as the number of layers and the size of the hidden state. The impact of the sequence length and embedding dimensions—parameters often set arbitrarily in practice—also warrants more systematic investigation.
The size of the training dataset is another important factor to consider. While we used a balanced dataset containing over 100,000 reviews, it remains to be seen how performance scales with more or fewer samples. Understanding the minimal dataset size needed to achieve satisfactory performance could help guide applications in resource-constrained scenarios.
4.4. Recent Developments in Transformer-Based Models and LLMs
Very recent advances in transformer-based architectures have led to the development of more efficient and robust models, such as ModernBERT [44], which introduces improvements over the original BERT in terms of training stability, representation quality, and scalability. However, despite these technical advances, no tri-polar sentiment classification pipeline based on ModernBERT was available at the time of our experiments. While some variants of ModernBERT have been fine-tuned for multilingual sentiment analysis or emotion detection, these models are not directly applicable to our setting, which focuses on polarity-based classification (positive, neutral, and negative) over structured review data such as Yelp. In contrast, the encoder-only transformer models we selected—BERT, RoBERTa, DistilBERT, and BERTweet—are all supported by readily available and reproducible pipelines tailored to tri-polar sentiment classification. This practical consideration, combined with their proven performance and efficient integration into large-scale workflows, motivated our choice to focus on these architectures rather than exploring recent alternatives that, although promising, were not yet mature or aligned with our specific task.
The field of sentiment analysis has undergone a significant transformation with the rise of large language models (LLMs), such as LLaMA, Mistral, and GPT-4. These models have set new benchmarks for language understanding, surpassing traditional encoder-based architectures like BERT and RoBERTa in various sentiment classification tasks. One particularly notable advancement is LLM2vec [45], an approach that leverages the embeddings from these large models to enhance sentiment analysis performance across multiple domains.
Recent studies have demonstrated that LLMs can achieve state-of-the-art results in sentiment classification, even in zero-shot and few-shot learning settings [46]. Despite their impressive capabilities, LLMs introduce new challenges in sentiment analysis. Their reliance on massive computational resources and specialized fine-tuning techniques makes them less accessible to practitioners who require ready-to-use NLP solutions.
In contrast to LLMs, Hugging Face pipelines provide a more user-friendly approach to sentiment analysis. These pipelines allow researchers and practitioners to apply pretrained transformer models with minimal setup, making them ideal for applications where ease of use is prioritized over cutting-edge performance. While LLMs offer superior accuracy in complex sentiment tasks, Hugging Face pipelines remain a practical choice for those seeking efficient, accessible, and interpretable NLP solutions.
5. Conclusions
This paper presents a comparative study of LSTM-based models and BERT-based pipeline models for sentiment analysis using the Yelp Open Dataset. We evaluated the performance of LSTM, Bi-LSTM, and some of the most popular transformer-based pipelines available on Hugging Face—DistilBERT, BERT-base, RoBERTa, and BERTweet—using standard metrics, including accuracy, precision, recall, and F1 score.
Our results on the Yelp dataset showed that a domain-specific trained LSTM model outperformed all other models in overall performance, achieving 77% across all macro-level metrics, despite having significantly fewer parameters than the BERT-based models. The Bi-LSTM architecture yielded results comparable to the LSTM, indicating that bidirectional processing did not provide substantial added value in this context. It appeared that RoBERTa had an overall tendency to classify text as positive, a bias it shares with BERTweet. RoBERTa also performed poorly in classifying neutral Yelp reviews. Although overall RoBERTa performed worse than LSTM, it achieved an impressive recall of 91% on positive sentiments, which is high, but with an F1 score of only 68%, which can be explained by the bias of the method toward positive outputs. On the other hand, BERT achieved an impressive 88% recall on negative sentiments but with a precision of 62%, reflecting its tendency to classify text inputs as negative.
To further assess the robustness and transferability of the LSTM model, we evaluated its performance on three additional datasets of varying nature: Google Maps restaurant reviews, Amazon product reviews, and the SemEval 2017 Task 4 dataset containing manually annotated Tweets. On the Google Maps restaurant reviews dataset, which shares a similar domain and structure with the Yelp reviews dataset, the LSTM achieved performance levels comparable to BERT, with the macro-level metrics slightly above 70%, outperforming RoBERTa and BERTweet, which remained below 65%. However, on the Amazon product reviews dataset, BERT clearly outperformed all other models, including LSTM, which trailed behind with lower accuracy and macro-F1 scores, especially due to the domain shift and imbalanced class distribution. On the SemEval Tweet dataset, transformer models fine-tuned on social media text—namely BERTweet and RoBERTa—demonstrated superior performance, achieving macro-scores of around 70%, while LSTM lagged behind with macro-precision and F1 score values below 50%.
These findings suggest that well-tuned LSTM architectures offer a lightweight and effective alternative to large pretrained transformer models, particularly for structured and domain-specific datasets like Yelp reviews. Nonetheless, BERT-based pipelines remain attractive due to their ease of use, rapid implementation, and generalization capabilities. Particularly if one wants to use the same model on texts of a diverse nature, BERT-based models are better suited, since the performance of LSTM decreases when applied to a test set with a different nature than the training set. LSTMs are simpler and faster but offer fewer generalization capabilities.
Future work will expand the scope of evaluation to explore architectural variations in the LSTM network (e.g., number of layers and hidden size) and assess the impact of embedding dimensions and sequence length. Investigating the relationship between dataset size and model performance will also be critical in determining the optimal training strategies and the scalability of these models for real-world sentiment classification tasks.
Author Contributions
Conceptualization, R.B.; methodology, R.B. and S.C.N.; software, R.B., F.D. and S.C.N.; validation, R.B. and S.C.N.; formal analysis, R.B., S.C.N., F.D. and P.-O.V.; investigation, R.B. and S.C.N.; resources, R.B. and S.C.N.; data curation, S.C.N.; writing—original draft preparation, R.B. and S.C.N.; writing—review and editing, R.B., S.C.N., F.D. and P.-O.V.; visualization, R.B. and S.C.N.; supervision, R.B., F.D. and P.-O.V.; project administration, R.B.; funding acquisition, R.B. All authors have read and agreed to the published version of the manuscript.
Funding
This work received support under the program “France 2030”, introduced by the French Government and implemented by ANR, with the reference number ANR-21-EXES-0007.
Informed Consent Statement
Not applicable.
Data Availability Statement
The Yelp dataset is publicly available at https://business.yelp.com/data/resources/open-dataset/ (accessed on 1 December 2024).
Conflicts of Interest
The authors declare no conflicts of interest.
Abbreviations
The following abbreviations are used in this manuscript:
| BERT | Bidirectional Encoder Representations from Transformers |
| Bi-LSTM | Bidirectional LSTM |
| CNN | Convolutional Neural Network |
| LSTM | Long Short-Term Memory |
| MLP | Multi-Layer Perceptron |
| RNN | Recurrent Neural Network |
| RoBERTa | Robustly Optimized BERT Pretraining Approach |
| SVM | Support Vector Machine |
References
- Wankhade, M.; Rao, A.C.S.; Kulkarni, C. A survey on sentiment analysis methods, applications, and challenges. Artif. Intell. Rev. 2022, 55, 5731–5780. [Google Scholar] [CrossRef]
- Birjali, M.; Kasri, M.; Beni-Hssane, A. A comprehensive survey on sentiment analysis: Approaches, challenges and trends. Knowl.-Based Syst. 2021, 226, 107134. [Google Scholar] [CrossRef]
- Mohammad, S.M. Sentiment analysis: Automatically detecting valence, emotions, and other affectual states from text. In Emotion Measurement; Woodhead Publishing: Cambridge, UK, 2021; pp. 323–379. [Google Scholar] [CrossRef]
- Fang, X.; Zhan, J. Sentiment analysis using product review data. J. Big Data 2015, 2, 5. [Google Scholar] [CrossRef]
- Onan, A. Sentiment analysis on product reviews based on weighted word embeddings and deep neural networks. Concurr. Comput. Pract. Exp. 2021, 33, e5909. [Google Scholar] [CrossRef]
- Pagolu, V.S.; Reddy, K.N.; Panda, G.; Majhi, B. Sentiment analysis of Twitter data for predicting stock market movements. In Proceedings of the 2016 International Conference on Signal Processing, Communication, Power and Embedded System (SCOPES), Paralakhemundi, India, 3–5 October 2016; pp. 1345–1350. [Google Scholar] [CrossRef]
- Valencia, F.; Gómez-Espinosa, A.; Valdés-Aguirre, B. Price movement prediction of cryptocurrencies using sentiment analysis and machine learning. Entropy 2019, 21, 589. [Google Scholar] [CrossRef]
- Roumeliotis, K.I.; Tselikas, N.D.; Nasiopoulos, D.K. LLMs and NLP Models in Cryptocurrency Sentiment Analysis: A Comparative Classification Study. Big Data Cogn. Comput. 2024, 8, 63. [Google Scholar] [CrossRef]
- Chandrasekaran, R.; Mehta, V.; Valkunde, T.; Moustakas, E. Topics, trends, and sentiments of tweets about the COVID-19 pandemic: Temporal infoveillance study. J. Med. Internet Res. 2020, 22, e22624. [Google Scholar] [CrossRef]
- Boon-Itt, S.; Skunkan, Y. Public perception of the COVID-19 pandemic on Twitter: Sentiment analysis and topic modeling study. JMIR Public Health Surveill. 2020, 6, e21978. [Google Scholar] [CrossRef]
- Matalon, Y.; Magdaci, O.; Almozlino, A.; Yamin, D. Using sentiment analysis to predict opinion inversion in Tweets of political communication. Sci. Rep. 2021, 11, 7250. [Google Scholar] [CrossRef]
- Ceron, A.; Curini, L.; Iacus, S.M.; Porro, G. Every tweet counts? How sentiment analysis of social media can improve our knowledge of citizens’ political preferences with an application to Italy and France. New Media Soc. 2014, 16, 340–358. [Google Scholar] [CrossRef]
- Hutto, C.; Gilbert, E. Vader: A parsimonious rule-based model for sentiment analysis of social media text. In Proceedings of the International AAAI Conference on Web and Social Media, Ann Arbor, MI, USA, 1–4 June 2014; Volume 8, pp. 216–225. [Google Scholar] [CrossRef]
- Baccianella, S.; Esuli, A.; Sebastiani, F. Sentiwordnet 3.0: An enhanced lexical resource for sentiment analysis and opinion mining. In Proceedings of the Seventh International Conference on Language Resources and Evaluation (LREC’10), Valletta, Malta, 17–23 May 2010; Volume 10, pp. 2200–2204. Available online: http://www.lrec-conf.org/proceedings/lrec2010/pdf/769_Paper.pdf (accessed on 18 May 2025).
- Zhang, L.; Wang, S.; Liu, B. Deep learning for sentiment analysis: A survey. Wiley Interdiscip. Rev. Data Min. Knowl. Discov. 2018, 8, e1253. [Google Scholar] [CrossRef]
- Sherstinsky, A. Fundamentals of recurrent neural network (RNN) and long short-term memory (LSTM) network. Phys. D Nonlinear Phenom. 2020, 404, 132306. [Google Scholar] [CrossRef]
- Devlin, J.; Chang, M.W.; Lee, K.; Toutanova, K. Bert: Pre-training of deep bidirectional transformers for language understanding. In Proceedings of the 2019 Conference of the North American Chapter of the Association for Computational Linguistics: Human Language Technologies, Volume 1 (Long and Short Papers), Minneapolis, MN, USA, 2–7 June 2019; pp. 4171–4186. [Google Scholar] [CrossRef]
- Liu, Y.; Ott, M.; Goyal, N.; Du, J.; Joshi, M.; Chen, D.; Levy, O.; Lewis, M.; Zettlemoyer, L.; Stoyanov, V. Roberta: A robustly optimized bert pretraining approach. arXiv 2019, arXiv:1907.11692. [Google Scholar] [CrossRef]
- Poria, S.; Hazarika, D.; Majumder, N.; Mihalcea, R. Beneath the tip of the iceberg: Current challenges and new directions in sentiment analysis research. IEEE Trans. Affect. Comput. 2020, 14, 108–132. [Google Scholar] [CrossRef]
- Barbieri, F.; Camacho-Collados, J.; Neves, L.; Espinosa-Anke, L. Tweeteval: Unified benchmark and comparative evaluation for tweet classification. arXiv 2020, arXiv:2010.12421. [Google Scholar] [CrossRef]
- Areshey, A.; Mathkour, H. Transfer Learning for Sentiment Classification Using Bidirectional Encoder Representations from Transformers (BERT) Model. Sensors 2023, 23, 5232. [Google Scholar] [CrossRef] [PubMed]
- Mutinda, J.; Mwangi, W.; Okeyo, G. Sentiment Analysis of Text Reviews Using Lexicon-Enhanced Bert Embedding (LeBERT) Model with Convolutional Neural Network. Appl. Sci. 2023, 13, 1445. [Google Scholar] [CrossRef]
- Nguyen, D.Q.; Vu, T.; Nguyen, A.T. BERTweet: A pre-trained language model for English Tweets. In Proceedings of the 2020 Conference on Empirical Methods in Natural Language Processing: System Demonstrations, Online, 16–20 November 2020; pp. 9–14. [Google Scholar] [CrossRef]
- Sanh, V.; Debut, L.; Chaumond, J.; Wolf, T. DistilBERT, a distilled version of BERT: Smaller, faster, cheaper and lighter. arXiv 2019, arXiv:1910.01108. [Google Scholar] [CrossRef]
- Pérez, J.M.; Giudici, J.C.; Luque, F. pysentimiento: A Python Toolkit for Sentiment Analysis and SocialNLP tasks. arXiv 2021, arXiv:2106.09462. [Google Scholar] [CrossRef]
- Loureiro, D.; Barbieri, F.; Neves, L.; Espinosa Anke, L.; Camacho-collados, J. TimeLMs: Diachronic Language Models from Twitter. In Proceedings of the 60th Annual Meeting of the Association for Computational Linguistics: System Demonstrations, Dublin, Ireland, 22–27 May 2022; pp. 251–260. [Google Scholar] [CrossRef]
- Plank, B.; Søgaard, A.; Goldberg, Y. Multilingual part-of-speech tagging with bidirectional long short-term memory models and auxiliary loss. arXiv 2016, arXiv:1604.05529. [Google Scholar] [CrossRef]
- Basiri, M.E.; Chegeni, R.S.; Karimvand, A.N.; Nemati, S. Bidirectional LSTM Deep Model for Online Doctor Reviews Polarity Detection. In Proceedings of the 2020 6th International Conference on Web Research (ICWR), Teheran, Iran, 22–23 April 2020; pp. 100–105. [Google Scholar] [CrossRef]
- Wang, X.; Liu, Y.; Sun, C.J.; Wang, B.; Wang, X. Predicting polarities of tweets by composing word embeddings with long short-term memory. In Proceedings of the 53rd Annual Meeting of the Association for Computational Linguistics and the 7th International Joint Conference on Natural Language Processing (Volume 1: Long Papers), Beijing, China, July 2015; pp. 1343–1353. [Google Scholar] [CrossRef]
- Kapali, N.; Tuhin, T.; Pramanik, A.; Rahman, M.S.; Noori, S.R.H. Sentiment Analysis of Facebook and YouTube Bengali Comments Using LSTM and Bi-LSTM. In Proceedings of the 2022 13th International Conference on Computing Communication and Networking Technologies (ICCCNT), Virtual, 3–5 October 2022; pp. 1–6. [Google Scholar] [CrossRef]
- Sadikin, M.; Fauzan, A. Evaluation of Machine Learning Approach for Sentiment Analysis using Yelp Dataset. Eur. J. Electr. Eng. Comput. Sci. 2023, 7, 58–64. [Google Scholar] [CrossRef]
- Chandra, R.; Sonawane, J.; Lande, J. An Analysis of Vaccine-Related Sentiments on Twitter (X) from Development to Deployment of COVID-19 Vaccines. Big Data Cogn. Comput. 2024, 8, 186. [Google Scholar] [CrossRef]
- Chandra, R.; Saini, R. Biden vs Trump: Modeling US General Elections Using BERT Language Model. IEEE Access 2021, 9, 128494–128505. [Google Scholar] [CrossRef]
- Bello, A.; Ng, S.C.; Leung, M.F. A BERT Framework to Sentiment Analysis of Tweets. Sensors 2023, 23, 506. [Google Scholar] [CrossRef]
- Hickman, L.; Thapa, S.; Tay, L.; Cao, M.; Srinivasan, P. Text Preprocessing for Text Mining in Organizational Research: Review and Recommendations. Organ. Res. Methods 2022, 25, 114–146. [Google Scholar] [CrossRef]
- Hochreiter, S.; Schmidhuber, J. Long short-term memory. Neural Comput. 1997, 9, 1735–1780. [Google Scholar] [CrossRef] [PubMed]
- Kingma, D.P.; Ba, J. Adam: A Method for Stochastic Optimization. arXiv 2017, arXiv:1412.6980. [Google Scholar] [CrossRef]
- Socher, R.; Perelygin, A.; Wu, J.; Chuang, J.; Manning, C.D.; Ng, A.; Potts, C. Recursive Deep Models for Semantic Compositionality Over a Sentiment Treebank. In Proceedings of the 2013 Conference on Empirical Methods in Natural Language Processing, Seattle, WA, USA, 18–21 October 2013; pp. 1631–1642. Available online: https://nlp.stanford.edu/~socherr/EMNLP2013_RNTN.pdf (accessed on 2 May 2025).
- Camacho-collados, J.; Rezaee, K.; Riahi, T.; Ushio, A.; Loureiro, D.; Antypas, D.; Boisson, J.; Espinosa Anke, L.; Liu, F.; Martínez Cámara, E. TweetNLP: Cutting-Edge Natural Language Processing for Social Media. In Proceedings of the 2022 Conference on Empirical Methods in Natural Language Processing: System Demonstrations, Abu Dhabi, United Arab Emirates, 7–11 December 2022; pp. 38–49. [Google Scholar] [CrossRef]
- Iqbal, A.; Amin, R.; Iqbal, J.; Alroobaea, R.; Binmahfoudh, A.; Hussain, M. Sentiment Analysis of Consumer Reviews Using Deep Learning. Sustainability 2022, 14, 10844. [Google Scholar] [CrossRef]
- Hou, Y.; Li, J.; He, Z.; Yan, A.; Chen, X.; McAuley, J. Bridging Language and Items for Retrieval and Recommendation. arXiv 2024, arXiv:2403.03952. [Google Scholar]
- Rosenthal, S.; Farra, N.; Nakov, P. SemEval-2017 task 4: Sentiment analysis in Twitter. arXiv 2019, arXiv:1912.00741. [Google Scholar]
- Hussain, M.; Naseer, M. Comparative Analysis of Logistic Regression, LSTM, and Bi-LSTM Models for Sentiment Analysis on IMDB Movie Reviews. J. Artif. Intell. Comput. 2024, 2, 1–8. [Google Scholar] [CrossRef]
- Warner, B.; Chaffin, A.; Clavié, B.; Weller, O.; Hallström, O.; Taghadouini, S.; Gallagher, A.; Biswas, R.; Ladhak, F.; Aarsen, T.; et al. Finally, a Replacement for BERT: Introducing ModernBERT. 2024. Available online: https://huggingface.co/blog/modernbert (accessed on 2 May 2025).
- BehnamGhader, P.; Adlakha, V.; Mosbach, M.; Bahdanau, D.; Chapados, N.; Reddy, S. LLM2Vec: Large Language Models Are Secretly Powerful Text Encoders. arXiv 2024, arXiv:2404.05961. [Google Scholar] [CrossRef]
- Krugmann, J.O.; Hartmann, J. Sentiment analysis in the age of generative AI. Cust. Needs Solut. 2024, 11, 3. [Google Scholar] [CrossRef]
Disclaimer/Publisher’s Note: The statements, opinions and data contained in all publications are solely those of the individual author(s) and contributor(s) and not of MDPI and/or the editor(s). MDPI and/or the editor(s) disclaim responsibility for any injury to people or property resulting from any ideas, methods, instructions or products referred to in the content. |
© 2025 by the authors. Licensee MDPI, Basel, Switzerland. This article is an open access article distributed under the terms and conditions of the Creative Commons Attribution (CC BY) license (https://creativecommons.org/licenses/by/4.0/).