Abstract
This study presents a comparative analysis of several multimodal large language models (LLMs) for no-reference image quality assessment, with a particular focus on images containing authentic distortions. We evaluate three models developed by OpenAI and three models from Claude.AI, comparing their performance in estimating image quality without reference images. Our results demonstrate that these LLMs outperform traditional methods based on hand-crafted features. However, more advanced deep learning models, especially those based on deep convolutional networks, surpass LLMs in performance. Notably, we make a unique contribution by publishing the processed outputs of the LLMs, providing a transparent and direct comparison of their quality assessments based solely on the predicted quality scores. This work underscores the potential of multimodal LLMs in image quality evaluation, while also highlighting the continuing advantages of specialized deep learning approaches.
1. Introduction
The proliferation of digital images across various platforms and applications has made automated image quality assessment (IQA) increasingly crucial. While traditional IQA methods often rely on reference images to evaluate quality, real-world scenarios frequently demand no-reference image quality assessment (NR-IQA), where quality must be determined without access to pristine versions of the images [1]. This challenge is particularly pronounced when dealing with authentic distortions that occur naturally during image capture and processing, as opposed to synthetic distortions commonly used in controlled studies [2]. Real-world scenarios often involve diverse and unpredictable distortions, making it challenging to assess image quality accurately. Non-distortion-specific algorithms, which do not require prior knowledge of distortion types, are increasingly important for practical applications [3]. In medical imaging, image quality directly affects diagnostic accuracy. Quality assurance processes, including acceptance testing and periodic checkups, are essential to ensure high-quality radiographs with minimal radiation exposure [4]. In an autonomous driving system, camera sensors acquire images from highly diverse and complex environments [5], and the quality of the camera images directly affects the performance of object detection [6], image classification [7], and image segmentation [8] algorithms. Digital image quality assessment may also have practical applications in surveillance and security [9], video streaming services [10], astronomical image processing [11], manufacturing quality control [12], and remote sensing [13].
Recent advances in vision–language models have revolutionized various computer vision tasks through their ability to understand both visual content and natural language descriptions. Large-scale models such as GPT-4V, Claude Vision, and PaLM-V have demonstrated remarkable capabilities in processing visual information alongside textual context. These models employ sophisticated architectures: GPT-4V utilizes a vision transformer (ViT) backbone with specialized attention mechanisms for cross-modal interaction, while Claude Vision implements a novel architecture combining convolutional and transformer layers with enhanced spatial reasoning capabilities. PaLM-V builds upon the PaLM language model architecture [14], incorporating visual tokens through a perception system that maintains high-resolution feature maps. These models are typically trained on massive datasets exceeding billions of image–text pairs, such as LAION-5B [15], WebLI [16], and Conceptual Captions [17], enabling them to learn rich semantic representations that bridge visual and linguistic information.
Traditional NR-IQA approaches have evolved significantly over the past decade. Hand-crafted feature methods began with Blind/Referenceless Image Spatial Quality Evaluator (BRISQUE) [18], which utilizes natural scene statistics (NSS) in the spatial domain, analyzing mean-subtracted contrast-normalized (MSCN) coefficients [19] and their pairwise products. Naturalness Image Quality Evaluator (NIQE) [20] advanced this approach by modeling multivariate Gaussian distributions of space-domain NSS. Deep learning approaches introduced new paradigms: CNNIQA pioneered the use of convolutional neural networks with a novel regression strategy, while NIMA [21] implemented a novel architecture using MobileNet as backbone, trained on the AVA (Aesthetic Visual Analysis) [22] dataset with earth mover’s distance (EMD) [23] loss. MetaIQA further advanced the field by incorporating meta-learning techniques to improve generalization across different distortion types. Recent developments include MUSIQ [24], which handles multiple scales through transformer architectures, and HyperIQA [25], which employs hypernetworks to generate quality-aware features. These methods have primarily been evaluated on synthetic distortion datasets such as LIVE [26], TID2013 [27], and KADID-10k [28].
The challenge of authentic distortions represents a significant hurdle in real-world IQA applications. Unlike synthetic distortions, authentic distortions present complex, often interconnected degradations [29,30,31,32]:
- Motion blur from camera shake or subject movement, characterized by directional smearing and varying intensity along the motion path;
- Poor focus, manifesting as both global and local blur patterns, often with depth-dependent characteristics;
- Exposure issues including highlight clipping, shadow noise, and dynamic range limitations;
- Sensor noise varying with ISO settings and showing color-channel-dependent characteristics;
- Optical aberrations including chromatic aberration, barrel/pincushion distortion, and vignetting;
- Complex interactions between multiple distortion types, such as noise amplification in post-processed underexposed regions.
Unlike conventional NR-IQA models that focus on low-level features, multimodal LLMs can contextualize image quality based on semantic content. For example, they may interpret whether blurring affects a face differently than a background [32] or how compression artifacts alter readability in text-heavy images [33]. Pretrained multimodal LLMs have seen vast amounts of real-world imagery, allowing them to generalize across diverse distortions (e.g., noise, blur, and compression) and datasets, rather than being restricted to specific distortions present in training data. Since these models can process both visual and textual inputs, they can be adapted to novel NR-IQA tasks, such as aesthetic quality assessment, perceptual similarity, or domain-specific evaluations (e.g., medical images and satellite imagery). Despite their potential, multimodal LLMs are not explicitly optimized for NR-IQA and may lack fine-grained sensitivity to certain distortions.
1.1. Contributions
This work systematically evaluates the capability of multimodal LLMs in the task of NR-IQA for authentic distortions. Our main contributions are as follows:
- We assess the ability of state-of-the-art LLMs to predict image quality scores on two widely used IQA benchmark datasets: CLIVE [34] and KonIQ-10k [1].
- We investigate the frequency of invalid responses across different models and datasets, identifying systematic weaknesses.
- We compare the performance of multiple multimodal LLMs, including ChatGPT-4o-Latest, GPT-4o-2024-11-20, GPT-4-Turbo-2024-04-09, Claude-3-Haiku-20240307, Claude-3-Opus-20240229, and Claude-3-Sonnet-20240229, highlighting variations in their robustness and accuracy. Our results reveal that LLMs struggle more with the CLIVE [34] dataset than with KonIQ-10k [1], suggesting dataset-specific challenges that affect multimodal LLM performance.
1.2. Structure of the Paper
The remainder of this paper is organized as follows. Section 2 provides an overview of previous studies on NR-IQA, including both traditional and deep learning-based approaches. Section 3 describes the datasets used for evaluation, the experimental setup, and the methodology for assessing the performance of different LLMs in NR-IQA. Section 4 presents a performance comparison of various LLMs against traditional and deep learning-based NR-IQA methods. The section includes quantitative evaluations in the form of statistical correlations with ground-truth scores. Section 5 interprets the findings, highlights key observations, and compares LLM performance across different architectures. It also discusses potential limitations and implications for real-world applications. Section 6 summarizes the key contributions of this study and suggests directions for future research in integrating LLMs into NR-IQA tasks.
2. Related Works
NR-IQA has emerged as a critical area of research within the field of computer vision, particularly due to its applicability in scenarios where reference images are unavailable, such as streaming applications [10] and autonomous vehicles [35]. NR-IQA aims to evaluate the perceptual quality of a given image based solely on the distorted image itself, making it a challenging task due to the absence of a pristine (or reference) image for comparison [36]. The complexity of NR-IQA arises from the diverse types of distortions and the inherent variability of image content, necessitating the development of robust algorithms capable of generalizing across different scenarios [37,38].
No-reference image quality assessment methods that do not rely on deep learning techniques often utilize various image features, statistical models, and computational algorithms to evaluate image quality without the need for a reference image. A popular approach is natural scene statistics (NSS), which refers to the statistical properties found in natural images, capturing the regularities and patterns commonly observed in the visual environment [39]. NSS analysis aims to understand and model the statistical distribution of pixel intensities, gradients, textures, and other visual features in natural scenes [40]. These statistical properties provide valuable insights into the characteristics of typical images encountered in the real world. NSS analysis has been widely used in the field of image processing and computer vision, particularly in tasks related to image quality assessment and image compression. By understanding the statistical regularities present in natural scenes, researchers can design algorithms that enhance the quality of processed images or improve the efficiency of image compression techniques [41]. In the context of image quality assessment, NSS-based methods analyze the statistical features of an image or a region within an image. These features may include moments, histograms, or other statistical measures derived from pixel intensities, gradients, or texture patterns. For instance, Moorthy and Bovik [42] introduced an algorithm that predicts the presence of a set of predefined distortions, i.e., JPEG compression noise, JPEG2000 compression noise, white noise, Gaussian blur, and fast fading, in an image. Next, perceptual quality scores are obtained along each of the predefined distortions. Finally, the quality of the input image is estimated as a probability-weighted summation. Quality-aware NSS features were extracted from Daubechies 9/7 wavelet subband coefficients [43] by fitting a generalized Gaussian distribution (GGD) onto them. Further, the parameters of the GGD were used as quality-aware features, which were mapped onto quality ratings with a trained support vector regressor (SVR) [44]. In [45], the authors also utilized wavelet coefficients, but their distributions were modeled using a Gaussian scale mixture [46]. In contrast, Saad et al. [47] defined NSS in the discrete cosine transform (DCT) domain. As in [42], the distribution of DCT coefficients was modeled with a GGD, and its shape parameters were taken as quality-aware features. Finally, these features were utilized in a Bayesian inference method for estimating perceptual image quality. A similar approach was presented in [48], where four quality-aware features were considered in the DCT domain, i.e., kurtosis, contrast, and two anisotropy measures [49]. Contrarily, Mittal et al. [18] fitted an asymmetric GGD [50] onto the normalized luminance coefficients [51] of a distorted image, and quality-aware features were obtained from the asymmetric GGD’s parameters. Besides NSS-based features, texture features [52] were also utilized for NR-IQA [3], since image texture is heavily influenced by the presence of noise. For instance, Xue et al. [53] utilized the gradient magnitude maps and the Laplacian of Gaussian responses of images to extract structural information. Local binary patterns (LBPs) [54], which are probably the most popular texture descriptors in the computer vision literature [55], have also been intensively applied for NR-IQA. In [56], Freitas et al. gave an overview of a wide range of LBP variants and their performance in NR-IQA. In [57,58], the authors combined LBP-based structural features with other types of features, i.e., statistical and luminance features, to achieve improved performance.
Recent advancements in deep learning have significantly influenced the development of NR-IQA methodologies. For instance, various neural network architectures, including convolutional neural networks (CNNs) and generative adversarial networks (GANs), have been employed to enhance the feature extraction capabilities of NR-IQA systems [59,60]. These approaches leverage the ability of deep learning models to learn hierarchical representations of image features, which can be crucial for accurately predicting image quality scores. The work of Kang et al. [61] was a pioneering achievement in the application of CNNs for NR-IQA. Specifically, the authors trained a CNN from scratch on image patches with dimensions of (the patches inherited the source images’ perceptual quality). The perceptual quality of a test image was determined by taking the arithmetic average of the sampled patches’ quality ratings. Similarly, Bare et al. [62] proposed an end-to-end CNN-based solution trained on image patches, but the patches’ target values did not inherit the quality score of the source image, since the target values were determined using an image similarity metric [63]. In contrast, Li et al. [64] modified and fine-tuned on the ImageNet [65] database trained Network in Network (NiN) [66] architecture. The NiN was modified by inserting five new layers after the 26th to make it suitable for NR-IQA. Next, it was completely retrained. Another line of papers [67,68,69] focused on feature extraction with ImageNet-pretrained CNNs, and the extracted features were mapped onto perceptual quality using a regression technique, typically an SVR. The main advantage of this scheme is that an image quality estimator can be implemented without training a neural network but while still relying on the semantic information stored in the CNN. On the other hand, they contain two steps, namely, deep feature extraction and regression, thus requiring the storage of long feature vectors. As a consequence, they are rather suitable for small- or medium-sized databases. For instance, Gao et al. [70] extracted deep features from all 37 layers of a very large pretrained CNN. Next, the deep features of each layer were mapped onto quality scores with SVRs. Finally, the arithmetic mean of the quality ratings provided by each layer was considered to represent a digital image’s perceptual quality. Besides CNNs, transformer neural networks have also become a hot research topic in the deep learning community [71]. Unlike CNNs, transformers rely entirely on self-attention mechanisms to capture relationships between input tokens, making them particularly effective for tasks involving sequential or positional data, such as language translation and text generation [72]. The key innovation in transformers is the self-attention mechanism, which allows the model to weigh the significance of different input tokens when making predictions. This mechanism enables architectures leading to better performance in various natural language processing (NLP) tasks. Although transformers were initially introduced for NLP, researchers have explored their applicability in the field of computer vision. One notable architecture that combines transformers with computer vision is Vision Transformer (ViT) [71]. In ViT, an image is divided into fixed-size non-overlapping patches, which are treated as tokens similar to words in NLP. These patches are then flattened and linearly embedded to form input embeddings for the transformer model. The transformer processes these embeddings using self-attention mechanisms, allowing the model to capture relationships between different image patches. For NR-IQA, Ke et al. [24] implemented a transformer-based method that uses hash-based 2D absolute position encoding for the embedding of image patches at multiple scales. Similarly, the authors of [73] applied multi-scale feature extraction to achieve improved performance. In contrast, Yang et al. [74] first applied ViT for feature extraction and then introduced two specific blocks to strenghten local and global interactions. Wang et al. [75] utilized CLIP (Contrastive Language–Image Pre-training) [76], which is a widely used multimodal LLM, to evaluate the similarity between an image and a prompt such as . Furthermore, the researchers identified several descriptive features, i.e., brightness and colorfulness, which can be estimated using this prompt strategy.
Since NR-IQA is a popular research topic and researchers have proposed many different methods over the years, an encyclopedic summary of NR-IQA methods would be outside the scope the scope of this study. In [77], Manap et al. presented a survey in which NSS-based NR-IQA methods were thoroughly discussed. Similarly, Xu et al. [78] introduced this topic from the point of view of quality-aware features. In [79], the authors discussed methods relying on deep learning techniques and several emerging topics in IQA, such as quality assessment of screen content images and 3D IQA. In [80], Yang et al. compared several deep learning-based algorithms to each other. An analysis of the current state of the art of NR-IQA can be found in the book of Xu et al. [81], and the PhD dissertations of Jenadeleh [82] and Men [83] can also be considered important works in the NR-IQA literature.
3. Materials and Methods
3.1. Materials
3.1.1. IQA Benchmark Databases
The evaluation of IQA models requires robust and diverse benchmark datasets that capture a wide range of distortions and subjective human opinions. Two commonly used databases for IQA research are CLIVE [34] and KonIQ-10k [1]. Both databases are widely recognized for their content diversity, real-world distortions, and high-quality subjective annotations, making them essential benchmarks for deep learning-based IQA models.
The CLIVE [34] database was developed to evaluate the performance of IQA models on images containing authentic, real-world distortions. Unlike artificially distorted datasets, CLIVE focuses on complex and diverse distortions encountered in practical scenarios. The CLIVE database consists of 1169 images that were collected using mobile devices. These images are characterized by diverse distortions, including motion blur, overexposure, underexposure, color artifacts, and noise. The wide range of real-world imperfections makes CLIVE a challenging benchmark for IQA models. To assess perceived image quality, subjective evaluations were gathered through crowdsourcing experiments, where a large number of participants rated the images based on their visual quality. The ratings were then aggregated to form mean opinion scores (MOSs), which serve as ground-truth labels for training and evaluating IQA models. The authentic distortions in CLIVE reflect real-world imaging challenges, such as those encountered in mobile photography. This makes CLIVE an essential dataset for developing and testing models designed to handle natural, unpredictable image degradation.
The KonIQ-10k [1] database was created to support research on image quality assessment, with a focus on providing a large and diverse set of high-quality images paired with subjective quality annotations. KonIQ-10k contains 10,073 images, which were selected from the Yahoo-Flickr Creative Commons 100 Million [84] (YFCC100M) dataset. The images cover a wide range of scenes and content types, including landscapes, people, architecture, and abstract patterns. The images were resized to 1024 × 768 pixels, ensuring consistency in resolution while maintaining visual richness. Image quality ratings for KonIQ-10k were collected through a large-scale crowdsourcing campaign, where participants provided their subjective assessments. The collected ratings were processed to generate MOSs, ensuring high reliability and consistency. To reduce bias, the experiment was carefully designed, considering factors such as participant diversity and the rating environment. KonIQ-10k is notable for its high content diversity and high-quality subjective labels. The dataset offers a comprehensive benchmark for evaluating the generalization ability of IQA models across various types of content and distortions. Additionally, the large-scale nature of the dataset (over 10,000 images) provides a robust platform for training deep learning models.
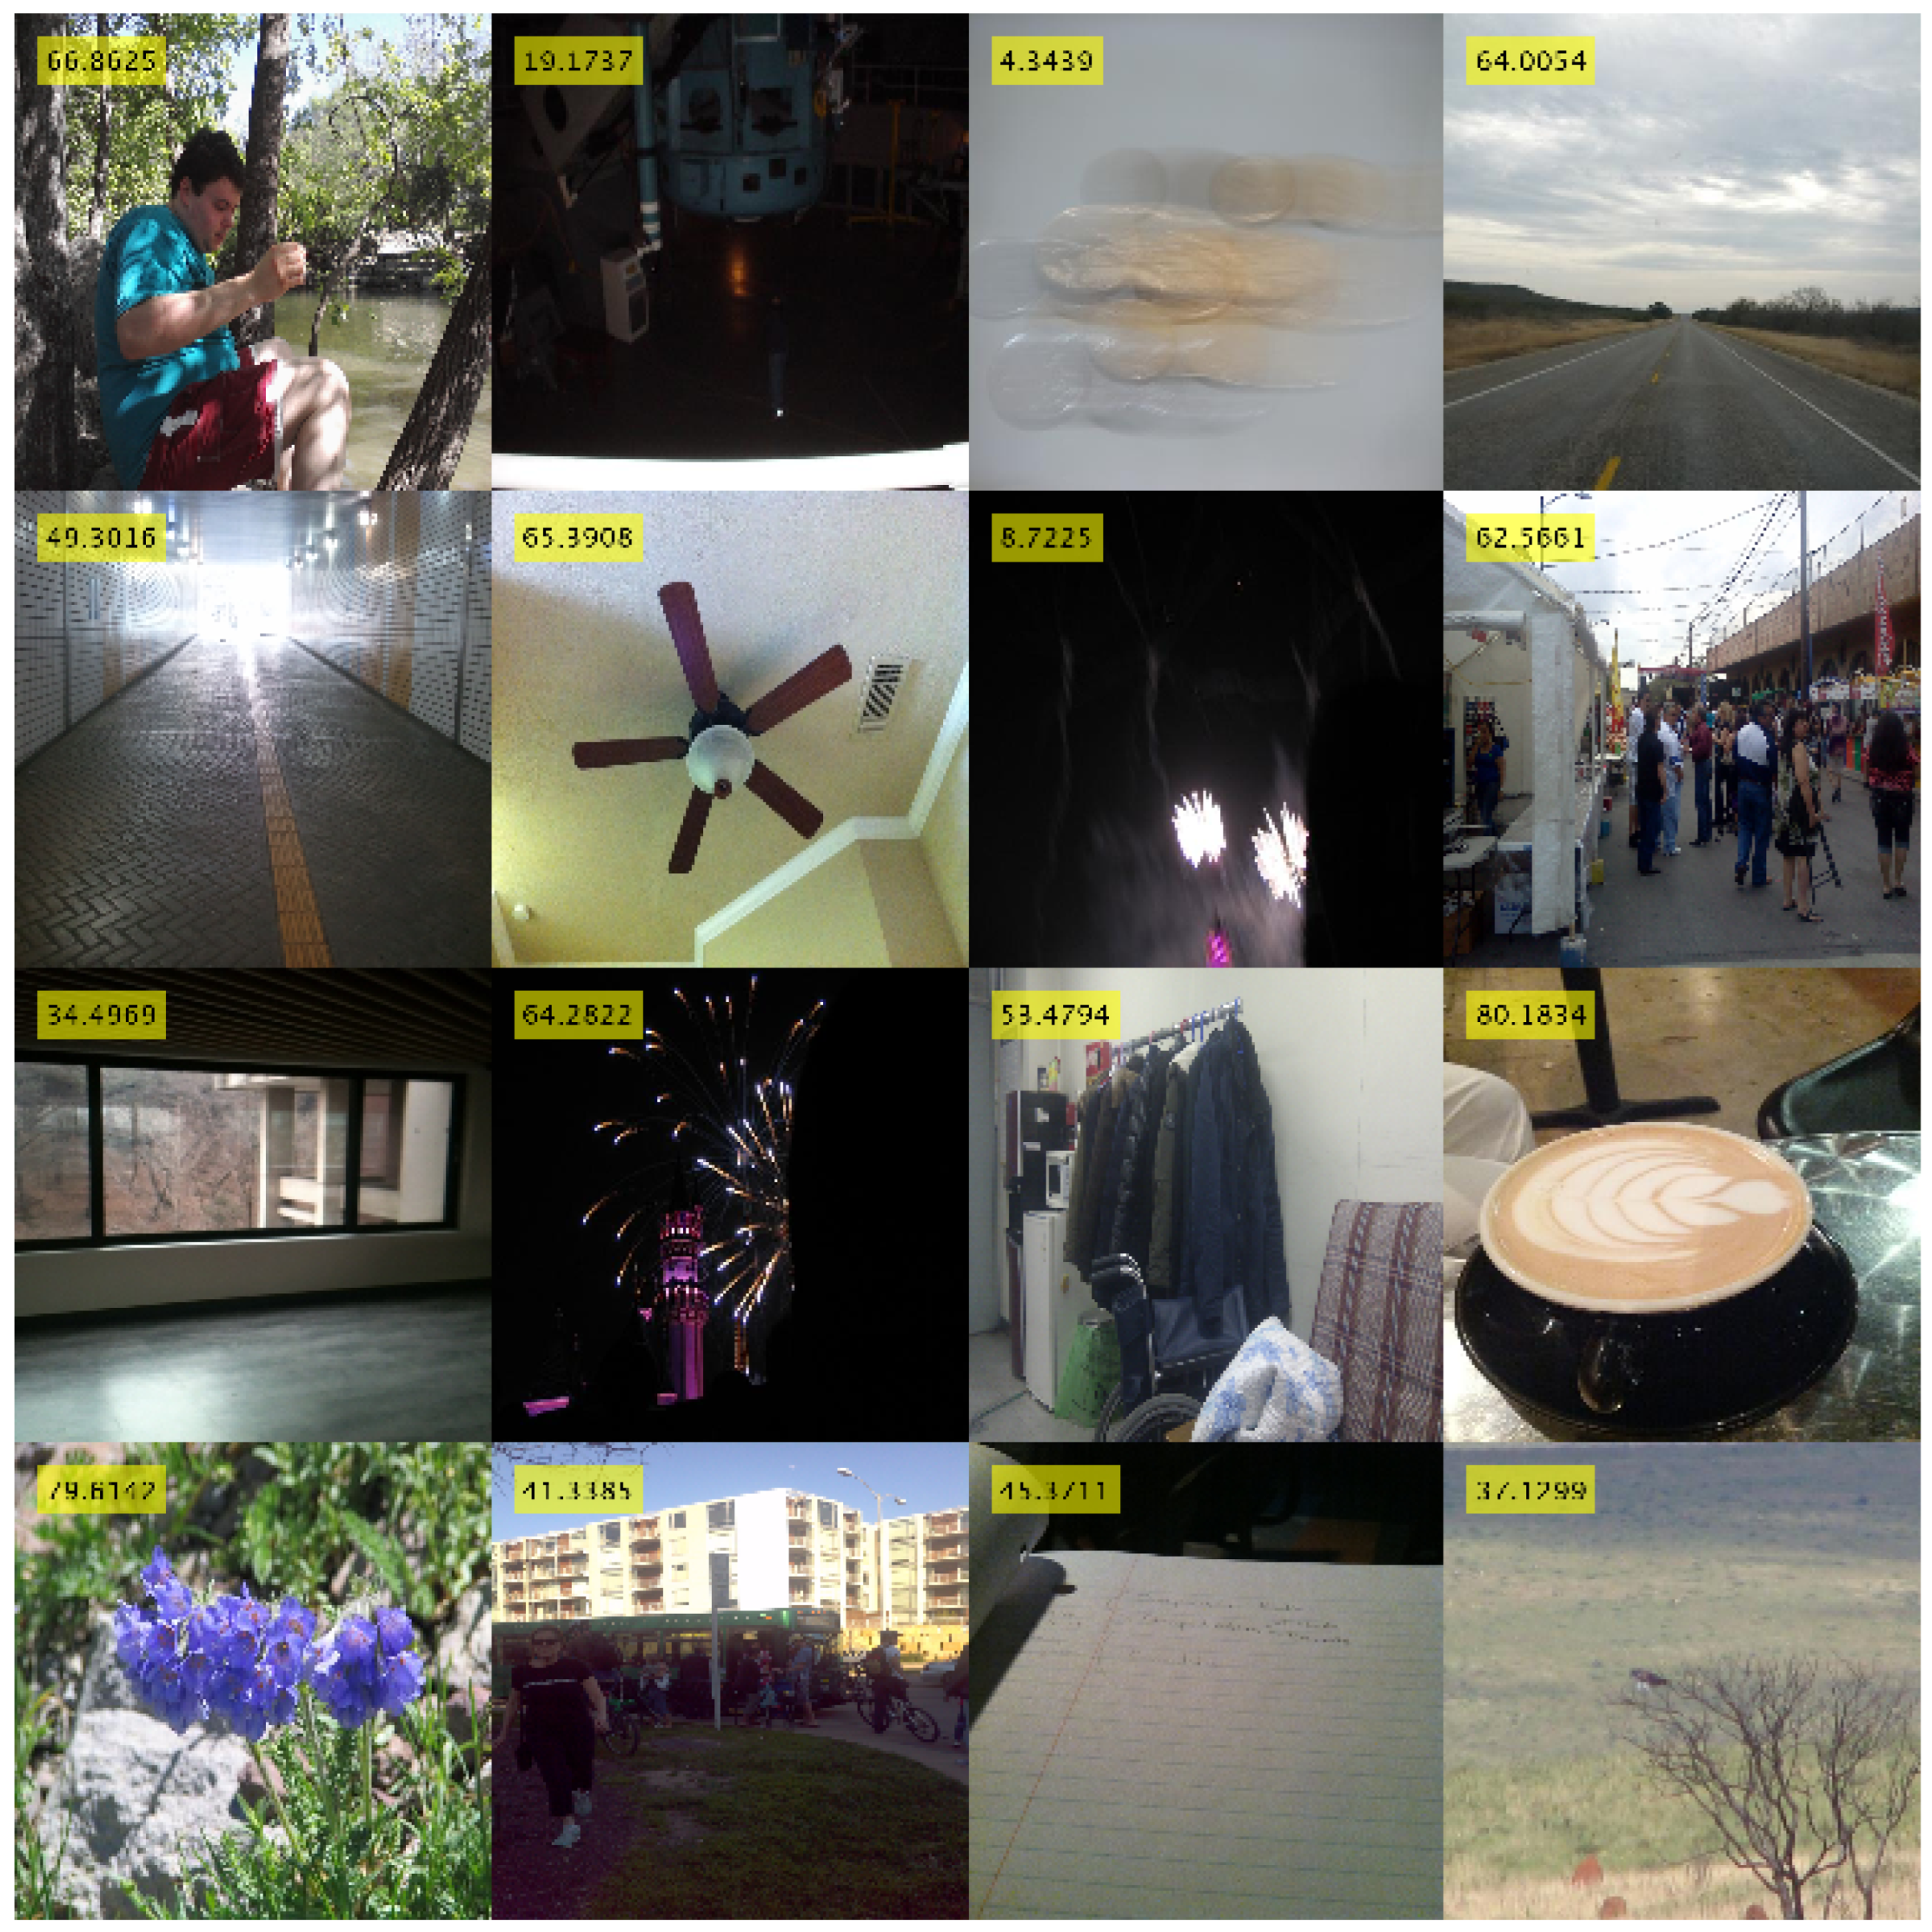
Both CLIVE [34] and KonIQ-10k [1] databases are widely used in the field of image quality assessment. While CLIVE emphasizes real-world, authentic distortions collected through mobile imaging, KonIQ-10k offers a broader range of content diversity with carefully curated subjective scores from a large-scale crowdsourcing effort [85]. Together, these datasets serve as complementary benchmarks for evaluating and improving deep learning-based IQA models, highlighting their ability to generalize across different types of distortions and content. Table 1 provides an overview of the benchmark databases used for evaluating the image quality assessment performance of multimodal LLMs. Figure 1 illustrates the relative distributions of MOS for the CLIVE [34] and KonIQ-10k [1] benchmark IQA databases. Figure 2 presents a selection of images from the CLIVE benchmark dataset, each annotated with an MOS displayed in a yellow box.

Table 1.
Applied benchmark databases.
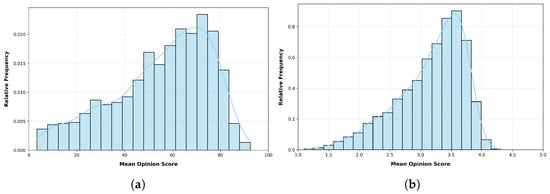
Figure 1.
The relative distributions of quality ratings (summarized in MOS) in the applied benchmark IQA databases: (a) CLIVE [34] and (b) KonIQ-10k [1].

Figure 2.
Several images from CLIVE [34] with their corresponding MOS values (where the MOS is the arithmetic mean of all quality ratings obtained from human observers).
3.1.2. Multimodal LLMs
OpenAI has introduced a range of multimodal LLMs that integrate text, image, and reasoning capabilities. The lineup includes ChatGPT-4o-Latest, GPT-4o-2024-11-20, and GPT-4-Turbo-2024-04-09, each designed to address distinct use cases while maintaining strong performance across multimodal tasks. ChatGPT-4o-Latest is the most recent iteration of OpenAI’s flagship model, optimized for real-time conversational AI and multimodal reasoning. It is able to process text and images simultaneously, making it suitable for complex dialogue systems, visual question answering (VQA), and multimodal search [86]. It is characterized by strong generalization across tasks with improved reasoning over images and text, delivering high accuracy on multimodal benchmarks. GPT-4o-2024-11-20 is a variant of GPT-4o designed with enhanced performance in multimodal content generation and analysis. It excels in document understanding, chart analysis, and image-based content creation, integrating detailed text generation with visual context interpretation. It demonstrates high performance in benchmarks for image–text reasoning and document analysis. GPT-4-Turbo-2024-04-09 is a performance-optimized version of GPT-4, tailored for cost-efficient deployment without compromising quality [87]. It is designed for general-purpose multimodal tasks such as image description, automated reporting, and conversational assistance. It offers a balance between cost efficiency and performance, making it suitable for large-scale enterprise deployments.
The Claude series of multimodal LLMs, developed by Anthropic, represents a significant advancement in AI-driven reasoning and image analysis. The series includes three models: Claude 3 Haiku, Claude 3 Opus, and Claude 3 Sonnet, each tailored for different use cases while sharing a common architecture designed for high-performance multimodal tasks [88]. Haiku is the fastest and most lightweight model in the Claude 3 series, optimized for real-time inference and large-scale deployments. Despite its compact size, it can process both text and image inputs effectively, making it suitable for quick, scalable tasks such as content moderation, chatbot interactions, and real-time image analysis. It is characterized by high-speed processing and low latency, ideal for applications requiring real-time responses. Opus is the flagship model, designed for complex reasoning tasks and high-precision multimodal analysis. It excels in understanding and generating text, as well as analyzing visual inputs, making it highly effective for tasks such as image captioning, document analysis, and complex reasoning over charts or infographics. Sonnet is the mid-tier model, offering a balance between the speed of Haiku and the high performance of Opus. Designed for general-purpose multimodal tasks, it provides strong performance across a wide range of applications, including customer support automation, image-based queries, and document processing. It is a balanced trade-off between performance and efficiency, making it a versatile choice for diverse applications. Collectively, these models highlight the capabilities of LLMs in combining textual and visual understanding to address a broad spectrum of AI challenges [89].
To provide a more balanced and comprehensive evaluation, we included LLaVA-1.5-7B-HF [90], a state-of-the-art open-source multimodal LLM. While proprietary systems, such as Claude, offer impressive performance, they operate as black boxes with limited transparency regarding architecture, training data, and inference mechanisms. In contrast, open-source models enable reproducibility, deeper analysis, and community-driven improvements. The model architecture consists of the following components:
- Vision Encoder: LLaVA-1.5-7B’s image encoder is CLIP ViT-L/14, which transforms an input image into a sequence of visual embeddings. CLIP (Contrastive Language–Image Pre-training) was trained on 400 million image–text pairs to produce aligned visual and textual representations.
- Language Model: The text processing backbone is Vicuna-7B v1.5, a fine-tuned version of LLaMA-2 7B optimized for instruction-following dialogue through supervised fine-tuning on high-quality multi-turn conversation data.
- Projection Layer: A trainable linear layer maps the output of the vision encoder to the language model’s embedding space. This enables the integration of visual information into the language model’s input stream.
- Training Paradigm: The model was trained using instruction-tuning on a mixture of datasets, including complex visual reasoning, image captioning, and visual question answering (VQA). The fine-tuning process includes aligning the model to follow multimodal prompts using image and text inputs jointly.
- Tokenization and Input Format: Images are encoded into visual tokens and prepended to the textual input as special tokens. During inference, a multimodal prompt (e.g., “Describe the quality of this image”) is concatenated with the visual tokens and fed into the model for autoregressive decoding.
- Model Availability: The “HF” suffix denotes the Hugging Face-compatible implementation, which includes pre-trained weights, configuration files, and inference scripts. It can be run on consumer-grade GPUs and integrated into custom pipelines.
3.2. Methods
As already mentioned, this study evaluates the ability of multimodal LLMs to perform NR-IQA on digital images with authentic distortions. Each model was prompted with a standardized question requesting an overall quality rating for each image. The question was formulated as follows for CLIVE [34]: “How would you rate the overall visual quality of this image on a continuous scale of 0.0 to 100.0, where 0.0 represents the lowest quality and 100.0 represents the highest quality?” For KonIQ-10k [1] benchmark database, a different rating scale was used: “How would you rate the overall visual quality of this image on a continuous scale of 1.0 to 5.0, where 1.0 represents the lowest quality and 5.0 represents the highest quality?” As already mentioned, the following multimodal LLMs were tested in this study: ChatGPT-4o-Latest, GPT-4o-2024-11-20, GPT-4-Turbo-2024-04-09, Claude-3-Haiku-20240307, Claude-3-Opus-20240229, and Claude-3-Sonnet-20240229. Model predictions were assessed by computing the correlation between the predicted scores and the ground-truth scores. However, in some instances, the models refused to provide an evaluation, citing privacy concerns or content restrictions. The frequencies of such invalid responses varied across models and are depicted in Figure 3. GPT-4o-2024-11-20 exhibited the highest invalid response rate, particularly for CLIVE images, whereas GPT-4-Turbo-2024-04-09 produced no refusals on KonIQ-10k. ChatGPT-4o-Latest also showed a relatively high invalid response rate for CLIVE (1.03%), but the rate remained low (0.04%) for KonIQ-10k. Claude-3-Haiku-20240307 had moderate invalid response rates for both datasets, at 0.68% for CLIVE and 0.53% for KonIQ-10k. Claude-3-Opus-20240229 had the lowest rates overall, showing the best robustness (0.00% for CLIVE and 0.13% for KonIQ-10k). It stands out as the most reliable model, producing almost no invalid responses. GPT-4-Turbo-2024-04-09 performs well, with a very low invalid response rate (0.09% for CLIVE and 0.00% for KonIQ-10k). The difference in refusal rates between datasets suggests that model responses may be influenced by the content characteristics of each dataset. CLIVE [34] has a higher invalid response rate across most models, suggesting that this dataset may be more challenging for multimodal LLMs than KonIQ-10k [1]. While evaluating LLaVA-1.5-7B-HF [90], we observed a high rate of invalid or uninformative responses in the context of NR-IQA. Unlike proprietary models, which typically provide a structured refusal along with a justification—often citing potential safety or misuse concerns—LLaVA tends to fail silently. In many cases, instead of outputting a quality score or indicating that it cannot perform the task, it defaults to generic image descriptions unrelated to perceptual quality. This lack of explicit refusal or scoring degrades the model’s reliability and makes it difficult to distinguish between true low-confidence cases and fundamental task limitations.
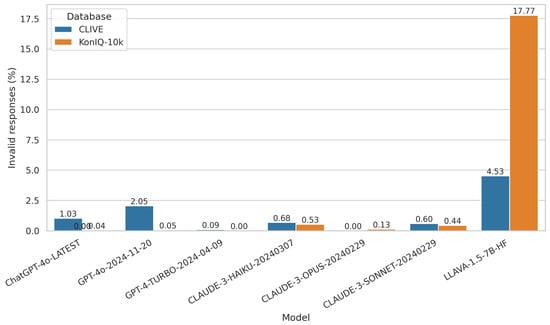
Figure 3.
The percentage of invalid responses provided by each multimodal LLM for the CLIVE [34] and KonIQ-10k [1] datasets. Invalid responses refer to instances where the model refused to provide an image quality score, often citing privacy concerns.
4. Results
4.1. Evaluation Metrics
In research studies, the performance of an NR-IQA method is given by the correlation strength calculated between predicted and ground-truth quality scores. To this end, Pearson’s linear correlation coefficient (PLCC), Spearman’s rank order correlation coefficient (SROCC), and Kendall’s rank order correlation coefficient (KROCC) are usually given. They are also adopted in this paper. PLCC is a statistical measure that quantifies the strength and direction of a linear relationship between two variables. It ranges from to 1, where indicates a perfect positive linear correlation: as one variable increases, the other variable increases proportionally. In contrast, indicates a perfect negative linear correlation. Finally, indicates no linear correlation. PLCC is calculated using the following formula:
where and are the individual data points in the two variables, while and are the means of the respective variables. As recommended in [26], prior to the calculation of PLCC, a non-linear mapping is carried out between the predicted and ground-truth scores using a logistic function with five parameters. SROCC is a non-parametric measure that assesses the strength and direction of a monotonic relationship between two variables. Unlike PLCC, SROCC does not assume a linear relationship between the variables. The calculation of SROCC involves the following steps: (i) Rank the values of each variable separately, assigning ranks from 1 to n, where n is the number of data points. (ii) Calculate the difference between the ranks for each pair of corresponding data points. (iii) Square these differences. (iv) Sum up these squared differences to obtain the sum of squared differences. SROCC can be expressed using the following formula:
where is the difference between the ranks of the corresponding pairs of data points and n is the number of data points. SROCC, like PLCC, ranges from to 1. indicates a perfect positive monotonic correlation, indicates a perfect negative monotonic correlation, and indicates no monotonic correlation. SROCC provides a measure of how well the relationship between two variables can be described using a monotonic function, regardless of the specific shape of that function. KROCC is also a non-parametric measure used to assess the strength and direction of a monotonic relationship between two variables. Like SROCC, KROCC is suitable for ordinal and ranked data and does not assume a linear relationship. The calculation of KROCC involves counting concordant and discordant pairs of observations. Then, KROCC can be expressed using the following formula:
where C and D denote the numbers of concordant and discordant pairs, respectively, between X and Y.
4.2. Performance Comparison of Multimodal LLMs
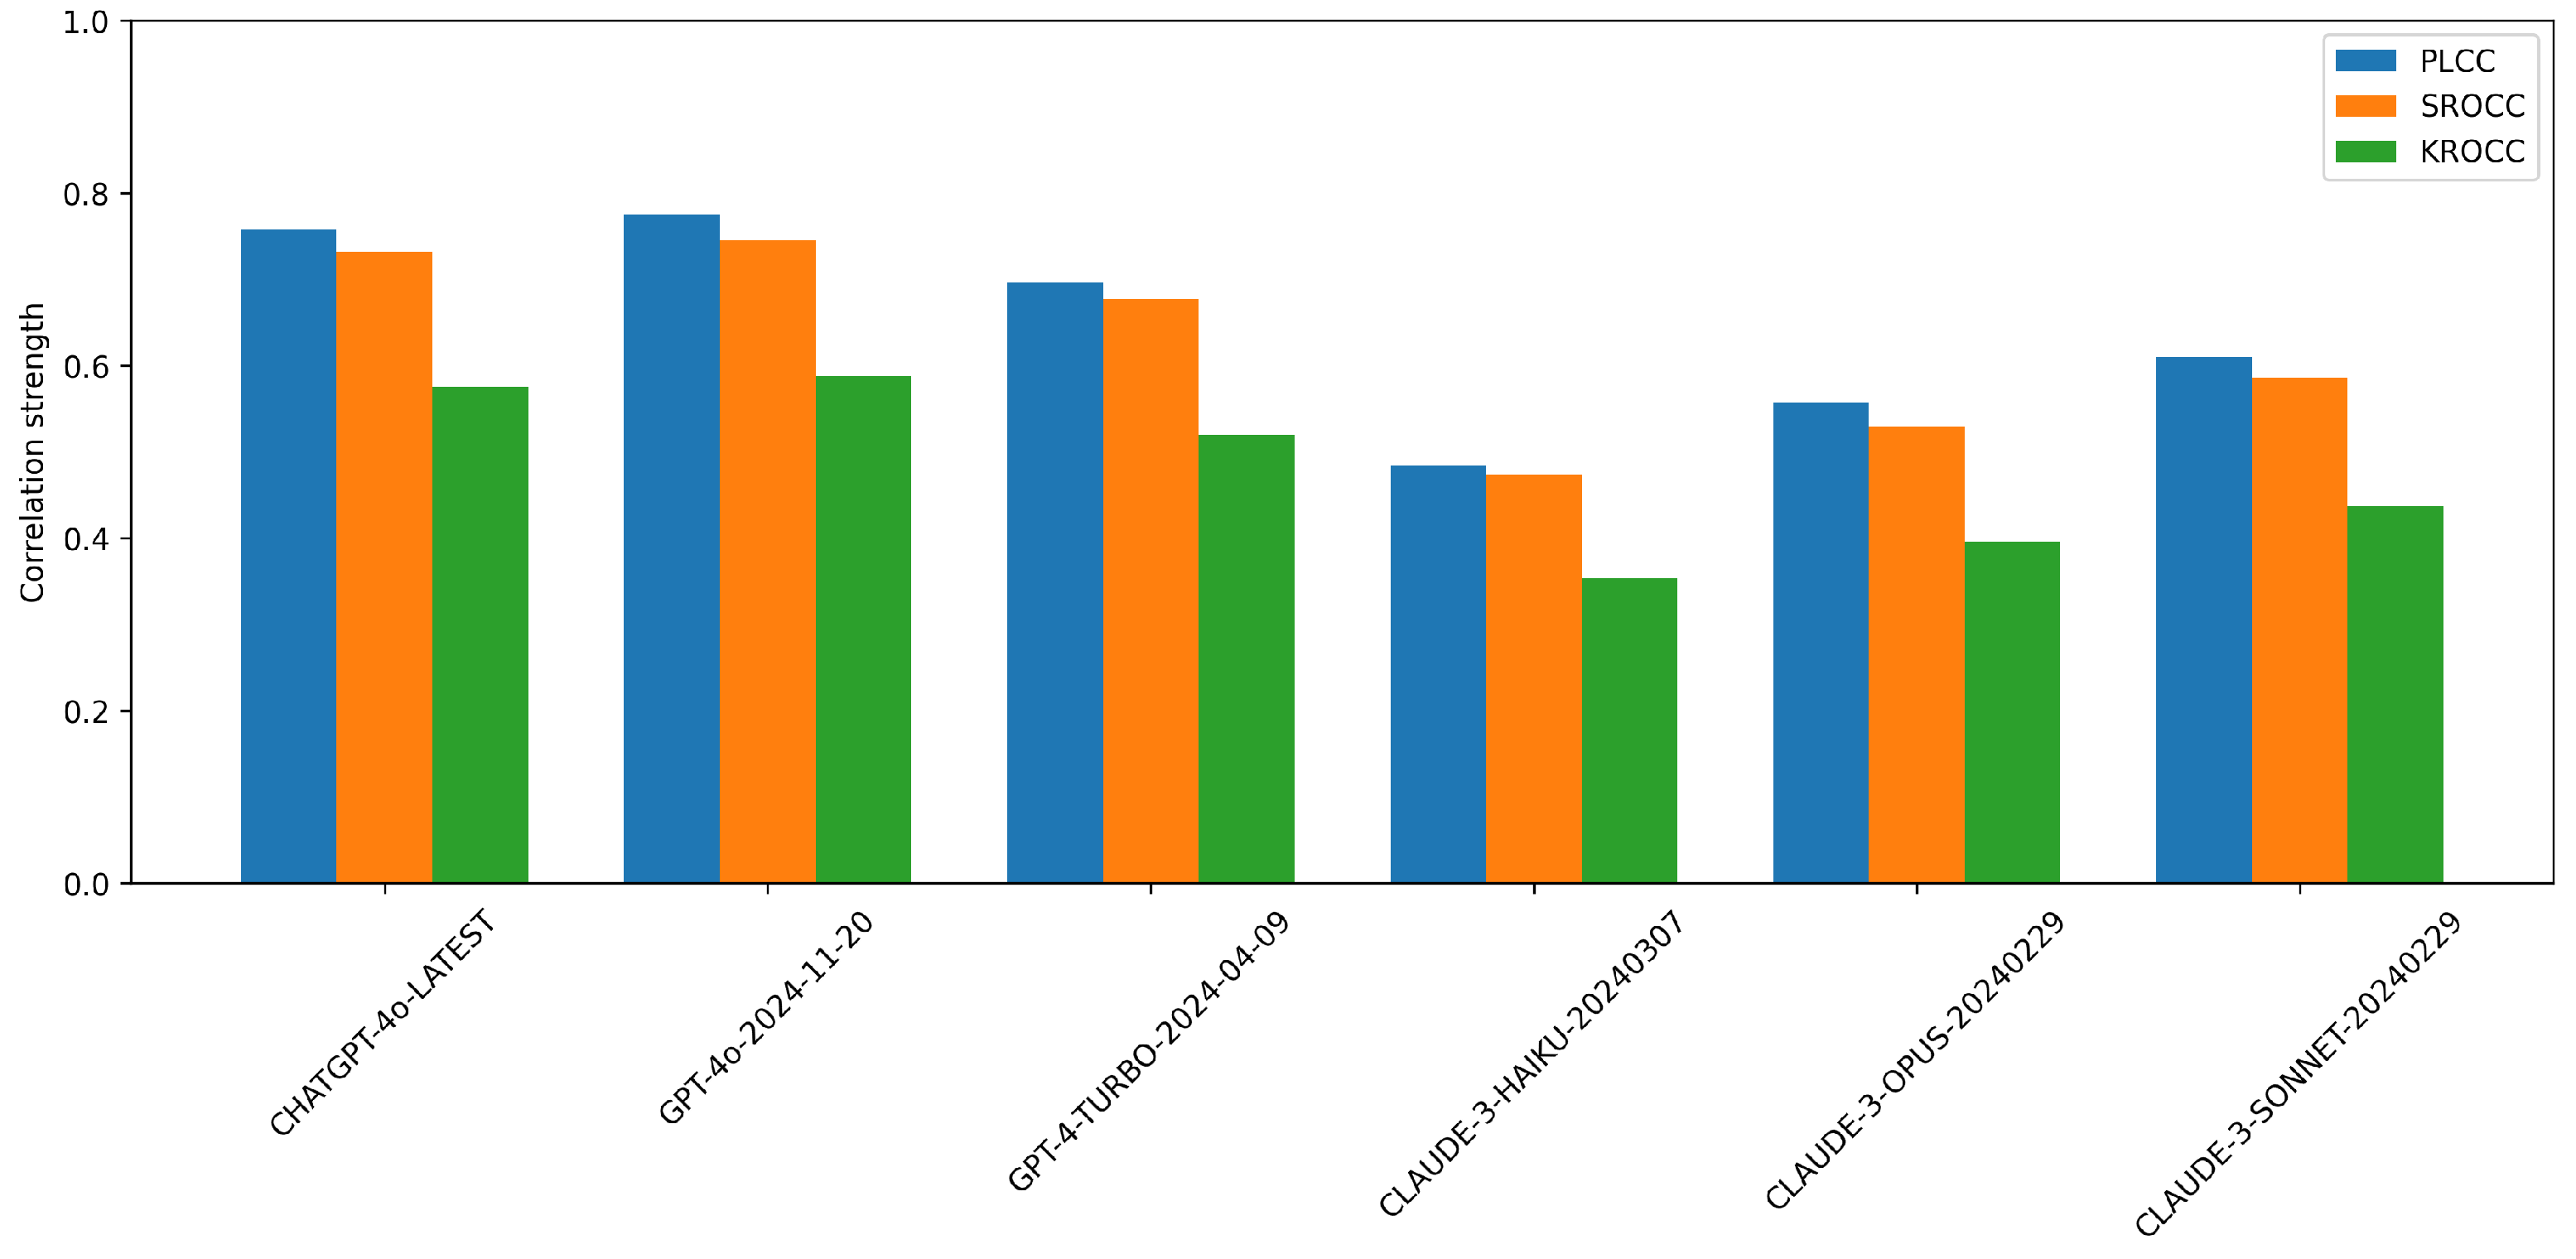
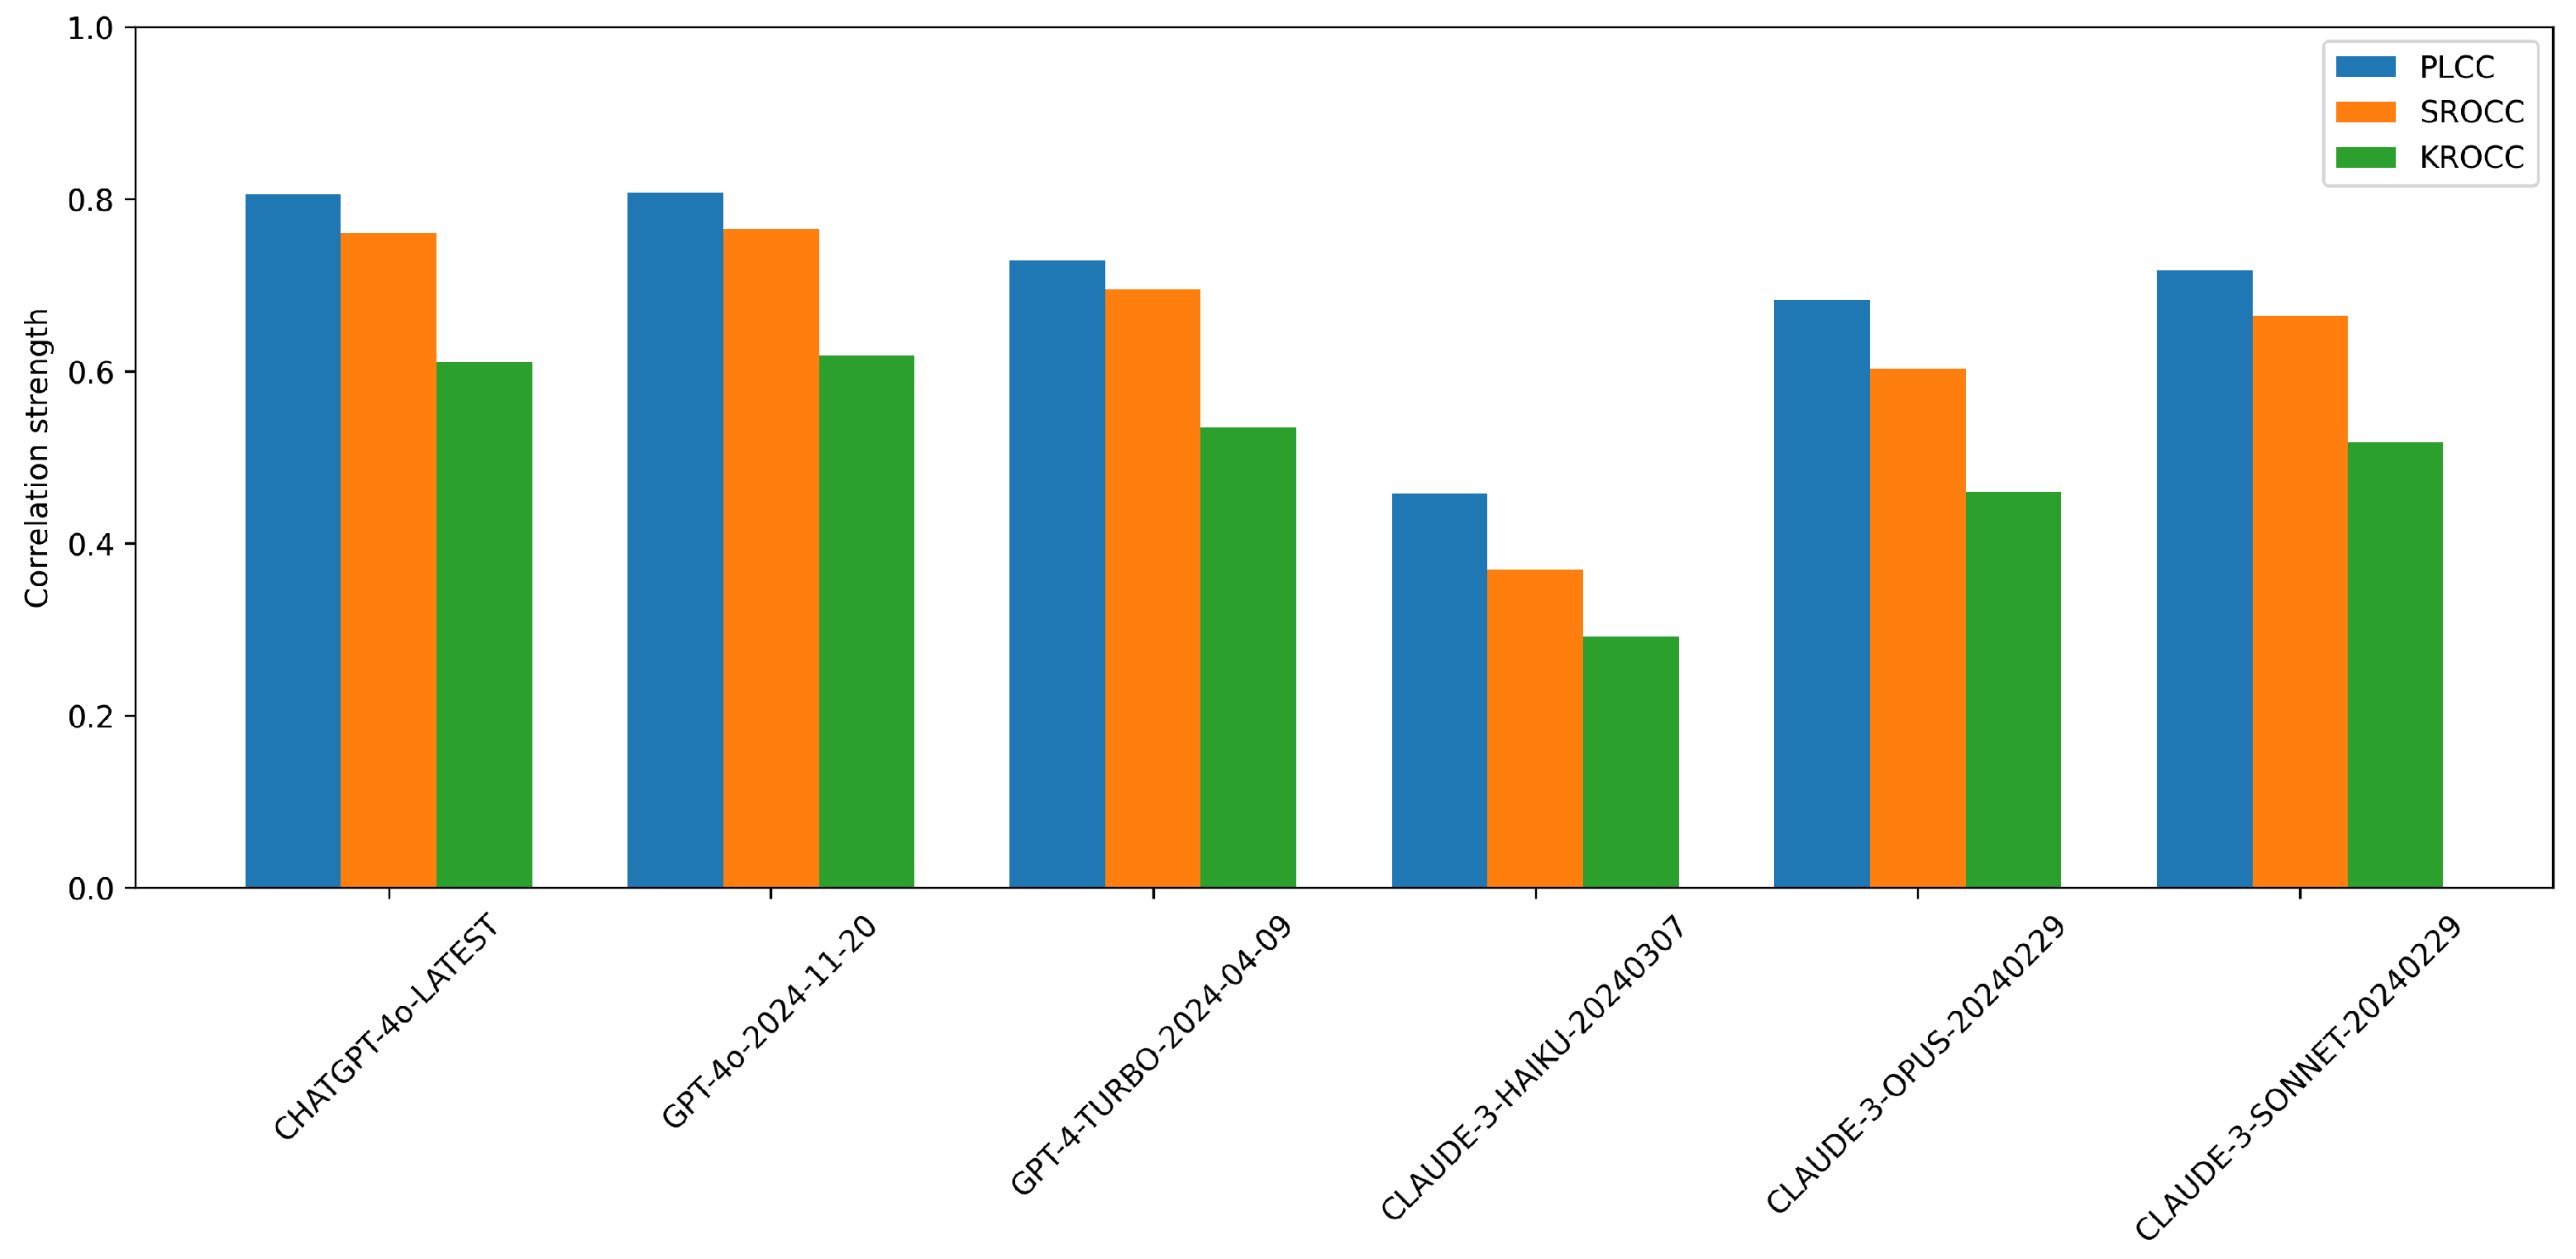
Figure 4 compares the performance of various multimodal LLMs on NR-IQA using the CLIVE [34] dataset. From the results, ChatGPT-4o-Latest and GPT-4o-2024-11-20 consistently outperform the other models, showing the highest correlation with human quality ratings. GPT-4-Turbo-2024-04-09 also demonstrates strong performance, although it slightly underperforms top two models. In contrast, the Claude-series models (Haiku, Opus, and Sonnet) exhibit noticeably weaker performance, particularly Claude-3-Haiku-20240307, which receives the lowest scores across all metrics. This suggests that OpenAI’s models are significantly more aligned with human judgments on this task than Anthropic’s models are. The performance gap between the best and worst models is substantial, indicating that not all LLMs are equally effective for image quality assessment tasks. Figure 5 presents a comparative analysis of multimodal LLMs for NR-IQA on the KonIQ-10k [1] dataset.

Figure 4.
Performance comparison of multimodal proprietary LLMs on NR-IQA tasks on CLIVE [34] in terms of PLCC, SROCC, and KROCC.
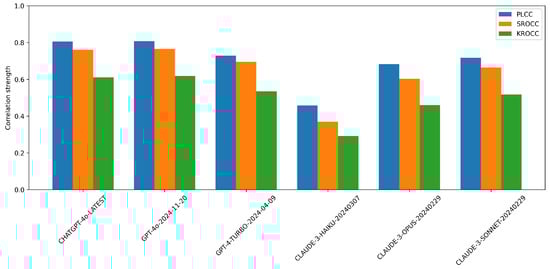
Figure 5.
Performance comparison of multimodal proprietary LLMs on NR-IQA tasks on KonIQ-10k [1] in terms of PLCC, SROCC, and KROCC.
Table 2 shows the performance of LLaVA-1.5-7B-HF [90] on the CLIVE [34] and KonIQ-10k [1] benchmarks. The correlation scores with ground-truth quality ratings are notably low, indicating limited effectiveness in NR-IQA tasks. This contrasts with the proprietary models evaluated in the previous section, which achieve substantially higher correlations, highlighting a significant performance gap between open-source and commercial multimodal systems.
Table 2.
Performance of LLaVA-1.5-7B-HF [90] on two benchmark NR-IQA datasets. The table reports correlation metrics between the model’s predicted quality scores (when available) and the ground-truth quality scores.
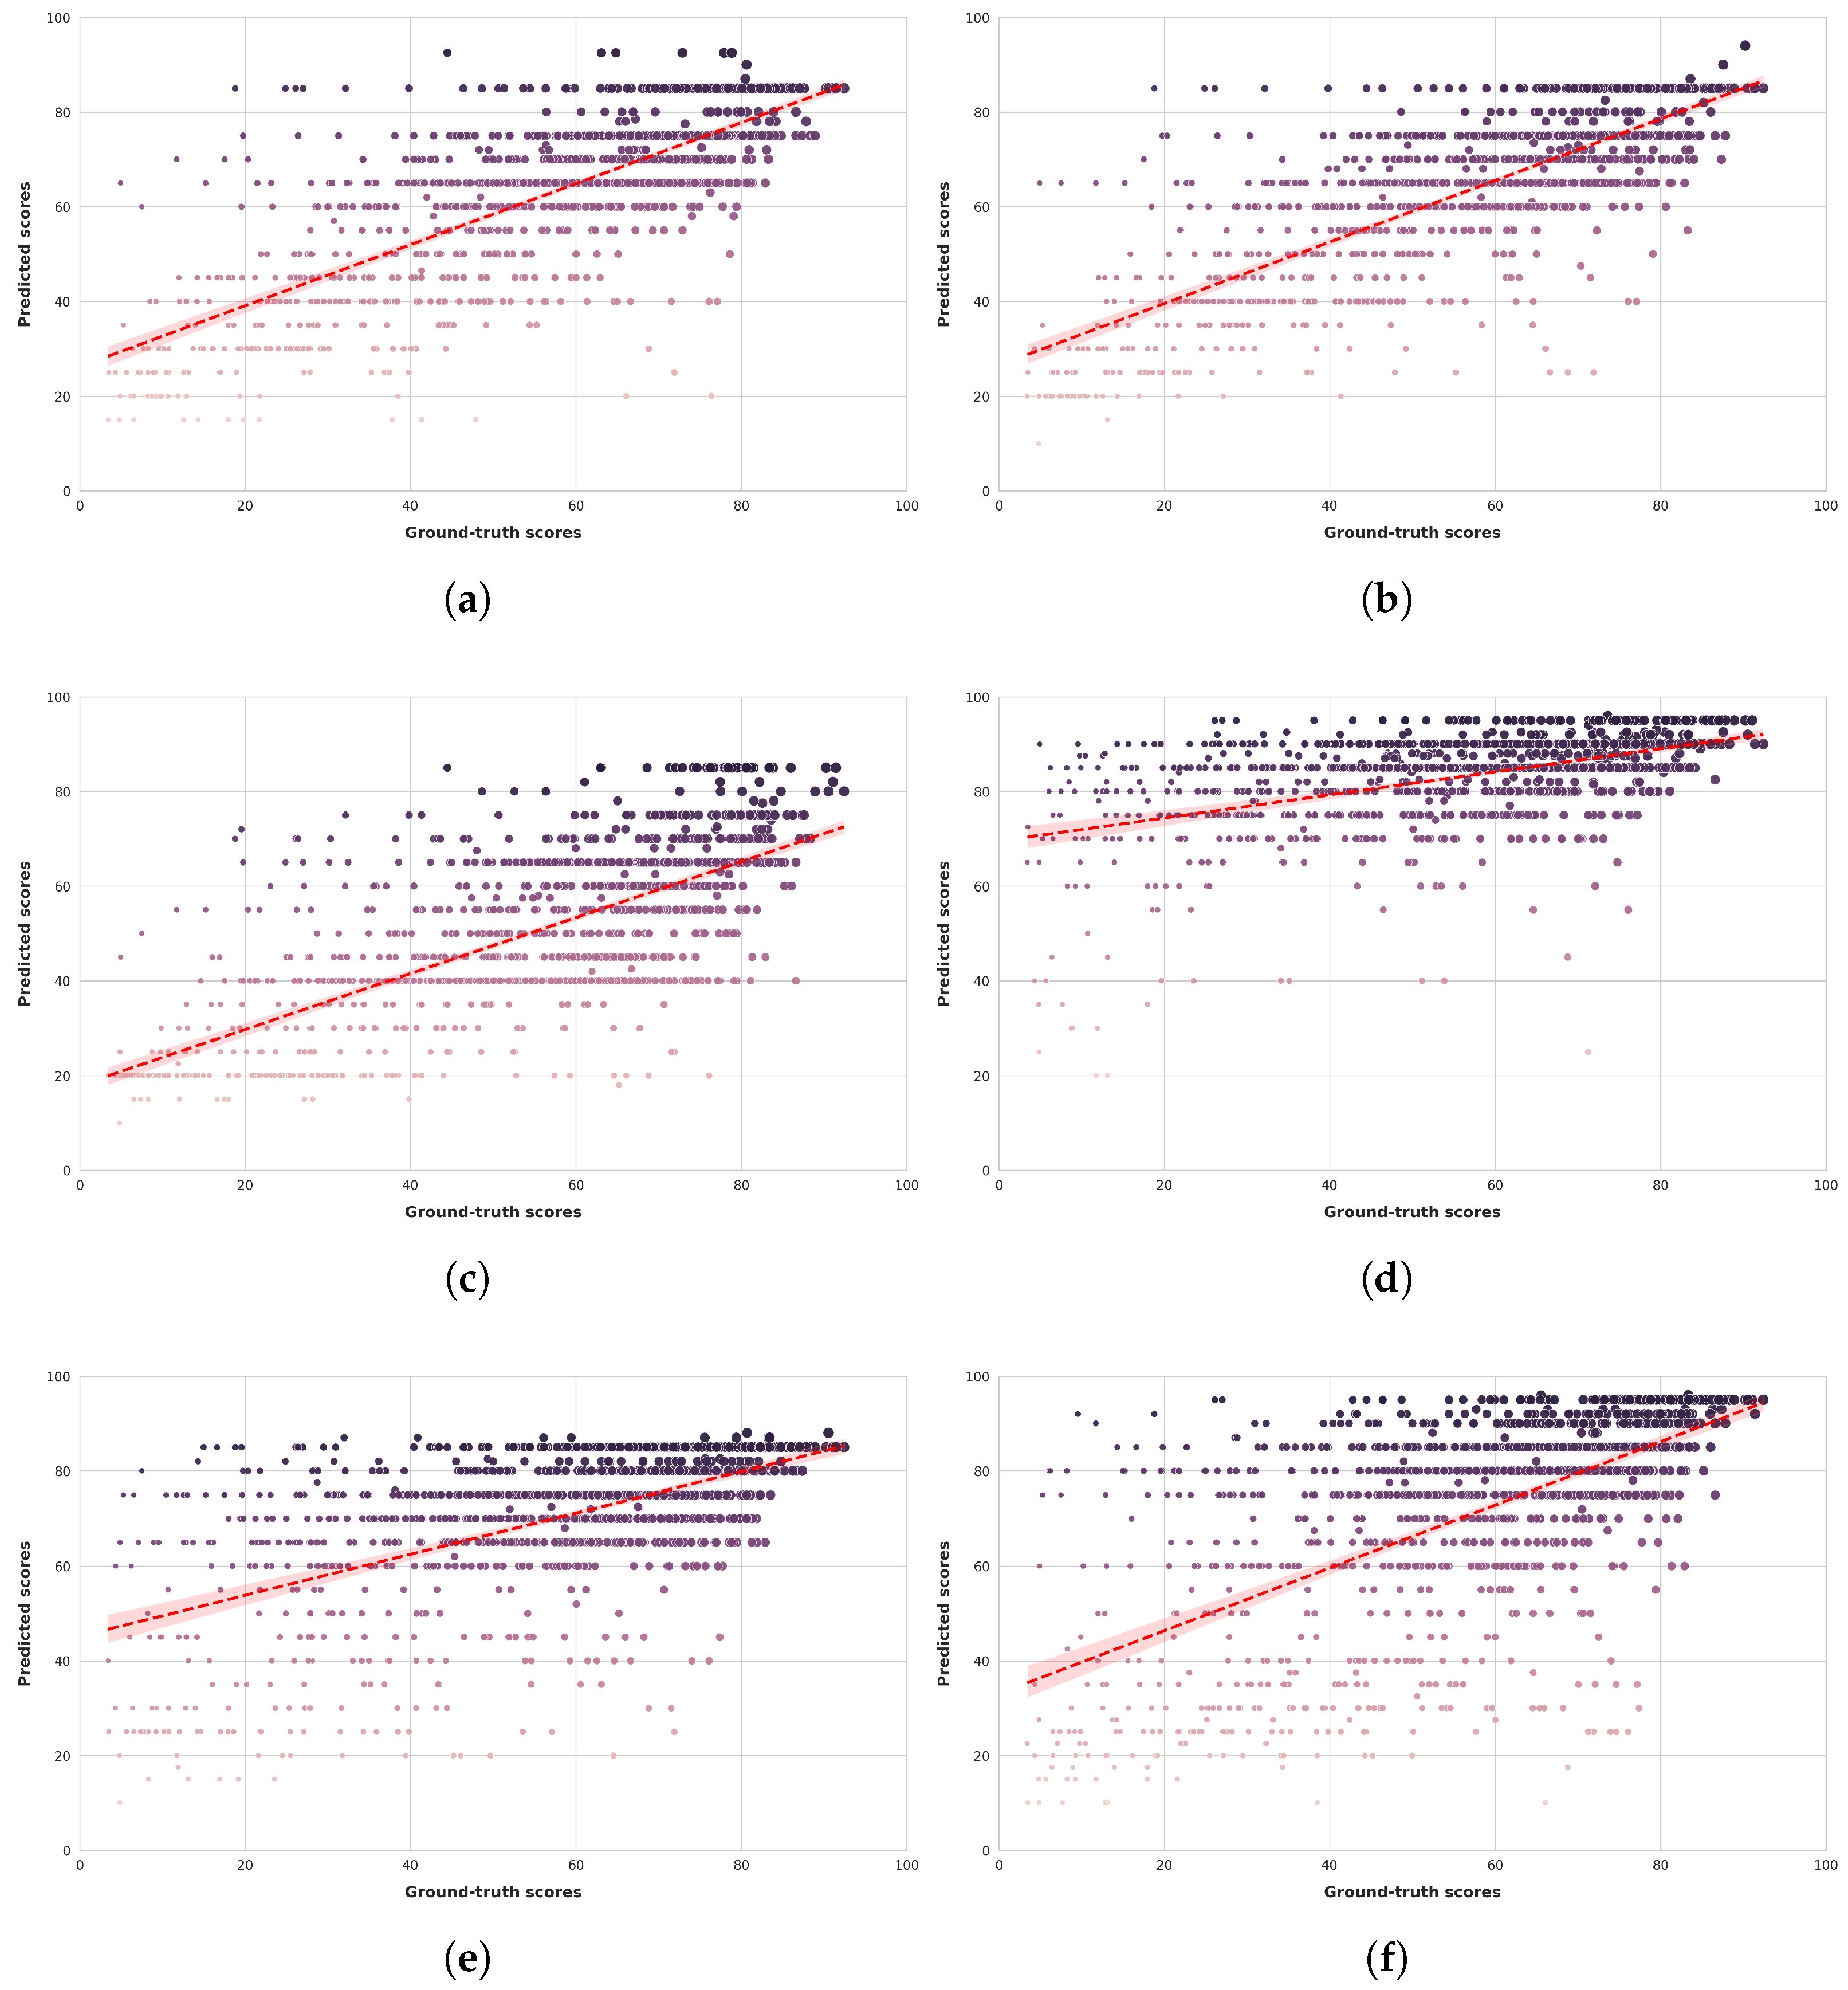
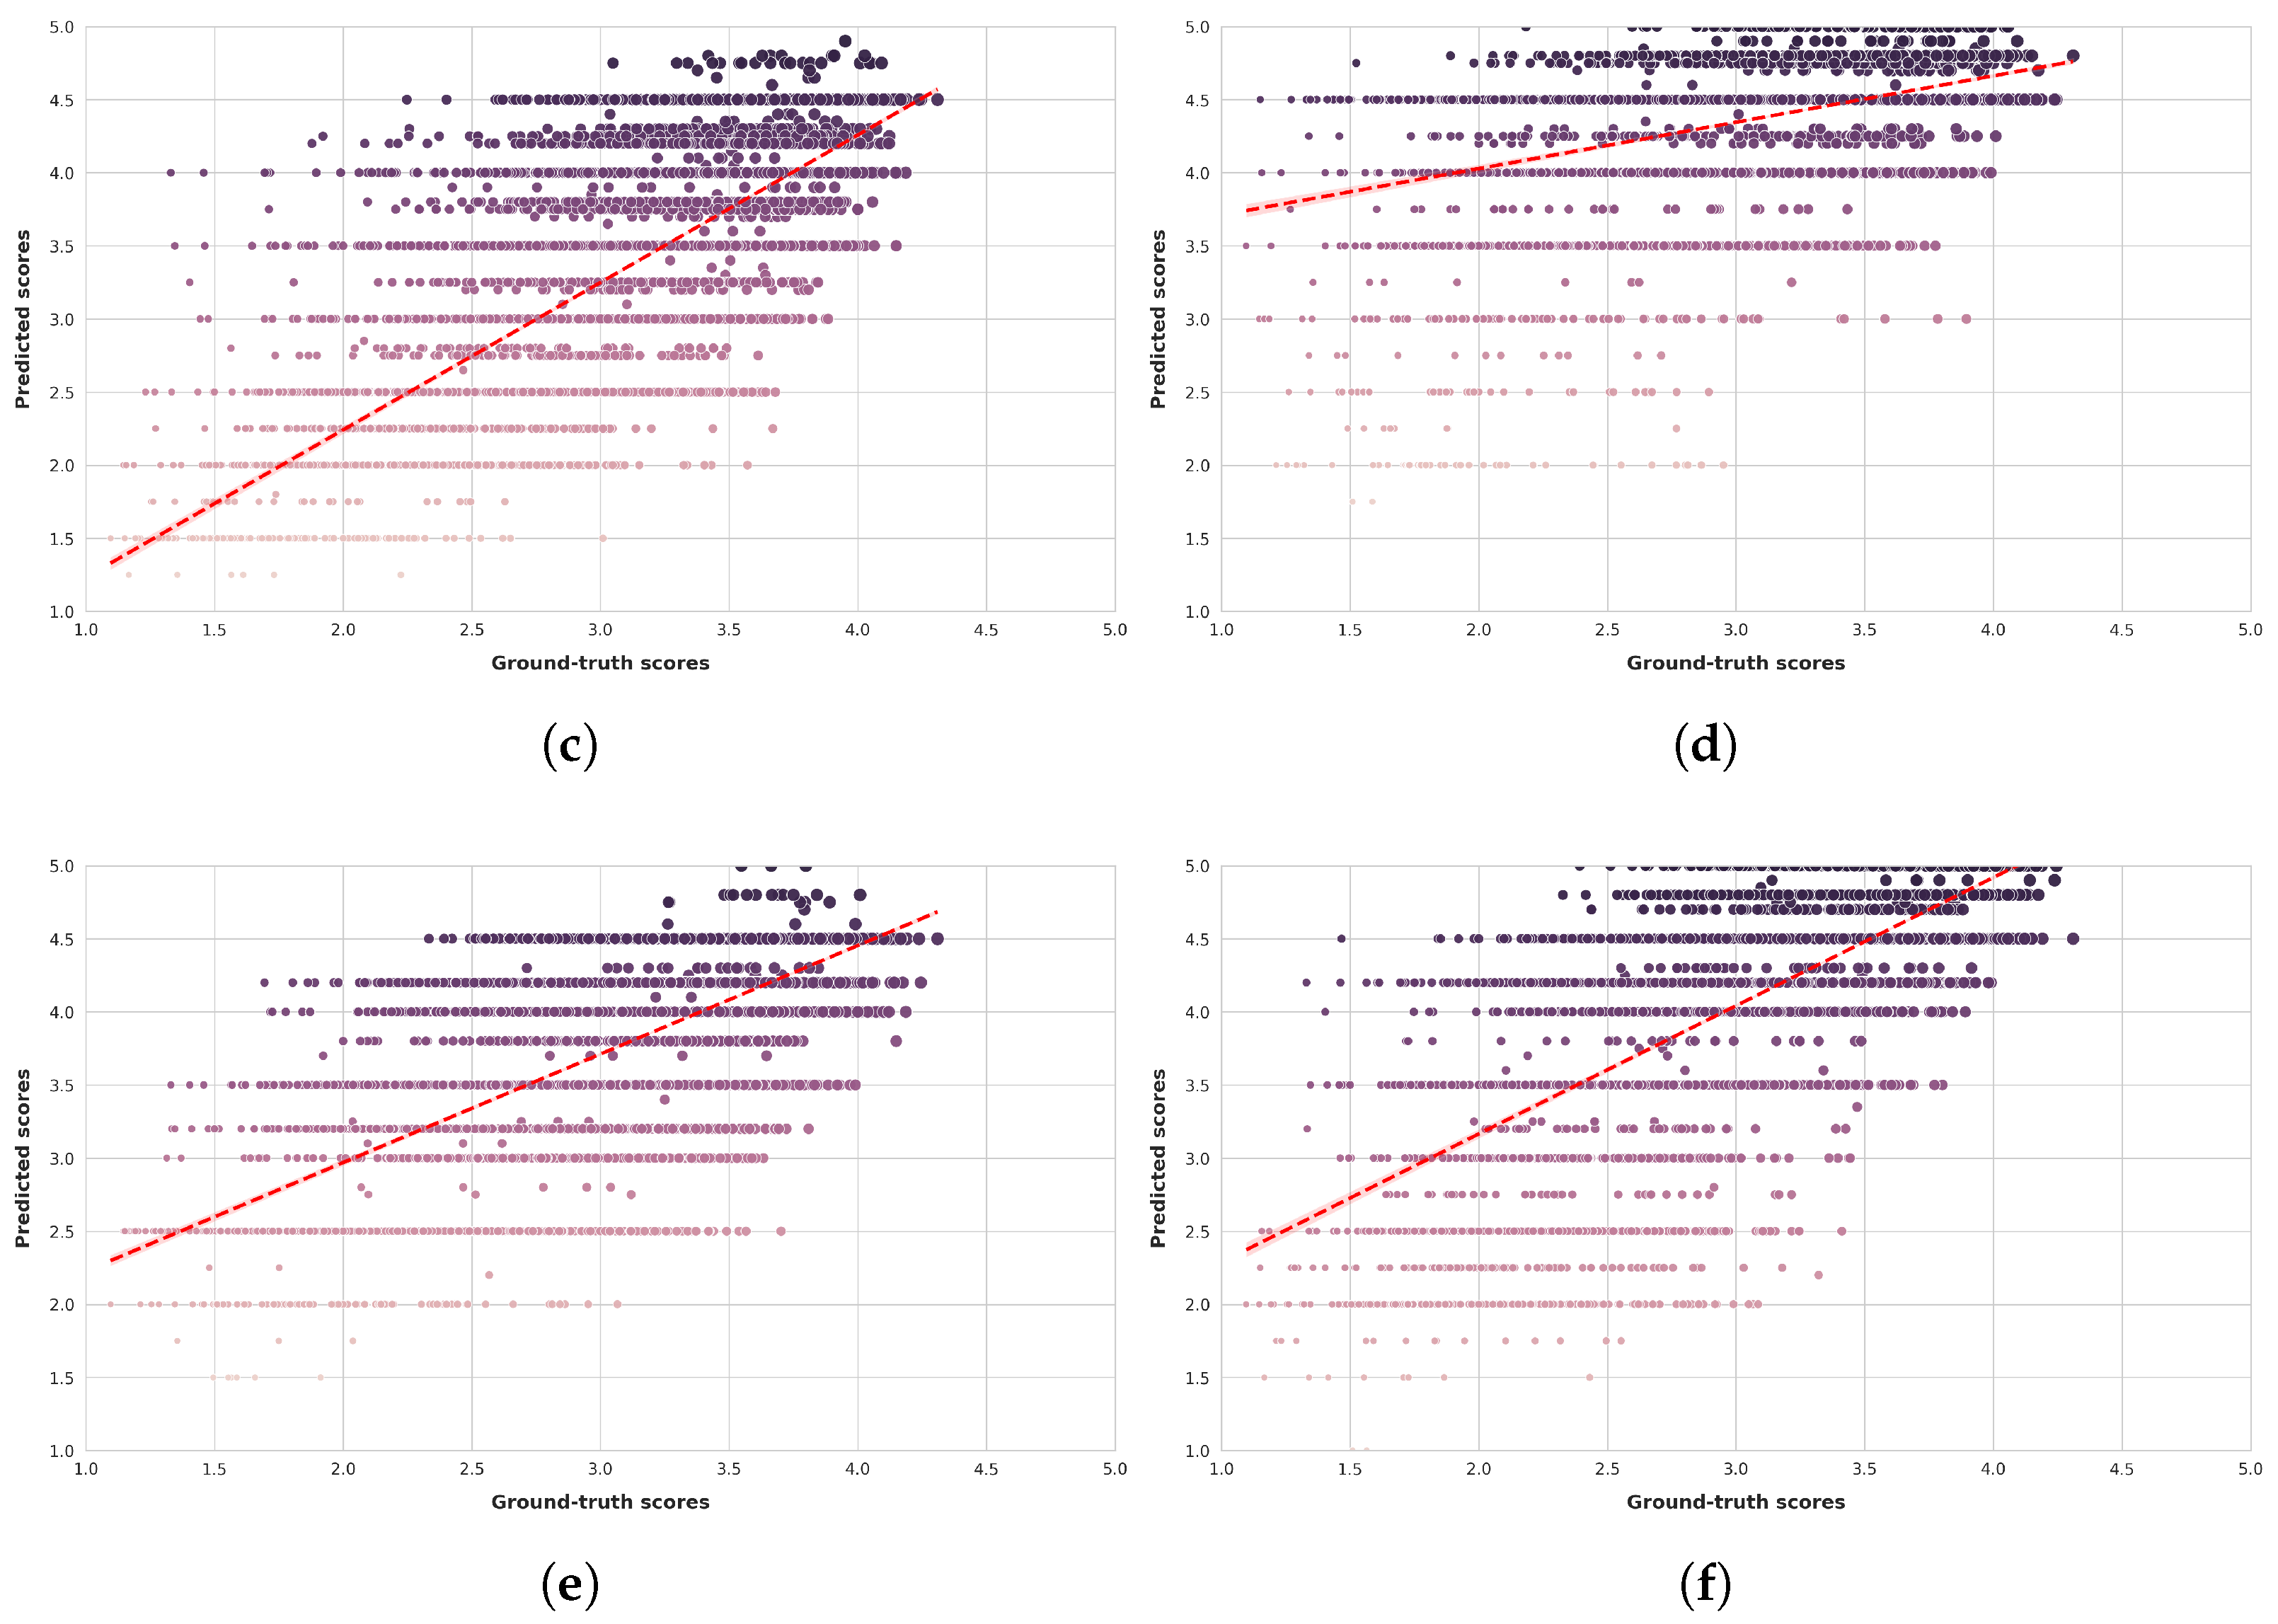
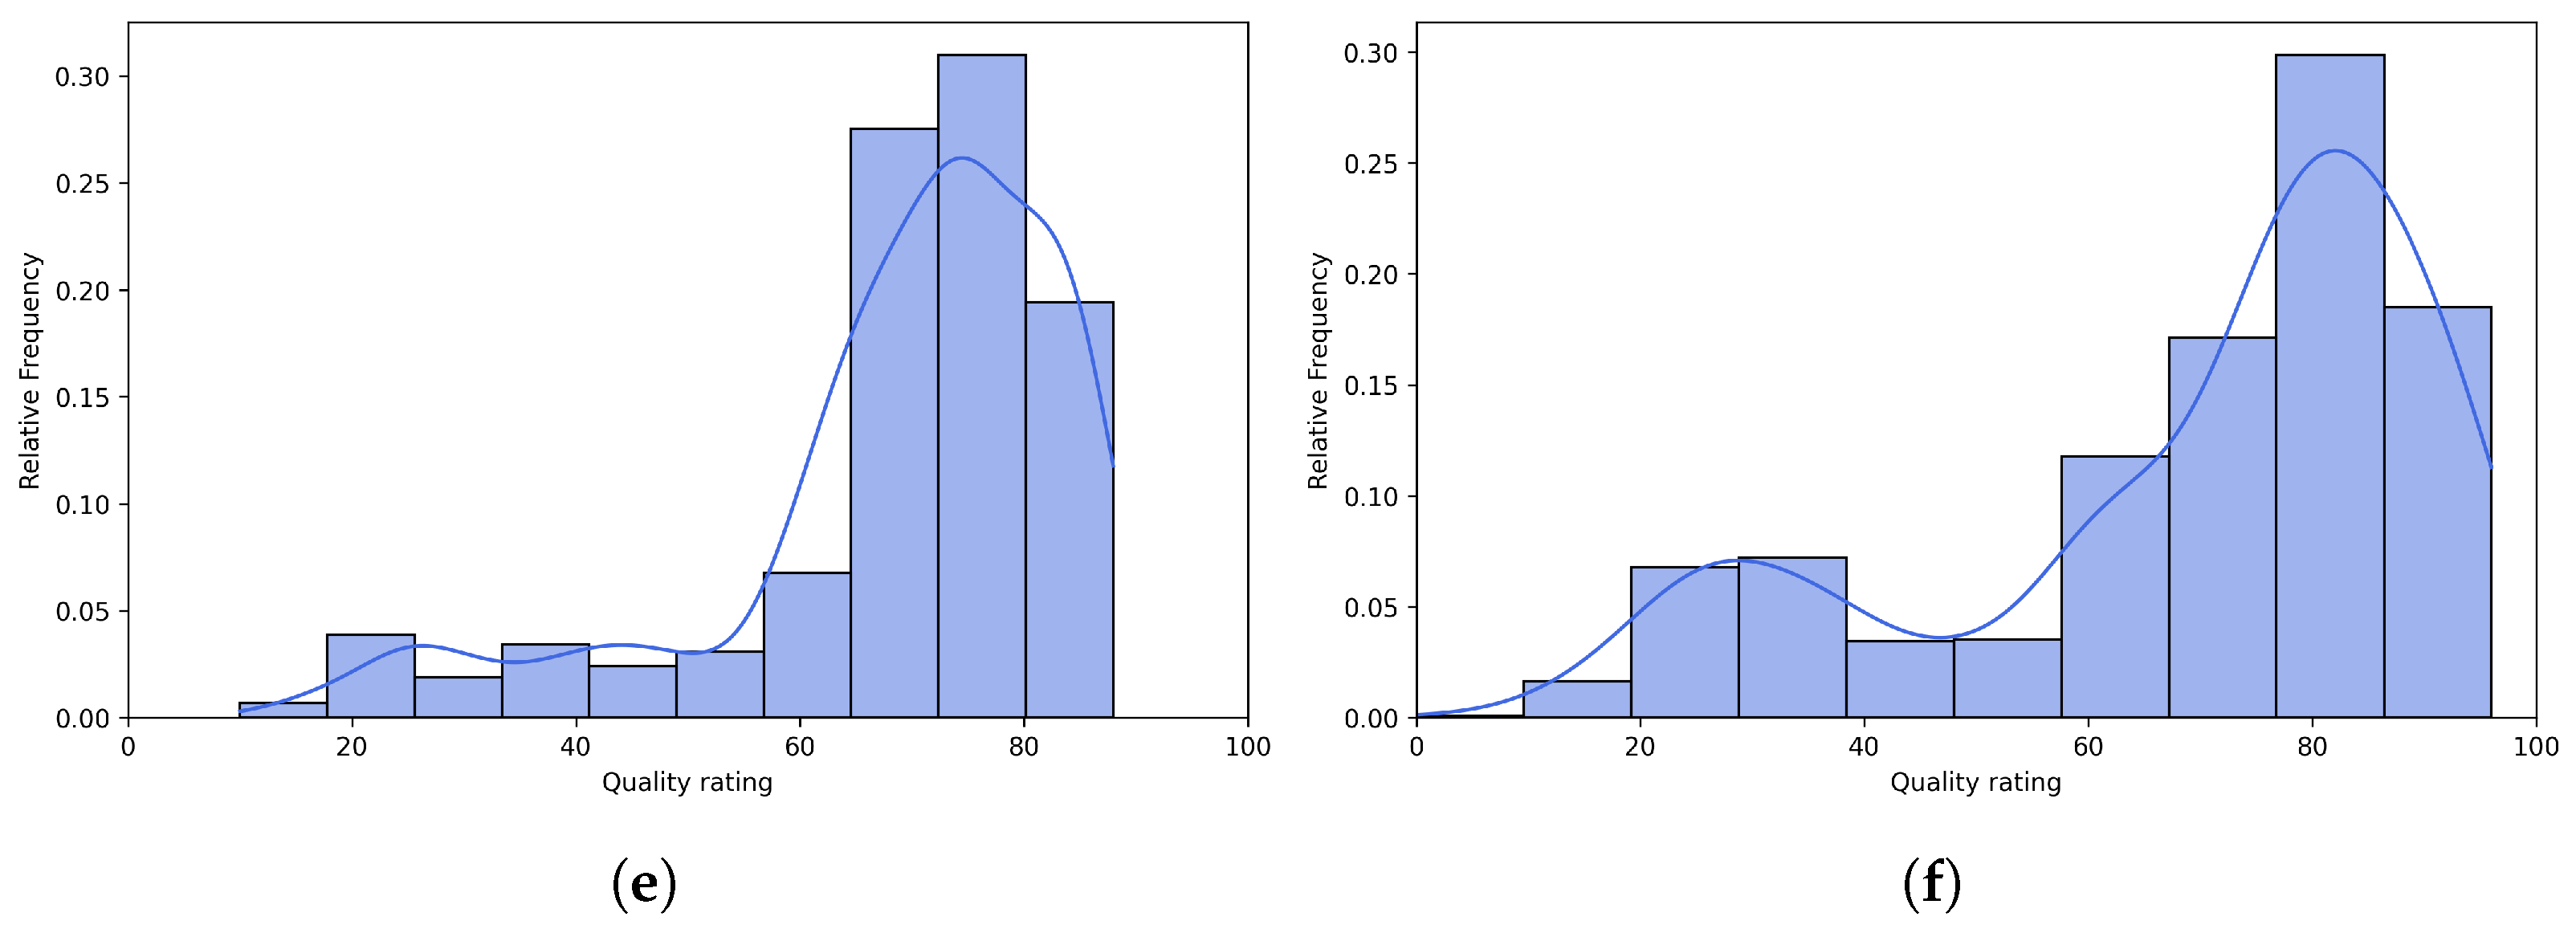
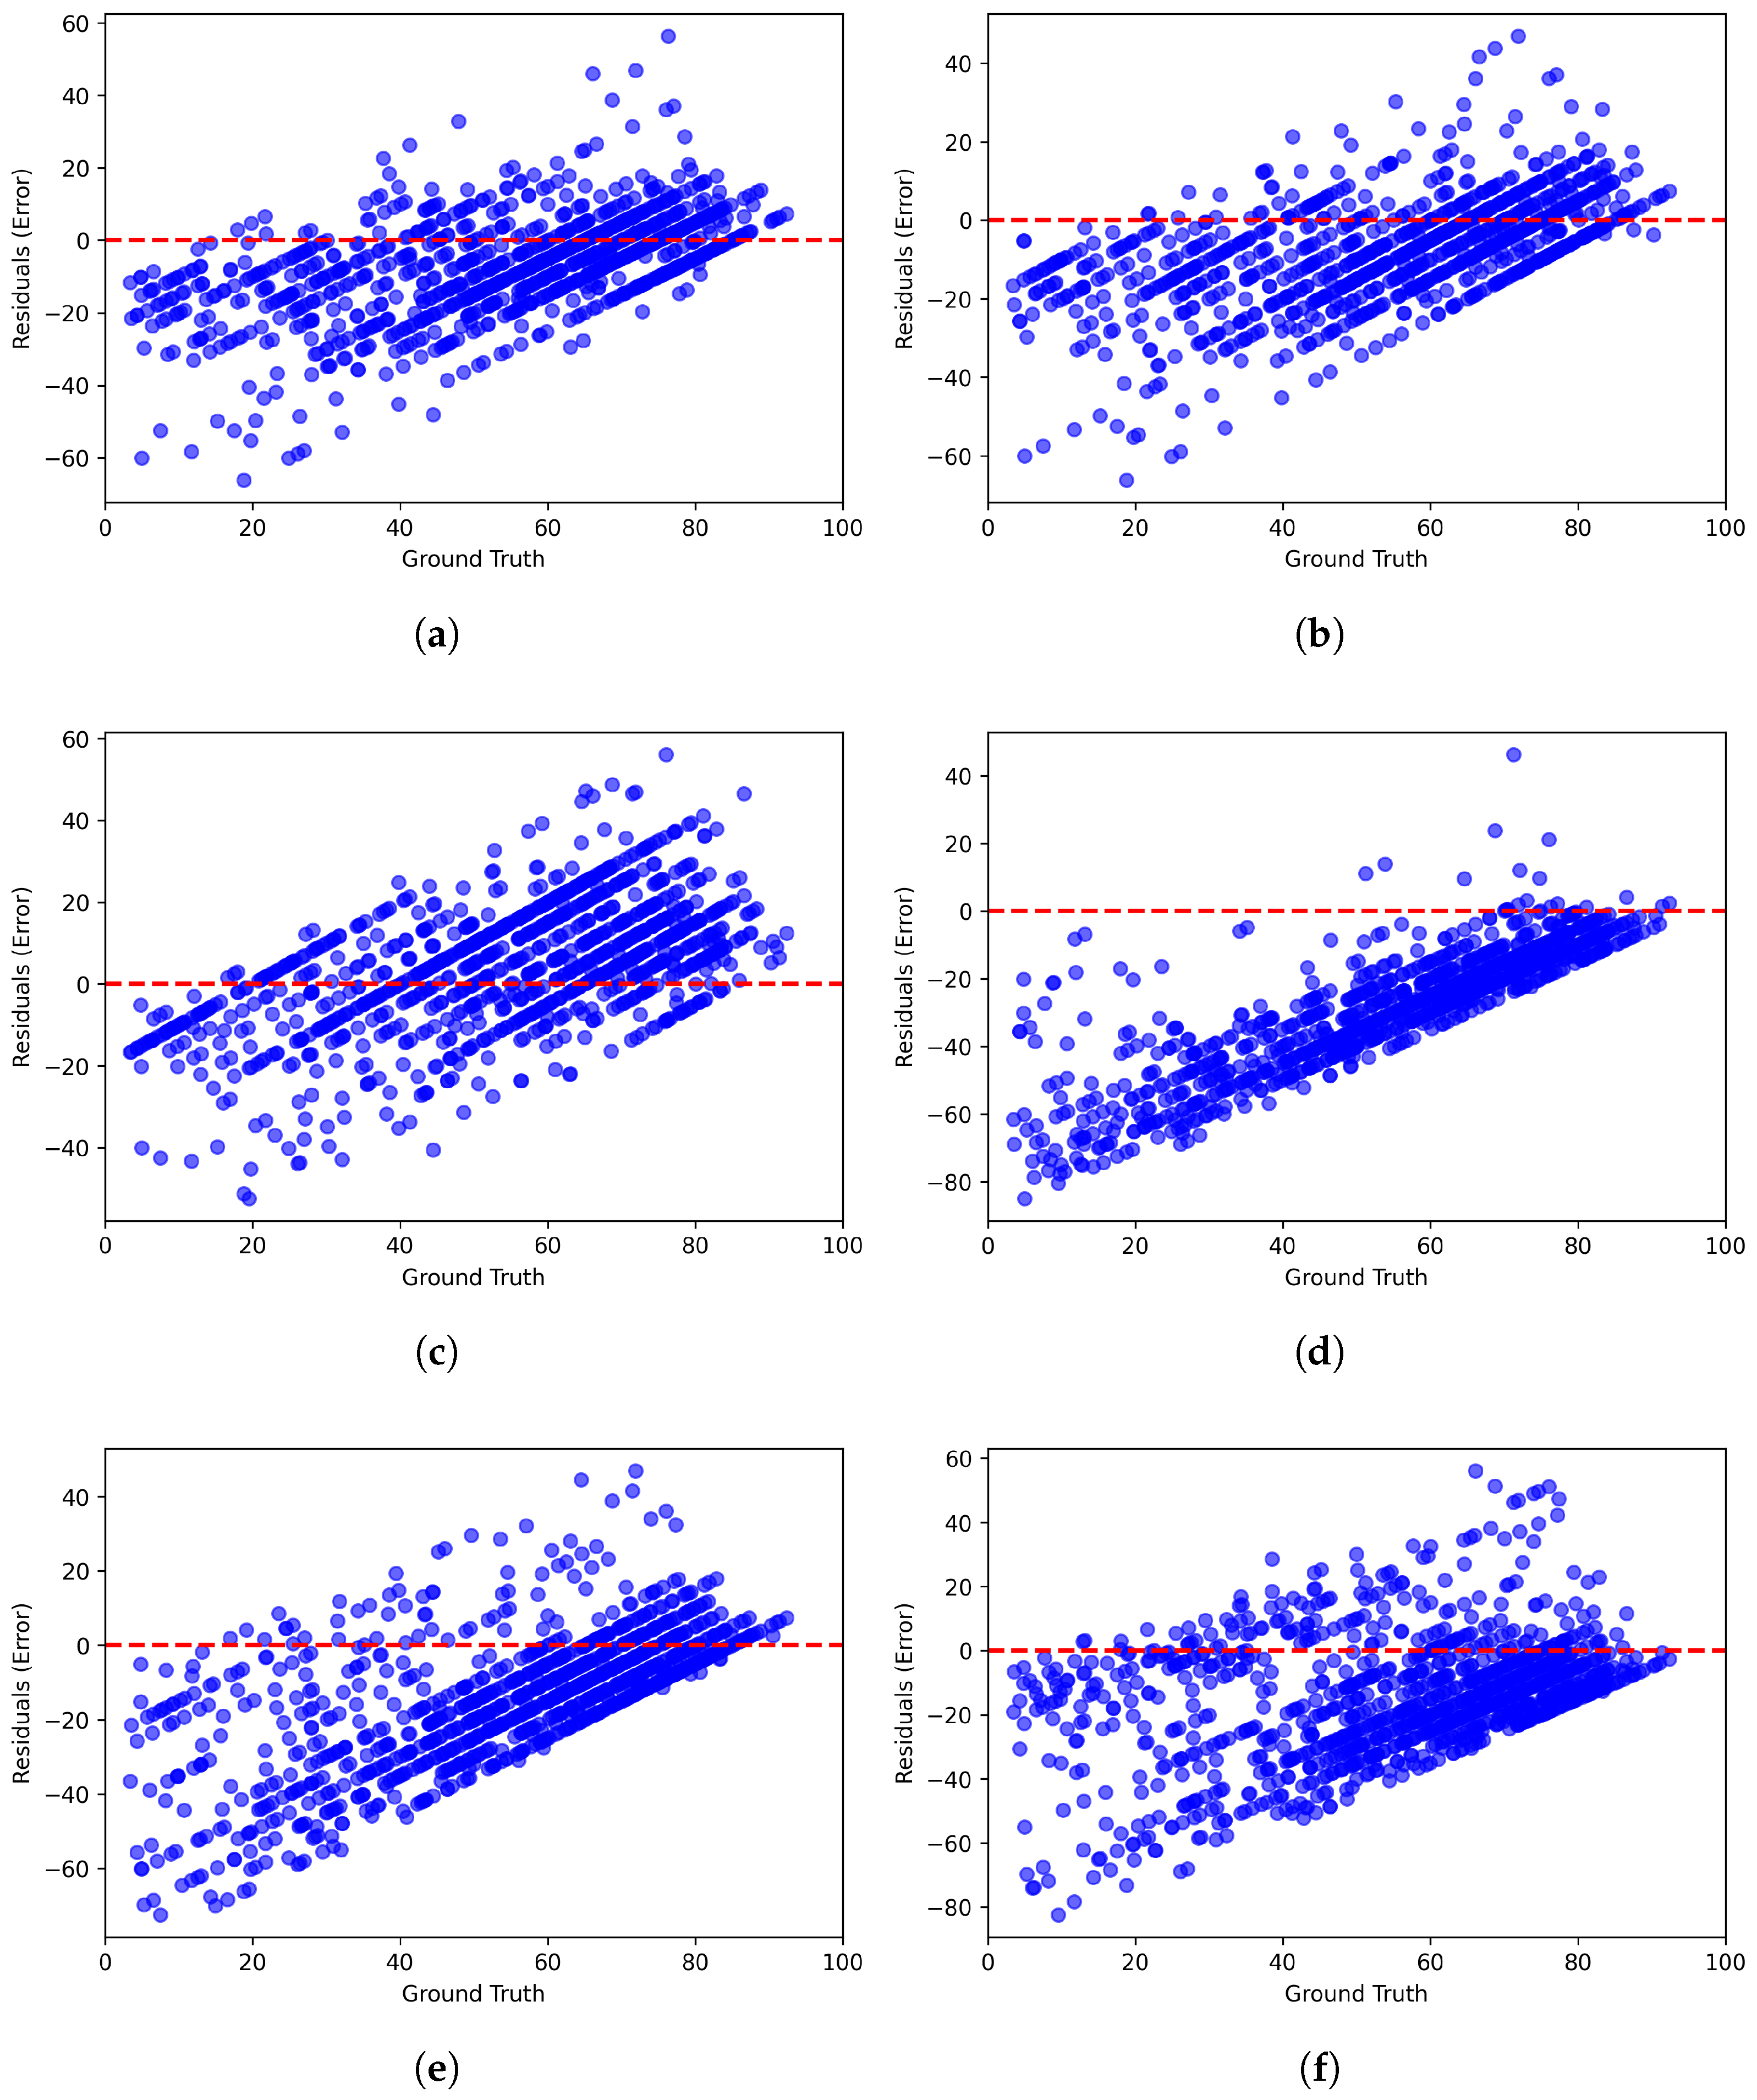
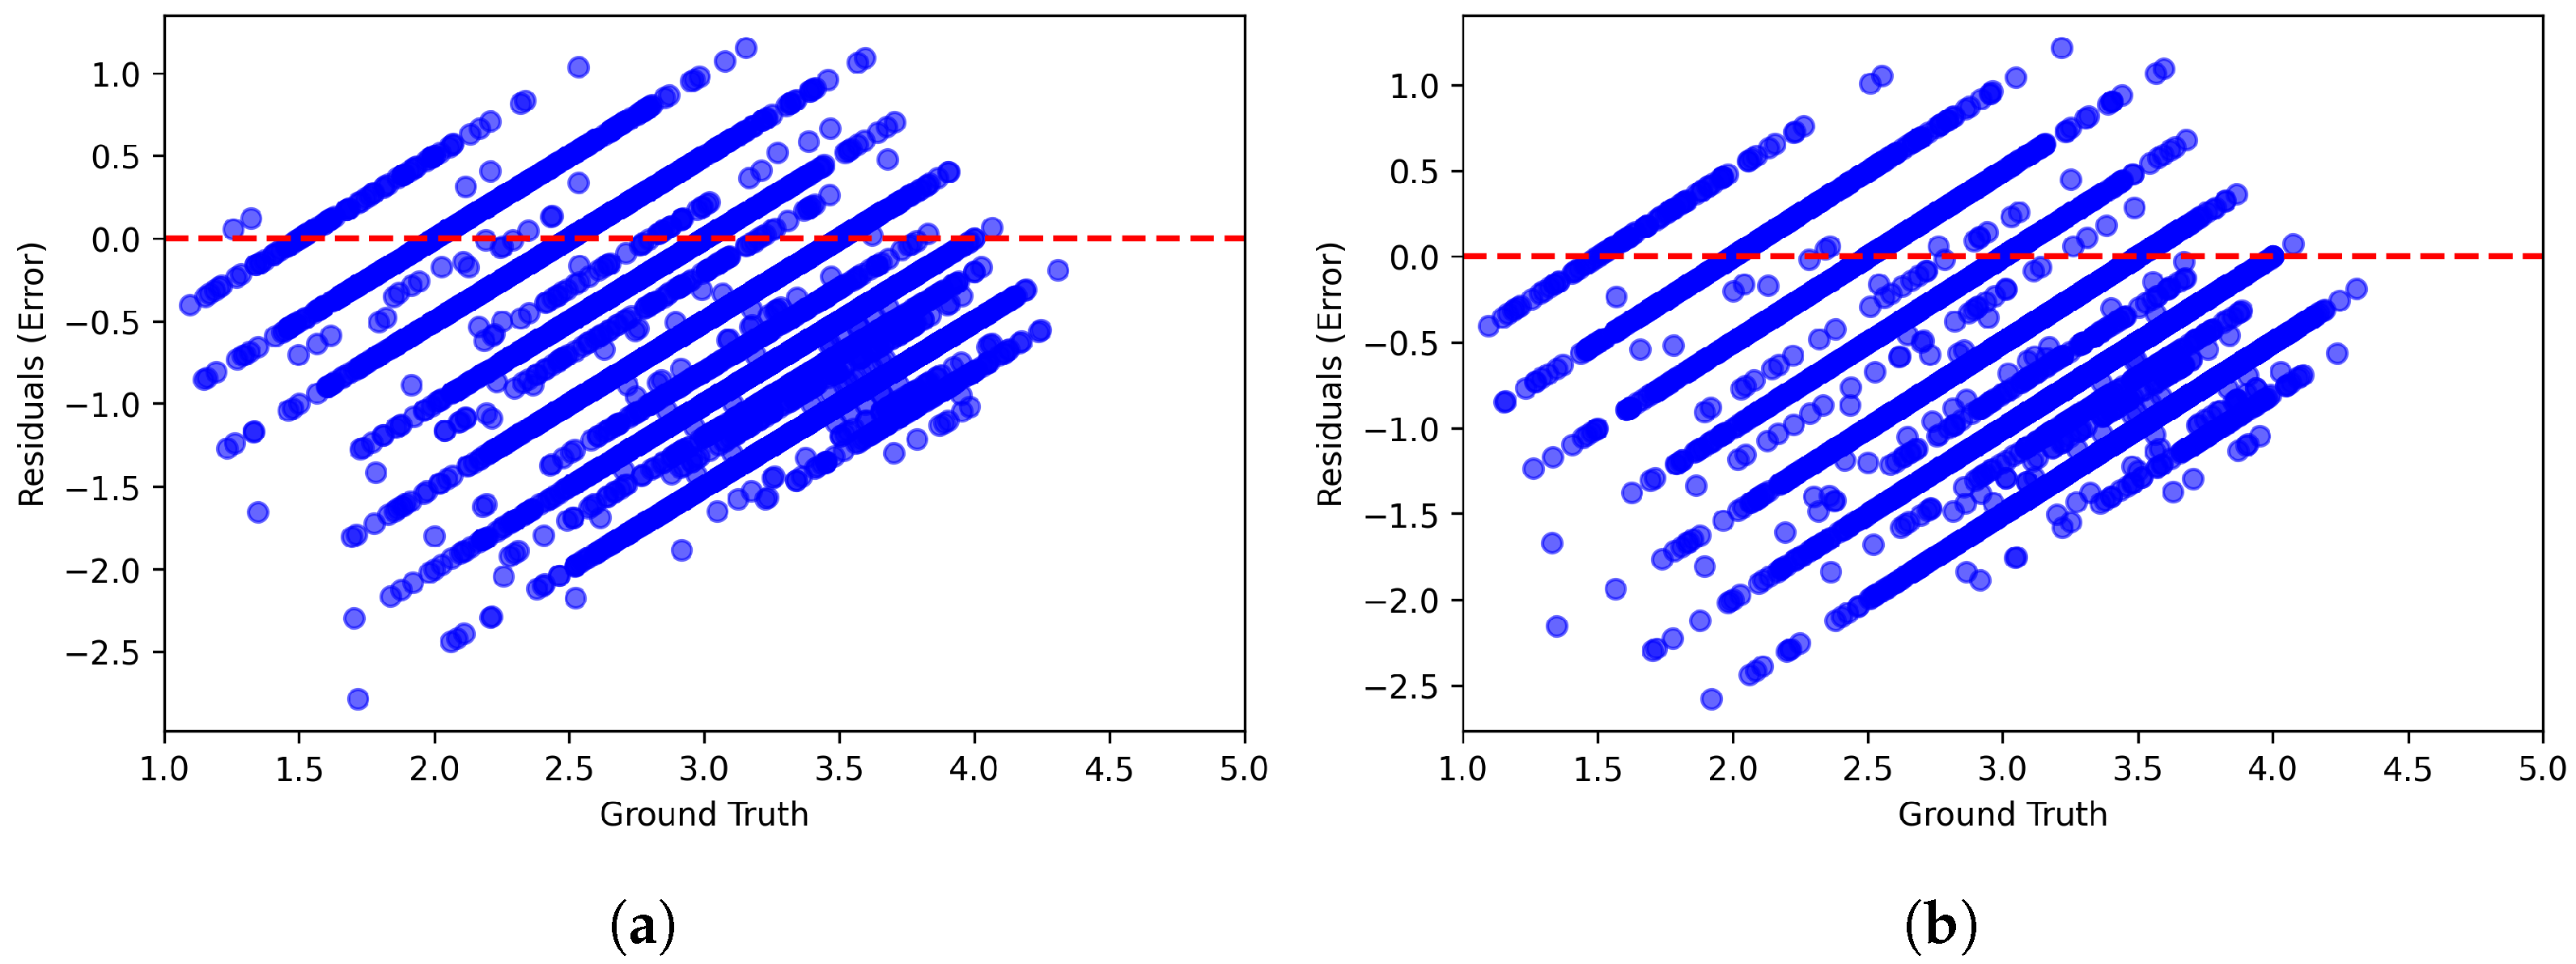
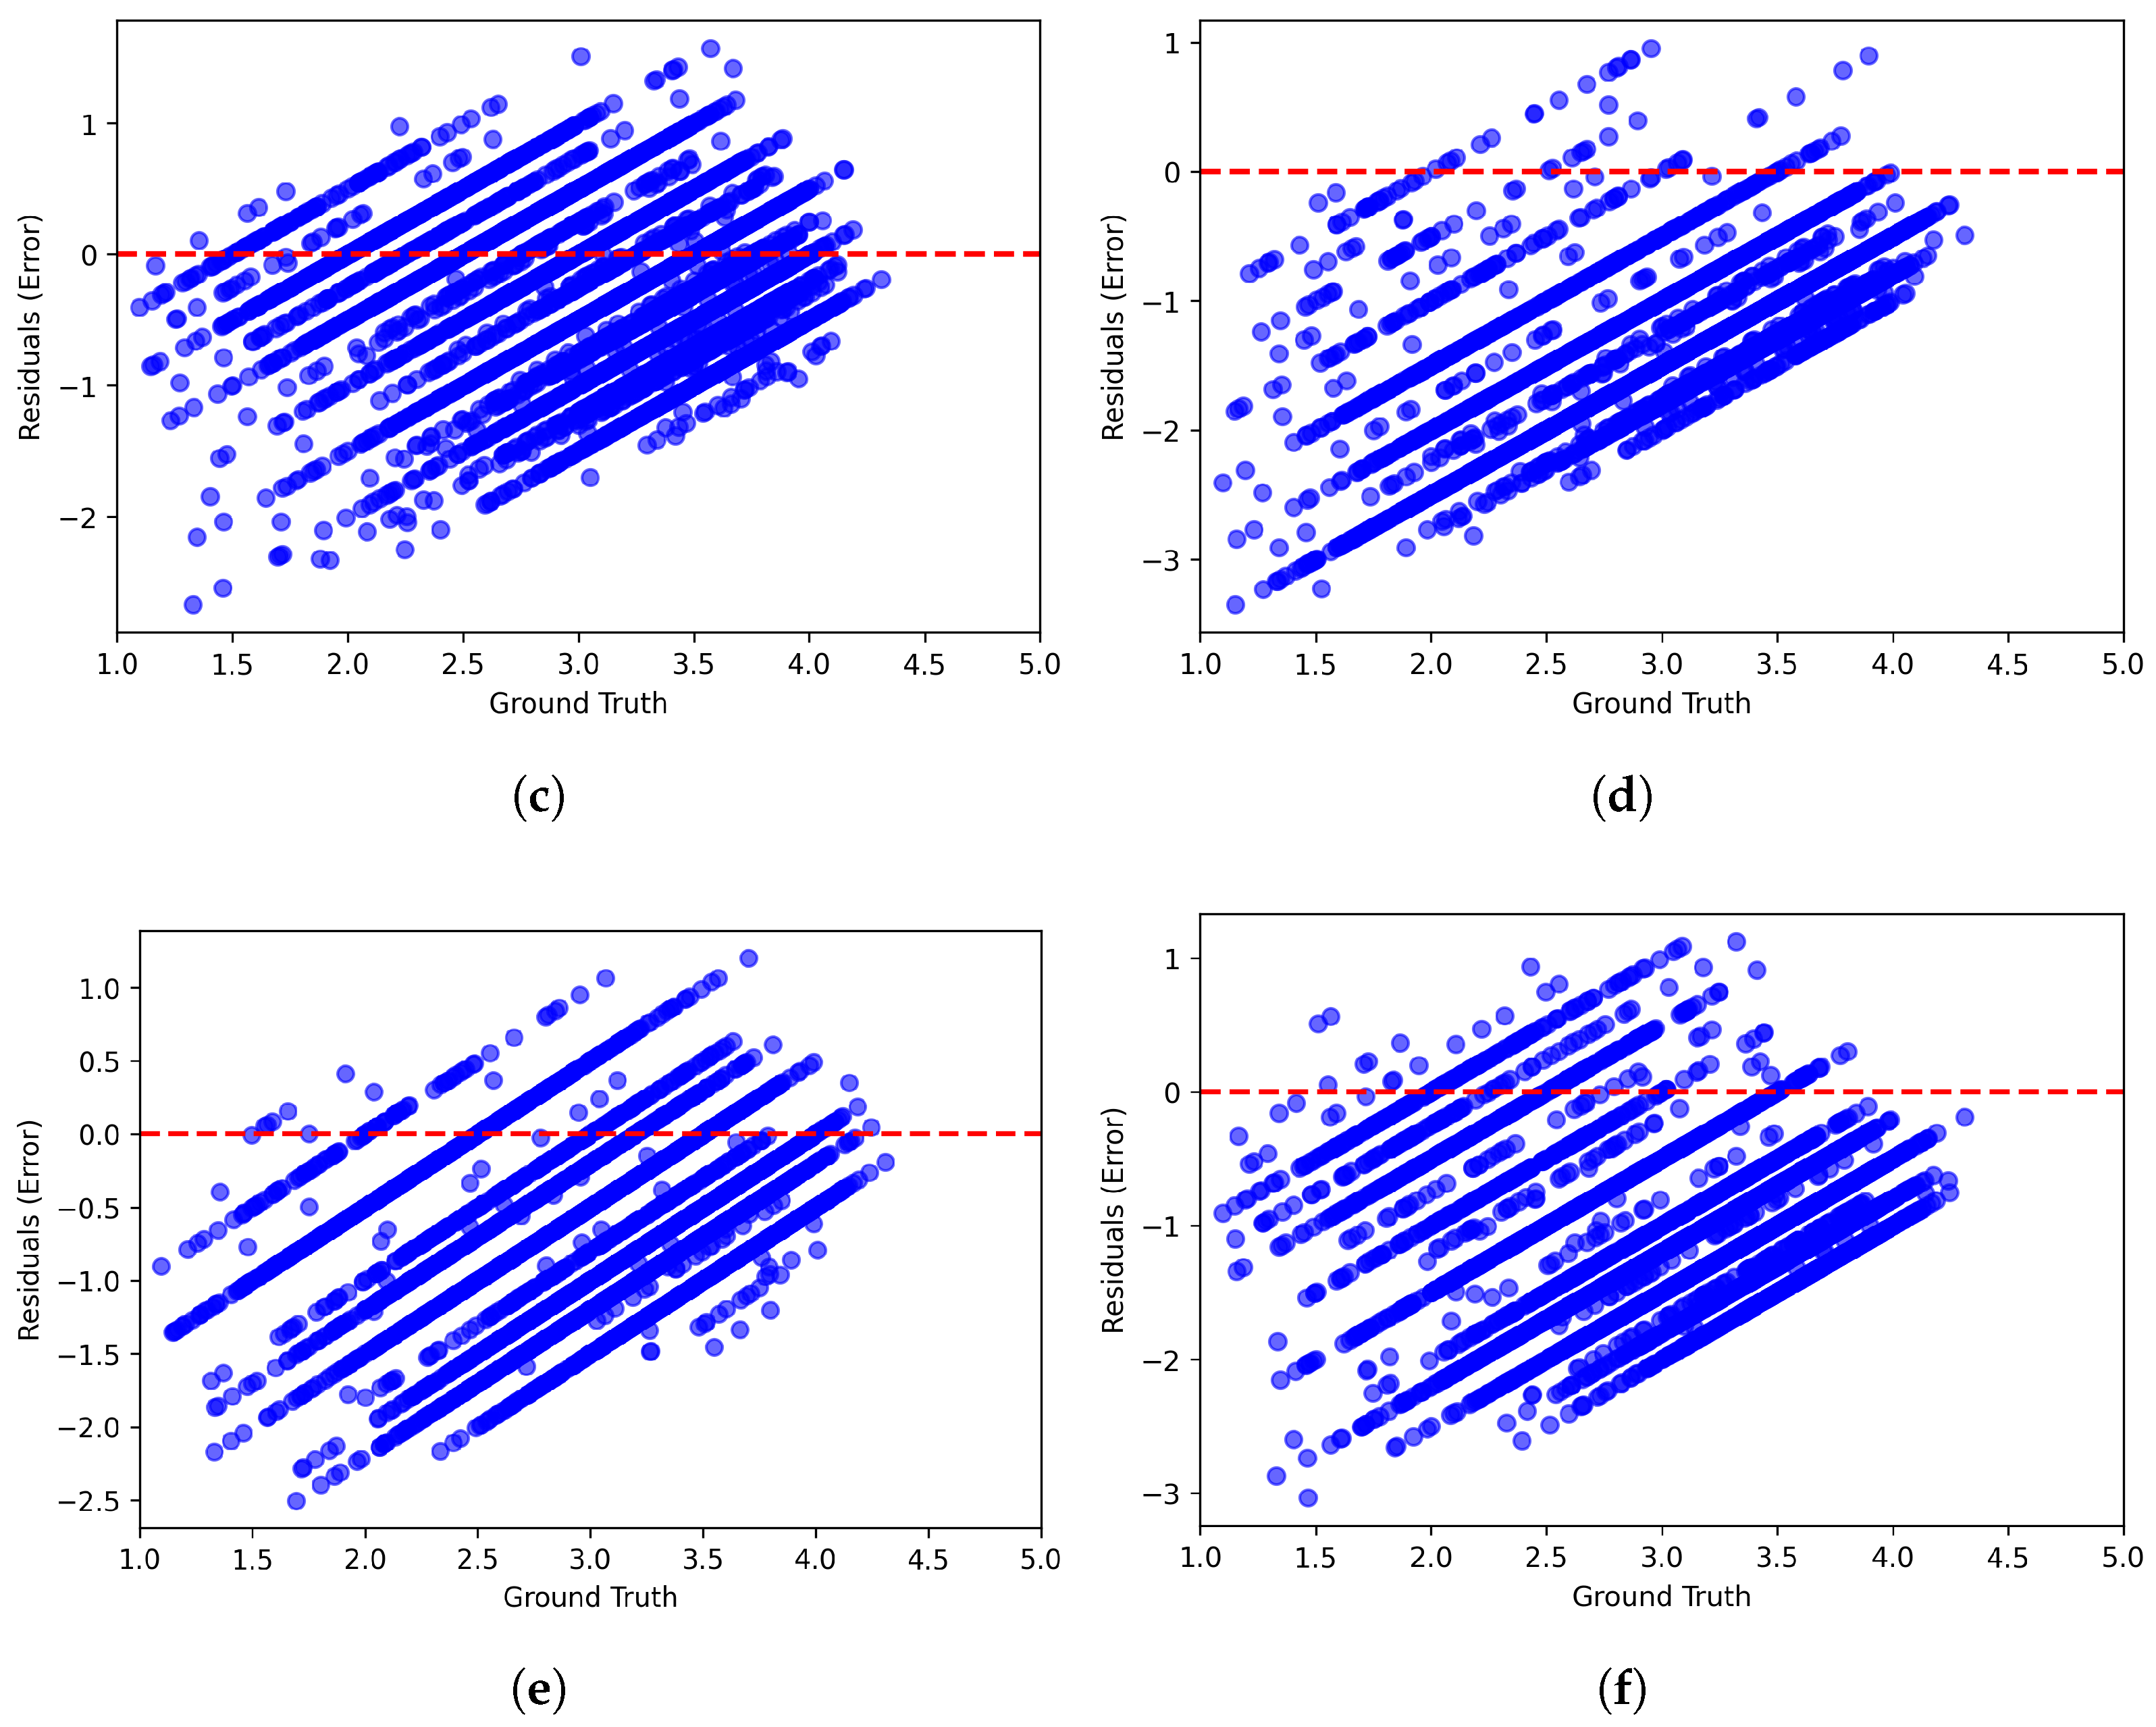
Figure 6 and Figure 7 present scatter plots comparing ground-truth image quality scores with predicted scores from the examined multimodal LLMs on the CLIVE and KonIQ-10k benchmark datasets, respectively. Models with better predictive performance should have points more closely aligned with the diagonal. Figure 8 and Figure 9 present histograms of quality ratings assigned by six multimodal LLMs on the CLIVE [34] and KonIQ-10k [1] benchmark datasets, respectively. Figure 10 and Figure 11 display residual plots for six multimodal LLMs on the CLIVE [34] and KonIQ-10k [1] benchmark databases, respectively. Most models exhibit a systematic pattern in their residuals, suggesting potential biases in their predictions. Specifically, Claude-3-Haiku-20240307 shows the most distinct pattern, with a strong negative slope, meaning it consistently overpredicts across most of the range, with this overprediction becoming more severe as ground-truth values increase. Claude-3-Sonnet-20240229 shows a less defined pattern with greater scatter but still tends toward overprediction, especially for higher ground-truth values. The other models show more balanced error distributions around the zero line but have similar patterns, with positive slope in residuals, suggesting they tend to underpredict high values and overpredict low values. All models show horizontal striping, suggesting the models may be quantizing their predictions to certain values or intervals. All models struggle more with extreme values (very low or very high ground truths).
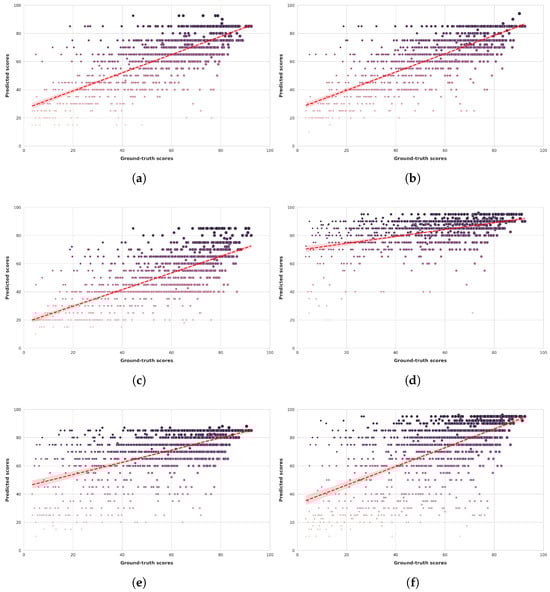
Figure 6.
Ground-truth quality scores vs. quality scores predicted by multimodal LLMs on the CLIVE [34] benchmark database. (a) ChatGPT-4o-Latest. (b) GPT-4o-2024-11-20. (c) GPT-4-Turbo-2024-04-09. (d) Claude-3-Haiku-20240307. (e) Claude-3-Opus-20240229. (f) Claude-3-Sonnet-20240229.
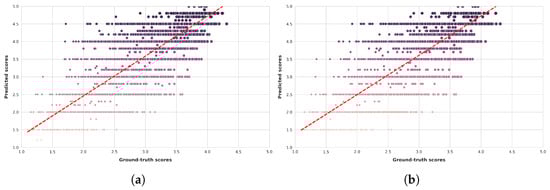
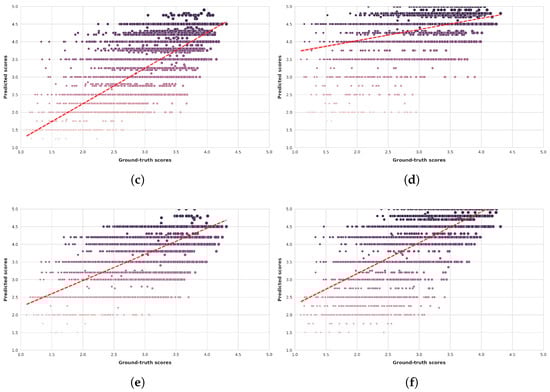
Figure 7.
Ground-truth quality scores vs. quality scores predicted by multimodal LLMs on the KonIQ-10k [1] benchmark database. (a) ChatGPT-4o-Latest. (b) GPT-4o-2024-11-20. (c) GPT-4-Turbo-2024-04-09. (d) Claude-3-Haiku-20240307. (e) Claude-3-Opus-20240229. (f) Claude-3-Sonnet-20240229.
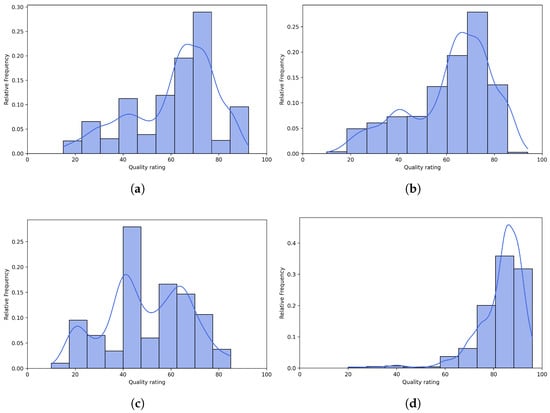

Figure 8.
Histograms of quality ratings provided by multimodal LLMs on the CLIVE [34] benchmark database. (a) ChatGPT-4o-Latest. (b) GPT-4o-2024-11-20. (c) GPT-4-Turbo-2024-04-09. (d) Claude-3-Haiku-20240307. (e) Claude-3-Opus-20240229. (f) Claude-3-Sonnet-20240229.
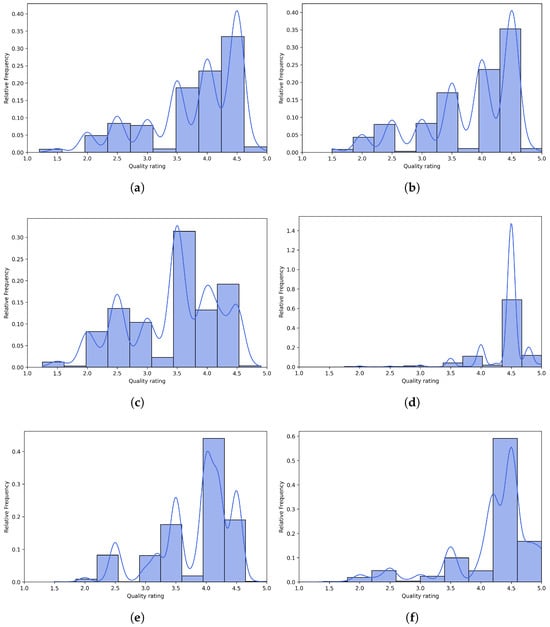
Figure 9.
Histograms of quality ratings provided by multimodal LLMs on the KonIQ-10k [1] benchmark database. (a) ChatGPT-4o-Latest. (b) GPT-4o-2024-11-20. (c) GPT-4-Turbo-2024-04-09. (d) Claude-3-Haiku-20240307. (e) Claude-3-Opus-20240229. (f) Claude-3-Sonnet-20240229.
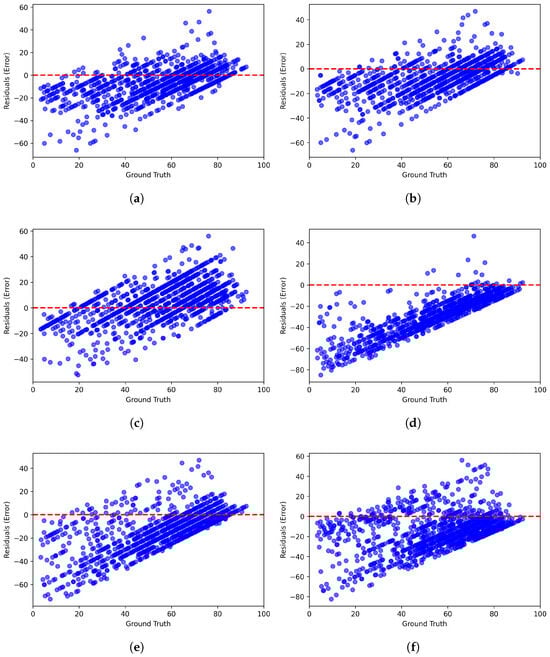
Figure 10.
Residual plots of multimodal LLMs on the CLIVE [34] benchmark database. (a) ChatGPT-4o-Latest. (b) GPT-4o-2024-11-20. (c) GPT-4-Turbo-2024-04-09. (d) Claude-3-Haiku-20240307. (e) Claude-3-Opus-20240229. (f) Claude-3-Sonnet-20240229.
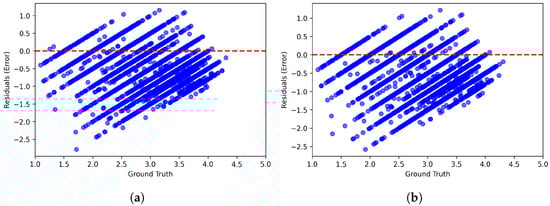
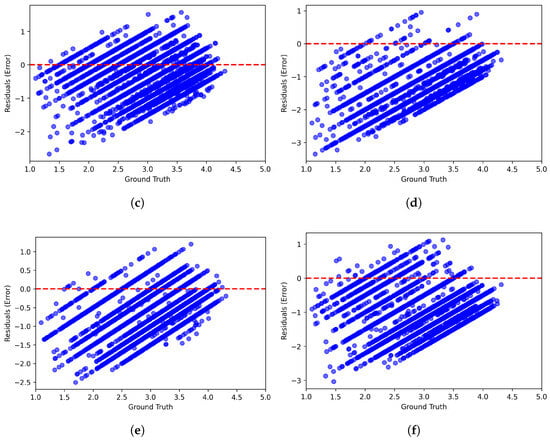
Figure 11.
Residual plots of multimodal LLMs on the KonIQ-10k [1] benchmark database. (a) ChatGPT-4o-Latest. (b) GPT-4o-2024-11-20. (c) GPT-4-Turbo-2024-04-09. (d) Claude-3-Haiku-20240307. (e) Claude-3-Opus-20240229. (f) Claude-3-Sonnet-20240229.
4.3. Comparison to the State-of-the-Art
Table 3 presents a comparative performance analysis of various NR-IQA methods based on hand-crafted features and various multimodal LLMs. As already mentioned, the performance of each method is quantified using three widely used correlation metrics: PLCC, SROCC, KROCC. These values were computed as the median over 100 random train–test splits in the case of NR-IQA algorithms based on hand-crafted features. To obtain the performance metrics, the original source codes published by the researchers were used in the test process. In contrast, multimodal LLMs were evaluated in a zero-shot setting by prompting each model once for the entire dataset without additional training or adaptation. The results indicate that multimodal LLMs—particularly OpenAI’s GPT-4o models—outperform traditional hand-crafted feature-based NR-IQA methods and achieve competitive performance compared to some deep learning-based approaches. Among the evaluated models, GPT-4o-2024-11-20 achieved the highest performance on both datasets, with PLCC, SROCC, and KROCC values of 0.775, 0.745, and 0.588 on CLIVE and 0.807, 0.765, and 0.618 on KonIQ-10k, respectively. The latest GPT-4o variant also performed well, securing the second-best results in most cases. In contrast, Claude-3 models exhibited significantly lower correlation scores, with Claude-3-Haiku achieving the weakest performance overall, while some Claude-3 models demonstrated moderate correlation with human judgments, they were consistently outperformed by OpenAI’s models across all metrics. Similar to Table 3, Table 4 also presents a comparison to state-of-the-art methods; however, instead of traditional approaches, it focuses on deep learning-based methods. The methods are categorized into three groups: (i) approaches reimplemented in PyTorch 2.7.0 and evaluated using 100 random train-test splits, (ii) results extracted from original publications (potentially using different train-test split ratios), and (iii) multimodal LLMs evaluated in a zero-shot setting. Among the examined methods, MAMIQA [91] achieved the highest PLCC (0.895) and SROCC (0.874) on CLIVE, and MAMIQA also demonstrated the best performance on KonIQ-10k, with a PLCC of 0.937 and an SROCC of 0.926. Multimodal LLMs, including ChatGPT-4o-Latest, GPT-4o-2024-11-20, and Claude-3 series, were also evaluated. Among these, ChatGPT-4o-Latest performed best, reaching a PLCC of 0.758 and an SROCC of 0.732 on CLIVE, and a PLCC of 0.805 and an SROCC of 0.760 on KonIQ-10k, while these results are lower compared to specialized deep learning models, they indicate the potential of multimodal LLMs in IQA tasks.
Table 3.
Comparison to traditional state-of-the-art methods on CLIVE [34] and KonIQ-10k [1] databases. Median PLCC, SROCC, KROCC values were obtained over 100 random train–test splits. Best values are in red, second-best values in green, and third-best values in blue.
Table 4.
Comparison to deep state-of-the-art methods on CLIVE [34] and KonIQ-10k [1] databases. Median PLCC, SROCC, KROCC values were obtained over 100 random train–test splits. Best values are in red, second-best values in green, and third-best values in blue. If the data are not available, it is denoted by ‘-’.
5. Discussion
The results of this study demonstrate that multimodal LLMs exhibit varying levels of effectiveness in performing NR-IQA. The best-performing models, ChatGPT-4o-Latest and GPT-4o-2024-11-20, achieved superior correlation with human-annotated ground-truth scores, surpassing all traditional NR-IQA methods. This suggests that state-of-the-art LLMs are capable of capturing complex visual distortions in a manner that aligns well with human perception. However, Anthropic’s Claude series (Claude-3-Haiku, Claude-3-Opus, and Claude-3-Sonnet) provided results comparable to those of traditional NR-IQA algorithms, indicating that not all LLMs are equally effective in visual quality assessment. This discrepancy highlights differences in multimodal architectures and training methodologies between models developed by OpenAI and Anthropic. Despite the strong performance of the best LLMs, modern deep learning-based NR-IQA models still outperformed them. This suggests that specialized deep learning models, which are explicitly trained for IQA tasks with large-scale image datasets, retain an advantage over general-purpose multimodal LLMs. The limitations of LLMs in IQA may stem from their training focus on textual and general visual understanding rather than fine-grained image quality assessment. Additionally, some LLMs occasionally refused to provide ratings, particularly citing privacy concerns. These refusals were more frequent in the GPT-4o series, particularly for the CLIVE dataset, suggesting that model safety mechanisms influence the applicability of LLMs in IQA tasks. This raises an important consideration: while LLMs are capable of performing IQA, their reliability may be impacted by built-in safety constraints that prevent them from evaluating certain images.
6. Conclusions
This study presented a systematic evaluation of multimodal LLMs in NR-IQA. The findings indicate that state-of-the-art LLMs, particularly ChatGPT-4o-Latest and GPT-4o-2024-11-20, outperform all traditional NR-IQA methods but remain inferior to modern deep learning-based approaches. The Claude series models perform at a level similar to traditional NR-IQA methods, highlighting the variance in multimodal capabilities across different architectures. While LLMs offer promising performance in image quality evaluation, their occasional refusal to assess certain images suggests that their deployment in real-world NR-IQA applications requires careful consideration. Future work could explore fine-tuning LLMs specifically for IQA tasks or integrating them with deep learning-based approaches to enhance their robustness and accuracy.
A promising direction for future work is to integrate LLMs with traditional deep learning-based NR-IQA models. For instance, CNN-based models excel at capturing low-level distortions and fine-grained spatial artifacts, whereas LLMs (especially multimodal ones) can provide high-level semantic reasoning and linguistic interpretation of image quality. Combining these modalities, e.g., by using the CNN features as inputs to an LLM or as auxiliary inputs alongside language prompts, could lead to systems that not only predict quality scores but also generate natural language explanations aligned with human perception. Such hybrid models may benefit from both data-driven visual priors and the generalization capabilities of LLMs trained on large-scale multimodal datasets.
In future work, we plan to further investigate the role of open-source multimodal models in no-reference image quality assessment, while open-source models such as LLaVA and BLIP-2 have shown promise in various tasks, their performance in this domain currently lags behind closed-source models like those from OpenAI and Claude.AI. As open-source models continue to evolve, we anticipate that improvements in their architecture and training data will enhance their performance, making them more viable for tasks like image quality assessment. A more extensive comparison between closed-source and open-source models, including a discussion on the implications for performance, reproducibility, and accessibility, will be an important direction for future research. This will help to clarify the trade-offs between model openness and the quality of results, paving the way for more accessible and reproducible solutions in the field.
Funding
This research received no external funding.
Institutional Review Board Statement
Not applicable.
Informed Consent Statement
Not applicable.
Data Availability Statement
The data used herein were obtained from the following public open-source datasets: 1. CLIVE: https://live.ece.utexas.edu/research/ChallengeDB/index.html (accessed on 25 February 2025); 2. KonIQ-10k: http://database.mmsp-kn.de/koniq-10k-database.html (accessed on 25 February 2025). The processed responses of the LLMs are available at: https://github.com/elektrische-schafen/llm-processed-responses (accessed on 7 May 2025).
Acknowledgments
I would like to express my sincere gratitude to my colleague Krisztián Varga for his invaluable assistance and expertise in GPU computing. His guidance and support have been instrumental in optimizing my computational workflows and accelerating the progress of this research project. I would also like to express my heartfelt gratitude to the entire team of Nokia Bell Labs, Budapest, for fostering an environment of collaboration, support, and positivity throughout the duration of this project. Finally, I wish to thank the anonymous reviewers and the academic editor for their careful reading of my manuscript and their many insightful comments and suggestions.
Conflicts of Interest
The author declares no conflicts of interest.
Abbreviations
The following abbreviations are used in this manuscript:
| BRISQUE | Blind/Referenceless Image Spatial Quality Evaluator |
| CLIP | Contrastive Language–Image Pre-training |
| CNN | convolutional neural network |
| DCT | discrete cosine transform |
| EMD | earth mover’s distance |
| GAN | generative adversarial network |
| GGD | generalized Gaussian distribution |
| IQA | image quality assessment |
| JPEG | Joint Photographic Experts Group |
| KADID | Konstanz artificially distorted image quality database |
| KROCC | Kendall’s rank order correlation coefficient |
| LBP | local binary patterns |
| LIVE | Laboratory for Image and Video Engineering |
| LLM | large language model |
| MOS | mean opinion score |
| MSCN | mean subtracted contrast normalized |
| NiN | network in network |
| NIQE | Naturalness Image Quality Evaluator |
| NLP | natural language processing |
| NR-IQA | no-reference image quality assessment |
| NSS | natural scene statistics |
| PLCC | Pearson’s linear correlation coefficient |
| SROCC | Spearman’s rank order correlation coefficient |
| SVR | support vector regressor |
| TID | Tampere Image Database |
| ViT | Vision Transformer |
| VQA | visual question answering |
| YFCC100M | Yahoo Flickr Creative Commons 100 Million |
References
- Lin, H.; Hosu, V.; Saupe, D. KonIQ-10K: Towards an ecologically valid and large-scale IQA database. arXiv 2018, arXiv:1803.08489. [Google Scholar]
- Götz-Hahn, F.; Hosu, V.; Lin, H.; Saupe, D. KonVid-150k: A dataset for no-reference video quality assessment of videos in-the-wild. IEEE Access 2021, 9, 72139–72160. [Google Scholar] [CrossRef]
- Yang, P.; Sturtz, J.; Qingge, L. Progress in blind image quality assessment: A brief review. Mathematics 2023, 11, 2766. [Google Scholar] [CrossRef]
- Oura, D.; Sato, S.; Honma, Y.; Kuwajima, S.; Sugimori, H. Quality assurance of chest X-ray images with a combination of deep learning methods. Appl. Sci. 2023, 13, 2067. [Google Scholar] [CrossRef]
- Nam, W.; Youn, T.; Ha, C. No-Reference Image Quality Assessment with Moving Spectrum and Laplacian Filter for Autonomous Driving Environment. Vehicles 2025, 7, 8. [Google Scholar] [CrossRef]
- Hao, Y.; Pei, H.; Lyu, Y.; Yuan, Z.; Rizzo, J.R.; Wang, Y.; Fang, Y. Understanding the impact of image quality and distance of objects to object detection performance. In Proceedings of the 2023 IEEE/RSJ International Conference on Intelligent Robots and Systems (IROS), Detroit, MI, USA, 1–5 October 2023; pp. 11436–11442. [Google Scholar]
- Dodge, S.; Karam, L. Understanding how image quality affects deep neural networks. In Proceedings of the 2016 Eighth International Conference on Quality of Multimedia Experience (QoMEX), Lisbon, Portugal, 6–8 June 2016; pp. 1–6. [Google Scholar]
- Pednekar, G.V.; Udupa, J.K.; McLaughlin, D.J.; Wu, X.; Tong, Y.; Simone, C.B.; Camaratta, J.; Torigian, D.A. Image quality and segmentation. Proc. SPIE Int. Soc. Opt. Eng. 2018, 10576, 105762N. [Google Scholar]
- Chiasserini, C.F.; Magli, E. Energy consumption and image quality in wireless video-surveillance networks. In Proceedings of the 13th IEEE International Symposium on Personal, Indoor and Mobile Radio Communications, Lisboa, Portugal, 15–18 September 2002; Volume 5, pp. 2357–2361. [Google Scholar]
- Winkler, S.; Campos, R. Video quality evaluation for Internet streaming applications. In Proceedings of the Human Vision and Electronic Imaging VIII, Santa Clara, CA, USA, 20 January 2003; Volume 5007, pp. 104–115. [Google Scholar]
- Li, J.; Zhang, X.; Ge, J.; Bai, C.; Feng, G.; Mu, H.; Wang, L.; Liu, C.; Kang, Z.; Jiang, X. Astronomical Image Quality Assessment Based on Deep Learning for Resource-constrained Environments. Publ. Astron. Soc. Pac. 2025, 137, 034502. [Google Scholar] [CrossRef]
- Babic, M.; Farahani, M.A.; Wuest, T. Image based quality inspection in smart manufacturing systems: A literature review. Procedia CIRP 2021, 103, 262–267. [Google Scholar] [CrossRef]
- Li, S.; Yang, Z.; Li, H. Statistical evaluation of no-reference image quality assessment metrics for remote sensing images. ISPRS Int. J. Geo-Inf. 2017, 6, 133. [Google Scholar] [CrossRef]
- Chowdhery, A.; Narang, S.; Devlin, J.; Bosma, M.; Mishra, G.; Roberts, A.; Barham, P.; Chung, H.W.; Sutton, C.; Gehrmann, S.; et al. Palm: Scaling language modeling with pathways. J. Mach. Learn. Res. 2023, 24, 1–113. [Google Scholar]
- Schuhmann, C.; Beaumont, R.; Vencu, R.; Gordon, C.; Wightman, R.; Cherti, M.; Coombes, T.; Katta, A.; Mullis, C.; Wortsman, M.; et al. Laion-5b: An open large-scale dataset for training next generation image-text models. Adv. Neural Inf. Process. Syst. 2022, 35, 25278–25294. [Google Scholar]
- Chen, X.; Wang, X.; Changpinyo, S.; Piergiovanni, A.; Padlewski, P.; Salz, D.; Goodman, S.; Grycner, A.; Mustafa, B.; Beyer, L.; et al. Pali: A jointly-scaled multilingual language-image model. arXiv 2022, arXiv:2209.06794. [Google Scholar]
- Sharma, P.; Ding, N.; Goodman, S.; Soricut, R. Conceptual captions: A cleaned, hypernymed, image alt-text dataset for automatic image captioning. In Proceedings of the 56th Annual Meeting of the Association for Computational Linguistics (Volume 1: Long Papers), Melbourne, Australia, 15–20 July 2018; pp. 2556–2565. [Google Scholar]
- Mittal, A.; Moorthy, A.K.; Bovik, A.C. No-reference image quality assessment in the spatial domain. IEEE Trans. Image Process. 2012, 21, 4695–4708. [Google Scholar] [CrossRef] [PubMed]
- Galdran, A.; Araújo, T.; Mendonça, A.M.; Campilho, A. Retinal image quality assessment by mean-subtracted contrast-normalized coefficients. In Proceedings of the VipIMAGE 2017: Proceedings of the VI ECCOMAS Thematic Conference on Computational Vision and Medical Image Processing, Porto, Portugal, 18–20 October 2017; Springer: Berlin/Heidelberg, Germany, 2018; pp. 844–853. [Google Scholar]
- Mittal, A.; Soundararajan, R.; Bovik, A.C. Making a “completely blind” image quality analyzer. IEEE Signal Process. Lett. 2012, 20, 209–212. [Google Scholar] [CrossRef]
- Talebi, H.; Milanfar, P. NIMA: Neural image assessment. IEEE Trans. Image Process. 2018, 27, 3998–4011. [Google Scholar] [CrossRef] [PubMed]
- Murray, N.; Marchesotti, L.; Perronnin, F. AVA: A large-scale database for aesthetic visual analysis. In Proceedings of the 2012 IEEE Conference on Computer Vision and Pattern Recognition, Providence, RI, USA, 16–21 June 2012; pp. 2408–2415. [Google Scholar]
- Levina, E.; Bickel, P. The earth mover’s distance is the mallows distance: Some insights from statistics. In Proceedings of the Eighth IEEE International Conference on Computer Vision, Vancouver, BC, Canada, 7–14 July 2001; Volume 2, pp. 251–256. [Google Scholar]
- Ke, J.; Wang, Q.; Wang, Y.; Milanfar, P.; Yang, F. Musiq: Multi-scale image quality transformer. In Proceedings of the IEEE/CVF International Conference on Computer Vision, Virtual Event, 11–17 October 2021; pp. 5148–5157. [Google Scholar]
- Su, S.; Yan, Q.; Zhu, Y.; Zhang, C.; Ge, X.; Sun, J.; Zhang, Y. Blindly assess image quality in the wild guided by a self-adaptive hyper network. In Proceedings of the IEEE/CVF Conference on Computer Vision and Pattern Recognition, Seattle, WA, USA, 14–19 June 2020; pp. 3667–3676. [Google Scholar]
- Sheikh, H.R.; Sabir, M.F.; Bovik, A.C. A statistical evaluation of recent full reference image quality assessment algorithms. IEEE Trans. Image Process. 2006, 15, 3440–3451. [Google Scholar] [CrossRef]
- Ponomarenko, N.; Ieremeiev, O.; Lukin, V.; Jin, L.; Egiazarian, K.; Astola, J.; Vozel, B.; Chehdi, K.; Carli, M.; Battisti, F.; et al. A new color image database TID2013: Innovations and results. In Proceedings of the Advanced Concepts for Intelligent Vision Systems: 15th International Conference, ACIVS 2013, Poznań, Poland, 28–31 October 2013; Springer: Berlin/Heidelberg, Germany, 2013; pp. 402–413. [Google Scholar]
- Lin, H.; Hosu, V.; Saupe, D. KADID-10k: A large-scale artificially distorted IQA database. In Proceedings of the 2019 Eleventh International Conference on Quality of Multimedia Experience (QoMEX), Berlin, Germany, 5–7 June 2019; pp. 1–3. [Google Scholar]
- Men, H.; Lin, H.; Saupe, D. Empirical evaluation of no-reference VQA methods on a natural video quality database. In Proceedings of the 2017 Ninth International Conference on Quality of Multimedia Experience (QoMEX), Erfurt, Germany, 31 May–2 June 2017; pp. 1–3. [Google Scholar]
- Men, H.; Lin, H.; Jenadeleh, M.; Saupe, D. Subjective image quality assessment with boosted triplet comparisons. IEEE Access 2021, 9, 138939–138975. [Google Scholar] [CrossRef]
- Lin, H.; Men, H.; Yan, Y.; Ren, J.; Saupe, D. Crowdsourced quality assessment of enhanced underwater images—A pilot study. In Proceedings of the 2022 14th International Conference on Quality of Multimedia Experience (QoMEX), Lippstadt, Germany, 5–7 September 2022; pp. 1–4. [Google Scholar]
- Su, S.; Lin, H.; Hosu, V.; Wiedemann, O.; Sun, J.; Zhu, Y.; Liu, H.; Zhang, Y.; Saupe, D. Going the extra mile in face image quality assessment: A novel database and model. IEEE Trans. Multimed. 2023, 26, 2671–2685. [Google Scholar] [CrossRef]
- Yang, H.; Fang, Y.; Lin, W. Perceptual quality assessment of screen content images. IEEE Trans. Image Process. 2015, 24, 4408–4421. [Google Scholar] [CrossRef]
- Ghadiyaram, D.; Bovik, A.C. Massive online crowdsourced study of subjective and objective picture quality. IEEE Trans. Image Process. 2015, 25, 372–387. [Google Scholar] [CrossRef]
- Xin, L.; Yuting, K.; Tao, S. Investigation of the Relationship between Speed and Image Quality of Autonomous Vehicles. J. Min. Sci. 2021, 57, 264–273. [Google Scholar] [CrossRef]
- Xia, W.; Yang, Y.; Xue, J.H.; Xiao, J. Domain fingerprints for no-reference image quality assessment. IEEE Trans. Circuits Syst. Video Technol. 2020, 31, 1332–1341. [Google Scholar] [CrossRef]
- Zeng, Z.; Yang, W.; Sun, W.; Xue, J.H.; Liao, Q. No-reference image quality assessment for photographic images based on robust statistics. Neurocomputing 2018, 313, 111–118. [Google Scholar] [CrossRef]
- Li, J.; Qiao, S.; Zhao, C.; Zhang, T. No-reference image quality assessment based on multiscale feature representation. IET Image Process. 2021, 15, 3318–3331. [Google Scholar] [CrossRef]
- Stansbury, D.E.; Naselaris, T.; Gallant, J.L. Natural scene statistics account for the representation of scene categories in human visual cortex. Neuron 2013, 79, 1025–1034. [Google Scholar] [CrossRef]
- Zhu, K.; Asari, V.; Saupe, D. No-reference quality assessment of H. 264/AVC encoded video based on natural scene features. In Proceedings of the Mobile Multimedia/Image Processing, Security, and Applications 2013, Baltimore, MD, USA, 29 April–1 May 2013; Volume 8755, pp. 25–35. [Google Scholar]
- Sheikh, H.R.; Bovik, A.C.; Cormack, L. Blind quality assessment of JPEG2000 compressed images using natural scene statistics. In Proceedings of the Thrity-Seventh Asilomar Conference on Signals, Systems & Computers, Pacific Grove, CA, USA, 9–12 November 2003; Volume 2, pp. 1403–1407. [Google Scholar]
- Moorthy, A.K.; Bovik, A.C. A two-step framework for constructing blind image quality indices. IEEE Signal Process. Lett. 2010, 17, 513–516. [Google Scholar] [CrossRef]
- Daubechies, I. Ten Lectures on Wavelets; Society for Industrial and Applied Mathematics: Philadelphia, PA, USA, 1992. [Google Scholar]
- Awad, M.; Khanna, R.; Awad, M.; Khanna, R. Support vector regression. In Efficient Learning Machines: Theories, Concepts, and Applications for Engineers and System Designers; Springer: Berlin/Heidelberg, Germany, 2015; pp. 67–80. [Google Scholar]
- Moorthy, A.K.; Bovik, A.C. Blind image quality assessment: From natural scene statistics to perceptual quality. IEEE Trans. Image Process. 2011, 20, 3350–3364. [Google Scholar] [CrossRef]
- Wainwright, M.J.; Simoncelli, E. Scale mixtures of Gaussians and the statistics of natural images. Adv. Neural Inf. Process. Syst. 1999, 12, 855–861. [Google Scholar]
- Saad, M.A.; Bovik, A.C. Blind quality assessment of videos using a model of natural scene statistics and motion coherency. In Proceedings of the 2012 Conference Record of the Forty Sixth Asiloma Pacific, Grove, CA, USA, 4–7 November 2012; pp. 332–336. [Google Scholar]
- Saad, M.A.; Bovik, A.C.; Charrier, C. A DCT statistics-based blind image quality index. IEEE Signal Process. Lett. 2010, 17, 583–586. [Google Scholar] [CrossRef]
- Gabarda, S.; Cristóbal, G. Blind image quality assessment through anisotropy. J. Opt. Soc. Am. A 2007, 24, B42–B51. [Google Scholar] [CrossRef]
- Lasmar, N.E.; Stitou, Y.; Berthoumieu, Y. Multiscale skewed heavy tailed model for texture analysis. In Proceedings of the 2009 16th IEEE International Conference on Image Processing (ICIP), Cairo, Egypt, 7–10 November 2009; pp. 2281–2284. [Google Scholar]
- Ruderman, D.L.; Bialek, W. Statistics of natural images: Scaling in the woods. Phys. Rev. Lett. 1994, 73, 814. [Google Scholar] [CrossRef] [PubMed]
- Humeau-Heurtier, A. Texture feature extraction methods: A survey. IEEE Access 2019, 7, 8975–9000. [Google Scholar] [CrossRef]
- Xue, W.; Mou, X.; Zhang, L.; Bovik, A.C.; Feng, X. Blind image quality assessment using joint statistics of gradient magnitude and Laplacian features. IEEE Trans. Image Process. 2014, 23, 4850–4862. [Google Scholar] [CrossRef]
- Rahim, M.A.; Hossain, M.N.; Wahid, T.; Azam, M.S. Face recognition using local binary patterns (LBP). Glob. J. Comput. Sci. Technol. 2013, 13, 1–8. [Google Scholar]
- Song, K.-C.; Yan, Y.-H.; Chen, W.-H.; Zhang, X. Research and perspective on local binary pattern. Acta Autom. Sin. 2013, 39, 730–744. [Google Scholar] [CrossRef]
- Garcia Freitas, P.; Da Eira, L.P.; Santos, S.S.; Farias, M.C.Q.d. On the application LBP texture descriptors and its variants for no-reference image quality assessment. J. Imaging 2018, 4, 114. [Google Scholar] [CrossRef]
- Li, Q.; Lin, W.; Xu, J.; Fang, Y. Blind image quality assessment using statistical structural and luminance features. IEEE Trans. Multimed. 2016, 18, 2457–2469. [Google Scholar] [CrossRef]
- Rajevenceltha, J.; Gaidhane, V.H. An efficient approach for no-reference image quality assessment based on statistical texture and structural features. Eng. Sci. Technol. Int. J. 2022, 30, 101039. [Google Scholar] [CrossRef]
- Bosse, S.; Maniry, D.; Müller, K.R.; Wiegand, T.; Samek, W. Deep neural networks for no-reference and full-reference image quality assessment. IEEE Trans. Image Process. 2017, 27, 206–219. [Google Scholar] [CrossRef]
- Ma, Y.; Cai, X.; Sun, F.; Hao, S. No-reference image quality assessment based on multi-task generative adversarial network. IEEE Access 2019, 7, 146893–146902. [Google Scholar] [CrossRef]
- Kang, L.; Ye, P.; Li, Y.; Doermann, D. Convolutional neural networks for no-reference image quality assessment. In Proceedings of the IEEE Conference on Computer Vision and Pattern Recognition, Columbus, OH, USA, 23–28 June 2014; pp. 1733–1740. [Google Scholar]
- Bare, B.; Li, K.; Yan, B. An accurate deep convolutional neural networks model for no-reference image quality assessment. In Proceedings of the 2017 IEEE International Conference on Multimedia and Expo (ICME), Hong Kong, China, 10–14 July 2017; pp. 1356–1361. [Google Scholar]
- Zhang, L.; Zhang, L.; Mou, X.; Zhang, D. FSIM: A feature similarity index for image quality assessment. IEEE Trans. Image Process. 2011, 20, 2378–2386. [Google Scholar] [CrossRef] [PubMed]
- Li, Y.; Po, L.M.; Feng, L.; Yuan, F. No-reference image quality assessment with deep convolutional neural networks. In Proceedings of the 2016 IEEE International Conference on Digital Signal Processing (DSP), Beijing, China, 16–18 October 2016; pp. 685–689. [Google Scholar]
- Krizhevsky, A.; Sutskever, I.; Hinton, G.E. ImageNet classification with deep convolutional neural networks. Commun. ACM 2017, 60, 84–90. [Google Scholar] [CrossRef]
- Lin, M. Network in network. arXiv 2013, arXiv:1312.4400. [Google Scholar]
- Bianco, S.; Celona, L.; Napoletano, P.; Schettini, R. On the use of deep learning for blind image quality assessment. Signal Image Video Process. 2018, 12, 355–362. [Google Scholar] [CrossRef]
- Zhang, R.; Isola, P.; Efros, A.A.; Shechtman, E.; Wang, O. The unreasonable effectiveness of deep features as a perceptual metric. In Proceedings of the IEEE Conference on Computer Vision and Pattern Recognition, Salt Lake City, UT, USA, 18–22 June 2018; pp. 586–595. [Google Scholar]
- Ryu, J. Improved image quality assessment by utilizing pre-trained architecture features with unified learning mechanism. Appl. Sci. 2023, 13, 2682. [Google Scholar] [CrossRef]
- Gao, F.; Yu, J.; Zhu, S.; Huang, Q.; Tian, Q. Blind image quality prediction by exploiting multi-level deep representations. Pattern Recognit. 2018, 81, 432–442. [Google Scholar] [CrossRef]
- Dosovitskiy, A.; Beyer, L.; Kolesnikov, A.; Weissenborn, D.; Zhai, X.; Unterthiner, T.; Dehghani, M.; Minderer, M.; Heigold, G.; Gelly, S.; et al. An image is worth 16 × 16 words: Transformers for image recognition at scale. arXiv 2020, arXiv:2010.11929. [Google Scholar]
- Shaw, P.; Uszkoreit, J.; Vaswani, A. Self-attention with relative position representations. arXiv 2018, arXiv:1803.02155. [Google Scholar]
- Keshari, A.; Subudhi, B. Multi-scale features and parallel transformers based image quality assessment. arXiv 2022, arXiv:2204.09779. [Google Scholar]
- Yang, S.; Wu, T.; Shi, S.; Lao, S.; Gong, Y.; Cao, M.; Wang, J.; Yang, Y. Maniqa: Multi-dimension attention network for no-reference image quality assessment. In Proceedings of the IEEE/CVF Conference on Computer Vision and Pattern Recognition, New Orleans, LA, USA, 18–24 June 2022; pp. 1191–1200. [Google Scholar]
- Wang, J.; Chan, K.C.; Loy, C.C. Exploring clip for assessing the look and feel of images. In Proceedings of the AAAI Conference on Artificial Intelligence, Washington, DC, USA, 7–14 February 2023; Volume 37, pp. 2555–2563. [Google Scholar]
- Radford, A.; Kim, J.W.; Hallacy, C.; Ramesh, A.; Goh, G.; Agarwal, S.; Sastry, G.; Askell, A.; Mishkin, P.; Clark, J.; et al. Learning transferable visual models from natural language supervision. In Proceedings of the International Conference on Machine Learning, Virtual, 18–24 July 2021; pp. 8748–8763. [Google Scholar]
- Manap, R.A.; Shao, L. Non-distortion-specific no-reference image quality assessment: A survey. Inf. Sci. 2015, 301, 141–160. [Google Scholar] [CrossRef]
- Xu, S.; Jiang, S.; Min, W. No-reference/blind image quality assessment: A survey. IETE Tech. Rev. 2017, 34, 223–245. [Google Scholar] [CrossRef]
- Zhai, G.; Min, X. Perceptual image quality assessment: A survey. Sci. China Inf. Sci. 2020, 63, 1–52. [Google Scholar] [CrossRef]
- Yang, X.; Li, F.; Liu, H. A survey of DNN methods for blind image quality assessment. IEEE Access 2019, 7, 123788–123806. [Google Scholar] [CrossRef]
- Xu, L.; Lin, W.; Kuo, C.C.J. Visual Quality Assessment by Machine Learning; Springer: Berlin/Heidelberg, Germany, 2015. [Google Scholar]
- Jenadeleh, M. Blind Image and Video Quality Assessment. Ph.D. Dissertation, Universität Konstanz, Baden-Württemberg, Germany, 2018. [Google Scholar]
- Men, H. Boosting for Visual Quality Assessment with Applications for Frame Interpolation Methods. Ph.D. Dissertation, Universität Konstanz, Baden-Württemberg, Germany, 2022. [Google Scholar]
- Thomee, B.; Shamma, D.A.; Friedland, G.; Elizalde, B.; Ni, K.; Poland, D.; Borth, D.; Li, L.J. Yfcc100m: The new data in multimedia research. Commun. ACM 2016, 59, 64–73. [Google Scholar] [CrossRef]
- Saupe, D.; Hahn, F.; Hosu, V.; Zingman, I.; Rana, M.; Li, S. Crowd workers proven useful: A comparative study of subjective video quality assessment. In Proceedings of the QoMEX 2016: 8th International Conference on Quality of Multimedia Experience, Lisbon, Portugal, 6–8 June 2016. [Google Scholar]
- Shahriar, S.; Lund, B.D.; Mannuru, N.R.; Arshad, M.A.; Hayawi, K.; Bevara, R.V.K.; Mannuru, A.; Batool, L. Putting gpt-4o to the sword: A comprehensive evaluation of language, vision, speech, and multimodal proficiency. Appl. Sci. 2024, 14, 7782. [Google Scholar] [CrossRef]
- Islam, R.; Moushi, O.M. Gpt-4o: The cutting-edge advancement in multimodal llm. Authorea Prepr. 2024. [Google Scholar] [CrossRef]
- Priyanshu, A.; Maurya, Y.; Hong, Z. AI Governance and Accountability: An Analysis of Anthropic’s Claude. arXiv 2024, arXiv:2407.01557. [Google Scholar]
- Zhao, F.F.; He, H.J.; Liang, J.J.; Cen, J.; Wang, Y.; Lin, H.; Chen, F.; Li, T.P.; Yang, J.F.; Chen, L.; et al. Benchmarking the performance of large language models in uveitis: A comparative analysis of ChatGPT-3.5, ChatGPT-4.0, Google Gemini, and Anthropic Claude3. Eye 2024, 39, 1132–1137. [Google Scholar] [CrossRef]
- Liu, H.; Li, C.; Wu, Q.; Lee, Y.J. Visual instruction tuning. Adv. Neural Inf. Process. Syst. 2023, 36, 34892–34916. [Google Scholar]
- Yu, L.; Li, J.; Pakdaman, F.; Ling, M.; Gabbouj, M. MAMIQA: No-Reference Image Quality Assessment Based on Multiscale Attention Mechanism With Natural Scene Statistics. IEEE Signal Process. Lett. 2023, 30, 588–592. [Google Scholar] [CrossRef]
- Min, X.; Zhai, G.; Gu, K.; Liu, Y.; Yang, X. Blind image quality estimation via distortion aggravation. IEEE Trans. Broadcast. 2018, 64, 508–517. [Google Scholar] [CrossRef]
- Liu, L.; Dong, H.; Huang, H.; Bovik, A.C. No-reference image quality assessment in curvelet domain. Signal Process. Image Commun. 2014, 29, 494–505. [Google Scholar] [CrossRef]
- Chen, X.; Zhang, Q.; Lin, M.; Yang, G.; He, C. No-reference color image quality assessment: From entropy to perceptual quality. EURASIP J. Image Video Process. 2019, 2019, 77. [Google Scholar] [CrossRef]
- Li, Q.; Lin, W.; Fang, Y. No-reference quality assessment for multiply-distorted images in gradient domain. IEEE Signal Process. Lett. 2016, 23, 541–545. [Google Scholar] [CrossRef]
- Zhang, L.; Zhang, L.; Bovik, A.C. A feature-enriched completely blind image quality evaluator. IEEE Trans. Image Process. 2015, 24, 2579–2591. [Google Scholar] [CrossRef]
- Ou, F.Z.; Wang, Y.G.; Zhu, G. A novel blind image quality assessment method based on refined natural scene statistics. In Proceedings of the 2019 IEEE International Conference on Image Processing (ICIP), Taipei, Taiwan, 22–25 September 2019; pp. 1004–1008. [Google Scholar]
- Venkatanath, N.; Praneeth, D.; Bh, M.C.; Channappayya, S.S.; Medasani, S.S. Blind image quality evaluation using perception based features. In Proceedings of the 2015 Twenty First National Conference on Communications (NCC), Mumbai, India, 27 February–1 March 2015; pp. 1–6. [Google Scholar]
- Liu, L.; Hua, Y.; Zhao, Q.; Huang, H.; Bovik, A.C. Blind image quality assessment by relative gradient statistics and adaboosting neural network. Signal Process. Image Commun. 2016, 40, 1–15. [Google Scholar] [CrossRef]
- Mittal, A.; Moorthy, A.K.; Bovik, A.C. Making image quality assessment robust. In Proceedings of the 2012 Conference Record of the Forty Sixth Asilomar Conference on Signals, Systems and Computers (ASILOMAR), Pacific Grove, CA, USA, 4–7 November 2012; pp. 1718–1722. [Google Scholar]
- Liu, L.; Liu, B.; Huang, H.; Bovik, A.C. No-reference image quality assessment based on spatial and spectral entropies. Signal Process. Image Commun. 2014, 29, 856–863. [Google Scholar] [CrossRef]
- Zhang, W.; Ma, K.; Zhai, G.; Yang, X. Uncertainty-aware blind image quality assessment in the laboratory and wild. IEEE Trans. Image Process. 2021, 30, 3474–3486. [Google Scholar] [CrossRef]
- Madhusudana, P.C.; Birkbeck, N.; Wang, Y.; Adsumilli, B.; Bovik, A.C. Image Quality Assessment using Contrastive Learning. arXiv 2021, arXiv:2110.13266. [Google Scholar] [CrossRef]
- Zhang, W.; Ma, K.; Yan, J.; Deng, D.; Wang, Z. Blind image quality assessment using a deep bilinear convolutional neural network. IEEE Trans. Circuits Syst. Video Technol. 2018, 30, 36–47. [Google Scholar] [CrossRef]
- Lin, H.; Hosu, V.; Saupe, D. DeepFL-IQA: Weak supervision for deep IQA feature learning. arXiv 2020, arXiv:2001.08113. [Google Scholar]
- Hosu, V.; Lin, H.; Sziranyi, T.; Saupe, D. KonIQ-10k: An ecologically valid database for deep learning of blind image quality assessment. IEEE Trans. Image Process. 2020, 29, 4041–4056. [Google Scholar] [CrossRef] [PubMed]
- Su, S.; Hosu, V.; Lin, H.; Zhang, Y.; Saupe, D. KonIQ++: Boosting No-Reference Image Quality Assessment in the Wild by Jointly Predicting Image Quality and Defects. In Proceedings of the 32nd British Machine Vision Conference, Virtual, 22–25 November 2021. [Google Scholar]
- Hosu, V.; Goldlucke, B.; Saupe, D. Effective aesthetics prediction with multi-level spatially pooled features. In Proceedings of the IEEE/CVF Conference on Computer Vision and Pattern Recognition, Long Beach, CA, USA, 15–20 June 2019; pp. 9375–9383. [Google Scholar]
- Ying, Z.; Niu, H.; Gupta, P.; Mahajan, D.; Ghadiyaram, D.; Bovik, A. From patches to pictures (PaQ-2-PiQ): Mapping the perceptual space of picture quality. In Proceedings of the IEEE/CVF Conference on Computer Vision and Pattern Recognition, Seattle, WA, USA, 14–19 June 2020; pp. 3575–3585. [Google Scholar]
- Zeng, H.; Zhang, L.; Bovik, A.C. A probabilistic quality representation approach to deep blind image quality prediction. arXiv 2017, arXiv:1708.08190. [Google Scholar]
- Pan, Z.; Yuan, F.; Lei, J.; Fang, Y.; Shao, X.; Kwong, S. VCRNet: Visual compensation restoration network for no-reference image quality assessment. IEEE Trans. Image Process. 2022, 31, 1613–1627. [Google Scholar] [CrossRef]
- Su, Y.; Korhonen, J. Blind Natural Image Quality Prediction Using Convolutional Neural Networks And Weighted Spatial Pooling. In Proceedings of the 2020 IEEE International Conference on Image Processing (ICIP), Abu Dhabi, United Arab Emirates, 25–28 October 2020; pp. 191–195. [Google Scholar]
- Miyata, T. ZEN-IQA: Zero-Shot Explainable and No-Reference Image Quality Assessment With Vision Language Model. IEEE Access 2024, 12, 70973–70983. [Google Scholar] [CrossRef]


Disclaimer/Publisher’s Note: The statements, opinions and data contained in all publications are solely those of the individual author(s) and contributor(s) and not of MDPI and/or the editor(s). MDPI and/or the editor(s) disclaim responsibility for any injury to people or property resulting from any ideas, methods, instructions or products referred to in the content. |
© 2025 by the author. Licensee MDPI, Basel, Switzerland. This article is an open access article distributed under the terms and conditions of the Creative Commons Attribution (CC BY) license (https://creativecommons.org/licenses/by/4.0/).