
Rail Surface Defect Diagnosis Based on Image–Vibration Multimodal Data Fusion


Abstract
1. Introduction
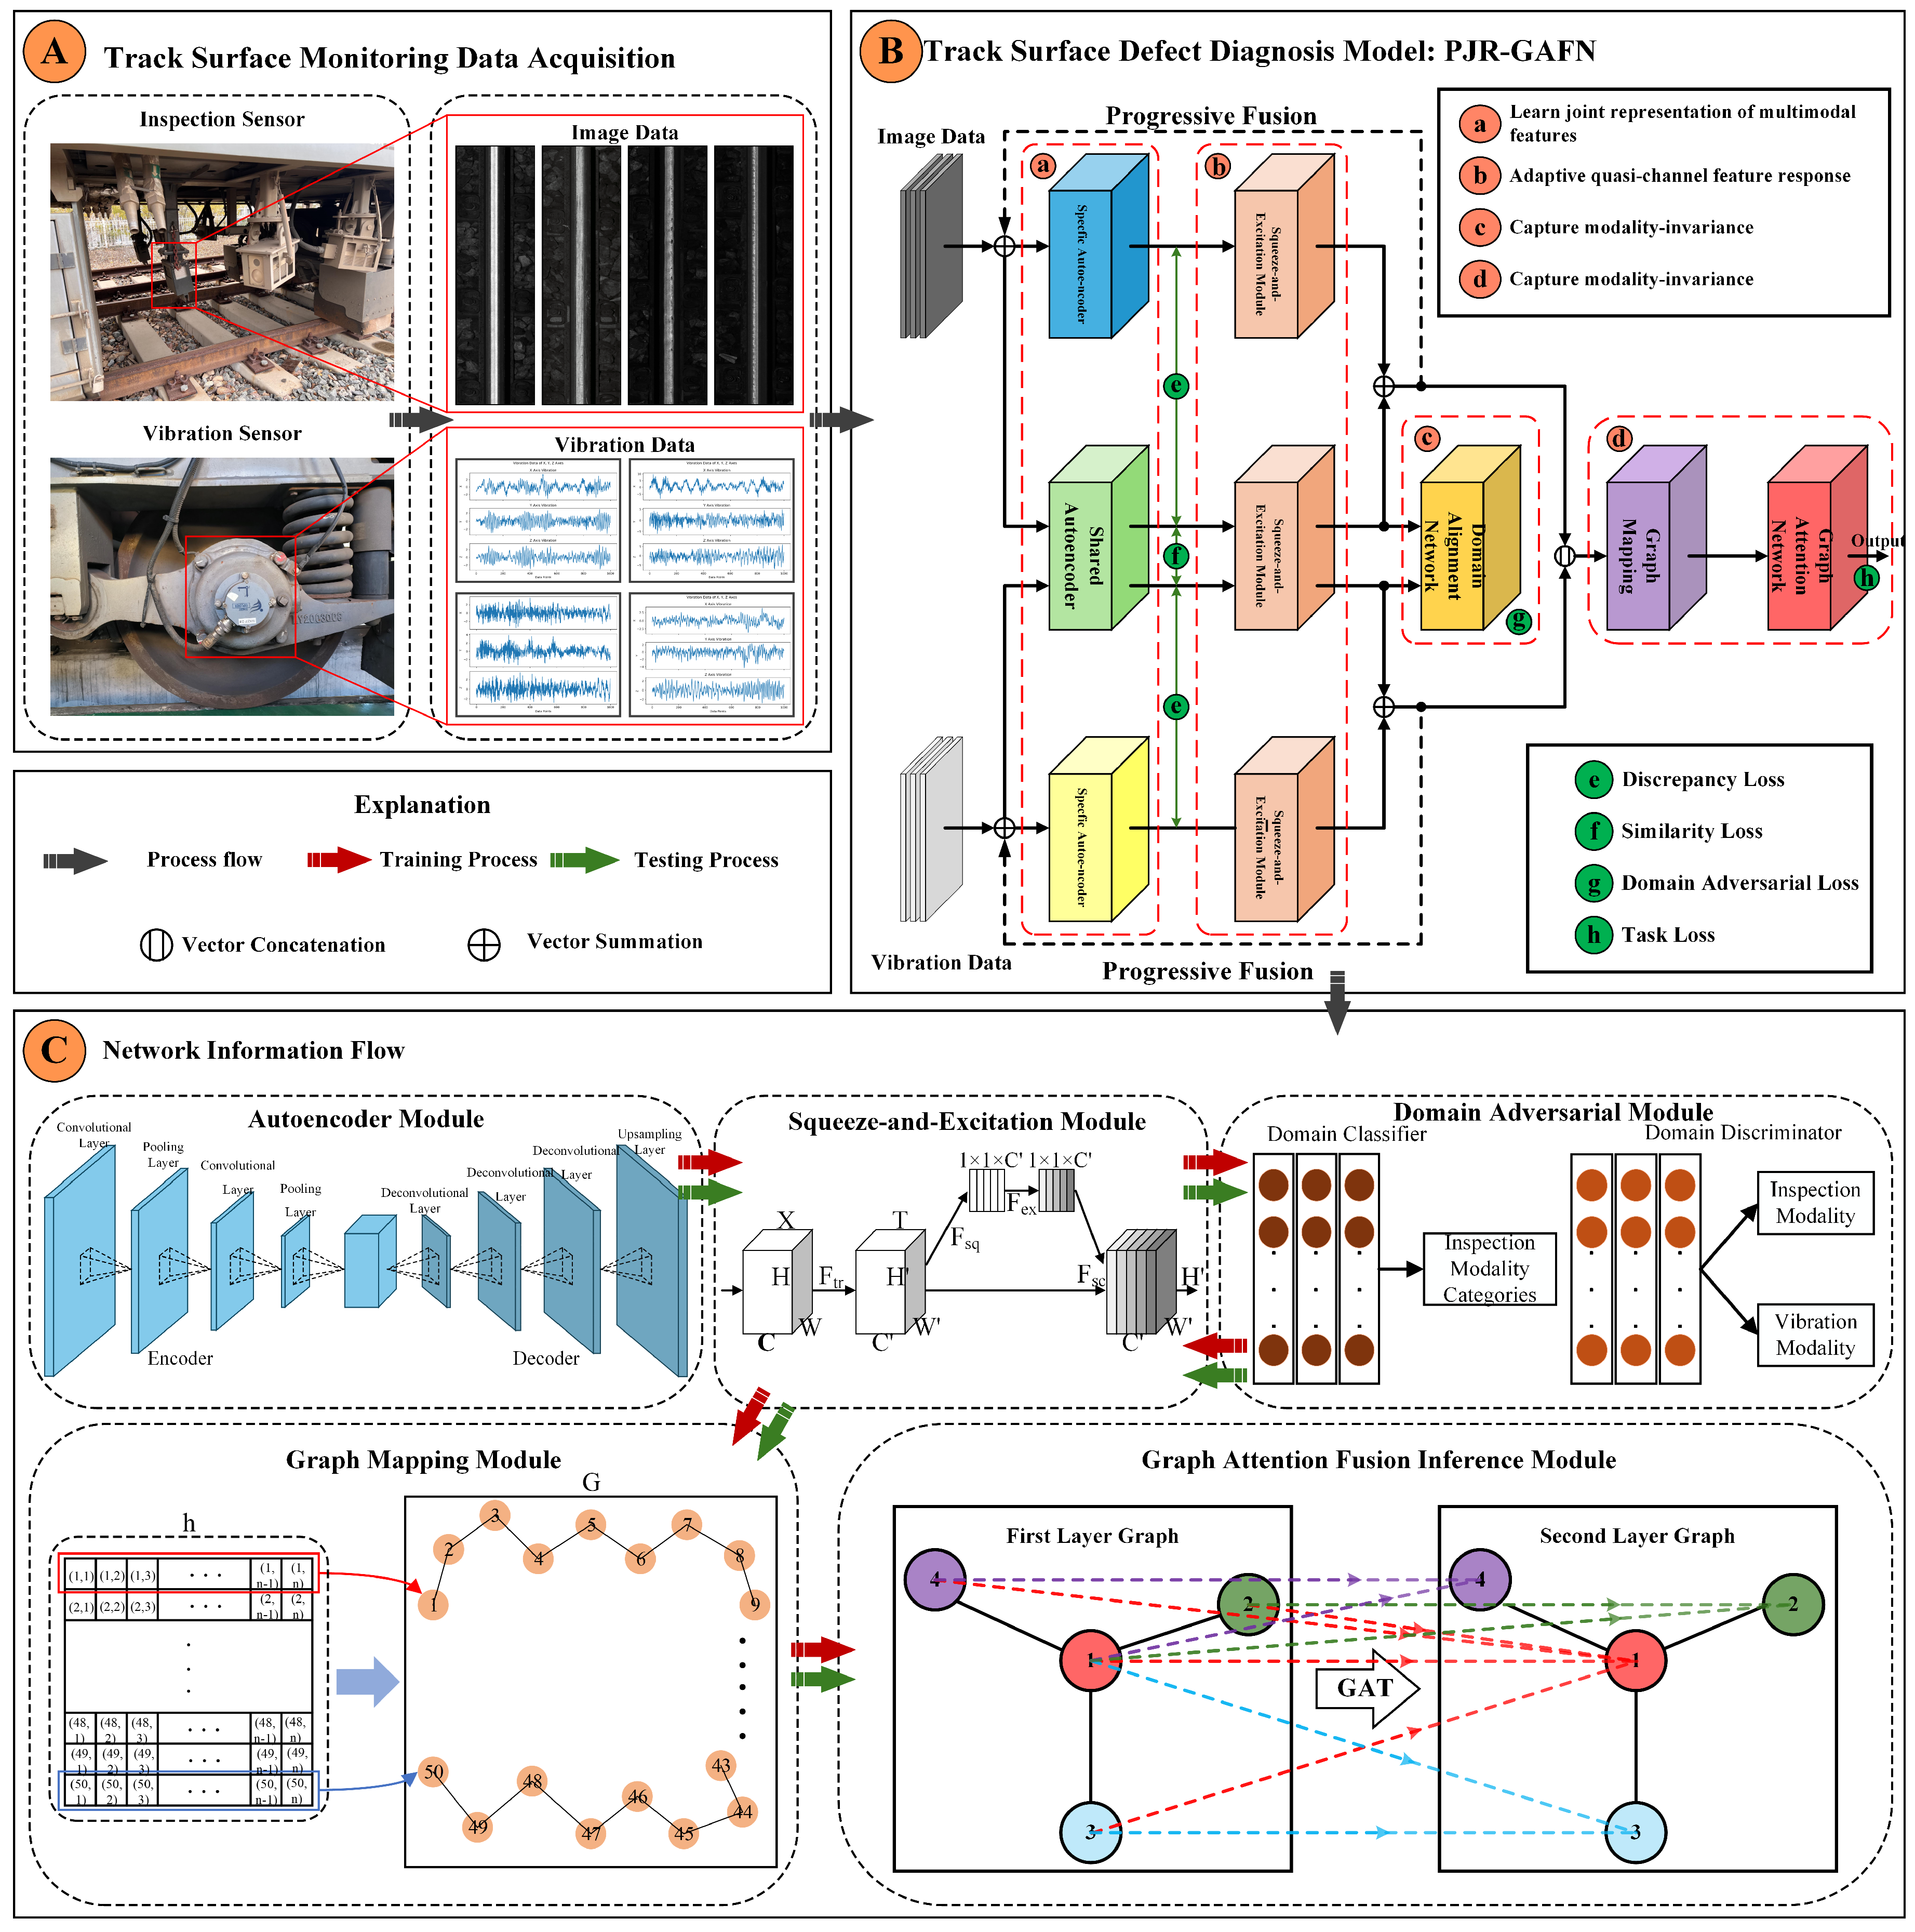
2. Model Overview
2.1. Model Structure
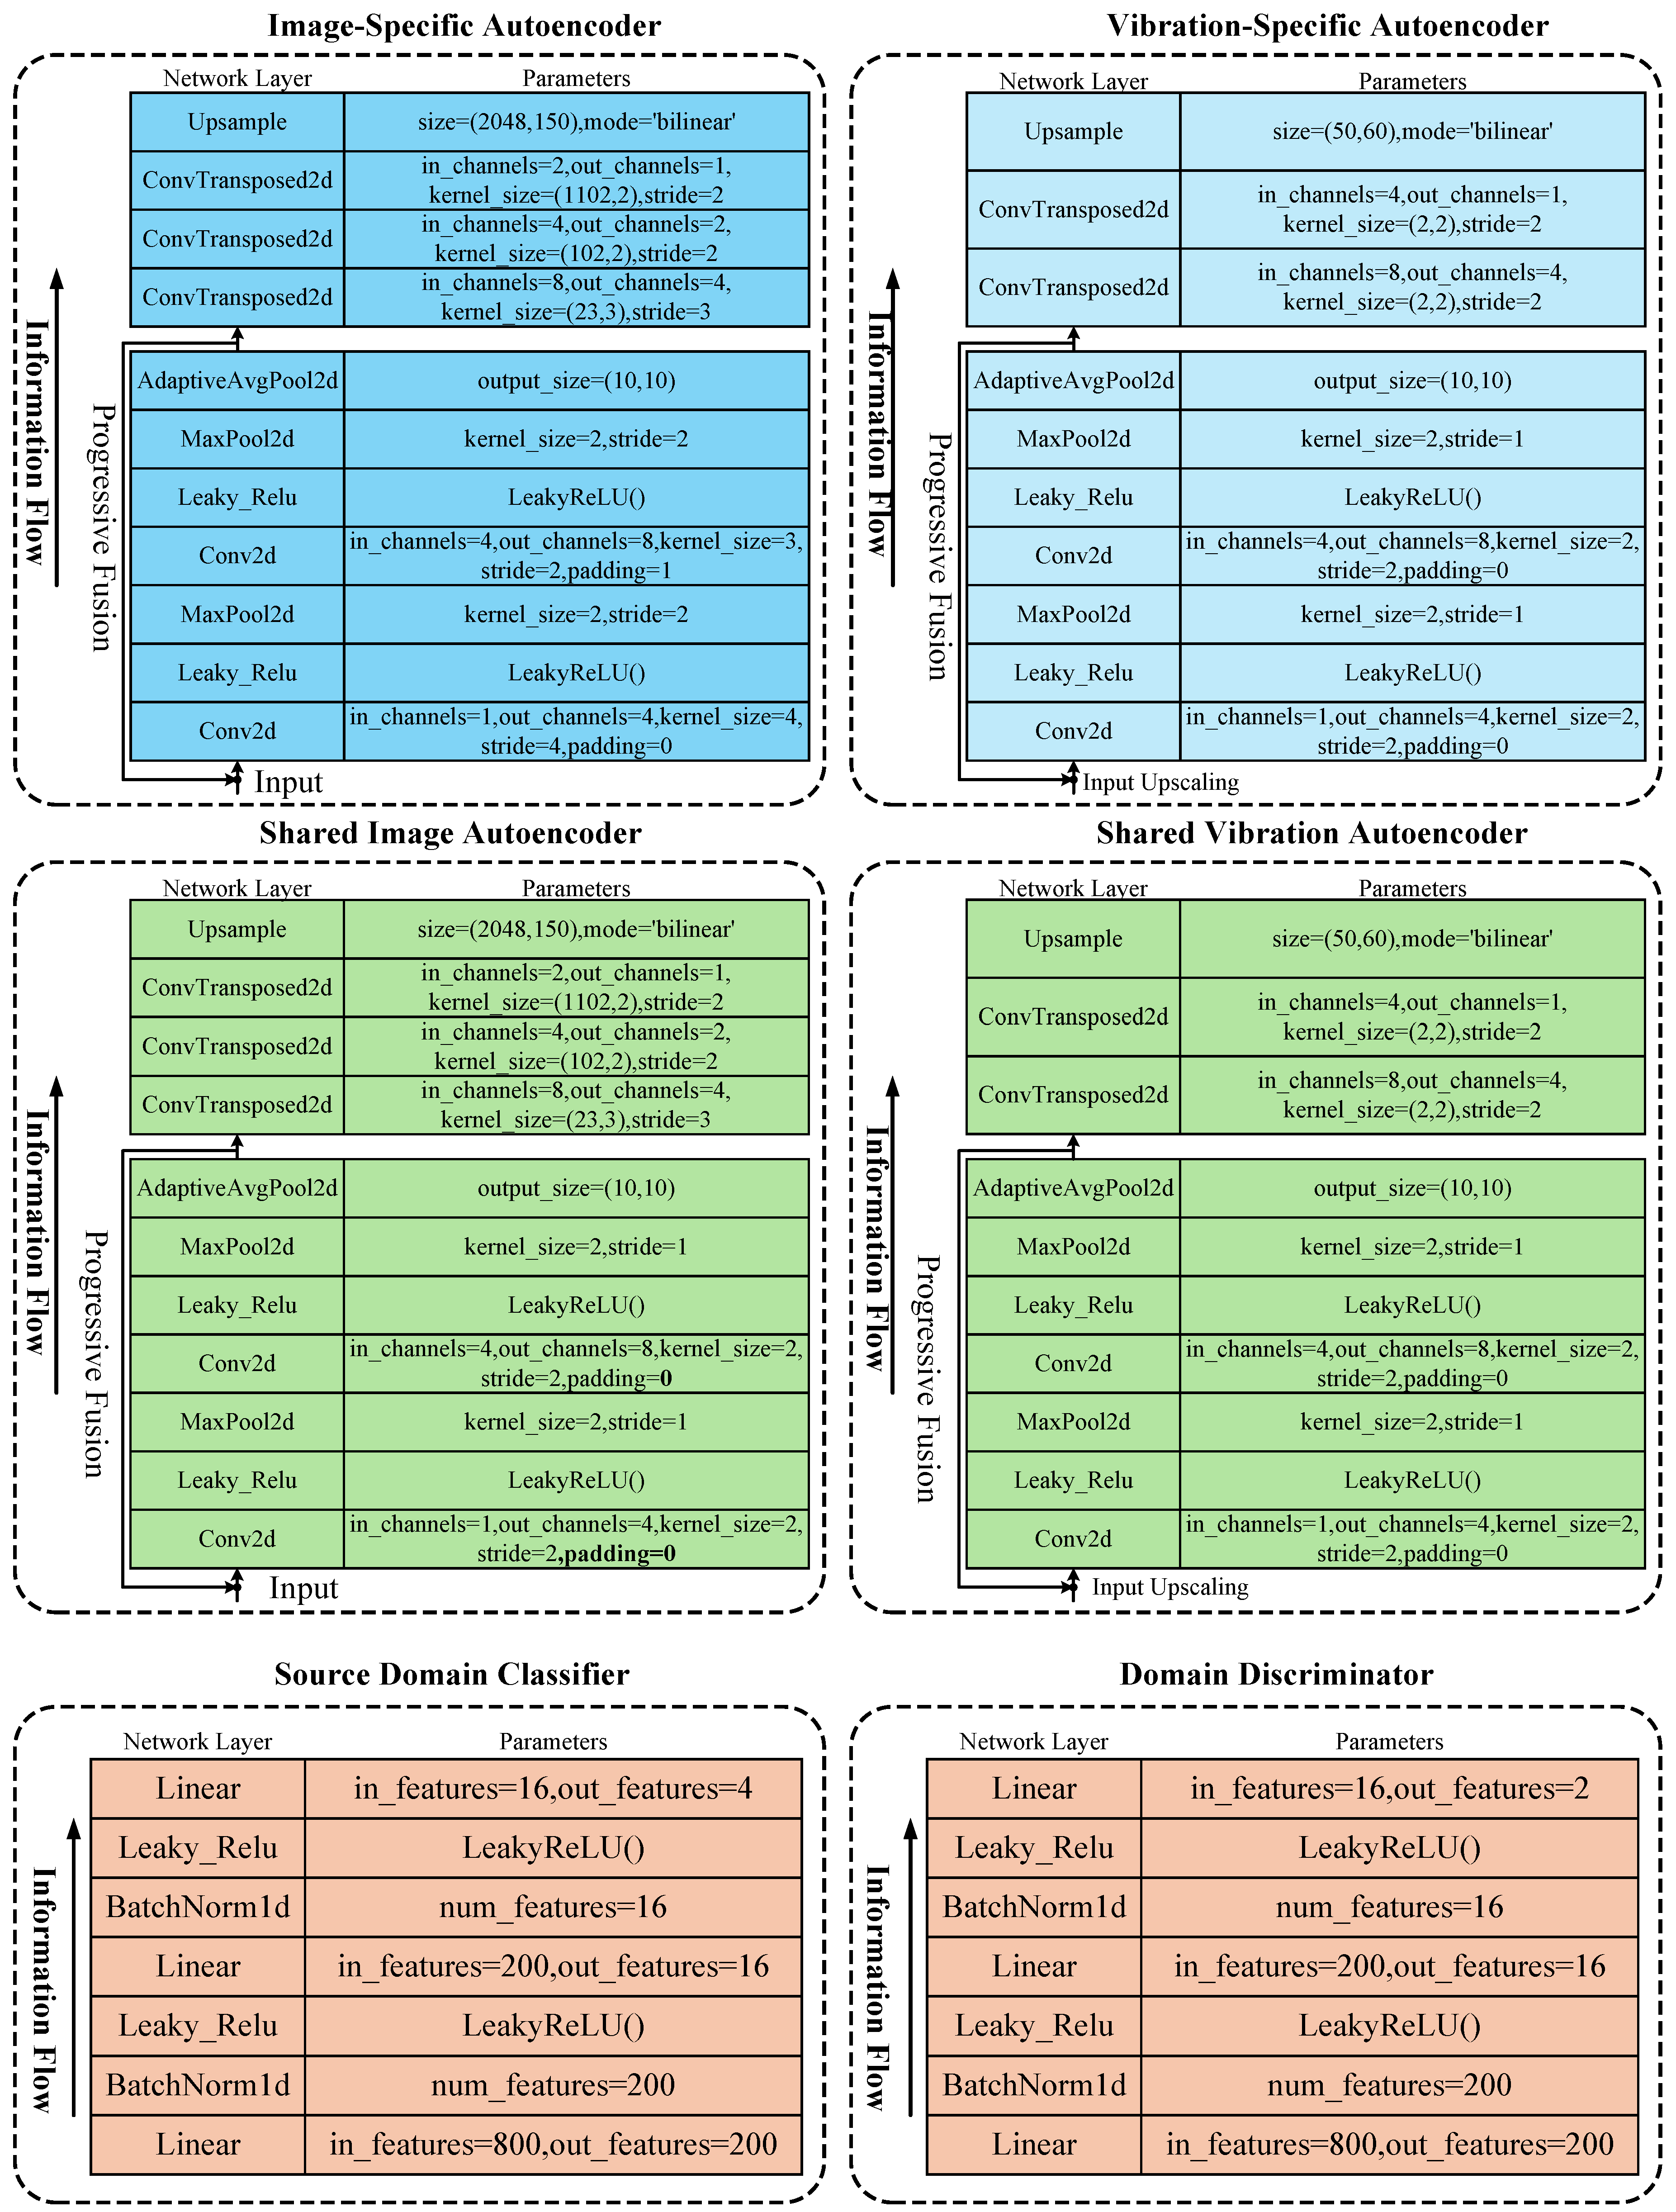
2.1.1. Joint Domain Separation Representation
2.1.2. Domain-Adversarial Learning Representation
2.1.3. Progressive Fusion Representation
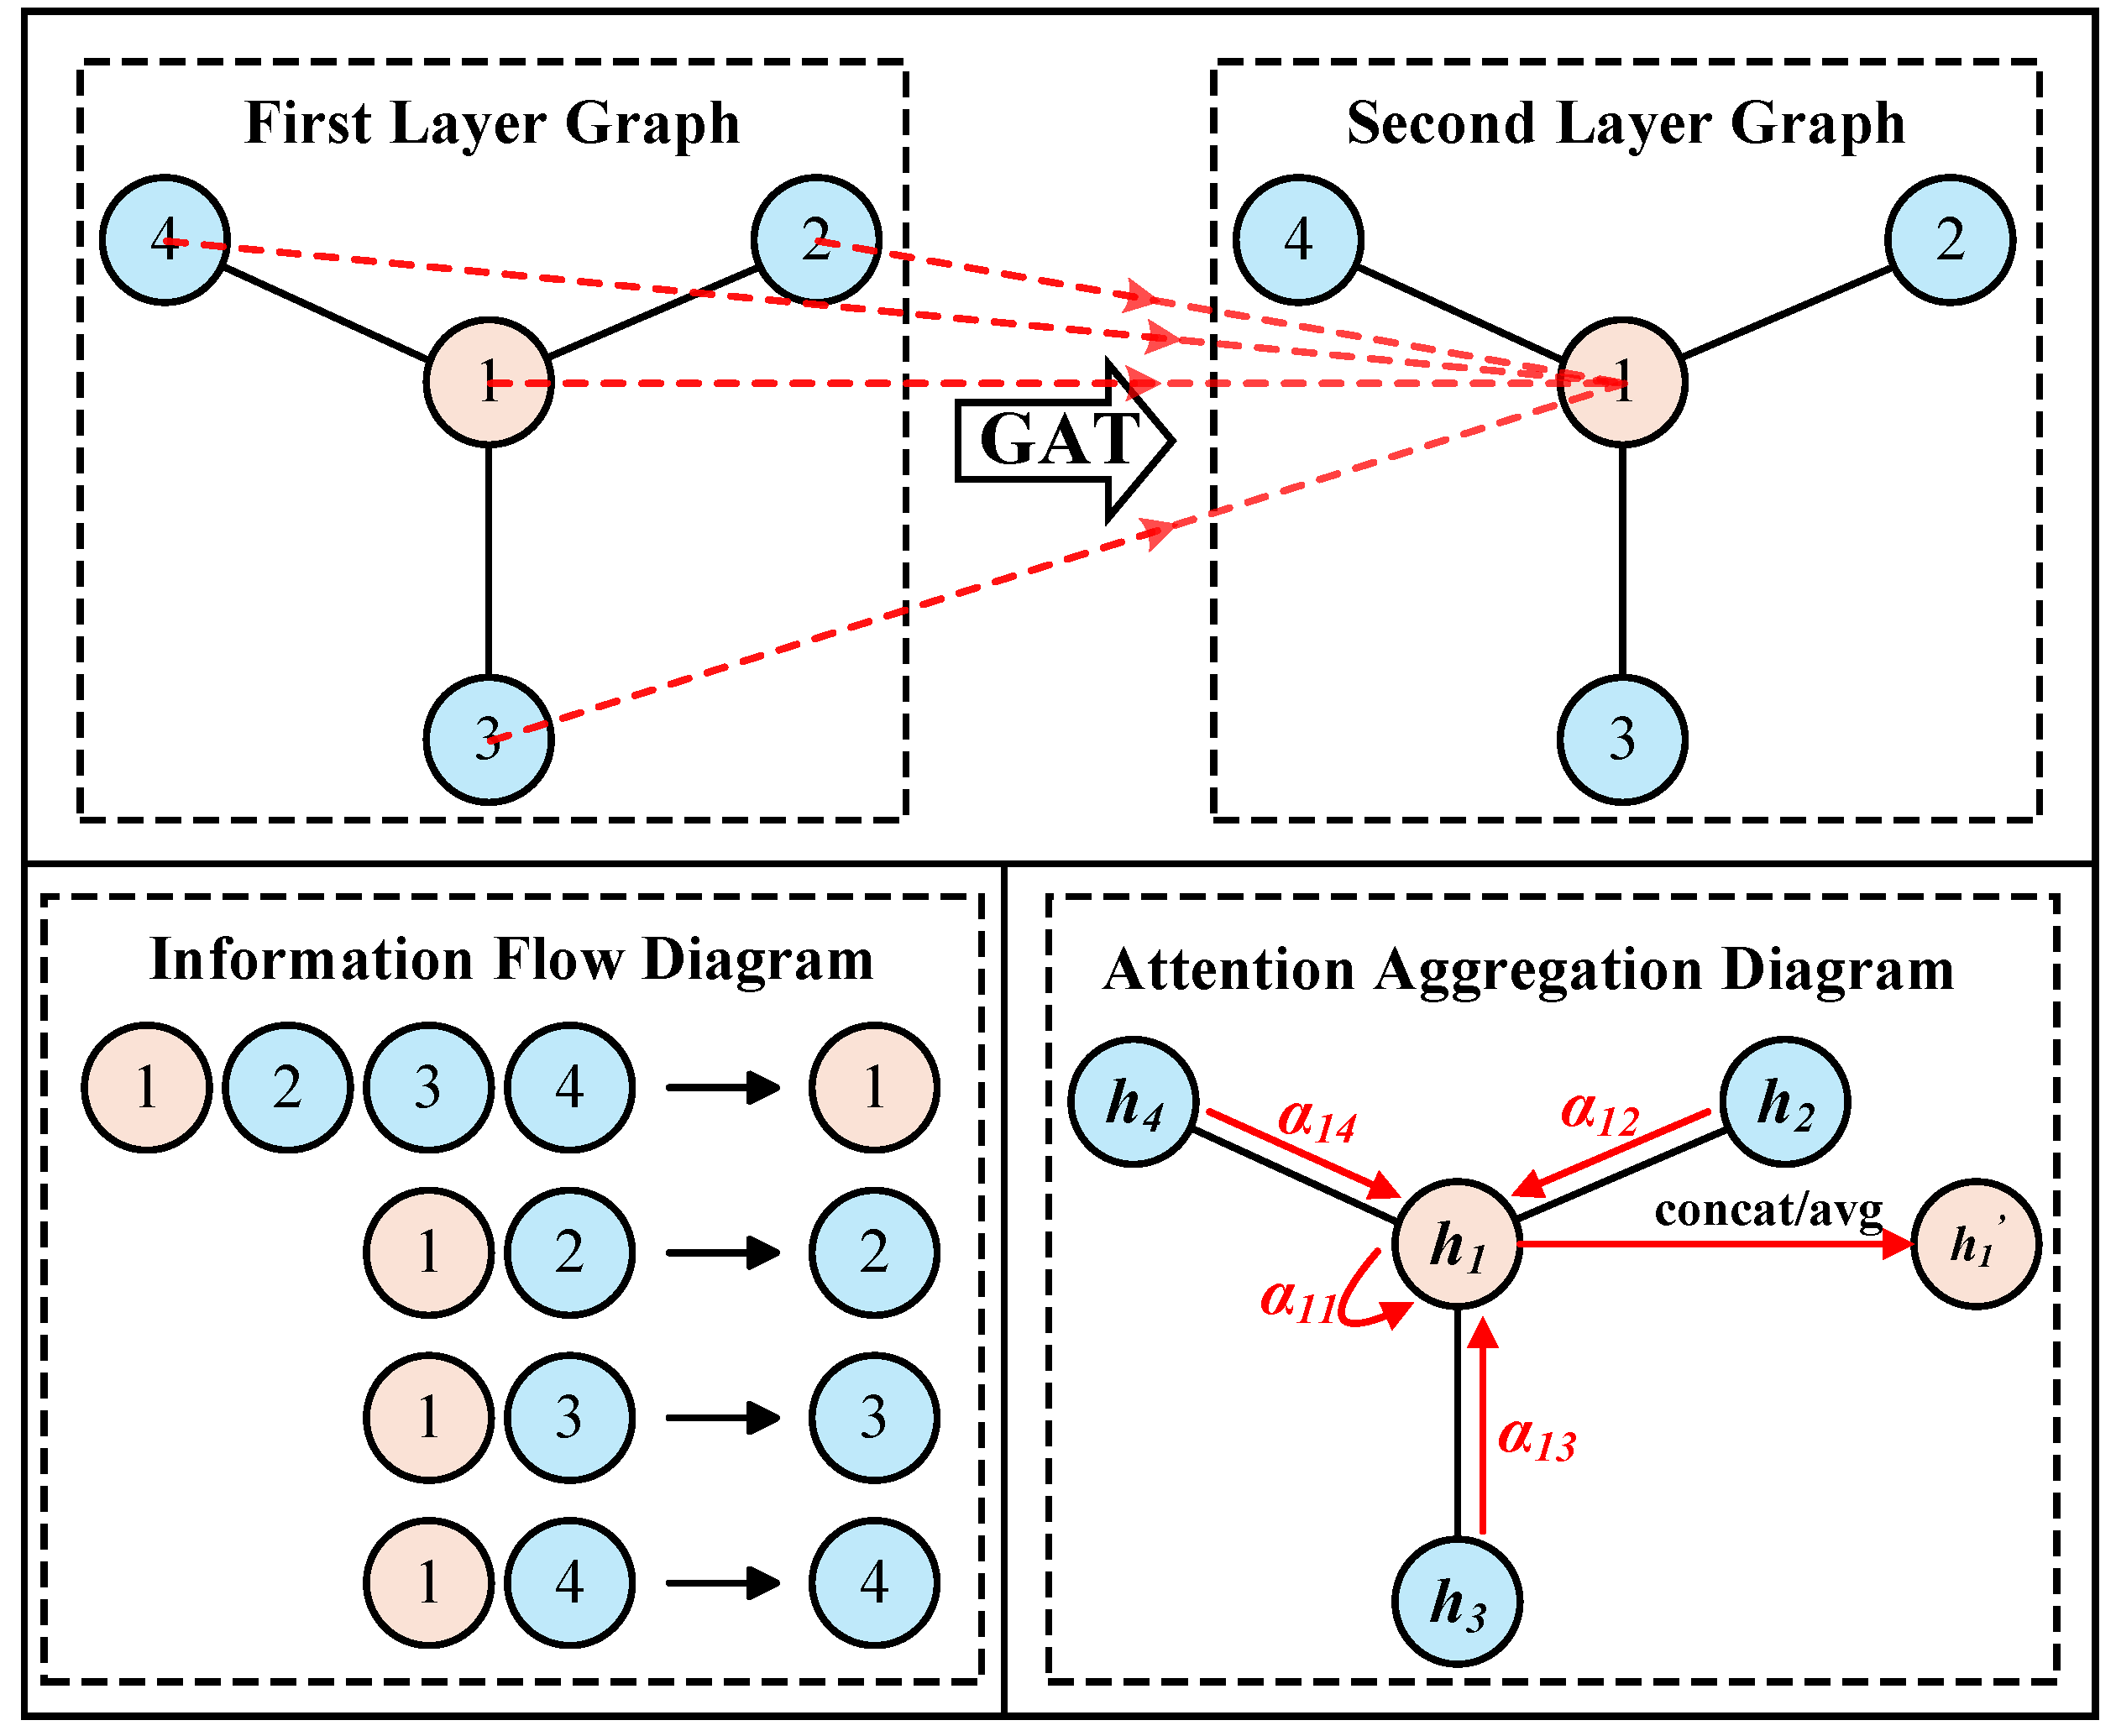
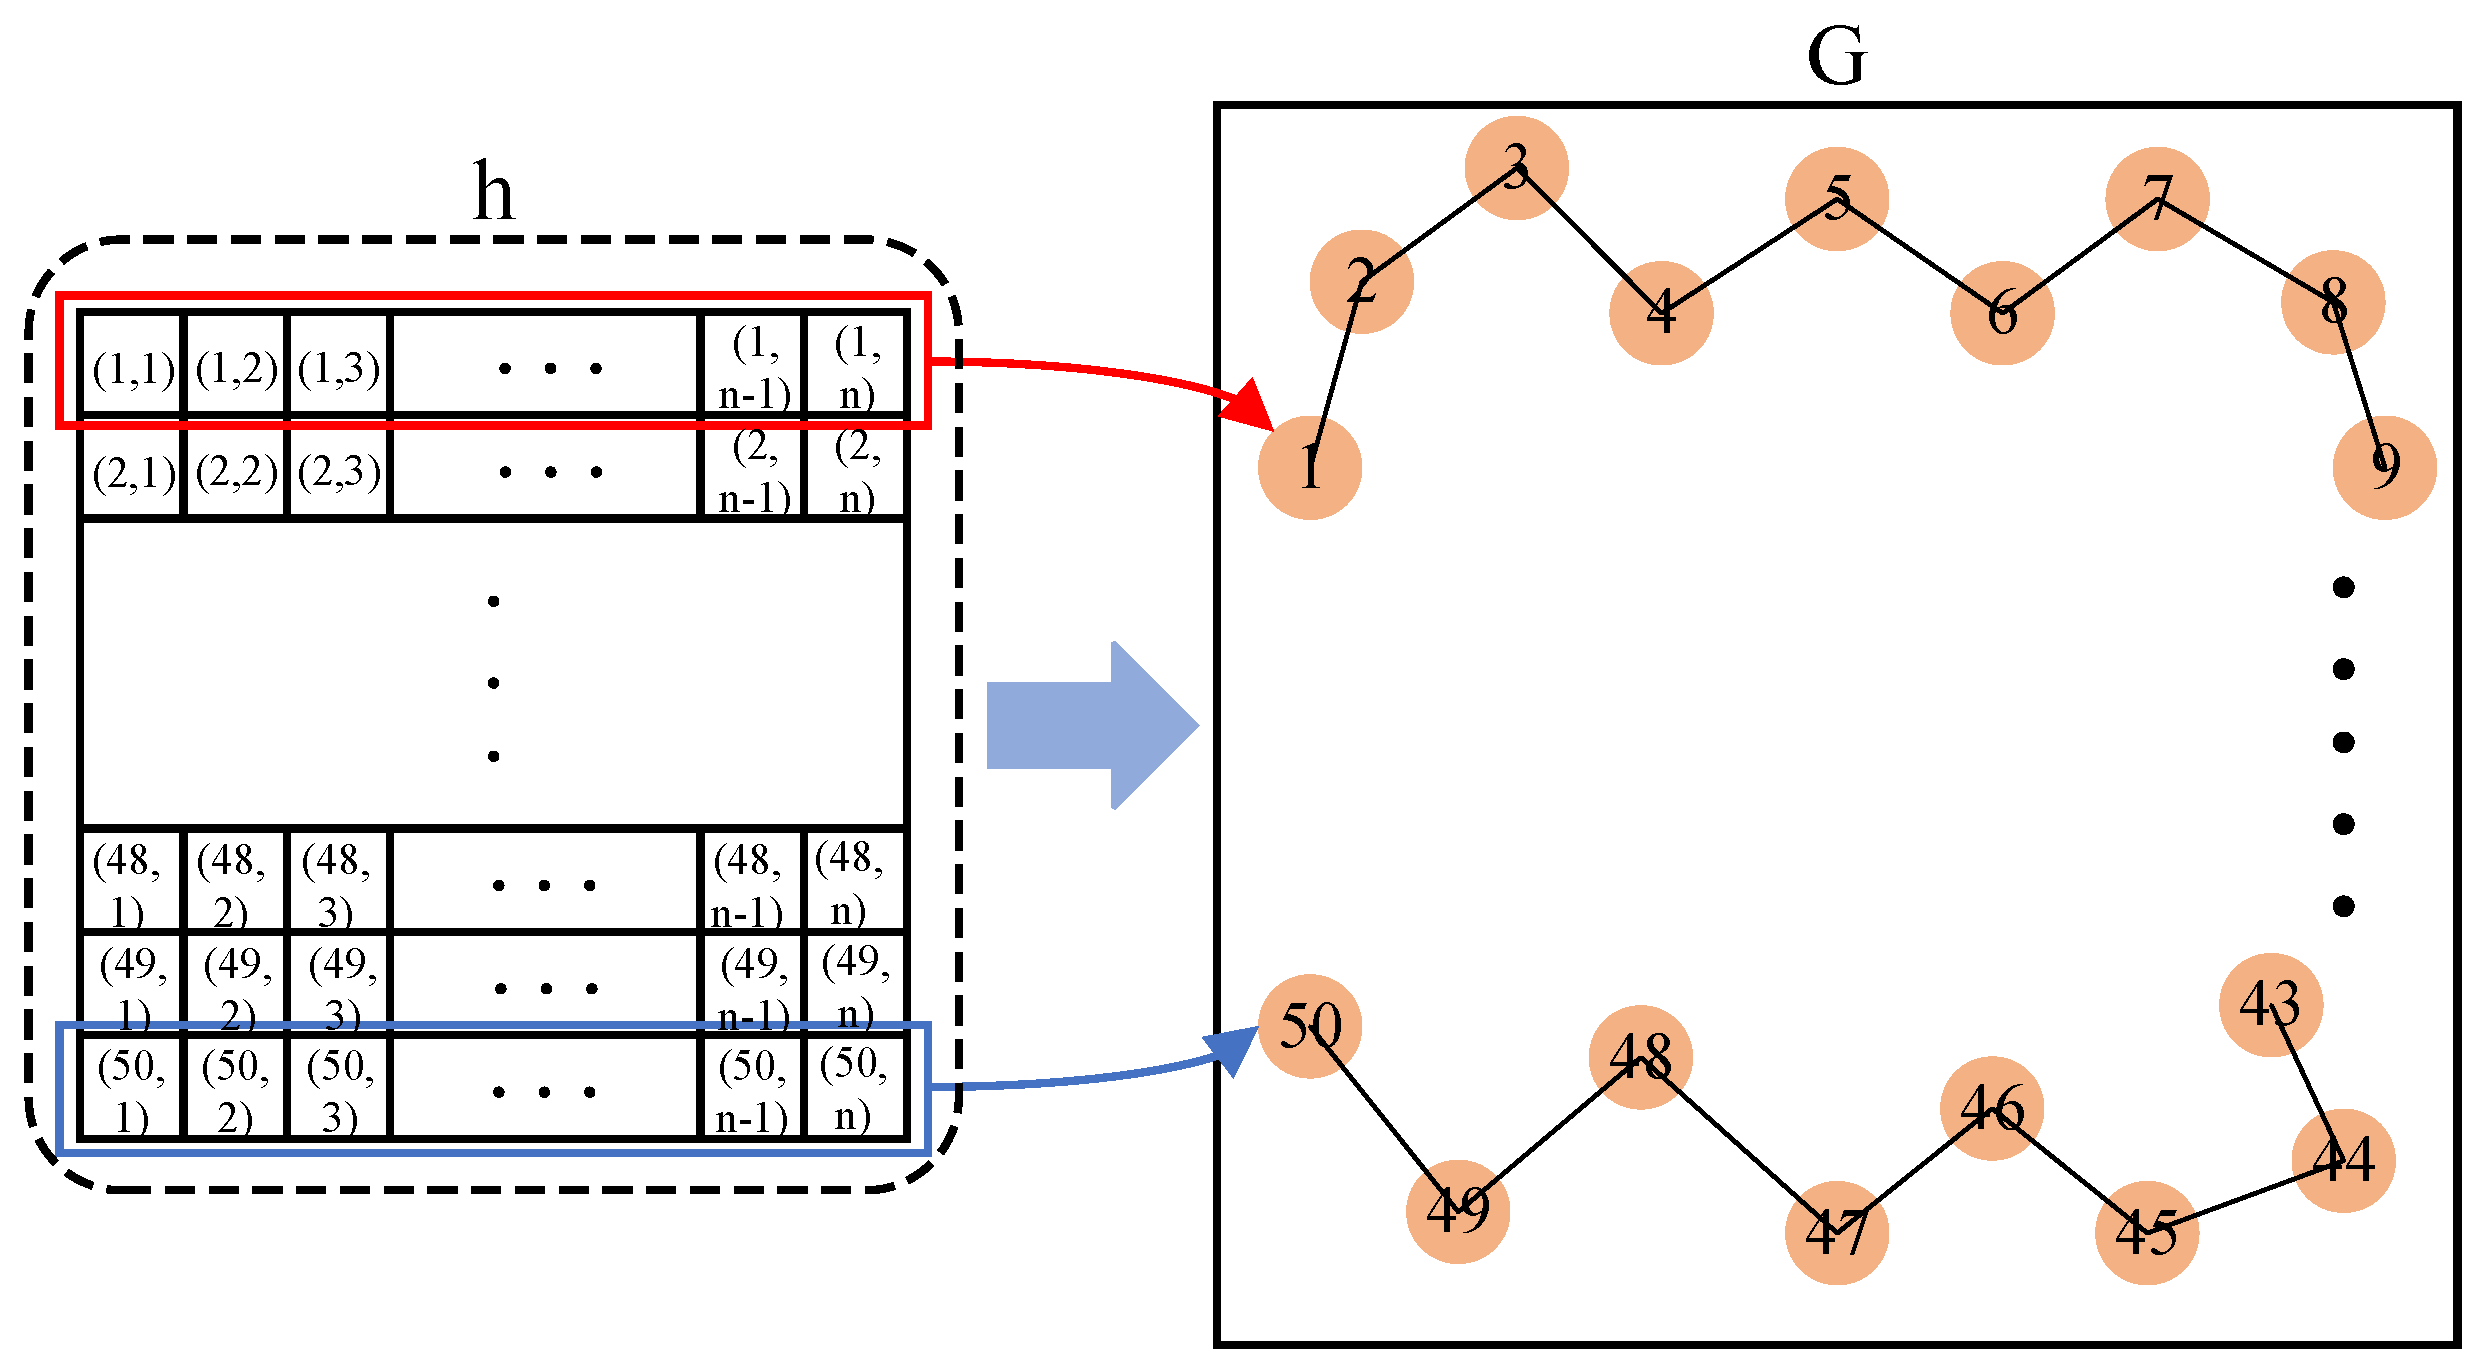
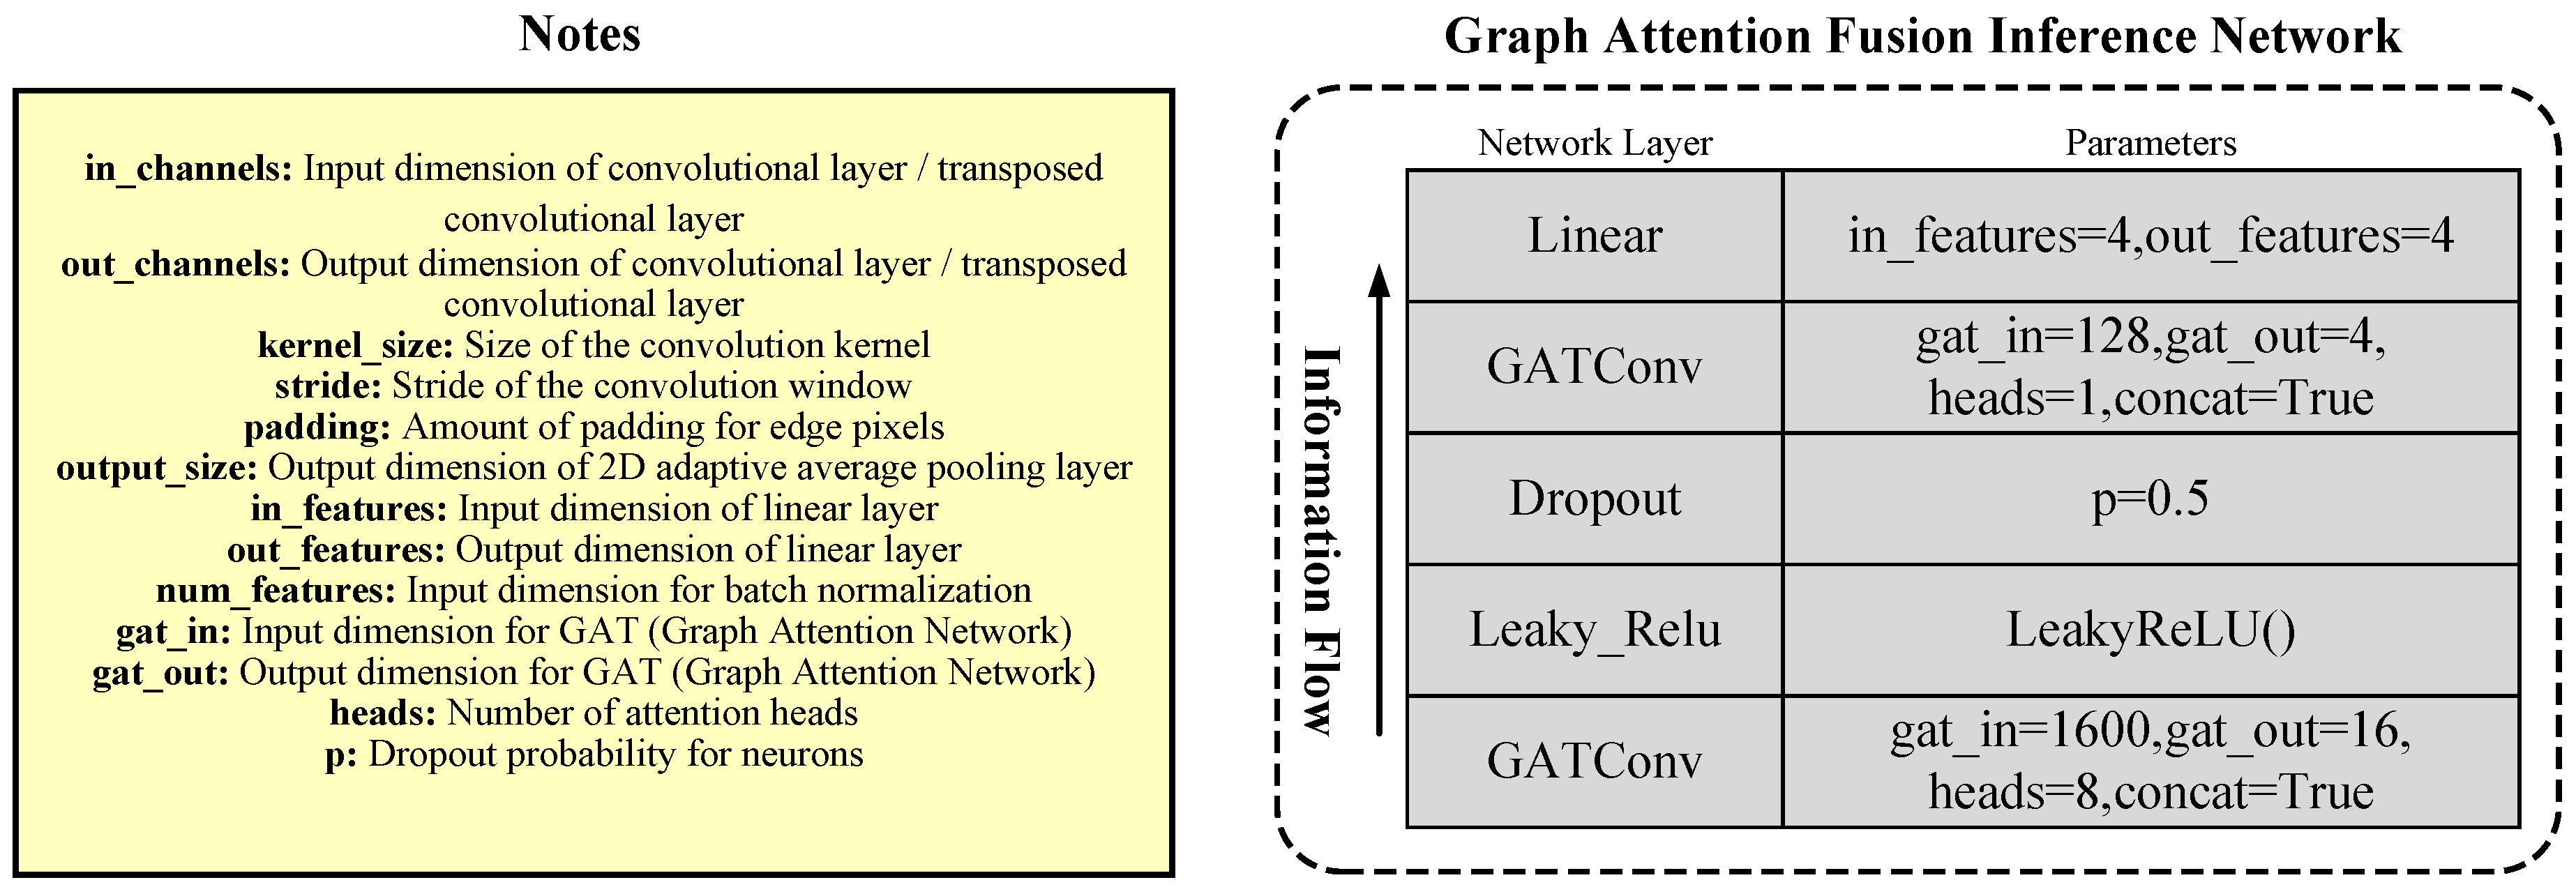
2.1.4. Graph Attention Fusion Representation
2.2. Learning Strategy
2.2.1. Reconstruction Loss
2.2.2. Joint Domain Disentangled Representation Loss
2.2.3. Domain-Adversarial Loss
2.2.4. Task Loss
2.2.5. Total Objective Loss
3. Experimental Analysis
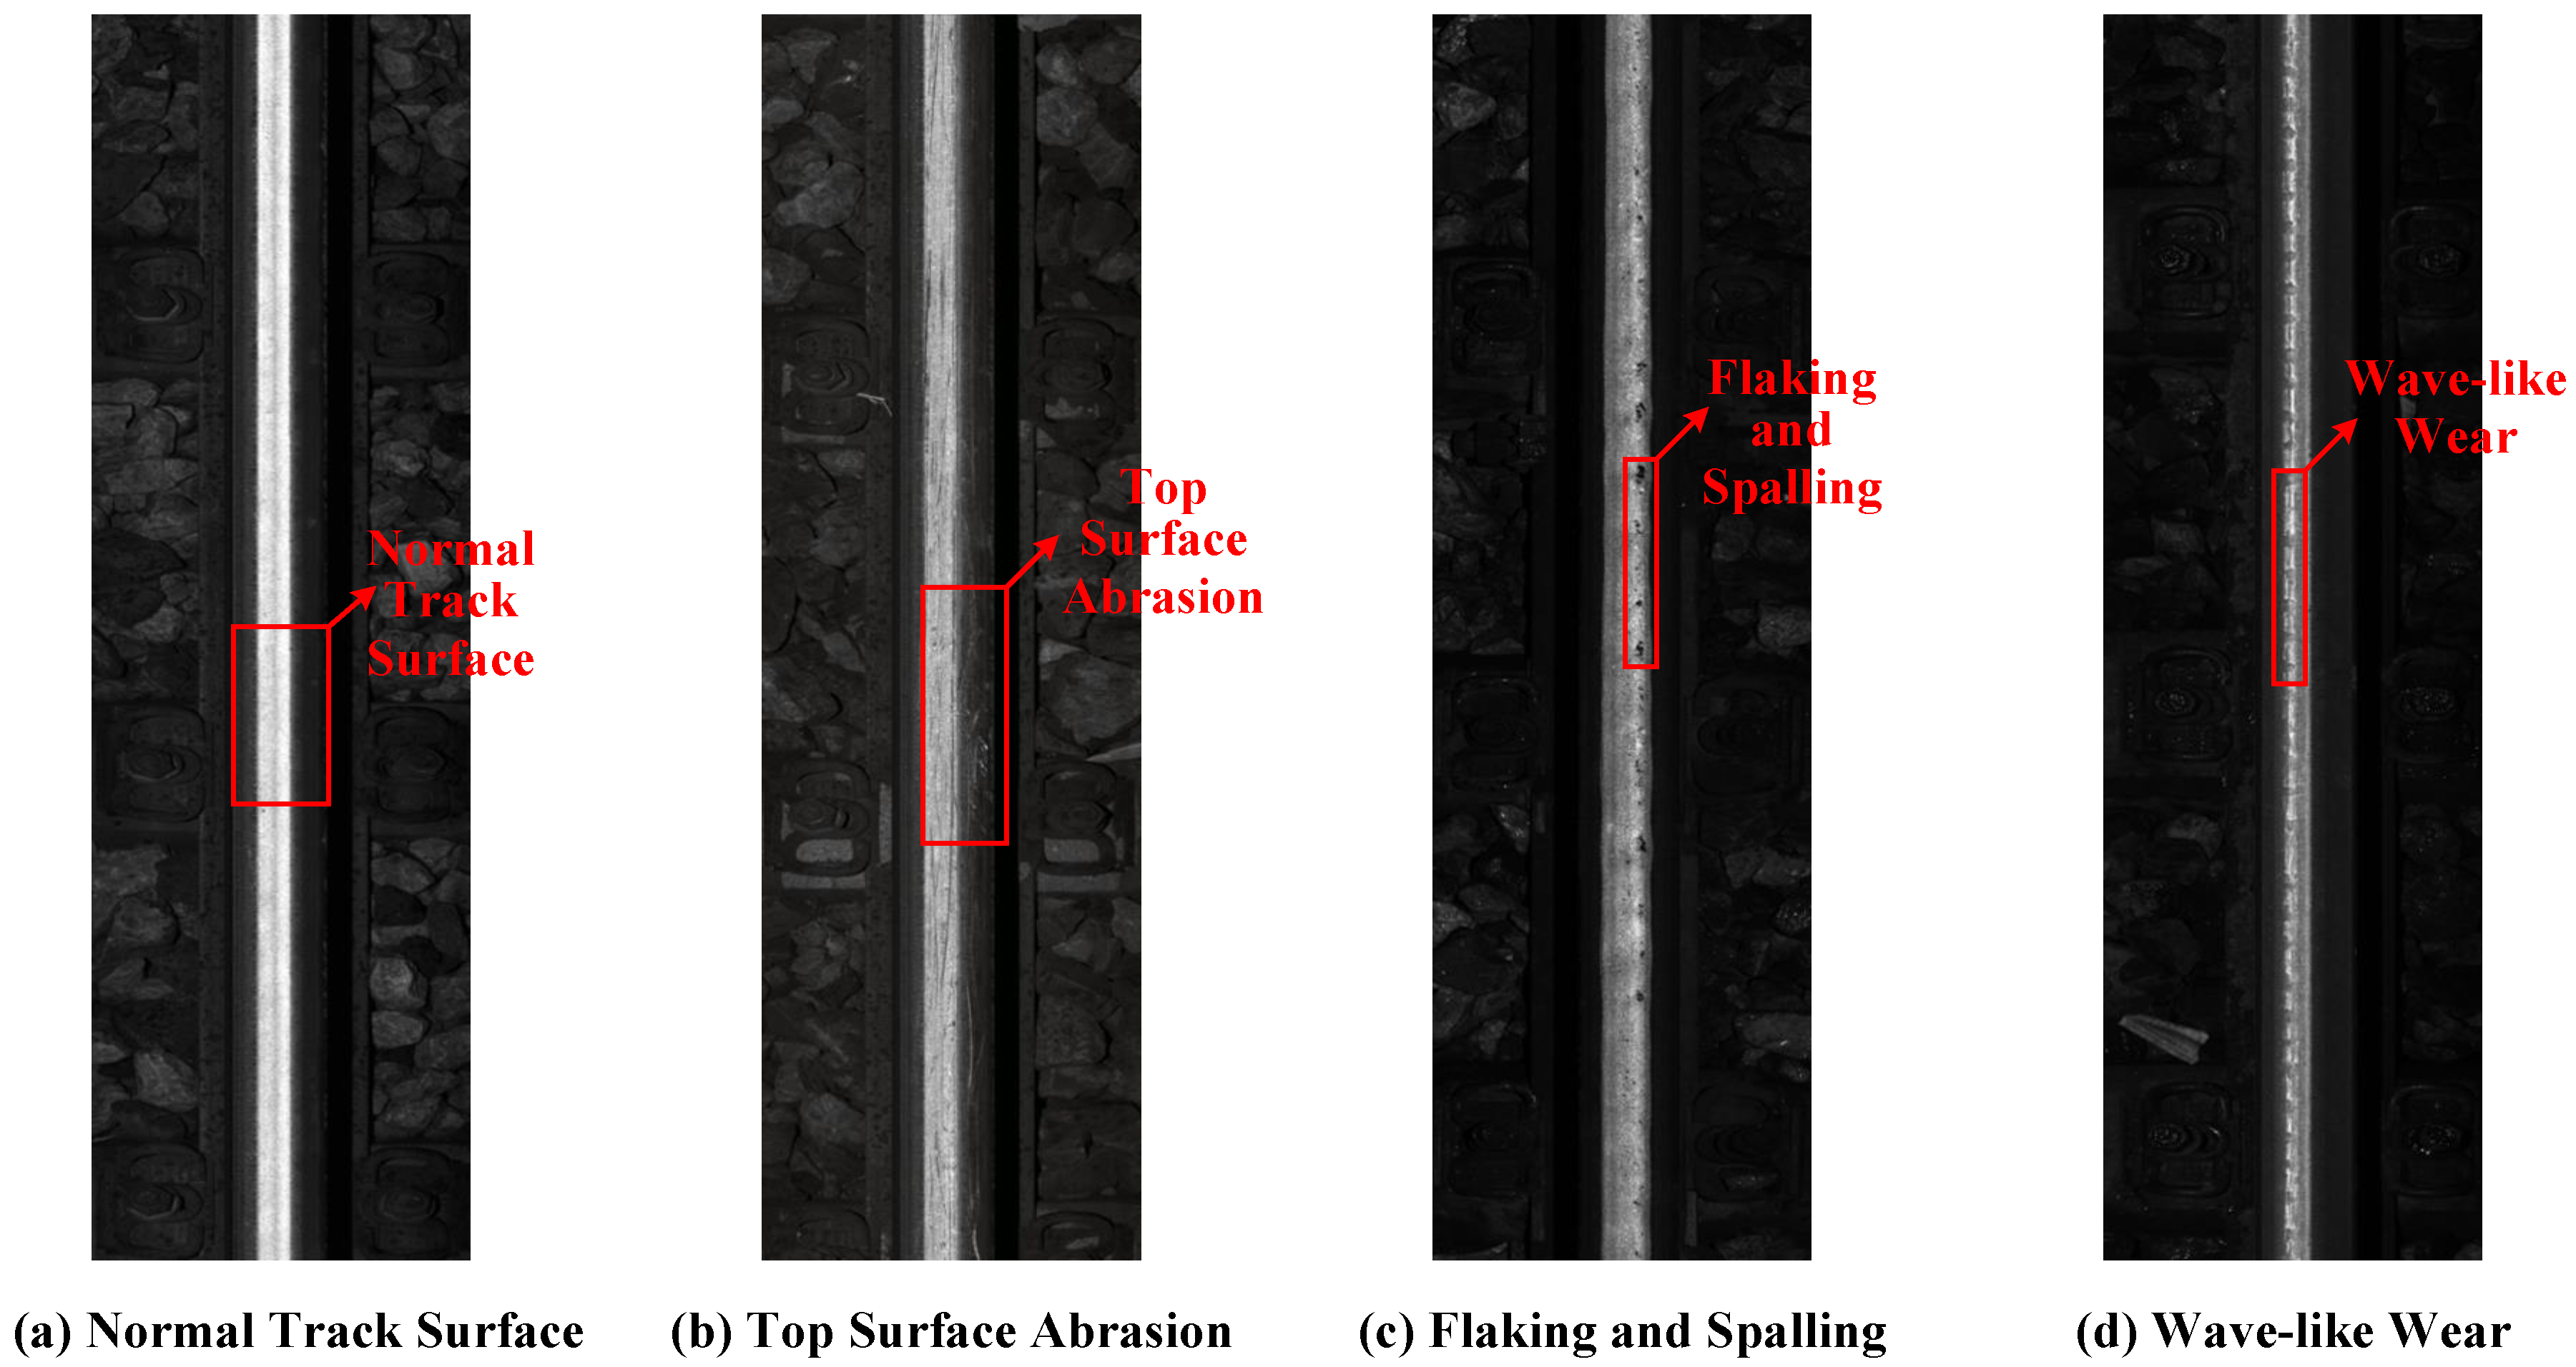
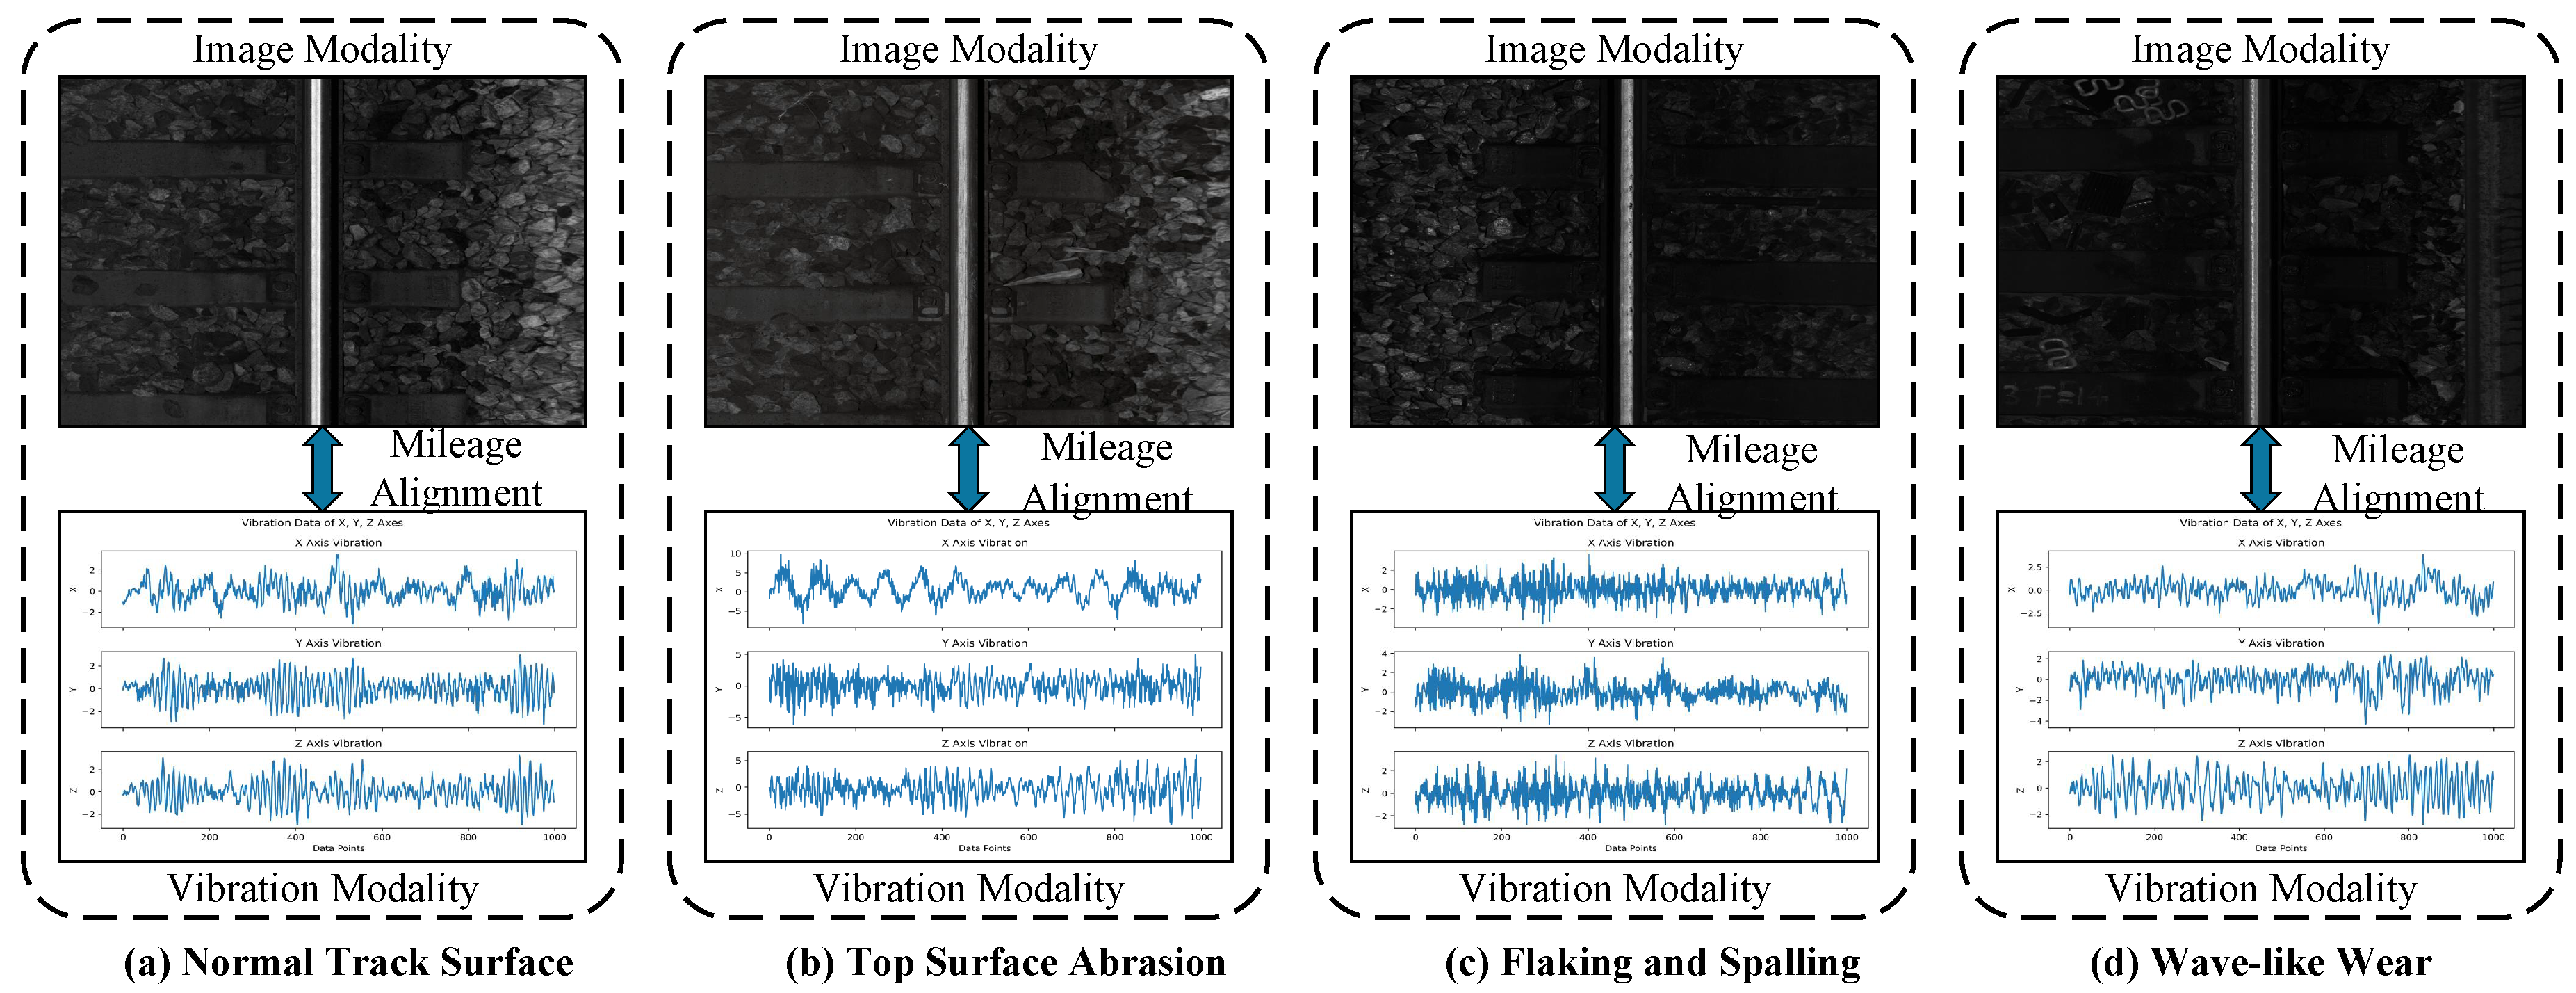
3.1. Dataset Description
3.2. Experimental Details
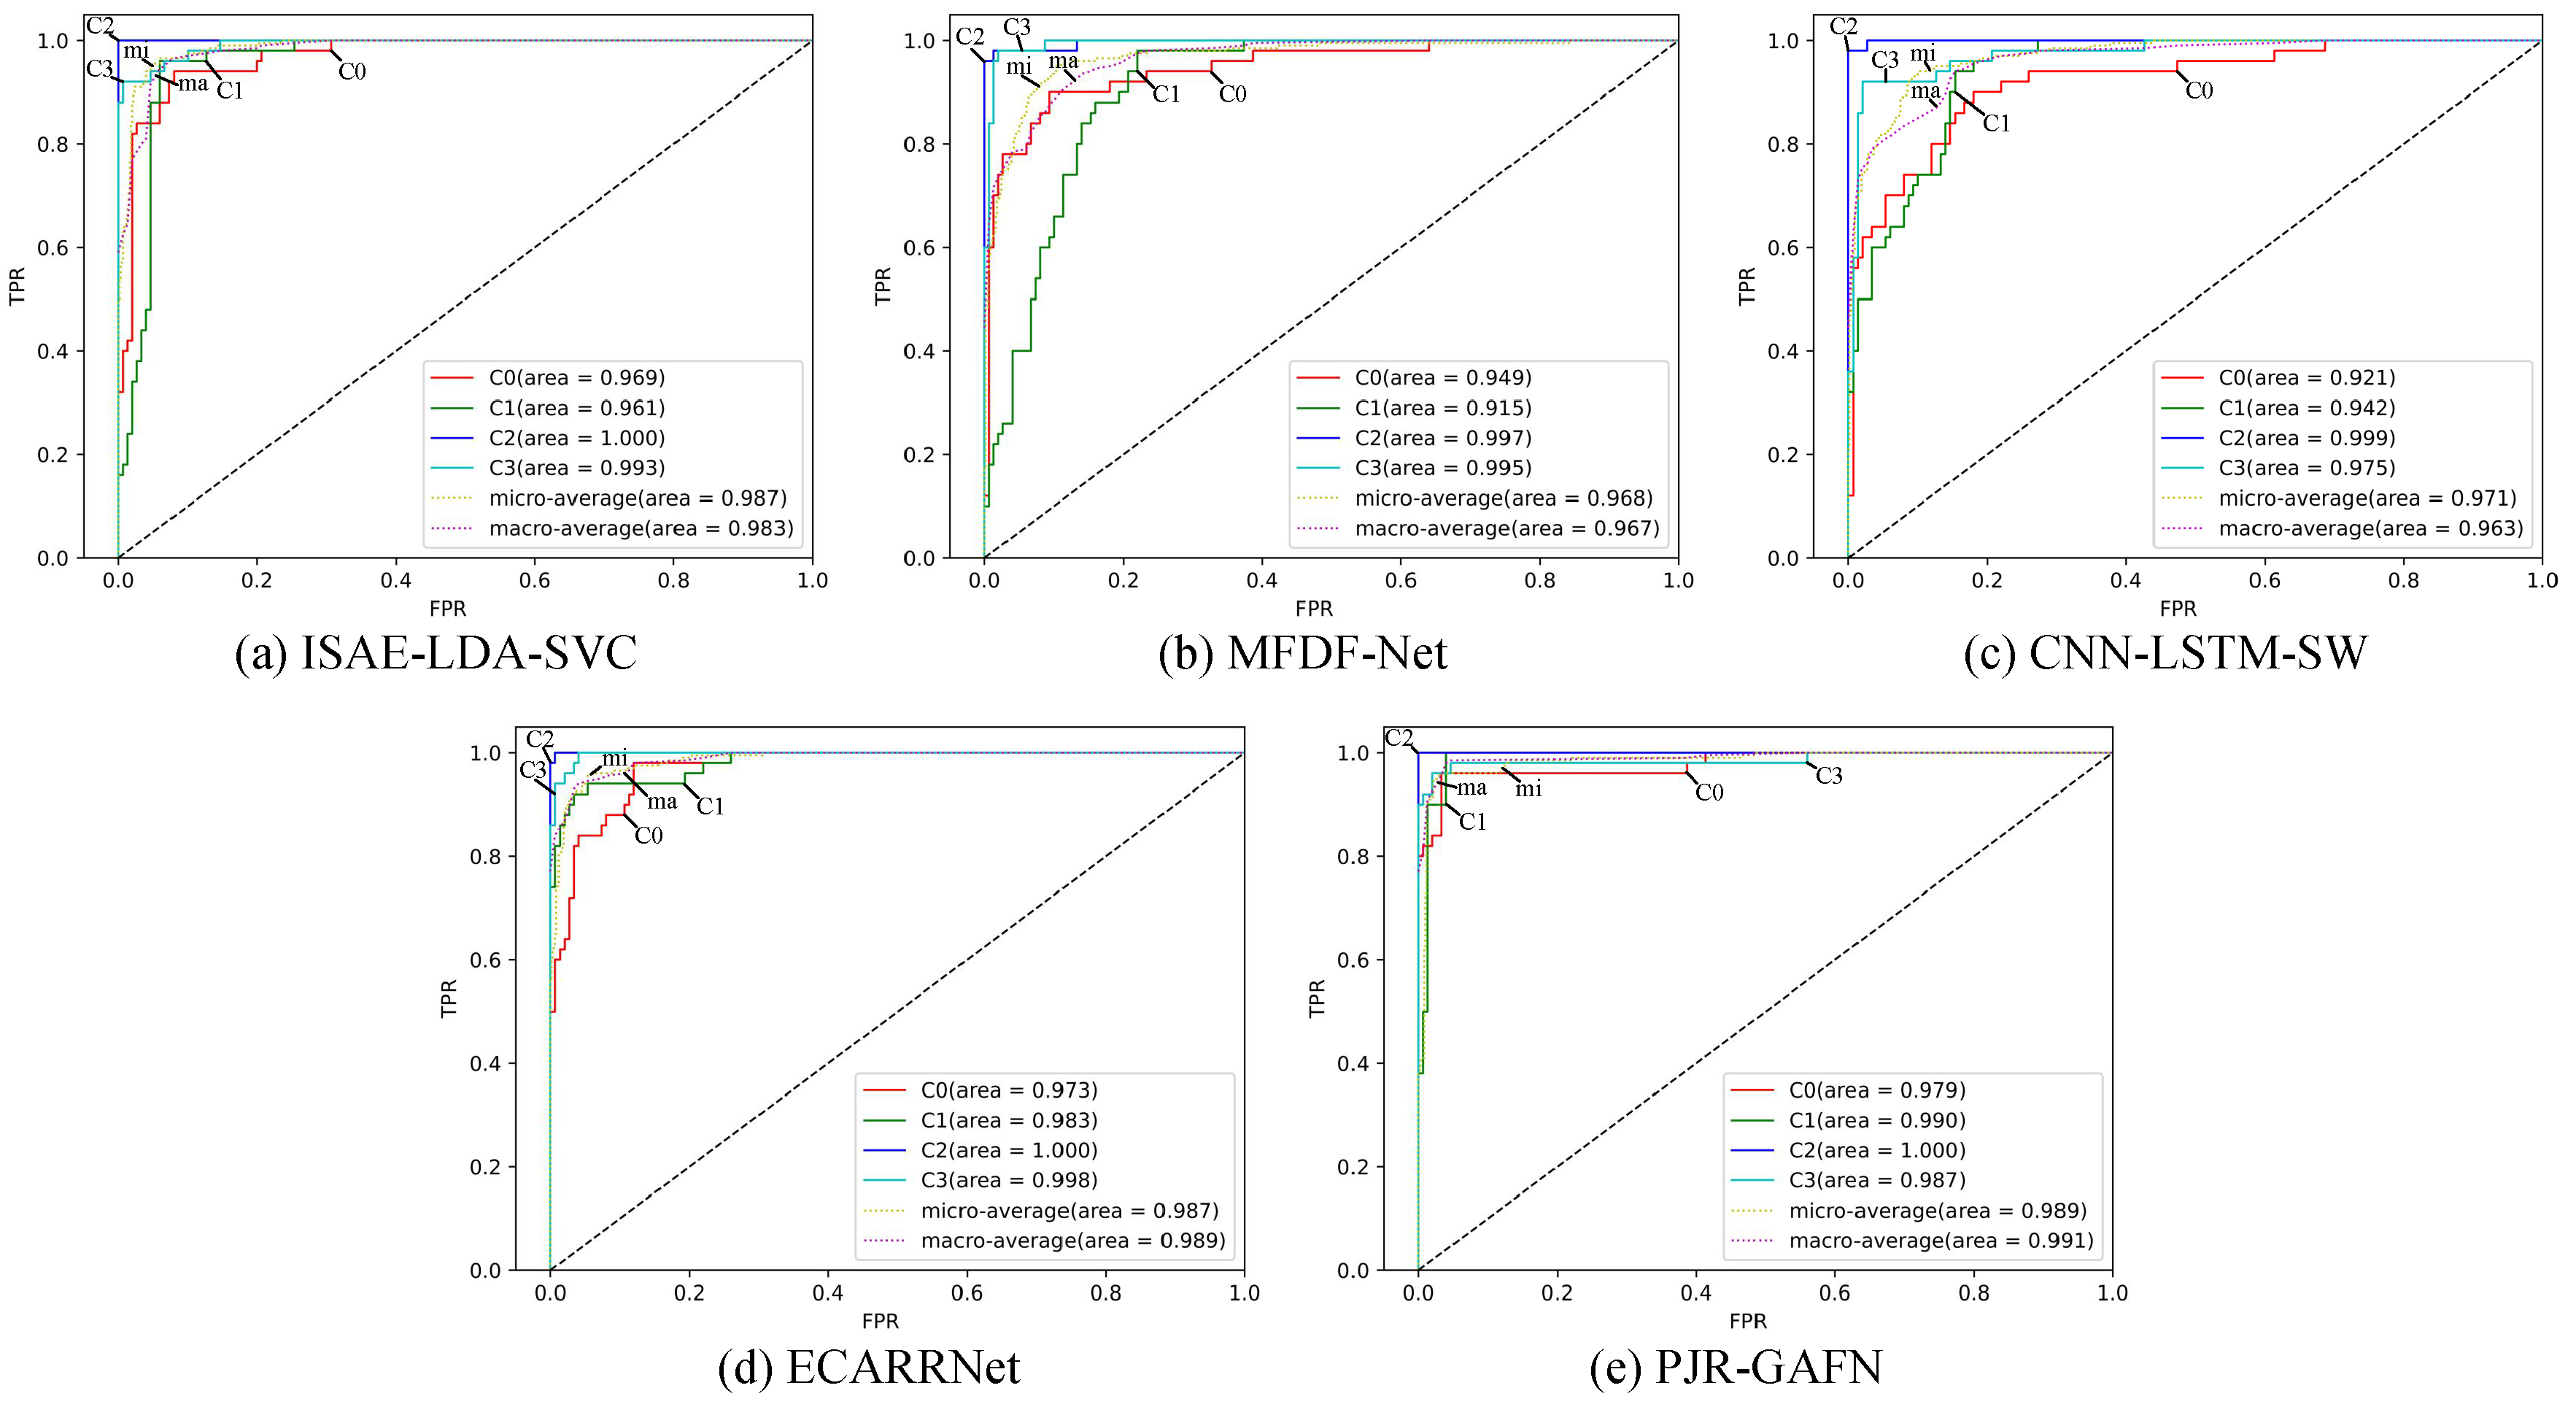
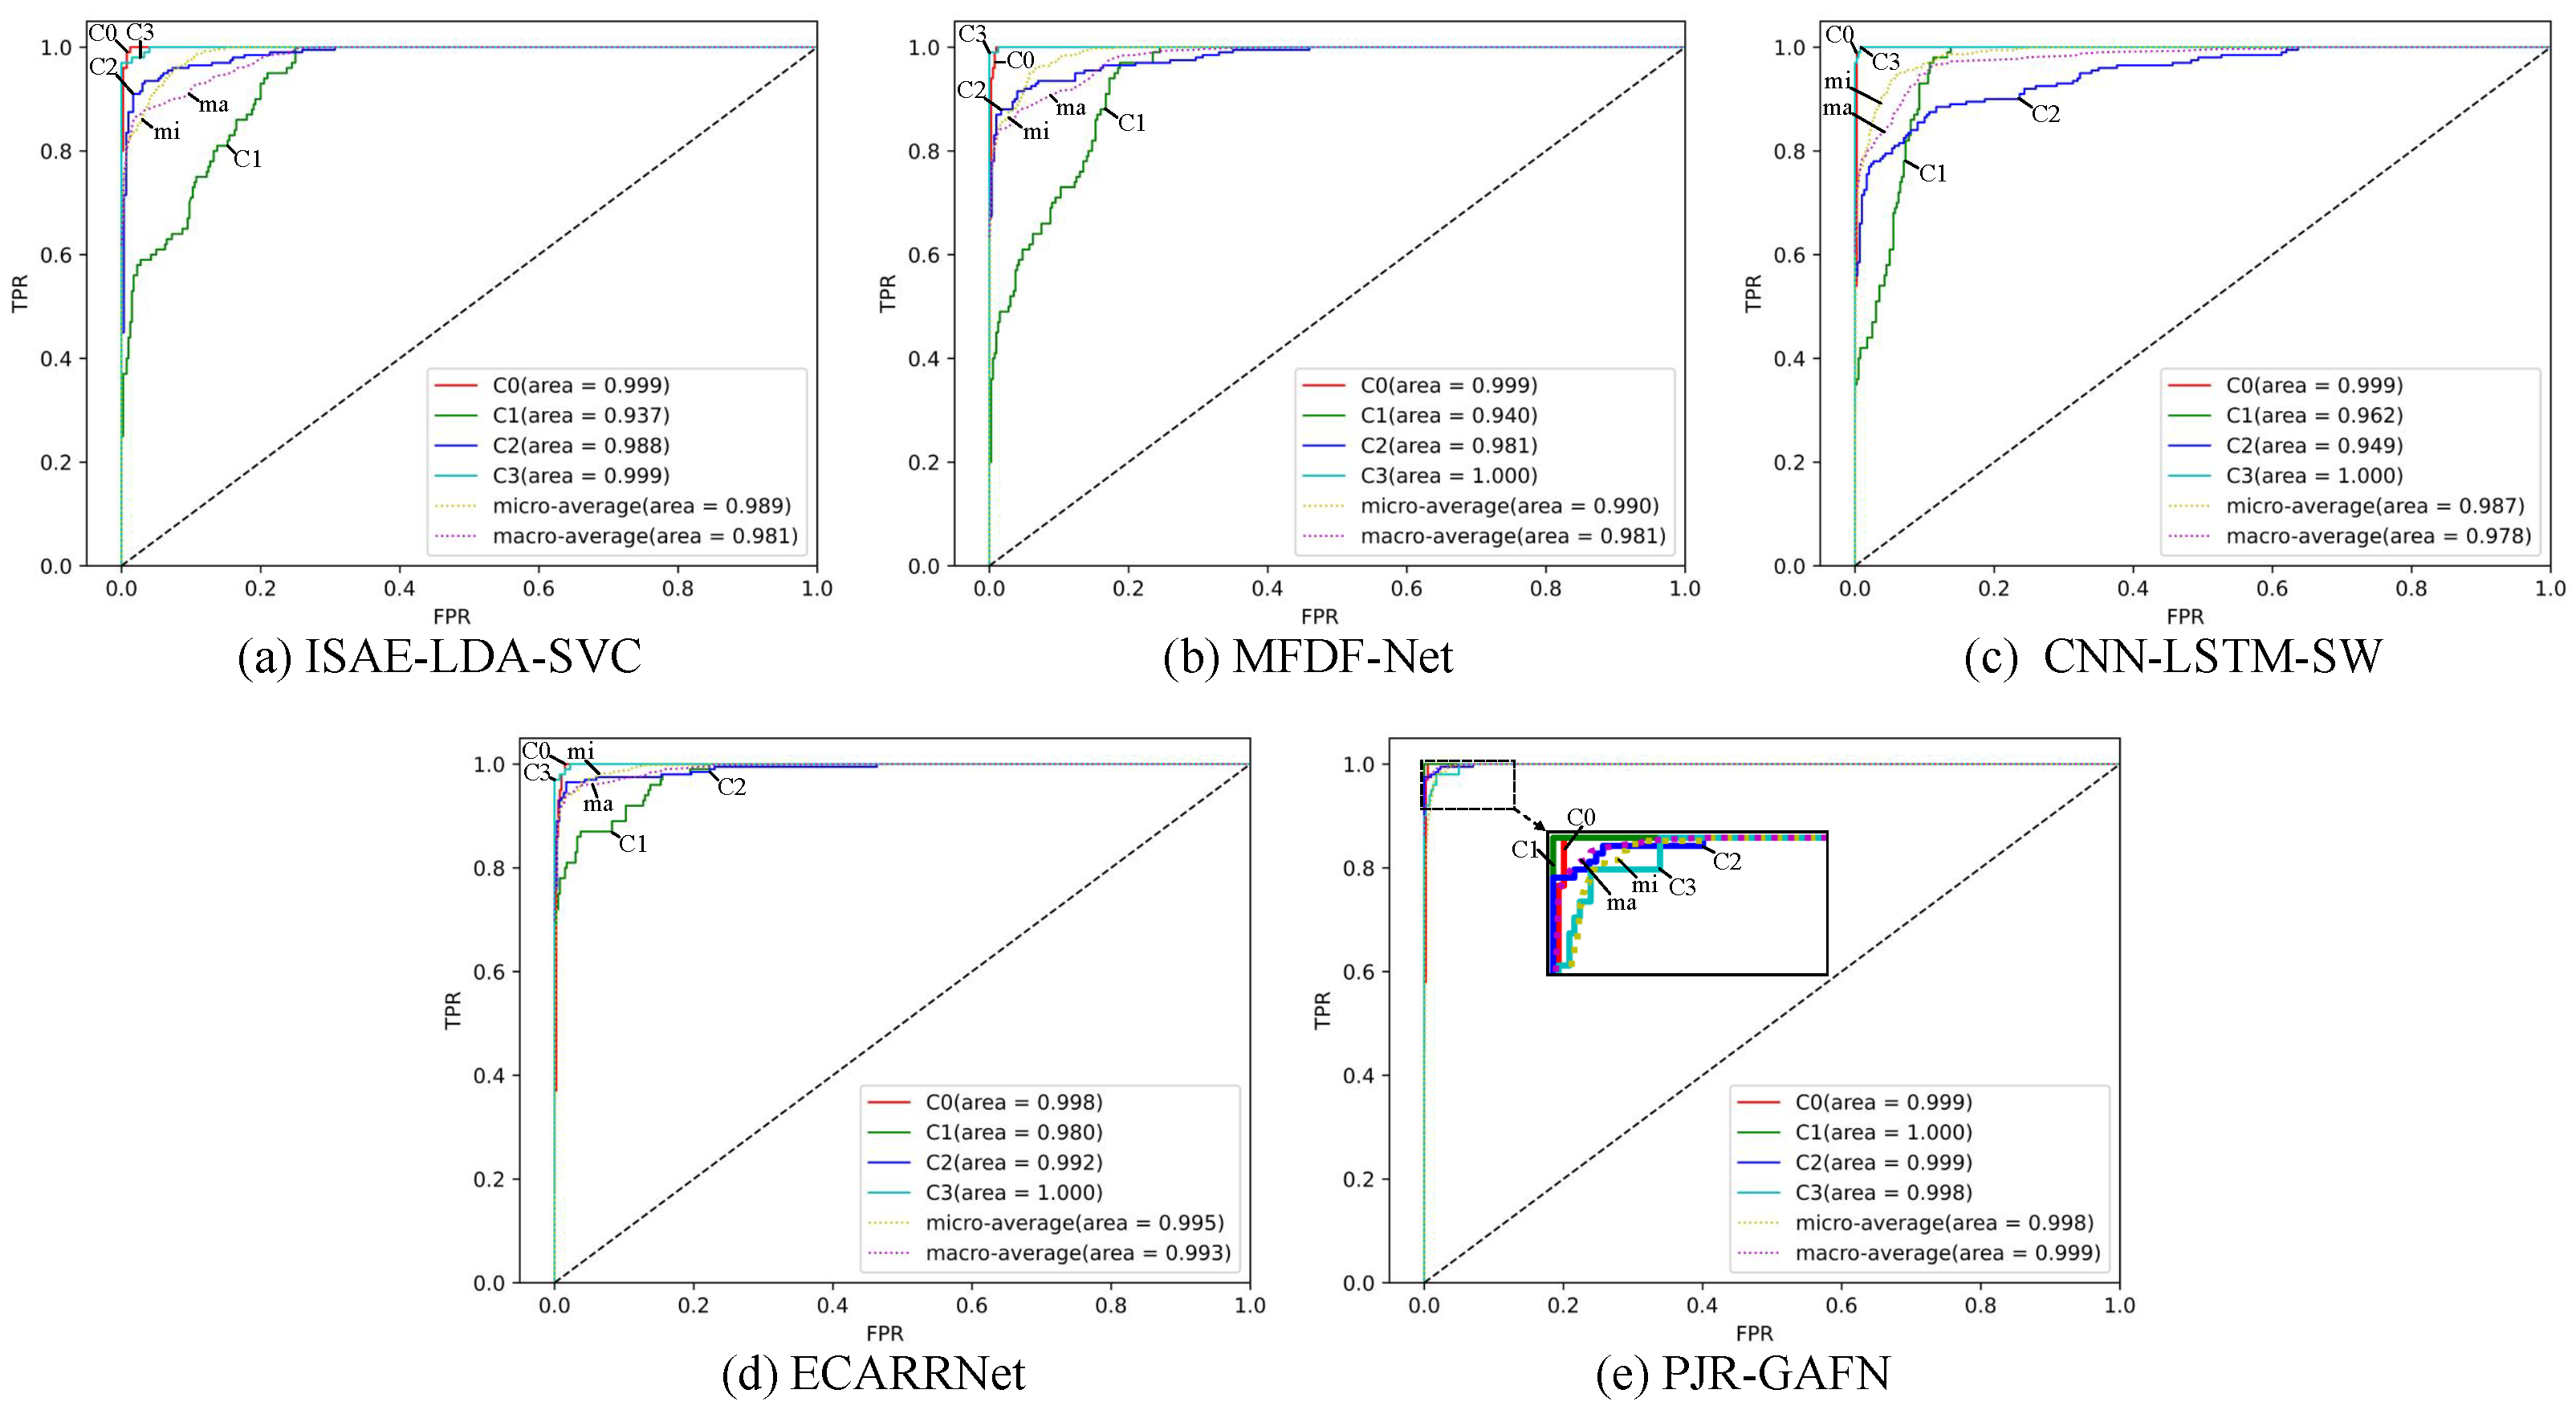
3.3. Comparative Experiments
3.4. Ablation Study
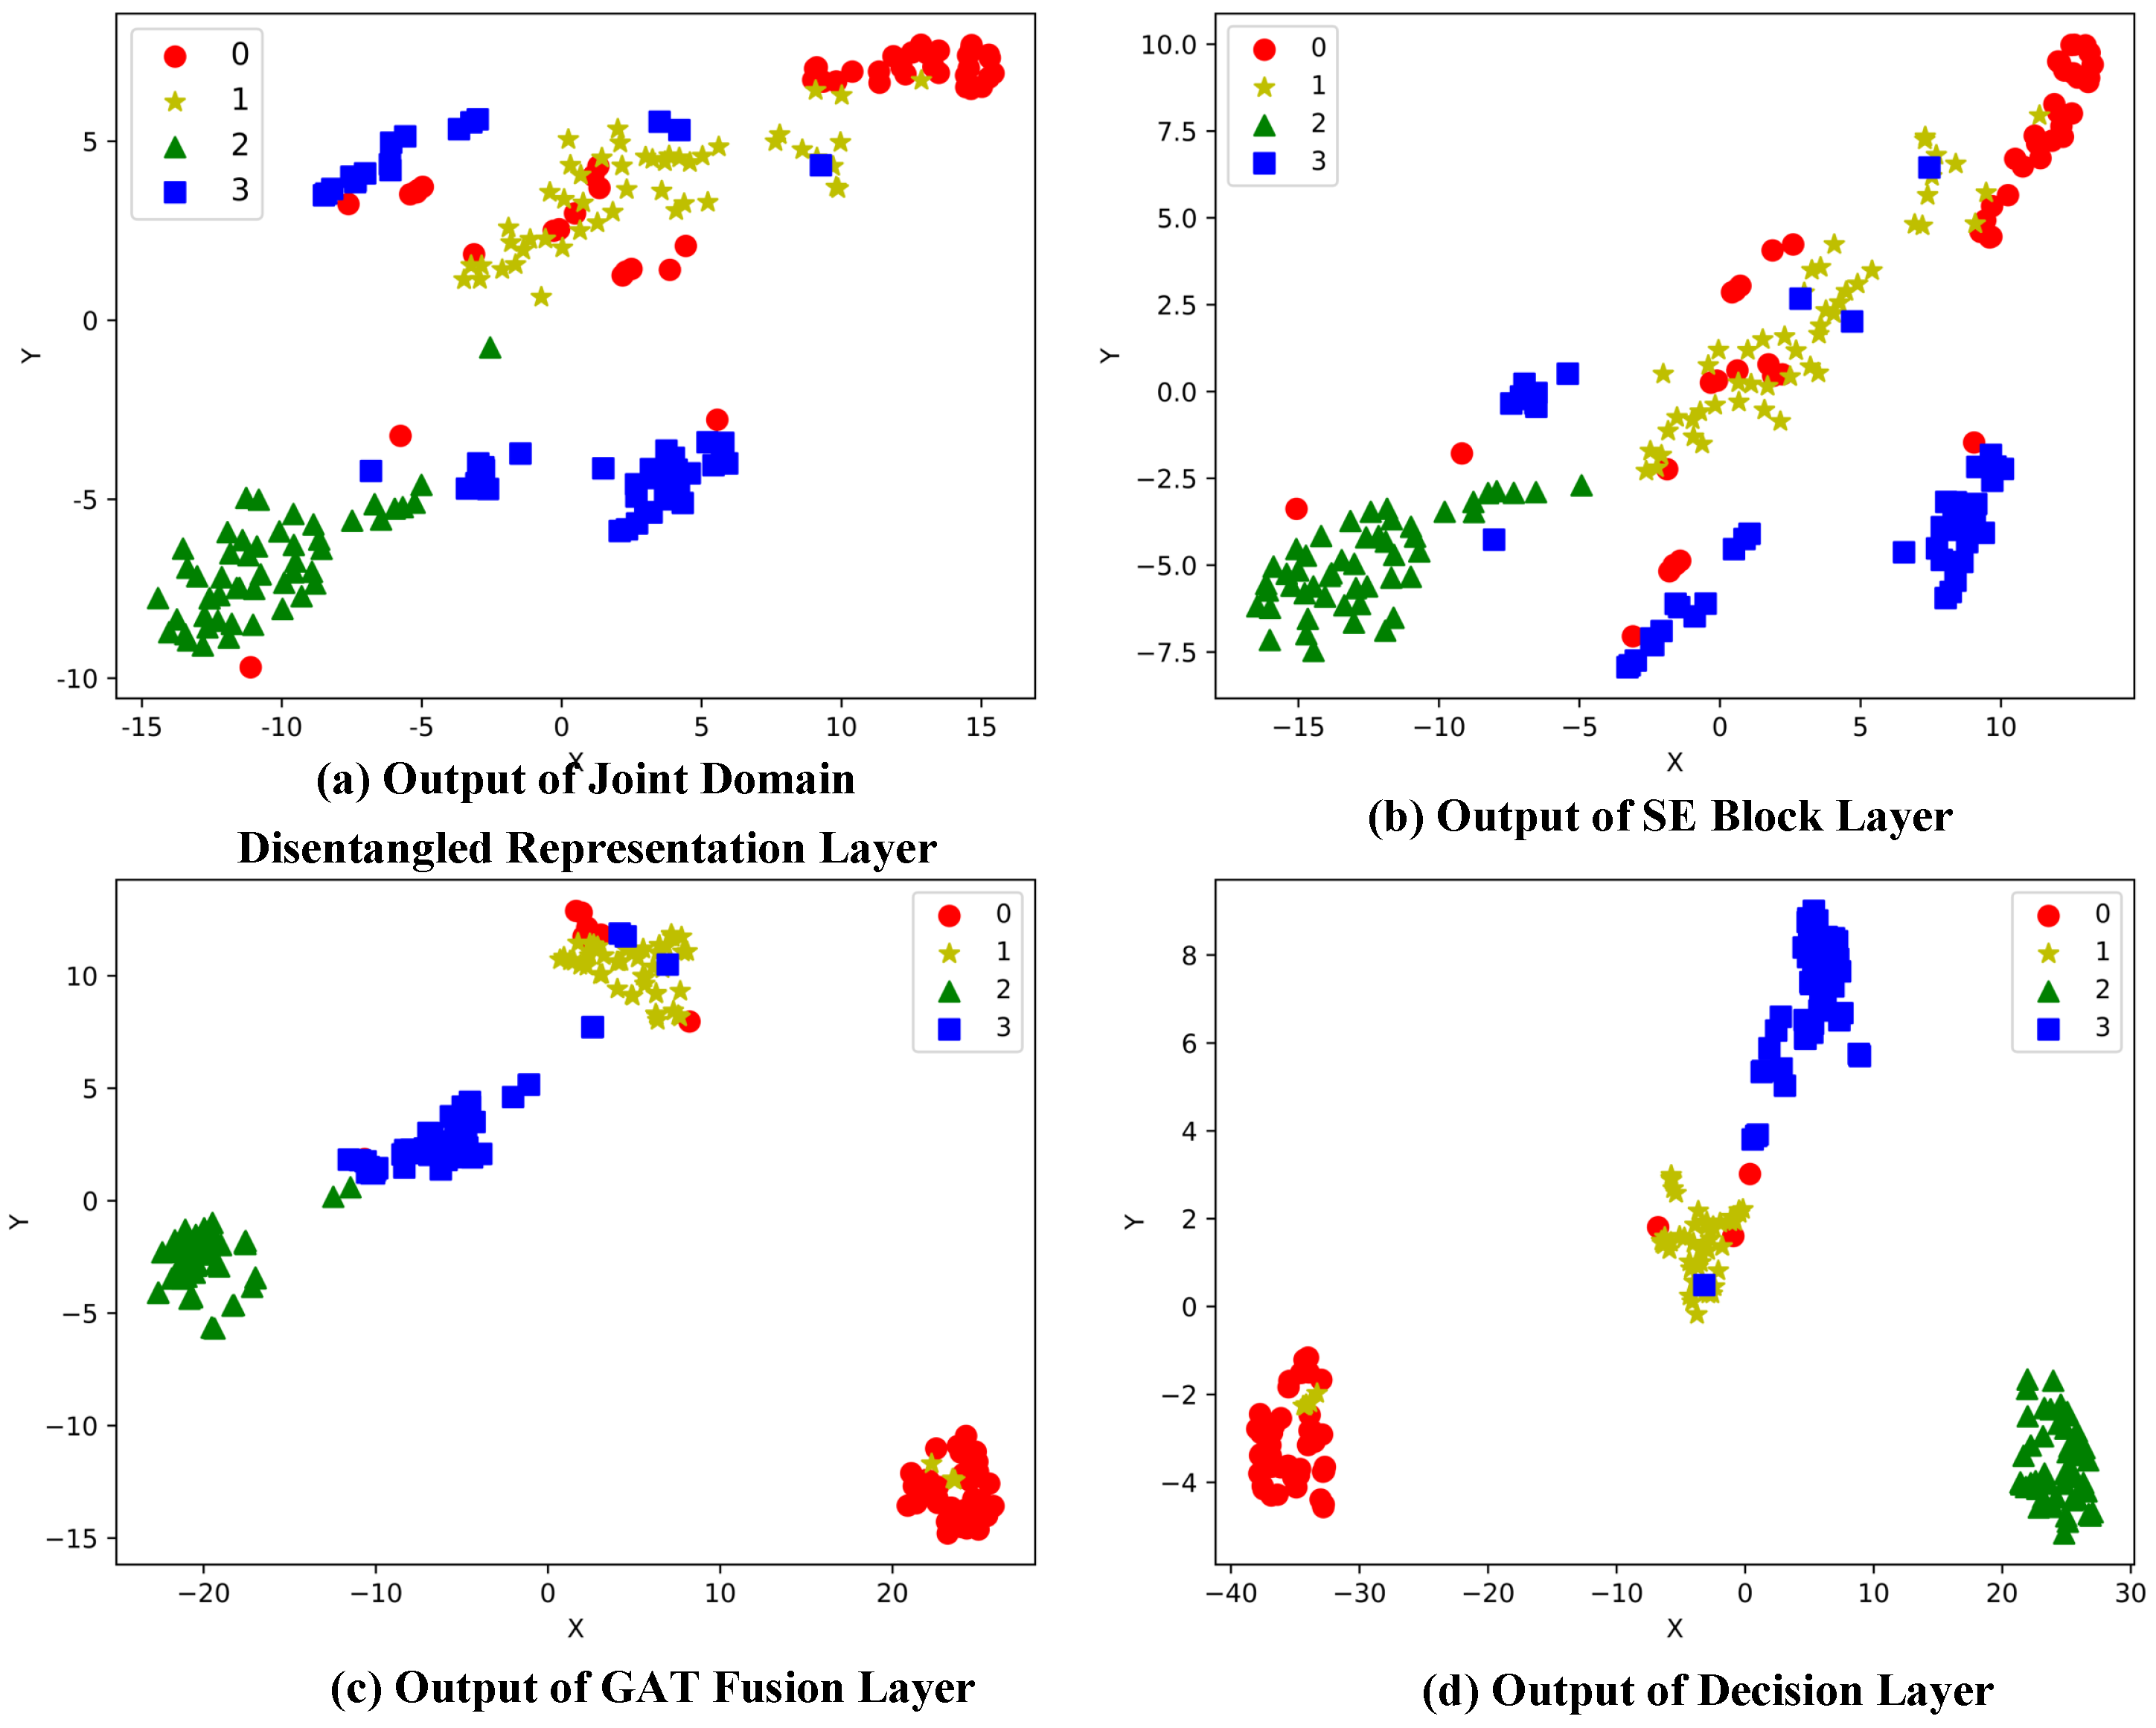
3.5. Model Explainability Analysis
3.6. Generalization Experiment
4. Conclusions
Author Contributions
Funding
Data Availability Statement
Conflicts of Interest
References
- Fenling, F.; Ailan, L.; Qiying, H.; Yinchen, Z. Strategy analysis on railway insured transportation and freight insurance cooperative development based on Hotelling model. J. Railw. Sci. Eng. 2023, 20, 356–363. [Google Scholar] [CrossRef]
- Xu, Y.; Liu, J.; Li, X.; Tang, C. An Investigation of Vibrations of a Flexible Rotor System with the Unbalanced Force and Time-Varying Bearing Force. Chin. J. Mech. Eng. 2025, 38, 25. [Google Scholar] [CrossRef]
- Binder, M.; Mezhuyev, V.; Tschandl, M. Predictive Maintenance for Railway Domain: A Systematic Literature Review. IEEE Eng. Manag. Rev. 2023, 51, 120–140. [Google Scholar] [CrossRef]
- Li, Z.; Bai, Q.; Wang, F.; Liu, R. Real-Time Detection System of Rail Surface Defects Based on Semantic Segmentation. Comput. Eng. Appl. 2021, 57, 248–256. [Google Scholar]
- Shen, Y.; Zhong, Q.; Zheng, S.; Li, L.; Peng, L. A Multi-Modal Approach to Rail Surface Condition Analysis: The MFDF-Net. IEEE Access 2024, 12, 132480–132494. [Google Scholar] [CrossRef]
- Chen, Z.; Wang, Q.; He, Q.; Yu, T.; Zhang, M.; Wang, P. CUFuse: Camera and Ultrasound Data Fusion for Rail Defect Detection. IEEE Trans. Intell. Transp. Syst. 2022, 23, 21971–21983. [Google Scholar] [CrossRef]
- LeCun, Y.; Bengio, Y.; Hinton, G. Deep learning. Nature 2015, 521, 436–444. [Google Scholar] [CrossRef] [PubMed]
- Schmidhuber, J. Deep learning in neural networks: An overview. Neural Netw. 2015, 61, 85–117. [Google Scholar] [CrossRef] [PubMed]
- Ge, X.; Cao, Z.; Qin, Y.; Gao, Y.; Lian, L.; Bai, J.; Yu, H. An Anomaly Detection Method for Railway Track Using Semisupervised Learning and Vision-Lidar Decision Fusion. IEEE Trans. Instrum. Meas. 2024, 73, 1–15. [Google Scholar] [CrossRef]
- Yang, J.; Zhou, W.; Wu, R.; Fang, M. CSANet: Contour and Semantic Feature Alignment Fusion Network for Rail Surface Defect Detection. IEEE Signal Process. Lett. 2023, 30, 972–976. [Google Scholar] [CrossRef]
- Wang, Q.; Wang, X.; He, Q.; Huang, J.; Huang, H.; Wang, P.; Yu, T.; Zhang, M. 3D tensor-based point cloud and image fusion for robust detection and measurement of rail surface defects. Autom. Constr. 2024, 161, 105342. [Google Scholar] [CrossRef]
- Piao, Y.; Ji, W.; Li, J.; Zhang, M.; Lu, H. Depth-Induced Multi-Scale Recurrent Attention Network for Saliency Detection. In Proceedings of the IEEE/CVF International Conference on Computer Vision (ICCV), Seoul, Republic of Korea, 27 October–2 November 2019. [Google Scholar]
- Zhao, H.; Zhao, J.; Zhao, X.; Wang, S.; Li, Y. Rail Surface Defect Method Based on Bimodal-Modal Deep Learning. Comput. Eng. Appl. 2023, 59, 285–293. [Google Scholar]
- Liu, N.; Zhang, N.; Han, J. Learning Selective Self-Mutual Attention for RGB-D Saliency Detection. In Proceedings of the IEEE/CVF Conference on Computer Vision and Pattern Recognition (CVPR), Seattle, WA, USA, 13–19 June 2020. [Google Scholar]
- Yang, T.; Xu, T.; Cheng, Y.; Tang, Z.; Su, S.; Cao, Y. A fusion method based on 1D vibration signals and 2D images for detection of railway surface defects. In Proceedings of the 2023 3rd International Conference on Neural Networks, Information and Communication Engineering (NNICE), Guangzhou, China, 24–26 February 2023; pp. 282–286. [Google Scholar] [CrossRef]
- Hu, J.; Shen, L.; Sun, G. Squeeze-and-Excitation Networks. In Proceedings of the IEEE Conference on Computer Vision and Pattern Recognition (CVPR), Salt Lake City, UT, USA, 18–23 June 2018. [Google Scholar]
- Velickovic, P.; Cucurull, G.; Casanova, A.; Romero, A.; Lio, P.; Bengio, Y. Graph attention networks. arXiv 2017, arXiv:1710.10903. [Google Scholar]
- Choi, J.Y.; Han, J.M. Deep Learning (Fast R-CNN)-Based Evaluation of Rail Surface Defects. Appl. Sci. 2024, 14, 1874. [Google Scholar] [CrossRef]
- Wang, M.; Zhou, Y. Autonomous Rail Surface Defect Identification Based on an Improved One-Stage Object Detection Algorithm. J. Perform. Constr. Facil. 2024, 38, 04024041. [Google Scholar] [CrossRef]
- Rahman, M.A.; Jamal, S.; Taheri, H. Remote condition monitoring of rail tracks using distributed acoustic sensing (DAS): A deep CNN-LSTM-SW based model. Green Energy Intell. Transp. 2024, 3, 100178. [Google Scholar] [CrossRef]
- Eunus, S.I.; Hossain, S.; Ridwan, A.E.M.; Adnan, A.; Islam, M.S.; Karim, D.Z.; Alam, G.R.; Uddin, J. ECARRNet: An Efficient LSTM-Based Ensembled Deep Neural Network Architecture for Railway Fault Detection. AI 2024, 5, 482–503. [Google Scholar] [CrossRef]
- Lessmeier, C.; Kimotho, J.K.; Zimmer, D.; Sextro, W. Condition monitoring of bearing damage in electromechanical drive systems by using motor current signals of electric motors: A benchmark data set for data-driven classification. In Proceedings of the PHM Society European Conference, Chengdu, China, 19–21 October 2016; Volume 3. [Google Scholar]

| Model Type | Data Type | Method | Accuracy/% |
|---|---|---|---|
| Single-Modality Non-Fusion | Image | Fast R-CNN [18] | 83.0 |
| MRC-CSN [19] | 83.5 | ||
| Multimodal Fusion | Image, Vibration | ISAE-LDA-SVC [15] | 93.5 |
| Image, Vibration | MFDF-Net [5] | 91.5 | |
| Image, Vibration | CNN-LSTM-SW [20] | 91.0 | |
| Image, Vibration | ECARRNet [21] | 94.0 | |
| Image, Vibration | PJR-GAFN | 95.0 |
| Experiment Type | Ablated Component | Accuracy (%) |
|---|---|---|
| Network Structure Ablation | Missing Squeeze-and-Excitation (SE) Module | 93.5 |
| Missing Progressive Fusion Module | 93.5 | |
| Missing Graph Attention Fusion Module | 85.0 | |
| Loss Function Ablation | Missing Domain-Adversarial Loss | 93.0 |
| Missing Joint Domain Disentangled Representation Loss | 92.0 | |
| Baseline Model | 95.0 |
| Serial Number | Type | Position | Form | Degree |
|---|---|---|---|---|
| K001 | Normal | – | – | – |
| KA04 | Bearing Fault | Outer Ring | Single Point | 1 |
| KA15 | Plastic Deformation | Outer Ring | Single Point | 1 |
| KB23 | Bearing Fault | Inner and Outer Rings | Multiple Points | 2 |
| KI21 | Bearing Fault | Inner Ring | Single Point | 1 |
| Model Type | Data Type | Method | Accuracy (%) |
|---|---|---|---|
| Multimodal Fusion | Electrical, Vibration | ISAE-LDA-SVC | 97.0 |
| Electrical, Vibration | MFDF-Net | 98.0 | |
| Electrical, Vibration | CNN-LSTM-SW | 96.8 | |
| Electrical, Vibration | ECARRNet | 98.2 | |
| Electrical, Vibration | PJR-GAFN | 99.8 |
Disclaimer/Publisher’s Note: The statements, opinions and data contained in all publications are solely those of the individual author(s) and contributor(s) and not of MDPI and/or the editor(s). MDPI and/or the editor(s) disclaim responsibility for any injury to people or property resulting from any ideas, methods, instructions or products referred to in the content. |
© 2025 by the authors. Licensee MDPI, Basel, Switzerland. This article is an open access article distributed under the terms and conditions of the Creative Commons Attribution (CC BY) license (https://creativecommons.org/licenses/by/4.0/).
Share and Cite
Wang, Z.; Peng, S.; Ao, W.; Liu, J.; Zhang, C. Rail Surface Defect Diagnosis Based on Image–Vibration Multimodal Data Fusion. Big Data Cogn. Comput. 2025, 9, 127. https://doi.org/10.3390/bdcc9050127
Wang Z, Peng S, Ao W, Liu J, Zhang C. Rail Surface Defect Diagnosis Based on Image–Vibration Multimodal Data Fusion. Big Data and Cognitive Computing. 2025; 9(5):127. https://doi.org/10.3390/bdcc9050127
Chicago/Turabian StyleWang, Zhongmei, Shenao Peng, Wenxiu Ao, Jianhua Liu, and Changfan Zhang. 2025. "Rail Surface Defect Diagnosis Based on Image–Vibration Multimodal Data Fusion" Big Data and Cognitive Computing 9, no. 5: 127. https://doi.org/10.3390/bdcc9050127
APA StyleWang, Z., Peng, S., Ao, W., Liu, J., & Zhang, C. (2025). Rail Surface Defect Diagnosis Based on Image–Vibration Multimodal Data Fusion. Big Data and Cognitive Computing, 9(5), 127. https://doi.org/10.3390/bdcc9050127