1. Introduction
Industry 4.0 relies on advanced automation, artificial intelligence, and the Internet of Things (IoT) to optimize production and industrial system maintenance. In this context, anomaly detection plays a crucial role in identifying manufacturing defects and malfunctions before they compromise product quality or operational continuity. Here, anomaly detection is understood not merely as a classification task, but rather as the identification of rare and critical deviations from expected patterns, emphasizing the detection of subtle irregularities rather than broad categorical assignments. As highlighted by Lee et al. [
1], Cyber-Physical Systems (CPS) are central to this transformation, enabling real-time interaction between digital models and physical production systems. Smart manufacturing frameworks, as outlined by Lu and Weng [
2], incorporate intelligent algorithms to monitor, analyze, and improve quality processes.
Image-based quality control is a key component of this digital evolution. By detecting and eliminating defective products before they reach the market, it helps companies avoid reputational risks associated with non-compliant products. A missed defect can lead to costly recalls, loss of customer trust, and potential regulatory penalties. Thanks to advances in computer vision and deep learning, visual inspection can now be automated with greater accuracy and speed. Unlike manual inspections, which are costly and prone to human error, AI-based systems detect subtle defects and provide full traceability in production. This approach is widely used in sectors such as electronics, automotive, and aerospace, where strict quality standards apply.
However, industrial anomaly detection poses several challenges. A major limitation is the rarity of defects, which creates severe class imbalances in datasets. Supervised deep learning methods become ineffective when abnormal examples are scarce, making unsupervised and self-supervised methods more suitable in industrial settings. As described by Ruff et al. [
3], a wide spectrum of anomaly detection strategies exists—ranging from shallow statistical methods to deep neural networks—each offering different trade-offs between interpretability and performance.
Moreover, variability in imaging conditions (e.g., lighting, viewing angles, and production parameters) affects the appearance of normal samples, further complicating defect detection. In addition, data confidentiality and infrastructure constraints in industry often require local, on-premises processing, which limits access to powerful computing resources. This necessitates the use of lightweight and efficient models to ensure real-time inference without compromising production throughput. As Sultani et al. [
4] pointed out in a different context, anomaly detection methods must remain reliable even in environments where anomalous events are rare and diverse.
Beyond manufacturing, similar computational and detection challenges are encountered in other critical sectors such as healthcare. In both industrial and medical applications, the constraints on energy consumption, latency, and data privacy demand the development of efficient and robust anomaly detection methods. In these contexts, minimizing false negatives—i.e., the ability to detect all critical anomalies—is particularly crucial to ensure safety, prevent severe failures, and protect human lives.
This study focuses specifically on industrial quality control through visual inspection, particularly in the context of manufacturing processes involving objects or materials. The evaluated methods are tested on representative data drawn from the MVTec AD dataset [
5], which includes components commonly found in mechanical and material-based production, such as metal parts, screws, bottles, or fabrics. In practical applications, this often translates to detecting misplaced screws on printed circuit boards (PCBs), incorrectly aligned electronic components, or surface defects such as scratches or contaminants that can jeopardize the functionality or reliability of manufactured products. This selection reflects practical use cases typical of Industry 4.0 environments, where precision in defect detection and computational efficiency are critical.
We conduct a comparative analysis of ten anomaly detection methods tailored for image-based quality control. The evaluation focuses on their ability to detect complex anomalies, their robustness to data variations, and their computational efficiency. The selected methods encompass a diverse set of state-of-the-art approaches, including reconstruction-based models, feature extraction methods, and techniques with or without synthetic anomaly generation. The selection was motivated by their recognition in recent literature, the availability of open-source implementations, and their relevance to industrial applications. All methods were evaluated on a dataset representative of manufacturing environments, ensuring that their performance reflects real-world industrial conditions. It is also important to note that all selected methods are designed to be trained exclusively on normal (defect-free) data, aligning with the industrial reality where anomalous examples are rare, unlabeled, or difficult to collect. The primary objective is to identify approaches that maximize detection performance while minimizing false positives, thereby avoiding unnecessary rejection of compliant products and reducing operational costs.
The remainder of this paper is organized as follows.
Section 2 presents the categorization framework used to classify the anomaly detection methods.
Section 3 details the experimental protocol, including the dataset, training procedures, and evaluation metrics.
Section 4 discusses the comparative results across different object types and analyzes the environmental and computational impacts of the methods. Finally,
Section 5 provides a general discussion of the findings, and
Section 6 concludes the paper with practical recommendations and perspectives for future work.
2. Categorization of Anomaly Detection Methods
We operate under the assumption that no abnormal samples are accessible during training. This constraint forces models to rely solely on normal samples, significantly influencing the choice of approaches and their ability to generalize to previously unseen defects.
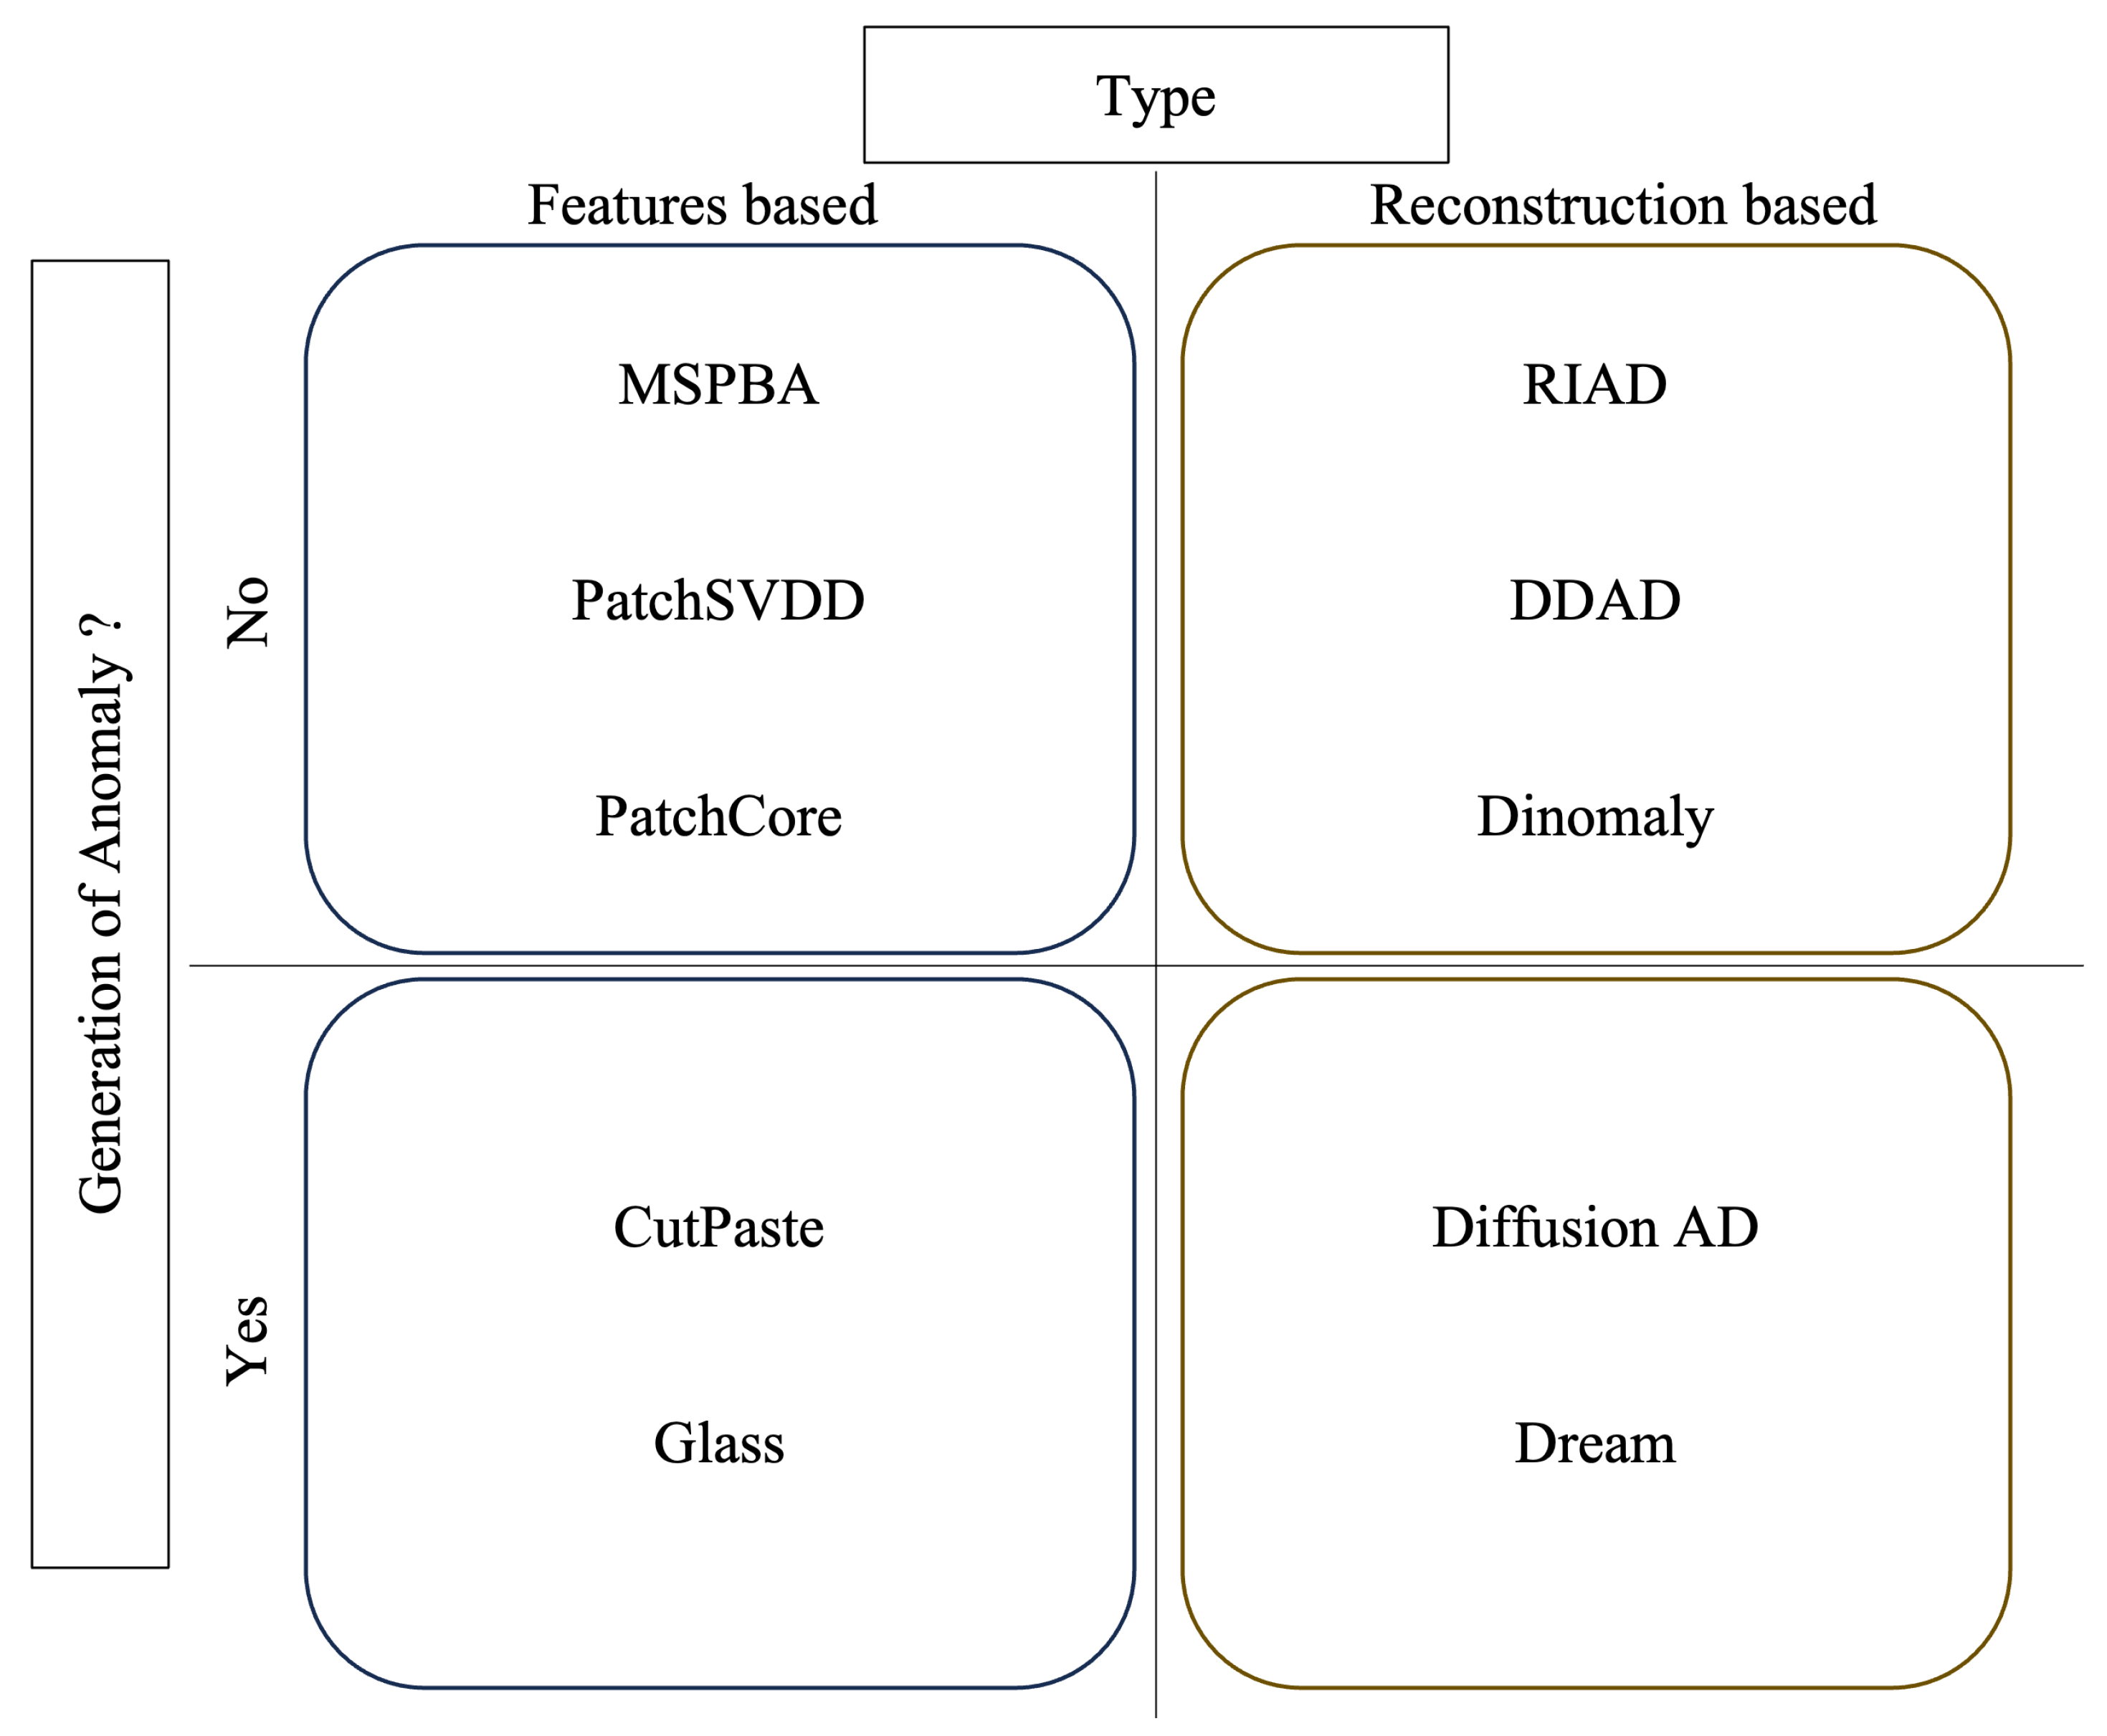
To better understand the differences between various anomaly detection approaches, we propose a categorization based on two main axes. The first axis distinguishes methods based on the use of synthetic anomalies: some approaches generate artificial anomalies to support training, while others rely exclusively on normal samples. The second axis focuses on the detection strategy: either based on image reconstruction or on the extraction of discriminative features. This dual categorization provides a structured framework to evaluate the strengths and limitations of each method with respect to the specific constraints of industrial quality control.
The following sections present this categorization in detail and introduce the ten evaluated methods, structured according to the two axes defined above.
2.1. Synthetic vs. Real Anomaly Generation
One of the main challenges in anomaly detection is the scarcity or even the absence of abnormal samples during training. Given the rarity or unavailability of genuine anomalies, some methods address this limitation by generating synthetic anomalies to enrich the training process. However, creating realistic and diverse anomalies remains a significant challenge, as industrial defects can vary widely, from microcracks to texture or color variations and assembly defects. This diversity makes it difficult to produce synthetic anomalies that accurately reflect the defects encountered in production. Moreover, overly simplistic anomaly generation techniques often fail to capture the full variability of real-world anomalies, which can reduce the effectiveness of these methods.
To address this issue, different anomaly generation approaches have been developed. Some methods overlay artificial textures onto the original image using randomly generated masks to simulate surface defects. Others adopt a copy-paste approach, where a region of the image is duplicated and repositioned, creating structural inconsistencies. These techniques help diversify synthetic anomalies and improve models’ generalization capabilities, though the quality of the generated anomalies directly impacts real-world detection performance.
Some methods require artificial anomaly generation for training, while others rely solely on normal samples. Methods generating synthetic anomalies are particularly useful when real defects are rare or difficult to collect, but their effectiveness depends on the quality and representativeness of the synthetic data. In contrast, methods trained exclusively on normal data exploit statistical deviations or latent space representations to detect anomalies without requiring abnormal samples. These approaches are often preferred in environments where generating realistic anomalies is impractical or costly.
2.2. Reconstruction-Based vs. Feature-Based Approaches
Anomaly detection methods also differ in how they identify abnormal patterns. Some rely on image reconstruction and analyze discrepancies between the original and reconstructed versions, while others directly extract discriminative features to distinguish normal and abnormal samples.
Reconstruction-based approaches rely on the observation that models trained only on normal images reconstruct them accurately, but tend to fail in reconstructing images containing anomalies. The difference between the input and its reconstruction indicates the presence of a defect. This strategy is particularly effective for detecting subtle anomalies that are difficult to characterize with fixed descriptors. However, it can struggle when certain anomalies are reconstructed too faithfully, making them harder to detect.
Feature-based approaches, by contrast, learn feature representations where anomalies naturally deviate from normal samples. These methods generally provide faster inference times by avoiding the need for full image reconstruction. However, they may be sensitive to natural variations in the data that do not necessarily correspond to true anomalies. The choice between these two families of approaches depends both on the types of anomalies to detect and on the computational constraints of the target application.
2.3. Overview of Anomaly Detection Methods
This section briefly presents the ten studied methods, categorized according to the previously defined framework, and illustrated in
Figure 1.
2.3.1. Anomaly Generation and Feature-Based Approaches
GLASS [
6] introduces synthetic anomalies by applying two complementary strategies: local transformations mix a texture image with the original image using a random mask to simulate surface defects, while global transformations inject Gaussian noise directly into the feature space to disrupt latent representations. A WideResNet50 [
7] architecture is used to extract features from intermediate layers (Layer 2 and Layer 3), and an adapter network refines these features to enhance alignment between normal and abnormal samples. Finally, a discriminator network assigns an anomaly score that quantifies how much an image deviates from normality. In the original implementation, the test dataset was mistakenly used during model selection, introducing data leakage and bias. This practice can artificially inflate performance metrics by allowing indirect adaptation to test data. To correct this issue, our evaluation restricts model selection strictly to the training set to ensure a rigorous and unbiased assessment.
CutPaste [
8] simulates synthetic anomalies by cutting a patch from an image and pasting it randomly elsewhere within the same image. The model is trained to classify whether an image has undergone such transformation. Several variants exist, such as CutPaste Scar, which generates linear cuts resembling scratches or cracks, and CutPaste 3-Way, combining multiple transformations to enhance anomaly diversity. In addition to image classification, CutPaste incorporates a Gaussian Density Estimator (GDE) that models the distribution of extracted features to better distinguish normal from abnormal images. The GDE estimates the likelihood of new feature vectors belonging to the normal distribution, strengthening anomaly detection alongside the CutPaste transformations. Since the official CutPaste code was unavailable, an unofficial reproduction was used, with validation indicating similar or improved performance relative to the original work.
2.3.2. Approaches Without Anomaly Generation and Feature-Based Detection
PatchCore [
9] extracts local features from normal images using a WideResNet50 backbone and stores a compact memory bank by selecting a representative subset of features (e.g., 10%). During inference, a test sample is compared to the nearest memory features, and an anomaly score is computed based on the minimum distance. This strategy minimizes memory consumption and accelerates inference while preserving detection accuracy.
PatchSVDD [
10] segments images into patches and embeds them into a compact feature space through self-supervised contrastive learning. A Support Vector Data Description (SVDD) model then encloses normal patch embeddings within a minimum-volume hypersphere. Anomalies are detected as patches that lie outside this hypersphere. Additionally, a pretext task requiring the prediction of the relative positions of patch pairs enhances the quality and structure of the learned features, improving anomaly localization.
MSPBA [
11] extends PatchSVDD by applying multi-scale analysis. It constructs K-Means clusters across patch features at three different resolutions rather than using a single hypersphere. This approach captures variations across different spatial scales and improves detection robustness in the presence of complex textures and defect patterns, as typically encountered in industrial scenarios.
2.3.3. Approaches with Anomaly Generation and Reconstruction-Based Detection
DRAEM [
12] combines an autoencoder trained for normal image reconstruction with a segmentation network trained to detect discrepancies. Synthetic anomalies are introduced during training by applying external textures and color perturbations using random masks. The autoencoder reconstructs the unaltered image, while the segmentation module learns to identify regions that differ between the original and reconstructed images, producing detailed anomaly maps.
DiffusionAD [
13] relies on a probabilistic diffusion model, where Gaussian noise is progressively added to normal images during training, and the model learns to reverse this process to restore the original content. Synthetic anomalies are injected during training through random masking and external texture overlays. At inference, the model reconstructs a defect-free version of the input image, and a segmentation network identifies discrepancies, highlighting anomalies even in cases where reconstruction alone would be insufficient.
2.3.4. Approaches Without Anomaly Generation and Reconstruction-Based Detection
RIAD [
14] addresses anomaly detection through inpainting-based reconstruction. During training, random masks at three scales are applied to normal images, and the model learns to predict and restore the missing regions using a UNet-based [
15] encoder-decoder architecture. A similarity loss ensures that reconstructed regions preserve fine structural details. At inference, anomalies are identified by analyzing pixel-wise differences between the input and its reconstructed version.
DDAD [
16] employs a denoising diffusion model, guiding the reconstruction process by conditioning it on the original input image. Anomalies are detected by calculating discrepancies both at the pixel level and within an adapted feature space extracted by a pretrained network. An unsupervised domain adaptation step refines the feature extractor to better match the characteristics of industrial images generated during training, improving detection precision on unseen data.
Finally, Dinomaly [
17] adopts a hybrid approach based on feature consistency. The model compares latent representations extracted by an encoder (based on DinoV2 [
18]) and a decoder. For normal images, feature transformations are expected to remain consistent between the two stages. Discrepancies between encoder and decoder features serve as anomaly indicators, without requiring pixel-level reconstruction. This mechanism reduces the risk of anomalies being reconstructed too faithfully and improves detection robustness in complex settings.
2.4. Overview of Anomaly Detection Methods
While recent anomaly detection methods have achieved impressive performance improvements—sometimes reaching near-saturation on standard benchmarks—it is important to note that these performances are increasingly difficult to surpass. In particular, most existing works focus primarily on maximizing global metrics such as the AUROC. However, in industrial quality control applications, the primary concern is to minimize missed anomalies (false negatives), as undetected defects can have severe operational and financial consequences. Few methods explicitly address this need, suggesting that a shift toward evaluation strategies prioritizing anomaly recall over purely global optimization is necessary for realistic deployments.
Furthermore, two important methodological aspects deserve particular attention. First, methods that generate synthetic anomalies during training can enrich the diversity of defect types encountered and potentially improve generalization. However, they risk introducing unrealistic artifacts that do not accurately represent real-world defects, potentially biasing the model toward detecting "artificial" anomalies. On the other hand, methods that avoid synthetic anomalies better align with industrial constraints, where genuine anomalies are rare and diverse, but may suffer from limited exposure to defect variability during training.
Second, reconstruction-based approaches offer the advantage of detecting subtle, localized deviations from normality, making them effective for complex or small-scale defects. Nevertheless, these methods can inadvertently reconstruct anomalies too faithfully, reducing the difference between normal and abnormal images and complicating detection. Feature-based approaches circumvent this risk by learning directly discriminative representations but may be more sensitive to natural variations within the normal class. The choice between these strategies must therefore be guided by the specific operational priorities, such as defect criticality, data variability, and computational constraints.
3. Methodology
3.1. Materials
All models were trained under identical hardware conditions to ensure a fair and consistent performance comparison. Experiments were conducted on an HP OMEN computer equipped with an Intel Core i9-11900K processor (11th Gen, 3.50 GHz, 16 threads), an NVIDIA RTX 3090 GPU with 24 GB of VRAM, 64 GB of RAM, and 64 GB of swap memory.
3.2. Data and Parameters
The evaluation of the ten anomaly detection methods was performed using the MVTec Anomaly Detection dataset [
5], a widely recognized benchmark for industrial anomaly detection. It comprises 15 categories, including 10 object classes (e.g., bottle, cable, capsule, metal) and 5 texture classes (e.g., wood, fabric, leather).
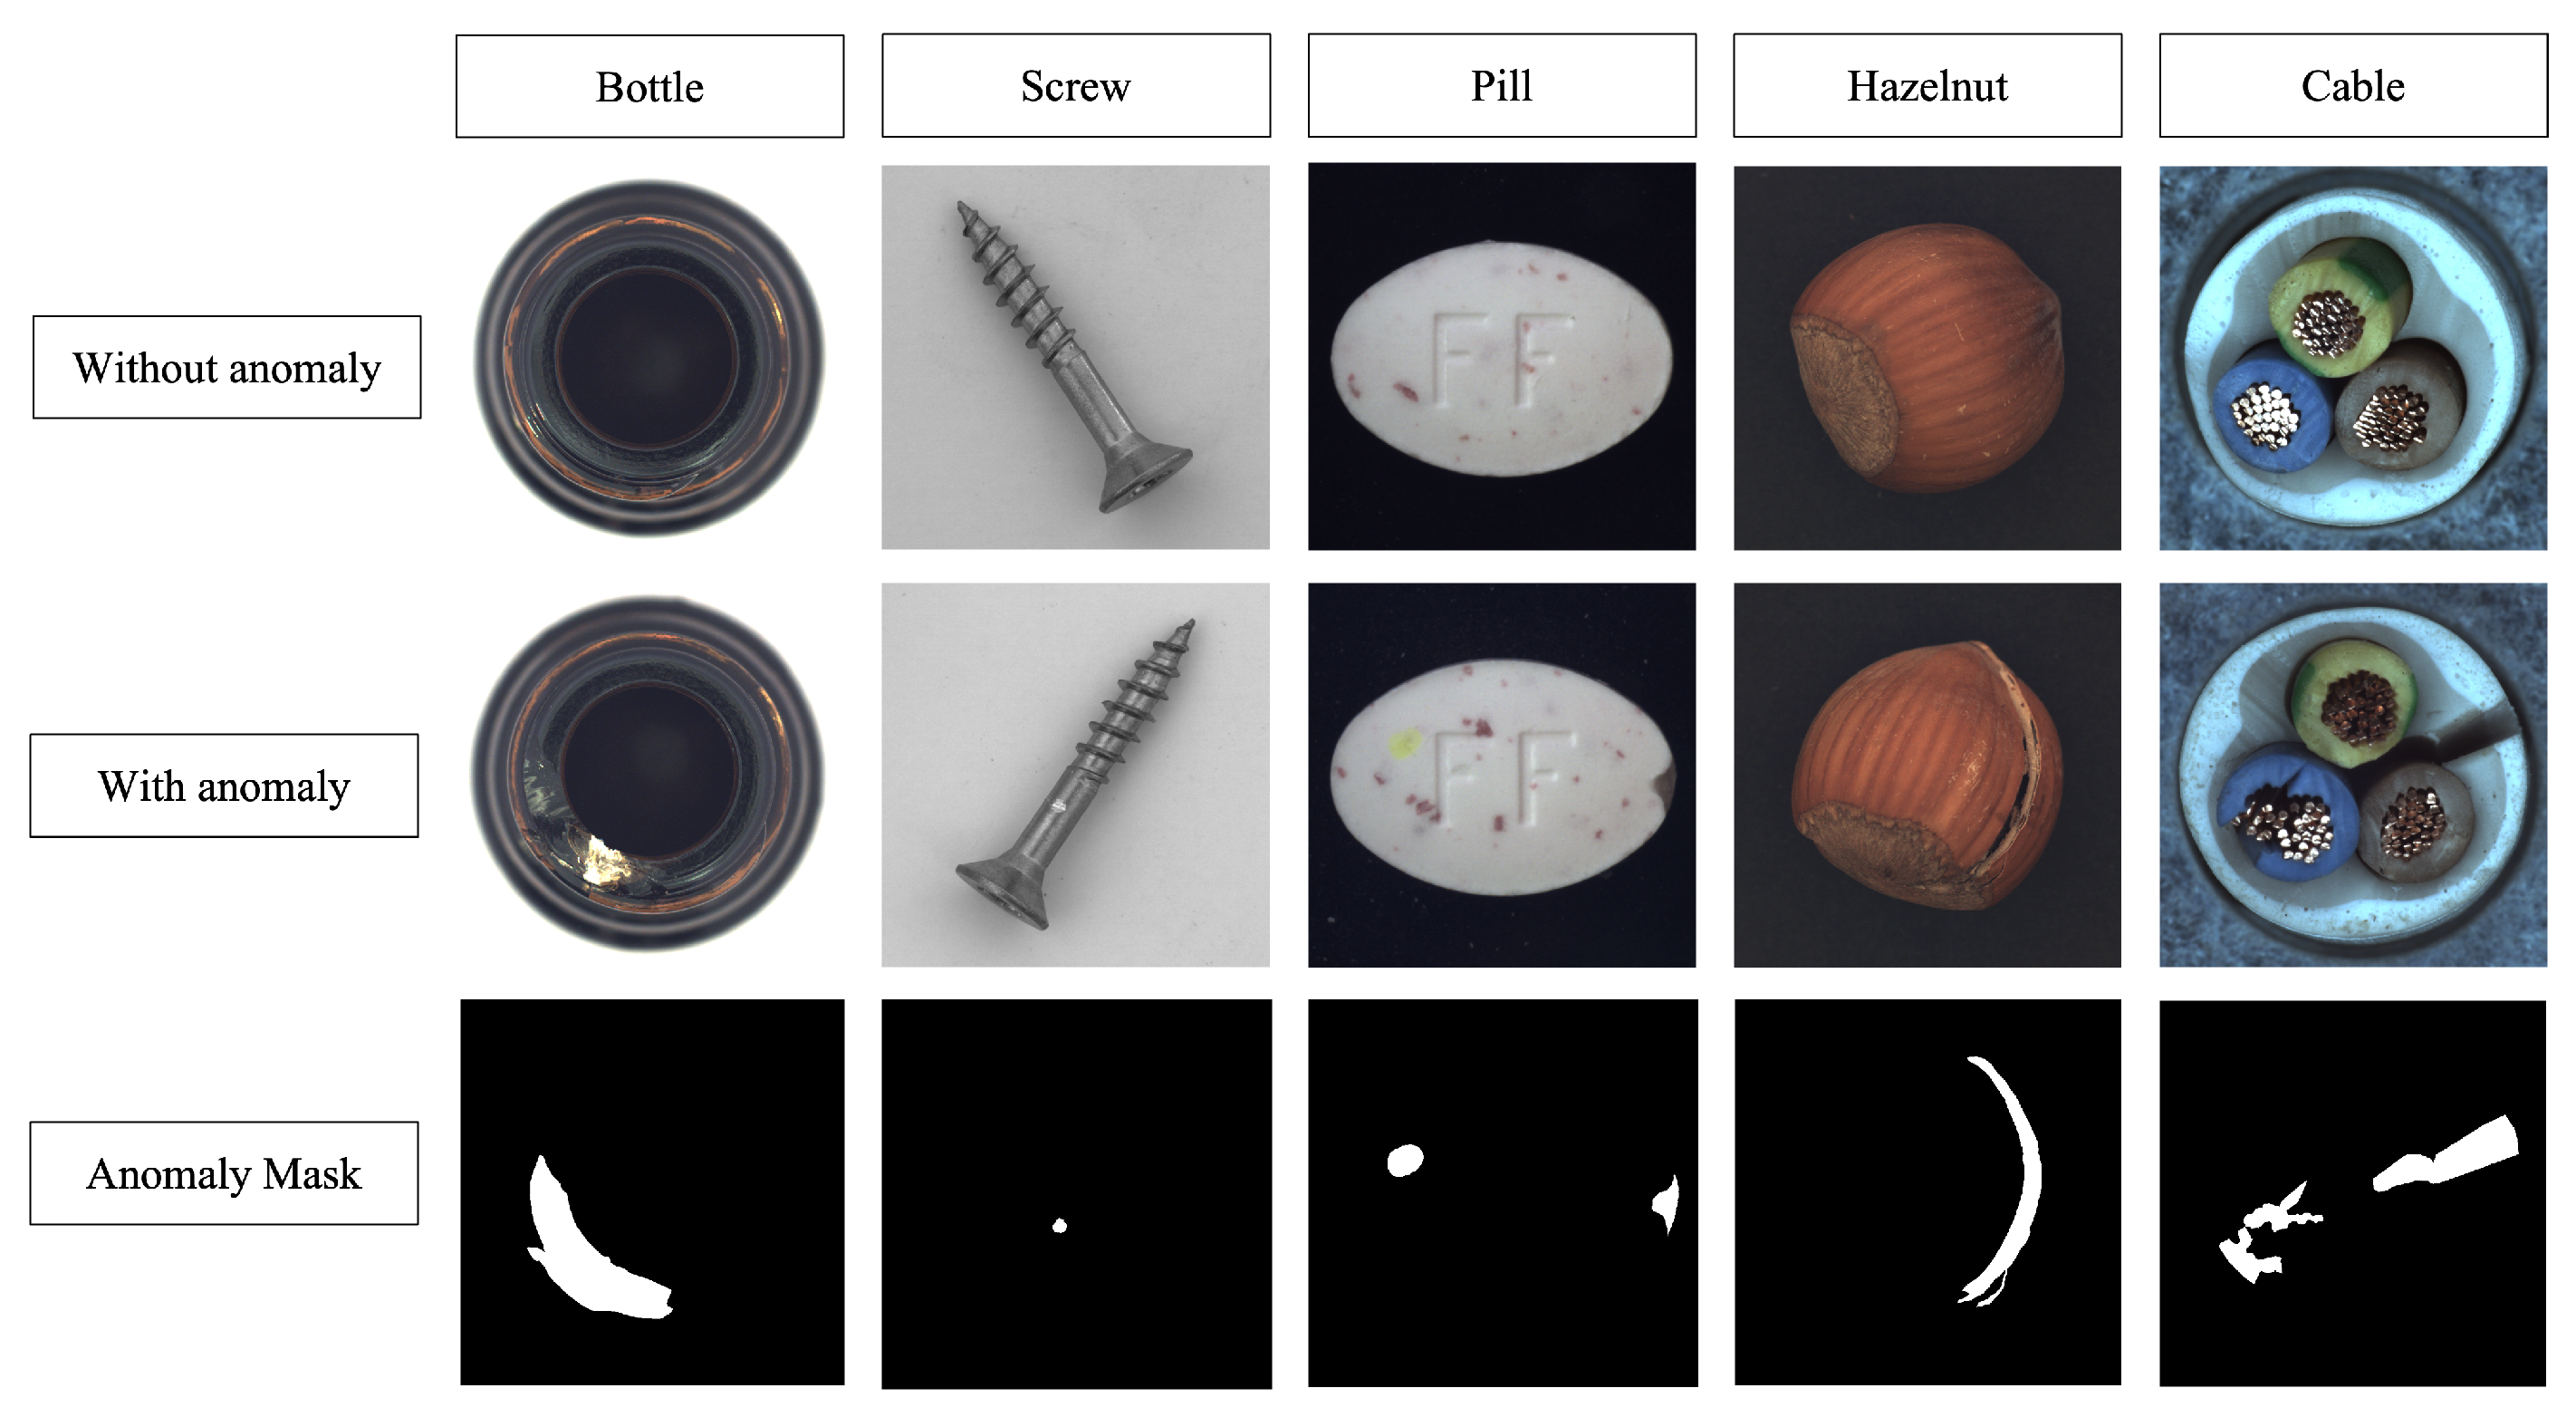
The training set contains only normal samples, while the test set includes both normal and anomalous images, as illustrated in
Figure 2. However, the test set is imbalanced, with normal images representing only 25% to 30% of the samples depending on the class. To ensure a more balanced and fair evaluation, we restructured the test set by transferring a portion of normal images from the training set to the test set.
Although this adjustment reduced the amount of training data, it enabled a more representative evaluation by restoring a better balance between normal and anomalous samples. Importantly, this rebalancing does not introduce bias: all normal images adhere to the same quality standards and are visually and functionally interchangeable. Thus, the selection of normal images for reallocation has no significant impact on the results.
All models were trained exclusively on normal images, following an unsupervised approach designed to learn the distribution of normal data and detect deviations. For methods requiring synthetic anomaly generation, the transformations described in their original publications were faithfully applied.
Additionally, we observed that some methods originally used test images during training, particularly for model selection based on test performance. To ensure proper experimental rigor, we corrected these practices by excluding all test images from training and validation phases. Final model evaluation was conducted exclusively on unseen test data.
Regarding hyperparameters, we adhered as closely as possible to the configurations recommended in the original publications to maintain consistency. However, in cases where the memory requirements exceeded the capabilities of the RTX 3090 GPU (24 GB of VRAM), we adapted the settings by first reducing the batch size. If necessary, we further decreased the input image resolution, maintaining a minimum of 256 × 256 pixels to preserve evaluation fidelity.
3.3. Metrics Evaluation
To comprehensively assess the anomaly detection methods, we categorize the evaluation metrics into three groups: Performance Metrics, Environmental Metrics, and Hardware Complexity Metrics.
3.3.1. Performance Metrics
These metrics measure the accuracy and robustness of the models based on standard classification and segmentation criteria.
Area Under the ROC Curve (AUC Image): This metric measures the model’s ability to distinguish between normal and anomalous images, corresponding to the area under the ROC (Receiver Operating Characteristic) curve, which plots the true positive rate (TPR) against the false positive rate (FPR). A value closer to 1.0 indicates better performance [
19].
Recall: Recall evaluates the proportion of correctly detected anomalies among all actual anomalies, defined as:
where
denotes true positives and
denotes false negatives. A high recall reflects effective anomaly detection but may also increase false positives [
20].
F1-Score: The F1-Score provides a harmonic mean of precision and recall, offering a balanced view of detection performance, particularly for imbalanced datasets. It is defined as:
Precision measures the proportion of true anomalies among detected anomalies, and recall measures the proportion of detected anomalies among all actual anomalies [
21].
Average Precision (AP): Average Precision evaluates the model’s average precision across all possible thresholds, computed as:
where
and
are the precision and recall at threshold
n. This metric is widely used in object detection and anomaly detection tasks [
22].
3.3.2. Environmental Metrics
Environmental metrics assess the ecological footprint associated with model training and inference. Specifically, we monitor:
Energy Consumption and Emissions: Energy usage is recorded throughout the training phase based on GPU power draw and total runtime. emissions are estimated using a standard emission factor of 0.475 kg /kWh, providing an approximate measure of the environmental impact. Reducing energy and emissions is critical for sustainable deployment at industrial scales.
3.3.3. Hardware Complexity Metrics
Hardware metrics quantify the computational demands of the models, focusing on the following aspects:
Inference Time: The time required for a model to process a single image or batch. Low inference times are crucial for real-time applications in industrial environments.
GPU Memory Usage: The amount of VRAM consumed during training and inference. Models with high memory usage may face deployment constraints, particularly on resource-limited hardware or edge devices.
Giga Multiply-Accumulate Operations (GMAC): GMAC quantifies the number of billions of operations (multiplications and additions) required during a single forward pass through the network. Higher GMAC values imply greater computational demands, which can impact execution time, energy efficiency, and hardware requirements. Thus, reducing computational complexity while maintaining detection performance remains a key optimization goal.
4. Results
This section presents the evaluation results of the ten anomaly detection methods under different conditions. First, the global performance is analyzed, followed by a detailed examination across three specific categories: fixed objects, rotating objects, and textures. Finally, the environmental impact and hardware complexity associated with each method are discussed.
4.1. Global Comparison of Anomaly Detection Methods
Table 1 summarizes the global performance of all evaluated methods across four key metrics: AUC, Recall, F1-Score, and Average Precision (AP). The ranking is based on the average results across the 15 classes of the MVTec AD dataset. A detailed breakdown of the results per class is provided in
Appendix A.
The results indicate that Dinomaly outperforms all other evaluated methods across every metric, demonstrating excellent robustness and detection accuracy. PatchCore follows closely, offering competitive performance with lower computational demands. GLASS achieves strong precision but a slightly lower recall, suggesting a tendency to miss certain anomalies. Conversely, methods such as RIAD and PatchSVDD exhibit significantly lower performance, making them less suitable for demanding industrial quality control tasks.
4.2. Performance on Fixed Objects
Table 2 presents the performance of the anomaly detection methods specifically on fixed objects, evaluated using the same four metrics: AUC, Recall, F1-Score, and Average Precision (AP).
Consistent with the global results, Dinomaly outperforms all other methods for fixed objects across all evaluated metrics. PatchCore again ranks second, confirming its robustness on static components. DDAD shows strong AUC and Recall values but a significant drop in F1-Score, indicating a lower precision. GLASS remains competitive for distinguishing anomalies but continues to exhibit slightly lower recall compared to Dinomaly and PatchCore. Lower-tier methods, such as RIAD and PatchSVDD, continue to show limited performance, suggesting poor generalization on fixed object categories.
4.3. Performance on Rotating Objects
Table 3 summarizes the performance of the evaluated methods on rotating objects, according to AUC, Recall, F1-Score, and Average Precision (AP).
PatchCore achieves the best performance on rotating objects, slightly outperforming Dinomaly in terms of recall and F1-Score. Both methods maintain excellent results across all evaluated metrics, confirming their robustness to rotational transformations. DRAEM and GLASS also deliver strong performance, particularly in AUC and AP. In contrast, methods such as RIAD and PatchSVDD exhibit significant drops in AUC and F1-Score, highlighting their vulnerability to rotational variations.
4.4. Performance on Textures
Table 4 presents the evaluation results of the anomaly detection methods specifically on texture categories.
Dinomaly achieves the highest performance on texture data, leading in AUC, F1-Score, and AP Image, while closely following DiffusionAD in recall. GLASS and PatchCore also exhibit strong results, with GLASS being particularly competitive in precision-oriented metrics. In contrast, RIAD and PatchSVDD consistently remain the least effective methods across all evaluated metrics.
4.5. Environmental Impact
Table 5 presents the environmental impact of each anomaly detection method. The metrics include total
emissions (in kilograms), total energy consumption (in kilojoules), and average GPU power consumption (in watts) during training.
The results show that feature extraction–based methods, such as PatchCore and CutPaste, are the most energy-efficient, with the lowest emissions and energy consumption. In contrast, models incorporating generative reconstruction processes, such as DiffusionAD and DRAEM, exhibit significantly higher environmental costs, driven by their increased computational complexity and GPU usage during training.
Another important observation is that models relying on synthetic anomaly generation (e.g., DiffusionAD, GLASS) tend to consume more energy than models trained without it. Although synthetic anomalies can improve accuracy in some contexts, they considerably raise the computational load and thus the environmental impact. For example, DiffusionAD produces 2.19 kg of CO2 emissions—equivalent to the carbon footprint of a 15–20 km car journey using a conventional vehicle or the electricity consumption of a European household over approximately 12–15 h. While these values may seem modest in isolation, they scale significantly when applied across large datasets or repeated training cycles in industrial settings.
Overall, feature extraction–based methods without synthetic anomaly generation emerge as the most sustainable and energy-efficient choice for industrial deployment.
4.6. Hardware Complexity and Computational Performance
Table 6 details the hardware requirements and computational complexity for each anomaly detection method. The metrics include training time (in seconds), inference time per image (in seconds), average GPU utilization during training (in %), model size (in megabytes), and GMAC (Giga Multiply-Accumulate Operations).
Feature extraction–based methods, such as PatchCore and CutPaste, show the best computational efficiency, with low training and inference times, minimal GPU utilization, and low GMAC values. In contrast, generative reconstruction–based methods, such as DiffusionAD, DDAD, and DRAEM, present significantly higher training costs and computational demands.
In several cases, the batch size had to be reduced to fit within available GPU memory, particularly for methods exceeding 90% GPU utilization, which typically require at least 24 GB of VRAM. While such methods remain feasible for deployment on high-performance industrial hardware, they are generally unsuitable for lightweight edge devices where resource constraints are stricter.
Dinomaly offers a strong compromise between speed, resource usage, and detection performance, making it particularly suitable for real-time deployment on mid-range industrial hardware.
Ultimately, model selection must balance detection performance with hardware constraints and energy considerations to ensure efficient and sustainable deployment in Industry 4.0 environments.
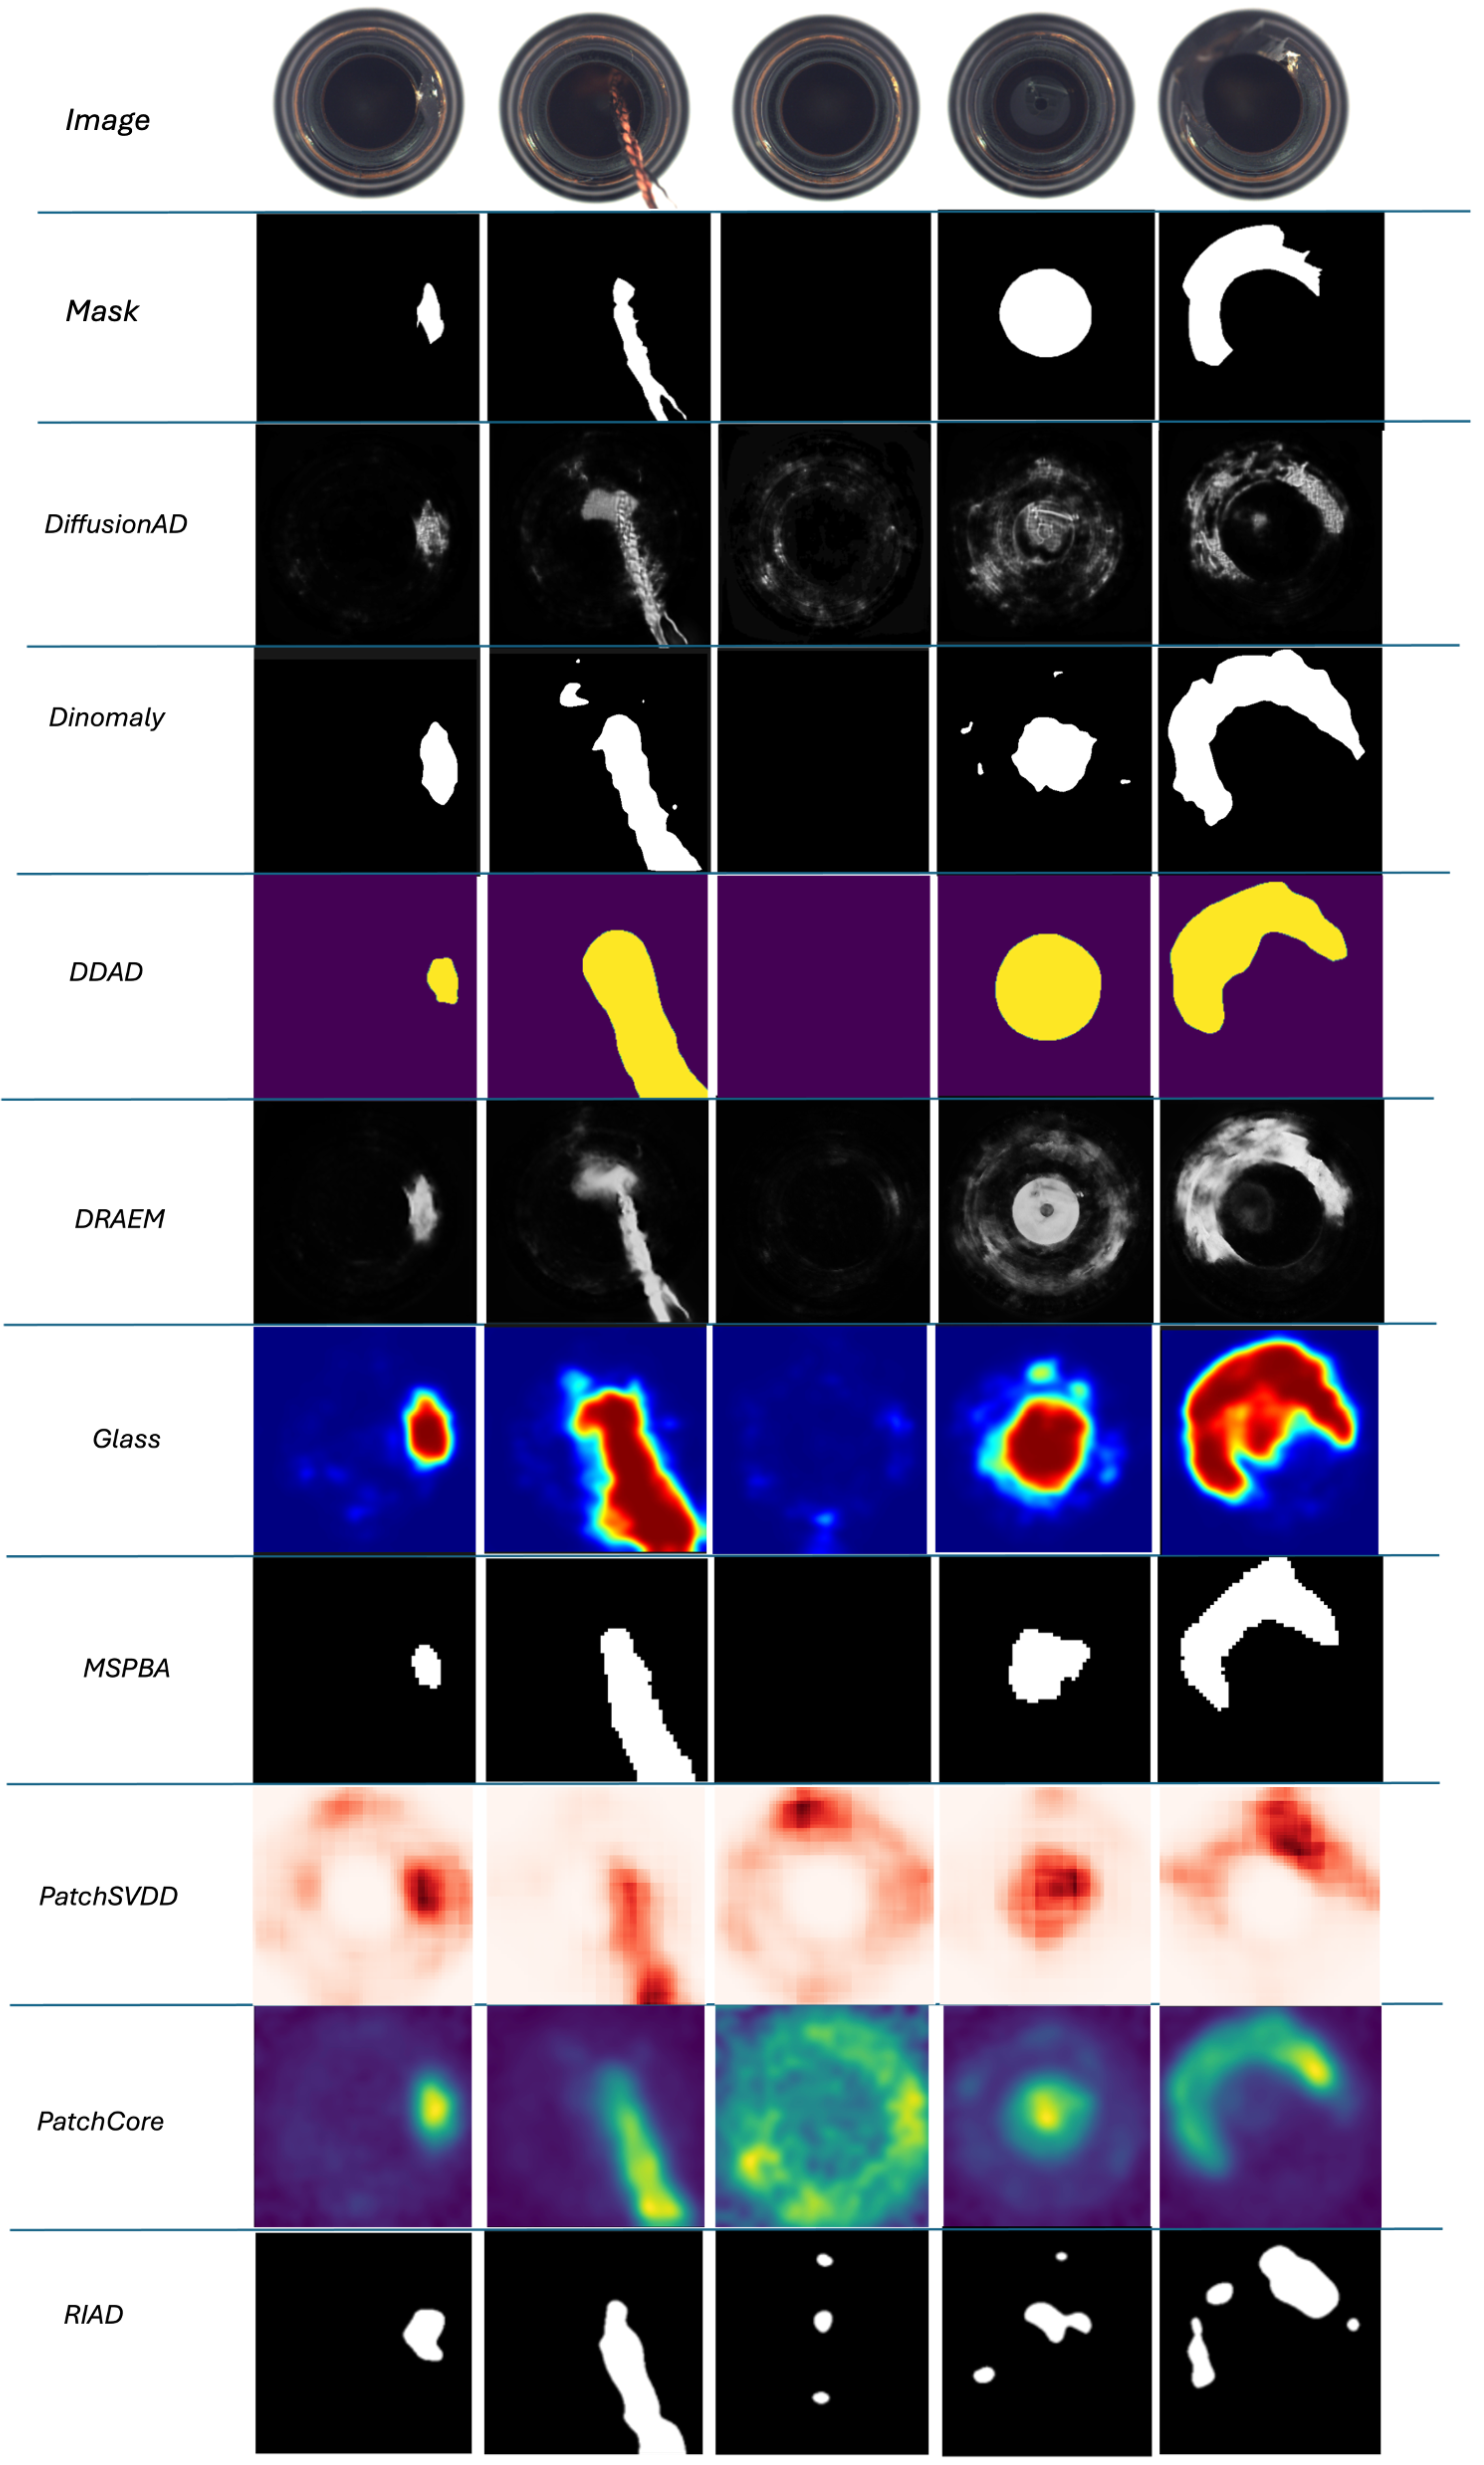
4.7. Visual Results
Figure 3 provides qualitative examples of the anomaly detection results on the
bottle class from the MVTec AD dataset. For each example, the original input image, the ground truth mask, and the predictions from various methods are shown.
Visual inspection reveals that while most methods succeed in identifying anomalous regions, the precision of segmentation varies significantly. Dinomaly and PatchCore produce effective anomaly detection results but often display coarse and poorly delineated predictions. DRAEM, on the other hand, provides sharper segmentation with better localization of defects.
It is important to note that the primary objective of this study is to detect the presence of anomalies rather than to achieve precise pixel-level segmentation. Consequently, these visual examples are presented mainly for illustrative purposes, highlighting qualitative differences between the evaluated methods.
4.8. Summary of Results
The overall evaluation highlights several key findings:
Dinomaly consistently achieves the best performance across all metrics and object categories, combining high detection rates with moderate computational cost.
PatchCore offers an excellent balance between detection performance and efficiency, especially suitable for resource-constrained deployments.
GLASS and DRAEM deliver strong performances, particularly when synthetic anomaly generation is acceptable to enhance training diversity.
Generative methods such as DiffusionAD and DDAD show acceptable detection rates but incur significant computational and environmental costs.
PatchSVDD and RIAD consistently demonstrate lower detection performance, limiting their suitability for industrial quality control applications.
These results also emphasize that feature extraction–based methods without anomaly generation tend to be more environmentally sustainable and computationally efficient, making them attractive options for large-scale and real-time industrial deployments.
5. Discussion
The results presented in the previous section reveal clear differences in the behavior, performance, and computational cost of the evaluated anomaly detection methods. This section provides a deeper interpretation of these findings, analyzing the strengths and limitations of each approach in the context of industrial quality control requirements, and proposes recommendations based on specific operational constraints.
5.1. General Observations
Dinomaly and PatchCore consistently achieve the best detection performance without relying on synthetic anomaly generation. This likely stems from their ability to learn the normal distribution directly, without introducing biases caused by artificial defects that may not accurately reflect real-world anomalies.
From an environmental perspective, feature-based methods without synthetic anomaly generation demonstrate significantly lower resource consumption. This efficiency is particularly evident in terms of GPU memory utilization, energy consumption, and emissions.
Inference times, reported without specific code optimizations, vary considerably across methods. Consequently, absolute values should be considered indicative rather than definitive.
5.2. Impact of Architecture on GPU Memory Consumption
An important technical observation concerns the substantial GPU memory consumption observed in diffusion-based models, notably DiffusionAD and DDAD. This high resource requirement can be attributed to specific architectural choices:
Storage of intermediate noise states during the forward and reverse diffusion processes.
Unrolling of sequential denoising operations, each of which must retain activation maps for gradient computation.
Use of U-Net–based backbones with extensive skip connections, increasing memory usage by storing high-resolution feature maps.
Similarly, methods like DRAEM exhibit elevated memory usage, primarily due to their dual-branch architecture combining an autoencoder for image reconstruction and a segmentation network operating in parallel.
Thus, the combination of sequential operations (in diffusion models) and dual-branch architectures (in DRAEM) inherently leads to higher VRAM usage, making these models less suitable for deployment in constrained environments without further optimization.
5.3. Challenges in Data and Evaluation
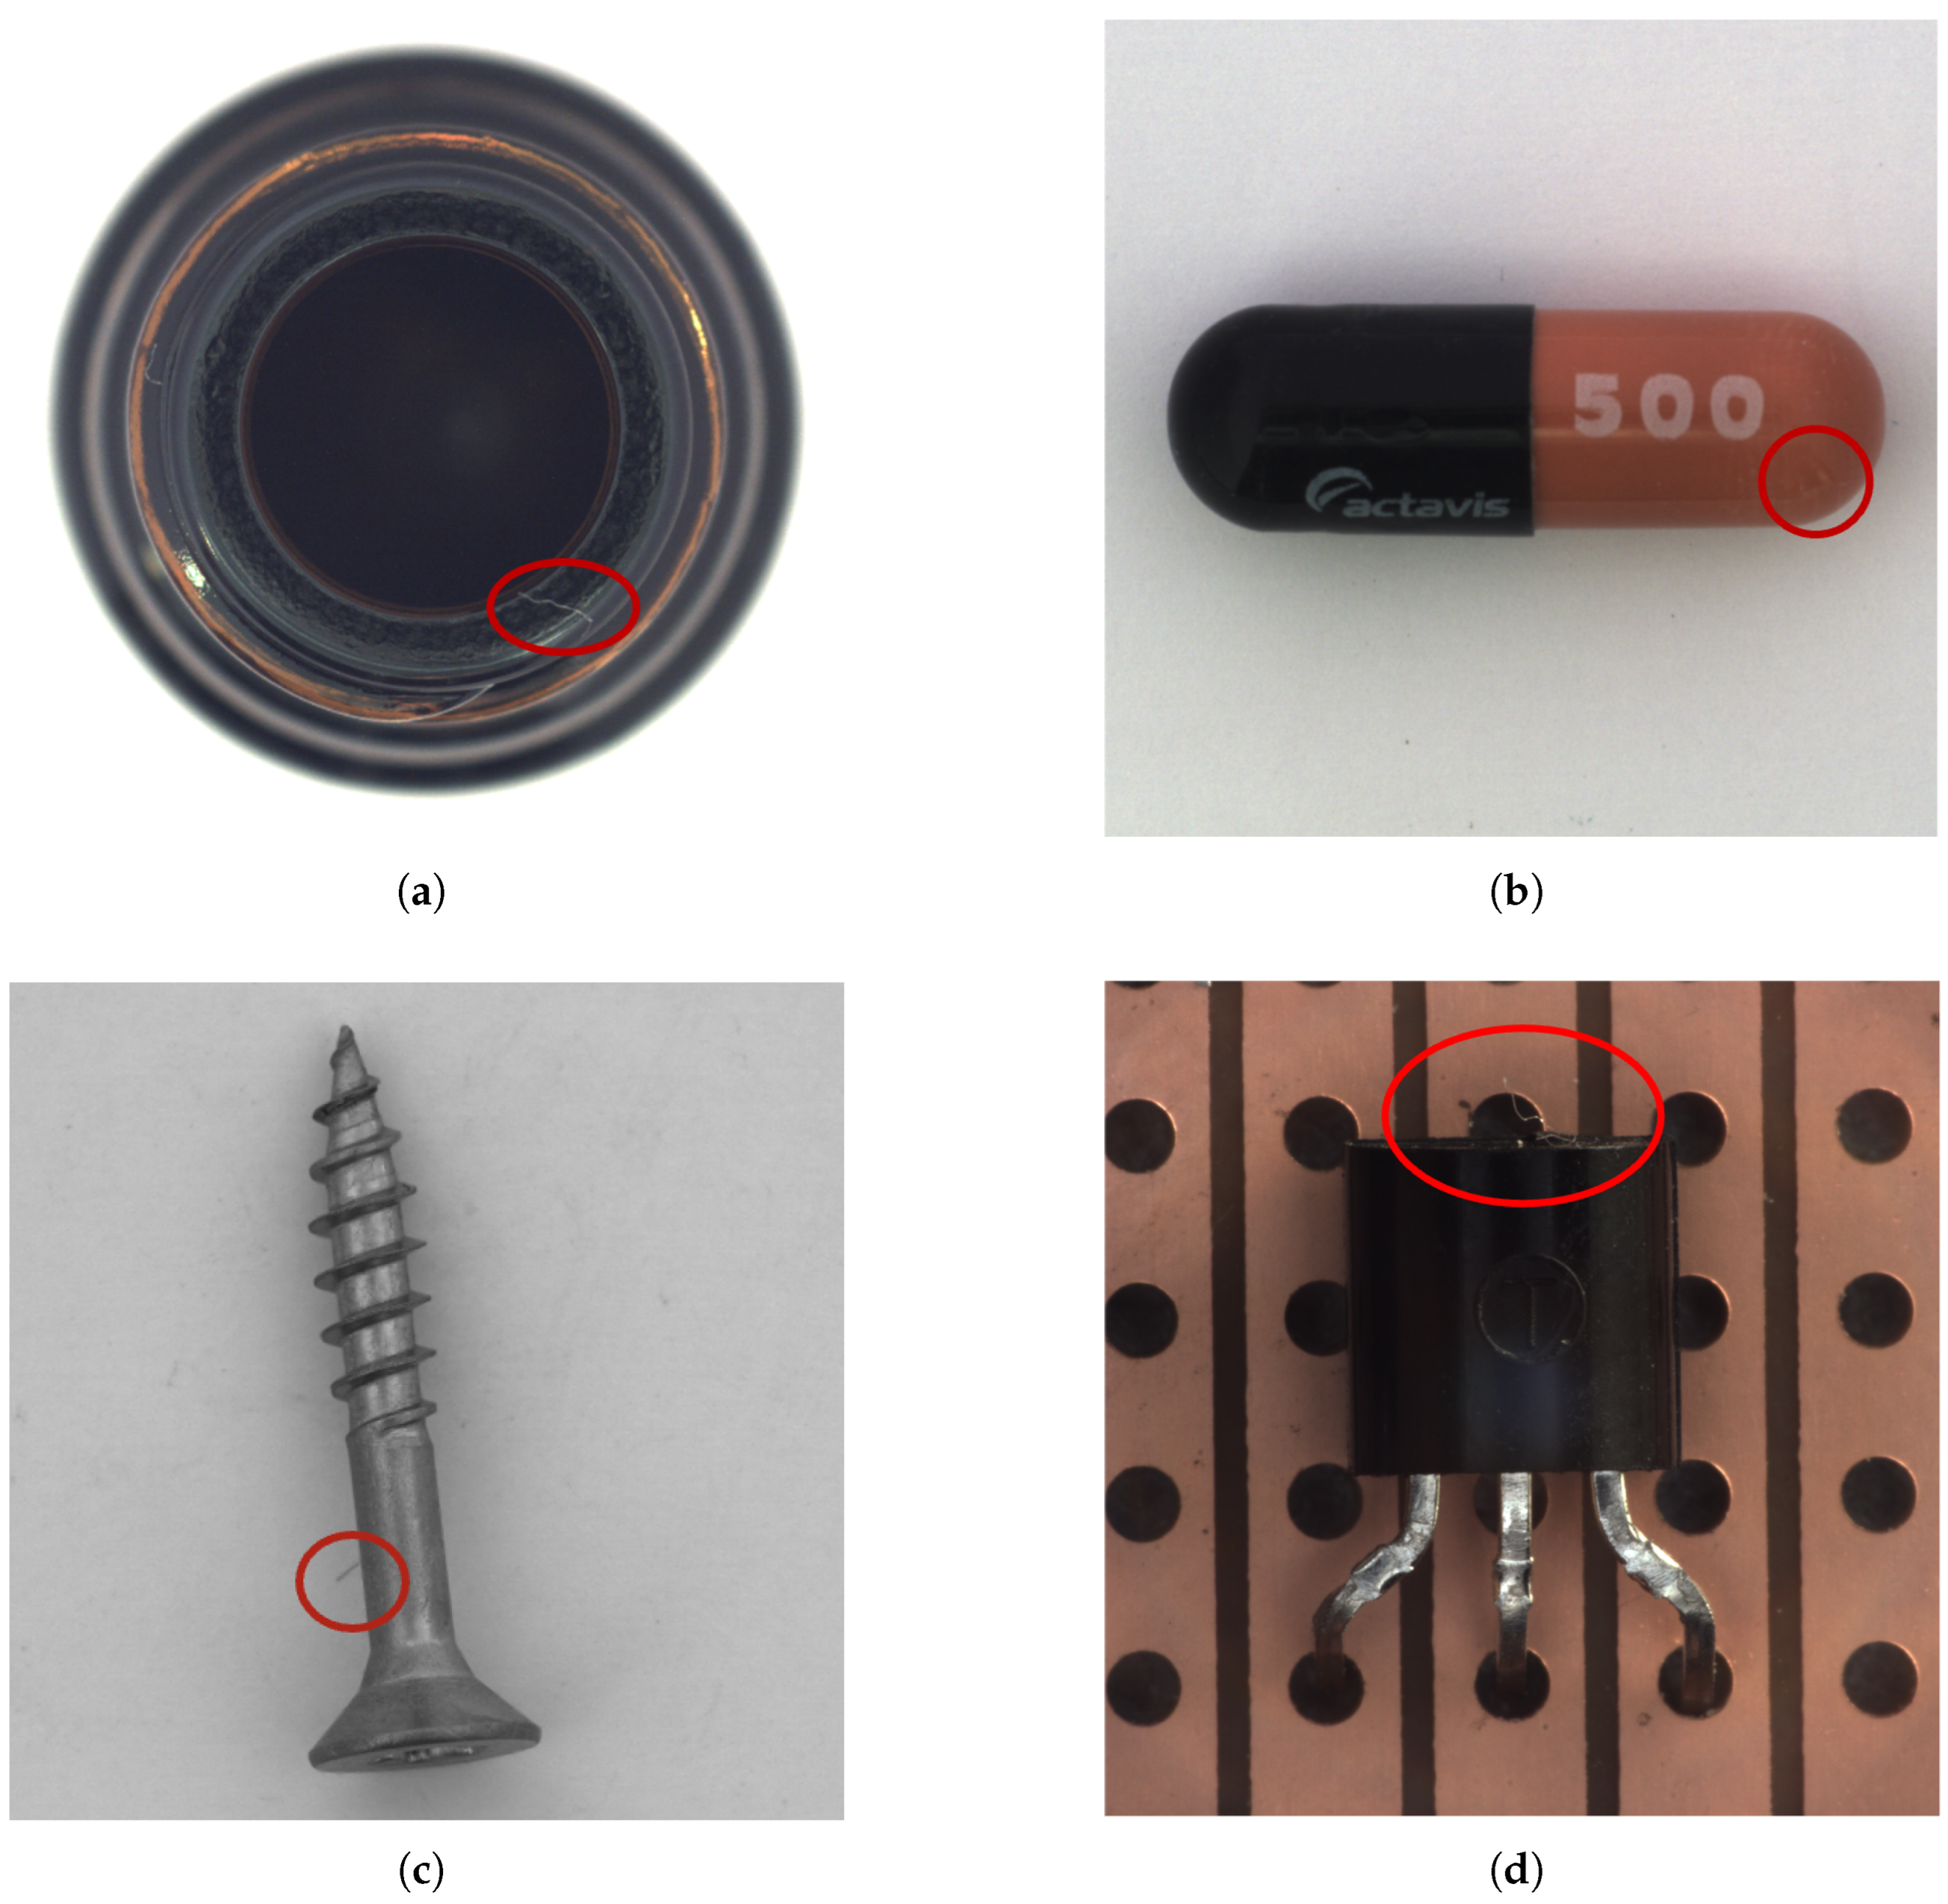
A critical observation concerns the presence of subtle or unlabeled defects in some images labeled as “normal” in the MVTec AD dataset. As shown in
Figure 4, models such as Dinomaly correctly identify these hidden defects, leading to apparent false positives during evaluation. This highlights the need for more rigorous dataset annotation or robust methods capable of handling label noise.
Another major limitation observed is the reliance on post-hoc threshold selection based on test set performance. Most methods optimize thresholds after observing the evaluation results, introducing what we term the “detection bias curse”. This practice artificially inflates model performance and undermines the true generalization ability. Developing threshold calibration methods independent of test data is essential for real-world deployment.
5.4. Recommendations and Future Directions
Several avenues for improvement emerge:
Threshold Calibration: Future methods should integrate threshold selection mechanisms independent of the evaluation set to eliminate bias and improve deployment reliability.
Segmentation Precision: Although detection remains the primary objective, enhancing anomaly localization would greatly benefit quality control applications requiring fine-grained defect analysis.
Dataset Refinement: Improved annotation quality and the development of new benchmark datasets with fewer labeling inconsistencies are crucial for fairer evaluations.
Synthetic Anomaly Generation: Current synthetic defect generation techniques often produce overly simplistic artifacts. Exploring advanced generative models, such as multimodal diffusion architectures or augmented reality-based defect simulation, could offer more realistic and diverse training data, thereby improving generalization.
Addressing these challenges is key to advancing the robustness, sustainability, and industrial applicability of anomaly detection systems.
6. Conclusions
This study presented a comprehensive benchmarking of ten anomaly detection methods applied to the MVTec Anomaly Detection dataset, with a focus on their application to quality control in Industry 4.0 environments. The methods were categorized along two axes: the use (or not) of synthetic anomaly generation, and the reliance on reconstruction-based versus feature-based detection strategies.
Dinomaly and PatchCore consistently achieved top performance without the need for synthetic anomaly generation, confirming their robustness and adaptability across diverse settings. PatchCore, in particular, stands out for its computational efficiency, while Dinomaly combines high detection accuracy with low inference latency, making both approaches highly suitable for real-world industrial deployment.
Diffusion-based models, although promising in detection accuracy, remain computationally intensive, particularly in terms of memory consumption. As highlighted in
Section 5, their iterative reconstruction processes contribute to high resource demands, posing challenges for deployment in constrained industrial environments.
The comparison of environmental and hardware performance revealed that feature-based methods without synthetic anomaly generation are generally more energy-efficient, offering significant advantages in sustainable industrial applications.
A critical limitation identified is the reliance on post-hoc threshold calibration based on test set performance, which introduces evaluation bias. Future work must focus on developing autonomous, test-independent threshold selection strategies to ensure more realistic and deployable solutions.
Moreover, while anomaly detection performance is high, segmentation precision remains insufficient for applications requiring fine-grained defect localization. Improving segmentation capabilities is a key avenue for enhancing model usability in quality-critical industries.
Ongoing research directions include the lightweight optimization of diffusion-based models, autonomous threshold calibration without test data, and improving the realism of synthetic anomalies. In particular, leveraging advanced generative architectures or augmented reality simulation could provide more diverse and representative training scenarios, ultimately strengthening the robustness and generalizability of industrial anomaly detection systems.


