Article

Introducing a Novel Fast Neighbourhood Component Analysis–Deep Neural Network Model for Enhanced Driver Drowsiness Detection

by
Sama Hussein Al-Gburi
1,*,
Kanar Alaa Al-Sammak
1,*,
Ion Marghescu
1,
Claudia Cristina Oprea
1,
Ana-Maria Claudia Drăgulinescu
1,
George Suciu
1,2,
Khattab M. Ali Alheeti
3,
Nayef A. M. Alduais
4 and
Nawar Alaa Hussein Al-Sammak
5
1
Faculty of Electronics, Telecommunications and Information Technology, National University of Science and Technology Politehnica Bucharest, 060042 Bucharest, Romania
2
BEIA Consult International, 060042 Bucharest, Romania
3
Department of Computer Networking System, College of Computer Sciences, and Information Technology, University of Anbar, Ramadi 31001, Iraq
4
Faculty of Computer Science and Information Technology (FSKTM), Universiti Tun Hussein Onn Malaysia (UTHM), Parit Raja 86400, Malaysia
5
College of Education for Pure Science, University of Kerbala, Babylon 56001, Iraq
*
Authors to whom correspondence should be addressed.
Big Data Cogn. Comput. 2025, 9(5), 126; https://doi.org/10.3390/bdcc9050126
Submission received: 20 March 2025 / Revised: 24 April 2025 / Accepted: 6 May 2025 / Published: 8 May 2025

Abstract

Driver fatigue is a key factor in road accidents worldwide, requiring effective real-time detection mechanisms. Traditional deep neural network (DNN)-based solutions have shown promising results in detecting drowsiness; however, they are often less suitable for real-time applications due to their high computational complexity, risk of overfitting, and reliance on large datasets. Hence, this paper introduces an innovative approach that integrates fast neighbourhood component analysis (FNCA) with a deep neural network (DNN) to enhance the detection of driver drowsiness using electroencephalogram (EEG) data. FNCA is employed to optimize feature representation, effectively highlighting critical features for drowsiness detection, which are then analysed using a DNN to achieve high accuracy in recognizing signs of driver fatigue. Our model has been evaluated on the SEED-VIG dataset and achieves state-of-the-art accuracy: 94.29% when trained on 12 subjects and 90.386% with 21 subjects, surpassing existing methods such as TSception, ConvNeXt LMDA-Net, and CNN + LSTM.

1. Introduction

One of the main factors contributing to traffic accidents in several nations is driver fatigue. Drowsiness can happen for many reasons, including medication, working for long hours, sleep disorders, poor-quality (or not having enough) sleep, and being awake for long periods [1,2]. Thus, their relationship is evident, as fatigue directly contributes to drowsiness. Although they are different concepts, some researchers considered drowsiness and fatigue alike, due to their similar consequences, such as [3,4,5]. Various studies have proposed different criteria and solutions for detecting driver fatigue and monitoring attention [1]. Over the years, significant research has been conducted to detect drowsiness and alert drivers to reduce accident rates [6,7]. According to the findings of a study that was conducted in 2017 and was based on information from the National Highway Traffic Safety Administration (NHTSA), USA, there were around 91,000 car accidents that were attributable to drowsy drivers, which resulted in approximately 50,000 injuries [8]. In addition, there were a total of 697 fatalities associated with drowsy driving in the year 2019 alone. However, it is essential to recognize that correctly quantifying the exact number of accidents, injuries, and fatalities caused by drowsy driving is difficult, and it is most likely that the current figures are underestimations [9]. The foundation for traffic safety of the American Automobile Association carried out more research, which resulted in the discovery of even more worrying statistics. According to the findings of their study, there are about 320,000 accidents caused by drivers who were very tired, including approximately 6400 fatal collisions [10]. These considerable findings bring to light the importance of the problem of sleepy driving and emphasize the urgent need for appropriate solutions to manage and minimize the impact of the problem. Therefore, this study introduces an integrated model that combines fast neighbourhood component analysis (FNCA) with a deep neural network (DNN) to detect driver drowsiness. To the best of our knowledge, this study is the first to combine fast neighbourhood component analysis (FNCA) with deep neural networks (DNNs) for EEG-signal-based driver drowsiness detection. This integration combines the best of both worlds: FNCA effectively improves feature separability through metric learning, while DNNs capture complex patterns for accurate classification. Although neighbourhood component analysis (NCA) is a well-known method of metric learning, it is often limited by its high computational cost, especially when applied to large datasets or real-time systems [11]. FNCA was developed to overcome this shortcoming and provide a more efficient way to learn meaningful feature transformations based on nearest neighbour relations [11]. By using FNCA instead of NCA, we can reduce the computational burden without sacrificing performance, making our approach more practical and scalable in real-world applications, such as in-vehicle driver monitoring.
Our paper responds to important challenges not addressed in the literature yet, such as:
  • Introducing an innovative approach that integrates fast neighbourhood component analysis (FNCA) and deep neural networks (DNNs) to enhance the detection of driver drowsiness using electroencephalogram (EEG) data.
  • Improving the FNCA + DNN model and comparing it with recent models using the benchmark driver drowsiness dataset SEED-VIG [12].
This manuscript is organized as follows: Section 2 reviews the relevant literature, delineating the scope of current research and foundational studies pertinent to our focus. In Section 3, we detail the methodology, describing the datasets utilized and the analytical techniques employed to process and evaluate the data. Section 4 discusses the implementation of our proposed model, FNCA + DNN, and provides an in-depth analysis of the experimental results. Finally, Section 5 summarizes the conclusions drawn from our study, reflecting on the implications of our findings and suggesting directions for future research.

2. Related Works

Drowsiness is a state of tiredness that can occur at inappropriate times, such as while driving, and even brief periods of drowsiness may lead to life-threatening consequences [13,14]. Fatigue is the main factor contributing to such states, leading to reduced alertness and increased accident risk [15,16]. Driving for extended periods, especially without sufficient sleep or during circadian low points, can result in reduced focus and slower response times [1,17]. Recognizing and detecting drowsiness is critical to improving road safety [18,19,20]. Al-Gburi et al. [7] emphasized the challenge in clearly defining fatigue, instead focusing on associated states like drowsiness and sleepiness.

2.1. Classical and Traditional Machine Learning Approaches

Sikander and Anwar [21] reviewed several fatigue detection techniques, categorizing them into subjective reporting, physiological signal monitoring, vehicle behaviour, and hybrid systems. Their work particularly emphasized EEG-based detection using frequency-domain characteristics. Ambient Internet of Things (IoT) represents a burgeoning field of IoT devices that leverage environmental energies such as radio frequencies, light, motion, and heat. Building upon traditional IoT and RFID systems, this innovation is poised to reduce costs and expand scalability significantly, with robust support from global telecommunications standards like Bluetooth, 5G Advanced, and 802.11 bp [22]. These advancements in IoT can potentially be integrated into traffic and safety systems to further enhance real-time monitoring and management of driver states, promising a future where technology continuously adapts to improve road safety.
FAWT, a traditional signal processing technique, was used in [23] to analyse unimodal EEG signals for early detection of drowsiness. The technique separates EEG into low- and high-pass channels and then extracts sub-band features. Similarly, [24] proposed a two-level hierarchical radial basis function (RBF-TLLH) network using PCA-based features to classify driving conditions in simulated environments. In [25], blink analysis was integrated with EEG signals from the Fp1 channel, where features were extracted using the moving standard deviation and wavelet transforms, followed by NCA for feature selection. The extracted features were evaluated on two datasets and demonstrated high sensitivity and specificity.

2.2. Deep-Learning-Based Models

With advances in deep learning (DL), models that automatically learn hierarchical EEG features have emerged. A DL-based classification system was proposed in [26] using EEG data from 14 channels and wearable headsets. This system included signal acquisition, annotation, and data augmentation (DA) to prevent overfitting. A compact CNN architecture was designed in [26] using separable convolutions to process EEG in a spatial-temporal sequence. Further, [27] introduced AGL-Net, a real-time-capable model optimized for EEG fatigue detection. Additionally, [28] discussed EEG-based testing methods and their integration into automotive systems for monitoring alertness. These deep learning models reduce reliance on handcrafted features, offering more scalable and robust alternatives for EEG analysis.

2.3. Hybrid and Multimodal Systems

Hybrid systems that integrate different model types or data modalities have been developed to improve accuracy and robustness. In [29,30], a multi-channel EEG-based passive brain–computer interface (pBCI) was proposed for detecting fatigue and spatial localization using data from six EEG channels across the prefrontal cortex (PFC), frontal cortex (FC), and occipital cortex (OC) regions. Spectral properties from various frequency bands (theta, alpha, beta, and delta) were analysed over time. Another hybrid approach in [29] combined EEG signals with vehicle motion parameters (steering angle, speed, and acceleration). Feature extraction included spectral ratios and entropy calculations, followed by Pearson correlation analysis, with SVM used for final classification.

2.4. Attention Mechanisms and Optimization-Enhanced Techniques

Modern systems increasingly employ attention mechanisms and optimization strategies to improve model performance. In [31], LMDA-Net incorporated multi-dimensional attention for enhanced interpretability in EEG-based brain–computer interfaces. TSception [32] captured temporal and spatial EEG asymmetries, initially designed for emotion recognition but useful in drowsiness detection. ConvNeXt [33], although not initially EEG-focused, applies modern convolutional strategies that can be repurposed for EEG analysis. Quantum machine learning (QML) for drowsiness detection was investigated in [34] by extracting both statistical and complex fractal features, processed using various quantum circuit topologies. Cross-dataset generalization using deep transfer learning was proposed in [35] to improve the robustness of drowsiness detection models. In [36], a scalable machine learning framework was introduced for EEG-based drowsiness detection under real-time constraints.

2.5. Benchmarking and Comparative Evaluation

Table 1 summarizes how the proposed FNCA + DNN model compares to recent works in the literature based on core criteria such as feature extraction method, architecture, attention mechanism usage, multi-band analysis, and real-time applicability.

3. Methodology

3.1. EEG Data Analysis and Feature Extraction

This section details the systematic approach used to analyse electroencephalogram (EEG) data to detect driver fatigue, guided by the mathematical principles established in subsequent sections. In order to enhance the accuracy and robustness of our fatigue detection model, we proposed the method leverages both fast neighbourhood component analysis (FNCA) and a deep neural network (DNN) to optimize the conversion of raw EEG signals into measurable indications of sleepiness. The workflow (see Figure 1) begins with the acquisition of EEG data, followed by segmentation into time-consistent intervals and spectral analysis to isolate frequency patterns associated with fatigue.

3.1.1. EEG Data

It should be noted that EEG data collection is not the focus of our paper. Instead, we used publicly available EEG datasets [38] which were published in Scientific Data in April 2024 under the title “Resting-state EEG dataset for sleep deprivation” and are publicly available under the Creative Commons Attribution 4.0 International License. It consisted of EEG recordings and cognitive assessments in 71 participants who were treated twice: once after normal sleep and one after sleep deprivation. Each session includes 5 min open-eye-open resting-state EEG recordings, as well as behavioural data from the Psychomotor Alertness Task (PVT), the Positive and Negative Effects Scale (PANAS), the Stanford Sleepiness Scale (SSS), and other psychological assessments. The dataset is formatted according to the Brain Imaging Data Structure (BIDS) and is accessible through OpenNeuro [38]. To the best of our knowledge, our study is the first to utilize this specific dataset to develop and evaluate models designed to detect driver drowsiness. By utilizing high-resolution EEG data under controlled sleep conditions, we aim to advance the understanding and detection of driver drowsiness and contribute to road safety and cognitive neuroscience.
EEG signals are vital for the analysis of alertness and cognitive performance (critical components in detecting indicators of sleepiness).
Our analysis consists of the following steps:
  • Channel selection: The data from eight different electrodes (Cz, Fz, T7, T8, C3, C4, PO7, and PO8) were chosen from the publicly available dataset (see Table 2). These brain regions were chosen for their importance in cognitive processing, sensory integration, and maintaining alertness (which are all crucial to accurately identifying shifts in drowsiness).
  • Sample frequency: The dataset used in our study was recorded at a particular sample frequency, denoted as fs = 500 Hz, which is critical in capturing the variety of significant brain activity.

3.1.2. Feature Extraction from Frequency Bands

This step is vital since the EEG data features will be extracted in a structured format. This structured form is an average of the power in the respective frequency bands for the assigned EEG channels Cz, Fz, T7, T8, C3, C4, PO7, and PO8. These specific channels have been chosen based on their established importance in tracking brain activities related to vigilance and cognitive capabilities, which are important in identifying states of drowsiness. In the following subsection, we detail the mathematical mechanisms through which each channel systematically mines the relevant features. We preprocess the EEG data using a Butterworth bandpass filter. This type of filter was chosen because it has a smooth frequency response, which means it does not distort the EEG signal. It helps isolate the desired frequency range while keeping the original data intact, making it ideal for our analysis.
Power Spectral Density Estimate: In our approach, we compute the estimated power spectral density (PSD) for each EEG channel using the Welch method as mentioned in the previous part. The PSD of a given time series x(t) from any selected channel is estimated first by segmenting the signal into overlapping sections; a window function is then applied to each of these sections and averaged across these sections over their squared magnitudes of the Fourier transform.
The PSD, denoted as P f , is then calculated as the average of all P i f values across the segments as in Equation (1),
P f = 1 L i = 1 L P i f
where L is the total number of segments. These steps are followed systematically to ensure accurate power spectral density estimation when analysing frequency-specific activity within the EEG signals relevant to drowsiness detection.
Frequency Band Power Calculation: After the power spectral density has been calculated, from the result we derive the average power calculated in several specified frequency bands, namely alpha (8–13 Hz), beta (14–30 Hz), and gamma (31–100 Hz), in each channel [39]. This is calculated by finding the frequency indices of all the bands to compute the average power of their PSD values. For any designated frequency band [ f s t a r t , f e n d ], the mean band power M b a n d is calculated as in Equation (2).
M b a n d = 1 N f f = f s t a r t f e n d P f
Equation (3) defines the assembly of a feature vector from EEG data, essential for examining the brain’s electrical activity under various cognitive states:
F s e g m e n t = M α , C z ,   M β , C z , M γ , C z ,   , M α , P O 8 M β , P O 8 M γ , P O 8
This vector integrates mean power values across selected EEG channels and frequency bands (alpha, beta, and gamma), providing an all-encompassing portrayal of the spectral features found in EEG signals. The selection of channels and bands is strategically chosen to capture the cognitive dynamics under study, thereby providing detailed insights into the brain’s functional states.
The dataset comprises 22,126 EEG segments, each represented by 16 variables reflecting mean power values in the alpha and beta bands across various cerebral regions, along with a categorical label indicating the cognitive state. This dataset is pivotal for validating the constructed feature vector’s capacity to discern subtle shifts in brain activity.
The data are organized to correlate directly with the components of the feature vector detailed in Equation (3), where each row corresponds to an EEG segment. Table 3 is a refined sample of the dataset showcasing a variety of cognitive state labels:
The analysis of these features provides a deep understanding of the relationships between specific EEG spectral features and the cognitive states labelled as ‘Intermediate’, ‘Alert’, and ‘Drowsy’. Examining how different channels and frequency bands relate to these states allows for the explanation of neurological patterns corresponding to each cognitive condition, providing critical insights for neurological diagnostics and therapeutic strategies.
This assures a multi-dimensional representation of the EEG data and gives way to a nuanced understanding and detection of the change in the brain activity related to drowsiness, as outlined in Algorithm 1.
Algorithm 1: EEG Spectral Feature Extraction for Drowsiness Detection
Input:
  • EEGData: Multichannel EEG recordings [Cz, Fz, T7, T8, C3, C4, PO7, PO8]
  • SamplingFrequency: Sampling frequency of the EEG data
  • SegmentLength: Length of each EEG segment for analysis.
Process:
1. 
Preprocessing EEG Data
For each channel in EEGData:
 -
Apply band-pass filtering (e.g., 0.5–45 Hz)
 -
Apply artifact removal (e.g., ICA or thresholding)
2. 
Segmenting EEG Data
For each channel:
 -
Divide into overlapping segments of length SegmentLength
3. 
Spectral Analysis using Welch’s Method
For each segment:
 -
Apply a window function
 -
Perform FFT
 -
Calculate and average periodograms to get PSD
4. 
Feature Extraction from PSD
For each channel and each frequency band (alpha, beta, gamma):
 -
Identify corresponding frequency bins
 -
Compute mean power
 -
Append to feature list
5. 
Compile Feature Vector
 -
Aggregate features from all channels and bands into one vector.
Output:
Features: A vector containing power spectral features for classification or analysis.
End

3.2. EEG Data Labelling

According to [40,41,42] an increase in alpha activity indicates drowsiness. An increase in the beta activity, however, is a sign of wakefulness and alertness. Therefore, in this study, the threshold values are computed through the distribution of alpha/beta ratios. Precisely, the 25th, 50th (median), and 75th percentile values of the distribution of the ratio help in setting the EEG data thresholds to partition them into various cognitive states. These thresholds thus discretize the data into low (alert), intermediate, and high (drowsy) regions corresponding to the underlying mental states. Mathematically, those thresholds could be approximated as follows:
  • T_low = P_25(X),
  • T_mid = P_50(X),
  • T_high = P_75(X),
where P_n(X) stands for the n-th percentile of the alpha/beta ratio distribution X [43]. The approach describes a new labelling function that gives each of the EEG records one of the three categorical labels ‘Alert’, ‘Intermediate’, or ‘Drowsy’ based on its alpha/beta ratio. Each value of the ratio is compared to the predefined threshold, and depending on its values, each record is simply classified into one of three classes. A labelled record is accordingly ‘Alert’ if the ratio is less than the low threshold, ‘Intermediate’ if it lies between low and high thresholds, and ‘Drowsy’ if greater than the high threshold.

3.3. Data Pre-Processing and Training

In this subsection, we discuss the method by which fast neighbourhood component analysis (FNCA) has been integrated with a deep neural network (DNN) (see Figure 2) for significantly enhanced classification accuracy. The main purpose of this section is to apply FNCA for dimensionality reduction to transform the feature space into one that would be most appropriate for solving deep learning problems.

3.4. Fast Neighbourhood Component Analysis (FNCA):

Neighbourhood component analysis (NCA), one of the most successful metric learning algorithms, suffers from the high computational cost [11]. To overcome this disadvantage, FNCA is a method proposed in [11] to facilitate the effective acquisition of a distance measure or linear transformation using the nearest neighbour approach.
Authors in [22,44,45,46,47] have used FNCA because it significantly increases the training speed and resolves the problem of high computational cost compared with NCA.
Let T ={( x 1 , y 1 ), …, ( x i , y i ), …, ( x n , y n )} be a training set of N labelled samples, where x i ϵ R d is a 22,126 × 16 sample, and y i ϵ {1, …, C} is the corresponding class label. Our goal is to learn a linear transform matrix L of size r × d ( r d ) for optimal nearest neighbour classification. With the linear transform matrix L , the Mahalanobis distance between two samples x i and x j is computed as in Equation (4) [43]:
d i j L = L x i x j 2 = ( x i x j ) T L T L x i x j
In this study, FNCA was used as a pre-processing step to transform EEG data into a more discriminative feature space. By leveraging the K-nearest neighbour (KNN) principle, FNCA optimizes the transformation matrix L , focusing on the K-nearest neighbours of each sample to enhance class reparability. The transformed training data were then used to train a deep neural network, while the transformed test data were used for classification. Unlike traditional methods that rely solely on KNN for classification, DNNs exploit their ability to learn complex nonlinear patterns from the transformed features. Classification accuracy was then evaluated, highlighting the effectiveness of combining FNCA’s metric learning approach with the powerful modelling capabilities of DNN. The mathematical details of FNCA, including how it uses K-nearest neighbours to learn the transformation matrix L, are explained in detail in the original paper [43].

Data Transformed with FNCA

In this study, we used FNCA to transform our training and test data, xTr and xTe, respectively. The transformation matrix L of FNCA is applied to transform the original space (xTr and xTe) to the new space (xTr transformed and xTe transformed). This stage involves local features, whereby the better separability of different classes is aimed for; hence, the classes will be well classified (see Table 4 and Figure 3).
  • Designing the DNN Model: The network will consist of a few input layers, various hidden processing layers, and one output layer. The size of the input layer should be equal to the number of transformed features. It consists of hidden layers designed with an increase in complexity and nonlinearity by ReLU activation functions. Finally, the last layers used the Softmax function to apply probabilities to different classes by making the final classification.
  • Training: In the learning phase, the training of the DNN is performed using the Adam optimizer to optimize the weights. We control the learning rate, apply the regularization to avoid overfitting, and manipulate the batch size to make the training progress smooth. Adam is chosen for its effectiveness in adjusting the learning rate, promoting faster and more reliable learning.
  • Evaluation: Our main metric to evaluate the performance of the classifier is the classification accuracy. It gives the proportion of all correct predictions from all predictions made.
Accuracy = Number   of   Correct   Predictions Total   Number   of   Predictions = T P + T N T P + T N + F P + F N
where:
  • T P (True Positives): Correctly predicted positive cases.
  • T N (True Negatives): Correctly predicted negative cases.
  • F P (False Positives): Incorrectly predicted positive cases.
  • F N (False Negatives): Incorrectly predicted negative cases.
The proposed classification pipeline leverages a hybrid approach combining Fast Neighbourhood Component Analysis (FNCA) and a Deep Neural Network (DNN) to enhance the discriminative power of EEG features for driver drowsiness detection. FNCA performs dimensionality reduction by maximizing class-specific neighbourhood separability, after which the transformed features are used to train a DNN classifier. This two-stage process allows for efficient learning in a reduced subspace while preserving essential discriminative information. The complete methodology is outlined in Algorithm 2:
Algorithm 2: FNCA-DNN Hybrid Model for Driver Drowsiness Classification
Input:
  • Training dataset D = { ( x i , y i ) } i = 1 n , where x i are EEG feature vectors and y i are class labels
  • Parameters:
     -
    K : neighbourhood size.
     -
    λ : regularization factor
     -
    r : target dimension of the projected feature space
Process:
1. 
FNCA Training:
-
Apply Fast Neighbourhood Component Analysis (FNCA) to learn a linear transformation matrix L R r   ×   d   ×   d , where d is the original feature dimension
-
Optimize the FNCA objective to maximize class neighbourhood separability using K-nearest neighbours and regularization term λ.
2. 
Feature Transformation:
-
Project training data into the learned subspace:
    For each training sample x i compute z i = L .   x i .
-
Define the transformed dataset as Z = { ( z i ) } i = 1 n .
3. 
DNN Model Training:
-
Initialize a deep neural network (DNN) classifier with suitable architecture
-
Train the DNN on (Z,Y) using backpropagation and an optimization algorithm (e.g., Adam):
 a.
Randomly initialize weights and biases.
 b.
For each epoch t = 1 to T:
  •
Forward propagate Z to compute predictions.
  •
Compute loss (e.g., cross-entropy) with respect to true labels Y.
  •
Backpropagate and update weights.
End for
-
After training, obtain the trained DNN model M.
4. 
Classification of New Samples:
-
For each new EEG feature vector x new :
   •
Compute z new = L .   x new .
   •
Use the trained DNN model M to predict the class probabilities.
   •
Assign predicted label as y ^ the class with the highest probability.
Output:
  • Learned FNCA transformation matrix L.
  • Trained DNN classifier M for prediction on unseen EEG data.

4. Results and Analysis

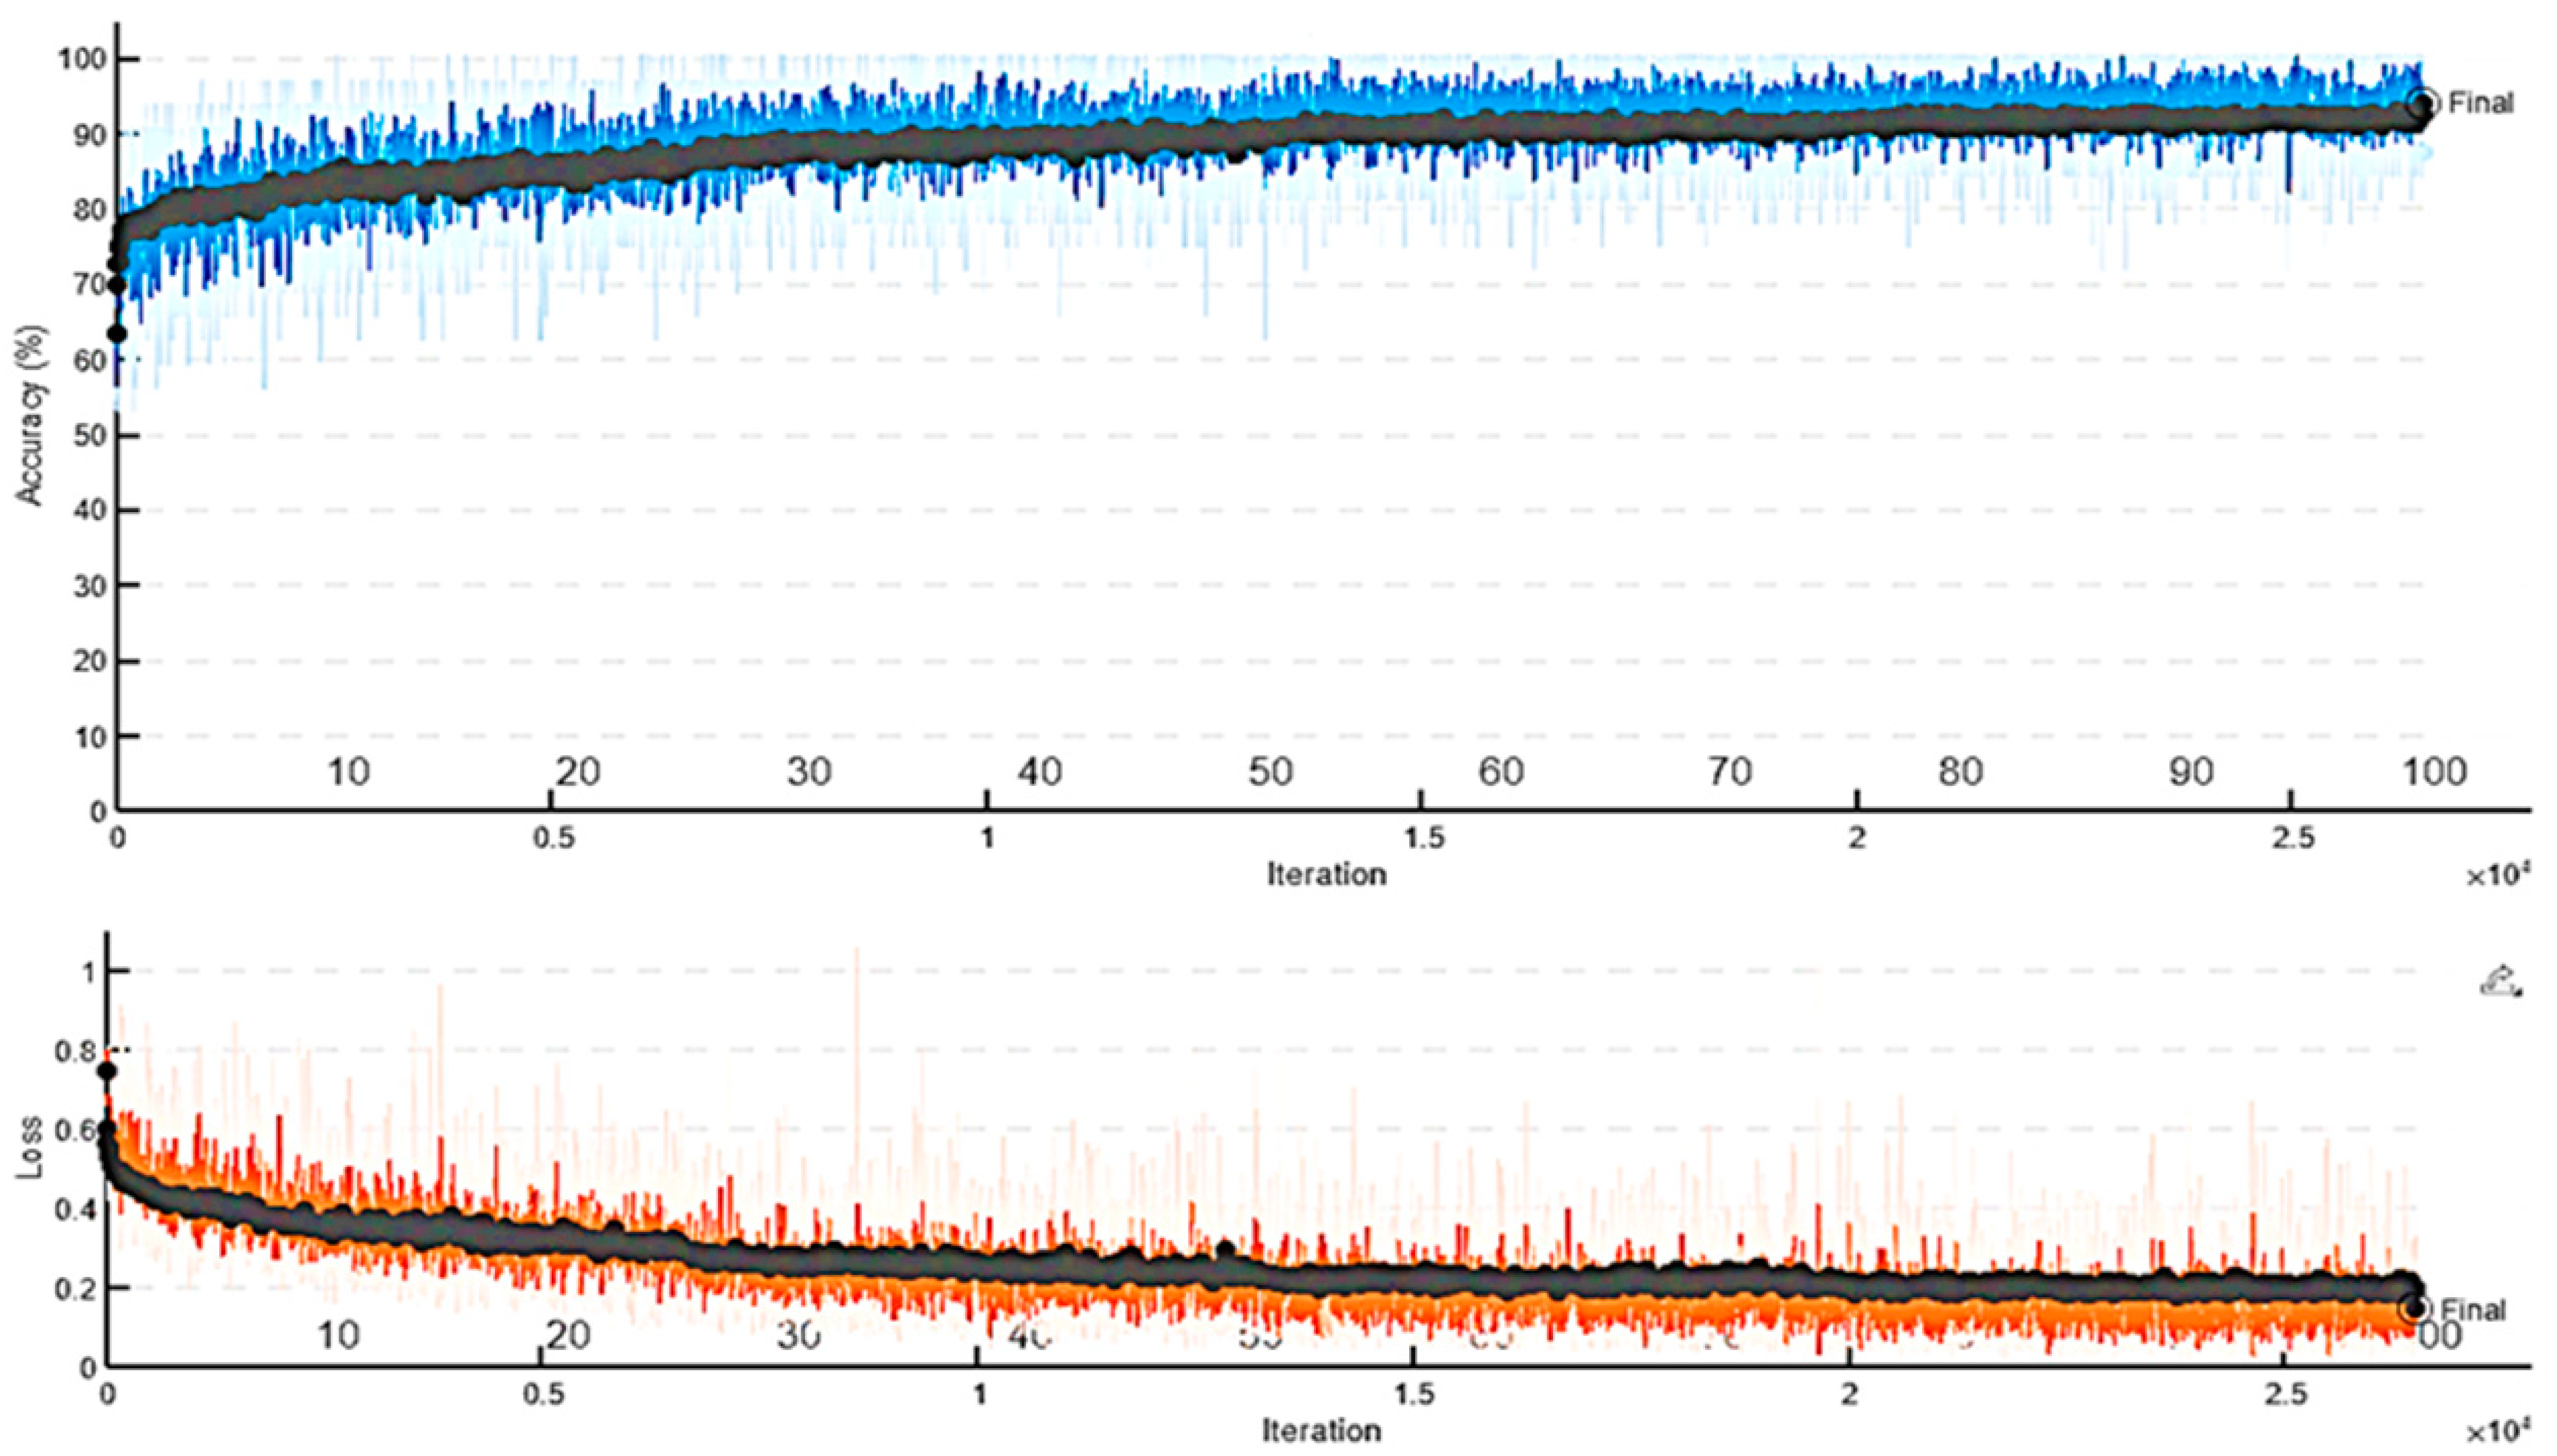
4.1. Analysis of FNCA + DNN for Driver Drowsiness Detection

This section discusses the performance of the proposed model, which includes FNCA and DNN. In this section, we shall look for experimental outcomes based on MATLAB R2022a simulations epoch by epoch, changes in accuracy, and loss together with the effect of the base learning rate suiting model efficiency.
FNCA and DNN are integrated to contain the dimensionality reduction capability of FNCA and the pattern recognition strength of DNNs. This work is in furtherance of being able to improve the classification accuracy without increasing computational complexity and excluding the problem of overfitting. We validate the effectiveness of this approach through a series of training and validation experiments. First, Figure 4 emphasizes the results regarding the evolution of the training and validation accuracy. The model sets off with the initial mini-batch accuracy at 33.59%, and that of the validation accuracies tends to increase. By the 15th epoch, those values were at 81.25% and 80.88%, respectively. An initial mini-batch loss of 2.837 shows a high error rate, but the model learns and adapts from the training data, with the loss reducing to 0.30 by the 30th epoch. Indeed, at the 30th epoch, the mini-batch and validation accuracies reach steady-state values of 86.72% and 83.67%, respectively. Such observations suggest a well-trained model generalizing well for unseen data.
Notably, what is interesting is the improved validation accuracy, which, at some points, is greater than the mini-batch accuracy, hinting that FNCA’s dimensionality reduction effectively helps in the learning process of the DNN.
It will be quite interesting to see whether future experiments with dynamic learning rate strategies make a difference in either the final quality of the model or increasing the speed of the training procedure.
Table 5 shows simulation results for four different experiments. Figure 5 shows the performance of the FNCA + DNN model when training 30 epochs with a learning rate of 0.001. The validation accuracy rate progressively improved over time, accomplishing a final epoch of 83.67%. The curve is smooth, demonstrating that the model is learning efficiently without any sudden drops or instability. This shows that 30 epochs is a valuable stopping point because the model has reached a solid level of performance without overfitting or wasting additional computational time.
Figure 6 scales training to 50 epochs, nevertheless preserving the similar learning rate. The accuracy achieved 3.59%, which is nearly the same as Figure 5. However, after 30 epochs, the accuracy began to fluctuate slightly, rather than further improving. This means that training with more than 30 epochs will not help much and may even introduce unnecessary instability. In practice, there is no real benefit to training for so long if the accuracy is not significantly improved.
Figure 7 shows the outcome for 40 epochs, again with a learning rate of 0.001. At this point, the accuracy is stable at 82.80%, which is marginally lower than in the first two cases. This is further evidence that training with more than 30 epochs does not add much value and may even slightly reduce accuracy. These results confirm that the model learns efficiently within 30 epochs, and that additional training will only increase the computational cost and will not really improve.
Figure 8 examines a higher learning rate of 0.01 while keeping the training time at 30 epochs. The verification accuracy dropped to 81.43%, and the accuracy curve was more unstable. Fluctuations indicate that the model is struggling to converge properly, possibly because the high learning rate makes the update too aggressive, causing the model to miss the optimal parameter adjustment. This result shows that 0.01 is too high a learning rate for the model compared to the smooth and stable learning in Figure 5.
In summary, FNCA integrated with DNN shows a promising result. Not only the accuracy but also the loss metrics exhibit a sharp decrease with time, proving that the model is improving. It steadily improved across epochs of training, which proves the power of FNCA’s dimension reduction combined with the capability of classification by DNN. It may be interesting in further research to explore the effect of changing the learning rate, for example, while also designing deeper network architectures or using other activation functions.

4.2. An Improved FNCA + DNN Model for Driver Drowsiness Detection Using EEG Signals

Figure 9 illustrates an improved FNCA–DNN model for driver drowsiness detection using EEG signals. The process starts with EEG data, divided into training and testing sets, followed by feature normalization to standardize the input. FNCA is applied to refine and enhance the extracted EEG features. The model consists of an input layer and four fully connected (FC) hidden layers with neuron counts of 256, 128, 64, and 32, each utilizing ReLU activation and batch normalization to improve learning stability. To prevent overfitting, dropout layers (0.3 and 0.2) are incorporated in the last two hidden layers. The output layer applies a Softmax activation function to classify the driver’s state as alert or drowsy. Additionally, the EEG electrode map highlights the key channels used for feature extraction, ensuring the model effectively captures EEG patterns associated with drowsiness. This enhanced architecture improves the accuracy and reliability of real-time driver fatigue detection systems.
In our experiments, DNN dropout layers, batch normalization, and multi-layer feedforward architecture robust learning of EEG features converted from FNCA is essential. The motivation for using dropout is its ability to randomly disable a subset of neurons during training to reduce overfitting, forcing the network to learn redundancy and generalized representation [48]. This is especially important for EEG signals, which are often noisy and collected in small amounts. Studies such as EEGNet specifically apply dropout to counteract these limitations and improve generalization [49]. We also added batch normalization (BN) to normalize the inputs for each layer and mitigate the internal covariate shift, which not only accelerates convergence but also enables higher learning rates and provides moderate regularization [50]. BN has proven to be particularly beneficial when used in conjunction with dropout, improving training stability and model robustness [51]. Our decision to adopt a multi-layer feedforward structure is consistent with best practices for EEG-based deep learning, where deep but regularized networks are often used to capture complex nonlinear relationships in brain activity. For example, EEGNet and DeepConvNet use layers of 3 to 10 and show higher accuracy of feature extraction and classification on shallower networks [49,52]. Roy et al. [51] further support the use of deeper architectures in EEG analysis, emphasizing that hierarchical representation learning is essential for detecting subtle neural patterns. Therefore, while we did not conduct empirical ablation studies due to resource constraints, our design decisions were based on well-established deep learning strategies and supported by a large body of literature on EEG signal classification.
The improved FNCA + DNN network architecture detailed in Table 6 has been carefully designed to improve classification accuracy while preventing overfitting. It starts with an input layer that receives the original features and passes them to the first fully connected layer (FC1) with 256 neurons, which helps learn complex patterns from the data. To ensure stable learning and faster convergence, this is followed by a batch normalization layer (Bn1) that normalizes the priming before applying the ReLU initiation function (ReLU 1), which introduces nonlinearity to capture complex relationships in the data. The network then proceeds to process a second fully connected layer (FC2) with 128 neurons, followed by batch normalization (BN2) and ReLU priming (ReLU2) again. This pattern is repeated in a third fully connected layer (FC3) with 64 neurons, maintaining the same batch normalization (BN3) and activation function (ReLU3). To reduce the risk of overfitting, a dropout layer with a dropout rate of 30% (dropout1) is included, and some neurons are randomly deactivated during training to make the model more robust. The learning process further refines important features using a fourth fully connected layer (FC4) with 32 neurons, followed by batch normalization (BN4) and ReLU priming (ReLU4). Another dropout layer with a dropout rate of 20% (dropout2) ensures additional regularization. Finally, the output layer (FC_output) maps the learned features to the number of target classes. The Softmax layer then converts these outputs into probabilities, allowing the classification layer to make final predictions. This architecture balances learning complexity with regularization, ensuring strong generalization of unseen data while effectively capturing the underlying patterns in the dataset.
To evaluate the proposed model, we used a benchmark dataset called SEED-VIG [10], which has been used to evaluate many recent works [27,28,31,32,33,35,36]. The SEED-VIG dataset is a comprehensive resource developed by the BCMI Laboratory of Shanghai Jiao Tong University to facilitate research using EEG data for alertness estimation and driver drowsiness detection. In this dataset, EEG and EOG signals were recorded from 23 participants who participated in the simulated driving task. The experimental setup features a four-lane highway scene displayed on a large LCD screen located in front of the real vehicle chassis, creating an immersive driving environment. Participants used the steering wheel and accelerator pedal to control the vehicle, and the simulation mainly involved a straight and monotonous road to effectively induce fatigue. EEG data were collected from 17 channels using the Neuroscan system, following the international 10–20 system, and sampled at 200 Hz. Specific electrode placements include the temporal region (FT7, FT8, T7, T8, TP7, and TP8) and the posterior region (CP1, CP2, P1, PZ, P2, PO3, POZ, PO4, O1, OZ, and O2). In addition, participants wore SMI eye-tracking glasses to record eye movements, enabling the calculation of the PERCLOS (percentage of eyelid closure) metric, which serves as a continuous measure of alertness levels from 0 to 1.
Figure 10 shows the results of applying the improved FNCA + DNN model to EEG data for 21 subjects, demonstrating high classification accuracy and consistency in detecting driver drowsiness. With an average accuracy of approximately 90% ± 0.06, the model effectively distinguishes between alert and drowsy states across different individuals. Several subjects achieved above 97% accuracy, indicating strong feature separability, while a few exhibited slightly lower accuracy (~86%), likely due to individual EEG variations, noise, or signal inconsistencies.
We applied the improved model to the SEED-VIG dataset. When combining EEG data (17 channels) from 12 subjects (subjects 1–12), the model achieved an accuracy of 94.29% ± 0.0028 using five-fold cross-validation, as shown in Figure 11. To further demonstrate the effectiveness of the proposed model, we combined EEG data (17 channels) from all subjects (subjects 1–21), where the model achieved an accuracy of 90.83% ± 0.0012 using five-fold cross-validation, as depicted in Figure 12. Also, we modify the number to classes to two instead three and only eight channels, combining EEG data dataset for 71 subjects, and the model achieved 99.42% ± 0.023 as shown in Figure 13.

4.3. Cross-Subject Evaluation Strategy

In our experiments, we evaluated our model through a cross-subject evaluation strategy of training the model on EEG data from different subjects and then testing it on data from different, unseen subjects, as shown in Table 7. For example, training only on subject 1 and testing on subject 21 had an accuracy rate of 52.77%, while training on subjects 1–11 and testing on subject 21 increased the accuracy to 72.09%. Further increasing the training set of subjects 1–19 can improve the accuracy of subject 21 to 77.18%. We also explored other configurations, such as training only with subject 4 and testing with subject 21 (74.92%), and training with subject 4 and testing with subject 8 (81.47% accuracy). These results illustrate how the model learns general EEG features from different datasets and effectively applies them to previously unseen subjects, demonstrating the robustness and adaptability of our approach.
In our experiments, we adopted a transfer learning strategy by aggregating EEG data from multiple subjects for training and then evaluating the model on an unseen subject. For instance, one configuration trains on subjects 1–11 and tests on subject 21, achieving an accuracy of 72.09% (see Figure 14), while another trains on subjects 1–19 and tests on subject 21, reaching an accuracy of 77.18% (see Figure 15). Based on our visual estimates from the loss curves, in Figure 14, at around 200,000 iterations, the training loss is approximately 0.35 and the validation loss about 0.40; in Figure 15, at around 600,000 iterations, the training loss is near 0.30 and the validation loss close to 0.33. This approach enables the model to learn general EEG features from a diverse dataset and apply them effectively to new, unseen subjects, with the loss curves confirming improved learning and generalization over time.

4.4. Real-Time Inference and Latency Performance

To evaluate the practical possibility of the proposed FNCA + DNN model in a real-world deployment, real-time simulations were performed using pre-recorded EEG data. The simulation simulates the behaviour of an online driver monitoring system by feeding one EEG feature vector at a time to a trained model to simulate a real-time stream. Each sample is first transformed using a learned FNCA projection matrix and then classified by a trained DNN. The system outputs the predicted state (drowsy or alert) in real time as well as the inference time for each sample. This setup allows us to evaluate the responsiveness of the model and its suitability for integration into a real-time drowsiness detection system.
The real-time simulation was conducted on a personal computer with the following specifications: Intel® Core™ i7- 10750H CPU @ 2.60 GHz 2.59 GHz, 16 GB RAM, Windows 11 Pro (64-bit), and MATLAB R2022a. The simulation was run without GPU acceleration to reflect realistic on-board processing scenarios for embedded or edge computing environments. All inference times reported were measured on the CPU to better approximate performance in resource-constrained applications such as in-vehicle monitoring systems.
Timely detection of driver fatigue is crucial for ensuring road safety. In real-time driver monitoring systems, especially those utilizing EEG signals, the system’s responsiveness is critical. Research indicates that effective EEG-based driver monitoring systems should ideally process and respond to data within 100 milliseconds per sample to be considered truly real-time [53]. In our real-time simulations, the FNCA + DNN model demonstrated an average inference time of 10.4 milliseconds per sample and a throughput of approximately 96 samples per second. These results are well within the acceptable range for real-time applications, ensuring timely detection and response to drowsiness events. The high throughput and low latency of our model underscore its suitability for deployment in a real-world driver monitoring scenario.

4.5. Ten-Fold Cross-Validation Results

In order to evaluate the robustness and generalization of the proposed FNCA + DNN model, a 10-fold cross-validation experiment was performed on the converted SEED-VID (Sb14-21) dataset. Table 8 shows the classification accuracy for each fold. The results show that the model achieves consistent high performance in all folding, with an average accuracy of 90.386% and a standard deviation of ±0.81, which proves the stability and effectiveness of the FNCA based feature transformation combined with DNN architecture.

4.6. Understanding the Attention Mechanism and Feature Importance

To help the model focus on the most important parts of the EEG data, we added a simple attention mechanism to the FNCA + DNN architecture. This layer of attention comes before the final output and plays a key role in improving the accuracy of the model and our understanding of how it makes decisions.
The attention mechanism works by giving weight to each input feature, showing the importance of that feature when the model predicts whether the driver is sleepy or alert. These weights are calculated using the Softmax function, so they are all positive numbers that add up to one. In our example, the model processes 85 features, built from 17 EEG channels, each with five frequency bands (delta, theta, alpha, beta, and gamma). The attention layer helps highlight which combinations of brain regions and frequency bands are most useful for detecting signs of drowsiness.
To explore how the model uses this mechanism, we looked at the attention weights of all 10 folds for the cross-validation experiment. As shown in Figure 16, each fold has its own distribution of attention, but the overall results are consistent. In most folding, this model focuses most on the characteristics of the temporal region (e.g., TP8 and FT8) and posterior (e.g., Pz, PO4, and O1) regions of the brain, especially in the theta and alpha bands. In previous studies, these brain regions and frequency ranges have been associated with fatigue and reduced alertness, which gives us confidence in the model’s focus. We also averaged the attention weights for all folds, and the results are shown in Figure 17. This diagram clearly shows the features that the model relies on most often. Consistency between different training folds suggests that the model is not just learning random patterns, but recognizing real, meaningful signals that are repeated between subjects.

4.7. Comparison with State-of-the-Art Methods on the SEED-VIG Dataset

Table 9 compares the accuracy of our proposed FNCA + DNN model with several recent methods on the SEED-VIG dataset. Methods such as TSeption, ConvNext, LMDA, and NLMDA-Net reported accuracy ranging from 80% to low-to-mid, while methods based on CNN + LSTM and their variants had accuracy ranging from 85% to 87%. In contrast, our FNCA + DNN model achieved an impressive 94.29% when trained with data from 12 subjects and achieved 90.386 ± 0.81 when trained with data from all 21 subjects. These results clearly show that the combination of feature normalization and component analysis with deep neural networks significantly enhances the extraction of robust EEG features, thereby improving the generalization of new objects and establishing our method as an efficient solution for driver drowsiness detection.

5. Conclusions

The proposed FNCA + DNN model effectively solves several limitations found in previous work. By applying FNCA to metric learning, the model ensures a more discriminative feature space, thereby enhancing class separability before classification. This transformation is very beneficial for subsequent DNNs, which are built using dropout layers and batch normalization to reduce overfitting. In addition, the integration of attention mechanisms enables the network to dynamically focus on the most relevant EEG channels and frequency bands, improving performance and interpretability. The proposed model outperforms existing methods on multiple benchmarks, especially in terms of accuracy, generalization, and real-time applicability, making it a reliable candidate for deployment in driver monitoring systems. Our model has been evaluated on the SEED-VIG dataset and achieves state-of-the-art accuracy: 94.29% when trained on 12 subjects and 90.389% with 21 subjects, surpassing existing methods such as TSception, ConvNeXt LMDA-Net, and CNN + LSTM. These findings highlight the practical applicability of FNCA + DNN in real-time drowsiness detection systems that can be integrated into smart cars or wearable monitoring devices to prevent fatigue-related accidents. Future work will focus on improving inter-agent generalization, extending datasets using real-world driving conditions, and exploring hardware implementations of embedded systems. By addressing these areas, the proposed FNCA + DNN model can make a significant contribution to road safety and intelligent driver monitoring solutions.

Author Contributions

Conceptualization, S.H.A.-G., K.A.A.-S., I.M., C.C.O., G.S., K.M.A.A. and N.A.H.A.-S.; methodology, S.H.A.-G.; software, S.H.A.-G.; validation, S.H.A.-G., I.M., C.C.O., A.-M.C.D., G.S., K.M.A.A., N.A.M.A. and N.A.H.A.-S.; formal analysis, I.M., C.C.O. and A.-M.C.D.; investigation, S.H.A.-G. and K.A.A.-S.; data curation, S.H.A.-G.; writing—original draft preparation, S.H.A.-G., I.M. and C.C.O.; writing—review and editing, S.H.A.-G., I.M., C.C.O., A.-M.C.D. and N.A.M.A.; visualization, S.H.A.-G., K.A.A.-S., I.M., C.C.O., A.-M.C.D., G.S., K.M.A.A., N.A.M.A. and N.A.H.A.-S.; supervision, I.M. All authors have read and agreed to the published version of the manuscript.

Funding

This research received no external funding.

Institutional Review Board Statement

Not applicable.

Data Availability Statement

The data supporting the findings of this study are available from publicly accessible repositories. A resting-state EEG dataset for sleep deprivation used in this research can be accessed at OpenNeuro Available online: https://openneuro.org/datasets/ds004902/versions/1.0.7 (accessed on 7 December 2024). SEED-VIG, which was also utilized, is available at the SEED dataset (SEED Dataset Available online: https://bcmi.sjtu.edu.cn/~seed/seed-vig.html (accessed on 13 February 2025). These datasets provide the foundation for the analysis and validation of the proposed method. No new datasets were generated during this study. For further information or inquiries, please contact the corresponding author.

Acknowledgments

This work was supported by the European Commission under the “EvoRoads” project (G.A. 101147850) and by Norway Grants and UEFISCDI through the SOLID-B5G project—A Massive MIMO Enabled IoT Platform with Network Slicing for Beyond 5G IoV/V2X and Maritime Services. The views expressed herein are those of the authors, and they do not necessarily reflect the views of the European Commission. For more information, please contact the authors.

Conflicts of Interest

The authors declare no conflicts of interest.

Abbreviations

DAData augmentation
DDDrowsiness detection
DNNDeep neural network
EEGElectroencephalogram
FAWTFlexible analytic wavelet transform
FNCAFast neighbourhood component analysis
KNNK-nearest neighbours
NCANeighbourhood component analysis
NHTSANational Highway Traffic Safety Administration
pBCIPassive brain–computer interface
PCAPrincipal component analysis
PSDPower spectral density
RFRandom forest
SVMSupport vector machine
CNNConvolutional neural network
LSTMLong short-term memory
DLDeep learning
LPLow-pass
HPHigh-pass
RBFRadial basis function
PFCPrefrontal cortex
FCFrontal cortex
OCOccipital cortex
EBIEye blink interval
QMLQuantum machine learning
CNOTControlled-NOT gate
CZControlled-Z gate
iSWAPImaginary SWAP gate

References

  1. Albadawi, Y.; Takruri, M.; Awad, M. A Review of Recent Developments in Driver Drowsiness Detection Systems. Sensors 2022, 22, 2069. [Google Scholar] [CrossRef] [PubMed]
  2. Al-Gburi, S.; Kanar, A.; Al-Sammak, I.; Marghescu, C.C.; Khattab, M. Analyzing Different Models Driver Behavior Detection Using EEG Data. In Proceedings of the 15th International Conference Communications (COMM), Bucharest, Romania, 3–4 October 2024; pp. 1–5. [Google Scholar]
  3. Knapik, M.; Cyganek, B. Driver’s Fatigue Recognition Based on Yawn Detection in Thermal Images. Neurocomputing 2019, 338, 274–292. [Google Scholar] [CrossRef]
  4. Liu, W.; Qian, J.; Yao, Z.; Jiao, X.; Pan, J. Convolutional Two-Stream Network Using Multi-Facial Feature Fusion for Driver Fatigue Detection. Future Internet 2019, 11, 115. [Google Scholar] [CrossRef]
  5. You, F.; Gong, Y.; Tu, H.; Liang, J.; Wang, H. A Fatigue Driving Detection Algorithm Based on Facial Motion Information Entropy. J. Adv. Transp. 2020, 2020, 1–17. [Google Scholar] [CrossRef]
  6. Fouad, I.A. A Robust and Efficient EEG-Based Drowsiness Detection System Using Different Machine Learning Algorithms. Ain Shams Eng. J. 2023, 14, 101895. [Google Scholar] [CrossRef]
  7. Al-Gburi, S.H.; Al-Sammak, K.A.; Marghescu, I.; Oprea, C.C. State of the Art in Drivers’ Attention Monitoring—A Systematic Literature Review. Karbala Int. J. Mod. Sci. 2023, 9, 14–26. [Google Scholar] [CrossRef]
  8. Arakawa, T. Trends and Future Prospects of the Drowsiness Detection and Estimation Technology. Sensors 2021, 21, 7921. [Google Scholar] [CrossRef]
  9. Drowsy Driving. Available online: https://www.nhtsa.gov/risky-driving/drowsy-driving (accessed on 27 December 2024).
  10. Drowsiness. Available online: https://medlineplus.gov/ency/article/003208.htm (accessed on 27 December 2024).
  11. Yang, W.; Wang, K.; Zuo, W. Fast Neighborhood Component Analysis. Neurocomputing 2012, 83, 31–37. [Google Scholar] [CrossRef]
  12. Zheng, W.-L.; Lu, B.-L. A Multimodal Approach to Estimating Vigilance Using EEG and Forehead EOG. J. Neural Eng. 2017, 14, 026017. [Google Scholar] [CrossRef]
  13. Ramzan, M.; Khan, H.U.; Awan, S.M.; Ismail, A.; Ilyas, M.; Mahmood, A. A Survey on State-of-the-Art Drowsiness Detection Techniques. IEEE Access 2019, 7, 61904–61919. [Google Scholar] [CrossRef]
  14. Drivers Are Falling Asleep Behind the Wheel. Available online: https://www.nsc.org/road/safety-topics/fatigued-driver (accessed on 27 December 2024).
  15. Suni, E. Drowsy Driving: Dangers and How to Avoid It|Sleep Foundation; Sleep Foundation: Arlington, VA, USA, 2022. [Google Scholar]
  16. Doudou, M.; Bouabdallah, A.; Berge-Cherfaoui, V. Driver Drowsiness Measurement Technologies: Current Research, Market Solutions, and Challenges. Int. J. Intell. Transp. Syst. Res. 2020, 18, 297–319. [Google Scholar] [CrossRef]
  17. Fu, B.; Boutros, F.; Lin, C.-T.; Damer, N. A Survey on Drowsiness Detection—Modern Applications and Methods. IEEE Trans. Intell. Veh. 2024, 1–23. [Google Scholar] [CrossRef]
  18. Wu, P.; Song, L.; Meng, X. Temporal Analysis of Cellphone-Use-Involved Crash Injury Severities: Calling for Preventing Cellphone-Use-Involved Distracted Driving. Accid. Anal. Prev. 2022, 169, 106625. [Google Scholar] [CrossRef] [PubMed]
  19. Al-Gburi, S.H.; Al-Sammak, K.A.; Alheeti, K.M.A.; Suciu, G.; Abdulqader, A.G. Driver Behavior Assessment with Different ML Models Using EEG and Physiological Data—A Comparative Study. In Proceedings of the 2024 16th International Conference on Electronics, Computers and Artificial Intelligence (ECAI), Iasi, Romania, 27–28 June 2024; IEEE: New York, NY, USA, 2024. [Google Scholar]
  20. Korotcov, A.; Tkachenko, V.; Russo, D.P.; Ekins, S. Comparison of Deep Learning with Multiple Machine Learning Methods and Metrics Using Diverse Drug Discovery Data Sets. Mol. Pharm. 2017, 14, 4462–4475. [Google Scholar] [CrossRef]
  21. Sikander, G.; Anwar, S. Driver Fatigue Detection Systems: A Review. IEEE Trans. Intell. Transp. Syst. 2019, 20, 2339–2352. [Google Scholar] [CrossRef]
  22. Mohammed Hashim, B.A.; Amutha, R. Human Activity Recognition Based on Smartphone Using Fast Feature Dimensionality Reduction Technique. J. Ambient Intell. Humaniz. Comput. 2021, 12, 2365–2374. [Google Scholar] [CrossRef]
  23. Subasi, A.; Saikia, A.; Bagedo, K.; Singh, A.; Hazarika, A. EEG-Based Driver Fatigue Detection Using FAWT and Multiboosting Approaches. IEEE Trans. Industr. Inform. 2022, 18, 6602–6609. [Google Scholar] [CrossRef]
  24. Ren, Z.; Li, R.; Chen, B.; Zhang, H.; Ma, Y.; Wang, C.; Lin, Y.; Zhang, Y. EEG-Based Driving Fatigue Detection Using a Two-Level Learning Hierarchy Radial Basis Function. Front. Neurorobot. 2021, 15, 618408. [Google Scholar] [CrossRef]
  25. Shahbakhti, M.; Beiramvand, M.; Nasiri, E.; Far, S.M.; Chen, W.; Sole-Casals, J.; Wierzchon, M.; Broniec-Wojcik, A.; Augustyniak, P.; Marozas, V. Fusion of EEG and Eye Blink Analysis for Detection of Driver Fatigue. IEEE Trans. Neural Syst. Rehabil. Eng. 2023, 31, 2037–2046. [Google Scholar] [CrossRef]
  26. Cui, J.; Lan, Z.; Sourina, O.; Muller-Wittig, W. EEG-Based Cross-Subject Driver Drowsiness Recognition with an Interpretable Convolutional Neural Network. IEEE Trans. Neural Netw. Learn. Syst. 2023, 34, 7921–7933. [Google Scholar] [CrossRef]
  27. Fang, W.; Tang, L.; Pan, J. AGL-Net: An Efficient Neural Network for EEG-Based Driver Fatigue Detection. J. Integr. Neurosci. 2023, 22, 146. [Google Scholar] [CrossRef] [PubMed]
  28. Siddhad, G.; Dey, S.; Roy, P.P.; Iwamura, M. Awake at the Wheel: Enhancing Automotive Safety Through EEG-Based Fatigue Detection; Springer: Berlin/Heidelberg, Germany, 2024. [Google Scholar]
  29. Arif, S.; Munawar, S.; Ali, H. Driving Drowsiness Detection Using Spectral Signatures of EEG-Based Neurophysiology. Front. Physiol. 2023, 14, 1153268. [Google Scholar] [CrossRef] [PubMed]
  30. Yaacob, S.; Izzati Affandi, N.A.; Krishnan, P.; Rasyadan, A.; Yaakop, M.; Mohamed, F. Drowsiness Detection Using EEG and ECG Signals. In Proceedings of the 2020 IEEE 2nd International Conference on Artificial Intelligence in Engineering and Technology (IICAIET), Kota Kinabalu, Malaysia, 26–27 September 2020; IEEE: New York, NY, USA, 2020. [Google Scholar]
  31. Miao, Z.; Zhao, M.; Zhang, X.; Ming, D. Lmda-Net: Alightweight Multi-Dimensional Attention Network General Eeg-Based Braincomputer Interfaces Interpretability. NeuroImage 2023, 276, 120209. [Google Scholar] [CrossRef]
  32. Ding, Y.; Robinson, N.; Zhang, S.; Zeng, Q.; Guan, C. TSception: Capturing Temporal Dynamics and Spatial Asymmetry from EEG for Emotion Recognition. IEEE Trans. Affect. Comput. 2023, 14, 2238–2250. [Google Scholar] [CrossRef]
  33. Liu, Z.; Mao, H.; Wu, C.-Y.; Feichtenhofer, C.; Darrell, T.; Xie, S. Convnet 2020s. In Proceedings of the IEEE/CVF Conference Computer Vision Pattern Recognition, New Orleans, LA, USA, 18–24 June 2022; pp. 11976–11986. [Google Scholar]
  34. Lins, I.D.; Araújo, L.M.M.; Maior, C.B.S.; Ramos, P.M.d.S.; Moura, M.J.d.C.; Ferreira-Martins, A.J.; Chaves, R.; Canabarro, A. Quantum Machine Learning for Drowsiness Detection with EEG Signals. Process Saf. Environ. Prot. 2024, 186, 1197–1213. [Google Scholar] [CrossRef]
  35. Cui, J.; Yuan, L.; Li, R.; Wang, Z.; Yang, D.; Jiang, T. Benchmarking EEG-Based Cross-Dataset Driver Drowsiness Recognition with Deep Transfer Learning. Annu. Int. Conf. IEEE Eng. Med. Biol. Soc. 2023, 2023, 1–6. [Google Scholar]
  36. Hidalgo Rogel, J.M.; Martínez Beltrán, E.T.; Quiles Pérez, M.; López Bernal, S.; Martínez Pérez, G.; Huertas Celdrán, A. Studying Drowsiness Detection Performance While Driving through Scalable Machine Learning Models Using Electroencephalography. Cognit. Comput. 2024, 16, 1253–1267. [Google Scholar] [CrossRef]
  37. Lan, Z.; Zhao, J.; Liu, P.; Zhang, C.; Lyu, N.; Guo, L. Driving Fatigue Detection Based on Fusion of EEG and Vehicle Motion Information. Biomed. Signal Process. Control 2024, 92, 106031. [Google Scholar] [CrossRef]
  38. Xiang, C.; Fan, X.; Bai, D.; Lv, K.; Lei, X. A Resting-State EEG Dataset for Sleep Deprivation. Sci. Data 2024, 11, 427. [Google Scholar] [CrossRef]
  39. Manohare, M.; Rajasekar, E.; Parida, M. Analysing Change Brain Waves Due Heterogeneous Road Traffic Noise Exposure Using Electroencephalography Measurements. Noise Health 2023, 25, 36–54. [Google Scholar] [CrossRef]
  40. Stancin, I.; Frid, N.; Cifrek, M.; Jovic, A. EEG Signal Multichannel Frequency-Domain Ratio Indices for Drowsiness Detection Based on Multicriteria Optimization. Sensors 2021, 21, 6932. [Google Scholar] [CrossRef] [PubMed]
  41. Borghini, G.; Astolfi, L.; Vecchiato, G.; Mattia, D.; Babiloni, F. Measuring Neurophysiological Signals in Aircraft Pilots and Car Drivers for the Assessment of Mental Workload, Fatigue and Drowsiness. Neurosci. Biobehav. Rev. 2014, 44, 58–75. [Google Scholar] [CrossRef] [PubMed]
  42. Eoh, H.J.; Chung, M.K.; Kim, S.-H. Electroencephalographic Study of Drowsiness in Simulated Driving with Sleep Deprivation. Int. J. Ind. Ergon. 2005, 35, 307–320. [Google Scholar] [CrossRef]
  43. Yi Wen, T.; Mohd Aris, S.A. Electroencephalogram (EEG) Stress Analysis on Alpha/Beta Ratio and Theta/Beta Ratio. Indones. J. Electr. Eng. Comput. Sci. 2020, 17, 175. [Google Scholar] [CrossRef]
  44. Irudayasamy, A.; Ganesh, D.; Natesh, M.; Rajesh, N.; Salma, U. Big Data Analytics on the Impact of Omicron and Its Influence on Unvaccinated Community through Advanced Machine Learning Concepts. Int. J. Syst. Assur. Eng. Manag. 2022, 15, 346–355. [Google Scholar] [CrossRef]
  45. Romero-Laiseca, M.A.; Delisle-Rodriguez, D.; Cardoso, V.; Gurve, D.; Loterio, F.; Posses Nascimento, J.H.; Krishnan, S.; Frizera-Neto, A.; Bastos-Filho, T. A Low-Cost Lower-Limb Brain-Machine Interface Triggered by Pedaling Motor Imagery for Post-Stroke Patients Rehabilitation. IEEE Trans. Neural Syst. Rehabil. Eng. 2020, 28, 988–996. [Google Scholar] [CrossRef]
  46. Zhao, G.; Wu, Y. An Efficient Kernel-Based Feature Extraction Using a Pull–Push Method. Appl. Soft Comput. 2020, 96, 106584. [Google Scholar] [CrossRef]
  47. Wang, F.; Zhang, H.; Wang, K.; Zuo, W. Fast neighbourhood component analysis with spatially smooth regulariser for robust noisy face recognition. IET Biom. 2014, 3, 278–290. [Google Scholar] [CrossRef]
  48. Srivastava, N.; Hinton, G.; Krizhevsky, A.; Sutskever, I.; Salakhutdinov, R. Dropout: A simple way to prevent neural networks from overfitting. J. Mach. Learn. Res. 2014, 15, 1929–1958. [Google Scholar]
  49. Lawhern, V.J.; Solon, A.J.; Waytowich, N.R.; Gordon, S.M.; Hung, C.P.; Lance, B.J. EEGNet: A compact convolutional neural network for EEG-based brain–computer interfaces. J. Neural Eng. 2018, 15, 056013. [Google Scholar] [CrossRef]
  50. Ioffe, S.; Szegedy, C. Batch Normalization: Accelerating Deep Network Training by Reducing Internal Covariate Shift. In Proceedings of the 32nd International Conference on Machine Learning (ICML), Lille, France, 6–11 July 2015; pp. 448–456. [Google Scholar]
  51. Roy, Y.; Banville, H.; Albuquerque, I.; Gramfort, A.; Falk, T.H.; Faubert, J. Deep learning-based electroencephalography analysis: A systematic review. J. Neural Eng. 2019, 16, 051001. [Google Scholar] [CrossRef] [PubMed]
  52. Schirrmeister, R.T.; Springenberg, J.T.; Fiederer, L.D.J.; Glasstetter, M.; Eggensperger, K.; Tangermann, M.; Hutter, F.; Burgard, W.; Ball, T. Deep learning with convolutional neural networks for EEG decoding and visualization. Hum. Brain Mapp. 2017, 38, 5391–5420. [Google Scholar] [CrossRef] [PubMed]
  53. Zhang, C.; Eskandarian, A. A Survey and Tutorial of EEG-Based Brain Monitoring for Driver State Analysis. IEEE/CAA J. Autom. Sin. 2021, 8, 1222–1242. [Google Scholar] [CrossRef]
Figure 1. Workflow for EEG-based driver drowsiness detection.
Bdcc 09 00126 g001
Figure 2. Block diagram for the FNCA + DNN.
Bdcc 09 00126 g002
Figure 3. Block diagram for DNN layer model.
Bdcc 09 00126 g003
Figure 4. Training and validation metrics over 30 epochs at a learning rate of 0.001.
Bdcc 09 00126 g004
Figure 5. Simulation results of FNCA + DNN at 30 epochs with a learning rate of 0.001.
Bdcc 09 00126 g005
Figure 6. Simulation results of FNCA + DNN at 50 epochs with a learning rate of 0.001.
Bdcc 09 00126 g006
Figure 7. Simulation results of FNCA + DNN at 40 epochs with a learning rate of 0.001.
Bdcc 09 00126 g007
Figure 8. Simulation results of FNCA + DNN at 30 epochs with a learning rate of 0.01.
Bdcc 09 00126 g008
Figure 9. An improved FNCA + DNN model for driver drowsiness detection using EEG signals.
Bdcc 09 00126 g009
Figure 10. Results of the applied proposed model for different subjects.
Bdcc 09 00126 g010
Figure 11. The results of applying the improved FNCA + DNN model to SEED-VIG EEG data for 12 subjects.
Bdcc 09 00126 g011
Figure 12. The results of applying the improved FNCA + DNN model to SEED-VIG EEG data for 21 subjects.
Bdcc 09 00126 g012
Figure 13. The results of applying the improved FNCA + DNN model to original dataset EEG data for 71 subjects.
Bdcc 09 00126 g013
Figure 14. Accuracy and loss results for the experiment where subjects 1–11 were used for training and subject 21 for testing.
Bdcc 09 00126 g014
Figure 15. Accuracy and loss results for the experiment where subjects 1–19 were used for training and subject 21 for testing.
Bdcc 09 00126 g015
Figure 16. Attention weight patterns from each of the 10 folds.
Bdcc 09 00126 g016
Figure 17. Average attention weights across all folds.
Bdcc 09 00126 g017
Table 1. The proposed FNCA + DNN model is compared with recent work on EEG-based driver drowsiness detection, highlighting key criteria and performance advantages.
CriteriaProposed Model (FNCA + DNN)Recent Works ([8,21,23,24,25,26,27,28,29,30,31,32,33,34,35,36,37])Key Advantage of the Proposed Model
FNCA for Metric Learning✗ (None use FNCA; Ref. [25] uses NCA)Optimizes feature space for classification via metric learning, enhancing k-NN/discriminative power.
DNN Architecture✓ (4 FC layers + BatchNorm/Dropout)✓ (Refs.[25,27,31,32,33,34,35,36] use DNNs)Balances depth and simplicity with regularization for robust EEG feature extraction.
Multi-Band EEG Analysis✓ (Explicit 5-band EEG features)✗ (Refs. [24,29] use spectral bands; others lack structured multi-band focus)Captures nuanced neural activity across bands for early drowsiness detection.
Attention Mechanisms✗ (Only Ref. [31] uses attention)Focuses on salient EEG regions, suppressing noise and improving feature relevance.
Real-Time Applicability✓ (Refs. [25,27,36] emphasize real-time)Lightweight DNN + FNCA enables efficient edge deployment.
Hybrid Data Integration✗ (EEG-only)✓ (Ref. [37] combines EEG + vehicle data)Maintains focus on EEG-centric detection for simplicity and cost-effectiveness.
Cross-Dataset Generalization✓ (Ref. [35] uses transfer learning)Future work can extend to cross-dataset validation.
Table 2. Selected attributes.
ChannelDescriptionMeasurement Unit
CzCentral electrode measurementMicrovolts (uV)
FzFrontal electrode measurementMicrovolts (uV)
T7Temporal, right electrode measurementMicrovolts (uV)
T8Temporal, left electrode measurementMicrovolts (uV)
C3Central, right electrode measurementMicrovolts (uV)
C4Central, left electrode measurementMicrovolts (uV)
PO7Parietal, right electrode measurementMicrovolts (uV)
PO8Parietal, left electrode measurementMicrovolts (uV)
Table 3. Sample of the labelled dataset.
Alpha_CzBeta_CzAlpha_FzBeta_FzAlpha_T7Beta_T7Alpha_T8Beta_T8Alpha_C3Beta_C3Alpha_C4Beta_C4Alpha_PO7Beta_PO7Alpha_PO8Beta_PO8Label
0.47470.13450.79860.34560.10200.05310.23780.07270.16870.04760.36730.09261.25820.25201.23790.2862Intermediate
0.73680.54760.72380.90660.15720.16380.26210.32660.20760.20510.30650.40581.75521.01291.66531.0814Alert
0.22030.19480.47490.45520.08160.07600.09480.10870.10050.08400.10700.16220.60200.33420.65780.3274Alert
2.01050.04570.88690.04455.95310.55873.26530.55252.34420.19742.07680.15994.93040.19377.85940.1390Drowsy
Table 4. DNN layers and the parameters.
LayerParameters
Input LayerInput size: Number of features
Fully Connected Layer 1Number of neurons: 100 (learns complex patterns by connecting all inputs to 100 hidden neurons)
ReLU Layer 1Activation function: ReLU
Fully Connected Layer 2Number of neurons: 100
ReLU Layer 2Activation function: ReLU
Fully Connected Layer 3Number of neurons: Number of unique classes
Softmax LayerActivation function: Softmax
Classification LayerClassification layer
Training OptionsOptimization algorithm: Adam (adaptive learning rate optimizer; balances speed and stability for convergence)
Maximum epochs: 30
Mini-batch size: 128 (processes 128 samples per gradient update (balances memory and converge))
Initial learning rate: 1 × 10⁻³ (initial step size for weight updates; prevents overshooting minima)
L2 Regularization: 1 × 10⁻⁴ (fines large weights to reduce overfitting)
Table 5. The simulation results for 4 different experiments.
Learning RateEpochsMini-Batch AccuracyValidation Accuracy
0.00103086.72%83.67%
0.00105088.28%83.59%
0.00104089.84%82.80%
0.0103081.25%81.43%
Table 6. Improved FNCA + DNN network architecture.
Layer NameTypeUnits/FiltersActivationDropout Rate
inputLayerFeature Input LayerInput Size--
FC1Fully Connected Layer256--
BN1Batch Normalization---
ReLU1ReLU Activation-ReLU-
FC2Fully Connected Layer128--
BN2Batch Normalization---
ReLU2ReLU Activation-ReLU-
FC3Fully Connected Layer64--
BN3Batch Normalization---
ReLU3ReLU Activation-ReLU-
dropout1Dropout Layer--0.3
FC4Fully Connected Layer32--
BN4Batch Normalization---
ReLU4ReLU Activation-ReLU-
dropout2Dropout Layer--0.2
FC_outputFully Connected LayernumClasses--
SoftmaxSoftmax LayernumClassesSoftmax-
OutputLayerClassification Layer---
Table 7. SEED-VIG dataset configurations and accuracy results.
ConfigurationAccuracy (Proposed) Accuracy
KNN [37], 2024
Train Subject 1Test Subject 2152.77%35%
Train Subjects 1–11Test Subject 2172.09%51%
Train Subjects 1–19Test Subject 2177.18%60%
Train Subject 4Test Subject 2174.92%-
Train Subject 4Test Subject 881.47%-
Table 8. Ten-fold cross-validation results.
FoldAccuracy (%)
0Fold 190.03
1Fold 290.44
2Fold 390.71
3Fold 489.63
4Fold 589.9
5Fold 691.79
6Fold 789.5
7Fold 890.58
8Fold 989.5
9Fold 1091.78
10Mean ± Std90.386 ± 0.81
Table 9. Accuracy comparison on the SEED-VIG dataset for FNCA + DNN and recent methods.
ReferenceYearClassifierAccuracy (%)
[33]2022TSeption 83.15 ± 0.36
[29]2025
[34]2022ConvNext 81.95 ± 0.61
[29]2025
[32]2023LMDA81.06 ± 0.99
[29]2025
[29]2025NLMDA-Net 83.71 ± 0.30
[36]2023EDJAN transfer learning 0.76
[28]2023CNN + LSTM85.1 ± 0.5
[28]2023ATT + CNN + LSTM85.6 ± 0.3
[28]2023Ghost + LSTM86.6 ± 0.4
[28]2023ATT + Ghost + LSTM87.3 ± 0.2
[28]2023CNN + LST85.1 ± 0.5
Proposed model FNCA + DNN 12 subjects 0.9429
Proposed model FNCA + DNN 21 subjects90.386 ± 0.81
Disclaimer/Publisher’s Note: The statements, opinions and data contained in all publications are solely those of the individual author(s) and contributor(s) and not of MDPI and/or the editor(s). MDPI and/or the editor(s) disclaim responsibility for any injury to people or property resulting from any ideas, methods, instructions or products referred to in the content.

