Article

Quantifying Post-Purchase Service Satisfaction: A Topic–Emotion Fusion Approach with Smartphone Data

School of Cyberspace Security (School of Cryptology), Hainan University, Haikou 570228, China
*
Authors to whom correspondence should be addressed.
These authors contributed equally to this work.
Big Data Cogn. Comput. 2025, 9(5), 125; https://doi.org/10.3390/bdcc9050125
Submission received: 1 April 2025 / Revised: 28 April 2025 / Accepted: 5 May 2025 / Published: 8 May 2025

Abstract

Effectively identifying factors related to user satisfaction is crucial for evaluating customer experience. This study proposes a two-phase analytical framework that combines natural language processing techniques with hierarchical decision-making methods. In Phase 1, an ERNIE-LSTM-based emotion model (ELEM) is used to detect fake reviews from 4016 smartphone evaluations collected from JD.com (accuracy: 84.77%, recall: 84.86%, F1 score: 84.81%). The filtered genuine reviews are then analyzed using Biterm Topic Modeling (BTM) to extract key satisfaction-related topics, which are weighted based on sentiment scores and organized into a multi-criteria evaluation matrix through the Analytic Hierarchy Process (AHP). These topics are further clustered into five major factors: user-centered design (70.8%), core performance (10.0%), imaging features (8.6%), promotional incentives (7.8%), and industrial design (2.8%). This framework is applied to a comparative analysis of two smartphone stores, revealing that Huawei Mate 60 Pro emphasizes performance, while Redmi Note 11 5G focuses on imaging capabilities. Further clustering of user reviews identifies six distinct user groups, all prioritizing user-centered design and core performance, but showing differences in other preferences. In Phase 2, a comparison of word frequencies between product reviews and community Q and A content highlights hidden user concerns often missed by traditional single-source sentiment analysis, such as screen calibration and pixel density. These findings provide insights into how product design influences satisfaction and offer practical guidance for improving product development and marketing strategies.

1. Introduction

With the development of online shopping, modern market competition has prompted consumers to pay more attention to services. Although many studies have been conducted, traditional methods are difficult to reflect the complex information between consumers and service suppliers. For example, Vakulenko et al. [1] quantitatively study customer satisfaction based on last-mile delivery experience in Sweden, and find that logistic reliability is an important mediator affecting customers’ overall satisfaction during their trip; Rita et al. [2] use structured surveys based on four dimensions (website design, privacy, customer service, order fulfillment) to investigate e-service quality; Chen et al. [3] used clustering analysis and text mining to analyze users’ Q and A comments and reviews based on question-and-answer websites and review sites; however, because K-means was used for cluster analysis, it may not be suitable for processing unstructured texts. Similarly, Bao and Yuan [4] only focused on purchase intent based on structured survey data but ignored the emotions contained in feedback statements. Also, Li et al. [5] studied product consumer satisfaction by analyzing word frequencies and regression models using tea reviews, but mainly analyzed simple discrete textual indicators instead of whole-text analyses.
The above research provides some inspiration, but due to the too narrow perspective caused by the excessive use of structured survey data or simple text analysis methods, they cannot reflect the complicated feelings hidden in consumers’ feedback reviews. At the same time, these studies divide objective parameters such as delivery time from subjective parameters such as aesthetics of the products themselves, which makes them inconvenient for a full understanding of consumer decision behavior.
Therefore, in response to the above problems, we propose a dual-source text mining method combining product review texts and community-based Q and A texts for sentiment-weighted hierarchical analysis with topic modeling. It reveals new dimensions regarding service experience and connects user demands directly to product characteristics. This enables companies to obtain specific instructions for improving products and guiding marketing activities, transforming fragmented feedback into useful strategic information for business decisions.
The main contributions of this paper are as follows:
  • We present a comprehensive evaluation framework that integrates product reviews and Q and A data, addressing the limitations of single-indicator and survey-based methods.
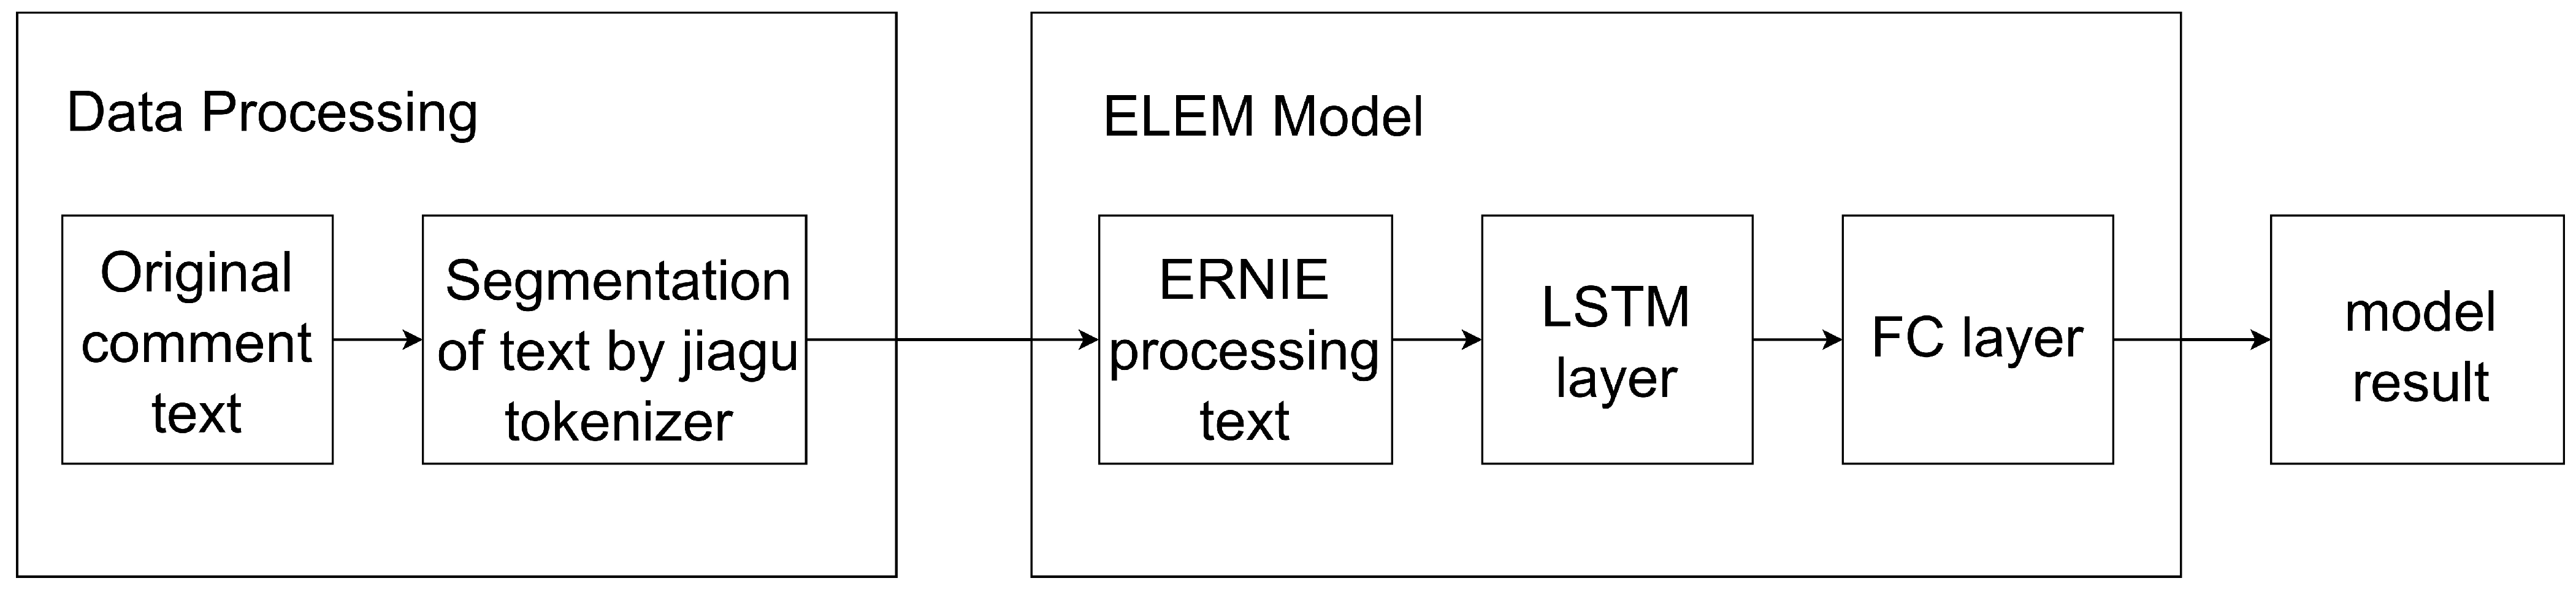
  • We introduce the ERNIE-LSTM Emotion Model (ELEM), a lightweight extension of the CFEE framework, optimized for real-world user reviews and more effective in detecting and filtering fake content.
  • We apply Biterm Topic Modeling (BTM) to filtered reviews to extract latent service dimensions and construct a sentiment-weighted evaluation structure.
  • Clustering analysis of Q and A content, combined with word frequency statistics, enables cross-corpus comparisons and reveals hidden service quality issues not captured by conventional approaches.
The rest of this paper is organized as follows: in Section 2, we review related works. Data and methods are introduced in Section 3. Experiments results and findings are presented in Section 4. We give conclusion and future work in Section 5.

2. Literature Review

In this section, we briefly summarize the recent literature about service evaluation in four aspects: (1) the relationship between text features and perceived service quality; (2) the role of text analytics in modeling customer satisfaction; (3) the combination of multiple sources for evaluation; (4) methodological deficiencies motivating our study framework.

2.1. Text Features and Service Quality

Customer’s user-generated textual reviews are being used more frequently as an indicator of perceived service quality. There are some studies on the influence of different textual features on customer evaluations and decision-making, including emotional tone of review texts, length of review texts, frequency of reviews, etc. Xu [6] found that positive emotions expressed in blind box e-commerce review texts could stimulate the customers’ platform engagement. Xu et al.’s results indicated that a high degree of emotion expression had been influenced by long-term text writing habits. Researchers also discovered that emotional reactions were affected by how many periods the consumer purchased on the platform and how much time they spent using it. Chen et al. [7] conducted eye-tracking experiments to investigate the impact of emotional content of review texts on purchasing behavior. Results showed that consumers tend to look at negative reviews more often than positive reviews due to negative feedback having a greater impact on purchase decisions; therefore, companies should respond quickly. Another study by Xu et al. [8] focused on the temporal changes in online reviews about customers’ satisfaction and recommendation but did not collect different types of text data or use methods such as sentiment-weighted hierarchical evaluation like this study.
Li et al. [9] found that there is an inverted U-shaped relationship between review text length and persuasive power—that is, short or long reviews tended to be less convincing than medium-length ones. Lu and Feng [10] concluded that consumers’ attitudes toward restaurant food were formed more by negative comments than positive ones when making purchase decisions, especially for expensive products. Zheng [11] pointed out the role of quantity in deciding purchases, while Zhou et al. [12] warned against giving priority only to niche lengthy content, which can result in biased opinions due to low diversity.
In summary, these works have emphasized the direct effect of different textual features, such as emotional tone, length, and frequency of review texts on customers’ perception of service quality. Very few works have constructed a systematic scoring model based on those textual features to evaluate the quality of a service. This work will make efforts to fill this research gap through the proposed sentiment–topic evaluation matrix.

2.2. Text Analytics in Service Evaluation

Recently, most works in the area of text-based service evaluation combined sentiment modeling with machine learning. Liu and Chen [13] constructed a framework based on an LSTM network and a hierarchical service quality model to analyze hotel services using online reviews; it can take into account time changes and has outperformed RNN and ANN models for customer sentiment. In addition, their sensitivity analysis also provides some areas that need improvement; for example, Wi-Fi and food. Similarly, Wang et al. [14] studied the trend of public opinion about construction outside the site through a large number of online data. Sun et al. [15] analyzed emotional feedback from users to construct a sentiment-aware recommendation system, which improves the suggestion of items on social networks. Sun [16] constructed a structured satisfaction assessment framework for ecotourism, proving the value of careful organization of data, but some problems still occurred. Cao [17] and Darko and Liang [18] rely mainly on the content of online reviews and ignore the authenticity of them, so the reliability of the data is questionable. Kumar et al. [19] examined customers’ satisfaction with grocery mobile applications, and only two countries—South Africa and Italy—were included in the study instead of China’s e-commerce sector; therefore, their results lack wide applicability. Zhao and Huang [20] used LDA topic modeling and Sentiment Score methods to mine satisfaction factors from anti-cold drug review texts but did not consider mining deeper semantic relationships between documents or comparing and validating results obtained from different datasets, so the conclusions were not very solid. Park [21] used Term Frequency-Inverse Document Frequency (TF-IDF) to determine significant service words such as “food” and “seat”, and then removed emotion-related terms to focus only on objectivity of service characteristics. Finally, a Data Envelopment Analysis (DEA) model was used to calculate multi-dimensional satisfaction. They do not use Deep Learning Models such as Bidirectional Encoder Representations from Transformers (BERT). However, they achieve consistency in TF-IDF results by validating with Latent Dirichlet Allocation (LDA).
Li et al. [22] adopted a topic-modeling-based method to examine how user-generated content and marketer-generated content affect Customer Satisfaction in the catering industry. But their research lacks interindustry testing and does not combine multiple kinds of feedback. Aldunate et al. [23] introduced a Deep Learning Architecture Based on BERT for identifying satisfaction drivers from structured survey responses through multi-label classification. The problem here is that their approach uses formal questionnaires and cannot easily process feedback from open-ended and unstructured questions found on review platforms and Q and A platforms. Our work combines unsupervised topic modeling with various feedback sources.
The previous studies show that text analytics are beneficial for service evaluation. But most of them simply discard some critical parts like authentic evidence, topic inspection, and emotional strength measurement. The proposed ELEM-BTM-AHP pipeline integrates verified emotional scores in the evaluation system.

2.3. Multi-Source Data Convergence in Service Evaluation

Recent research has shown that combining different types of data can add more value to service evaluation. Park et al. [24] combined online discussion about COVID-19 policy in the US with airport mobility data through computation to demonstrate that different data combinations would generally provide details valuable and informative only from their respective perspectives. Wu et al. [25] use maritime industry accident reports as an application of combining different datasets across industries. Such exploration shows that multiple-data approach could be promising. Xu [26] studied what affects customer satisfaction in food delivery reviews but did not include insights from multiple platforms. Shi and Peng [27] develop a big-data augmented Kano model method for customer needs classification but do not consider combination various contents such as review and Q and A data.
In summary, while exploring the customers’ potential demand, solutions using multiple types of information could be meaningful and necessary; there are limited studies on applying community-based Q and A and review data together to explore customers’ deep concerns. Our study applies dual-source clustering and comparison of content analysis to unveil further insights about hidden customer issues.

2.4. Methodological Limitations and Conceptual Framework

As for the existing research, firstly, it relies too much on subjective methods such as questionnaires and simple text analysis. Secondly, review information authentication, topic information judgment, emotional intensity estimation, and various data resource uses have been ignored. Finally, e-commerce review topic modeling based on BTM has not yet been focused on. Therefore, a new methodology composed of two parts is proposed in this paper: (1) important service topics were extracted from real e-commerce reviews based on BTM and weighted by feeling scores; the obtained topics were structured into an evaluation matrix at a consistency ratio less than 0.1 via the AHP method to make efforts to compare the satisfaction of smartphone brand services through user profile construction and study of behavior difference and preference; (2) differences between products, Q and A, etc., among different communities were explored.
In summary, such a configuration can help absorb the complicated user feedback into an observable assessment process, enriching the method dimension and providing beneficial inspiration for service quality improvement.

3. Materials and Methods

This section outlines the datasets and methodologies used in this study. Section 3.1 describes the software environment supporting the implementation of the framework. Section 3.2 details the procedures for detecting fake reviews and preprocessing textual data. Section 3.3 presents the overall data processing pipeline, including topic extraction using the Biterm Topic Model (BTM), constructing user profiles, and identifying underlying factors influencing user satisfaction, with the aim of finding out the main determinants of satisfaction in the JD Mall mobile electronic mall market and measuring their weight.

3.1. Software and Tools

We used Python 3.9 (v3.9.8) to develop all of our algorithms. The algorithm for topic modeling based on sparse short texts was implemented using the BitermPlus package (v0.7.0), which is specifically provided for this purpose. We performed data preprocessing and numerical computation with Pandas (v2.1.1) and NumPy (v1.26.0), respectively. Clustering, similarity calculation, and performance evaluation were conducted using Scikit-learn (v1.4.1). Sentiment classification and fake review detection were executed using a pre-trained ERNIE fine-tuned model by the PaddlePaddle Team. All experiments were run on Windows 11, and Matplotlib (version 3.8.0) was used for data visualization where needed.

3.2. Data Collection

This study used a multi-source framework to evaluate service quality based on data collected from JD Mall’s mobile phone marketplace. Four different types of data were used for different analysis tasks. First, domain-specific keywords were extracted from top-selling smartphone reviews using the TextRank algorithm, and these keywords helped refine the sentiment dictionary and highlight important service-related terms. Second, another review dataset goes through BTM topic modeling and can be extracted quantified service topics. Third, a neural network model was trained on labeled reviews to detect and remove fake or suspicious comments, improving the overall quality of the data. Fourth, we analyzed a community-based Q and A dataset to study user–service interactions, by identifying common questions and typical answers related to service experiences.
The data collection followed three main criteria: products were limited to the top 10 best-selling JD smartphone models; only stores with at least 500 monthly sales and 150 verified reviews were included; and all data were collected between October 2023 and March 2024 to ensure that the results reflected current market trends. The content, size, and labels of the dataset are shown in Table 1.

3.2.1. Fake Review Detection Model

To ensure the reliability of user-generated content prior to sentiment analysis and topic modeling, we proposed a fake review detection architecture, termed the ERNIE-LSTM-Emotion-Model (ELEM). This model is simplified from the CFEE framework [28] by integrating contextual embeddings from a pre-trained ERNIE encoder with sequential modeling via a Long Short-Term Memory (LSTM) network, followed by binary classification through a fully connected layer.
The ELEM consists of three sequential modules: a contextual embedding layer, a sequential encoding layer, and a classification layer, as illustrated in Figure 1:
(1)
Contextual Embedding Layer
The input consists of original comment texts, which are first preprocessed and tokenized using the Jiagu tokenizer, enhanced with a domain-specific dictionary for mobile electronics. The tokenized texts are then fed into a 12-layer ERNIE encoder, pretrained on large-scale Chinese corpora. The ERNIE model has a hidden size of 768 and 12 attention heads per layer. All parameters of the ERNIE encoder are fine-tuned during model training, for each input, we selected the contextualized representation of [CLS] token at the last Transformer layer as sentence representations whose size was 768.
(2)
Sequential Encoding Layer (LSTM)
We reshape the [CLS] embedding (768-dimension) into [batch_size, 1, 768] and input it to the sequence model; a forward LSTM network with one layer whose input layer size is 768 and hidden layer size is 128 was selected to obtain the review information of the last time step from its output hidden layer.
(3)
Classification Layer
Then, we feed the hidden state of the last time step to an FC layer that takes 128-dim vector input and outputs a single score for binary classification. The model’s configurations are shown in Table 2.
We conducted benchmarking experiments using two baseline models: (1) ERNIE + Fully Connected and (2) the original CFEE model [28] on a manually labeled dataset of 1296 samples (balanced between genuine and fake reviews). Results were shown in Table 3.
Across the evaluated models, the ERNIE + FC model achieved an accuracy of 84.34%, with precision (P), recall (R), and F1 scores of 84.23%, 84.27%, and 84.26%, respectively. The CFEE model [28] attained an accuracy of 83.56%, with corresponding P, R, and F1 scores of 83.51%, 83.39%, and 83.44%. Notably, the ELEM outperformed both, achieving an accuracy of 84.88% and the highest P, R, and F1 scores of 84.77%, 84.86%, and 84.81%. These results suggest that the integration of contextual embeddings and sequential encoding in the ELEM offers a modest improvement in classification performance.

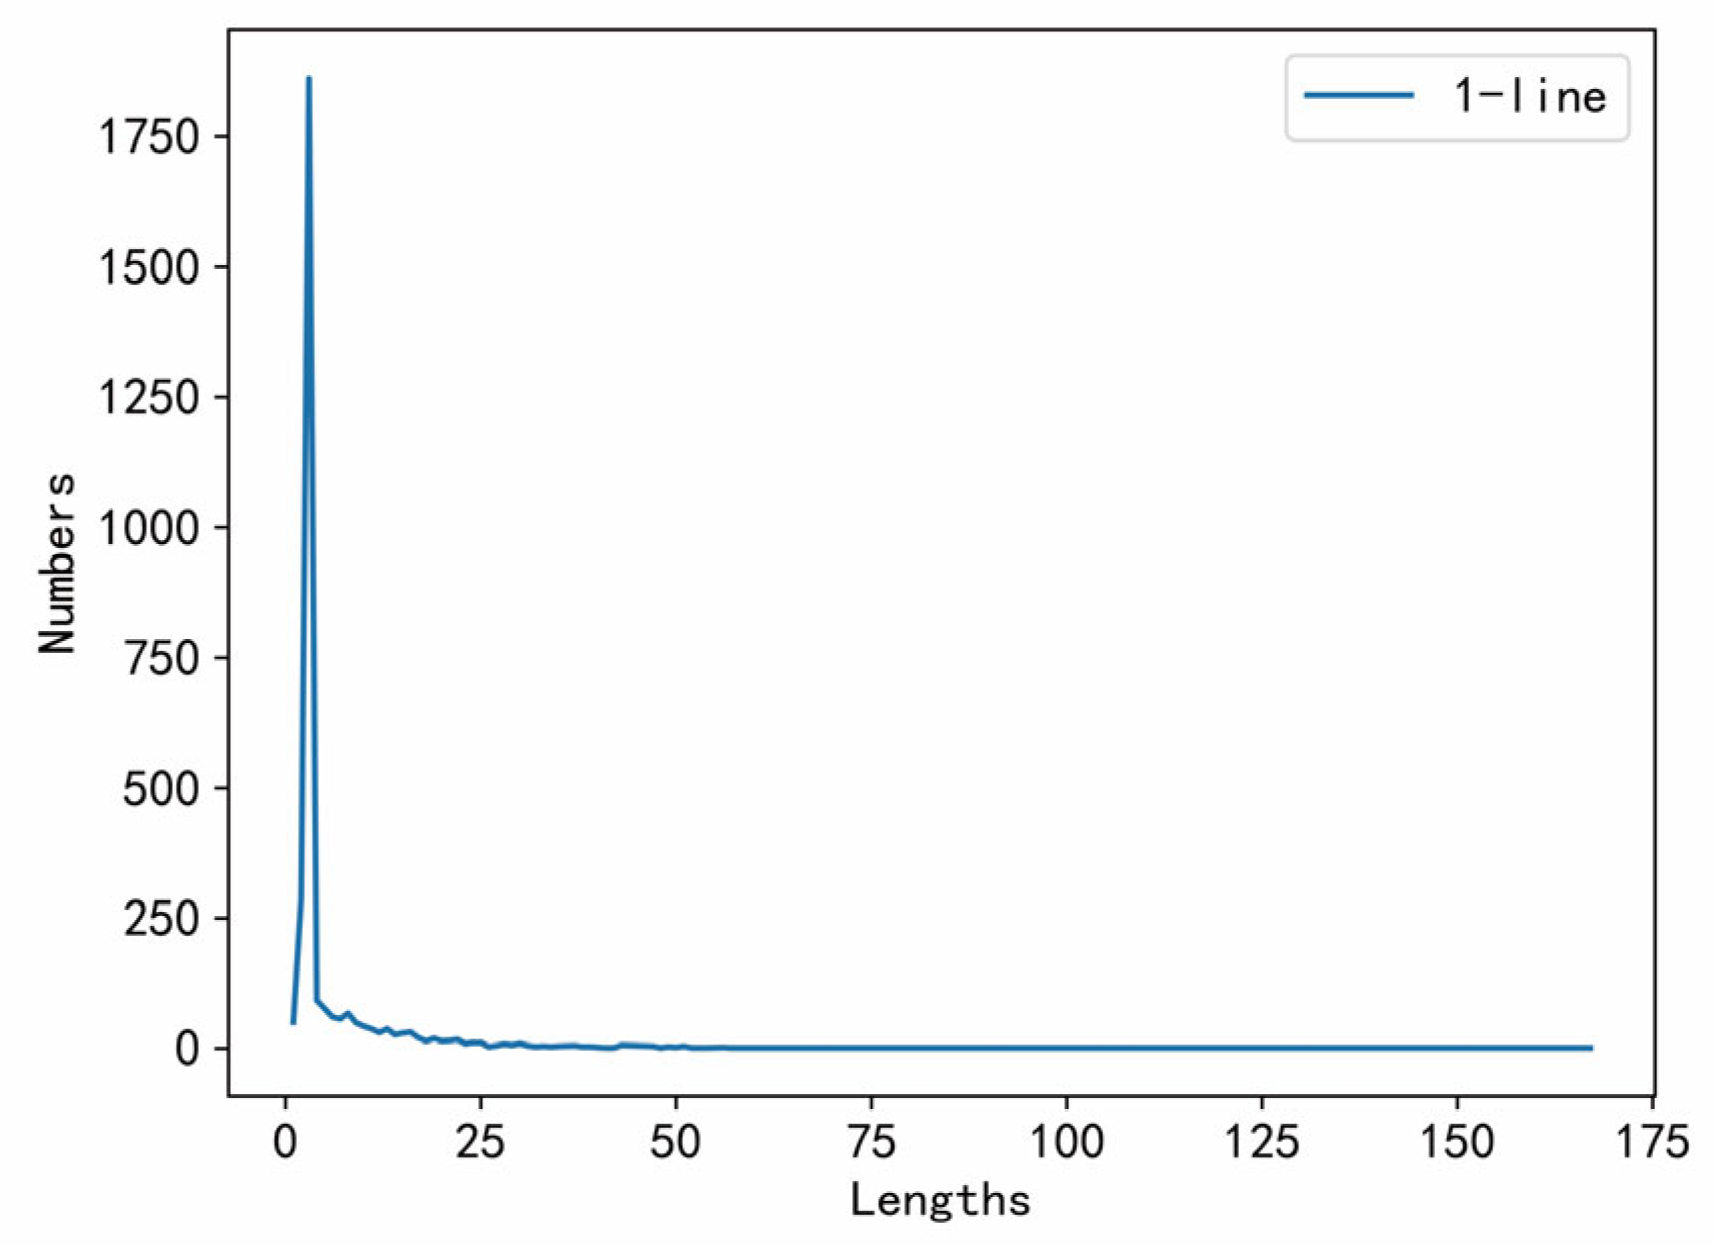
3.2.2. Pre-Processing of Data

We also set some data cleaning rules to remove meaningless information and further clean the input data for the next experiment. The specific filtering rules are shown in Table 4.
After preprocessing and fake review removal, we conducted descriptive statistics on review distributions, including the ratio of 5-star to 1-star ratings and comment length trends across different rating levels.

3.3. Methods

The methodology comprised four primary stages:
Step 1: A neural network-based classifier was trained to detect and eliminate fake reviews. The dataset was collected from JD.com’s mobile phone marketplace and preprocessed accordingly.
Step 2: The cleaned reviews were processed using the Biterm Topic Model (BTM) to extract latent service-impacting factors. Emotional phrases associated with each topic were used to determine their relative importance, and these sentiment-weighted scores were used to construct a modified AHP-based service evaluation model.
Step 3: Based on the constructed model, we evaluated overall service quality in JD’s smartphone sector and compared two representative products.
Step 4: To qualitatively identify overlooked service issues, a clustering algorithm was applied to compare term frequency distributions between user reviews and Q and A texts. This revealed latent service gaps not captured in review data alone. The flowchart of the method is shown in Figure 2.

3.3.1. Establish a Service Evaluation System

To build a hierarchical service evaluation system, we employed a multi-stage process that integrates topic modeling, sentiment scoring, and AHP-based weighting. The BTM was first applied to the preprocessed review dataset to identify latent service factors. The elbow method was used to determine the optimal number of topics.
After calculating the emotional weights between each obtained factor, based on the TextRank algorithm combined with Jiagu tokenizer, domain knowledge corresponding to the expression can be obtained, and given a polarity value of +1 or −1 combined with BosonNLP’s lexicon. After screening out noise information through the combined stop word list there are 227 positive words and 53 negative words representing emotion association (Table 5).
Following Xue et al. [29], co-occurrence analysis was used to map emotional phrases to service topics, aggregating their frequencies and polarity into normalized emotional intensity scores.
To assign weights in the AHP structure, we adopted a two-level scheme comprising the factor level (topics) and the standard level (topic categories). All weights were calculated based on the sentiment proportions observed across multiple smartphone review datasets.
Factor-Level Weighting:
Each topic’s average sentiment score V F i j was computed as follows:
V F i j = 1 N F i j k = 1 N F i j V i j k
where i denotes the index of a standard-level category (e.g., performance, promotion), j denotes the index of a topic (factor) within category i , k denotes the index of an individual sentiment short sentence under topic F i j , N F i j is the number of sentiment short sentences under topic F i j , V i j k is the sentiment value of the k -th short sentence associated with topic F i j .
The factor-level weights were normalized as follows:
W F i j = V F i j j V F i j
Standard-Level Weighting:
Topics were grouped into broader standard-level categories. The aggregated emotional score for each category V S i was calculated as follows:
V S i = F i j S i k = 1 N F i j V i j k
The standard-level weights were then obtained by normalization:
W S i = V S i i V S i
Hierarchical Evaluation Model:
Once the factor-level and standard-level weights have been determined, they were kept fixed for subsequent evaluation.
To compute the final satisfaction score for each store, the store’s review comments are first analyzed to obtain the sentiment values V i j k under each topic.
These sentiment values are aggregated upwards through the hierarchical structure using the pre-computed weights as follows:
V F i j = 1 N F i j k = 1 N F i j V i j k
V S i = j W F i j V F i j
V total = i W S i V S i
where V F i j is the average sentiment score for topic F i j based on the store’s review data, W F i j is the pre-determined weight of topic F i j within its category, V S i is the weighted sentiment score of the standard-level category S i , W S i is the pre-determined weight of the standard-level category S i , V t o t a l is the overall satisfaction score for the store.
This evaluation process ensures that store-level satisfaction assessments are both consistent with the overall sentiment structure and sensitive to the specific review content of each store.

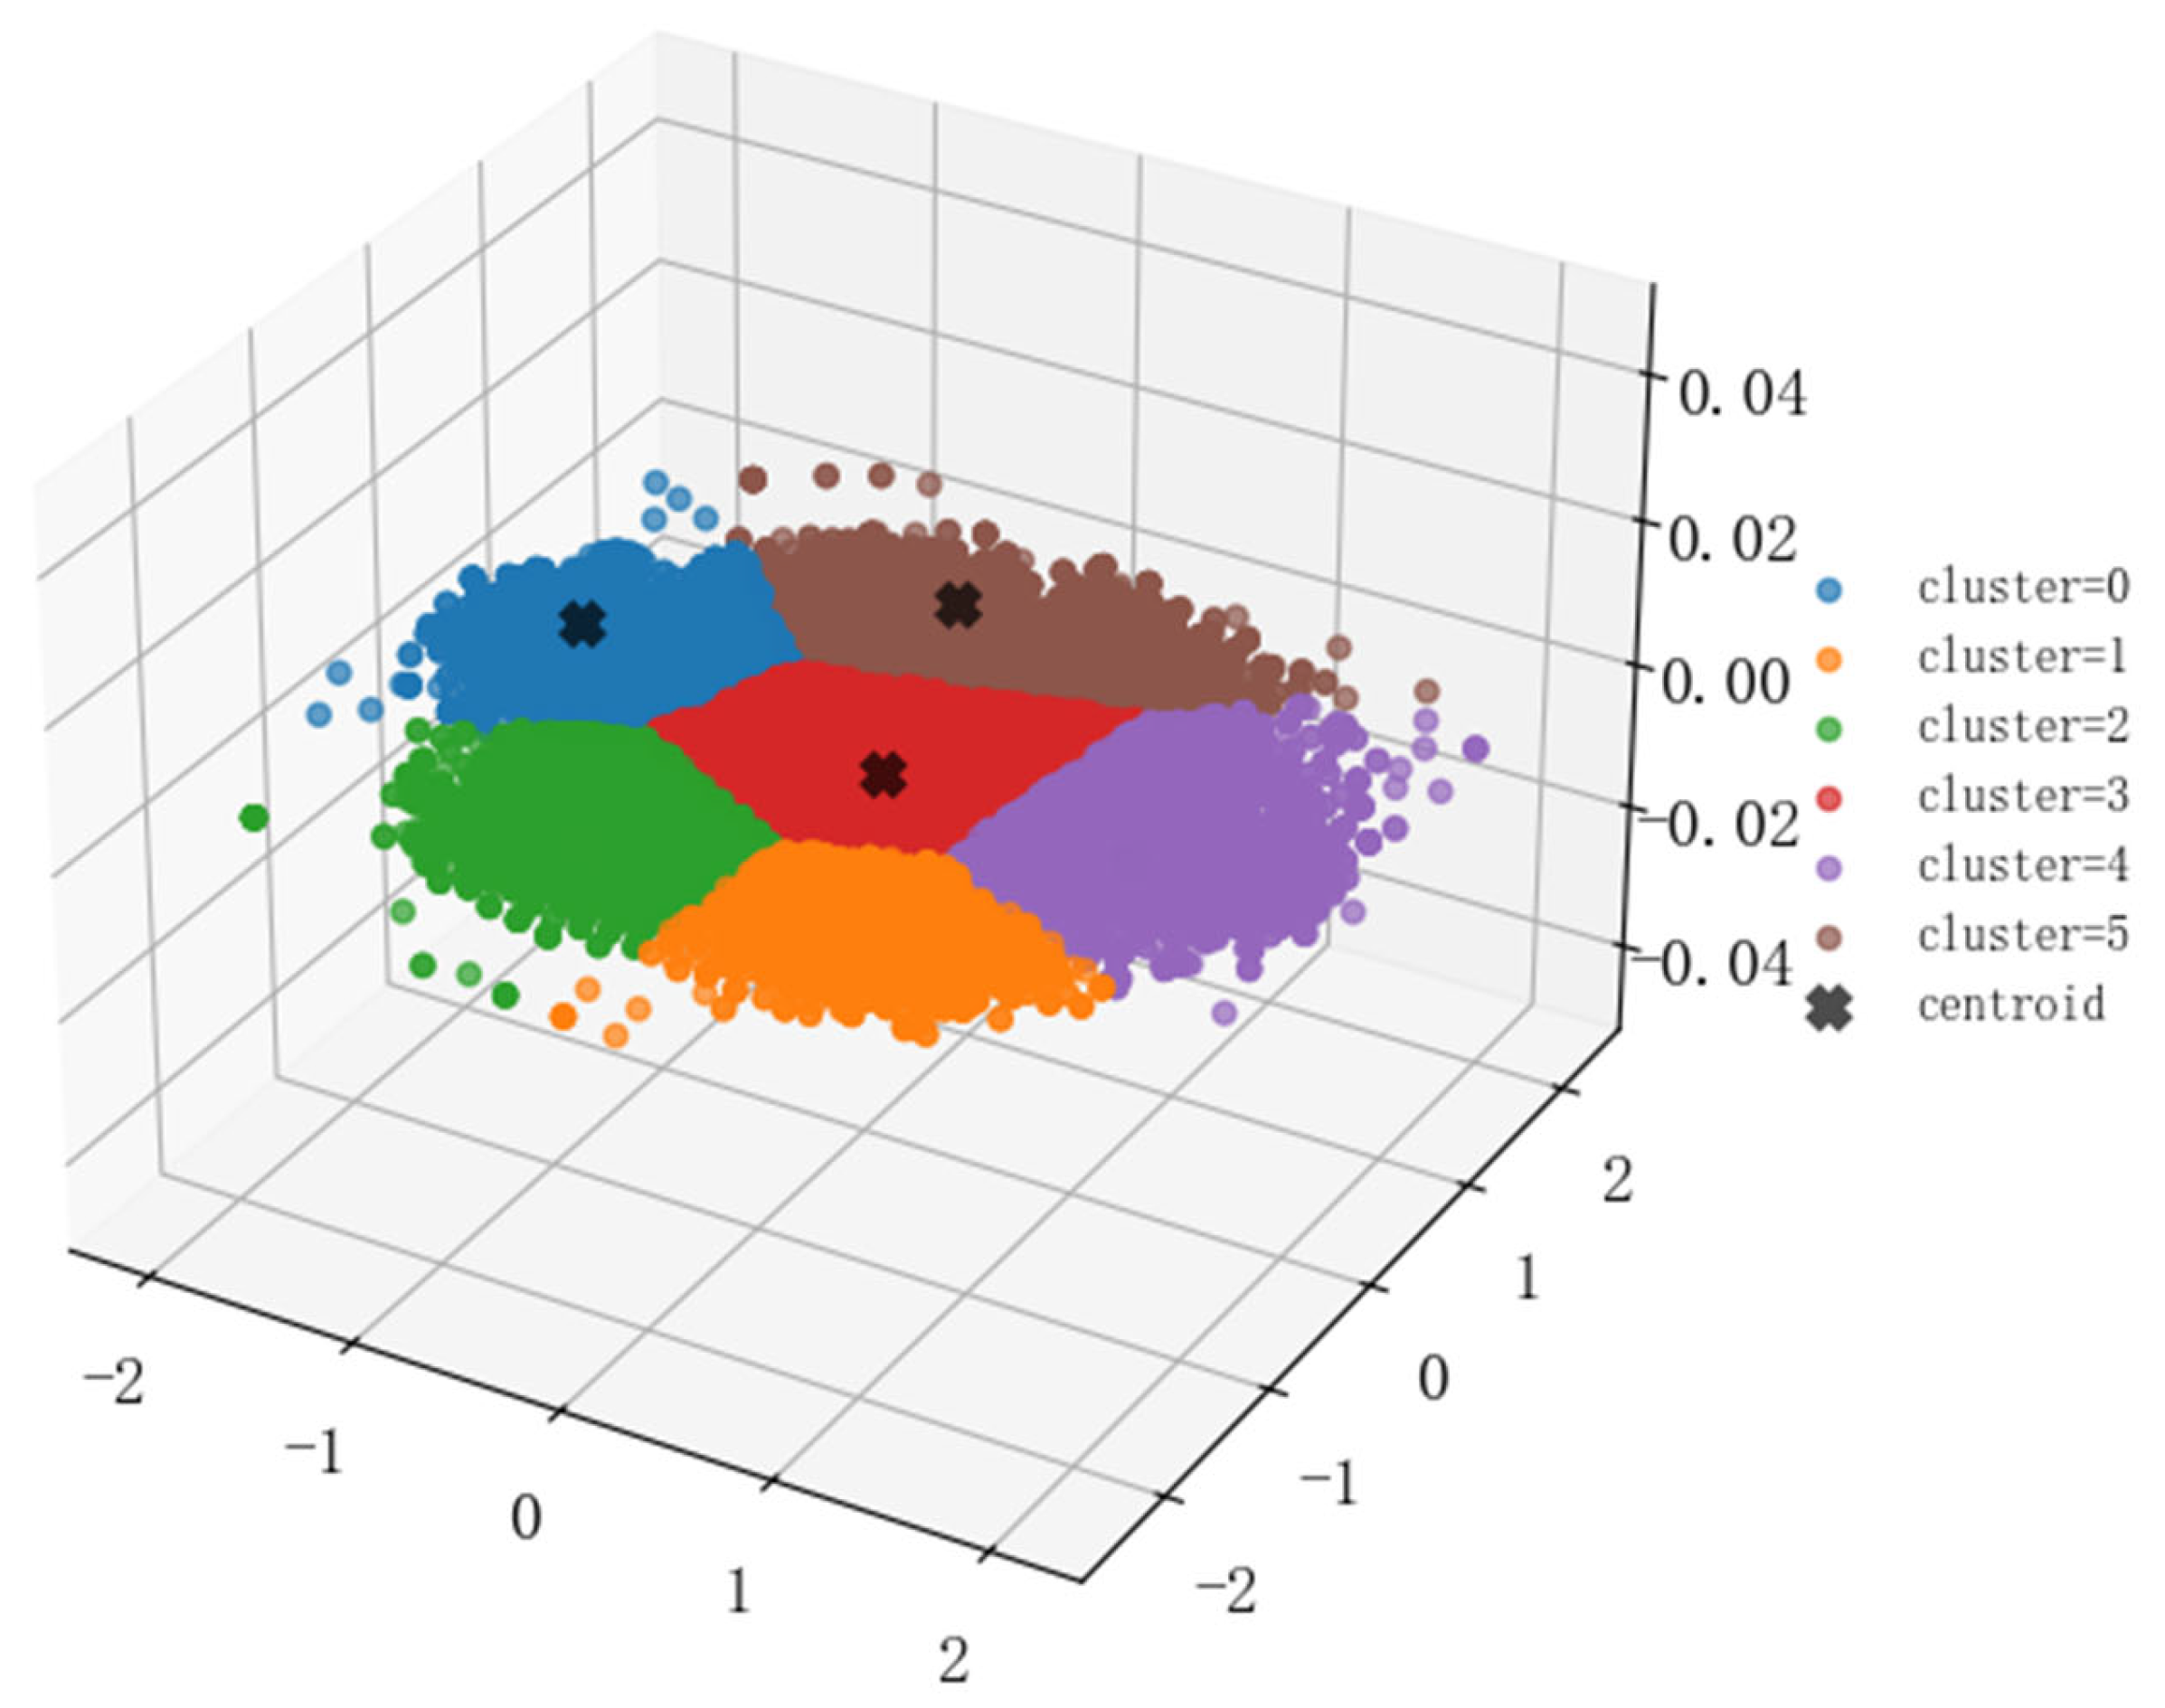
3.3.2. User Concern Profiling and Clustering Validation

Building upon the Fei et al. [30] framework, this study implements Self-Organizing Maps (SOM) to segment JD Mall mobile electronics reviewers into behaviorally distinct clusters. Using AIC and BIC criteria, the optimal cluster number was determined to be six (k = 6), as depicted in Figure 3, demonstrating superior separation across validation metrics:
As shown in Figure 4, the comparative analysis highlights SOM’s strong performance in cluster separation, achieving the highest Calinski–Harabasz index (14,088.01)—39% higher than K-means++ (10,150.10) and significantly outperforming other algorithms. While SOM’s Davies–Bouldin index (0.782) slightly trails K-means++ (0.775), it maintains robust differentiation capabilities, particularly excelling in scenarios requiring clear user group distinctions. Notably, SOM avoids the critical weaknesses of alternatives: unlike Affinity Propagation’s poor cohesion (silhouette: 0.154) and GMM’s cluster overlap issues (DB: 0.809), SOM delivers balanced performance suitable for service evaluation tasks. These results validate SOM as a reliable choice for user behavior analysis in e-commerce contexts. The specific numerical indicators are shown in Table 6.

3.3.3. The Analysis of the Q and A System

To enhance multidimensional analysis, we integrated Q and A content using Gaussian Mixture Model (GMM)-based clustering. AIC/BIC optimization confirmed six clusters (k = 6) as optimal (Figure 5).
As shown in Figure 6, GMM delivered the best balance across metrics. Although Affinity Propagation slightly outperformed on the CH index (404.77 vs. 388.14), its silhouette coefficient was only 0.355, and its DB index was higher (0.794). GMM posted the lowest DB index (0.762), outperforming K-means++ by 5.2% and SOM by 15.7%. These findings demonstrate GMM’s superior ability to differentiate Q and A service patterns. The specific numerical indicators are shown in Table 7.

4. Results

This part is the results of our methodological analysis. The first result of Section 4.1 presented the initial analysis results about features’ extraction. In Section 4.2, we introduced every process associated with finding out satisfaction determinants and comparing their weights for assessing online stores’ service quality in detail. Meanwhile, we found out what customers appreciate by presenting results of user profiles, providing us an insight into buyers’ behavior as well. As explained in Section 4.3 with respect to how both review data and Q and A are analyzed together, discovering latent factors concealed within comparative studies across different entities or aspects. All those results constitute a multi-dimensional point of view concerning influencing factors towards service satisfaction.

4.1. Preliminary Analysis

The proposed framework was validated using real-world customer reviews collected from JD Mall (https://www.jd.com/). Review titles, content, and metadata were retrieved via web scraping and stored in a structured temporary database. The preprocessed dataset was stratified by review ratings (1 to 5 stars) for preliminary analysis. Comment length distributions were visualized to examine basic textual characteristics.
The analysis (Figure 7) shows that five-star reviews dominate the mobile phone category on JD Mall, followed by decreasing counts of four-, three-, two-, and one-star ratings. This pattern suggested high baseline satisfaction and implies that most services meet consumer expectations. Using review ratings as categorical anchors, we further analyzed comment length by rating level.
The comment length analysis (Figure 8) revealed that over 85% of reviews across all rating levels contain fewer than 20 words. A slight increase in length was observed in 3-star reviews, which occasionally exceeded 50 words. The brevity and informality of most reviews pose challenges for traditional models like LDA, which rely on lexical richness. To address this, we employed the Biterm Topic Model (BTM), which uses word co-occurrence patterns to maintain semantic coherence even in sparse textual environments [31].

4.2. Establishment Model

4.2.1. Extract Service Factors

We began by using a fake review detection model to purify the dataset. Word segmentation was carried out with the Jiagu tokenizer, and topic extraction was performed using the Biterm Topic Model (BTM). Following the methodologies of Wang and Hu [32] and Liu [33], we plotted the perplexity curve to determine that 58 was the optimal starting number of topics.
To minimize semantic overlap while preserving interpretability, we removed any topics that shared three or more keywords within their top 20 terms. This 15% threshold was empirically validated to balance topic resolution with usability.
We limited the final number of topics to between 10 and 20 for three reasons: (1) cognitive limits suggest users can interpret no more than 15–20 distinct themes; (2) a large number of topics reduces clarity in visualizations; and (3) excessive fragmentation leads to topic redundancy and reduced interpretability in brief user reviews.
After applying the filtering criteria, 17 coherent and non-redundant topics were retained. These are detailed in Table 8.
In addition to adjectives, nouns, verbs, and their different combinations can also express emotional positives and negatives and therefore need to be mined accordingly [33]. In line with Sun [16], we expanded sentiment expression types beyond adjectives, including noun–adjective and verb–noun constructions. Jiagu was used for part-of-speech tagging, and Emotional Short Sentences (ESS) were extracted using rule-based templates. Compared to Jieba, Jiagu demonstrated superior tagging accuracy in our domain. ESS counts are summarized in Table 9.
Annotated with the BosonNLP lexicon, these emotional phrases were mapped to topics and clustered using Affinity Propagation (AP). Five higher-level categories were defined based on keyword co-occurrence patterns, with corresponding weights summarized in Table 10.
The final five theme categories—imaging, performance, design, promotion, and ecosystem. Each was explained below.
  • Imaging Capabilities and Hardware Innovations (8.6%)
The data reveal that users focus on imaging features (e.g., telephoto, night mode) and interaction technologies (e.g., ultrasonic fingerprint) (Topics 4/7/13/16) aligns with the weight of hardware innovation (8.6%), consistent with the Kano model’s excitement factors—innovations boost short-term satisfaction but risk value erosion if usability is neglected. Manufacturers should adopt tiered optimization: high-end models prioritize differentiated technologies (e.g., advanced stabilization algorithms), while mid-range models streamline usability (e.g., one-touch pro modes), balancing technical sophistication with user-friendly design.
  • Core Performance and System Optimization (10.0%)
User demands for processor fluency (Topic 3), fast charging (Topic 12), and display accuracy (Topic 9) (10.0%) reflect the performance threshold effect—improvements beyond baseline expectations yield diminishing returns. Negative feedback on gaming lag (Topic 3) and battery life (Topic 12) suggests prioritizing mid-range models with dynamic frame rate adjustment and flagship models with intelligent background process management over raw hardware upgrades.
  • User-Centric Design and Multifunctional Experience (70.8%)
The dominant weight (70.8%) validates scenario-driven experience theory, where needs span elderly friendly interfaces (Topic 1), ergonomic design (Topic 2), and multimedia integration (Topic 10). Strategies include mid-range models enhancing niche scenarios (e.g., simplified elderly modes) and high-end models developing cross-application workflows (e.g., split-screen multitasking). E-commerce platforms should replace technical specifications with scenario demonstrations (e.g., short videos showcasing mode switching).
  • Consumer Decision-Making and Promotional Drivers (7.8%)
Promotion clarity (Topic 8) and value perception (Topic 14) influence purchases (7.8%) via bounded rationality decision-making—users rely on intuitive cues (e.g., “discount tags”). Recommendations include structured information design (e.g., performance-price quadrants) and scenario labels (e.g., “ad-free OS”) to reduce cognitive load.
  • Industrial Design and Ecosystem Balance (2.8%)
The coexistence of “sleek design” and “system ads” (Topic 15) highlights latent demand dynamics—hardware appeal is undermined by software flaws. Mitigation strategies: mid-range models minimizing pre-installed ads and high-end models leveraging premium materials (e.g., ceramic backs) and cross-device synergy for long-term retention.

4.2.2. Model Evaluation Score

Within the AHP-based evaluation framework [29], aggregated sentiment scores from user reviews were used to estimate the overall satisfaction level across JD.com’s smartphone market, resulting in a score of 0.238.
When the model is used to evaluate two online stores, the emotional values are shown in Table 11.
Therefore, the emotional value score of the Huawei Mate 60 Pro is slightly higher than that of the Xiaomi Redmi Note 11 5G Tianji 810, indicating a minor overall advantage in recent user satisfaction.
A more detailed comparison across feature categories reveals that Xiaomi outperforms Huawei in the mobile phone camera function, whereas Huawei maintains higher scores across most other aspects.
To present these results clearly, we collected the sentiment scores of both stores for each topic, calculated the score differences by retaining only positive values and recording the corresponding store, and then aggregated the scores within each topic cluster. The final comparison results are summarized in Table 12.
In our scoring system, each emotional phrase is no more than 3 words long. According to the scoring standard of an emotional phrase, considering extreme cases, the score range is [−4, 8]. But in fact, all emotion phrase intervals are concentrated in the range [−3, 3], so we regard [−4, −3) as extremely dissatisfied, [−3, 0) as dissatisfied, [0, 3) as satisfied, [3, 8] as extremely satisfied, and finally found that both the overall JD mobile phone market and the services of the two mobile online stores are satisfied, which accords with our intuitive judgment at the beginning, and Huawei’s score is higher than Xiaomi, which is indeed consistent with the fact, so our conclusion basically satisfies the fact.

4.2.3. Generation and Analysis of User Portrait

The generation and analysis of a user portrait on the dataset are beneficial for the online store service provider to make improvements and enhancements [30]. Based on the method of the paper [34] user profiles are generated for the dataset of the mobile phone evaluation model, with the difference that multiple clustering algorithms are used to cluster the review dataset.
This study generates and analyzes user portraits from a dataset of mobile phone reviews to guide online store service providers in making targeted improvements. Using multiple clustering algorithms, user profiles were created based on attention to topics generated by the Biterm Topic Model (BTM). Six user clusters were identified, with attention levels to five key categories quantified: Imaging Capabilities and Hardware Innovations (Category 0), Core Performance and System Optimization (Category 1), User-Centric Design and Multifunctional Experience (Category 2), Consumer Decision-Making and Promotional Drivers (Category 3), and Industrial Design and Software Ecosystem Balance (Category 4).
According to Table 13, Cluster 0 users prioritize Core Performance and System Optimization, User-Centric Design and Multifunctional Experience, and Industrial Design and Software Ecosystem Balance, showing minimal interest in Consumer Decision-Making and Promotional Drivers, suggesting they may be entry-level or fringe users.
Cluster 1 users focus on User-Centric Design and Multifunctional Experience and Industrial Design and Software Ecosystem Balance, followed by Core Performance and System Optimization and Imaging Capabilities and Hardware Innovations, indicating they are entry-level users with broader interests.
Cluster 2 users emphasize Core Performance and System Optimization, User-Centric Design and Multifunctional Experience, Industrial Design and Software Ecosystem Balance, and Consumer Decision-Making and Promotional Drivers, likely representing new or occasional users.
Cluster 3 users value Imaging Capabilities and Hardware Innovations, Core Performance and System Optimization, User-Centric Design and Multifunctional Experience, Industrial Design and Software Ecosystem Balance, and Consumer Decision-Making and Promotional Drivers, with significant attention to Industrial Design and Software Ecosystem Balance, making them general market consumers.
Cluster 4 users prioritize Imaging Capabilities and Hardware Innovations, Core Performance and System Optimization, User-Centric Design and Multifunctional Experience, and Industrial Design and Software Ecosystem Balance, with less concern for Consumer Decision-Making and Promotional Drivers.
Cluster 5 users focus on Core Performance and System Optimization, User-Centric Design and Multifunctional Experience, and Industrial Design and Software Ecosystem Balance, showing lower interest in Imaging Capabilities and Hardware Innovations, Consumer Decision-Making and Promotional Drivers, and Industrial Design and Software Ecosystem Balance.
Overall, core performance and user-centered design are the most important factors across all groups. Imaging plays a bigger role for Clusters 3 and 4, while promotions are more attractive to Cluster 2. Clusters 0, 1, and 5 show more stable but less extreme preferences.
Merchants should prioritize R and D investments in Core Performance and System Optimization, User-Centric Design and Multifunctional Experience, and Industrial Design and Software Ecosystem Balance to ensure product competitiveness. Tailored marketing strategies and product development plans are needed to address the specific needs of different user clusters. For example, enhancing Imaging Capabilities and Hardware Innovations and Consumer Decision-Making and Promotional Drivers can attract Clusters 3 and 4, while improving Industrial Design and Software Ecosystem Balance and purchasing convenience can retain Clusters 0, 1, and 5. These strategies aim to expand market coverage, increase user satisfaction, and achieve long-term strategic objectives.

4.3. Explore Potential Factors

To explore factors affecting services that may not be mentioned in reviews, it is a general idea to mine another UGC related to online reviews. What we chose is the Q and A system on the product page of JD.
To identify service factors potentially omitted from reviews, we analyze the Q and A system integrated within JD’s product pages as a complementary UGC source. This active inquiry platform aggregates consumer-initiated questions and purchaser-provided answers, capturing service-related concerns through community-driven interactions. Unlike passive review mechanisms, the system facilitates targeted information exchange, addressing specific consumer needs while supplementing traditional review analysis (Figure 9).
As shown in Figure 10 and Figure 11, while both user-generated content types focus on product evaluation, online reviews primarily assess product attributes, whereas the Q and A system captures unmet user needs through concise inquiries. This complementary relationship enabled dual-source analysis: by implementing parallel 6-cluster categorizations for reviews and Q and A data, we identified service-related factors through comparative term frequency analysis. The methodology filtered meaningful content by contrasting lexical patterns across clusters, revealing factors emphasized differently across UGC types.
As shown in Table 14, the findings reveal minimal differences in the user count across various problem categories, with a significant increase observed in Categories 1 and 3. The average length of questions typically ranges between 10 and 15 words, while answers tend to be much shorter, averaging around 2 words, with individual responses ranging from 20 to 35 words. Based on these observations, this study will further explore the frequency of clustered words to gain a deeper understanding of the unique characteristics of the questions and answers.
To analyze the user clustering results, we apply Zipf’s second law to define high and low-frequency words and identify high-frequency terms. We then use the G-index to pinpoint sub-high frequency words and perform statistical analyses on both ultra-high and sub-high frequency words across each category. By using sub-high frequency words as keywords for each category, we compare them against the processed comment dataset to identify similarities and differences between the two online textual corpora. This approach provides an additional perspective for evaluating online store services. The results are presented in Table 15.
For the Q and A system, users within Category 0 exhibited a particular focus on “the appearance of mobile phones”. Category 1 users demonstrated a heightened interest in “the screen of mobile phones”. Category 2 users were especially concerned with “the mobile phone system”. Category 3 users showed a particular concern for “the charging situation”, whereas Category 5 users were particularly concerned with “taking photos” and “the pixel quality of mobile phones”. Lastly, Category 4 users exhibited a significant concern for “the functions of mobile phones”.
We summarized the top four most frequent and second-most frequent terms from the clustering results of both Q and A and review datasets in Table 16. Figure 12 presents a Venn diagram comparing the second-most frequent terms, highlighting the unique and shared vocabulary between the two sources—where the left circle represents terms from Q and A data and the right from review data. Integrated analysis of high-frequency terms across review and Q and A datasets reveals persistent user inquiries about product attributes explicitly mentioned in reviews (e.g., “battery”, “heat dissipation”, “memory”) alongside novel concerns absent from reviews, such as “screen quality”, “pixel density”, and “earphone compatibility”. This highlights the need for comprehensive service evaluation frameworks, as reviews alone often fail to capture certain user experiences that are systematically addressed in Q and A interactions. The study concludes that product quality plays a fundamental role in shaping perceptions of service adequacy—high-performing products naturally reduce service-related complaints by validating their effectiveness through user experience.

5. Conclusions and Discussion

This study presents an AI-driven, multi-stage framework for modeling user satisfaction in e-commerce environments. The analysis is based on a curated dataset of 4,016 verified smartphone reviews from JD.com. To ensure data authenticity, the ERNIE-LSTM Emotion Model (ELEM)—a deep neural classifier with contextualized embeddings tailored to Chinese-language texts—was employed to detect and remove potentially inauthentic reviews. Subsequently, latent satisfaction drivers were extracted using Biterm Topic Modeling (BTM), and each topic was quantified using sentiment-weighted topic scores derived from review-level annotations.
A hierarchical topic aggregation procedure produced 17 refined subtopics, which were grouped into five dominant satisfaction dimensions:
(1)
User-Centric Design and Multifunctional Experience (70.8%), emphasizing intuitive UI interactions, adaptive interfaces, and diversified usage scenarios;
(2)
Core Performance and System Optimization (10.0%), reflecting user priorities in processing speed, thermal stability, and smooth responsiveness;
(3)
Imaging Capabilities and Hardware Innovation (8.6%), focusing on camera clarity, night-mode quality, and sensor enhancements;
(4)
Promotional Incentives and Decision-Making Factors (7.8%), including price-performance perceptions, promotional effectiveness, and discount transparency;
(5)
Industrial Design and Ecosystem Integration (2.8%), incorporating users’ aesthetic preferences as well as issues related to software intrusion (e.g., pre-installed apps, ad overlays).
In a comparative evaluation of two flagship models—Huawei Mate 60 Pro and Xiaomi Redmi Note 11 5G—distinct brand-specific satisfaction patterns emerged. Huawei users consistently highlighted fluency, system responsiveness, and thermal performance as key satisfaction factors, aligning with the Core Performance dimension. In contrast, Xiaomi users exhibited higher sentiment scores for imaging features and accessory compatibility, reflecting a stronger orientation toward visual experience and ecosystem extensibility. Although the overall sentiment scores between the two models were statistically similar, Huawei slightly outperformed Xiaomi in system-related dimensions, whereas Xiaomi led in camera innovation and value perception.
To explore user behavioral heterogeneity, we clustered users based on topic-sentiment embedding vectors, resulting in six distinct consumer segments. While all clusters shared a strong emphasis on system performance and usability, their preferences for imaging and promotional features diverged. Clusters 3 and 4 demonstrated heightened sensitivity to advanced imaging technologies, whereas Cluster 2 showed stronger responsiveness to promotional campaigns and price changes.
To uncover unaddressed concerns, we also conducted a cross-corpus lexical frequency analysis between user reviews and community Q and A interactions. This revealed latent but salient user issues—such as screen calibration discrepancies, pixel density dissatisfaction, and accessory incompatibility—that are often underrepresented in standard review-only analyses. These findings support the value of incorporating multi-source corpora to more comprehensively reflect user experience dimensions and strengthen the reliability of satisfaction modeling.
Nevertheless, several limitations are worth further discussion. First, in this study only JD.com smartphone data were used because of the limited access to data. In future research, we will try to introduce more data to improve our work.
Secondly, while the current study focuses on Chinese e-commerce data, the proposed framework can be extended to multilingual environments by incorporating multilingual sentiment lexicons and corresponding review datasets. Future work will explore the use of language-specific emotional resources to support evaluations across different linguistic and cultural contexts.
Finally, future research could extend the framework to additional product categories (e.g., household appliances, wearables) and incorporate multimodal signals (e.g., images, audio reviews) to deepen our understanding of user satisfaction across heterogeneous e-commerce ecosystems.

Author Contributions

Conceptualization, P.G. and H.L.; methodology, P.G. and H.L.; Software: P.G.; Formal analysis and investigation: P.G. and H.L.; Writing—original draft preparation: P.G., X.M. and H.L.; Writing—review and editing: X.M. and H.L.; Funding acquisition: X.M. and H.L.; All authors have read and agreed to the published version of the manuscript.

Funding

This work is supported by Hainan Provincial Natural Science Foundation of China (Grant number: 623RC455, 623RC457), Scientific Research Fund of Hainan University (Grant number: KYQD (ZR)-22096, KYQD (ZR)-22097).

Institutional Review Board Statement

Not applicable.

Informed Consent Statement

Not applicable.

Data Availability Statement

The datasets used and analyzed during the current study are available from the corresponding author (lihuan@hainanu.edu.cn) on reasonable request.

Conflicts of Interest

The authors declare no conflicts of interest.

Abbreviations

The following abbreviations are used in this manuscript:
ELEMERNIE-LSTM-Emotion-Model
BTMBiterm Topic Model
LDALatent Dirichlet Allocation
Q and AQuestion and Answer System

References

  1. Vakulenko, Y.; Shams, P.; Hellström, D.; Hjort, K. Online Retail Experience and Customer Satisfaction: The Mediating Role of Last Mile Delivery. Int. Rev. Retail. Distrib. Consum. Res. 2019, 29, 306–320. [Google Scholar] [CrossRef]
  2. Rita, P.; Oliveira, T.; Farisa, A. The Impact of E-Service Quality and Customer Satisfaction on Customer Behavior in Online Shopping. Heliyon 2019, 5, e02690. [Google Scholar] [CrossRef] [PubMed]
  3. Chen, Y.; Liu, D.; Liu, Y.; Zheng, Y.; Wang, B.; Zhou, Y. Research on User Generated Content in Q&A System and Online Comments Based on Text Mining. Alex. Eng. J. 2022, 61, 7659–7668. [Google Scholar] [CrossRef]
  4. Bao, J.; Yuan, Q. Research on the Impact of Systematic Clues of E-Commerce Platform on Consumers’ Purchase Intention under the Background of New Retail. China Bus. Mark. 2020, 33, 9. [Google Scholar]
  5. Li, D.; Yang, J.; Chen, J. Analysis of factors affecting consumer satisfaction of tea e-commerce–Based on the exploration and analysis of online reviews. For. Econ. 2019, 41, 70–77. [Google Scholar]
  6. Xu, X. Examining the Role of Emotion in Online Consumer Reviews of Various Attributes in the Surprise Box Shopping Model. Decis. Support Syst. 2020, 136, 113344. [Google Scholar] [CrossRef]
  7. Chen, T.; Samaranayake, P.; Cen, X.; Qi, M.; Lan, Y.-C. The Impact of Online Reviews on Consumers’ Purchasing Decisions: Evidence From an Eye-Tracking Study. Front. Psychol. 2022, 13, 865702. [Google Scholar] [CrossRef]
  8. Xu, X.; Wang, Y.; Zhu, Q.; Zhuang, Y. Time Matters: Investigating the Asymmetric Reflection of Online Reviews on Customer Satisfaction and Recommendation across Temporal Lenses. Int. J. Inf. Manag. 2024, 75, 102733. [Google Scholar] [CrossRef]
  9. Li, Z.; Zhang, Y.; Luan, D. What factors influence consumers’ online purchasing decisions?—Customer perceived value drivers. Manag. Rev. 2017, 29, 136–146. [Google Scholar] [CrossRef]
  10. Lu, X.; Feng, Y. Value of word of mouth–an empirical study based on online restaurant reviews. Manag. World 2009, 26, 126–132+171. [Google Scholar] [CrossRef]
  11. Zheng, X. An Empirical Study of the Impact of Online Reviews on Online Consumers’ Purchasing Decisions. Unpublished. Master’s Thesis, Renmin University of China, Beijing, China, 2008. [Google Scholar]
  12. Zhou, X.; Wang, W.; Cai, H. Research on the perception of mountain tourism image based on text mining–Taking Yuntai Mountain scenic area as an example. J. Northwest Norm. Univ. Nat. Sci. 2023, 59, 37–43. [Google Scholar] [CrossRef]
  13. Liu, X.-X.; Chen, Z.-Y. Service Quality Evaluation and Service Improvement Using Online Reviews: A Framework Combining Deep Learning with a Hierarchical Service Quality Model. Electron. Commer. Res. Appl. 2022, 54, 101174. [Google Scholar] [CrossRef]
  14. Wang, Y.; Li, H.; Wu, Z. Attitude of the Chinese Public toward Off-Site Construction: A Text Mining Study. J. Clean. Prod. 2019, 238, 117926. [Google Scholar] [CrossRef]
  15. Sun, J.; Wang, G.; Cheng, X.; Fu, Y. Mining Affective Text to Improve Social Media Item Recommendation. Inf. Process. Manag. 2015, 51, 444–457. [Google Scholar] [CrossRef]
  16. Sun, B.-S.; Ao, C.-L.; Wang, J.-X.; Zhao, M.-Y. Evaluation of Ecotourism Satisfaction Based on Online Text Mining. Oper. Res. Manag. Sci. 2023, 31, 165. [Google Scholar]
  17. Cao, Y. Research on the Influencing Factors and Service Evaluation of Consumers’ Online Shopping Clothing Based on Online Reviews–Taking Pathfinder Enterprise as an Example. Unpublished. Master’s Thesis, Liaoning Technical University, Fuxin, China, 2022. [Google Scholar]
  18. Darko, A.P.; Liang, D. Modeling Customer Satisfaction through Online Reviews: A FlowSort Group Decision Model under Probabilistic Linguistic Settings. Expert Syst. Appl. 2022, 195, 116649. [Google Scholar] [CrossRef]
  19. Kumar, A.; Chakraborty, S.; Bala, P.K. Text Mining Approach to Explore Determinants of Grocery Mobile App Satisfaction Using Online Customer Reviews. J. Retail. Consum. Serv. 2023, 73, 103363. [Google Scholar] [CrossRef]
  20. Zhao, X.; Huang, Z. A Method for Exploring Consumer Satisfaction Factors Using Online Reviews: A Study on Anti-Cold Drugs. J. Retail. Consum. Serv. 2024, 81, 103895. [Google Scholar] [CrossRef]
  21. Park, J. Combined Text-Mining/DEA Method for Measuring Level of Customer Satisfaction from Online Reviews. Expert Syst. Appl. 2023, 232, 120767. [Google Scholar] [CrossRef]
  22. Li, J.; Dong, W.; Ren, J. The Effects of User- and Marketer-Generated Content on Customer Satisfaction: A Textual Analysis Approach. Electron. Commer. Res. Appl. 2024, 65, 101407. [Google Scholar] [CrossRef]
  23. Aldunate, Á.; Maldonado, S.; Vairetti, C.; Armelini, G. Understanding Customer Satisfaction via Deep Learning and Natural Language Processing. Expert Syst. Appl. 2022, 209, 118309. [Google Scholar] [CrossRef]
  24. Park, J.Y.; Mistur, E.; Kim, D.; Mo, Y.; Hoefer, R. Toward Human-Centric Urban Infrastructure: Text Mining for Social Media Data to Identify the Public Perception of COVID-19 Policy in Transportation Hubs. Sustain. Cities Soc. 2022, 76, 103524. [Google Scholar] [CrossRef] [PubMed]
  25. Wu, J.; Jiang, F.; Yao, H.; Huang, M.; Ma, Q. An Analysis and Risk Forecasting of Inland Ship Collision Based on Text Mining. J. Transp. Inf. Saf. 2018, 36, 8–18. [Google Scholar]
  26. Xu, X. What Are Customers Commenting on, and How Is Their Satisfaction Affected? Examining Online Reviews in the on-Demand Food Service Context. Decis. Support Syst. 2021, 142, 113467. [Google Scholar] [CrossRef]
  27. Shi, Y. Enhanced Customer Requirement Classification for Product Design Using Big Data and Improved Kano Model. Adv. Eng. Inform. 2021, 49, 101340. [Google Scholar] [CrossRef]
  28. Gu, Y.; Zheng, K.; Hu, Y.; Song, Y.; Liu, D. Support for Cross-Domain Methods of Identifying Fake Comments of Chinese. Data Anal. Knowl. Discov. 2024, 8, 84–98. [Google Scholar]
  29. Deng, X.; Li, J.-M.; Zeng, H.-J.; Chen, J.-Y.; Zhao, J.-F. Research on Computation Methods of AHP Wight Vector and Its Applications. Math. Pract. Theory 2012, 42, 93–100. [Google Scholar]
  30. Fei, P.; Lin, H.; Yang, L.; Xu, B.; Gulizige, A. A Multi-Perspective Fusion Framework for Constructing User Portraits. Comput. Sci. 2018, 45, 179–182. [Google Scholar]
  31. Yan, X.; Guo, J.; Lan, Y.; Cheng, X. A Biterm Topic Model for Short Texts. In Proceedings of the 22nd International Conference on World Wide Web, Rio de Janeiro, Brazil, 13–17 May 2013; Association for Computing Machinery: New York, NY, USA, 2013; pp. 1445–1456. [Google Scholar]
  32. Wang, Y.; Hu, Y. Hotspot detection in microblog public opinion based on BTM. J. Intell. 2016, 35, 119–124+140. [Google Scholar]
  33. Liu, B. Sentiment Analysis: Mining Opinions, Sentiments, and Emotions; Cambridge University Press: Cambridge, UK, 2015. [Google Scholar]
  34. Wang, Y.; Zhang, W.; Tang, Z. Research on user clustering method based on the sentiment analysis of e-commerce reviews. Mod. Inf. Technol. 2023, 7, 24–27+33. [Google Scholar] [CrossRef]
Figure 1. ELEM Flowchart.
Bdcc 09 00125 g001
Figure 2. Flowchart of the method.
Bdcc 09 00125 g002
Figure 3. Results of user clustering.
Bdcc 09 00125 g003
Figure 4. Effect of Different User Clustering Algorithms.
Bdcc 09 00125 g004
Figure 5. User clustering results of Q and A system.
Bdcc 09 00125 g005
Figure 6. Comparison of clustering algorithms in question answering system.
Bdcc 09 00125 g006
Figure 7. Comparison of the number of reviews with different review stars.
Bdcc 09 00125 g007
Figure 8. Comparison of comment length under different stars.
Bdcc 09 00125 g008
Figure 9. Q and A system product page display.
Bdcc 09 00125 g009
Figure 10. Question length statistics.
Bdcc 09 00125 g010
Figure 11. Answer lengths statistics.
Bdcc 09 00125 g011
Figure 12. The sub-high frequency words between question answering system and comments.
Bdcc 09 00125 g012
Table 1. Dataset.
Table 1. Dataset.
Database NameNumber of CommentsRemarks
Textrank keyword dataset8337JD.com
Mobile phone market model review dataset4016JD.com
False comment dataset8240JD.com
QandA comment dataset542 (Question) + 3252 (Answer)Question + Answer in JD.com
Table 2. Model configuration and training.
ComponentSetting
EncoderERNIE (768-dimensional)
LSTM1-layer, 128 hidden units
ClassifierFully Connected Layer
Loss FunctionBinary Cross-Entropy
OptimizerAdam
Learning Rate3 × 10−5
Batch Size16
Epochs10
Max Sequence Length64 tokens
Table 3. The average comments detection rate.
ModelPRF1Amount of Data
ERNIE + FC84.23%84.27%84.26%1296
CFEE [28]83.51%83.39%83.44%1296
ELEM84.77%84.86%84.81%1296
Table 4. The rules of preprocessing process.
Rule
1. Emoji and normal expressions;6. Go to comments that are empty;
2. Punctuation;7. To repeat single, one-word comments;
3. Spaces;8. Uncompressed paragraphs;
4. Repeated comments;9. Invalid reviews, including: “default positive review”, “cashback”, “This user did not fill in the evaluation.”;
5. Useless comments, such as comments with numbers instead of text;10. Short sentences are comments whose length is less than 1.
Table 5. Merge and increase the number of emotional words.
Emotional Word TypesNumber of Emotional Words
Positive emotional words227
Negative emotional words53
Table 6. Evaluation effect data of SOM clustering.
Evaluating IndicatorNumerical ValueInterpretation
Contour coefficient0.40Moderate intra-cluster cohesion
CH index14,088.01Strong inter-cluster differentiation
DB index0.78Low inter-cluster similarity
Table 7. Evaluation effect parameters of GMM clustering.
Evaluating IndicatorNumerical ValueInterpretation
Contour coefficient0.38Moderate intra-cluster cohesion
CH index388.14Moderate inter-cluster differentiation
DB index0.76Low inter-cluster similarity
Table 8. The theme after weight removal.
TopicKeywordInterpreted Topic
topic0photo, good, smooth, clear, feel, battery, charging, speed, life, very good, very fast, cost-effective, appearance, effect, running, screen, worth, received, beautiful, capacityComprehensive Performance and Design Experience
topic1time, good, screen, standby, memory, old man, dad, a period, cost-effective, like, buy to, battery, feeling, value, New Year, satisfied, beautiful, old man, worth, enoughBudget-Friendly Models for Elderly Users
topic2feel, screen, fingerprint, one-handed, 21, ratio, body, grip, thin, 21pro, 219, white, comfortable, nice, camera, photo, appearance, back cover, really, panelErgonomics and Aesthetic Design
topic3smooth, photo, good, feel, system, okay, battery, effect, time, signal, experience, good, mode, endurance, optimization, charging, small screen, not too, standby, functionSystem Smoothness and Battery Optimization
topic4nice, system, price, cost-effective, smooth, speed, first time, feel, pixel, daily, no problem, satisfied, battery, get, price, no shame, flagship, very quickly, people-friendly, worriedEntry-Level Flagship Value Experience
topic5photo, like, nice, effect, special, speed, very good, smooth, satisfied, feel, good-looking, running, color, really, time, hope, very soon, clear, national products, cost-effectiveImaging Performance and Color Calibration
topic6photo, screen, hope, system, like, a little, good, feel, price, really, experience, image, appearance, support, performance, consumers, indeed, in line with, especially, appearanceConsumer Expectation Alignment
topic7screen, system, price point, nice, photo, charging, endurance, back cover, $1000, processor, telephoto, camera, very good, price, battery, gaming, metal, curved, super, workmanshipHigh-End Imaging and Gaming Performance
topic8good, like, price, elderly, gift, discount, really, special, quality, self-operated, activities, good, buy, New Year, good-looking, give, delivery, very good, cost-effective, very quicklyHoliday Promotions and Gifting Scenarios
topic9screen, smooth, photo, good, feel, good-looking, appearance, clear, battery, performance, effect, cost-effective, enhancement, camera, very good, touch, processor, 20, first, ownedDisplay Quality and Performance Upgrade
topic10photo, clear, effect, good, screen, running, feel, function, speed, smooth, sound quality, recommended, cost-effective, very good, battery, buy, endurance, performance, appearance, worthwhileAll-in-One Multimedia Device
topic11good, speed, endurance, very, fast, video, running, play-games, elderly, enough, charge, feel, games, okay, good, battery, smooth, price, ability, like, cost-effectiveGaming and Video Battery Life
topic12time, standby, battery, speed, running, charging, endurance, range, very fast, very good, photo, durable, a period, no problem, okay, smooth, effect, power, capacity, satisfactoryBasic Battery Life and Charging Efficiency
topic13fingerprint, ultrasonic, unlock, nice, motor, system, wide-area, experience, really, configuration, white, good, panel, boost, hope, comfortable, vibration, recognition, 21pro, 20proBiometric Recognition and Interaction Innovation
topic14good, cost-effective, charging, hope, a little, less than, battery, price, feel, support, feeling, new, satisfied, brand, smooth, parents, system, order, screen, experienceBalancing Cost-Effectiveness and Pain Points
topic15body, feel, design, benefits, thin, support, system, weight, performance, appearance, experience, camera, Ads, charging, screen, smooth, feel, run, settings, signalIndustrial Design and Ad Intrusions
topic16screen, support, inches, video, camera, every day, pixels, performance, smooth, photography, brings, photo, clear, feel, effect, great, rear, offers, display, finesseDisplay and Photography Professional Upgrade
Table 9. The rules of extracting ESS and the corresponding number of datasets.
Emotional Short Sentence RuleExamples of Emotional Short SentencesQuantityEmotional Short Sentence RuleExamples of Emotional Short SentencesQuantity
n + aSpeed + very fast1669v + nLike + feel2598
a + nNot bad + fuselage2277d + v + nSpecial + thank you + express delivery171
n + d + aAppearance + really + good-looking159d + a + nNot too good + nice + music116
n + d + d + aRear cover + excessive + slight + smooth2
Table 10. The results after clustering the topic.
TopicsCategoryTopic Category ContentWeight
topic4, topic7, topic13, topic160Imaging Capabilities and Hardware Innovations8.6%
topic3, topic5, topic9, topic121Core Performance and System Optimization10.0%
topic0, topic1, topic2, topic10, topic112User-Centric Design and Multifunctional Experience70.8%
topic6, topic8, topic143Consumer Decision-Making and Promotional Drivers7.8%
topic154Industrial Design and Software Ecosystem Balance2.8%
Table 11. The emotional value of product evaluation in two online stores.
Product NumberProduct NameThe Emotional Value
1HUAWEI’s flagship mobile phone Mate 60 Pro 12 GB + 512 G1.548
2Xiaomi (MI)Redmi Note 11 5G Tianji 810 33W Pro fast charging 5000 mAh battery 8 GB + 256 GB.1.543
Table 12. Comparison of the score difference in different theme clusters in two stores.
Topic Category ContentStoresObtain Score
Imaging Capabilities and Hardware InnovationsHUAWEI0.028458
Xiaomi0.055214
Core Performance and System OptimizationHUAWEI0.011942
Xiaomi0.000636
User-Centric Design and Multifunctional ExperienceHUAWEI0.073285
Xiaomi0.061326
Consumer Decision-Making and Promotional DriversHUAWEI0.005092
Xiaomi0.000000
Industrial Design and Software Ecosystem BalanceHUAWEI0.012937
Xiaomi0.000000
Table 13. Cluster topic attention of user clustering.
User ClusteringClustering Attention
0‘0’: 8800, ‘1’: 1064, ‘2’: 1032, ‘3’: 7430, ‘4’: 521
1‘0’: 9930, ‘1’: 9100, ‘2’: 1055, ‘3’: 7680, ‘4’: 372
2‘0’: 5800, ‘1’: 1276, ‘2’: 1109, ‘3’: 1039, ‘4’: 722
3‘0’: 1622, ‘1’: 1764, ‘2’: 1843, ‘3’: 1845, ‘4’: 987
4‘0’: 2221, ‘1’: 2266, ‘2’: 2288, ‘3’: 1142, ‘4’: 490
5‘0’: 1641, ‘1’: 2362, ‘2’: 2449, ‘3’: 1329, ‘4’: 783
Table 14. Analysis of Q and A system data.
CategoryNumberThe Ratio of Categories to Total QuestionsThe Problem’s Average Word FrequencyAverage AnswersThe Average Word Frequency of Answers
06613%12.263.3634.11
115029%13.612.7529.46
26312%14.032.1119.00
39418%10.533.0533.79
47014%10.732.1717.86
56813%12.781.9122.91
Table 15. All kinds of ultra-high frequency words and sub-high frequency words in the Q and A system.
Categories of Q and A SystemsUltra-High Frequency WordsSub-High-Frequency Words
(Only the First Four Are Listed)
0--(‘pixel’, 9), (‘earphone’, 8), (‘cosmetics’, 8), (‘normal product’, 7)
1--(‘15’, 15), (‘batteries’, 14), (‘screen’, 9)
2--(‘system’, 13), (‘whether or not’, 9), (‘support’, 7)
3(‘charge’, 26)(‘memory’, 10), (‘device-heating’, 10), (‘endurance’, 10), (‘king’, 8)
4(‘function’, 16), (‘support’, 16), (‘NFC’, 11)(‘4G’, 7), (‘open’, 6), (‘5g’, 6), (‘displayed, 6)
5(‘photograph’, 21)(‘video’, 9), (‘screen’, 9), (‘effect’, 8), (‘beautiful’, 8)
Table 16. Clustered comment ultra-high frequency words and sub-high frequency words (the word frequency is on the right in brackets).
Category of CommentsUHF Words (Only the First Four Are Listed)Sub-High Frequency Words
(Only the First Four Are Listed)
0(‘standbytime’, 1160), (‘phone’, 566), (‘charge’, 467), (‘endurance’, 426)(‘two-days’, 60), (‘one-charge’, 58), (‘moreandmore’, 57), (‘character’, 53)
1(‘screen’, 2159), (‘soundscape’, 1517), (‘nice’, 457), (‘clearer’, 314)(‘luminance’, 53), (‘last’, 52), (‘endurance’, 52), (‘motor’, 51)
2(‘appearance’, 2021), (‘contour’, 1591), (‘beautiful’, 636), (‘phone’, 619)(‘blue’, 61), (‘high-end’, 60), (‘endurance’, 59), (‘character’, 59)
3(‘phone’, 2168), (‘nice’, 1038), (‘smoothly’, 605), (‘quality-priceratio’, 596)(‘game’, 75), (‘mom’, 75), (‘AD’, 73), (‘processingunit’, 70)
4(‘photograph’, 2674), (‘effect’, 2001), (‘phone’, 785), (‘clearer’, 659)(‘improvement’, 64), (‘camerashot’, 63), (‘shopping’, 62), (‘wish’, 61)
5(‘speed’, 1967), (‘running’, 1722), (‘very-fast’, 825), (‘phone’, 821)(‘very-big’, 60), (‘configure’, 60), (‘batteries’, 59), (‘statistics’, 59)
Disclaimer/Publisher’s Note: The statements, opinions and data contained in all publications are solely those of the individual author(s) and contributor(s) and not of MDPI and/or the editor(s). MDPI and/or the editor(s) disclaim responsibility for any injury to people or property resulting from any ideas, methods, instructions or products referred to in the content.

