1. Introduction
Understanding public perceptions is critical in the context of mass disruption events, such as natural disasters [
1,
2,
3] and pandemics [
4,
5,
6]. In this digital era, media platforms—encompassing social media, search engines, and news media—have emerged as key tools for gauging public perceptions. They provide real-time, high-volume data that can be harnessed to understand and gauge public response, thereby informing and enhancing strategies for crisis management. Each platform attracts a unique user demographic and serves specific information needs, leading to different patterns of public awareness. Therefore, conducting an integrated analysis across diverse media platforms can offer a more comprehensive understanding of public perceptions and behaviors during mass disruption events.
Many studies have leveraged media platforms to exam public responses and awareness. During Hurricane Sandy in 2012, researchers analyzed Twitter data to assess the effectiveness of social media communication during disasters, especially in understanding the relationship between activities and attention gained during three phases of a disaster [
7,
8,
9]. In response to the Chennai floods of 2015, in India, Facebook activated its ‘Safety Check’ feature, allowing users in the affected area to quickly inform their networks that they were safe. Research found that this feature played a significant role in disseminating information and connecting affected individuals with their social networks [
10]. During the COVID-19 pandemic, many researchers analyzed a large volume of Twitter data to understand public sentiments towards the infectious disease [
11], attitudes towards government policies (e.g., stay at home order) [
12], opinions on COVID-19 vaccines [
4], and public concerns across the pandemic [
13]. Different media platforms have distinct features and can offer diverse perspectives into public awareness. However, limited studies have leveraged data from multiple media platforms to concurrently support analysis. For instance, Burke et al. [
14] analyzed location-specific variation in search query behavior related to smoke exposure from Google Trends and geotagged Twitter data using natural language processing algorithms to identify public preferences and sentiments in rapidly changing wildfire risk. However, the study lacks comprehensive analysis from the spatial and temporal perspectives.
This study aims to utilize multiple media platforms to reveal distinct dimensions of the public’s response to the Ohio train derailment event. On 3 February 2023, a train carrying hazardous materials suffered a severe derailment on the eastern side of East Palestine, Ohio, near the Pennsylvania border. This catastrophic event resulted in a fire that burned for several days. Among the derailed cars, 11 were tank cars that dumped ~100,000 gallons of hazardous materials into the environment, including vinyl chloride, benzene residue, and butyl acrylate, which pose significant threats to the environment and public health. To mitigate the situation, emergency crews conducted a controlled burn of several railcars. Unfortunately, this measure resulted in the emission of additional hazardous substances into the air.
Numerous studies have investigated the environmental impacts of the derailment event. Ramachandra et al. [
15] analyzed the temporal pattern of chemical pollutant levels in the air, water, and soil in East Palestine and built machine learning and statistical models to predict pollutant levels over time. Nix et al. [
16] collected waterways and cropland, household income, and health insurance coverage datasets and utilized geographic information system tools to analyze human and environmental concerns. In addition to environmental investigations, several studies have addressed public awareness of railroad safety from different perspectives. For instance, Cruz [
17] utilized qualitative method to examine the communication strategies employed during the Ohio train derailment incident, focusing on how information was disseminated and managed among stakeholders. Ghosh et al. [
18] conducted a systematic analysis of Twitter data to identify major topics related to railroad safety, including Ohio train derailment event. Their findings underscore the utility of social media platforms like Twitter in understanding public discourse on transportation safety issues.
Despite growing recognition of the value of public perception data from media platforms, most existing studies on the Ohio derailment have primarily focused on environmental modeling and pollutant monitoring, with limited attention paid to how the public interpreted and responded to the event. Moreover, while social media and search engine platforms generate rich streams of real-time data that reflect public sentiment and awareness, few studies have leveraged both sources in a complementary manner to assess public reaction. This study is motivated by the need to bridge this gap by integrating geotagged Twitter data and Google Trends to assess public awareness, concern, and sentiment across spatial and temporal dimensions. Twitter provides a platform for users to express their immediate emotional responses, while Google Trends captures broader search behaviors indicative of public curiosity and concern. Together, these platforms offer a multifaceted view of public discourse that can enhance situational awareness and inform data-driven decision-making.
To guide this investigation, we pose the following three research questions:
Q1: How does the popularity of search terms related to train derailment events across different geographic regions in the U.S.?
Q2: How does the sentiment and tone of social media about train derailment events change over time, and are there any notable events or incidents that contribute to shifts in sentiment?
Q3: How do trending topics related to train derailment events change and evolve on a social media platform?
The remainder of the paper is organized into four main sections.
Section 2 provides background information on the Ohio train derailment event and introduces the media platforms analyzed in this study, including Twitter and Google Trends. It further outlines the key methods used to analyze social media data.
Section 3 presents the results and highlights the main findings.
Section 4 and
Section 5 offer a discussion of the results, concluding remarks, study limitations, and directions for future research.
2. Study Data and Methods
This section describes the datasets and methodologies used in the study, offering temporal, spatial, and thematic insights into public responses following the Ohio train derailment. It begins by outlining the event timeline, followed by a detailed explanation of the data collection processes for Google Trends and Twitter data. Finally, it introduces the analytical approaches used to examine spatial and temporal patterns in public awareness and perception of the event.
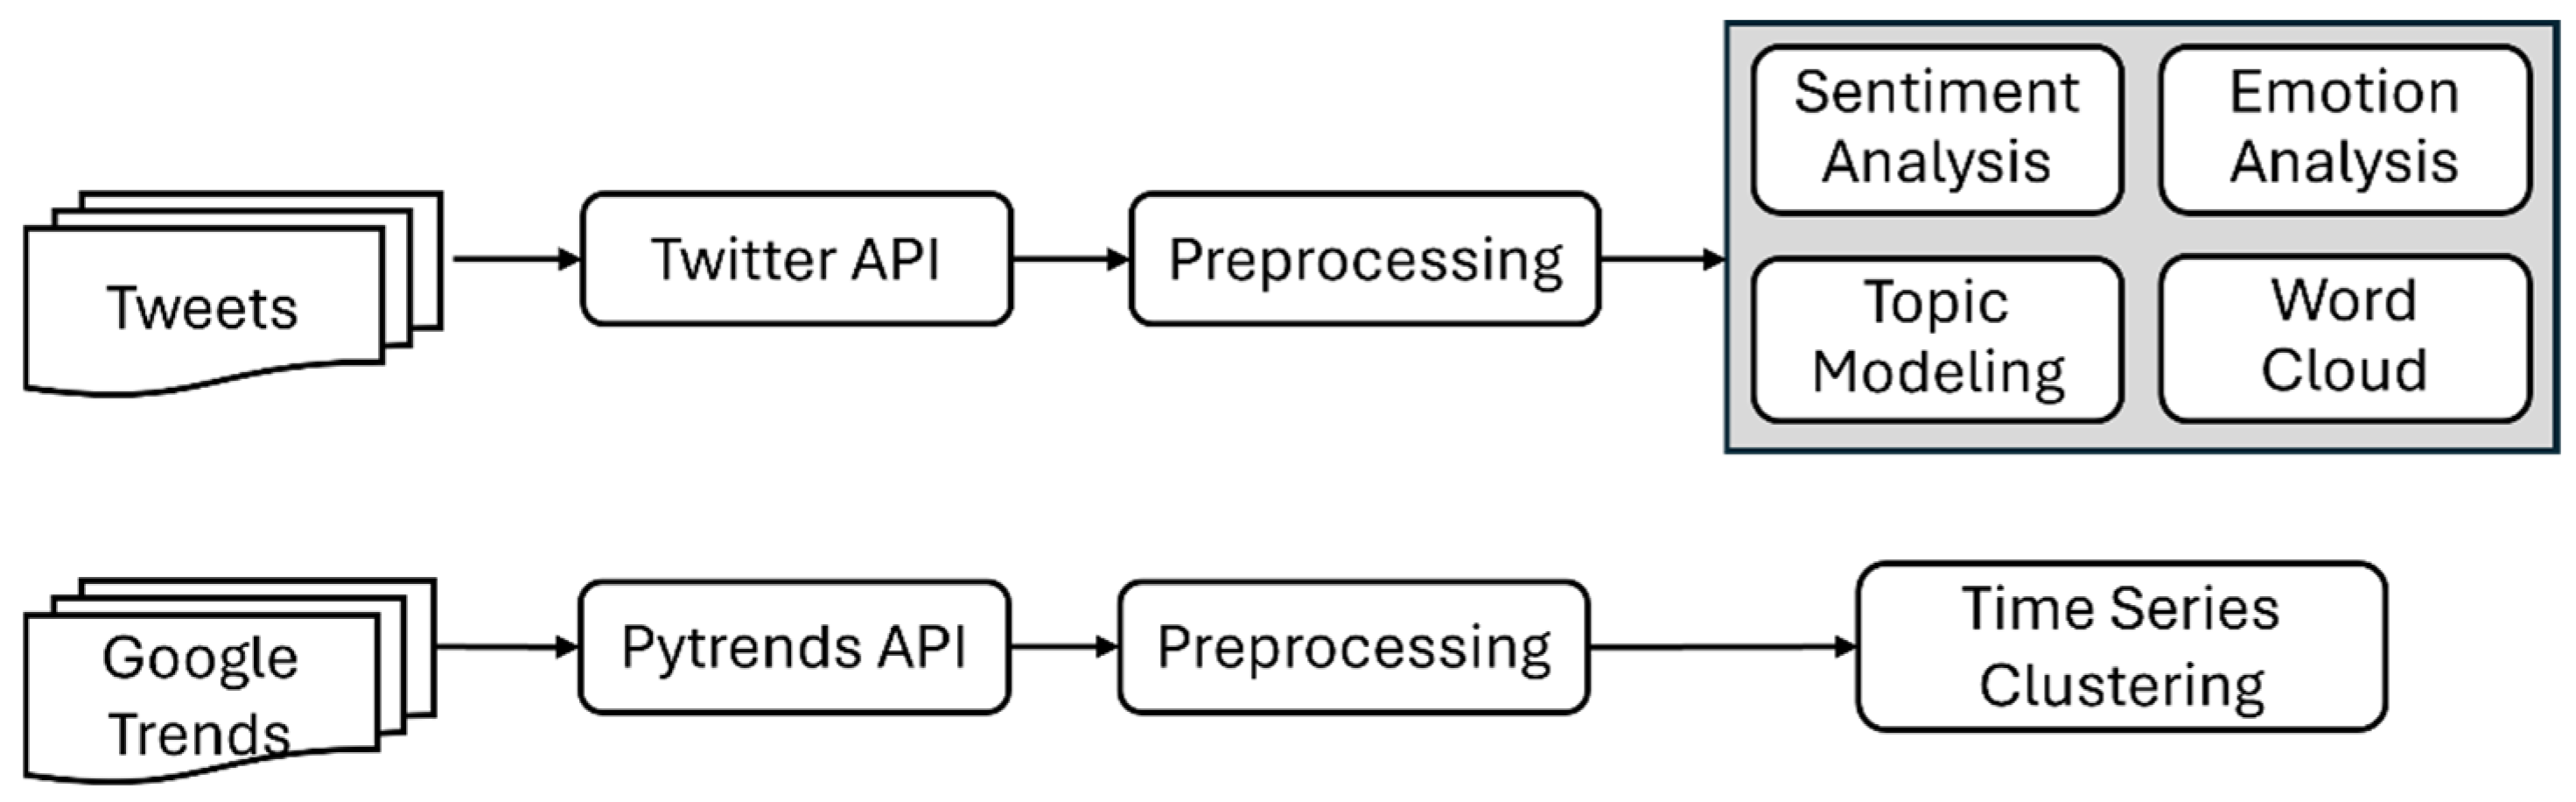
Figure 1 presents the integrated workflow used to examine public awareness and opinion by combining Twitter and Google Trends data. The top pathway outlines the Twitter-based analysis, which includes data collection via the Twitter API, preprocessing, and various forms of content analysis, such as sentiment analysis, emotion analysis, topic modeling, and word cloud generation, to capture the tone, themes, and discourse surrounding the event. The bottom pathway illustrates the Google Trends-based analysis, where data were collected using the Pytrends API and preprocessed for time series clustering. This clustering was conducted at the state level, allowing for the identification of both spatial and temporal trends in public search behavior. While Twitter analysis focuses on the content and emotional context of public discourse, the Google Trends analysis captures broader patterns of public interest over time and across geographic regions. Together, these complementary approaches provide a holistic view of public response to the event.
2.1. Ohio Train Derailment Event Timeline
On 3 February 2023, a freight train derailed in East Palestine, Ohio, U.S., causing a significant disaster in the vicinity. The train, carrying a shipment of ethanol, resulted in a massive fireball upon derailment. In response to the escalating danger, the government implemented an emergency evacuation of all residents within a one-mile radius of the derailment site on 6 February. However, the pollution spawned by the derailment has resulted in an enduring and ongoing environmental impact. According to statements from the Ohio Department of Natural Resources, the chemical spill resulted in the death of approximately 3500 small fish in about 7.5 miles of streams as of 8 February (
https://www.cbsnews.com/news/timeline-east-palestine-ohio-train-derailment-chemicals-evacuations/, accessed on 31 December 2024). By 23 February, it had potentially killed more than 43,000 marine creatures, including fish, crustaceans, and amphibians (
https://www.washingtonpost.com/climate-environment/2023/02/23/ohio-train-derailment-animals-deaths/, accessed on 31 December 2024). Since this devastating event took place, environmental scientists and governmental agencies have been actively developing controlled relief strategies and conducting rigorous assessments of the environmental impacts. This includes the collection of air, soil, and water samples to gauge the extent of pollution. Crash remnants were detected in water samples from water near the derailment site such as Bull Creek, Little Beaver Creek, and the Ohio River. Despite official statements that no hazardous chemicals were detected in the air and water, residents persist in reporting health issues such as headaches and difficulty breathing [
19].
As depicted in
Figure 2, we grouped the event time period into three phases, including the following:
Phase 1: Impact and immediate response (3 February–9 February). This phase includes the derailment event itself, the immediate response by emergency services, the evacuation of the surrounding area, and the immediate efforts to contain and manage the situation.
Phase 2: Investigation (10 February–21 February). This phase begins after investigations into the impact of pollution in local communities. For instance, on February 16, the EPA (U.S. Environmental Protection Agency) administrator visited East Palestine for the first time since the derailment and said that residents with private wells should use bottled water until tests showed that the well water was safe to drink.
Phase 3: Recovery (22 February–28 February). This phase represents the longer-term aftermath of the event, including government response at a higher level, such as the visit from previous president Donald Trump on 22 February 2023.
2.2. Google Search Data
Google Trends is a website created by Google that analyzes the popularity of top search queries in Google Search across various regions and languages. It offers unique insights into the public’s awareness of specific events by monitoring Google search behaviors over time. For this study, we used Google Trends to obtain data related to Ohio train derailment events. While Google does not directly offer an API to extract data from Google Trends, PyTrends, an open-source Python library, allows a simple interface for automating downloading of Google Trends reports. It enables users to extract time-series data of Google searches related to keywords. When gathering data, Google Trends normalizes it by scaling according to the total search volume within a specific time period and location. The data are indexed on a scale from 0 to 100, where the peak popularity for a term in the chosen region and timeframe is assigned a value of 100. All other data points are scaled relative to this peak. In our study, we queried Google Trends for each state individually, indicating that the normalization process was applied on a state-by-state basis. Given this methodology, Google Trends can offer insights into how popular a term is across different areas, making it suitable for analyzing and cross-comparing relative trends over time.
To accurately capture the online discourse surrounding the Ohio train derailment, we used the search term ’Ohio train derailment’ in our data request process. Furthermore, we restricted the time window for data collection from 4 February to 28 February 2023. This timeframe aligns with our identified timeline of the critical events and discussions related to the derailment. This approach guarantees the capture the most relevant and focused insights from the public awareness that unfolded during this period.
2.3. Social Media Data
We further collected tweets data from Twitter, currently known as X, to identify what people are discussing and sharing, providing insights into public opinion and sentiment. Before July 2023, Twitter offered various APIs, including the Rest API, Ads API, Twitter API v2, and Enterprise APIs. These APIs allow developers to access and interact with data, such as tweet content, user profiles, follower data, location information, and more. This study employed Twitter streaming API, notable for its real-time data access. This API enables developers to subscribe to specific users, keywords, or geographic regions and receive all tweets that match predefined criteria. The Twitter streaming API’s unique strength lies in its capacity to provide real-time tracking of public events and discussions. For instance, during the Ohio train derailment event, this API delivered a live feed of all event-related tweets, forming a sense of real-time public awareness.
The Harvard Center for Geographic Analysis (CGA) has utilized Twitter’s streaming API to amass geotagged tweets since 2012, thereby creating a substantial data archive [
9]. In this study, we utilized this repository and defined specific keywords and hashtags relevant to Ohio train derailments. The keywords include “Ohio toxic”, “Ohio river”, “Ohio pollution”, “Ohio derailment”, “Ohio train”, “EastPalestine”, “Ohio disaster”, “Ohio chemical”, “Ohio Chernobyl”, “Ohio water”, and “Ohio train crash”. The hashtags include #EastPalestine, #OhioTrainDisaster, #OhioChernobyl, #ChernobylOhio, #OhioChemicalDisaster, #ohiotoxiccloud, #TrainDerailment, #OhioCoverup, #EastPalestineDisaster, #PalestineOhio, #OhioPalestine, #Ohiotraincrash, and #TrainDisaster. In addition, we selected only tweets posted in English. Having established a study timeframe from 1 February to 28 February 2023, we gathered a considerable number of geotagged tweets posted in the U.S., a total of 10,050. We have three main steps to identify and remove promotional and advertisement tweets. The first step is to build identification criteria. We defined promotional or advisement tweets as those primaries intended to market a product, service, or event. This includes tweets containing sales offers, discounts, promotional codes, or direct calls to action such as ‘buy now’, ‘subscribe’, ‘promotion’, or ‘visit our store’. The second step is the manual review. After selecting tweets based on the above criteria using keyword searches, the team reviewed the content of the tweets to ascertain whether they were promotional or advertisement in nature. The third step is validation. In addition to the criteria, the team members went through the removed and remaining tweets and validated the accuracy of the decisions. Following this rigorous process, we removed a total of 290 tweets identified as promotional or advertisements, resulting in a final dataset of 9760 geotagged tweets for our study.
2.4. Time-Series Clustering
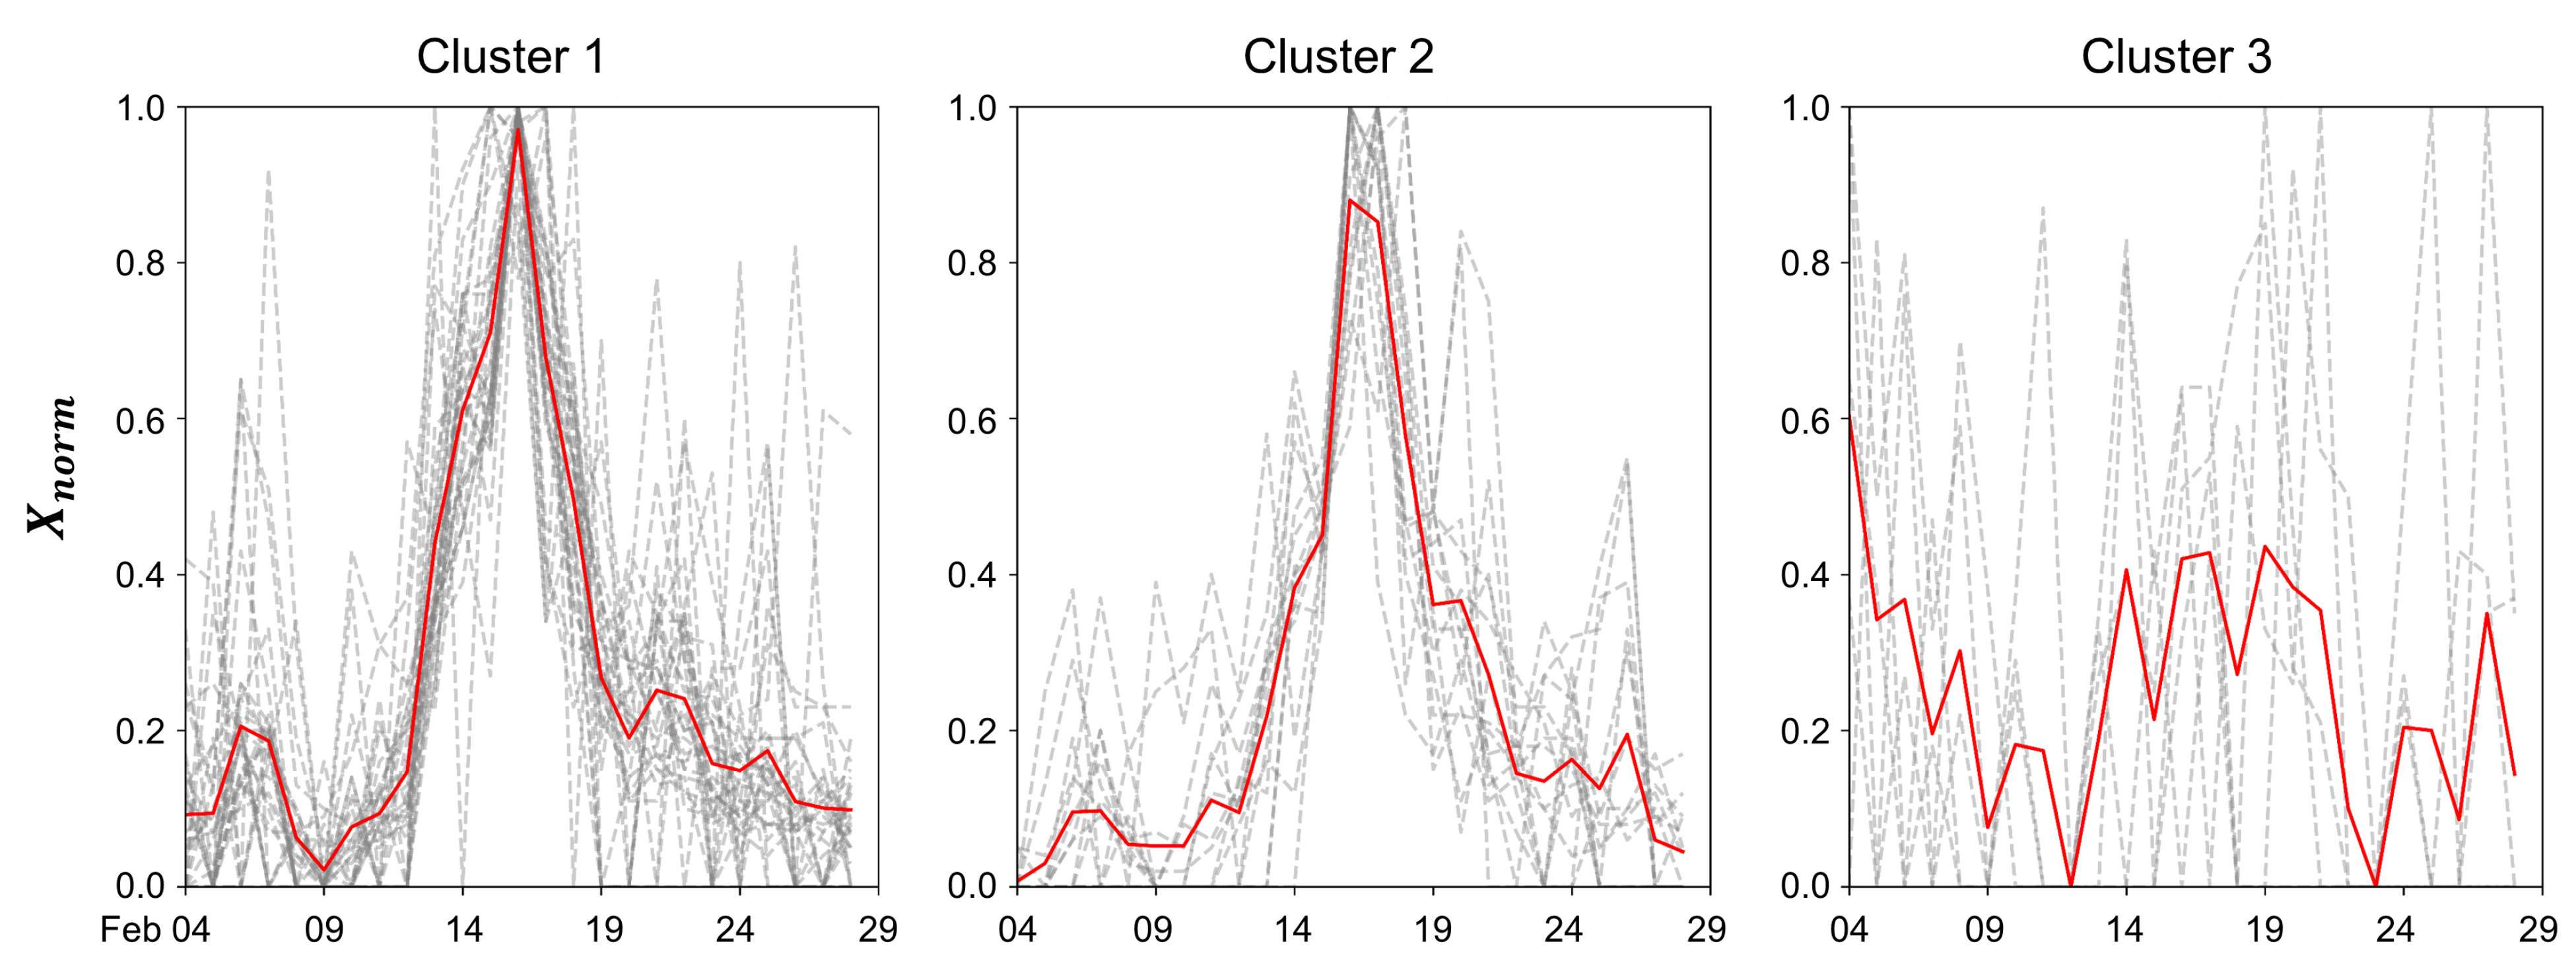
We first performed time-series clustering at the U.S. state level using Google Trends data as introduced in
Section 2.2. Given the limited time series duration incorporated in our research, we opted for an unsupervised approach to this task. We deployed the Self-Organizing Map (SOM), an unsupervised learning algorithm originating from artificial neural networks, specifically crafted for high-dimensional data visualization and clustering tasks. The broad applicability of the SOM stems from its inherent flexibility, topological preservation, scalability, and concurrent dimension region and clustering capabilities, which have warranted its widespread usage across diverse domains [
20,
21,
22]. By feeding the state-level Google Trends time series data into the SOM, we managed to optimize it via the quantization error [
23]. This process resulted in a 1 × 3 neuron setting, which corresponds to three optimized time-series clusters. We set the learning rate as 0.16 and the sigma as 0.7. Our input time series ranged from 4 February to 28 February, thereby leading to a 25-dimension vector, i.e.,
. We derived a normalized vector
, where
.
The training procedure for the SOM is further elaborated upon as follows:
- (1)
Choose random values for the initial weight vectors .
- (2)
Draw a sample training input vector from the input space.
- (3)
Find the winning neuron that has the weight vector closest to the input vector, i.e., .
- (4)
Apply the weight update equation , where is the learning rate and is a Gaussian neighborhood.
- (5)
Return to the second step until the feature map stops changing.
2.5. Sentiment Analysis
The tool chosen for sentiment analysis in this study is VADER (Valence Aware Dictionary and Sentiment Reasoner), a lexicon and rule-based sentiment analysis tool specifically designed to work well with social media data, including Twitter [
24]. Its primary function is to measure the polarity (whether the sentiment is positive or negative) and intensity (the strength of the sentiment) of emotions in text. The VADER scoring system provides not only the Positivity and Negativity scores but also a Compound score that conveys the overall sentiment of a text. This Compound score ranges from −1 to 1, where a score less than −0.05 indicates a negative sentiment, a score more than 0.05 signifies a positive sentiment, and scores between these thresholds are regarded as neutral. One of VADER’s strengths is its adeptness at analyzing short, informal texts such as tweets, which often include abbreviations, slang, and emojis. It even considers the impact of text attributes like capitalization and exclamation points on sentiment. Therefore, in this study, VADER’s ability to provide context-specific sentiment scores enables us to capture the nuanced dynamics of sentiment on social media with a high degree of accuracy.
2.6. Topic Modeling
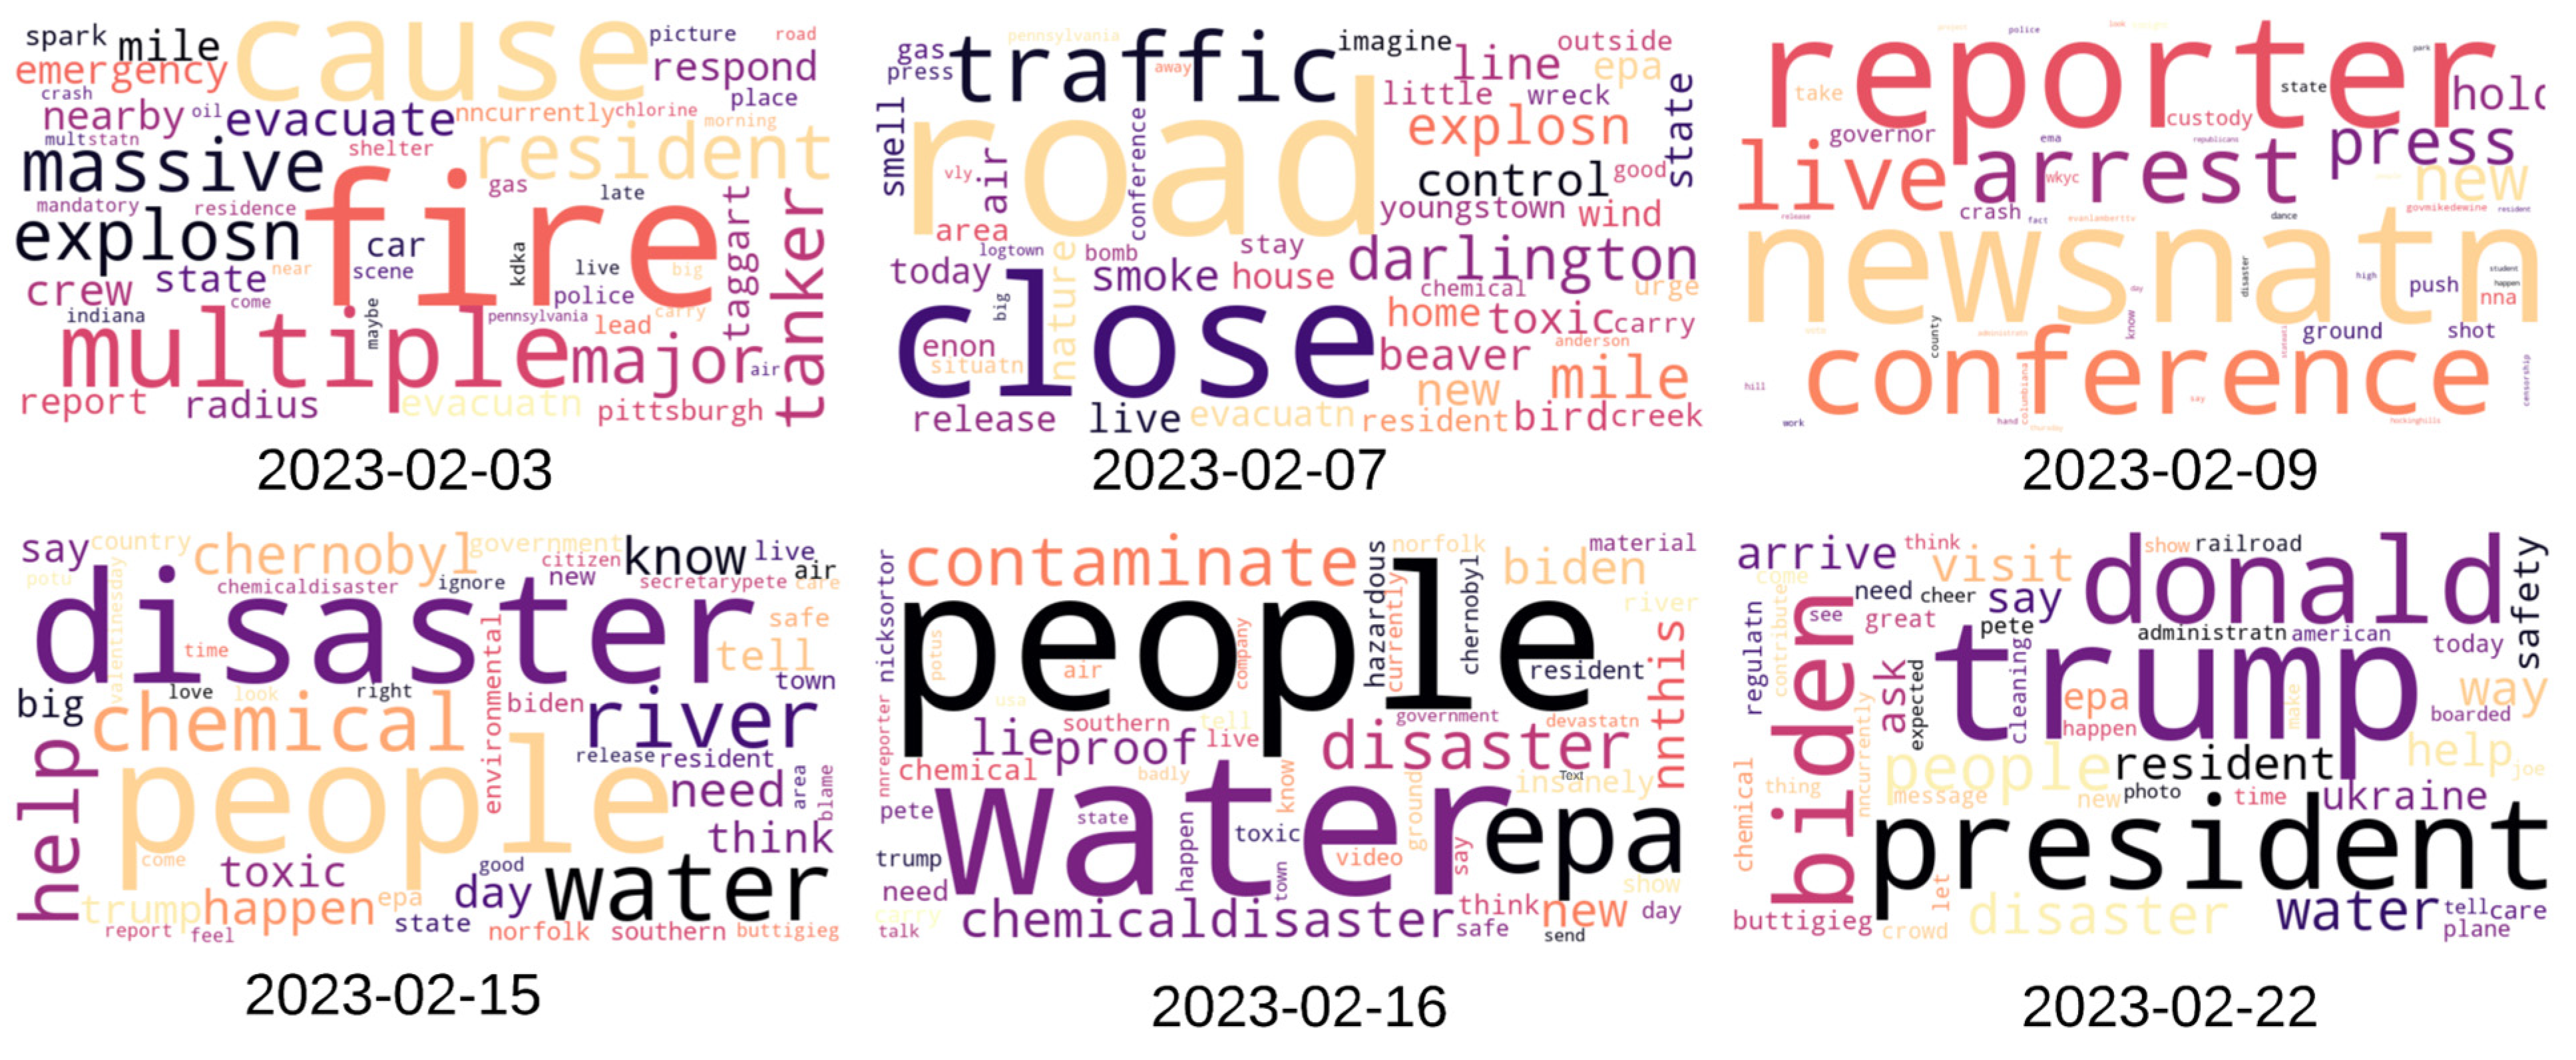
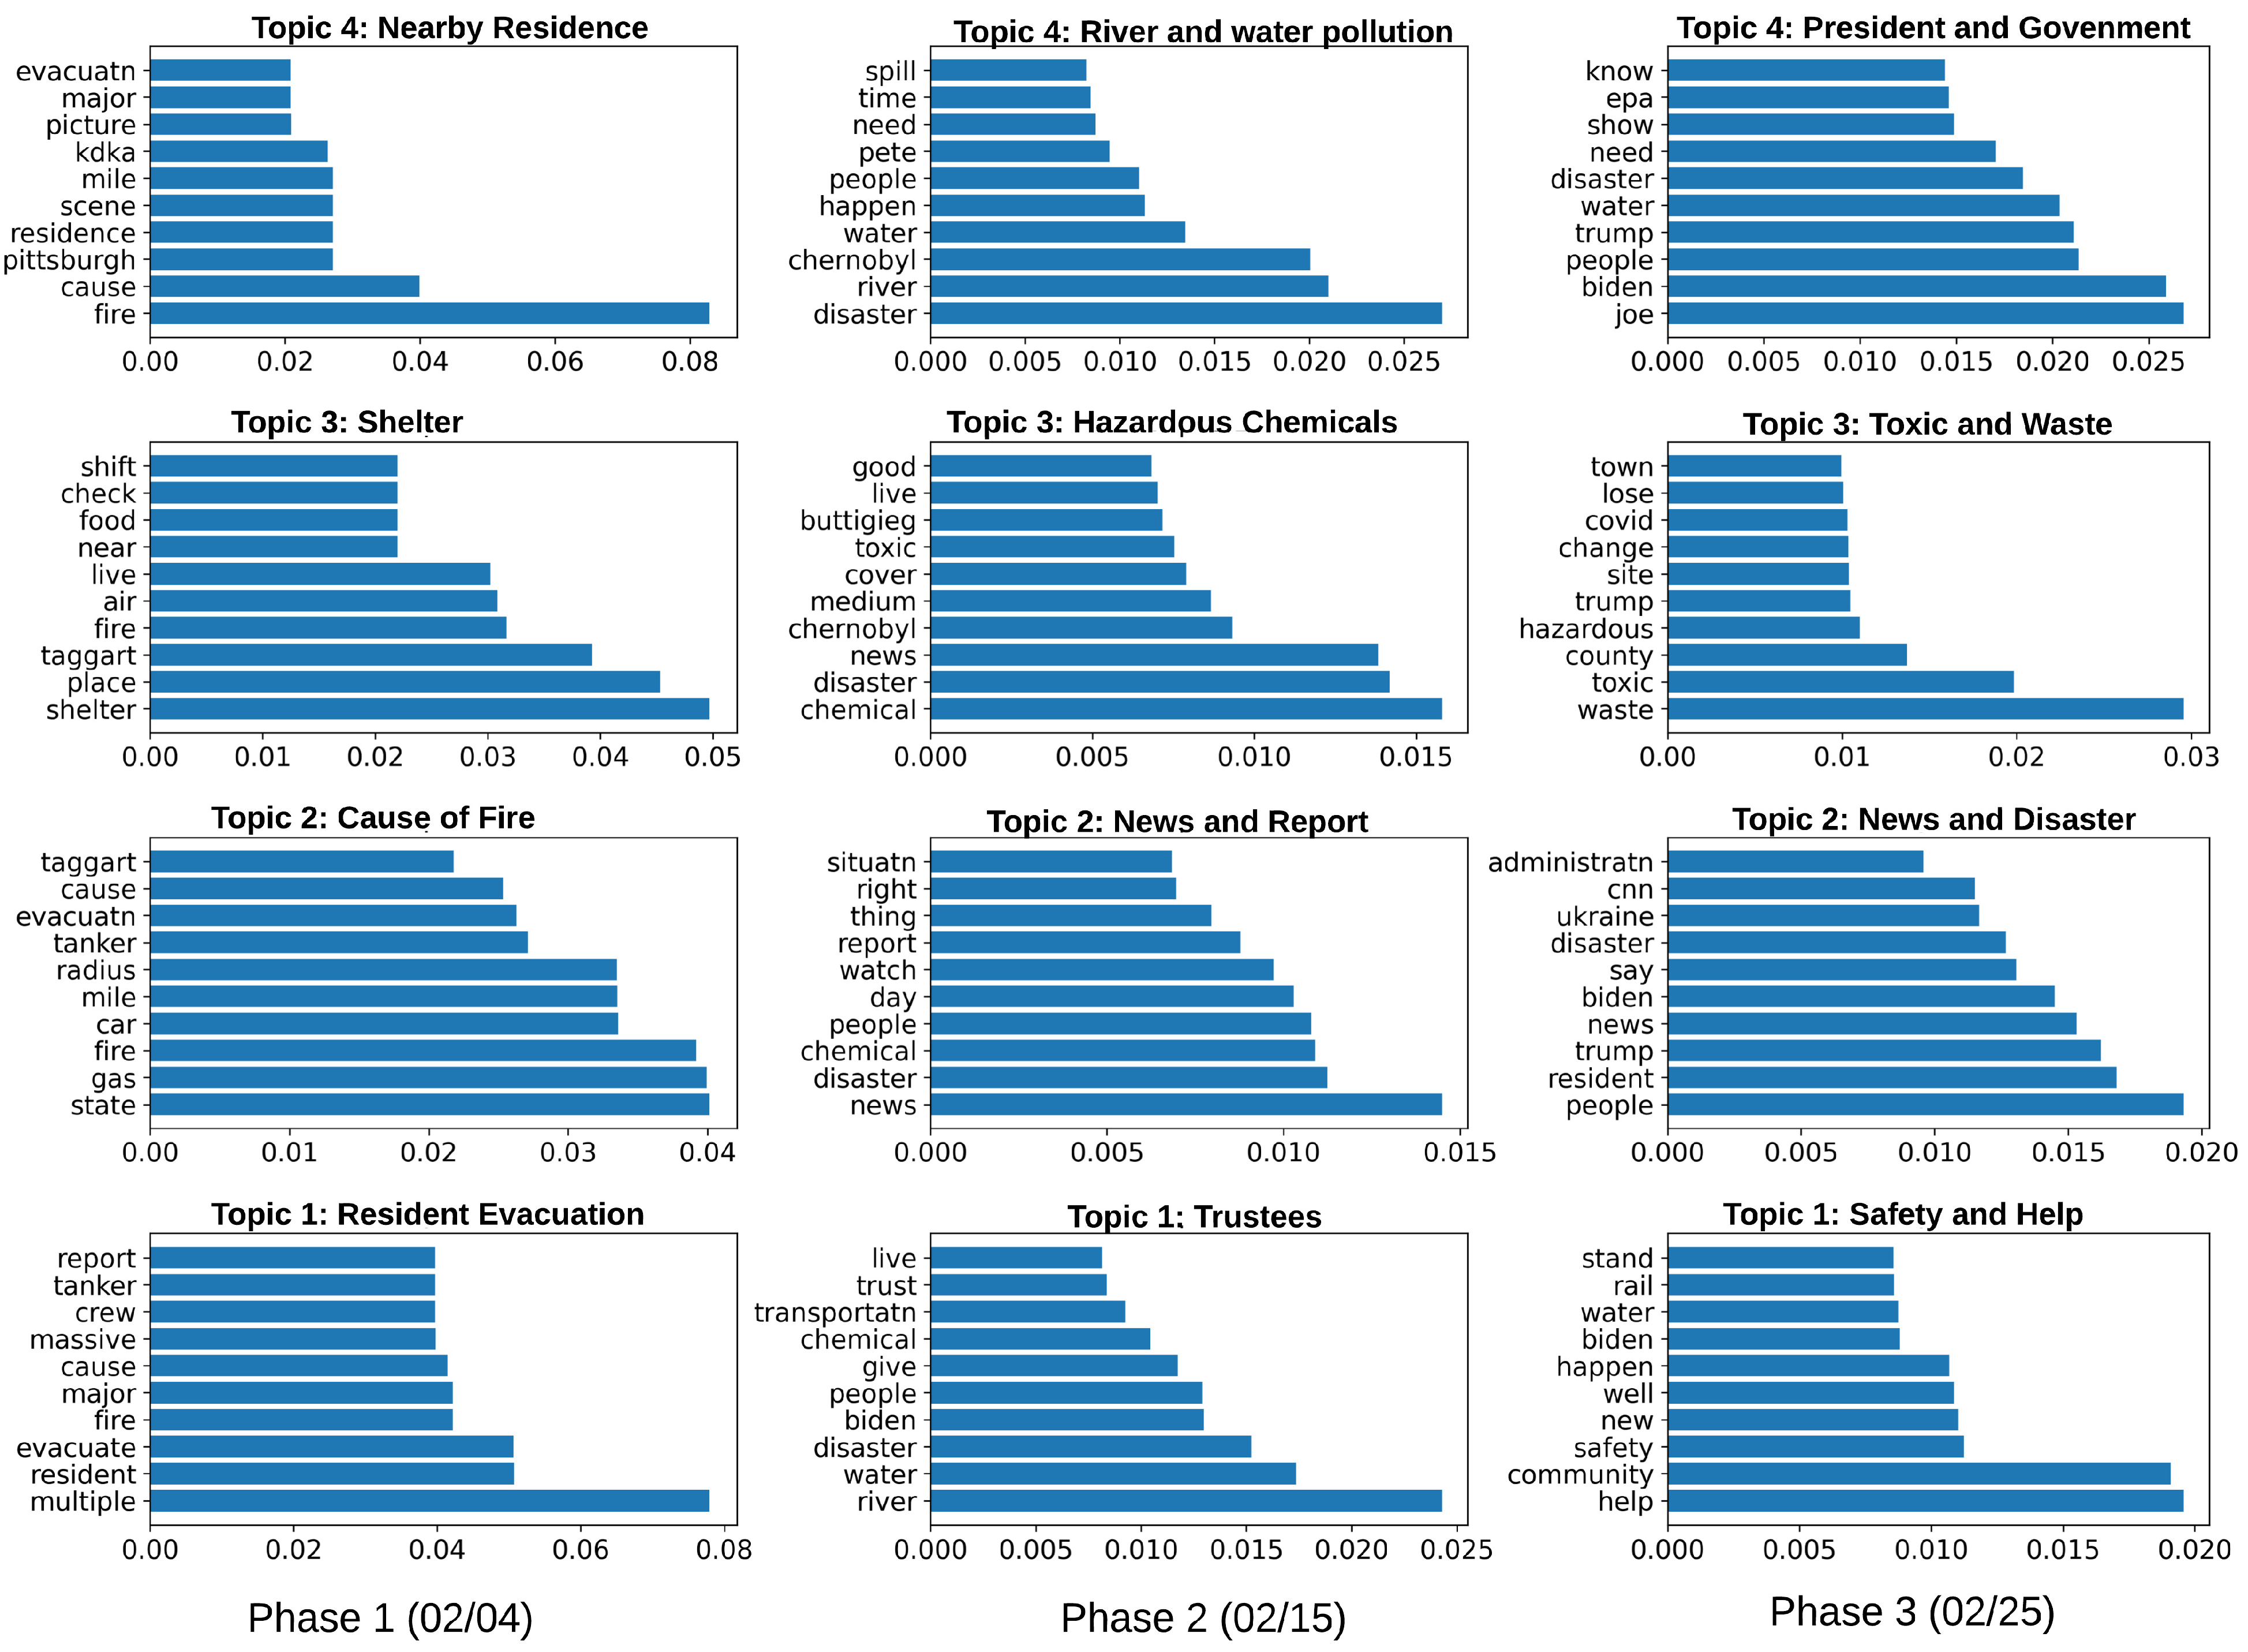
Latent Dirichlet Allocation (LDA) serves as a valuable tool for topic modeling, enabling the identification of underlying topics within tweets. It is particularly well-suited for processing large quantities of unstructured data, such as the text collected from Twitter feeds. The first step involves preprocessing the Twitter data, including tokenization, which splits the text into individual words, the removal of stop words (i.e., frequently used words such as ’is’, ’the’, etc., that offer limited informative value), and stemming or lemmatization, which reduces words to their root form. Specific to this study, we also excluded words like ‘ohio’, ‘train’, ‘derailment’, and ‘palestine’ from the text related to the train derailment event to focus on meaningful content.
Once preprocessing was complete, we applied the LDA model. The underlying premise of LDA is that each tweet is a combination of a specific number of topics, and every word within a tweet fit to one of its topics. Based on word distributions across tweets, LDA identifies these topics. The model initially assigns each word in a tweet to a random topic and then iteratively reassigns words to topics. This reassignment is grounded in the probability of a word belonging to a topic and the tweet containing that topic. Upon multiple iterations, a steady state emerges wherein words are allocated to particular topics. These topics manifest as collections of keywords. By studying these keywords, researchers can deduce the theme of the topic. For this study, we employed Gensim, a Python library, to implement the LDA model for Twitter data analysis.
4. Discussion
In this research, we delved into an analysis of public sentiment and opinions concerning the Ohio train derailment event, leveraging both Twitter data and Google Trends data. This multidimensional approach facilitated a comprehensive understanding of the spatial and temporal trends related to this event. Emergency management typically encompasses four phases: mitigation, preparedness, emergency response, and recovery [
27]. However, unlike natural disasters, some disruptive events (i.e., train derailment) are unpredictable. As a result, the preparedness phase is not included in this work. Our analysis and results provide crucial insights into how public discourse evolved, from immediate reactions to long-term reflections, and how geographical nuances influenced this discourse. As depicted in
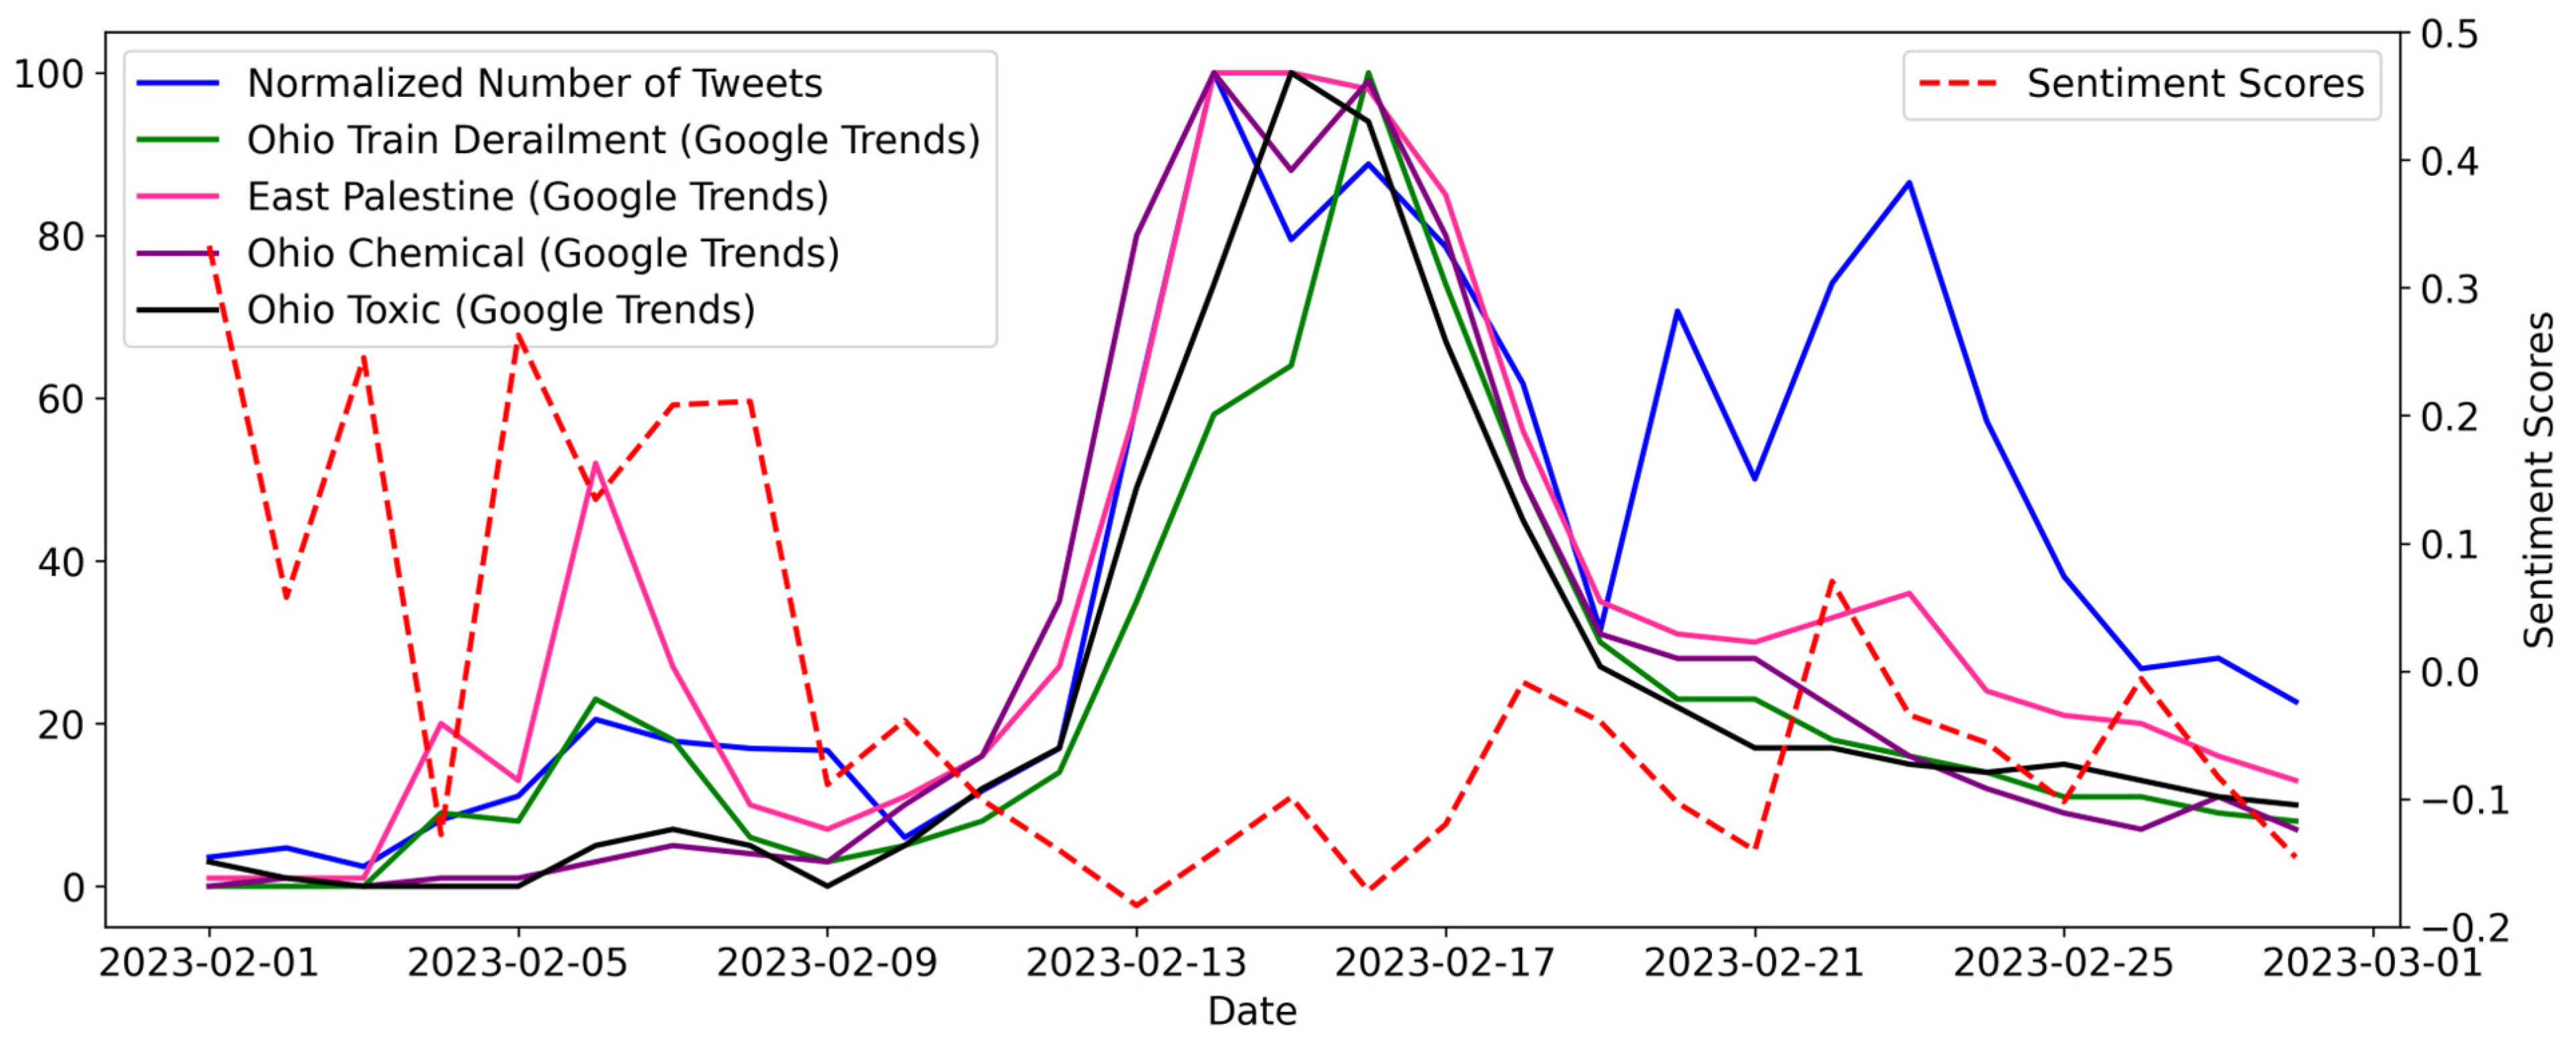
Figure 1 and
Figure 4, both Twitter and Google Trends data reveal a consistent pattern of public concerns, showing an inverted U-shaped curve. This clearly delineates the three phases of the event: impact, investigation, and response. Public sentiments extracted from Twitter data further corroborate the three distinct phases of the disaster. Therefore, social media platforms and search engines can play an important role in identifying different phases of emergencies. By tracking temporal trends of public awareness, policymakers can develop or adjust policies related to disaster management. For example, there is a dramatic increase in the number of tweets and Google queries from Phase 1 to Phase 2, while sentiment scores are continuously decreasing. Some typical tweets regarding the event include ‘
That #trainderailment in #Ohio is giving everyone the perfect reason to flee; like a Cat 5 Hurricane about to hit’, ‘
Ummmm what??? WTF are they trying to hide??? #OhioTrainCrash’, and ‘
Explain this #Ohio Governor @MikeDeWine! Are you still using #Trump tactics to censor journalists from news media that don’t align with your political party?’ The temporal pattern and the negative content of the posted tweets suggest that local authorities or the governor need to pay more attention to disclosing the truth to the public through various means, ensuring that the government maintains public trust. In addition, understanding how public awareness changes over time can provide insights into behavior patterns. This can be important for predicting how people might respond to future emergencies and for developing strategies to encourage desired behaviors, such as evacuating and building shelters.
This study further identified public opinions towards the event via text mining, offering valuable insights into the concerns, beliefs, and priorities of the affected community. This can guide policymakers and emergency responders in evidence-based decision-making that are in line with the needs and preferences of the public. Understanding opinions can further help authorities tailor their communication strategies to address prevailing misconceptions, fears, and rumors. In this case study, the analysis of Twitter data in Phase 2 revealed a prevalent distrust towards public officials, primarily due to the observed discrepancies between state officials’ recommendations and those of the Ohio EPA. In light of this, it is imperative for local governments to provide clear and concise clarifications to rebuild trust. More importantly, public opinions shed light on the long-term challenges and needs of affected communities. For instance, East Palestine residents have concerns over whether the pollution danger that may be addressed in the short term will pose a potential long-term impact. Such concerns underscore the need for policymakers to implement effective strategies, including routine air and water quality assessments, ensuring access to safe drinking water, and more. Oladeji et al. conducted mobile air quality sampling on 20 February–21 February to complement initial data from the EPA stationary air monitor [
28]. The levels of acrolein were high relative to those of other volatile organic compounds, while the average concentrations of xylenes, benzene, vinyl chloride, and toluene were below minimal risk levels for intermediate and chronic exposure. These proactive measures can steer recovery and rebuilding initiatives in a direction that ensures sustainability and aligns with community needs and concerns.
In addition to ongoing environmental monitoring, there is a pressing need to systematically track and assess the health outcomes of local residents to ensure their long-term well-being. This approach is not just about immediate responses but also about understanding the prolonged impact of the incident. The growing public concern is evident in social media, as highlighted by Twitter users’ posts: ‘
Yikes! #Health concerns grow in East Palestine, Ohio, after train derailment’, and ‘
Everybody in East Palestine needs to (1) get a current health check up including labs and blood work (2) get a lawyer. (3) sign nothing.’. This sentiment echoes the worries of a local East Palestine resident, as revealed in an interview: ‘
I’m worried about the health and safety of my family and the residents of East Palestine. What’s our chronic health outlook going to be?’ [
29]. These statements underscore the community’s anxiety and the urgent need for reliable health information. To address these concerns, the expertise of epidemiologists and community health professionals becomes invaluable [
30]. They are equipped to set up a comprehensive health registry, which would play a crucial role in tracking health outcomes over an extended period. Additionally, conducting thorough and ongoing chemical exposure assessments, as recommended by the CDC, is vital. Moreover, establishing a strong communication channel between health professionals, local authorities, and the community is essential. Regular updates, transparent sharing of information, and community engagement in health monitoring efforts can help alleviate fears and build trust. It also ensures that the community’s concerns are heard and addressed promptly, fostering a collaborative approach to managing this health crisis.
However, there are several limitations to be addressed in this study. First, both Twitter and Google Trends users represent a subset of the population, not the entire population. This could potentially lead to bias in the interpretation of the data. Second, Twitter feeds often contain a significant amount of noise, including irrelevant posts, spam, or misinformation. This could pose challenges in data processing and analysis. While some tools (e.g., tweetbotornot) can be used to filter out noise, they may not be 100% effective. In addition to concerns about data quality, Twitter terminated free access to its APIs in 2023 and now requires a monthly fee. This change has resulted in challenging and costly data collection for academic researchers. Other existing social media platforms, like Facebook and Instagram, could be considered as potential data sources.
In our future work, we plan to include diverse news media platforms such as the Global Database of Events, Language, and Tone (GDELT) (
https://www.gdeltproject.org/, accessed on 31 December 2024) and Television Archive (
https://archive.org/details/tvarchive, accessed on 31 December 2024). The GDELT Project monitors the world’s news from nearly every corner of the world in over 100 languages and identifies the people, locations, themes, emotions, and events in the news in near real-time. It can serve as an extensive source of global news data that complements local and regional data. Television archives, on the other hand, offer unique access to mainstream narratives and public discourse. By integrating data from these sources, researchers can gain a holistic view of the information landscape during disruptive events. This will not only enhance the accuracy of the sentiment analysis but also broaden the spectrum of the response analysis, ensuring a more inclusive, diversified, and well-rounded assessment. However, with this expansion in data sources, it will be crucial to develop robust methods for data cleaning, integration, and analysis to handle the increased complexity and volume of data. Last but not least, this study is short-term and specifically focuses on the variations in public perceptions over a brief period. However, it is essential to investigate the long-term impact on health outcomes within communities in future research.


