Skip Content
You are currently on the new version of our website. Access the old version .
BDCCBig Data and Cognitive Computing
  • Editor’s Choice
  • Article
  • Open Access

16 March 2025

Defining, Detecting, and Characterizing Power Users in Threads

,
,
,
,
,
and
DII, Polytechnic University of Marche, 60121 Ancona, Italy
*
Author to whom correspondence should be addressed.
This article belongs to the Special Issue Research Progress in Artificial Intelligence and Social Network Analysis

Abstract

Threads is a new social network that was launched by Meta in July 2023 and conceived as a direct alternative to X. It is a unique case study in the social network landscape, as it is content-based like X, but has an Instagram-based growth model, which makes it significantly different from X. As it was launched recently, studies on Threads are still scarce. One of the most common investigations in social networks regards power users (also called influencers, lead users, influential users, etc.), i.e., those users who can significantly influence information dissemination, user behavior, and ultimately the current dynamics and future development of a social network. In this paper, we want to contribute to the knowledge of Threads by showing that there are indeed power users in this social network and then attempt to understand the main features that characterize them. The definition of power users that we adopt here is novel and leverages the four classical centrality measures of Social Network Analysis. This ensures that our study of power users can benefit from the enormous knowledge on centrality measures that has accumulated in the literature over the years. In order to conduct our analysis, we had to build a Threads dataset, as none existed in the literature that contained the information necessary for our studies. Once we built such a dataset, we decided to make it open and thus available to all researchers who want to perform analyses on Threads. This dataset, the new definition of power users, and the characterization of Threads power users are the main contributions of this paper.

1. Introduction

Threads (https://www.threads.net, accessed on 15 January 2025) is a social network launched by Meta on 5 July 2023, designed as an extension of Instagram (https://www.instagram.com, accessed on 15 January 2025) to encourage the sharing of text content and the participation of people in public discussions. It was conceived as a direct alternative to X, offering an environment based on user interaction through short texts, images, and videos. Since its first days, Threads has attracted the attention of a significant number of users, reaching more than 100 million sign-ups within the first week of its launch (https://www.bbc.com/news/technology-66153244, accessed on 15 January 2025). The integration of Threads with Instagram allows users to employ their Instagram profile to participate in Threads. This facilitated people’s rapid adoption of Threads by automatically transferring social connections that were already on Instagram to Threads. Despite its initial success, Threads has faced significant challenges in maintaining a high level of engagement and establishing itself as a flagship platform in the social networking landscape (https://edition.cnn.com/2023/08/03/tech/threads-user-count-falls/index.html, accessed on 15 January 2025). However, its content-based nature and Instagram-based growth model make it a unique case study for analyzing social networks and the dynamics of digital interactions.
Social Network Analysis (SNA) is a fundamental tool for studying social networks [1,2,3,4]. It focuses on the observation and modeling of users, represented by nodes, and the ties that connect them, represented by arcs. SNA allows the investigation of interaction patterns, diffusion processes, and organizational dynamics within social networks. Indeed, in social networks, the ties between individuals are not just connections, but form the framework through which information circulates and communities are built [3,5,6,7]. SNA allows us to study how information spreads and how networks react to perturbations by identifying central nodes, strong and weak ties, and structures that keep networks cohesive [8,9,10,11,12,13].
Within social networks, a small group of individuals often emerges who play a key role in shaping the dynamics of user interaction and information dissemination. In the scientific literature, these individuals are referred to by various names, such as power users [14,15,16], lead users [17], influential users or influencers [5,18,19,20,21,22], etc. In the following, we will use the term “power users” to refer to them. Because of their central position in the network, their ability to spread information, and their visibility, power users are able to attract the attention of a significant number of people, influencing information spread and ultimately opinions and behaviors of the other users.
The study of power users has been a central topic in SNA [5,17,18,19,20,23]. Indeed, due to their characteristics, power users act as catalysts in the dissemination of content, accelerating the speed at which information spreads and amplifying its visibility on a large scale. Moreover, their presence is often crucial for the cohesion of the network itself. Indeed, power users tend to connect communities that would otherwise be isolated, and keep the network resilient to disruptions caused, for example, by the abandonment of the network by a subset of users or by other power users [24,25]. Understanding whether there are power users in a network, and if so, who they are, what their characteristics are, and how they behave are challenging issues at both the theoretical and the application levels. For example, it is possible to improve marketing strategies, identify emerging trends, or analyze the information dissemination in real-time [25,26,27,28].
Since Threads is a new social network, the study of power users in it is still in its early stages. This paper aims to provide a contribution in this setting. In particular, it aims to propose a definition of the concept of power users, as well as an approach to their detection and characterization in Threads.
Our power user definition has the dual goal of being (i) highly selective and (ii) based on measures whose properties are well known in SNA so that it is possible to take advantage of all the knowledge about these properties that has been gained in the past. We want to give a definition of power users that can be applied to Threads, but also to other content-based social networks. More specifically, our definition of power users is based on the idea that to fulfill this role, it is not enough for such users to have many connections, but they must also be close to as many users as possible, act as bridges between user communities who would otherwise not communicate, and have connections with other power users. In SNA, the four properties highlighted above are represented by the four most classical forms of centrality, namely degree, closeness, betweenness, and eigenvector centralities [29].
After introducing our power user definition, we apply it to detect and characterize Threads power users. As we have seen above, Threads is a unique case study in the social network landscape, since it is content-based, like X, but has an Instagram-based growth model, which makes it significantly different from X. For this reason, we believe that an ad hoc study of Threads power users, which takes the peculiarities and the internal structure of this social platform into account, can provide insight into this important phenomenon in this new, but already extremely important, social network.
In order to conduct our study of Threads power users, we needed a dataset derived from this platform that contained all the structural and content information necessary for this analysis. Unfortunately, we could not find an existing dataset in the literature that could support this type of analysis. Therefore, we decided to build one ourselves. This task was not easy due to the difficulty of obtaining data from the Threads APIs and the limitations on their use imposed by the platform. After completing this task, we decided to make this dataset open, so that it can be used in the future by all researchers who want to perform studies and analyses on Threads.
In summary, the main contributions of this paper are as follows:
  • We propose a new definition of power users that requires them to have simultaneously very high values of degree, closeness, betweenness, and eigenvector centralities, which are the most classical centrality measures and whose properties are well known in SNA.
  • We illustrate an approach to detect and characterize Threads power users that is tailored to the characteristics of this social network. To the best of our knowledge, this is the first attempt to study Threads power users in the literature.
  • We provide an open dataset on Threads that can be used in the future by all researchers who want to investigate this social platform.
The rest of this paper is structured as follows. In Section 2, we review the related literature. In Section 3, we present the methods used in our research. In Section 4, we describe the corresponding results. Finally, in Section 5, we draw our conclusions and provide an overview of possible future developments of our research in this area.

3. Methods

In this section, we present the methods used in this work. In particular, in Section 3.1 we describe our Threads dataset and the various tasks we had to perform to obtain it. In Section 3.2, we present the model used to represent and study Threads. In Section 3.3, we illustrate the various measures used in our analysis. Finally, in Section 3.4 we present our definition of power users.

3.1. Description of Our Threads Dataset

To build our Threads dataset, we followed a procedure that consisted of four steps, namely (i) downloading posts and comments, (ii) collecting data on the users involved, (iii) assessing the quality of data, and (iv) organizing data into files.
As for the first step, we downloaded all posts and comments from the publicly available Threads feed in the European Union. According to the Threads policy, these data elements should be accessible without the need for an account. To perform the download of posts and comments, we built a Selenium-based scraper. For each post, we collected its URL, the user who published it, its caption, the link to any images and videos contained in it, the timestamp when it was published, and the number of likes it received. The interested reader can find the scraper code in the folder scraper of the GitHub repository https://github.com/ecorradini/Threads_Dataset, accessed on 15 January 2025. It should be noted that this code may need to be updated due to constant changes in the Threads User Interface. Obtaining the data from Threads through our scraper was not easy, as Threads has strict security policies that regulate the access to its data. To run this scraper, we used a server with a 16-core CPU, 96 GB of RAM, and the Ubuntu 22.04 operating system.
We downloaded all the posts and comments published in Threads from 14 December 2023 to 21 February 2024. As we mentioned in the Introduction, we wanted to conduct a study on Threads power users that took into account the peculiarities of this social platform. Now, Threads has a feature that distinguishes it from all other content-based social networks in that each comment is also treated as a post. Therefore, for each comment/post, we stored the possible post to which it is a response (the so-called “parent post”). The identification of posts and comments in Threads and our decision to store the parent post for each post/comment allowed us to reconstruct conversations and discussions conducted by multiple users through chains of posts/comments.
As for the second step of our procedure, we built a second Selenium-based scraper to extract information about users. For each user, we recorded their username, display name, URL address of their profile, biographical information (if available), web links in their profile (if available), and number of followers in the dataset. To run this second scraper, we also used the server described above.
As for the third step, we first identified the posts whose author was not present in the list of users of our dataset and removed them from it, so that for all remaining posts it was possible to track the users who published them. Similarly, we identified users for whom there were no published posts in our dataset and removed them from it so that all remaining users had at least one post published by them.
As for the fourth step, we organized the collected data into two .csv files named posts.csv and users.csv, which store all data related to posts and users. In addition, we created a special folder to store images and videos linked by posts.
Once we built this dataset, we decided to make it available to all researchers who want to perform analyses on Threads. It can be found at the following GitHub address: https://github.com/ecorradini/Threads_Dataset, accessed on 15 January 2025. It is anonymized to protect the privacy of Threads users.

3.2. Model Definition

In order to perform any SNA activity in Threads, it is first necessary to define a model for representing data regarding this social platform. Our Threads model is a classical social network representation model. Specifically, we represent Threads as a network:
T = N , A
Here, N is the set of nodes in T . There is a node n i N for each Threads user who has published at least one post. Since there is a biunivocal correspondence between a node n i and its corresponding user u i , we will use these two terms interchangeably. A is the set of arcs in T . An arc a i j = ( n i , n j ) indicates an interaction from n i to n j ; specifically, it indicates that u i published a comment/post in response to a post published by u j . It also indicates that u j succeeded in arousing the interest of u i .

3.3. Measures Adopted in Our Analysis

In this section, we briefly describe the measures used in our analysis. The core of our power user definition is represented by the centrality measures in SNA. However, we have also used other concepts and measures that are already known in SNA, and we have introduced a new one that is important for our purposes, but which we believe could also be very useful for social network analysts in their future investigations. The definition of measures are given below:
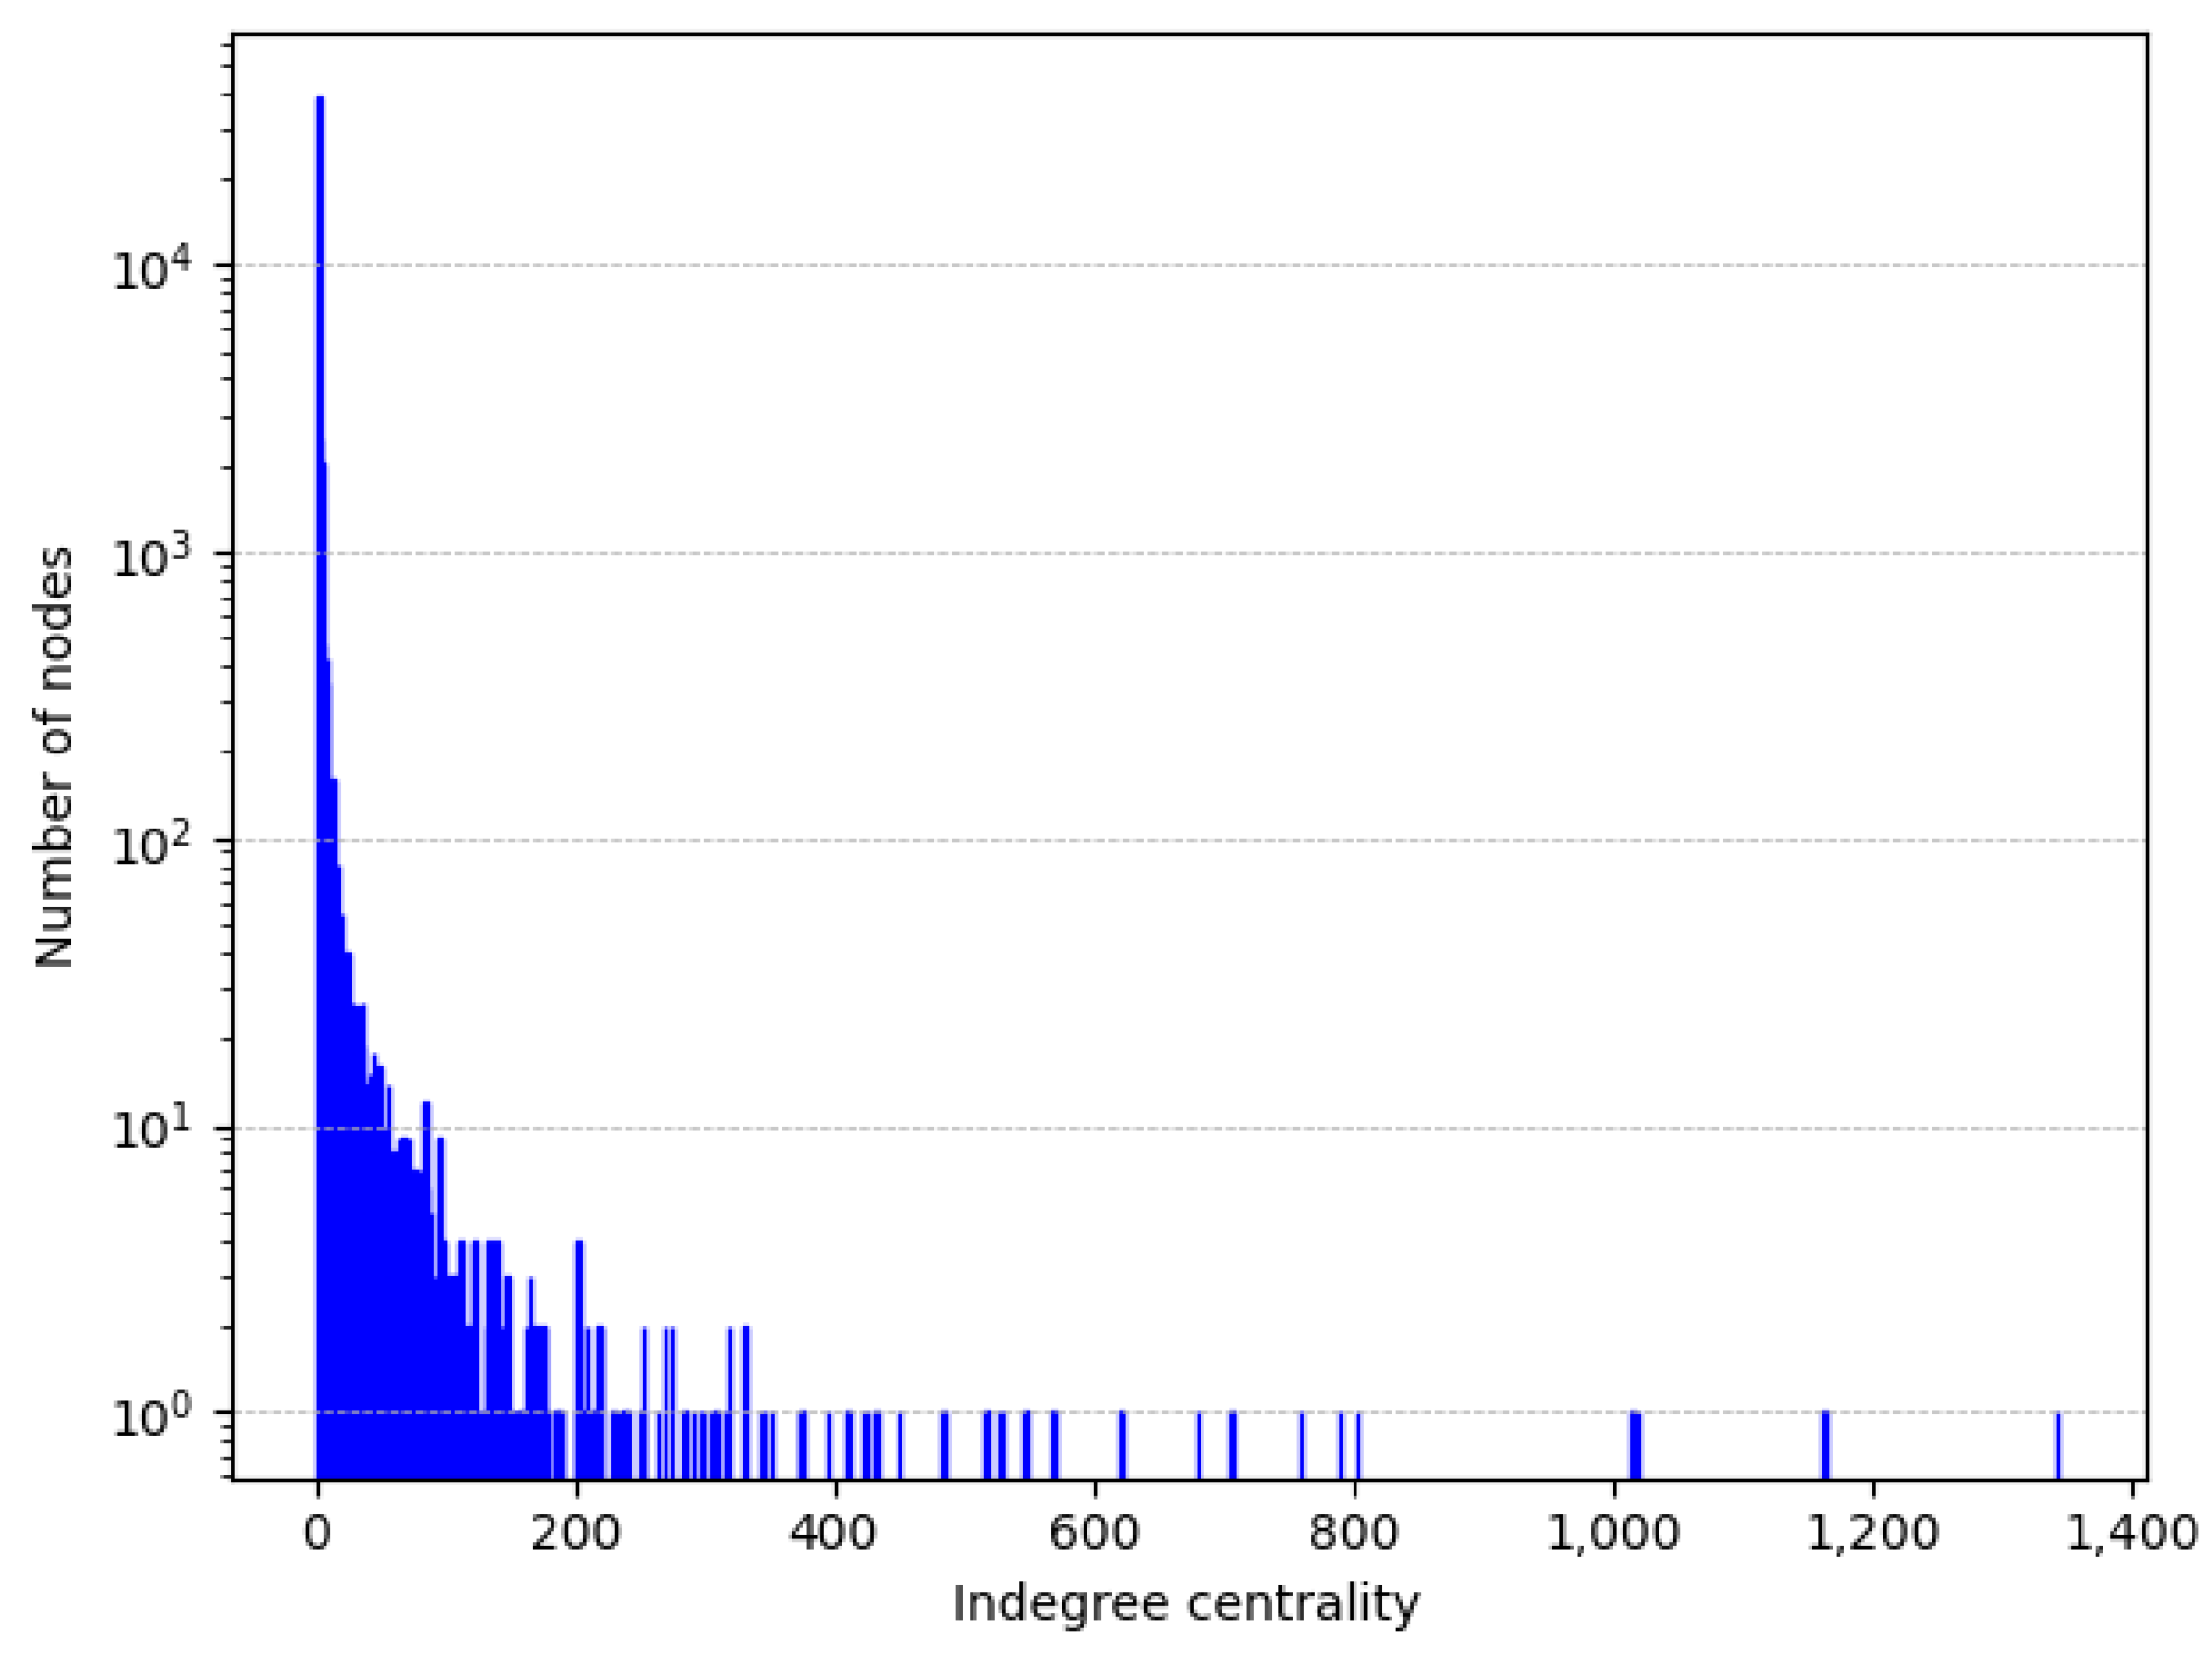
  • The degree centrality of a node is defined as the number of arcs it has. In the case of directed networks, one can distinguish between the indegree centrality of a node, which is the number of arcs incoming into it, and the outdegree centrality of a node, which is the number of arcs outgoing from it. The higher the degree centrality, the more important the node.
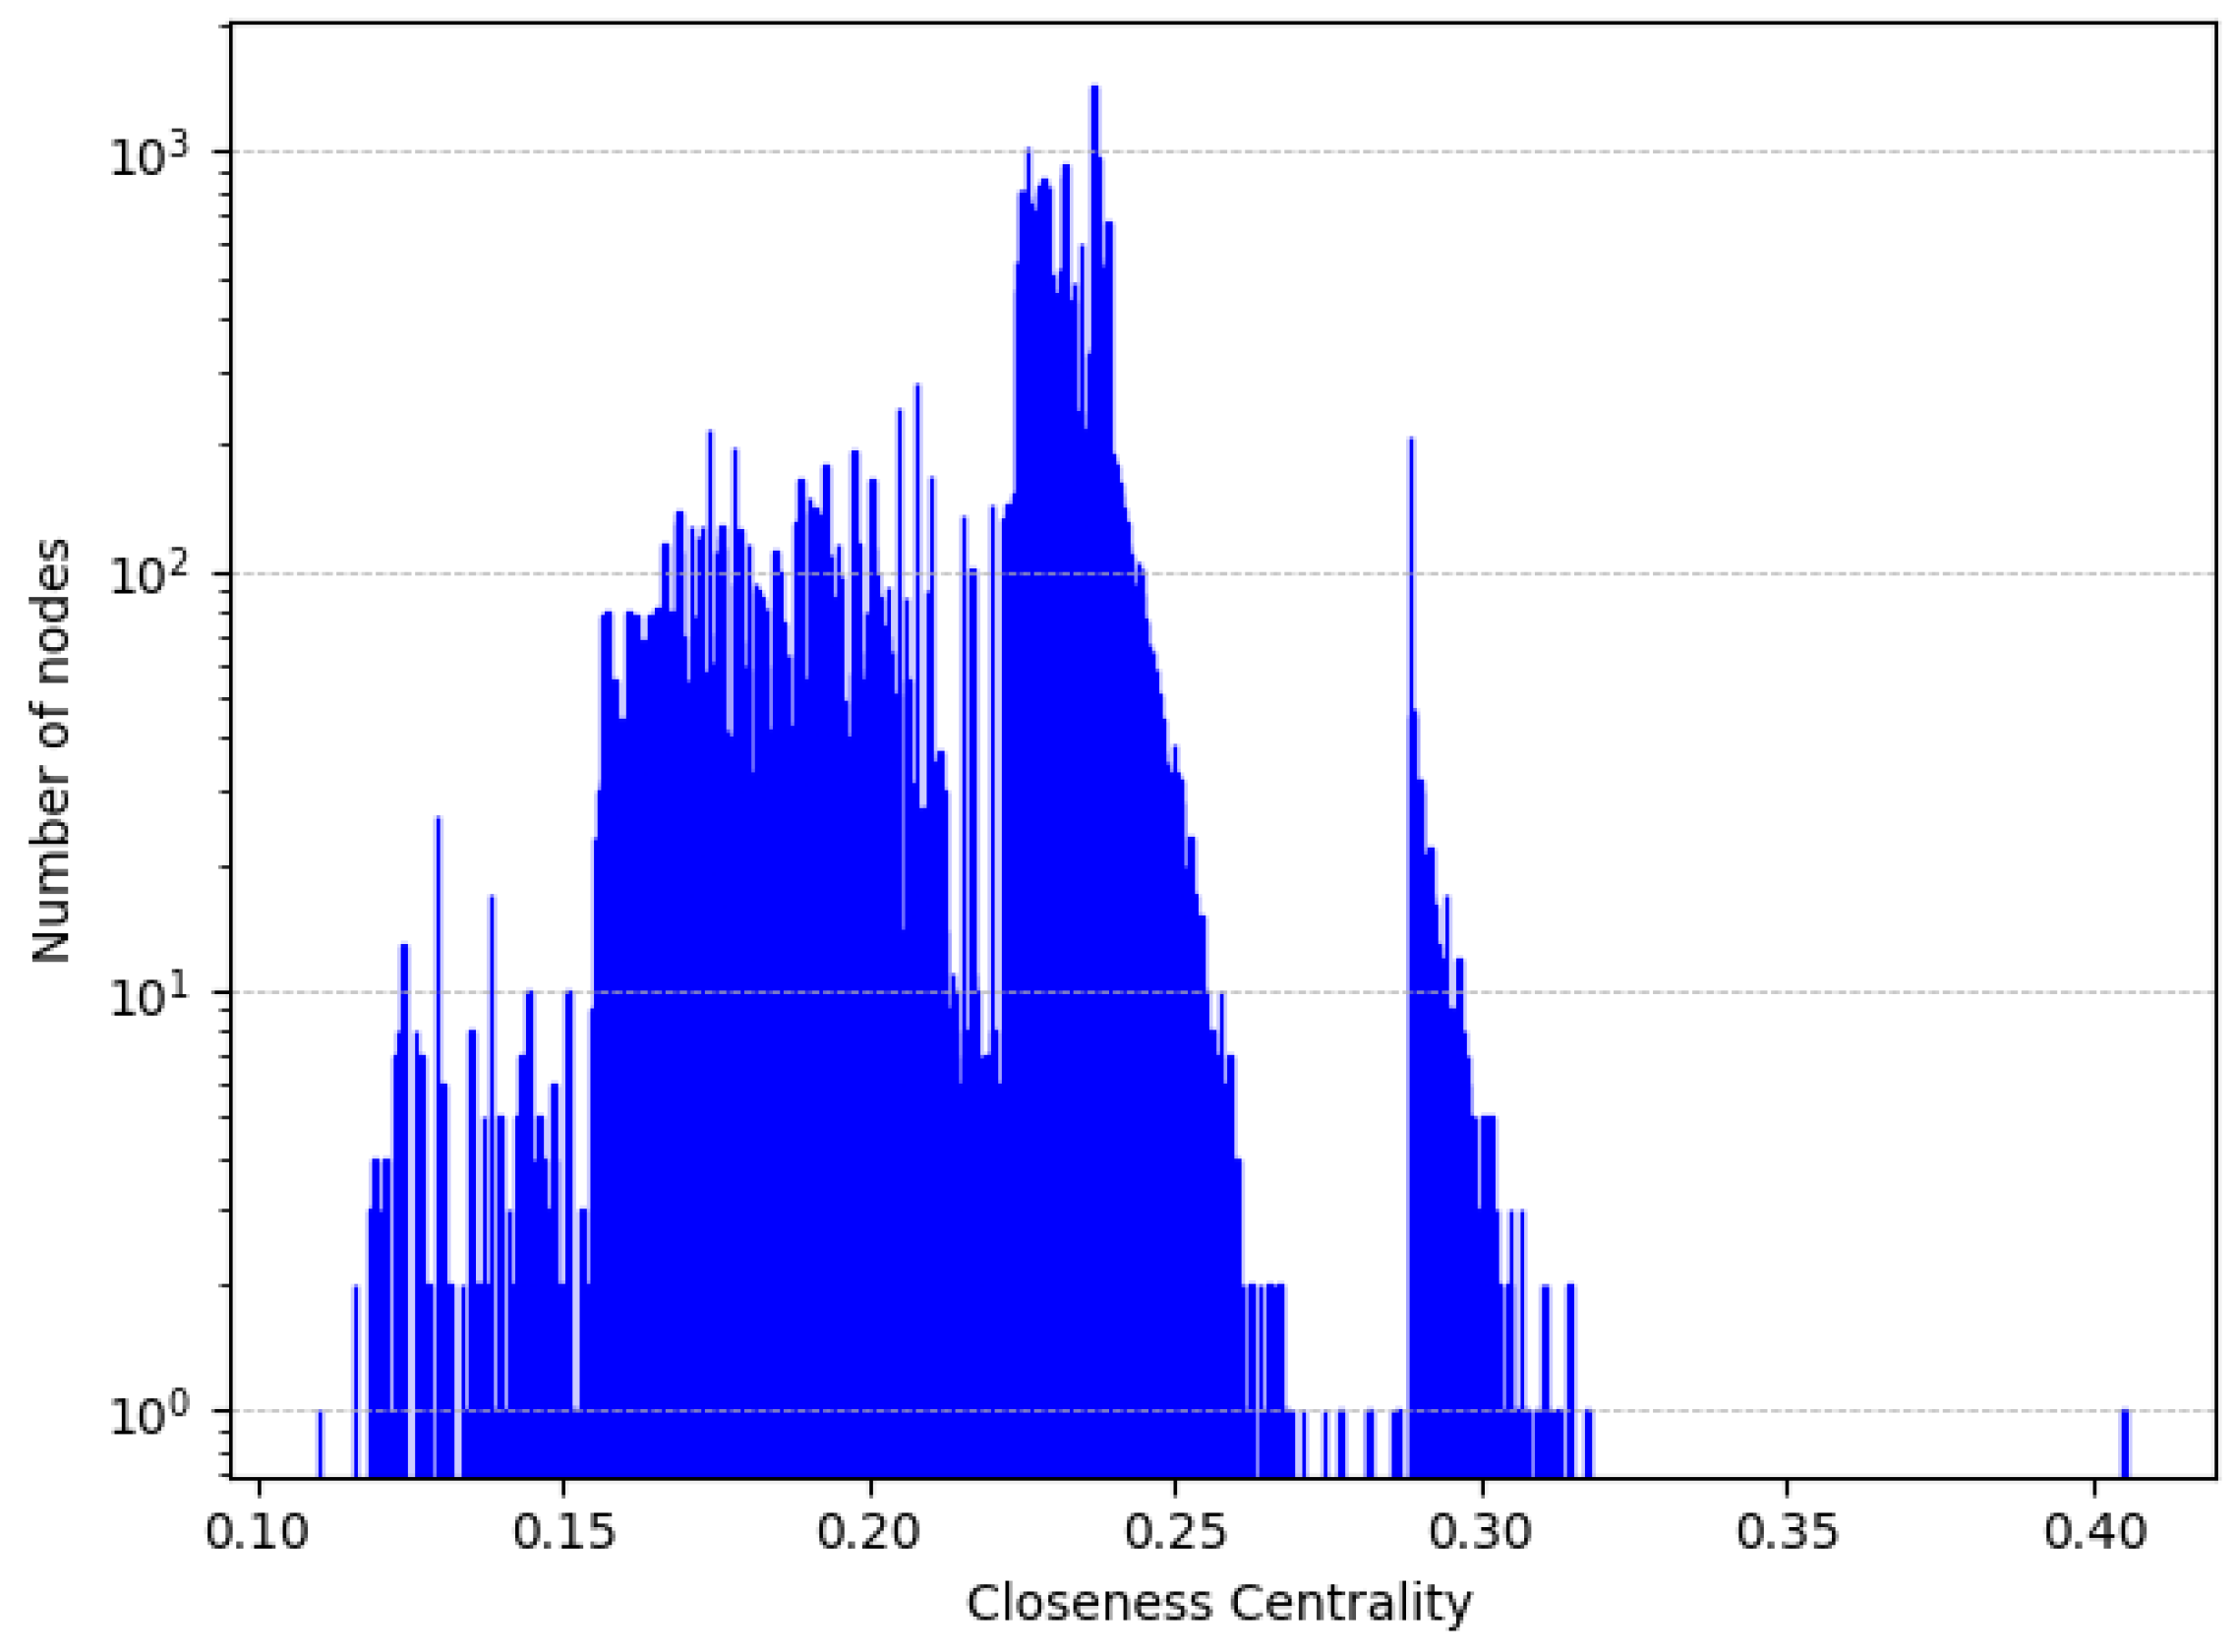
  • The closeness centrality of a node is defined as the inverse of its distance from other nodes. The higher the closeness centrality of a node, the more important it is.
  • The betweenness centrality of a node is defined as the sum of the fractions of all-pairs shortest paths passing through it. The higher the betweenness centrality of a node, the more important it is.
  • The eigenvector centrality of a node codifies the idea that the importance of a node depends on the number of arcs it has with other nodes and the importance of these nodes. Thus, the definition is recursive. The higher the eigenvector centrality of a node, the more important it is.
  • The density of a network is the ratio of the number of real arcs to the number of potential arcs. The higher the density, the more connected the network.
  • The average clustering coefficient of a network is equal to the average of the clustering coefficients of its nodes. The clustering coefficient of a node is given by the fraction of nodes connected to it by an arc that are also connected to each other. The higher the average clustering coefficient, the more connected the network.
  • The average path length of a network is the average number of arcs that form the shortest paths between every pair of nodes in the network. The lower the average path length, the easier it is for information to flow through the network.
  • The diameter of a network is the number of arcs that make up the shortest path between the two most distant nodes in the network; in other words, it is the number of arcs of the longest shortest path between a pair of nodes in the network. The smaller the diameter, the easier it is for information to flow through the network.
  • A connected component of a network is a maximally connected subset. The maximum connected component of a network is the connected component with the largest number of nodes in the network. In directed networks, the maximum strongly connected component takes into account the direction of the arc when determining whether two nodes are connected. In contrast, the maximum weakly connected component does not take into account the direction of the arc when determining whether two nodes are connected, but only the existence of an arc between them.
  • The normalized average degree of a node is defined as the ratio of the average degree to the number of nodes in the network. Its value is between 0 and 1. The higher its value, the more important a node is. This measure was introduced by us in this paper to take into account the size of the network when comparing the value of the average degree of nodes in different networks. In fact, the same average degree can have different implications for a very large network and a very small one.

3.4. Definition of Power Users

As mentioned above, our definition of power users is based on the four main centralities considered in SNA. In particular, we define power users as those users whose corresponding nodes simultaneously belong to the top K % of nodes with the highest values of degree, closeness, betweenness, and eigenvector centralities in T . We will refer to these nodes as K-Top-D, K-Top-C, K-Top-B, and K-Top-E nodes. Obviously, K is a parameter whose value should be small and must be experimentally tuned. Note that this definition is very strict; in fact, there is no certainty that a node belonging to one of the four sets defined above also belongs to another set. For example, it is well known that in many network-modeled contexts, nodes with high degree centrality value do not have high closeness centrality value [29], and similar observations could be made for other centralities. Here, we even set the condition that a node must have high values for all the four centralities. Based on the above reasoning, we can expect that (i) nodes with these characteristics (if they exist) will be few and (ii) nodes with these characteristics (if they exist) will be very strong.
Already considering the semantics of the four centrality measures, we can determine some important features of power users:
  • Having a high indegree centrality, they have many users connected to them and are thus recognized as important reference points by other users;
  • Having a high closeness centrality, they are connected to other Threads users by medium-to-short paths, so the information they transmit can reach these users very quickly;
  • Having a high betweenness centrality, they are among the few strategic nodes that can carry information between different Threads subnetworks;
  • Having a high eigenvector centrality, they are connected to several other equally central users in Threads; this allows us to hypothesize the presence of a backbone connecting power users. In the next section, we will see that this hypothesis is actually confirmed.

4. Results

In this section, we present the results of our work. In particular, in Section 4.1 we apply our definition of power users to Threads and verify that power users exist on this platform. In Section 4.2, we identify the characteristics of Threads power users. Finally, in Section 4.3 we propose a discussion aimed at comparing the characteristics of the power users found according to our definition with those of the power users determined considering definitions proposed in the existing literature.

4.1. Detection of Power Users in Threads

In Section 3.1, we illustrated our Threads dataset, while in Section 3.2 we presented our network-based model for representing Threads and introduced the network T (see Equation (1)). Finally, in Section 3.3, we presented several measures that we thought would be useful to consider for the analysis of T . As a first step in our analysis, we calculated the values of these measures in T . The results obtained are shown in Table 1.
Table 1. Some basic properties of the network modeling of our Threads dataset.
From the analysis of this table, we can see that (i) the density and the average clustering coefficient of T are very low; (ii) the network diameter is high, while the average shortest path is rather low; (iii) the network is fully connected, since the size of its maximum connected component is equal to the number of nodes; (iv) the average indegree and the average outdegree are very low; and (v) the indegree assortativity and the outdegree assortativity are essentially null, which means that each node in the network establishes interactions with other nodes, regardless of whether they have an indegree or outdegree similar to its own.
The scenario that emerges from this initial analysis is typical of a new network in which interactions are still limited, users do not know each other well, and tend to interact on the basis of content of interest rather than their indegree or outdegree.
As we have seen in Section 3.2, the basic concept for our power user definition is that of centrality. Therefore, the first step to determine if there are power users in Threads is the investigation of the behavior of centrality measures in T .
We begin our analysis with degree centrality. In Figure 1, we show the distribution of the indegree centrality for T in semi-log scale. We only consider indegree centrality and neglect outdegree centrality, because it is precisely the former that indicates whether a user in T has attracted the interest of other users. From the analysis of this figure, we can see that the distribution of indegree centrality follows a very steep power law, with very few users stimulating a lot of comments from other users (and therefore stimulating a lot of interest with their posts) and many users stimulating few or no comments.
Figure 1. Distribution of indegree centrality values in T (semi-log scale).
Let us now consider closeness centrality. In Figure 2, we show the distribution of the values of this centrality in T in semi-log scale. Note that there is a bell-shaped distribution, which is typical for closeness centrality [29]. Actually, the distribution more closely resembles a superposition of at least two bell-shaped curves with different heights and a “half-bell-shaped” curve. Furthermore, it has long tails on both the left and the right. The figure shows that there are few nodes that have high closeness centrality values and are therefore connected to other nodes by very short paths. Moreover, most nodes have medium or medium-low closeness centrality values and are therefore connected to other nodes by paths that are neither too long nor too short. Finally, few nodes have low closeness centrality values and are therefore connected to other nodes by long paths.
Figure 2. Distribution of closeness centrality values in T (semi-log scale).
Now consider the betweenness centrality, whose distribution in semi-log scale is shown in Figure 3. From the analysis of this figure, we can see that this distribution follows a very steep power law. It tells us that in T , there are many users who are not strategic for connecting different subnetworks, while a small number of users are very strategic for this task.
Figure 3. Distribution of betweenness centrality values in T (semi-log scale).
The last centrality we consider is eigenvector centrality, whose distribution in semi-log scale is shown in Figure 4. From the analysis of this figure, we can see that it follows a very steep power law. This tells us that there are many unimportant nodes in T because they are connected with few incoming arcs to other unimportant nodes. At the same time, there are a few important nodes because they are connected with many incoming arcs to other (very) important nodes.
Figure 4. Distribution of eigenvector centrality values in T (semi-log scale).
Looking at all these distributions together, several considerations emerge. The first is that the distributions of degree, betweenness, and eigenvector centralities are similar, and this is consistent with SNA theory. Conversely, the closeness centrality distribution is considerably different from the other three distributions, and this result is also consistent with SNA theory [29]. The second consideration is that in all types of centralities, we observe the presence of a small number of nodes that have extremely high centrality values. This is not entirely surprising, except that it is also true for closeness centrality, which generally does not show this feature [29]. At this point, the question arises as to whether the nodes with high centrality values are always the same for all centrality measures, or whether they are different. Again, SNA theory tells us that the nodes are generally different in the different forms of centrality [29].
At this point, it is interesting to check if there are any correlations between the different centrality measures. To perform such a check, we thought to rely on Spearman’s correlation coefficient [51] and calculated its value for each pair of centralities mentioned above. Remember that this coefficient can consider values in the real range [ 1 , 1 ] , where −1 indicates a perfect negative correlation, 0 denotes no correlation, and 1 indicates a perfect positive correlation. The results obtained are shown in Figure 5.
Figure 5. Values for the Spearman’s correlation coefficient for the four centrality measures in T —The color red indicates high values; the color gray indicates medium-high values; the color blue indicates low values; the deeper the blue, the lower the value.
From the analysis of this figure, we can see the presence of a weak positive correlation between indegree centrality and betweenness centrality and between indegree centrality and eigenvector centrality. What is surprising, however, is that there is a strong positive correlation between indegree centrality and closeness centrality, whereas SNA theory does not predict it. This reinforces the idea that there may be power users in T .
To test the truth of this hypothesis, we decided to calculate the K-Top-D, K-Top-C, K-Top-B, and K-Top-E nodes in T . For this purpose, we had to determine a value for K. We based our choice on the following considerations: (i) most centrality distributions follow a power law, (ii) we wanted to narrow the focus to the most important nodes for each centrality measure, and (iii) we wanted to avoid missing important nodes, and thus potential power users. Consideration (ii) would lead us to set the threshold at very low values, especially considering that the power law distributions of indegree, betweenness, and eigenvector centralities are very steep. Consideration (iii), on the other hand, would prompt us not to set the threshold at very low values. Setting K to 20 was, in our view, a good tradeoff between these two requirements and was also consistent with Pareto’s law that underlies power law distribution. At this point, we computed the intersection between the different sets of nodes mentioned above. The results are shown in Table 2.
Table 2. Percentage of the nodes belonging to the intersection between the top 20% nodes for each pair of centrality measures.
From the analysis of this table, we can see that the percentage of common nodes is high for some pairs of centrality measures; one of the highest values is obtained for the pair ⟨ 20-Top-D, 20-Top-C ⟩, which, as mentioned above, is generally not the case in SNA. This allows us to hypothesize that there may indeed be power users in our Threads dataset. To confirm this hypothesis, we applied our power user definition and calculated the percentage of nodes that simultaneously belong to 20-Top-D, 20-Top-C, 20-Top-B, and 20-Top-E nodes in T . This percentage is 2.59%, corresponding to 1176 users. These are exactly the power users we were hoping to find.
The discovery of the existence of power users in Threads is a major contribution of our paper to the related literature. In the next section, we will investigate several important properties and peculiarities of these Threads power users.
Simply considering the definition of the four centrality measures, we can infer that Threads power users are very prominent, exceptionally well-connected, strategic, and influential users. In the next section, we investigate further to identify other important features that characterize them.

4.2. Characterization of Threads Power Users

In the previous section, we introduced power users and saw that they have several interesting properties resulting from the fact that they have very high centrality values. In this section, we see that in addition to these “basic” properties, which are very interesting in themselves, there are several other complex properties that characterize Threads power users. Because of these properties, a very small number of users (i.e., power users) are able to exert great influence and control over the whole Threads platform. The characterization of Threads power users is another major contribution of this paper.
In Table 3, we show a comparison of the indegree of all users and power users. This table reveals that the mean indegree of power users is much higher (specifically, 11.96 times higher) than that of all users. This is not surprising given the definition of a power user. What is interesting, however, is that the median indegree of power users is also significantly higher than that of all users. This implies that the overall indegree distribution is shifted upward for power users.
Table 3. Mean and median indegree of all users and power users in Threads.
The next analysis aims to test whether power users form a backbone in Threads, i.e., whether they tend to prefer contacts with each other over contacts with other users. The possible existence of a backbone would be a very significant result, because it would lead us to say that there is a real structured organization among these users that allows them to strongly influence the behavior of the other users, despite being extremely limited in number. To perform this verification, we decided to compute several parameters both in T and in the subnetwork P of T induced by power users (i.e., the subnetwork of T consisting only of the power users and the connections between them). The parameters we measured were number of nodes, number of arcs, density, average clustering coefficient, diameter, average shortest path, average indegree, and normalized average indegree.
In Table 4, we report the parameter values obtained in T and P .
Table 4. Values of some basic parameters in T and P .
From the analysis of this table, we can observe the following:
  • The density in P is much higher than in T (specifically, it is 56.31 times higher). This suggests that power users are much more interconnected than users.
  • The average clustering coefficient in P is much higher than in T (specifically, it is 37.35 times higher). This indicates that power users are much more likely to form closed triads with each other than users are, which is another indicator that power users tend to interact with each other much more than users do.
  • The normalized average indegree in P is much higher than in T (specifically, it is 55.99 times higher). This indicates that the tendency of power users to interact with other power users is much greater than the tendency of users to interact with other users.
  • The average shortest path and diameter in P are slightly smaller than those in T . This indicates that information can flow a little better in P than in T .
All of these results clearly point in the same direction, which is to conclude that there is indeed a backbone among Threads power users.
All previous analyses to characterize power users have taken into account the structure of T and have finally shown that, from a structural point of view, Threads power users are indeed powerful, because they are able to act as information spreaders by strongly influencing the behavior of other Threads users. In our opinion, this result is very important because it shows how a very small fraction of power users (i.e., less than 3% of Threads users) are able to influence the dynamics of the whole network. However, we believe that we can go further in our investigation by looking not only at the structure of Threads, but also at the content of the posts exchanged in it. In particular, by analyzing this content, it is possible to identify communities of Threads users who share the same interests. From this perspective, Threads can be seen as a sort of network of partially overlapping communities, each of which is interested in a particular topic. We want to test whether, in addition to the structural characteristics mentioned above, power users can act as connectors or bridges between different communities. In the affirmative case, the backbone of power users detected above would be a sort of “glue” that holds the different communities of Threads together, preventing them from becoming isolated from each other.
To test whether power users have such a function, it is first necessary to find a way to analyze the content exchanged in Threads. We found the key to doing this by examining the topics associated with posts/comments submitted by users in Threads. In this regard, GPT provided us with a straightforward method to obtain a topic for each post/comment. We used the OpenAI’s GPT-3.5 model (https://www.openai.com, accessed on 15 January 2025); specifically, for each post or comment in the dataset, we used gpt-3.5-turbo to extract the topic that best represented it. We provided the following prompt:
“Extract the main topic of discussion from the text. One word, not too specific, general topic of discussion.”
More details on the API calls can be found in our GitHub repository. By doing this for all posts/comments in our dataset, we identified 531 different topics. In our community-oriented view of Threads, each topic gives rise to a community that includes all users who published at least one post/comment on that topic. As a consequence, in this view, Threads consists of 531 partially overlapping communities.
Figure 6 shows the distribution of posts against topics. In particular, for layout reasons, we show only the 50 topics with the highest number of associated posts. Analyzing this figure, we can see that this distribution follows a power law. In fact, there are two topics, i.e., “Entertainment” and “Politics”, which have a much higher number of associated posts than all the other topics. A third topic that is quite common is “Technology”. Starting with the fourth topic, i.e., “Sports”, we see a slow decrease in the number of posts associated with each topic.
Figure 6. Distribution of posts against topics (50 most frequent topics in T ).
Figure 7 shows the distribution of power users against topics. From the analysis of this figure we can observe that this distribution is much less steep than the previous one. Indeed, there is still a prevalence of the most frequent two topics over all the others, but it is less pronounced than in Figure 6. Similarly to Figure 6, in Figure 7 we observe a slow decrease in the number of power users associated with the topics. Finally, we notice some slight differences in the most frequent topics between Figure 6 and Figure 7. In particular, the main differences regard the topic “Technology”, which is in third position in Figure 6 and in eighth position in Figure 7, and the topic “Education”, which is in twelfth position in Figure 6 and in fifth position in Figure 7.
Figure 7. Distribution of power users against topics (50 most frequent topics in T ). In the two plots, the scale on the y-axis is different because it is related to the topic of the graph with the largest number of nodes.
Figure 8 shows the top 50 topics with the corresponding number of users who published at least one post on that topic. Users are divided into two classes, namely “unique” and “shared”. Given a topic, the class “unique” consists of users present only in that topic, while the class “shared” consists of users present in that topic and at least one other. Figure 9 shows the same information, but only for power users.
Figure 8. Distribution of users against topics and their division into the classes “unique” and “shared” (50 most frequent topics in T ). In the two plots, the scale on the y-axis is different because it is related to the topic of the graph with the largest number of nodes.
Figure 9. Distribution of power users against topics and their division into the classes “unique” and “shared” (50 most frequent topics in T ). In the two plots, the scale on the y-axis is different because it is related to the topic of the graph with the largest number of nodes.
Comparing the two figures, we can deduce some interesting information. First, the order of the topics is slightly different; for example, the topic “Technology” is ranked third in Figure 8 and eighth in Figure 9, while the topic “Education” is ranked eleventh in Figure 8 and fifth in Figure 9. However, the most interesting thing we notice is the difference in the proportion of users (Figure 8) and power users (Figure 9) belonging to the two classes. In fact, for a given topic, the fraction of power users belonging to the class “shared” is generally larger than the corresponding fraction of users. This is a strong indicator of the possible validity of our hypothesis that power users can indeed act as “bridges” (and their backbone as “glue”) to hold the different Threads communities together.
To confirm this hypothesis, we conducted an additional experimental analysis:
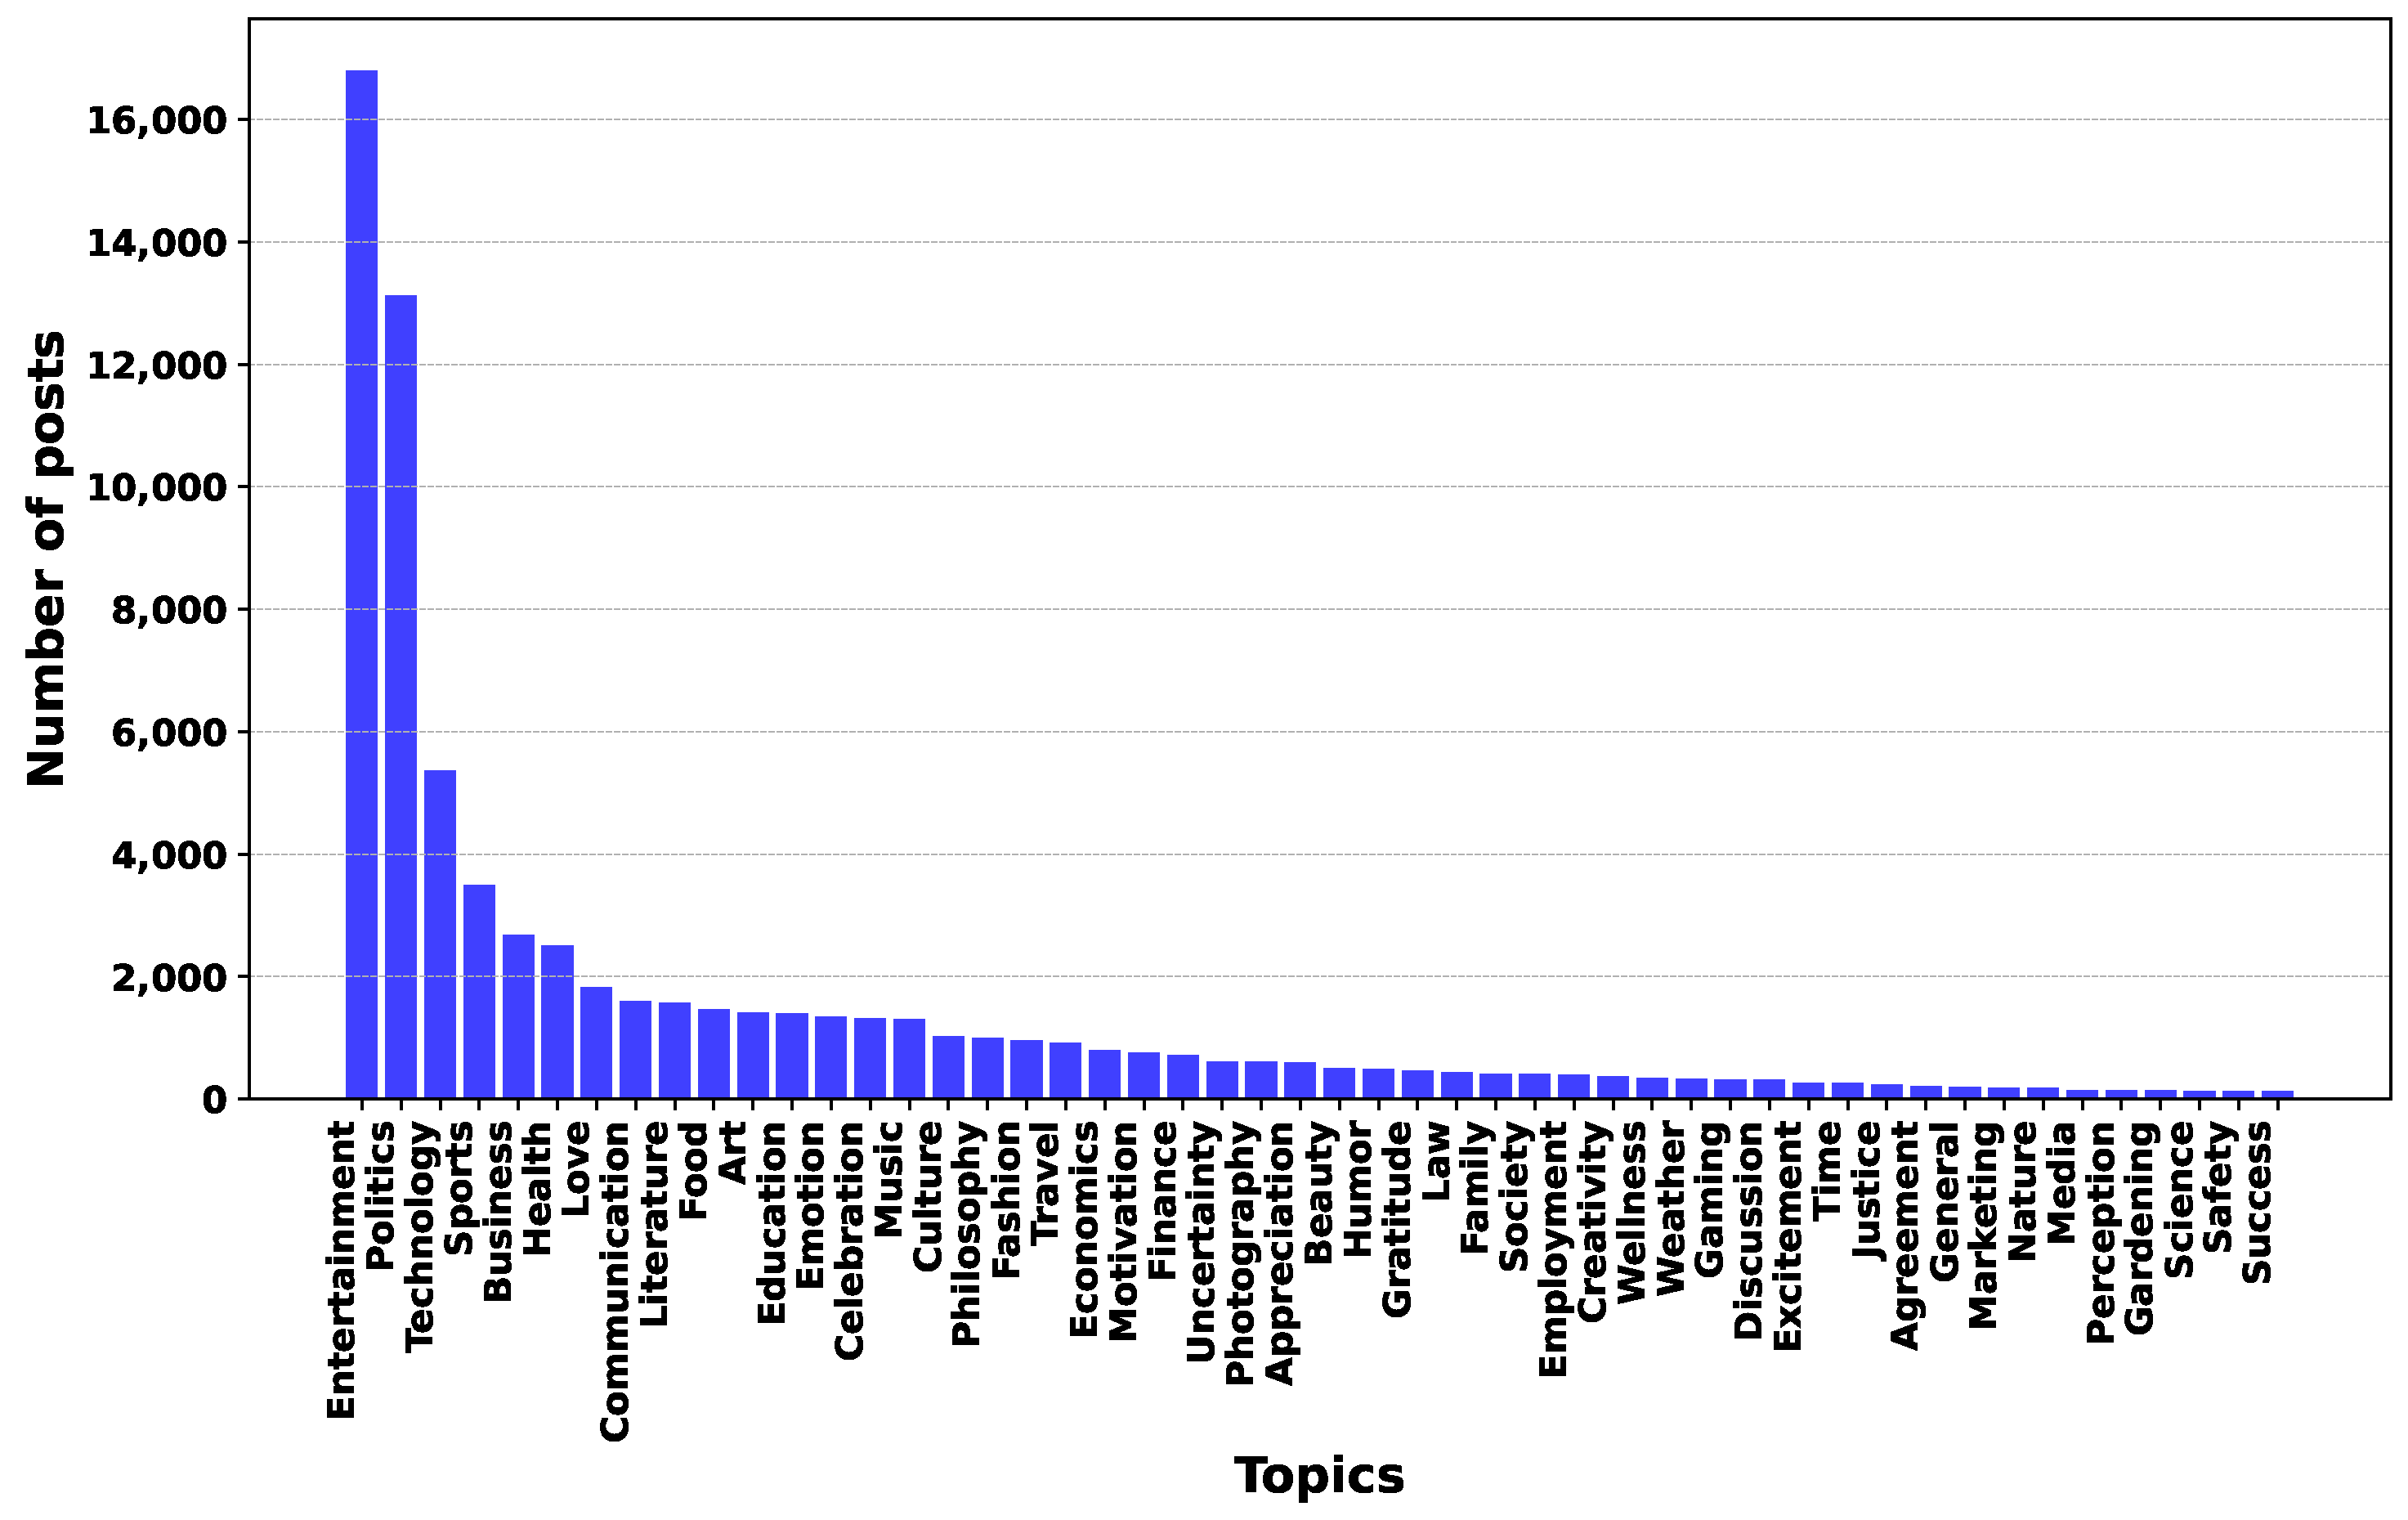
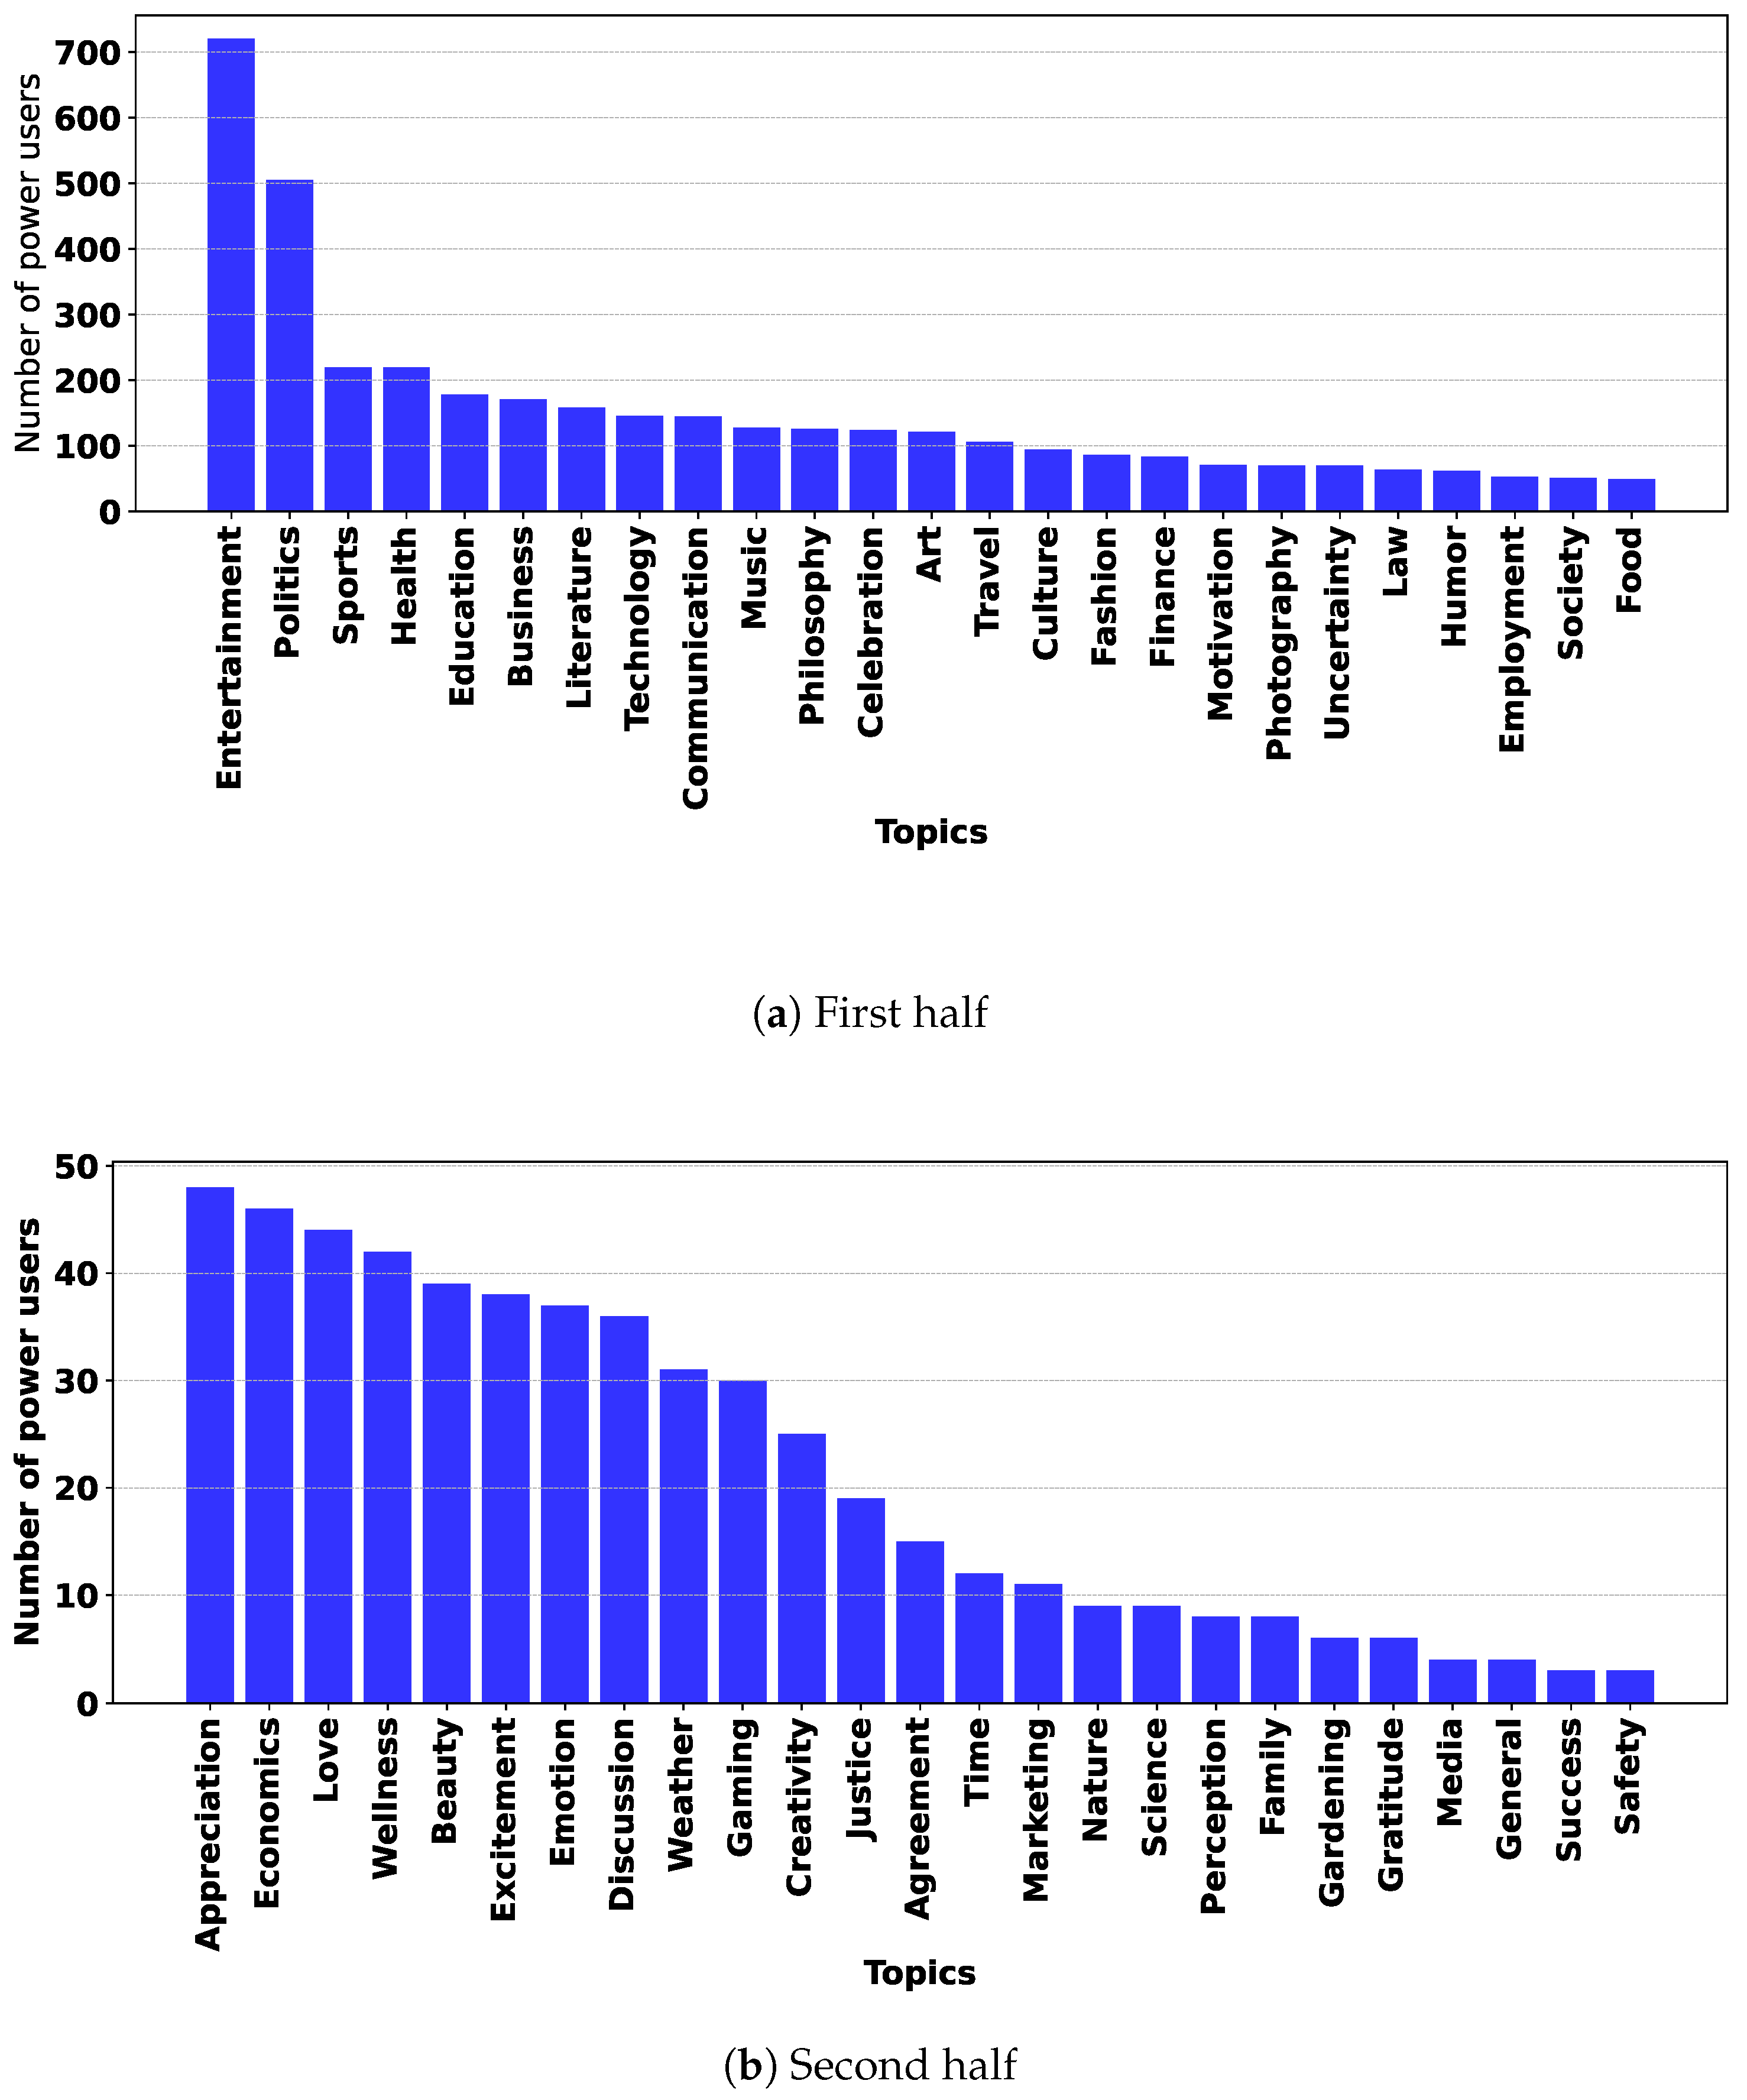
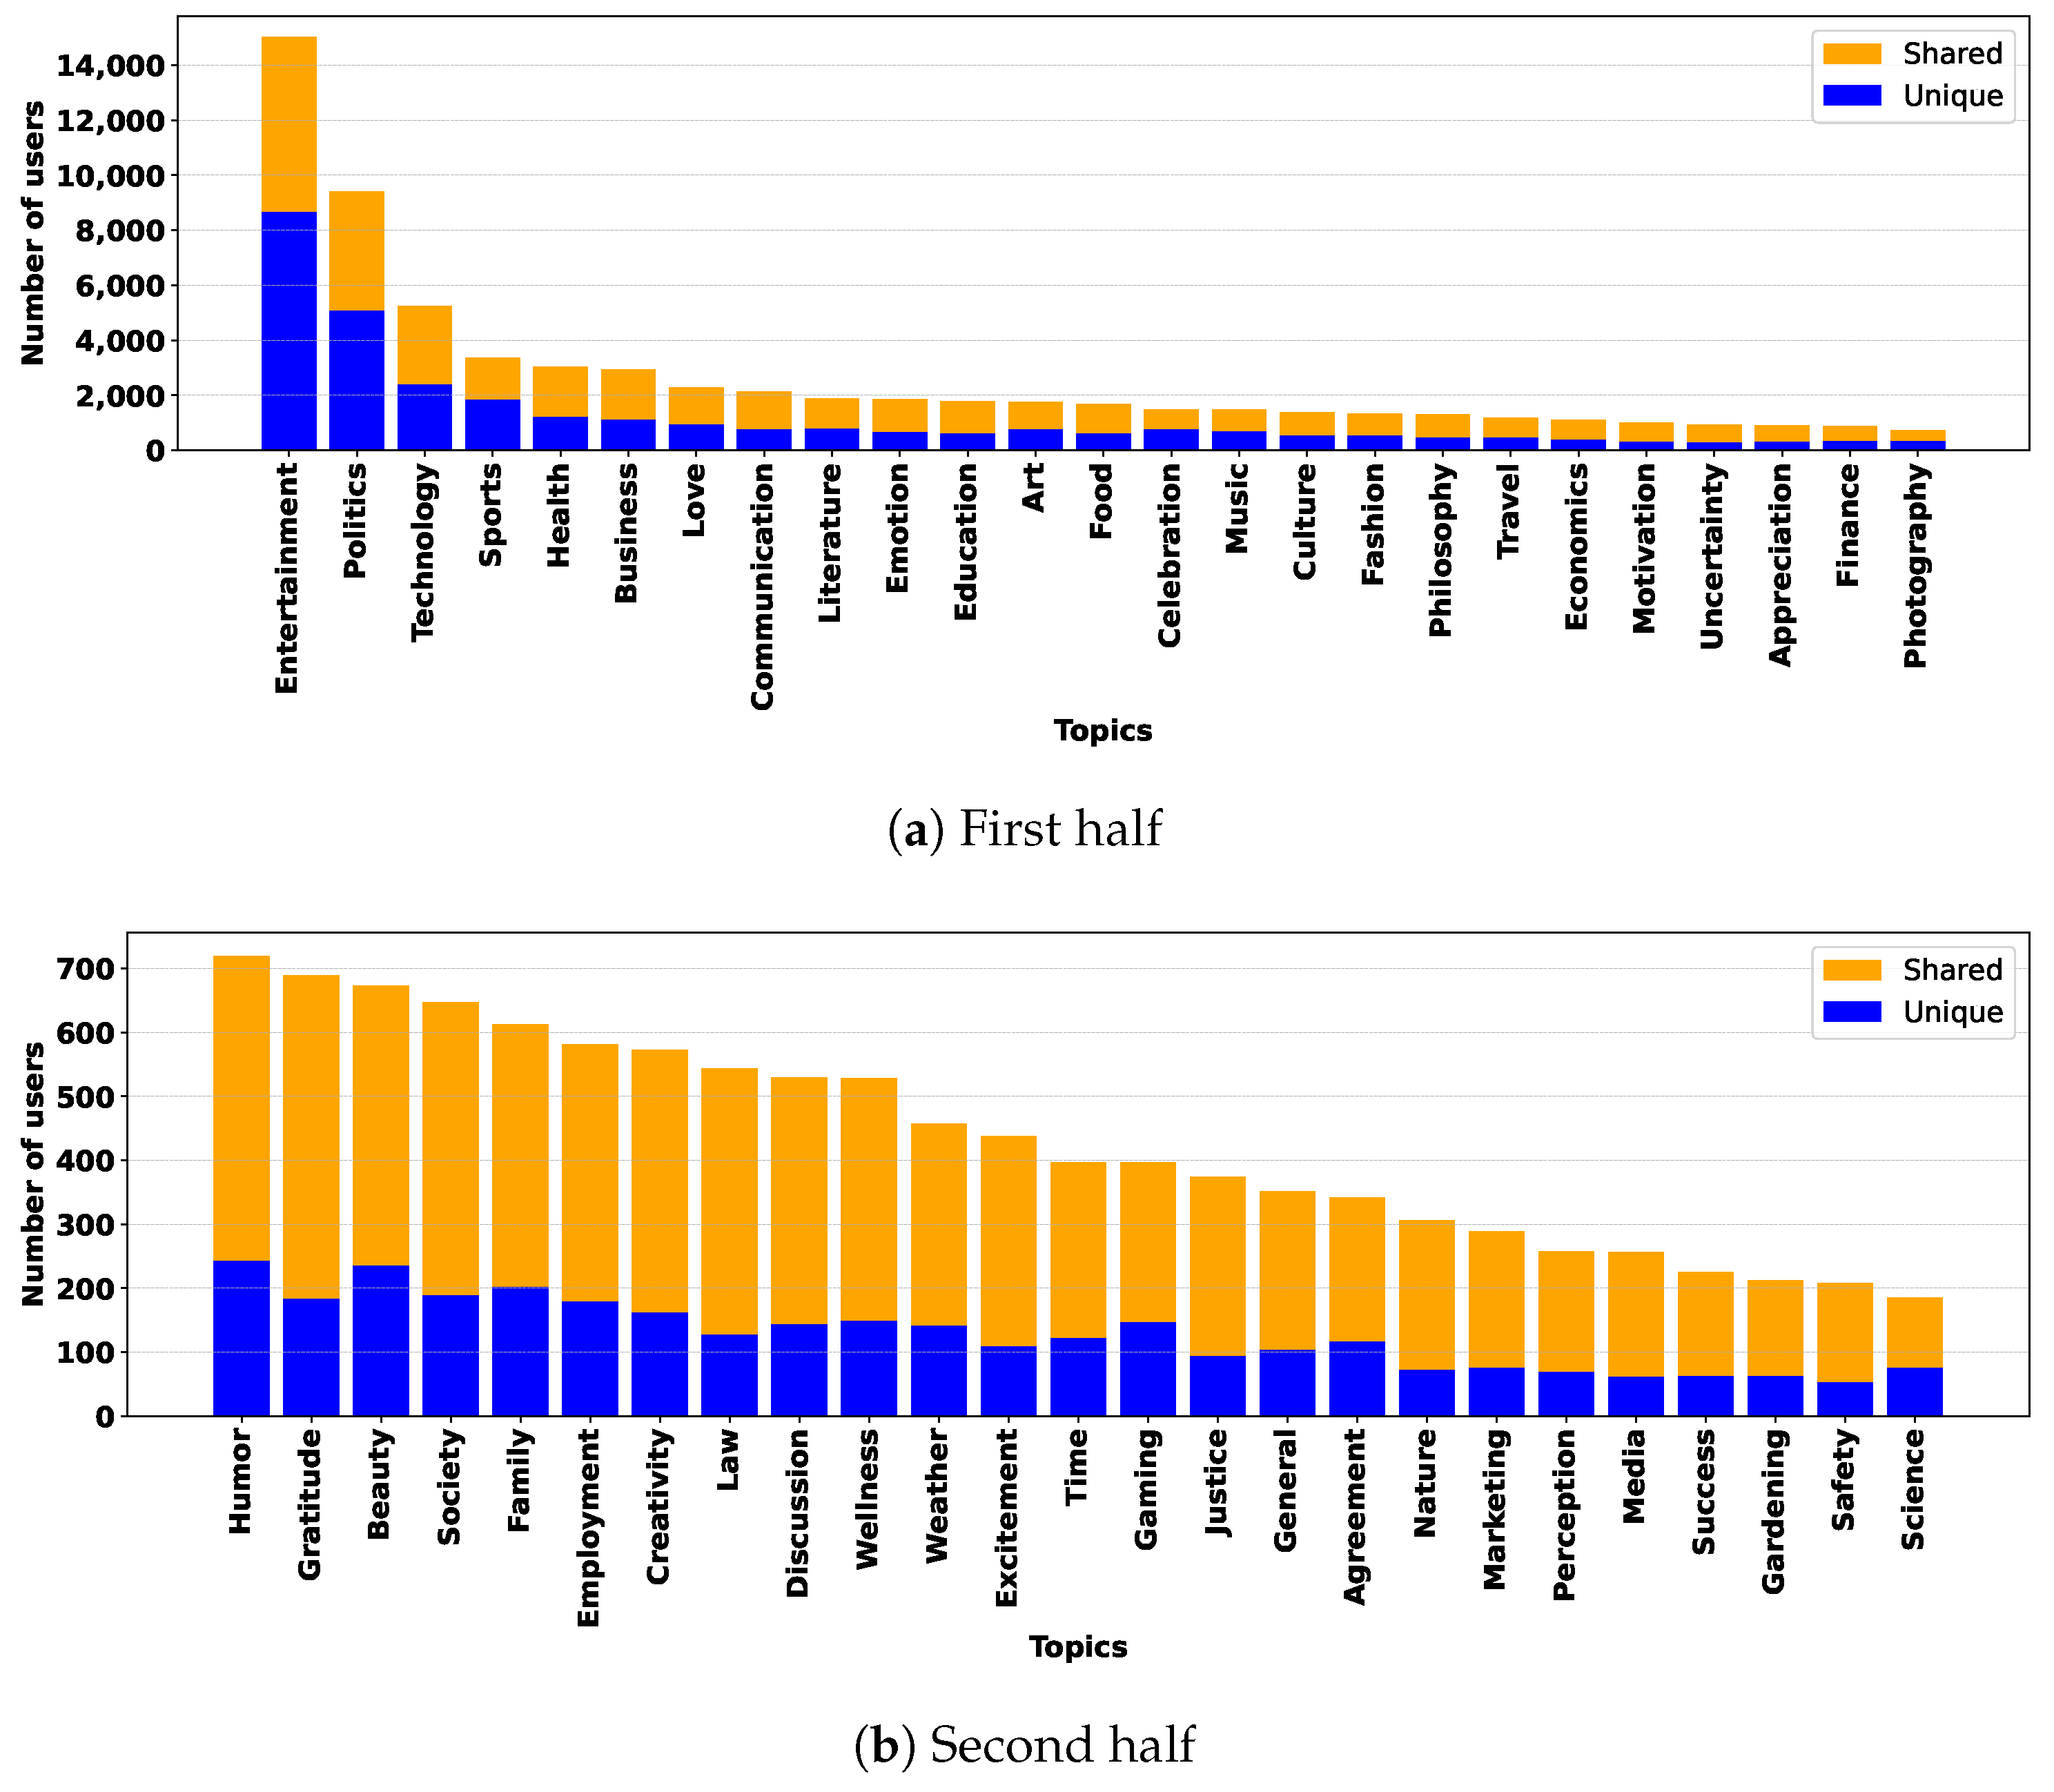
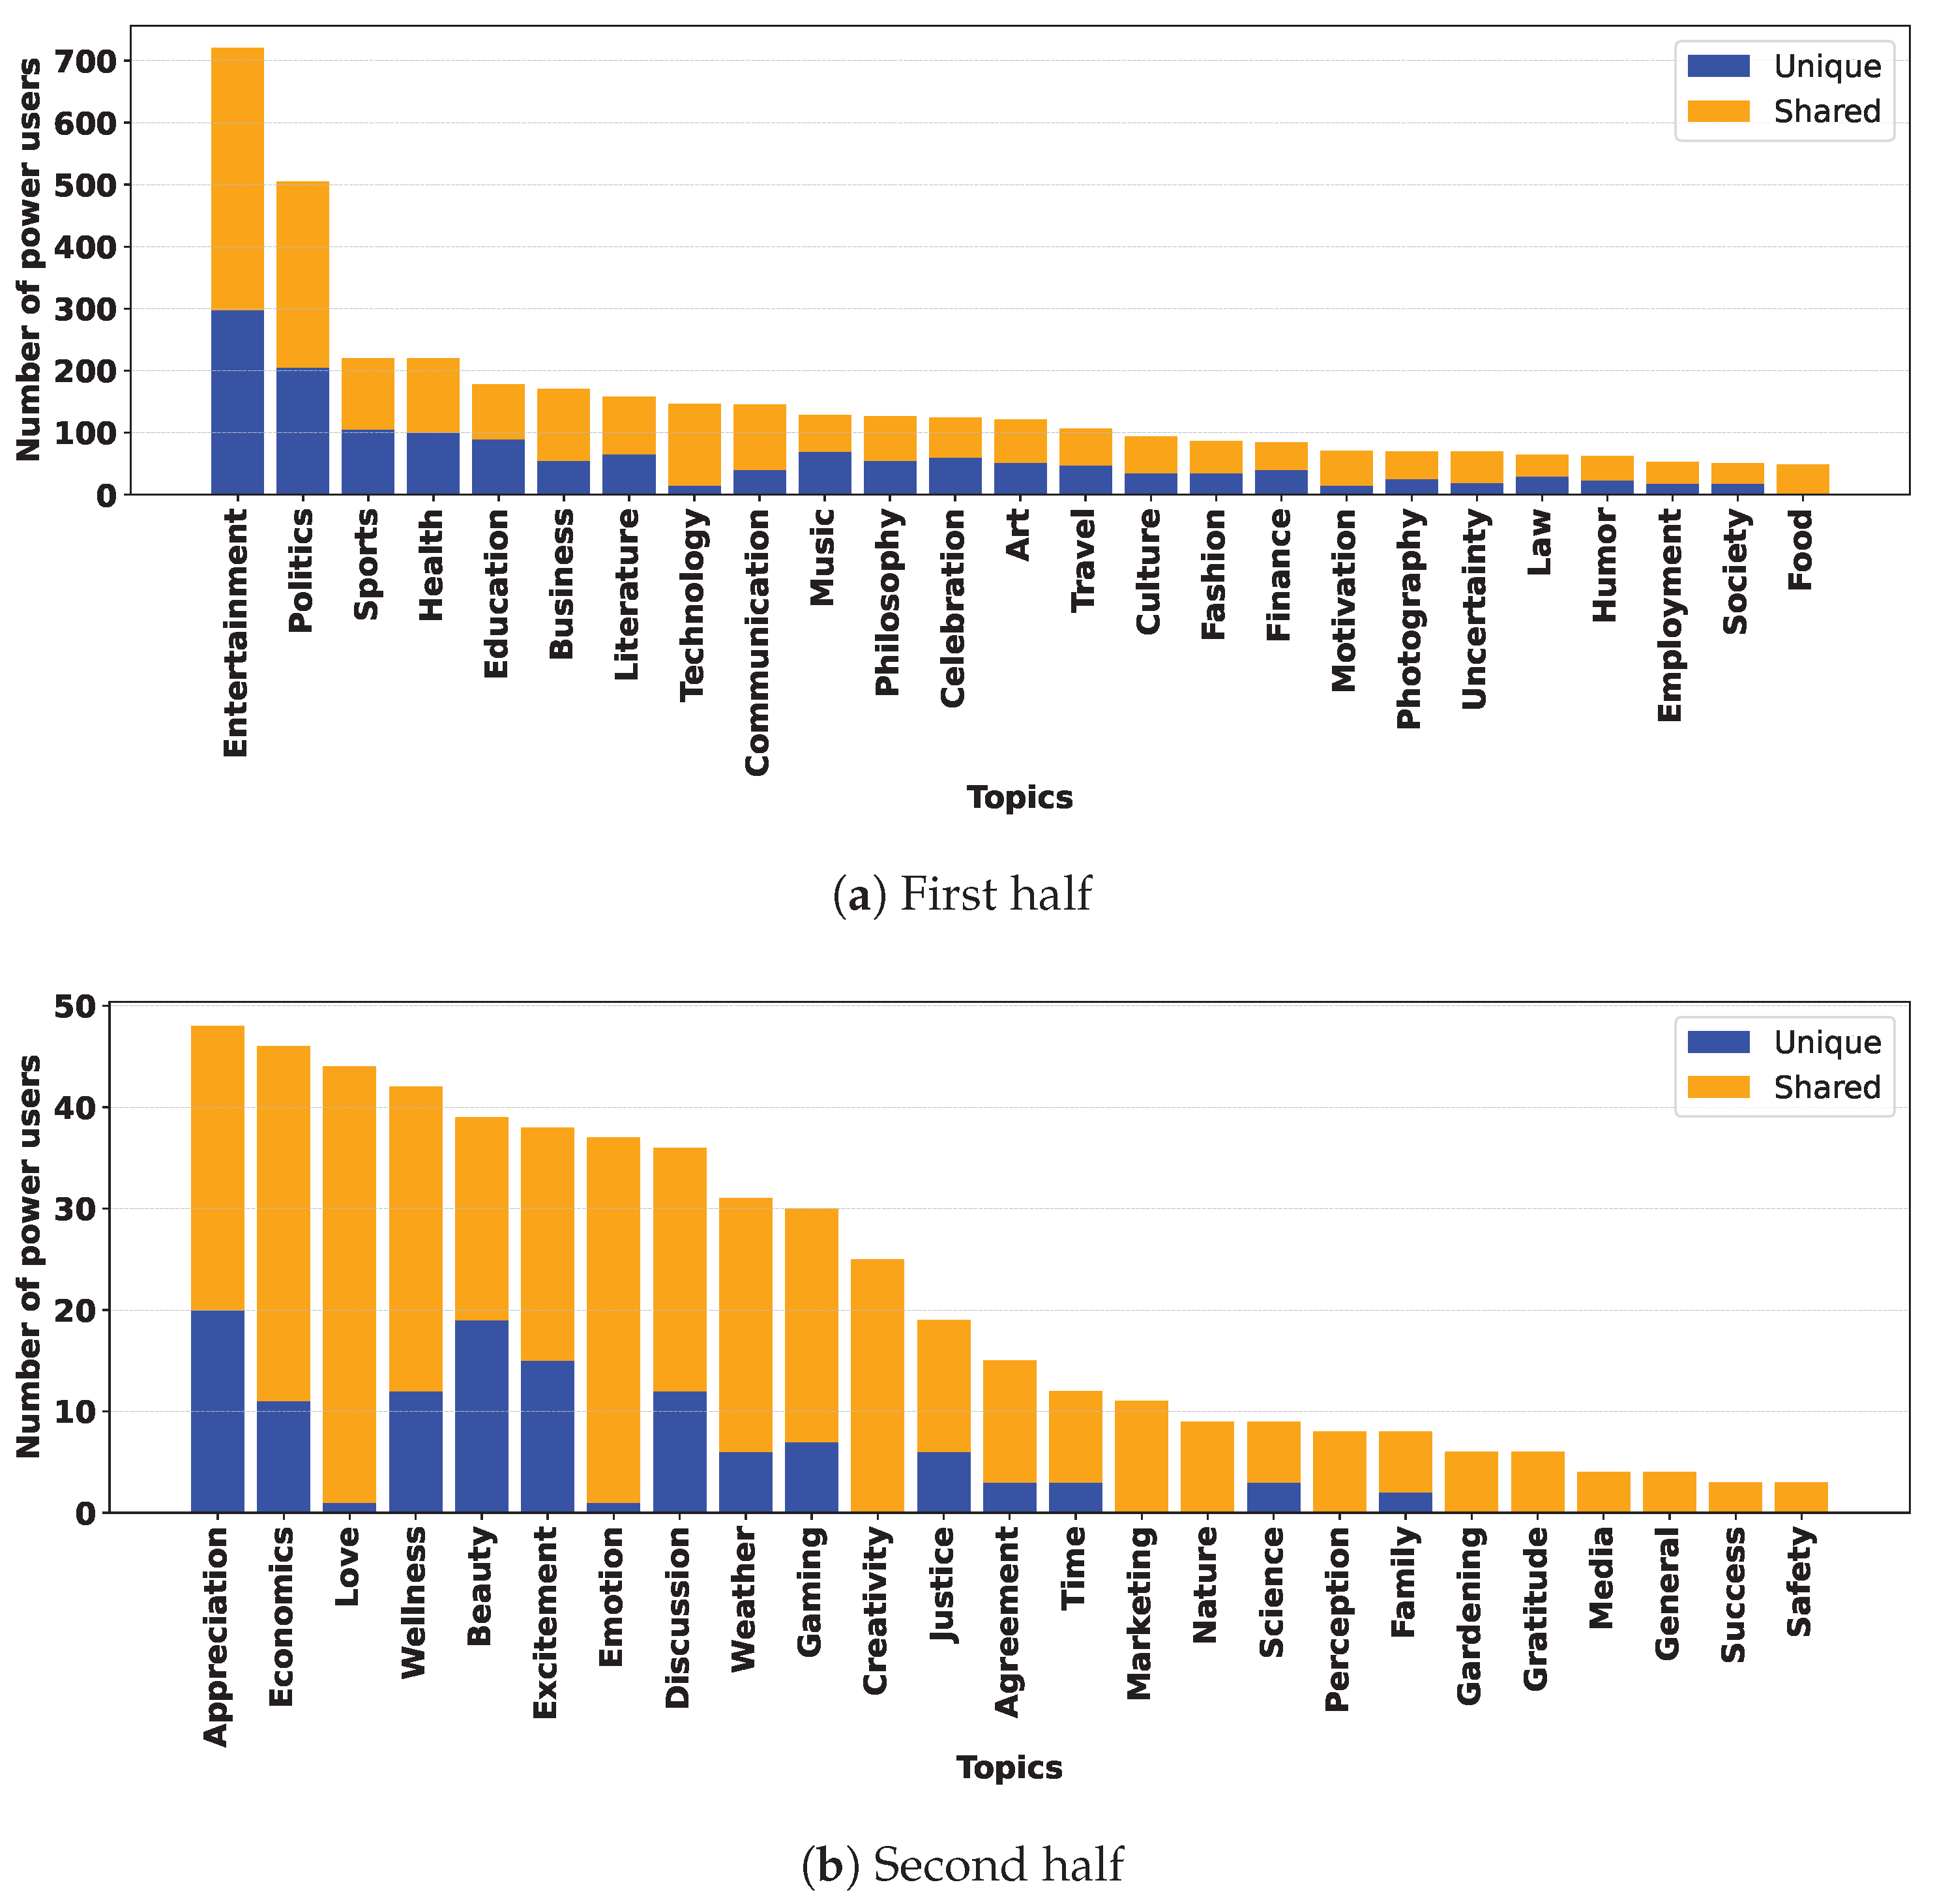
  • We took the 50 most frequent topics; the frequency of a topic is measured in terms of the number of users who published at least one post on it. These are the topics reported in Figure 8. We limited ourselves to this number of topics for computational reasons, and because the other topics had negligible numbers of associated users compared to them.
  • We considered all 2450 topic pairs that could be obtained from them.
  • For each pair, we determined the number of users that the two topics had in common.
  • For all pairs with a number of users in common greater than 0, we computed the ratio of common power users to all common users (including power users).
  • We averaged the values obtained in this way.
The value of this average is 46.37%. Now, this value is much higher (specifically, 17.90 times higher) than the percentage of power users in the network, which, let us remember, is 2.59%. This result confirms the validity of our hypothesis that power users act as “bridges” (and the backbone of power users acts as “glue”) between the different user communities in Threads.
This analysis concludes our characterization of Threads power users. Thanks to this, we have seen that they are instrumental in disseminating information, influencing user behaviors, holding the various communities together, and, ultimately, strongly conditioning the life and evolution of this social network.

4.3. Discussion

In this section, we discuss further implications of the results obtained above. In particular, in Section 4.3.1 we compare the properties characterizing the power users obtained from our definition with those characterizing the power users defined in the previous approaches in the literature. In Section 4.3.2, we evaluate a second hypothesis that could explain our results on the backbone of power users in Threads in light of the Instagram-based growth model that characterizes this network.

4.3.1. Comparing Our Power Users with Those of the Other Approaches

In this section, we want to compare the characteristics of the power users obtained through our definition with those of the power users defined differently in the past literature. First, our definition of power users takes into account the structure of the network because it employs the four main centralities of SNA. This means that our power users are very prominent, exceptionally well-connected, strategic, and influential users. We have also seen through our experiments that they hold together communities in Threads with different interests, so that the backbone of power users represents the “glue” that holds together the different communities in Threads.
In the previous literature, there are many definitions of power users that are very different from each other and from ours. For example, the definition of power users in Opsahl [18] results in having power users with high degree centrality and who are very active on X, especially in terms of mention and reply activities. The definition of power users in [5] follows the same lines as the one in [18], in that also in this case the obtained power users have a high degree centrality and are very active on X. In addition, they tend to connect with each other, similar to the power users defined by us. The power users in [19] consider both the structure of the network and user behavior. In fact, they have a high value of Personalized PageRank (and remember that PageRank is a special case of eigenvector centrality) as well as high values for focus rate, activity, authenticity, and speed of reaction. The power users of [17] are characterized by a high betweenness centrality, thus acting as bridges between different communities, and by a rather high degree centrality. As mentioned in Section 2, in addition to high values of degree and betweenness centralities, our power users also have high values of closeness and eigenvector centralities. The power users of [46] do not take centrality into account, but rather the historical behavior of users, and are also chosen to maximize indirect influence.
The definition of power users in [45] does not consider global measures in the network, but approximates them by aggregating local measures. The authors use local structural information as an approximation of the corresponding global one and compute power users by aggregating local structural information. The main goal of the approach of [45] is to obtain power users while minimizing the amount of resources required. The power users defined in [43,49] do not consider centralities but some behavioral characteristics such as engagement and activeness. In [50], power users are characterized by a combination of structural properties (such as high degree centrality, betweenness centrality, eigenvector centrality, and PageRank) and semantic features. In contrast to our approach, the one in [50] does not consider closeness centrality. The power users identified in [44] are characterized by structural embeddings obtained by means of struct2vec. They are characterized by a strong strategic position in the network and high diffusion potential. Therefore, they consider structural information, like our power users, but the information taken into account by them and their way of proceeding are completely different from our approach.

4.3.2. Two Different Hypotheses About the Backbone of Power Users

In Section 4.2, we showed that there is a backbone of power users in Threads, which allows a very small fraction of users (2.59% in the case of our dataset) to quickly spread information throughout Threads and ultimately strongly influence the topics covered in this social network and the behavior of the corresponding users.
We also mentioned that Threads is a content-based social network that is different from any other in that its growth is based on Instagram. This means that Instagram users are strongly encouraged to join Threads because it is very difficult not to. This growth model makes Threads different from all the other content-based social networks, where users decide to join spontaneously and not because they are strongly conditioned by another social network with completely different goals and characteristics to which they are already subscribed. This means that the interpretation of the backbone of power users in Threads must also take this fact into account. In fact, if we were considering any other content-based social network, the only possible interpretation would be that the backbone of power users is able to actively and strongly condition other users who are nevertheless actively participating in the life of the social network. This is the hypothesis we have favored so far in this paper.
However, the very fact that we have an Instagram-based growth model makes another hypothesis about the backbone of users in Threads possible. According to this second hypothesis, the power users in Threads are those users who are really interested in exchanging messages on this social network. Most of the other users would find themselves subscribed to this social platform because they are “forced” by Instagram, but would not actively participate in the life of this social medium. According to this hypothesis, the backbone of power users would determine the content exchanged in Threads and the life of this social platform not because power users are able to influence other users, but because the other users would not be interested in actively participating in the discussion on this platform.
In the paper, we lean more towards the first hypothesis, also because not all Threads users come from Instagram. However, we cannot rule out the second hypothesis at the moment. As one of the possible future developments of this research, we want to carry out further analyses on Threads to better understand which of the two hypotheses is the one that best fits the reality of Threads.

5. Conclusions

In this paper, we have proposed an approach to define, detect, and characterize power users in Threads. First, we have presented a new definition of power users based on the classical centrality measures of Social Network Analysis, so that we can take advantage of all the knowledge about these measures that has been accumulated over the years. Our definition of power users can be applied not only to Threads, but also to any content-based social network. Next, we have used our definition to see if power users exist in Threads, and we have seen that they indeed exist in this social platform. Finally, we have presented an analysis campaign to characterize Threads power users. In particular, we first focused on the structural viewpoint and showed that power users are able to influence the information spread and the behavior of other users. Next, we have looked at the content, and thus the topic exchanged through posts, which lead to the formation of user communities in Threads based on common interests. As for the content viewpoint, we have shown that power users act as bridges for these communities, and that the backbone of power users acts as “glue” for Threads communities that would otherwise risk being isolated. In order to perform all of these analyses, we had to build a Threads dataset, which we have decided to make open so that it can be used in the future by all researchers who want to perform analyses on Threads.
In the future, we plan to continue our efforts to learn more about Threads. In particular, there are several typical issues of content-based networks that have been investigated and addressed in the older social networks and that still need to be studied in Threads. For example, we would like to identify mechanisms that allow us to determine the trust, reputation, and reliability of users in Threads based on the posts they make, the comments they receive, and, more generally, their behavior within this network. Furthermore, we would like to study the possible existence of forms of status or value homophily in Threads, in order to understand whether there are dynamics leading users or user groups to interact more with other users who share the same status and/or values. To do this, it will be extremely important to define the concepts of user status and user values in Threads. Finally, a third challenging issue that we would like to address in the future concerns the possibility of studying the dynamics by which user communities within Threads start, evolve, and die. In particular, we would like to understand what favors the birth of new communities, how they attract new users, the reasons causing users to leave them, what the premonitory signs are that this is about to happen, and the reasons that lead to the end of a community.

Author Contributions

Conceptualization, D.U. and E.C.; methodology, M.M. and L.V.; software, M.M. and E.C.; validation, C.B., F.P. and D.U.; formal analysis, L.V.; investigation, F.P. and M.M.; resources, E.C.; data curation, L.V. and C.B.; writing—original draft preparation, D.U.; writing—review and editing, C.B. and G.B.; visualization, F.P. and L.V.; supervision, D.U. and G.B.; project administration, D.U. and E.C. All authors have read and agreed to the published version of the manuscript.

Funding

This research was supported by the PNRR project FAIR—Future AI Research (PE00000013), Spoke 9—AI, under the NRRP MUR program funded by the NextGenerationEU.

Institutional Review Board Statement

Not applicable.

Data Availability Statement

The dataset used in this work is available at the following link: https://github.com/ecorradini/Threads_Dataset, accessed on 15 January 2025.

Conflicts of Interest

The authors declare no conflicts of interest.

References

  1. Mislove, A.; Marcon, M.; Gummadi, K.; Druschel, P.; Bhattacharjee, B. Measurement and analysis of online social networks. In Proceedings of the ACM SIGCOMM International Conference on Internet Measurement (IMC’07), San Diego, CA, USA, 24–26 October 2007; ACM: New York, NY, USA, 2007; pp. 29–42. [Google Scholar]
  2. Buntain, C.; Golbeck, J. Identifying Social Roles in Reddit Using Network Structure. In Proceedings of the International Conference on World Wide Web (WWW’14), Seoul, Republic of Korea, 7–11 April 2014; ACM: New York, NY, USA, 2014; pp. 615–620. [Google Scholar]
  3. Yadav, A.; Johari, R.; Dahiya, R. Identification of centrality measures in social network using network science. In Proceedings of the International Conference on Computing, Communication, and Intelligent Systems (ICCCIS’19), Greater Noida, India, 18–19 October 2019; IEEE: Piscataway, NJ, USA, 2019; pp. 229–234. [Google Scholar]
  4. Bonifazi, G.; Cauteruccio, F.; Corradini, E.; Marchetti, M.; Terracina, G.; Ursino, D.; Virgili, L. A framework for investigating the dynamics of user and community sentiments in a social platform. Data Knowl. Eng. 2023, 146, 102183. [Google Scholar] [CrossRef]
  5. Howlader, P.; Sudeep, K. Degree centrality, eigenvector centrality and the relation between them in Twitter. In Proceedings of the International Conference on Recent Trends in Electronics, Information & Communication Technology (RTEICT’16), Bangalore, India, 20–21 May 2016; IEEE: Piscataway, NJ, USA, 2016; pp. 678–682. [Google Scholar]
  6. Bonifazi, G.; Corradini, E.; Marchetti, M.; Sciarretta, L.; Ursino, D.; Virgili, L. A Space-Time Framework for Sentiment Scope Analysis in Social Media. Big Data Cogn. Comput. 2022, 6, 130. [Google Scholar] [CrossRef]
  7. Bonifazi, G.; Cauteruccio, F.; Corradini, E.; Marchetti, M.; Pierini, A.; Terracina, G.; Ursino, D.; Virgili, L. An approach to detect backbones of information diffusers among different communities of a social platform. Data Knowl. Eng. 2022, 140, 102048. [Google Scholar] [CrossRef]
  8. Bonifazi, G.; Breve, B.; Cirillo, S.; Corradini, E.; Virgili, L. Investigating the COVID-19 vaccine discussions on Twitter through a multilayer network-based approach. Inf. Process. Manag. 2022, 59, 103095. [Google Scholar] [CrossRef] [PubMed]
  9. Pierri, F.; Piccardi, C.; Ceri, S. A multi-layer approach to disinformation detection in US and Italian news spreading on Twitter. EPJ Data Sci. 2020, 9, 35. [Google Scholar] [CrossRef]
  10. Jeong, U.; Jiang, B.; Tan, Z.; Bernard, R.; Liu, H. BlueTempNet: A Temporal Multi-network Dataset of Social Interactions in Bluesky Social. IEEE Data Descr. 2024, 1, 71–79. [Google Scholar] [CrossRef]
  11. La Cava, L.; Mandaglio, D.; Tagarelli, A. Polarization in Decentralized Online Social Networks. In Proceedings of the International ACM Web Science Conference (WEBSCI’24), Stuttgart, Germany, 21–24 May 2024; ACM: New York, NY, USA, 2024; pp. 48–52. [Google Scholar]
  12. Bono, C.; Cava, L.L.; Luceri, L.; Pierri, F. An Exploration of Decentralized Moderation on Mastodon. In Proceedings of the International ACM Web Science Conference (WEBSCI’24), Stuttgart, Germany, 21–24 May 2024; ACM: New York, NY, USA, 2024; pp. 53–58. [Google Scholar]
  13. Bin Zia, H.; He, J.; Castro, I.; Tyson, G. Fediverse Migrations: A Study of User Account Portability on the Mastodon Social Network. In Proceedings of the International ACM Web Science Conference (WEBSCI’24), Stuttgart, Germany, 21–24 May 2024; ACM: New York, NY, USA, 2024; pp. 68–75. [Google Scholar]
  14. Wilson, C.; Boe, B.; Sala, A.; Puttaswamy, K.; Zhao, B. User interactions in social networks and their implications. In Proceedings of the ACM European Conference on Computer systems (EuroSys’09), Nuremberg, Germany, 1–3 April 2009; ACM: New York, NY, USA, 2009; pp. 205–218. [Google Scholar]
  15. Buccafurri, F.; Foti, V.; Lax, G.; Nocera, A.; Ursino, D. Bridge Analysis in a Social Internetworking Scenario. Inf. Sci. 2013, 224, 1–18. [Google Scholar] [CrossRef]
  16. Buccafurri, F.; Lax, G.; Nicolazzo, S.; Nocera, A. Comparing Twitter and Facebook user behavior: Privacy and other aspects. Comput. Hum. Behav. 2015, 52, 87–95. [Google Scholar] [CrossRef]
  17. Kratzer, J.; Lettl, C.; Franke, N.; Gloor, P. The social network position of lead users. J. Prod. Innov. Manag. 2016, 33, 201–216. [Google Scholar] [CrossRef]
  18. Yustiawan, Y.; Maharani, W.; Gozali, A. Degree centrality for social network with Opsahl method. Procedia Comput. Sci. 2015, 59, 419–426. [Google Scholar] [CrossRef]
  19. Alp, Z.; Öğüdücü, S. Identifying topical influencers on Twitter based on user behavior and network topology. Knowl.-Based Syst. 2018, 141, 211–221. [Google Scholar]
  20. Zareie, A.; Sheikhahmadi, A.; Jalili, M. Influential node ranking in social networks based on neighborhood diversity. Future Gener. Comput. Syst. 2019, 94, 120–129. [Google Scholar] [CrossRef]
  21. Huang, X.; Chen, D.; Wang, D.; Ren, T. Identifying influencers in social networks. Entropy 2020, 22, 450. [Google Scholar] [CrossRef] [PubMed]
  22. Subramani, N.; Easwaramoorthy, S.V.; Mohan, P.; Subramanian, M.; Sambath, V. A gradient boosted decision tree-based influencer prediction in social network analysis. Big Data Cogn. Comput. 2023, 7, 6. [Google Scholar] [CrossRef]
  23. Anastasiei, B.; Dospinescu, N.; Dospinescu, O. Word-of-mouth engagement in online social networks: Influence of network centrality and density. Electronics 2023, 12, 2857. [Google Scholar] [CrossRef]
  24. Bertoni, V.; Saurin, T.; Fogliatto, F. How to identify key players that contribute to resilient performance: A social network analysis perspective. Saf. Sci. 2022, 148, 105648. [Google Scholar] [CrossRef]
  25. Eskandanian, F.; Sonboli, N.; Mobasher, B. Power of the Few: Analyzing the Impact of Influential Users in Collaborative Recommender Systems. In Proceedings of the International ACM Conference on User Modeling, Adaptation and Personalization (UMAP ’19), Larnaca, Cyprus, 9–12 June 2019; ACM: New York, NY, USA, 2019; pp. 225–233. [Google Scholar]
  26. Wang, N.; Xie, W.; Tiberius, V.; Qiu, Y. Accelerating new product diffusion: How lead users serve as opinion leaders in social networks. J. Retail. Consum. Serv. 2023, 72, 103297. [Google Scholar] [CrossRef]
  27. Rehman, A.; Jiang, A.; Rehman, A.; Paul, A.; Din, S.; Sadiq, M. Identification and role of opinion leaders in information diffusion for online discussion network. J. Ambient. Intell. Humaniz. Comput. 2023, 14, 15301–15313. [Google Scholar] [CrossRef]
  28. Tsugawa, S.; Watabe, K. Identifying influential brokers on social media from social network structure. In Proceedings of the International AAAI Conference on Web and Social Media (ICWSM’23), Lymassol, Cyprus, 5–8 June 2023; Volume 17, pp. 842–853. [Google Scholar]
  29. Tsvetovat, M.; Kouznetsov, A. Social Network Analysis for Startups: Finding Connections on the Social Web; O’Reilly Media, Inc.: Sebastopol, CA, USA, 2011. [Google Scholar]
  30. Zhang, P.; He, Y.; Haq, E.; He, J.; Tyson, G. The Emergence of Threads: The Birth of a New Social Network. arXiv 2024, arXiv:2406.19277. [Google Scholar]
  31. Bonifazi, G.; Corradini, E.; Ursino, D. Definition of status and value assortativity in complex networks and their evaluation in Threads. Soc. Netw. Anal. Min. 2024, 14, 212. [Google Scholar] [CrossRef]
  32. Trifiro, B.; Clarke, M.; Huang, S.; Mills, B.; Ye, Y.; Zhang, S.; Zhou, M.; Su, C. Media moments: How media events and business incentives drive twitter engagement within the small business community. Soc. Netw. Anal. Min. 2022, 12, 174. [Google Scholar] [CrossRef] [PubMed]
  33. Borah, A.; Singh, S. Investigating political polarization in India through the lens of Twitter. Soc. Netw. Anal. Min. 2022, 12, 97. [Google Scholar] [CrossRef]
  34. Poulopoulos, V.; Wallace, M. Social Media Analytics as a Tool for Cultural Spaces—The Case of Twitter Trending Topics. Big Data Cogn. Comput. 2022, 6, 63. [Google Scholar] [CrossRef]
  35. Sahneh, E.; Nogara, G.; DeVerna, M.; Liu, N.; Luceri, L.; Menczer, F.; Pierri, F.; Giordano, S. The Dawn of Decentralized Social Media: An Exploration of the Bluesky Social Ecosystem. arXiv 2024, arXiv:2408.03146. [Google Scholar]
  36. Quelle, D.; Bovet, A. Bluesky: Network Topology, Polarisation, and Algorithmic Curation. arXiv 2024, arXiv:2405.17571. [Google Scholar] [CrossRef]
  37. Naseem, U.; Razzak, I.; Khushi, M.; Eklund, P.; Kim, J. Covidsenti: A large-scale benchmark Twitter data set for COVID-19 sentiment analysis. IEEE Trans. Comput. Soc. Syst. 2021, 8, 1003–1015. [Google Scholar] [CrossRef]
  38. Hamraoui, I.; Boubaker, A. Impact of Twitter sentiment on stock price returns. Soc. Netw. Anal. Min. 2022, 12, 28. [Google Scholar] [CrossRef]
  39. Alieva, I.; Ng, L.; Carley, K. Investigating the spread of Russian disinformation about biolabs in Ukraine on Twitter using social network analysis. In Proceedings of the IEEE International Conference on Big Data (BigData’22), Osaka, Japan, 17–20 December 2022; IEEE: Piscataway, NJ, USA, 2022; pp. 1770–1775. [Google Scholar]
  40. Ferreira, C.; Murai, F.; Silva, A.; Almeida, J.; Trevisan, M.; Vassio, L.; Mellia, M.; Drago, I. On the dynamics of political discussions on instagram: A network perspective. Online Soc. Netw. Media 2021, 25, 100155. [Google Scholar] [CrossRef]
  41. Stoddart, M.; Koop-Monteiro, Y.; Tindall, D. Instagram as an Arena of Climate Change Communication and Mobilization: A Discourse Network Analysis of COP26. Environ. Commun. 2025, 19, 218–237. [Google Scholar] [CrossRef]
  42. Chang, M.; Yi, T.; Hong, S.; Lai, P.Y.; Jun, J.; Lee, J. Identifying museum visitors via social network analysis of Instagram. J. Comput. Cult. Herit. 2022, 15, 1–19. [Google Scholar] [CrossRef]
  43. Purba, K.; Asirvatham, D.; Murugesan, R. Influence maximization diffusion models based on engagement and activeness on instagram. J. King Saud-Univ.-Comput. Inf. Sci. 2022, 34, 2831–2839. [Google Scholar] [CrossRef]
  44. Kumar, S.; Mallik, A.; Khetarpal, A.; Panda, B. Influence maximization in social networks using graph embedding and graph neural network. Inf. Sci. 2022, 607, 1617–1636. [Google Scholar] [CrossRef]
  45. Bartolucci, S.; Caccioli, F.; Caravelli, F.; Vivo, P. Ranking influential nodes in networks from aggregate local information. Phys. Rev. Res. 2023, 5, 033123. [Google Scholar] [CrossRef]
  46. Wu, S.; Li, W.; Shen, H.; Bai, Q. Identifying influential users in unknown social networks for adaptive incentive allocation under budget restriction. Inf. Sci. 2023, 624, 128–146. [Google Scholar] [CrossRef]
  47. Bhadra, J.; Khanna, A.; Beuno, A. A Graph Neural Network Approach for Identification of Influencers and Micro-Influencers in a Social Network: Classifying influencers from non-influencers using GNN and GCN. In Proceedings of the International Conference on Advances in Electronics, Communication, Computing and Intelligent Information Systems (ICAECIS’23), Bangalore, India, 19–21 April 2023; IEEE: Piscataway, NJ, USA, 2023; pp. 66–71. [Google Scholar]
  48. Iqbal, S.; Khan, R.; Khan, R.; Alarfaj, F.; Alomair, A.; Ahmed, M. Association Rule Analysis-Based Identification of Influential Users in the Social Media. Comput. Mater. Contin. 2022, 73, 6479–6493. [Google Scholar]
  49. Hasan, M.; Bakar, A.; Yaakub, M. Measuring user influence in real-time on twitter using behavioural features. Phys. A Stat. Mech. Its Appl. 2024, 639, 129662. [Google Scholar] [CrossRef]
  50. Karoui, W.; Hafiene, N.; Ben Romdhane, L. Machine learning-based method to predict influential nodes in dynamic social networks. Soc. Netw. Anal. Min. 2022, 12, 108. [Google Scholar] [CrossRef]
  51. Zar, J. Spearman rank correlation: Overview. In Wiley StatsRef: Statistics Reference Online; Wiley Online Library: Hoboken, NJ, USA, 2014. [Google Scholar]
Disclaimer/Publisher’s Note: The statements, opinions and data contained in all publications are solely those of the individual author(s) and contributor(s) and not of MDPI and/or the editor(s). MDPI and/or the editor(s) disclaim responsibility for any injury to people or property resulting from any ideas, methods, instructions or products referred to in the content.

Article Metrics

Citations

Article Access Statistics

Multiple requests from the same IP address are counted as one view.