Article

FedIFD: Identifying False Data Injection Attacks in Internet of Vehicles Based on Federated Learning

1
School of Computer Science and Technology, Guangxi University of Science and Technology, Liuzhou 545006, China
2
Guangxi Colleges and Universities Key Laboratory of Intelligent Computing and Distributed Information Processing, Guangxi University of Science and Technology, Liuzhou 545006, China
3
Cybersecurity Monitoring Center for Guangxi Education System, Liuzhou 545006, China
4
Liuzhou Huating New Energy Technology Co., Ltd., Liuzhou 545006, China
*
Author to whom correspondence should be addressed.
Big Data Cogn. Comput. 2025, 9(10), 246; https://doi.org/10.3390/bdcc9100246
Submission received: 20 August 2025 / Revised: 22 September 2025 / Accepted: 23 September 2025 / Published: 26 September 2025
(This article belongs to the Special Issue Big Data Analytics with Machine Learning for Cyber Security)

Abstract

With the rapid development of intelligent connected vehicle technology, false data injection (FDI) attacks have become a major challenge in the Internet of Vehicles (IoV). While deep learning methods can effectively identify such attacks, the dynamic, distributed architecture of the IoV and limited computing resources hinder both privacy protection and lightweight computation. To address this, we propose FedIFD, a federated learning (FL)-based detection method for false data injection attacks. The lightweight threat detection model utilizes basic safety messages (BSM) for local incremental training, and the Q-FedCG algorithm compresses gradients for global aggregation. Original features are reshaped using a time window. To ensure temporal and spatial consistency, a sliding average strategy aligns samples before spatial feature extraction. A dual-branch architecture enables parallel extraction of spatiotemporal features: a three-layer stacked Bidirectional Long Short-Term Memory (BiLSTM) captures temporal dependencies, and a lightweight Transformer models spatial relationships. A dynamic feature fusion weight matrix calculates attention scores for adaptive feature weighting. Finally, a differentiated pooling strategy is applied to emphasize critical features. Experiments on the VeReMi dataset show that the accuracy reaches 97.8%.

1. Introduction

With the deep integration of information and communication technology (ICT) and the intelligent vehicle industry, the IoV has become a critical asset for transportation information infrastructure. By leveraging the spatiotemporal dynamic behaviors of vehicles and collaborative sensing with roadside infrastructure, the IoV enables real-time exchange of traffic information, supporting intelligent transportation and autonomous driving. However, the highly distributed, heterogeneous, and interconnected nature of IoV also exposes it to multidimensional attack surfaces. Under the control of an attacker, malicious vehicles can send falsified data in basic safety messages (coordinates, speed, etc.) to mislead other vehicles about the actual state of traffic events. Active deception attacks such as Sybil attacks, replay attacks, and false data injection attacks [1,2] can inject forged traffic data packets, resulting in anomalies, abrupt changes, and other irregularities in the dataset. These disruptions to data distribution may induce incorrect decision-making in vehicles, thereby directly threatening both the safety and efficiency of the IoV [3].
To address these problems, traditional FDI attack detection methods collect and analyze communication data streams in the IoV to identify potential attack behaviors. Among them, machine learning-based methods have been widely used for network traffic classification and anomaly detection due to their superior performance [4,5]. Compared with traditional machine learning, deep learning is considered to have even greater potential for threat detection because of its automatic feature extraction and strong high-dimensional representation capabilities [6,7]. Existing systems still face two key challenges in identifying FDI attacks. First, IoV BSM data exhibits significant spatiotemporal dynamic characteristics, including multimodal information such as vehicle position, speed, timestamp, and signal strength. Current attack detection methods are limited in modeling and fusing these spatiotemporal features, making it difficult to accurately capture complex attack behavior patterns [8,9,10]. Second, traditional attack detection methods typically rely on centralized big data analysis architectures, which are vulnerable to the dynamic changes in IoV topology, surges in data volume, and network bandwidth limitations. Centralized approaches also face risks of sensitive data leakage and single points of failure during data sharing, further weakening system reliability and robustness [11]. Moreover, these methods are in direct conflict with data sovereignty regulations such as the European Union General Data Protection Regulation (GDPR) [12].
In this context, BiLSTM is used to deeply model the historical states and behavior sequences of vehicles. It can capture bidirectional contextual dependencies in sequential data and obtain richer temporal information than the traditional unidirectional LSTM. This enhances the representation of vehicle behavior evolution and abnormal patterns. The goal of this model is to fully and effectively capture the spatiotemporal coupling features of traffic flow data while reducing the training time required to achieve high accuracy and improving training efficiency. This is aimed at achieving a relatively lightweight overall performance. In addition, by controlling the depth and width of modules, limiting the number of attention heads and the size of the feedforward layers, and applying strategies such as quantization and gradient compression, we strive to lower computation and memory costs without sacrificing key representational abilities. This “edge-efficient and resource-friendly” design makes the model easier to deploy and update on resource-constrained devices, such as vehicle terminals and the roadside units (RSUs).
To address the risk of sensitive data leakage in centralized methods, FL is applied as a collaborative learning paradigm. Its distributed nature improves the system’s adaptability to dynamic changes in network topology and enables distributed model training. This approach aligns with data minimization principles required by regulations such as GDPR, ensuring the security of local data on vehicles [13,14]. During the model parameter aggregation process in FL, we consider the heterogeneity of data distribution and computing resources among nodes. A dynamic weighted aggregation strategy, Q-FedCG, based on quantized bit-width and gradient compression, is introduced. This strategy adaptively adjusts global model updates according to the training performance of each client, improving the convergence speed and generalization performance of the system under heterogeneous conditions. Encryption methods can also be used during data upload and global model updates to further enhance communication security. For example, transmission layer encryption and end-to-end security protocols can be implemented between clients and the server. Combined with cryptographic techniques such as secure aggregation, this ensures that the server only receives aggregated updates and cannot access sensitive gradient information from individual clients. For scenarios with higher privacy requirements, model gradients or parameters can be encrypted and perturbed before sharing, reducing the risk of leakage caused by eavesdropping, replay, or inference attacks during transmission and aggregation, and further improving privacy and communication security in dynamic and heterogeneous vehicular networks. However, this paper mainly addresses the heterogeneity of data distribution and computing capability among nodes by introducing a Q-FedCG dynamic weighted aggregation strategy based on quantization bit-width and gradient compression. This method adaptively adjusts global model updates according to each client’s training performance, thus improving convergence speed and generalization under heterogeneous conditions.
Therefore, this paper proposes a detection method for false data injection attacks in the Internet of Vehicles based on federated learning. This method adapts to the limited computing resources of vehicles and builds a lightweight local threat detection model. The model uses a dual-branch parallel structure to extract temporal and spatial features, and adopts an adaptive dimension-level weighting mechanism to enhance the representation ability of spatiotemporal features in the local model. Compressed gradients are uploaded to RSU for dynamic aggregation, which protects vehicle privacy data and reduces communication costs. The main contributions are as follows.
  • A federated learning framework for detecting false data injection attacks in the Internet of Vehicles is proposed. A lightweight vehicle threat detection model is designed, which performs local incremental training using BSM containing information such as vehicle coordinates, speed, and signal strength. Gradients are compressed using the Q-FedCG algorithm and then uploaded to the RSU for global model aggregation.
  • A dual-branch spatiotemporal parallel feature extraction architecture is developed. The original features are restructured using a time window of T = 10 , and a three-layer stacked BiLSTM is employed to capture temporal dependencies bidirectionally. A sliding average strategy is used for sample alignment, and a lightweight Transformer is applied to model global spatial relationships. Each branch outputs a 64-dimensional feature vector, enabling efficient parallel modeling of spatiotemporal features in the IoV.
  • An adaptive feature dimension weighting mechanism is designed. Each of the spatiotemporal dual branches employs a 64 × 64 feature fusion weight matrix to dynamically compute attention scores, enabling dynamic weighting at the dimensional level. A differentiated pooling strategy is then applied to the adaptively weighted output features, enhancing the representation of key features.
  • Experimental results show that this method significantly improves performance compared to traditional attack detection methods in multi-client tests on the VeReMi dataset. The experimental accuracy reaches 97.8%, and the F1 score reaches 97.3%.
The rest of this paper is structured as follows. Section 2 reviews related work. Section 3 presents the design details and key techniques of the federated learning-based method for detecting false data injection attacks in the Internet of Vehicles. Section 4 discusses the experimental results and performance comparison. Finally, Section 5 concludes the paper and outlines directions for future work.

2. Related Work

Early research on attack detection in the Internet of Vehicles mostly relied on traditional machine learning models deployed locally on vehicles. These methods identified attacks by analyzing static features in the data received by vehicles. For example, Ilango et al. [15] proposed a BSM identification scheme for false location data based on autoencoders and random forests. Anyanwu et al. [16] designed a lightweight false BSM detection scheme. This scheme uses hyperparameter tuning of an integrated random forest classifier and employs random search cross-validation to optimize classification errors. Although such methods are easy to deploy, they find it difficult to capture temporal dependency features in IoV traffic, which limits detection accuracy in dynamic environments.
With the development of deep learning, sequence modeling methods based on recurrent neural networks (RNN) and their variants have been gradually applied in the field of IoV security. Zhu et al. [17] designed a distributed Long Short-Term Memory (LSTM) that achieves anomaly detection for Vehicle Ad Hoc Network (VANET) traffic by analyzing both temporal and data dimensions. Zhou et al. [18] proposed an incremental LSTM model, which dynamically adjusts the hidden layer states to address the evolution of network traffic. It is worth noting that He et al. [19] developed the BiLSTM-Att detection model for the cloud-based intelligent connected vehicle lateral control system. This model enhances physically guided features and models bidirectional dependencies, improving the FDI attack detection accuracy to 93.9%. Nguyen et al. [20] proposed a multi-class intrusion detection system based on a Transformer attention network, which overcomes the limitation that LSTM can only model limited time dependencies and validates the model’s ability to capture complex spatiotemporal dependencies. However, traditional deep learning methods face two key challenges. First, a single network architecture leads to insufficient feature representation of spatiotemporal features. Second, centralized big data analysis architectures have the risk of data privacy leakage.
To address the problem of insufficient feature representation and to optimize feature extraction ability, current research mainly adopts serial architectures to extract spatiotemporal features in stages. For example, Gu et al. [21] designed a fog-cloud collaborative feature extraction framework based on a staged graph attention network and gated recurrent unit (GRU). In this framework, the fog computing node uses a multi-head graph attention network to model the spatial topology among vehicles, and the cloud applies an attention-based GRU to mine global temporal features. Li et al. [22] proposed a novel method based on a spatiotemporal Transformer network to solve the problem of FDI attack detection. This method integrates a self-attention mechanism and graph convolution layers to fuse the structural topology and spatiotemporal features of data. However, serial architectures have difficulty fully capturing the synergistic correlations of spatiotemporal features in original data, which leads to the loss of key information. Recent studies show that parallel architectures can significantly improve the efficiency of spatiotemporal feature extraction. Cheng et al. [23] proposed synchronizing the encoding of spatiotemporal relationships in the encoder. This method uses an attention-enhanced convolutional network to capture spatial and channel features and combines an attention-based LSTM to establish key byte associations across time steps. Xing et al. [24] proposed a parallel feature extraction framework based on Temporal Convolutional Networks and LSTM. This framework fuses spatiotemporal features through the self-attention mechanism. Experiments show that, compared with serial methods, it significantly reduces the false positive rate and improves detection accuracy, and can more effectively mine the potential associations of spatiotemporal features.
Due to the privacy limitations of centralized learning architectures, federated learning frameworks and the distributed system architecture of the Internet of Vehicles show a high degree of compatibility. This approach demonstrates unique adaptability and advantages in dynamic and unstable IoV environments. Firstly, IoV nodes are widely distributed and highly mobile. The frequent changes in network connections and the online status of nodes make it difficult for centralized learning to ensure stable and timely collection of raw data. Centralized methods also require high bandwidth and continuous connections, making them easily affected by network bottlenecks, latency, and node offline problems. In contrast, federated learning only requires vehicles to periodically upload local model parameters, which greatly reduces the requirements for communication quality and node availability. When vehicle nodes go offline temporarily due to network fluctuations, they can continue training locally and synchronize when conditions allow. This ensures the continuity of the overall training process and improves the system’s fault tolerance. Additionally, as the scale of the Internet of Vehicles continues to grow, the distributed and collaborative framework of federated learning can effectively reduce the computation and communication burden on the central node. It is also more suitable for practical needs, such as the sharp increase in the number of vehicles and frequent changes in communication routes. By performing data processing and preliminary model training locally on vehicles, federated learning not only reduces the risk caused by uploading raw sensitive data but also further improves data privacy protection. It also significantly optimizes overall resource utilization and system real-time performance. Therefore, federated learning provides a practical and effective technical foundation for security protection in complex and dynamic IoV environments. Several experiments [25,26,27] have shown that, in the field of IoV security, federated learning can reduce large amounts of data transmission while ensuring data privacy, and can achieve detection performance comparable to centralized methods. This provides a new technical paradigm for threat detection in the Internet of Vehicles.
Therefore, privacy protection for IoV data based on federated learning has become a research hotspot. Considering the problem of insufficient feature representation, some researchers have conducted related studies. For example, Huang et al. [28] built a federated learning architecture and used a serial structure of graph attention network (GAT) and LSTM on vehicle nodes to capture the spatiotemporal dependencies of road networks. Yuan et al. [29] combined federated learning and used a serial architecture of an LSTM and a Convolutional Neural Network (CNN) to capture the long-term spatiotemporal information of each region for urban traffic flow prediction. Li et al. [30] applied federated learning and designed a serial architecture of GRU and GAT to separately capture spatiotemporal features for traffic speed prediction. Tao et al. [31] used a serial architecture of an autoencoder and a time-embedding Transformer to capture spatial and temporal features for VANET federated learning distributed collaborative threat detection. However, there are still two key limitations in existing research on false data injection attack detection in the Internet of Vehicles. First, the vehicle BSM data used to train local threat detection models has strong spatiotemporal correlation. Research on deep spatiotemporal feature mining that combines federated learning with parallel network architectures is still limited. Most methods still rely on serial architectures, which makes it difficult to fully utilize the complex associations between spatiotemporal features. Second, current methods generally ignore the actual constraints of limited computing resources on vehicle devices. There is a lack of lightweight model design, which affects the practical deployment performance.
According to the above factors, exploring a federated learning-based method for identifying false data injection attacks in the Internet of Vehicles, which can both fully mine spatiotemporal features and meet the requirements of lightweight deployment, has important theoretical research value and practical application prospects.

3. Proposed Method

3.1. FedIFD Framework

This paper designs a federated learning architecture for identifying false data injection attacks in the Internet of Vehicles, as shown in Figure 1. In this architecture, the cloud server acts as the top-level management and coordination center. It is mainly responsible for global resource scheduling, heterogeneous node management, and maintaining model version history. This can effectively improve the stability and sustainability of system iterations. However, this study focuses on one-to-many federated edge collaboration for attack detection between RSU and vehicle nodes. There is no actual interaction with the cloud server module during experiments using the VeReMi dataset. In the current experimental setup, the absence of a cloud server does not affect the research objectives or the empirical results of the proposed method. Therefore, the specific mechanisms of the cloud server are not discussed in detail in this paper. In this system, vehicle clients serve as distributed computing nodes. They use onboard sensors and dedicated communication modules to collect multidimensional data in real time, including local vehicle states, V2X communication interaction records, and local event logs. Based on deep neural networks, each node conducts local feature representation learning and model training to generate gradient update information. Legitimate vehicles, as trusted participants, submit compressed gradient data processed by bit-width quantization to the RSU. Malicious vehicles and phantom vehicles exhibit behavior patterns that are significantly different from those of normal nodes, and they have different effects on the system. Specifically, malicious vehicles inject forged data into legitimate vehicles during the local data collection stage to create interference. The fake V2X messages can mislead normal vehicles into carrying out incorrect operations, such as sudden braking or turning. Ghost vehicles are false nodes that are misjudged by normal vehicles. False data injection attacks not only undermine the convergence stability of the federated learning system but also pose a major potential threat to traffic operation safety.
Specifically, the RSU serves as a regional computing center and is responsible for key functions such as gradient aggregation and model updating. It uses the dynamic weighted aggregation algorithm Q-FedCG to aggregate multi-dimensional gradient information. The resulting global model parameters are then distributed to each vehicle node in a distributed manner. By establishing a closed-loop iterative mechanism of “local training–gradient uploading–global aggregation–model distribution”, this architecture can progressively optimize the attack detection model while effectively protecting the privacy of local raw data on vehicles. This provides a practical technical solution for collaborative security defense in the Internet of Vehicles environment. Compared with the traditional centralized machine learning paradigm, this scheme achieves an effective balance between sensitive data protection and collaborative training based on a distributed federated learning framework. Its parameter isolation mechanism can effectively prevent privacy leakage risks that may occur during raw data exchange.
To address issues such as packet loss, latency, node disconnection, and data corruption in the Internet of Vehicles, this paper makes the following basic assumptions for experimental design: In typical communication abnormal scenarios, vehicle nodes can ensure that local training results are eventually and effectively aggregated into the global model through methods such as retrying, caching, and uploading later. If a node is offline for a long period, this update will not affect the global aggregation process.

3.2. System Model

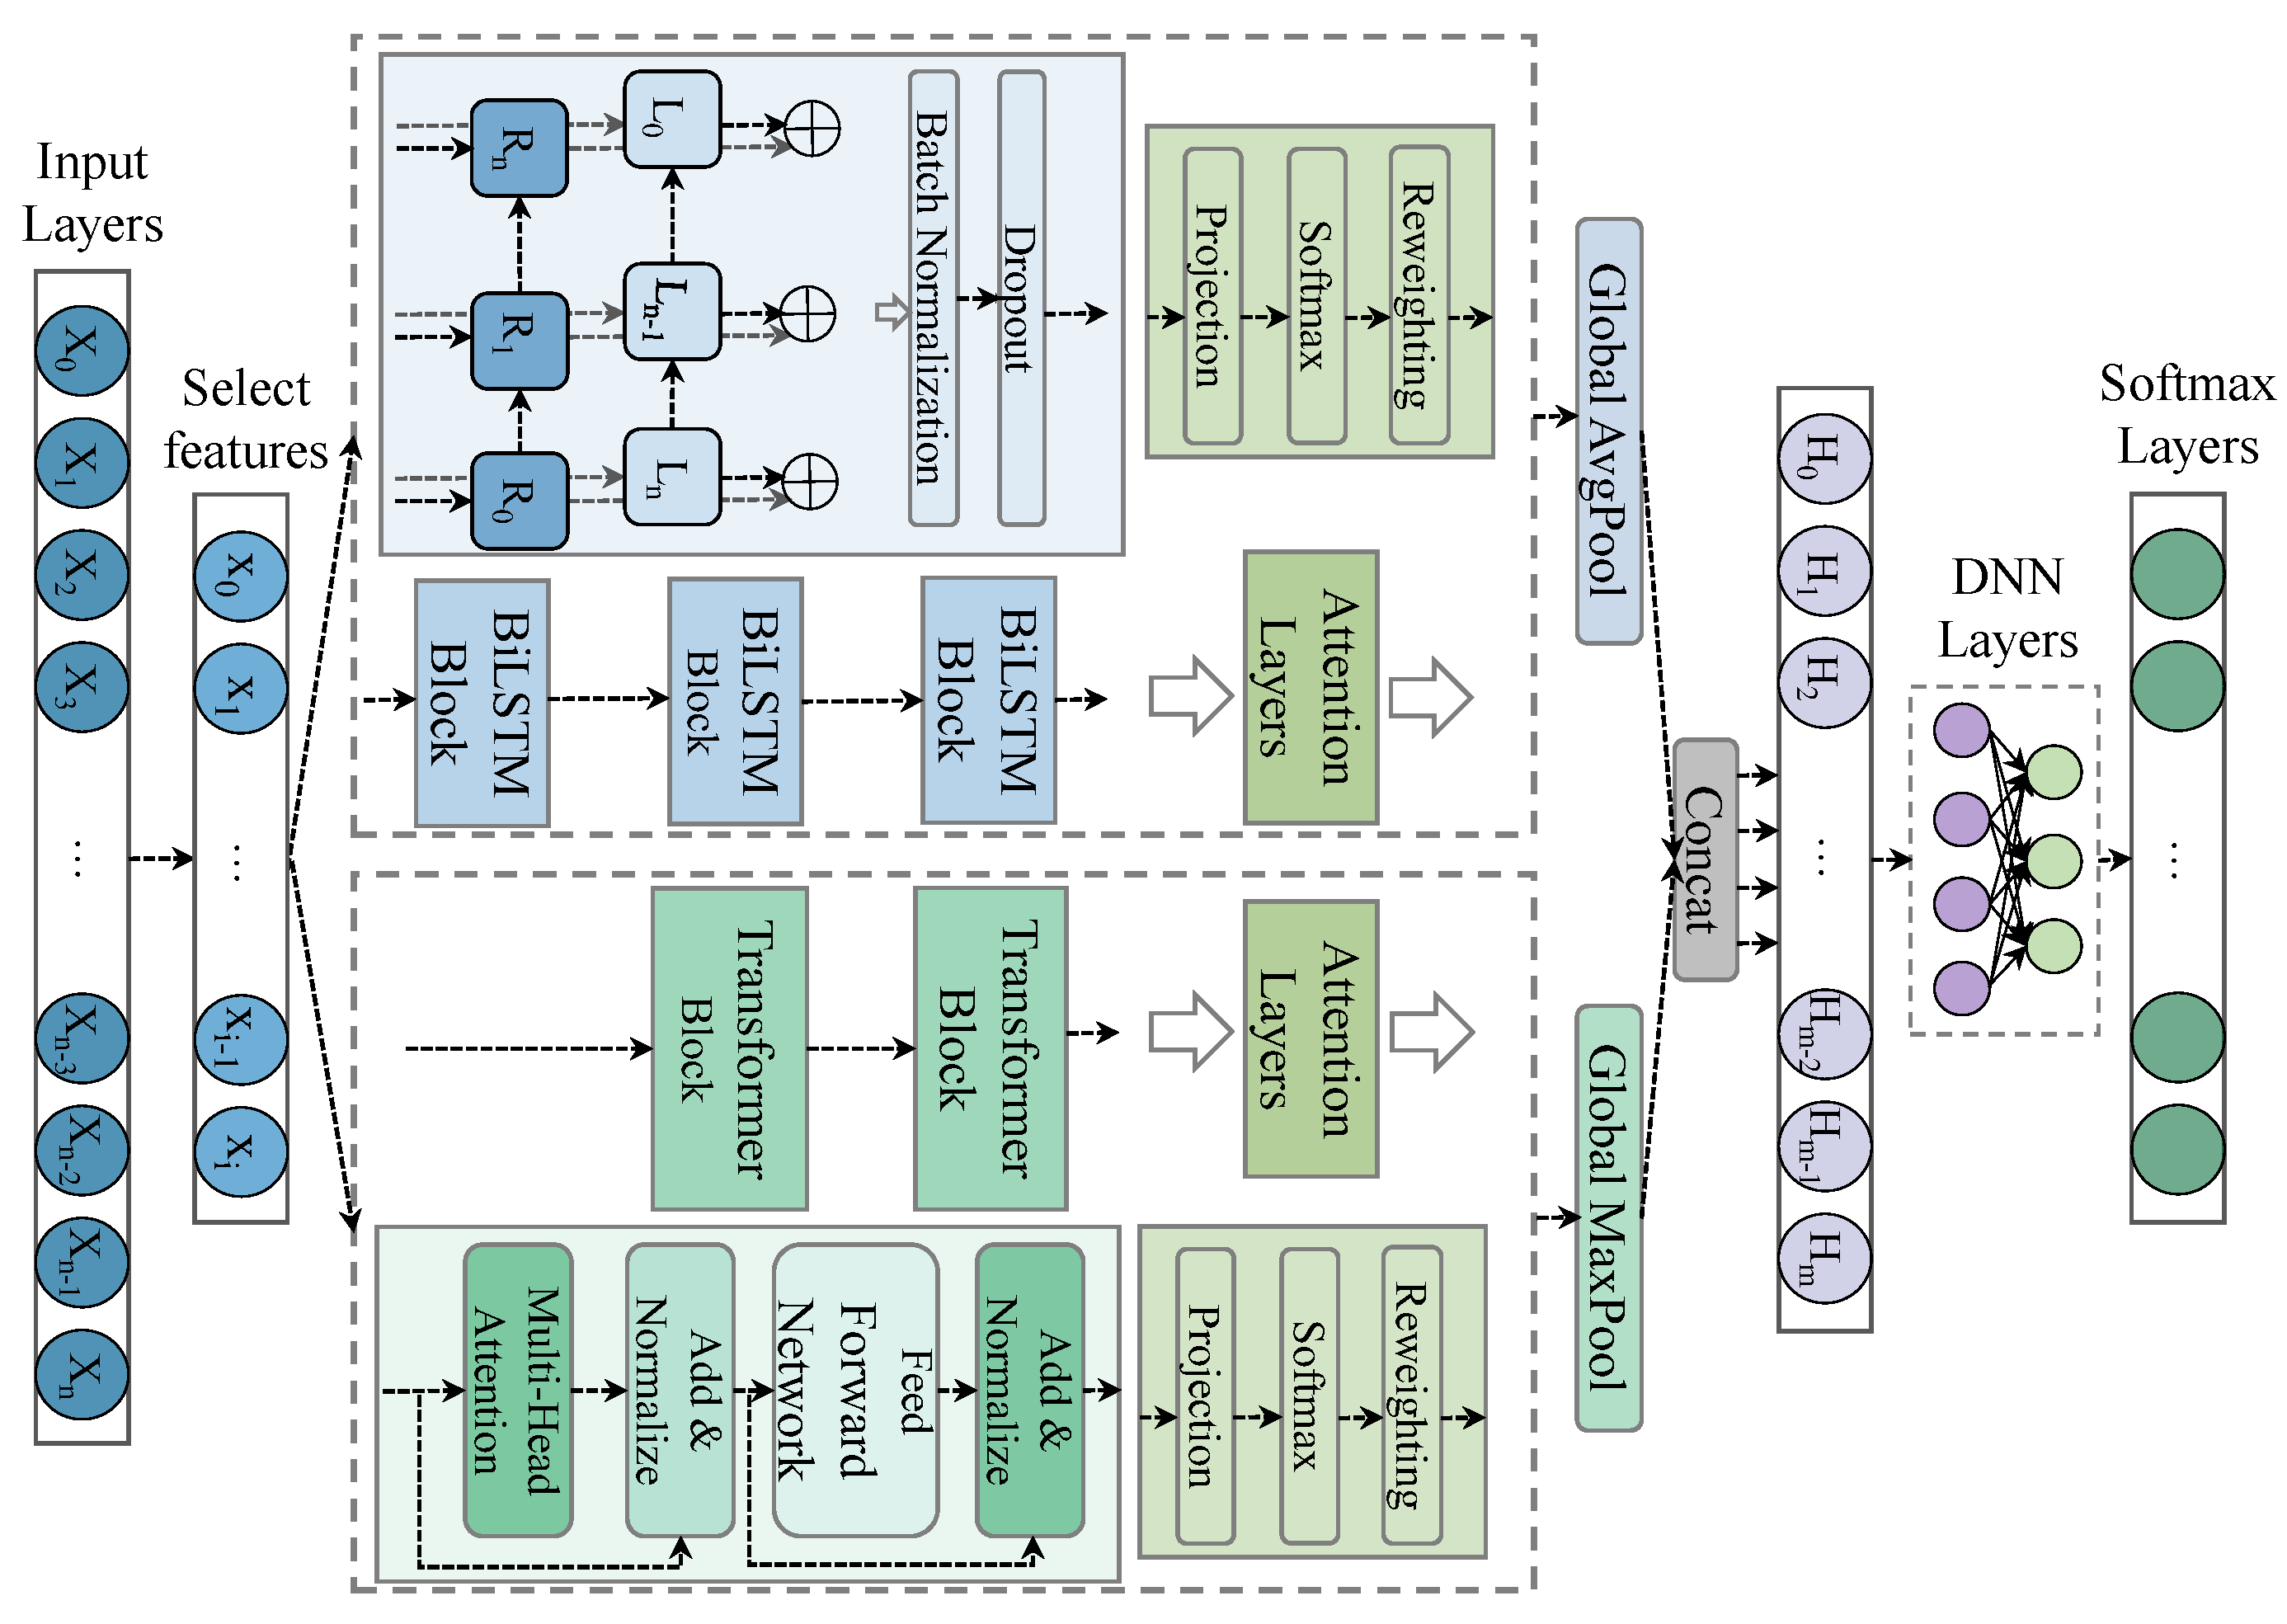
This paper proposes a hybrid neural network model combining BiLSTM and Transformer for processing data with complex spatiotemporal features. The input layer, X 0 X n , represents BSM features, including information such as position, speed, and signal strength. By calculating the Pearson correlation coefficient between features, highly correlated redundant features are removed, resulting in the final input features x 0 x i for the model. Then, BiLSTM is used to capture the dynamic characteristics of the time series, while a lightweight Transformer module efficiently models the spatial features. In addition, to achieve comprehensive and accurate threat detection, this study needs to fuse temporal and spatial features to fully utilize the intrinsic correlations in spatiotemporal data. To this end, the model incorporates a dimension-level adaptive weighted attention mechanism for further fusing temporal and spatial features, thereby enhancing feature representation capabilities. Finally, classification is performed through a Deep Neural Network (DNN). Figure 2 presents the framework of the local vehicle-side threat detection model.

3.2.1. Feature Extraction of Time Series

As an improved variant of recurrent neural networks, BiLSTM implements bidirectional modeling of sequential data by deploying forward and backward LSTM layers in parallel. Compared with traditional unidirectional LSTM, which only processes sequence information in a single direction, BiLSTM can capture more complete contextual dependencies through its bidirectional recurrent structure. Specifically, a unidirectional LSTM controls the information flow through the gating mechanisms of the input gate, output gate, forget gate, and candidate memory cell. The formulas are as follows:
f t = σ ( W f x t + U f h t 1 + b f )
i t = σ ( W i x t + U i h t 1 + b i )
o t = σ ( W o x t + U o h t 1 + b o )
c ˜ t = tanh ( W c x t + U c h t 1 + b c )
c t = f t c t 1 + i t c ˜ t
h t = o t tanh ( c t )
where x t is the input vector at the current time step, h t 1 is the hidden state at the previous time step, and f t , i t , and o t represent the activation values of the forget gate, input gate, and output gate, respectively. c ˜ t is the candidate cell state at the current time step, and c t is the cell state at the current time step. b f , b i , b o , and b c are the bias terms for each gate, while W f , W i , W o , and W c are the weight matrices from the input to each gate, and U f , U i , U o , and U c are the weight matrices from the hidden state to each gate. σ ( ) denotes the sigmoid activation function, which compresses gate values into the range [0,1], t a n h ( ) denotes the hyperbolic tangent activation function, which compresses values into the range [−1, 1], and ⊙ denotes the Hadamard product.
On this basis, BiLSTM introduces a backward propagation path, so that the hidden state at each time step is generated by jointly combining the forward propagation state h t and the backward propagation state h t . The final output is h t = [ h t , h t ] . For the original feature matrix, dimension reshaping is first performed to adapt to the input requirements of BiLSTM:
X time = Reshape X , N T , T , d
X R N × d represents the original feature matrix, where N is the total number of samples and d is the feature dimension. T = 10 is the fixed time window length. X t i m e R N T × T × d is the reshaped three-dimensional tensor, which divides the continuous data stream into N / T sequences. Each sequence contains T time steps. This design has two advantages. On the one hand, a systematic sensitivity analysis was conducted for different time window lengths (5, 10, and 15). The results show that a length of 10 provides the best detection performance and more effectively captures short-term changes in vehicle movement states. On the other hand, a moderate segment length helps reduce computational complexity and alleviates the risks of gradient vanishing and overfitting caused by long sequences. In the three-layer stacked BiLSTM architecture, the computation of the l-th layer is as follows:
h t l = LSTM h t l 1 , h t 1 l , c t 1 l ; θ l
h t l = LSTM h t l 1 , h t + 1 l , c t + 1 l ; θ l
h t l and h t l represent the forward and backward hidden states at time step t in the l-th layer, respectively. c t l and c t l are the corresponding memory cell states. θ l and θ l are the parameter sets of the LSTM. To enhance model robustness, a batch normalization layer and a Dropout layer are configured after each network layer. Batch normalization accelerates model convergence by standardizing the distribution of hidden layer activations. The Dropout mechanism effectively suppresses overfitting by randomly masking neuron connections. Figure 3 shows the change in dimension of the original feature input after processing by the BiLSTM.
Finally, the output tensor shape of this branch is H time = h ˜ 3 R N T × T × d h , where d h / 2 = 32 is the hidden state dimension of the unidirectional LSTM. The total output dimension is d h / 2 = 64 , which includes d h / 2 -dimensional features from the forward LSTM, encoding the information flow from the past to the present, and d h / 2 -dimensional features from the backward LSTM, encoding the information flow from the future to the present. This structure provides rich temporal context information for feature extraction and discrimination in subsequent model layers.

3.2.2. Extraction of Spatial Features

To effectively model the dependencies in the feature space, this branch adopts a Transformer encoder structure to construct the spatial feature extraction module. Unlike the original encoder–decoder structure of the Transformer, only the encoder part is retained in this scheme to focus on modeling feature space interaction. The core of this module consists of a multi-head self-attention mechanism and a feed-forward neural network (FNN). The multi-head attention uses two attention heads to calculate in parallel. This configuration, while ensuring computational efficiency, enables parallel capture of multi-dimensional interaction information through feature space separation. The feed-forward network adopts a two-layer fully connected structure. The first layer introduces a nonlinear transformation ability using the Rectified Linear Unit (ReLU) activation function. The second layer performs dimension recovery to ensure consistency between the output feature and input dimension.
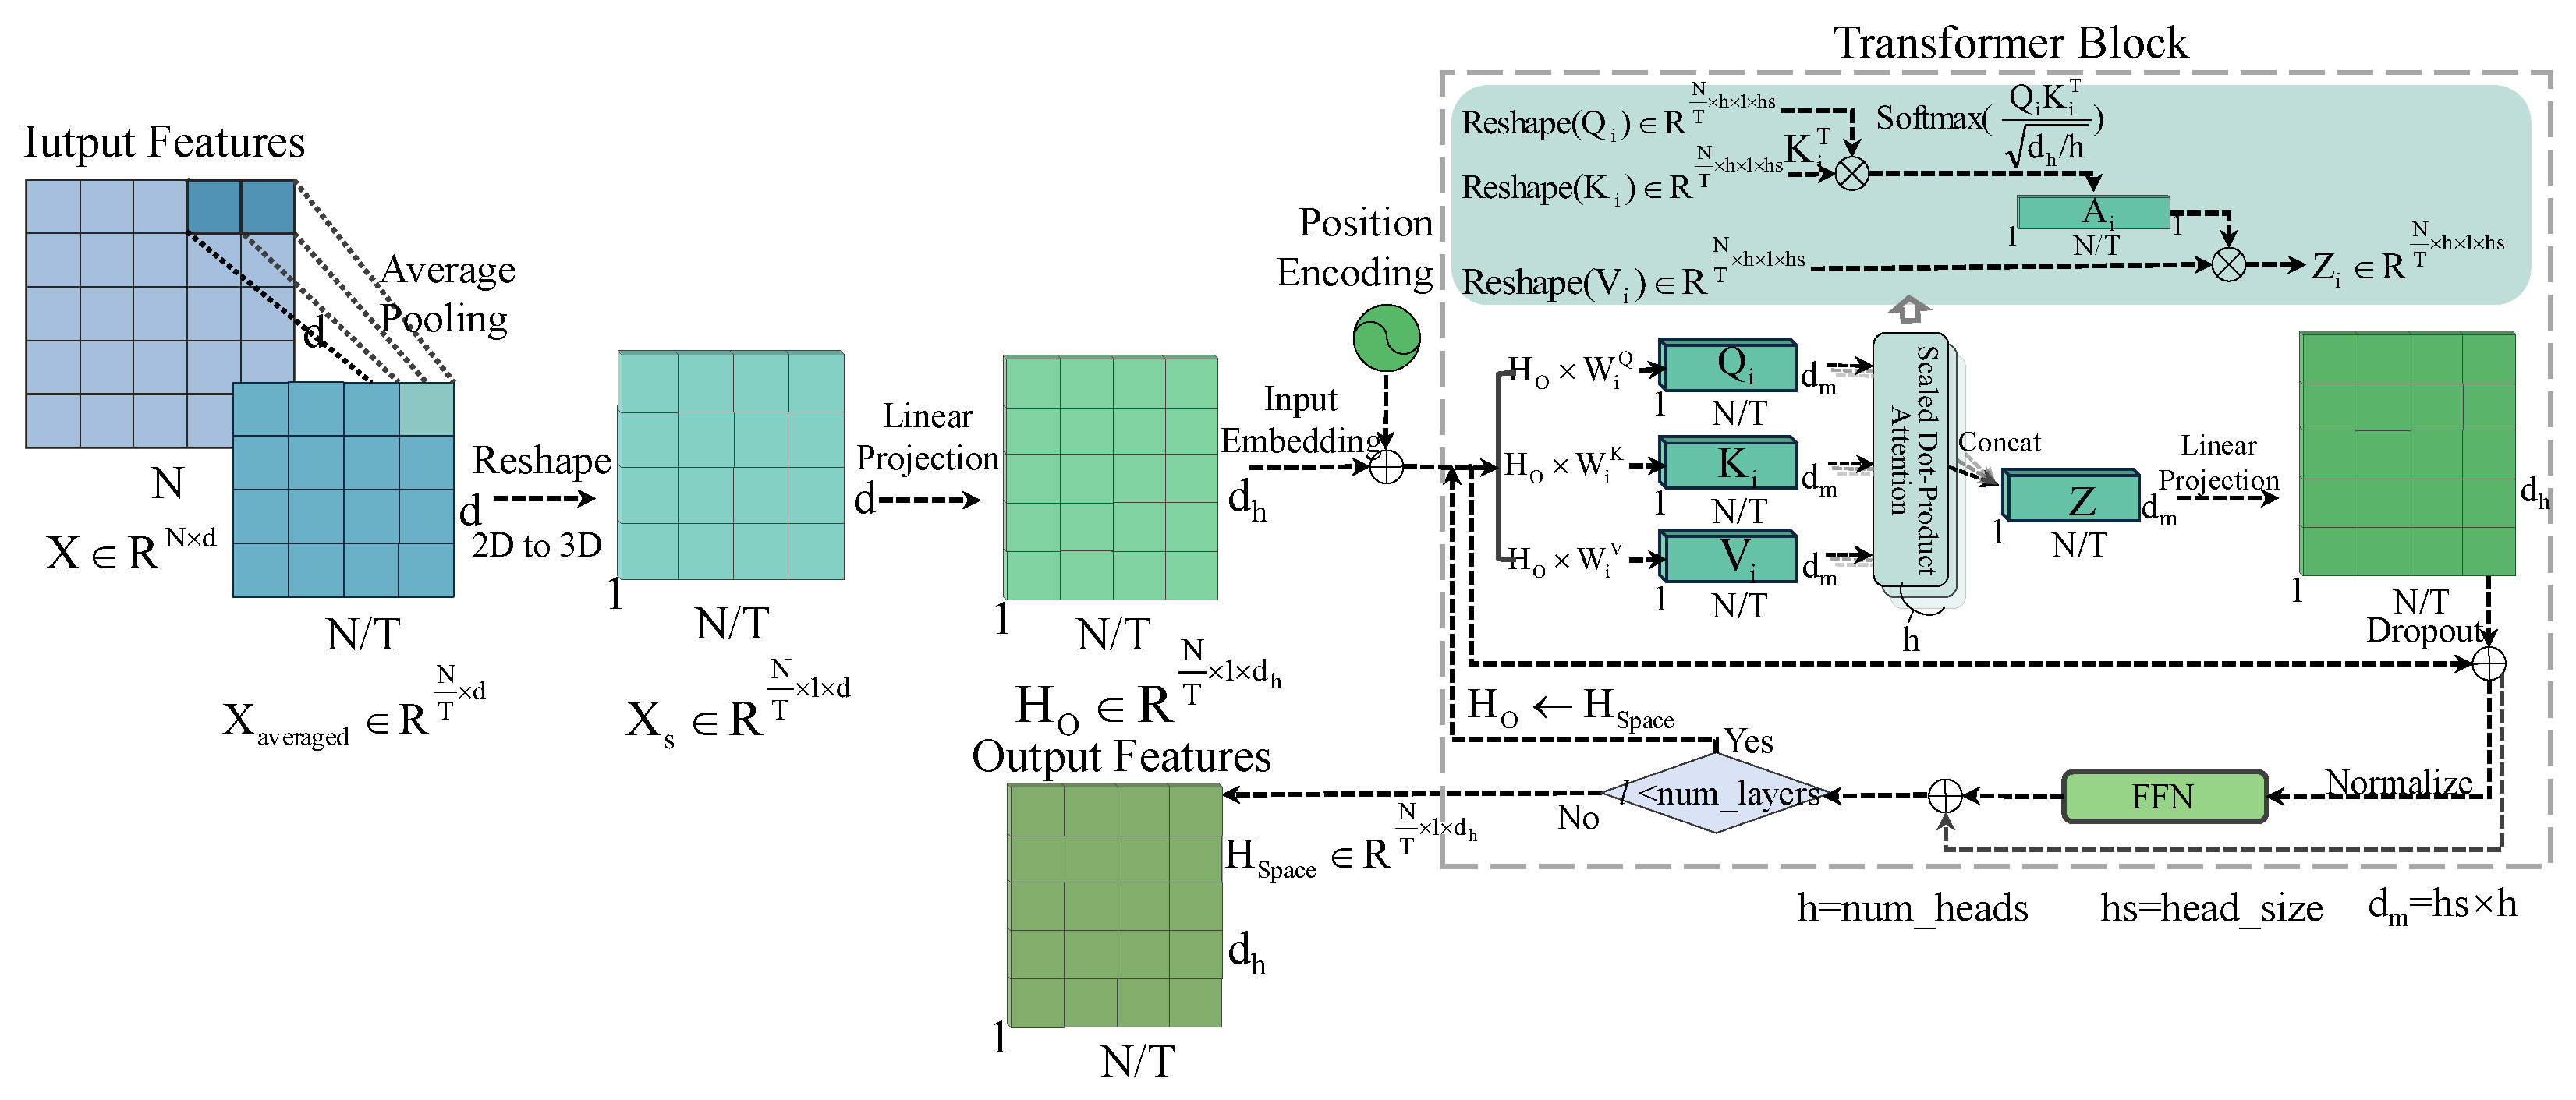
Considering that the temporal branch reorganizes the original data using a time window of T = 10 , the number of output samples in the temporal branch changes from N to N / T . To ensure the consistency of feature dimensions during the subsequent feature fusion stage, the spatial branch needs to align the sample dimension of the original features accordingly. Specifically, the spatial branch processes the original feature matrix X R N × d using a sliding average strategy. It applies average pooling to the feature vectors of every consecutive T samples to generate new feature representations. The parameter kernelSize specifies the number of elements covered by each pooling window, while the stride determines how many elements the pooling window skips during each move. The process can be described as:
X a v e r a g e d = A v g P o o l 1 D X , k e r n e l S i z e = T , s t r i d e = T
In this way, N original samples are reorganized into N / T aggregated samples, each of which contains the average feature information of T consecutive samples. This design not only maintains the continuity of the features but also ensures that the number of output samples is fully aligned with that of the temporal branch, thus achieving temporal semantic alignment between temporal and spatial features. To meet the input requirements of the Transformer encoder, the aggregated features are further reshaped and projected into the desired space dimension:
X s = Reshape X a v e r a g e d , N T , 1 , d
H 0 = X s W p + b p
Specifically, X s denotes the reshaped 3D tensor, W p R d × d h is the projection weight matrix, and b p R d h is the bias vector, where the hidden dimension is d h = 64 . This setup treats each sample as an independent token, allowing the self-attention mechanism to focus on modeling correlations among feature dimensions rather than temporal dependencies. The 64-dimensional input features provide ample expression space for the attention mechanism to capture rich feature interactions. By first using a linear projection to map the 64-dimensional features to a 16-dimensional intermediate representation, and then evenly splitting it into two 8-dimensional subspaces, each attention head independently processes an 8-dimensional feature subset. The outputs from both heads are finally projected back to 64 dimensions, achieving a balance between computational efficiency and representational power. For each attention head i, the calculation of the query, key, and value matrices is defined as Q i = H 0 W i Q , K i = H 0 W i K , and V i = H 0 W i V . Here, W i Q , W i K , and W i V R d h × d h h are the corresponding parameter matrices. h = 2 is the total number of attention heads. When the sequence length is 1, the computation of the attention weights between features is simplified as:
A i = softmax Q i K i T d h h
A i R N T × 1 × 1 represents the attention weight matrix, and d h h is the scaling factor. At this time, the multiplication between the query matrix Q and the key matrix K is essentially transformed into the similarity calculation between features. If two features are highly correlated, the attention weight will be higher. If there is a contradiction between features, it may be identified as an abnormal situation. In this way, the global dependency relationship in the feature space is established. It is important to note that the simplified calculation of attention weights is specifically designed for the scenario where this branch takes only a single time slice as input. In this case, the self-attention mechanism of the Transformer no longer models dependencies across different time steps, but instead focuses on the global interaction modeling of different feature dimensions within the same time slice. Therefore, the product of Q and K essentially reflects the pairwise similarity between features, which does not fundamentally conflict with the original objective of self-attention in sequence modeling. This design fully leverages the strengths of the attention mechanism in feature space modeling, enabling it to effectively capture the complementarity and anomalies among features. For instance, if there are strong correlations or abnormal distributions between certain features, the attention weights will clearly reflect these relationships, providing valuable support for subsequent anomaly detection or spatial information aggregation. Additionally, since temporal dependencies have already been captured by the temporal branch, this specific setting for the spatial branch does not weaken the model’s overall capacity for feature representation and dependency modeling. On the contrary, it can further enhance the quality of feature interactions in the spatial domain, achieving a reasonable decoupling and efficient synergy between the model’s feature and temporal spaces. Figure 4 shows the changes in feature dimensions after the original feature input is processed by the Transformer.
The output of each attention head is calculated as Z i = A i V i . The output of multi-head attention is obtained by concatenation and linear transformation, expressed as Z = Concat ( Z 1 , Z 2 ) W O , where W O R d h × d h is the output projection matrix. Regarding the configuration between encoder layers, each attention head is followed by a residual connection and a layer normalization module. The Dropout mechanism is used together to form a complete regularization chain. This design ensures the stability of gradient propagation and enhances the model’s ability to capture complex spatial relationships through multi-scale feature fusion. Finally, the tensor output from the spatial branch is denoted as H s p a c e R N T × 1 × d h . Each dimension represents the feature embedding reconstructed and weighted by the self-attention mechanism, which can be dynamically adjusted according to the global relationships with other features. This design enables the model to capture the intrinsic dependencies between features and provides feature representations with spatial context for subsequent threat detection tasks.

3.2.3. Feature Weighting and Fusion

In order to further enhance the representation capability of temporal and spatial features, the model adopts an adaptive attention mechanism. This mechanism improves the focus on key features by dynamically adjusting feature weights. Specifically, the attention layer uses a trainable weight matrix W a t t n R d h × d h and a bias vector b a t t n R d h to compute the attention scores of the input features H. The attention score matrix E is normalized by the Softmax function to obtain a probabilistic weight matrix. Then, the Hadamard product is used to achieve dynamic feature weighting, resulting in the weighted feature representation H . The hidden layer dimension is d h = 64 . The formulas are as follows:
E = H · W a t t n + b a t t n
H = H s o f t m a x E
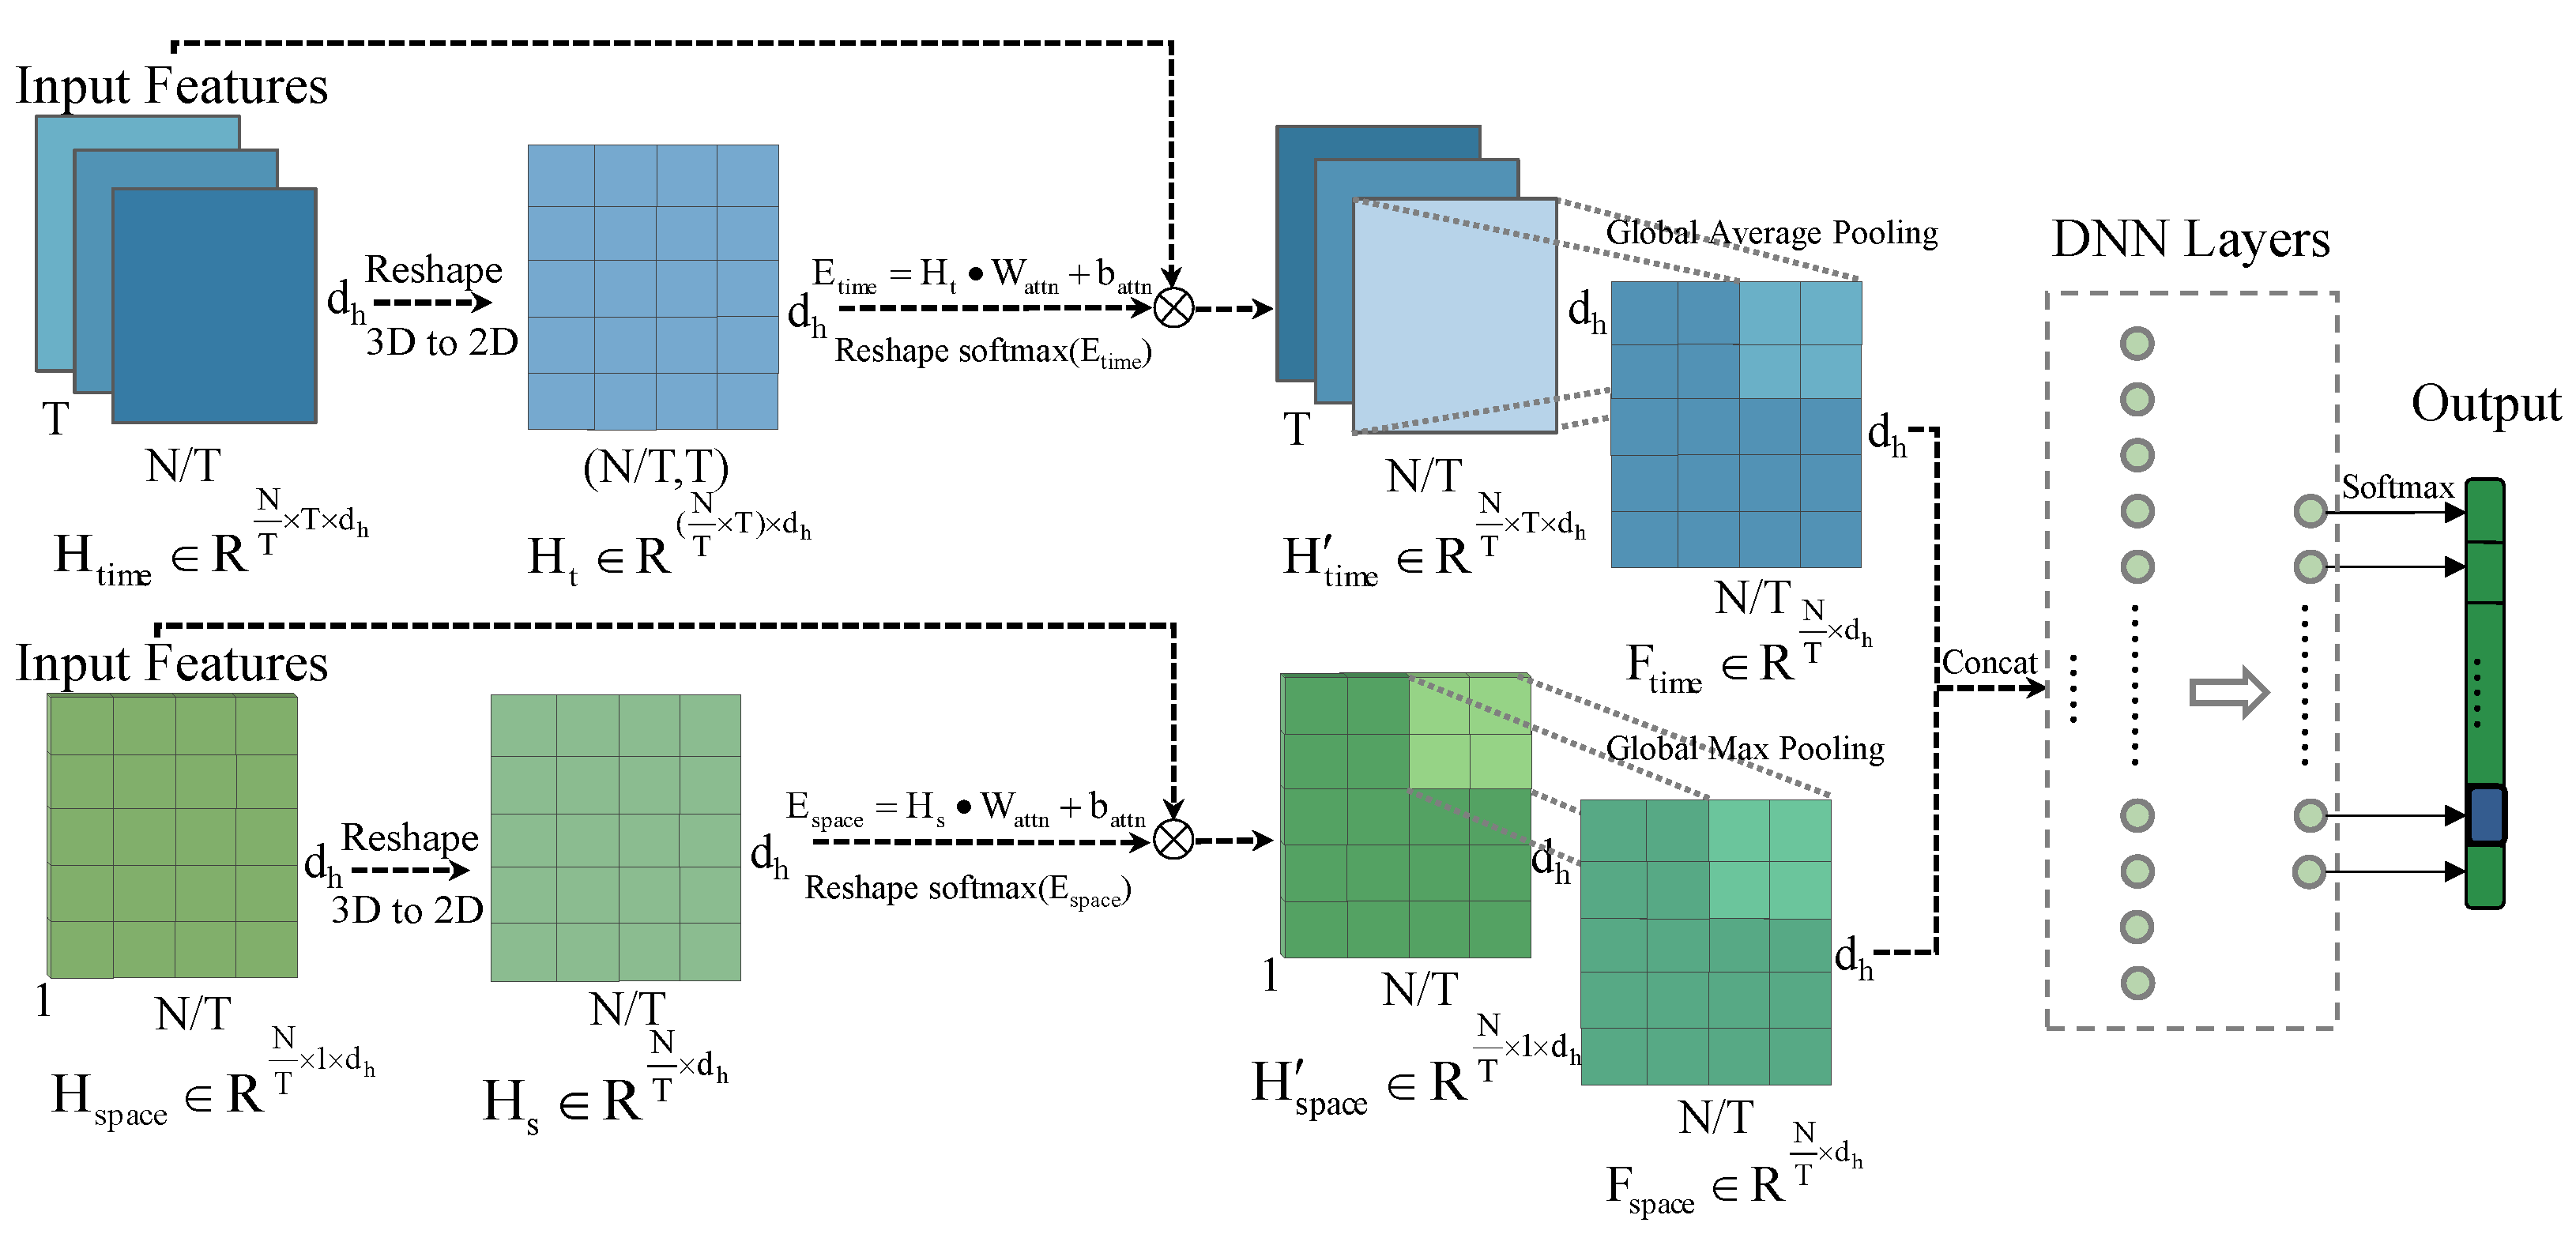
In the implementation process, the three-dimensional tensor output H t i m e from the BiLSTM branch is reshaped into a two-dimensional tensor as H t i m e = R e s h a p e H t i m e , 1 , d h , where -1 means that the size of this dimension is automatically calculated to flatten the batch and time steps into a single dimension. The purpose of this operation is to make matrix multiplication on the two-dimensional tensor more efficient and to avoid the complexity of processing three-dimensional tensors. Attention scores are calculated by the weight matrix and bias, and then normalized using the softmax function to obtain the attention distribution on the 64 feature dimensions. The weight matrix is then reshaped back to the original shape [ N T , T , d h ] and multiplied by the original features. This allows the model to adaptively suppress redundant or noisy features, highlight key feature information, and keep the original output shape unchanged.
Similarly, for the output of the Transformer branch, since the sequence length is 1, its feature output can be directly reshaped to [ N T , d h ] to maintain the same attention weighting method as the BiLSTM branch. The final output dimension is also restored to [ N T , 1 , d h ] , ensuring structural consistency and uniform calculation standards. To further prevent all the attention weights from being highly concentrated on a single feature dimension, the model adopts small initial weights during the parameter initialization stage of the attention mechanism. This is combined with LayerNorm normalization to balance the activation distribution across features. Regularization techniques such as Dropout are also introduced during training to effectively prevent overfitting to specific features. Additionally, we conducted a statistical analysis of the attention weight distributions during training and found that they are generally dispersed and balanced, with no obvious signs of collapse. After applying attention weighting, the features need to be compressed into vectors for fusion. Temporal features are dimensionally reduced through global average pooling, with the output F t i m e R N T × d h . Average pooling computes the mean over the temporal dimension, capturing the overall trend of the entire time series. The spatial features are dimensionally reduced through global max pooling, resulting in F s p a c e R N T × d h , which retains the most salient feature information. The pooled temporal and spatial features are then fused into a unified feature representation via concatenation:
F f u s e d = C o n c a t F t i m e , F s p a c e R N T × 2 d h
The fused feature vector is successively processed by two fully connected layers, each followed by batch normalization and a Dropout mechanism. A fully connected layer with Softmax activation outputs classification probabilities, thereby enabling classification of the input samples. This feature fusion design effectively identifies complex abnormal patterns involving both temporal and spatial dimensions, such as physical anomalies where speed does not match positional changes, gradually evolving forged location attacks, and anomalous events where communication patterns deviate from normal paradigms. This provides a solid model foundation for anomaly detection tasks in complex scenarios. Figure 5 shows the changes in feature dimensions after spatiotemporal features are processed by BiLSTM and Transformer, then fused by weighting with an adaptive attention mechanism, and finally used for training and classification with a DNN.

3.3. Overall Federal Learning Process

Federated learning achieves collaboration between global and local computation through dynamic interaction between a centralized server and distributed clients. Within this framework, Horizontal Federated Learning (HFL) is suitable for scenarios where data share the same feature space but differ in samples. Clients share the same features and perform local training, aggregating gradient information to optimize global model updates. This approach not only ensures the security of local raw data and reduces transmission costs but also enhances collaboration among clients, leading to efficient model training.

3.3.1. Q-FedCG [32]

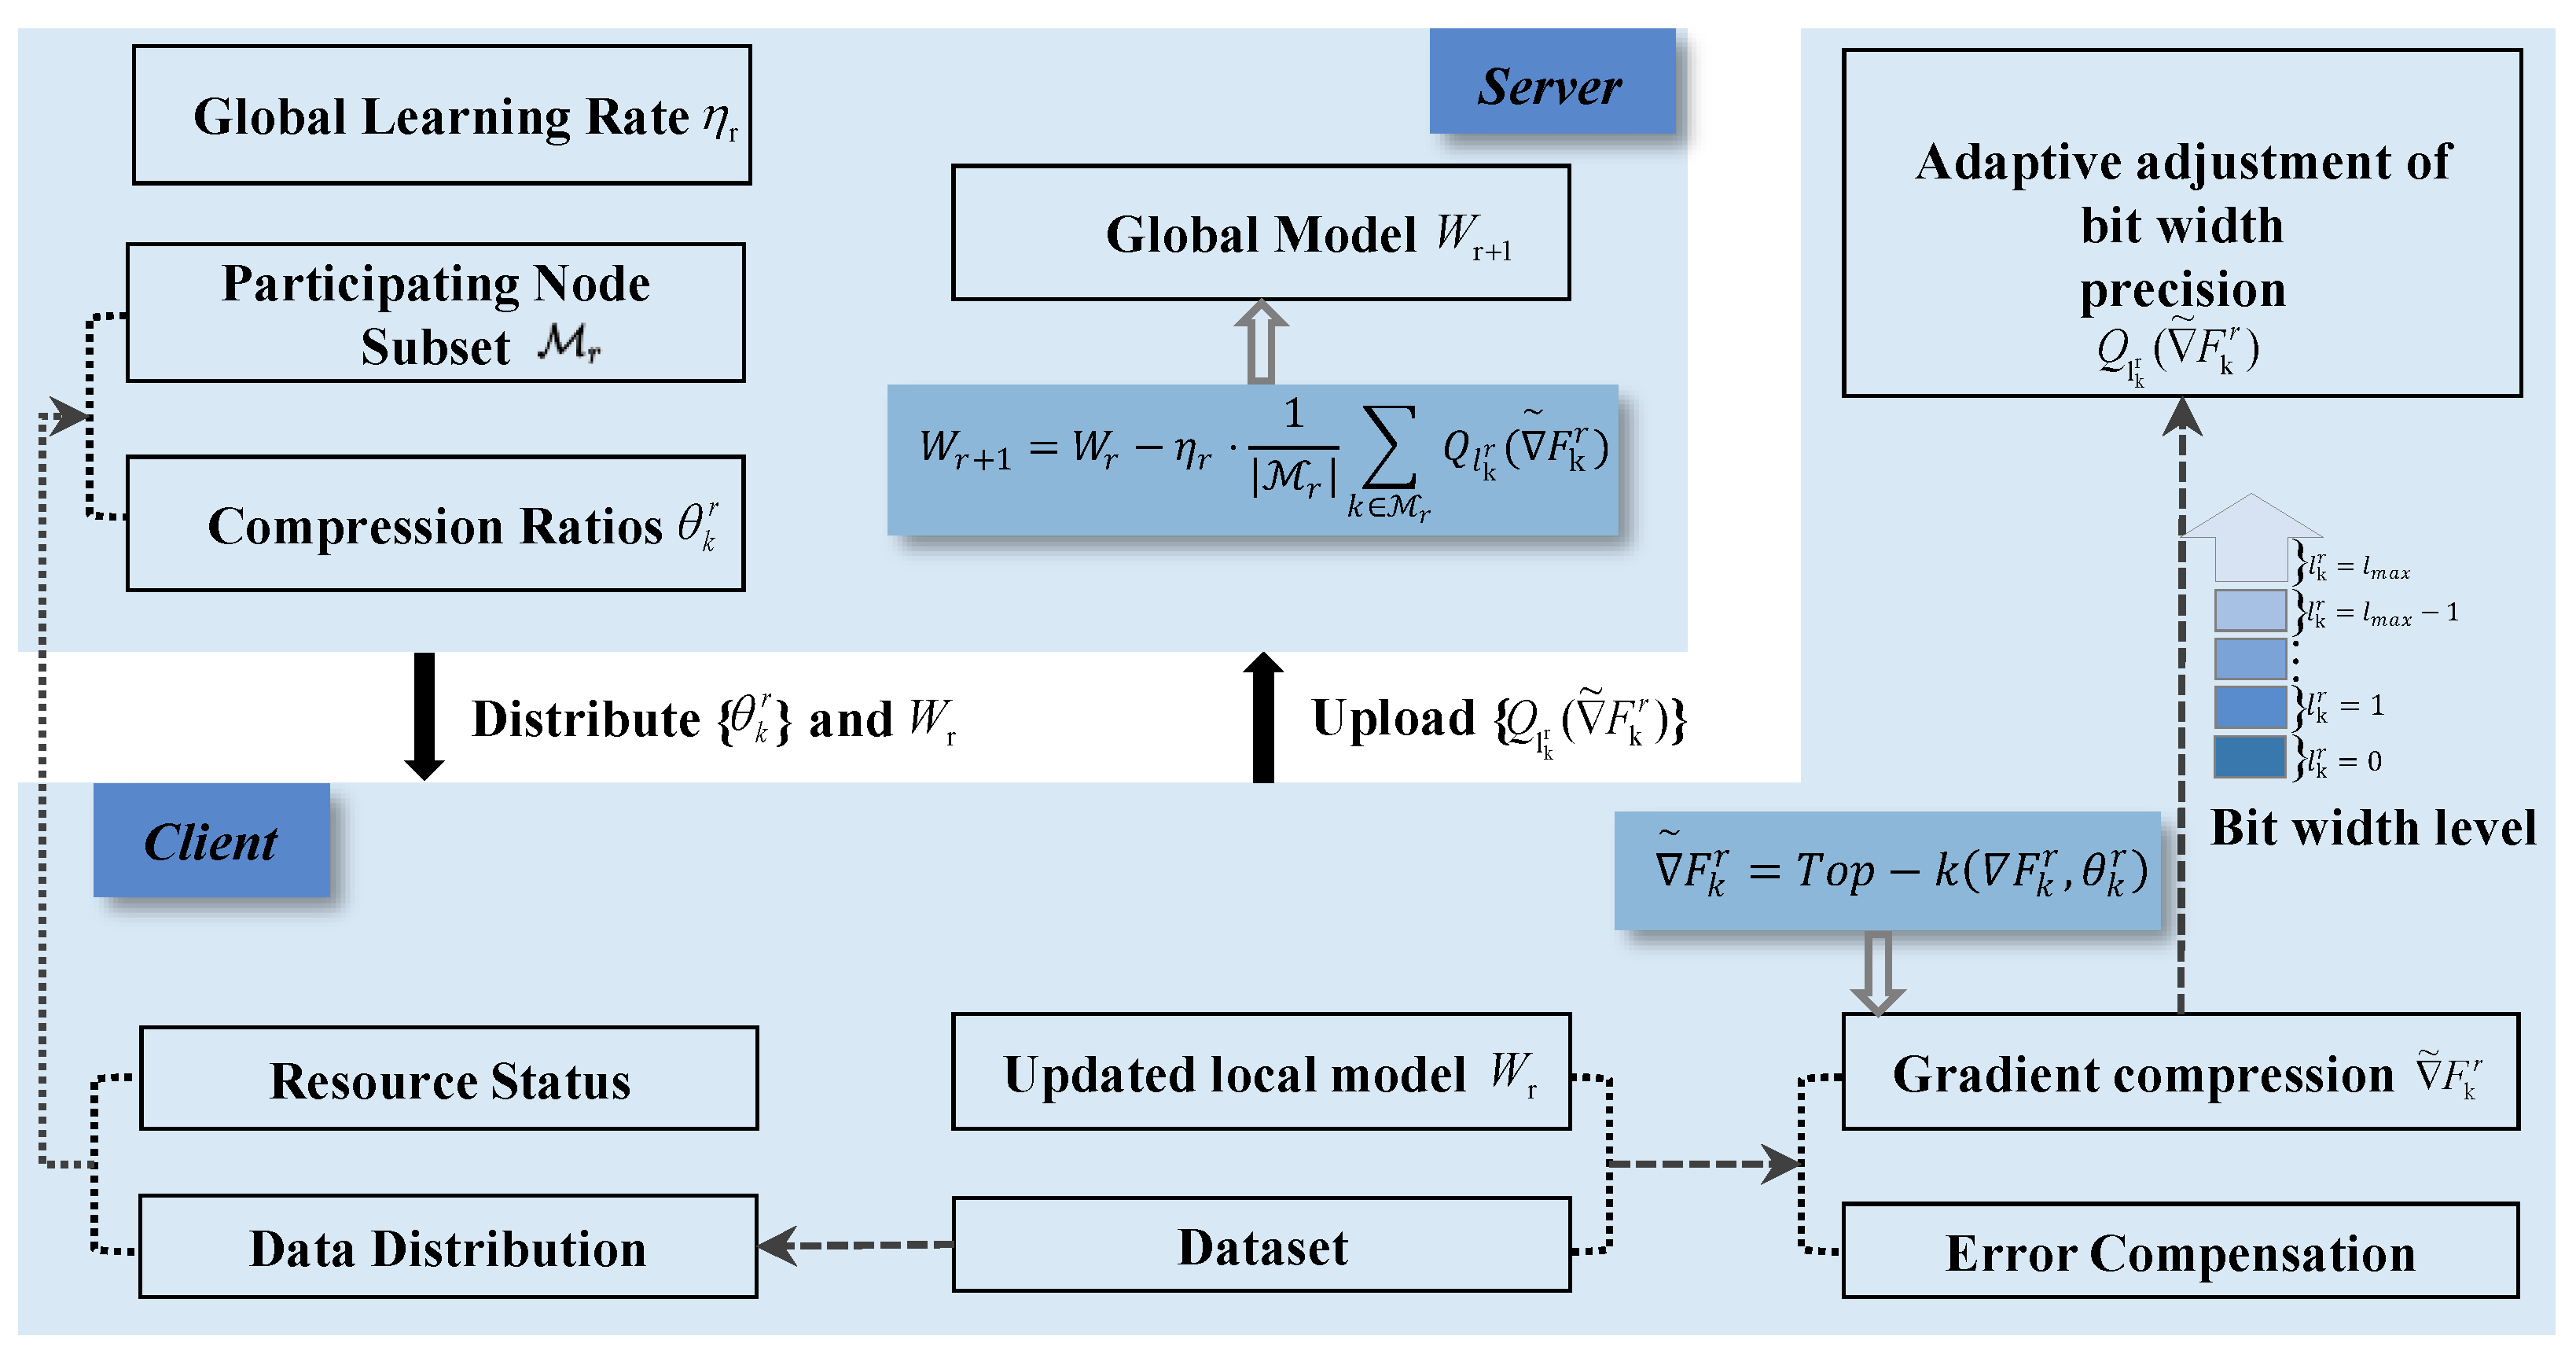
In the IoV environment, there is significant heterogeneity in the data distribution, data volume, and computing capability across node vehicles. Simply selecting participating nodes uniformly for federated learning can reduce training efficiency and affect the performance of the global model. To address this, this paper adopts the Q-FedCG federated aggregation strategy, which is specifically designed for resource-constrained scenarios. As shown in Figure 6, the working mechanism of Q-FedCG includes the following key steps.
First, in each round, the server dynamically selects a subset of nodes M r to participate in training based on the current resource status and local data distribution of each vehicle node, assigning each selected node an optimal gradient sparsification compression ratio θ k r . θ k r is modeled as a resource-constrained optimization problem, which can be solved by linear programming. The objective is to minimize the compression error while meeting system resource constraints. The optimization objective function is:
min θ k r k M k ( 1 θ k r ) E 2 F 2
The parameters are subject to the constraints i = 0 r 1 T i + ( R r ) T r < T , 0 < θ k r 1 , where E is the current number of local optimization iterations; F represents the gradient magnitude; T i denotes the communication cost of the i-th round; R is the total number of aggregation rounds. To eliminate the effects caused by differences in scale, both E and F are processed using min-max normalization, mapping them to the [0,1] interval before optimization. A larger value of E indicates more local training rounds, which implies higher resource consumption; a larger F signifies greater gradient fluctuation, indicating that the model has not fully converged. In the objective function 1 θ k r E 2 F 2 , the squared terms enhance the constraint on extreme nodes, ultimately facilitating a reasonable allocation of the compression ratio θ k r . This approach ensures the overall training performance while simultaneously considering system resource usage and model convergence. T r is the estimated cost of the current round, and T is the total resource budget. Based on this, the server distributes the global model parameters and the adaptive gradient sparsification compression ratio to the corresponding vehicles. In the actual implementation, this paper uses Python’s “scipy.optimize.linprog” function as the linear programming solver. The objective function and resource constraints are fed into the solver to obtain the optimal compression ratio allocation for each node in every round. Next, after local model training on each vehicle node, updates with low significance are transmitted with lower precision or even skipped entirely. The update significance is defined as the difference between the locally compressed gradient in the current round and the previously uploaded gradient, as shown below:
Q l max ˜ F k r Q l k r 1 ˜ F k r 1 2 Ψ r + 3 ε k r ( l max l k r + 1 ) 2 + 3 ε k r ( l max l k r + 1 ) 2
Ψ r = 1 η r 2 M 2 ( r 1 ) i = 1 r 1 W r + 1 i W r i 2
ε k r ( l ) = ˜ F k r Q l ( ˜ F k r )
˜ F k r represents the compressed gradient. Q l m a x ( ˜ F k r ) denotes the compressed gradient of client k quantized with the maximum bit width in the current round. Q l k r 1 ( ˜ F k r 1 ) is the quantized gradient uploaded by client k in the previous round. Ψ r is the sum of global model parameter updates in the previous r 1 rounds. η r denotes the global learning rate. M is the number of clients selected in each round. W r stands for the global model parameters. The term ε k r l measures the quantization error. According to the update significance, the gradients are assigned to different quantization levels l k r . Specifically, as the overall model update approaches convergence, Ψ r also decreases accordingly to adapt to the actual global learning dynamics in each round. Meanwhile, using three times the quantization error as a dynamic safety boundary effectively prevents the omission of too much important information. Therefore, when the change in local quantized gradients does not exceed this adaptive threshold and l k r = 0 , the update is considered to have very low significance and can safely skip transmission. The threshold in this method is set dynamically and adaptively, without the need for manually fixed values. During actual training, both Ψ r and the quantization error can be computed online in real time.
Finally, after collecting the heterogeneously compressed gradients uploaded by each node, the server performs normalization and weighted processing according to different quantization precisions, reducing the uncertainty in global model aggregation and ensuring continuous convergence to the optimum. The core advantage of the Q-FedCG strategy is that it allows clients to upload compressed gradients of varying sizes, which not only reduces communication overhead but also accommodates client heterogeneity. Furthermore, under non-Independent and Identically Distributed (non-IID) data, Q-FedCG can accelerate convergence to the target accuracy by up to 75.2% compared to FedAvg [32].

3.3.2. FedIFD Algorithm

This section describes the overall federated learning algorithm process. The server sends requests to selected clients to retrieve the initial global model parameters. Once the required minimum number of clients is reached, the server instructs the clients to begin local training. Subsequently, clients send their local model updates back to the server, which updates the global model using an aggregation strategy. Finally, the optimized model is distributed to all clients for testing and inference. This process is repeated between the server and clients until a certain number of rounds is reached. Algorithm 1 provides more information about the collaborative training for identifying false data injection attacks in IoV based on federated learning as proposed in this paper. Here, Q l k r ˜ F k r represents the compressed gradient after quantization to the specified bit-width. This result is what each client uploads to the server.
Algorithm 1 Federated Learning Framework for Vehicle Network Threat Detection
Input: 
Client pool N , Number of rounds R, Number of epochs E
Output: 
Global model W
  1:
[Server]
  2:
for r = 1 R do
  3:
    Select client subset M r from N
  4:
    Broadcast W r and compression ratios θ k r to each selected client k
  5:
    Collect quantized sparse gradients { Q l k r ( ˜ F k r ) } from M r
  6:
    Aggregate global model W r + 1 considering quantization levels and update
  7:
end for
  8:
[Client k M r ]
  9:
Receive θ k r and W r k W r
10:
for e = 1 E do
11:
    Train W r + 1 k on local data D k using ForwardPass
12:
    Compress gradient with error compensation and update error buffer
13:
    Quantize sparse gradient to obtain Q l k r ( ˜ F k r ) then send to server
14:
end for
15:
function ForwardPass( X time , X space )
16:
    Extract features: H time BiLSTM ( X time ) , H space Transformer ( X space )
17:
    Apply attention and fusion to pooled output: H fused Concat ( F time , F space )
18:
    Return y ^ Softmax ( Dense num _ labels ( H fused ) )
19:
end function

4. Experiments and Analysis

4.1. Overview of VeReMi Datasets

The VeReMi dataset [33] is a simulation dataset constructed by Heijden et al. based on the Luxembourg SUMO Traffic scenario using the VEINS and OMNET++ tools. It covers a variety of traffic environments, such as highways, urban roads, and streets, and is primarily used to analyze false data injection problems in IoV. It is the first publicly available and scalable dataset for VANET research. The dataset distinguishes between legitimate vehicles and attacker vehicles by assigning an attacker type value: legitimate vehicles have an attacker type of 0, while the five representative FDI attacks included are constant attack, constant offset attack, random attack, random offset attack, and eventual stop attack, represented by 1, 2, 4, 8, and 16, respectively (see Table 1 for details).
The dataset comprises 225 simulation runs, covering three levels of attack density and three levels of traffic density. Each vehicle receives log records of the periodic position updates generated by the SUMO simulation system, as well as the BSM information received from other vehicles, which includes each vehicle’s speed, receive timestamp, position, received signal strength, and other information. A “ground truth” file labels attacker behaviors.

4.2. Dataset Preprocessing

To approximate urban dense-communication scenarios and assess robustness under non-IID conditions, a high-traffic configuration of the VeReMi dataset is adopted. The 07:00–09:00 time window serves as the experimental subset. This configuration ensures sufficient sample size and introduces greater interference, thereby enabling a more stringent evaluation of model generalization in complex vehicle–road environments. The processing of this dataset is divided into four stages:
(1)
Data Parsing and Label Alignment: First, key features such as vehicle position, speed, reception time, and signal strength are extracted from the vehicle trajectory JSON log files. Next, each record’s ‘messageID’ in the log files is used as a key and matched with the ‘messageID’ in the ‘GroundTruthJSONlog.json’ file to determine the attack type for each record, thus achieving label alignment. Finally, by calculating the dynamic changes in trajectory data between two frames, including position and speed variations, the relative motion relationships between vehicles are captured.
(2)
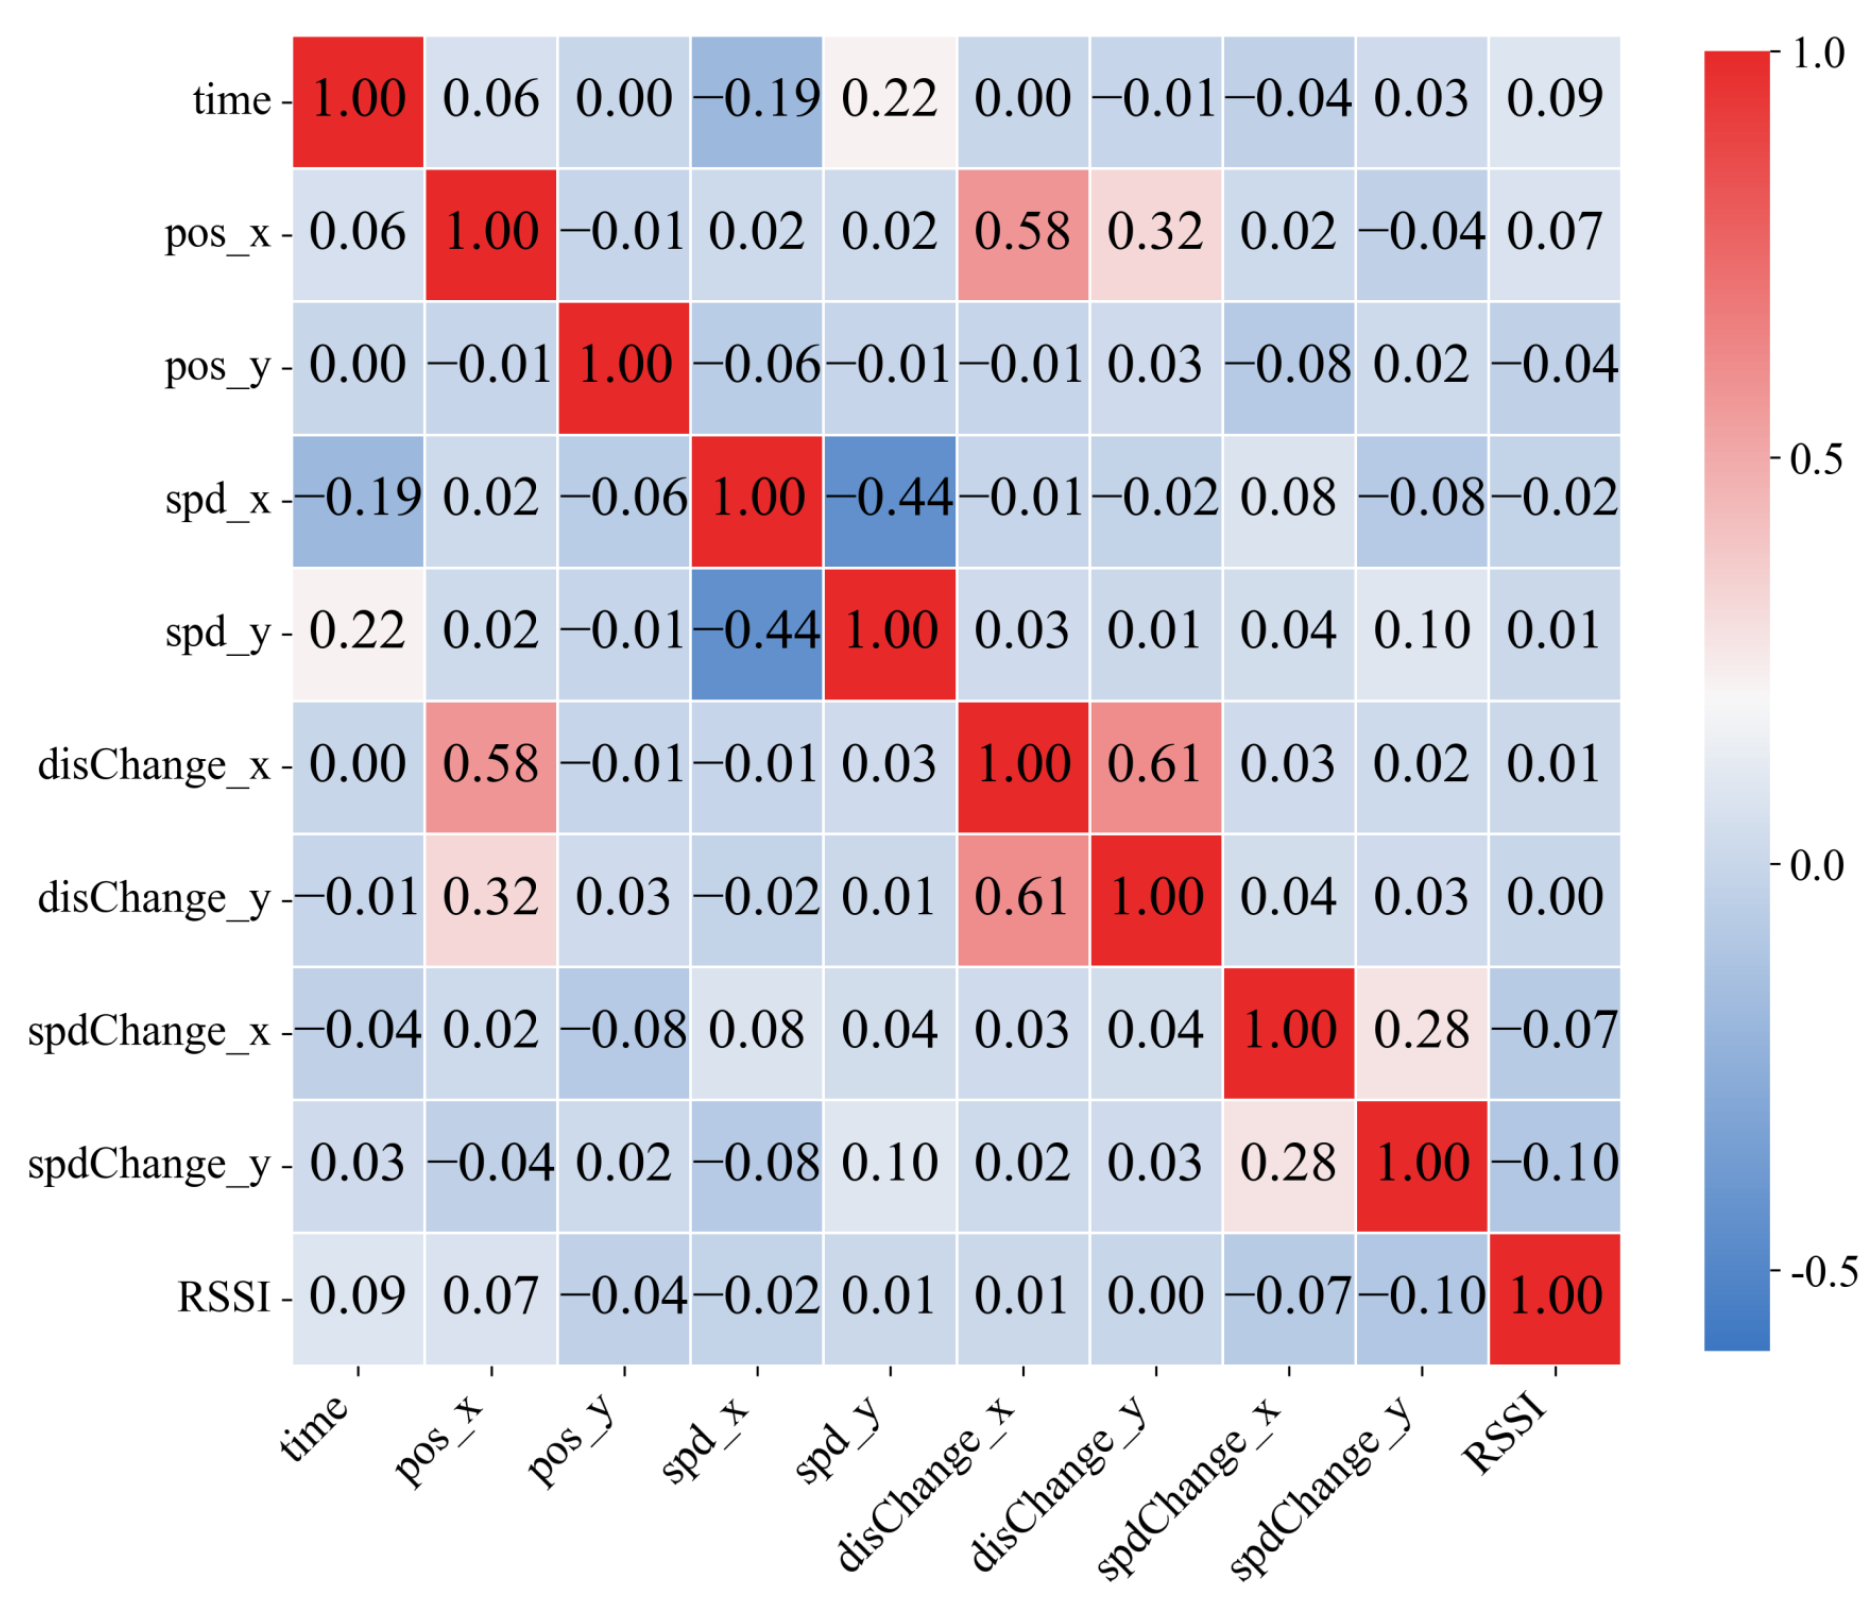
Data Cleaning and Feature Selection: Missing values in the dataset are filled using mean imputation, duplicate records are removed, and outliers are corrected. In total, 32,557,534 records are retained, with the ratio of benign to attack records being approximately 8:2, and the proportions of the five attack types are approximately 9:9:10:7:8. Next, the Pearson correlation coefficient was used to analyze the linear relationships between key vehicle features extracted from the original log files. As shown in Figure 7, the absolute values of the correlation coefficients for all feature pairs are below 0.7, which is well below the commonly used threshold of 0.8 for feature redundancy elimination. Therefore, no highly correlated features needing removal were identified in this study. In the subsequent experiments, the retained key features demonstrated good discriminative ability and model performance.
(3)
Normalization and One-Hot Encoding: The Z-score normalization method is applied to adjust all features to zero mean and unit variance, and labels are one-hot encoded to meet the requirements for subsequent model training.

4.3. Evaluating Indicator

To comprehensively analyze the detection performance of the model, T P , T N , F P , and F N represent true positive, true negative, false positive, and false negative, respectively. The following evaluation metrics were selected:
Accuracy = T P + T N T P + T N + F P + F N
Precision = T P T P + F P
Recall = T P T P + F N
F 1 score = 2 · Precision · Recall Precision + Recall
To further analyze the model’s performance on the imbalanced dataset, the confusion matrix, Receiver Operating Characteristic (ROC) curve, and Area Under the ROC Curve (AUC) were introduced as supplementary evaluation tools. The ROC curve is plotted with the false positive rate (FPR) on the x-axis and the true positive rate (TPR) on the y-axis. The closer the curve is to the upper left corner, the better the model’s performance. The AUC value is not affected by class distribution; the larger the AUC, the better the model’s performance in evaluating imbalanced datasets. The formulas for FPR and TPR are as follows:
FPR = F P T N + F P
TPR = T P T P + F N

4.4. Experiment Content

In terms of experimental design, to simulate a realistic federated learning scenario in IoV, the VeReMi vehicular communication dataset was selected as the benchmark data source. A distributed system architecture was constructed that includes multiple intelligent vehicle agents. The experimental environment and settings are summarized in Table 2.
In the overall experimental design, stratified sampling and balancing strategies are first used to divide the dataset into training and testing sets at a ratio of 8:2. This ensures scientific and representative training and evaluation. Then, each data subset is partitioned and assigned to different client nodes according to a non-IID strategy. This approach fully simulates the data imbalance in real vehicular networks and reflects the practical data distribution challenges in federated learning applications. In practical vehicular networks, factors such as the spatiotemporal differences in vehicle trajectories and the diversity of attack types cause the data collected by each terminal to naturally have different statistical distributions. This data heterogeneity is an unavoidable characteristic of the vehicular network environment. By using a non-IID allocation strategy, we can verify the robustness and generalization ability of the model under different data distributions, as well as analyze the adaptability of federated learning algorithms in handling data heterogeneity. From an application perspective, this experimental design can improve the deployment reliability of the model in real vehicular network environments. It enhances the system’s robustness when faced with data differences across regions and periods. This approach also provides a basis for client selection and resource allocation strategies, ensuring the quality of federated learning models in diverse application scenarios. Therefore, this experiment simulates the non-IID data distribution in real-world scenarios, narrowing the gap between laboratory research and engineering applications. It offers a practical reference for the actual deployment of federated learning systems in vehicular networks. During the model training and evaluation phase, five-fold cross-validation was further employed, in which the training set was divided into five subsets. In each round, one subset was used as the validation set while the remaining four subsets served as the training data. This process was repeated for five rounds, and the average of the evaluation metrics across all folds was taken as the final result to enhance the robustness and generalization of the model assessment.
The experiments are conducted with scenarios involving 1, 5, 10, and 20 clients to systematically evaluate the scalability and robustness of the model under different numbers of nodes. It is important to note that the analysis mainly focuses on the model performance with 5, 10, and 20 clients. The single-client scenario is used as a control group and compared with the multi-client results under the federated learning framework. This setup further validates the effectiveness of the proposed method in a federated learning environment. The communication configuration for federated learning adopts a combination of 10 rounds of global aggregation and 5 rounds of local training.
In terms of model structure, this study uses a spatiotemporal dual-branch output that is fused through feature integration. The fused features are then processed by two fully connected hidden layers to generate the final prediction results, with the number of neurons in these layers set to 256 and 128, respectively. This configuration is verified by multiple comparative experiments. A smaller hidden layer size (128/64) shows limited model capacity, while a larger configuration (512/256 or 1024/512) can improve the training set performance but tends to cause overfitting and significantly increase computational costs. Sensitivity analysis results indicate that the 256/128 configuration achieves the best balance between model expressiveness and overfitting prevention, and demonstrates optimal performance in all comprehensive metrics.
The default activation function for all network layers is ReLU. After feature fusion, BatchNorm is applied before the fully connected layer to normalize the data, preventing gradient vanishing or abnormal amplification during training. The adaptive attention mechanism operates on the 64 × 64 feature output space and uses fully connected, learnable weights to automatically adjust the importance of each channel feature. Specifically, a linear transformation is first applied to obtain the attention score for each feature dimension, followed by softmax normalization to distribute the weights. The resulting attention weights are then multiplied element-wise with the original features to achieve adaptive weighting, which enhances the model’s sensitivity to important spatiotemporal features and improves its expressive capability.
For hyperparameter settings, this study conducts systematic sensitivity tests on the learning rate, Dropout regularization parameter, and batch size. The learning rate experiments show that among 0.01, 0.005, 0.001, and 0.0005, 0.001 is the optimal choice. It avoids the instability caused by an excessively high learning rate and overcomes the slow convergence of a too-low learning rate, achieving the best trade-off between efficiency and performance. The Adam optimizer is used to ensure training stability and convergence efficiency. For the Dropout parameter, comparison among 0.2, 0.3, and 0.5 finds that 0.3 achieves the best balance between preventing overfitting and maintaining model expressiveness. Batch size experiments indicate that a value of 64 provides the most balanced training efficiency and model performance compared to 32 and 128.

4.4.1. Performance for FedIFD

As the number of clients participating in federated learning increases from 1 to 20, the FedIFD method shows significant performance improvement on the VeReMi dataset. The overall accuracy increases from 0.965 to 0.978, which means the model can correctly classify 0.977 of the samples and has excellent comprehensive classification ability. The overall precision increases from 0.964 to 0.975, which means the false positive rate of attack samples decreases to 2.5%. The overall recall rate increases to 0.977, confirming that the model can capture 97.7% of real attacks. The overall F1 score increases from 0.968 to 0.973, reflecting the enhanced balance of the model’s classification performance. The collaborative improvement of these indicators verifies the effectiveness of the proposed federated learning-based threat detection model for vehicle networks. Especially, as the number of clients increases, the Q-FedCG gradient compression algorithm achieves efficient aggregation of model parameters. The system can fully utilize the data features of distributed clients and continuously optimize threat detection performance while protecting vehicle data privacy.
To further ensure the statistical reliability of the performance evaluation results, this paper adopts a non-parametric Bootstrap resampling method to calculate symmetric bilateral 95% confidence intervals (CIs) for each core metric. Without any distribution assumption, B = 2000 Bootstrap resampling with replacement is performed to obtain the empirical distribution of statistics and calculate the percentiles. Specifically, for each client scale, the results of five independent experiments are used for Bootstrap sampling. The mean is calculated for each resampled set. The 2.5% and 97.5% percentiles of the sequence of sample means are taken as the lower and upper limits of the confidence interval. The detailed steps are as follows: For each client scale, B = 2000 Bootstrap samples are generated by resampling with replacement from the m = 5 repeated experimental results. The Bootstrap sample set is denoted as X b = { x b , 1 , x b , 2 , , x b , m } , where b = { 1 , 2 , , B } . The mean is calculated for each Bootstrap sample set. After sorting the B estimated statistics, the percentiles are selected.
θ ^ b = 1 m i = 1 m x b , i
CI 95 % = θ ^ ( B × 0.025 ) , θ ^ ( B × 0.975 )
Here, θ ^ q represents the q-th percentile value after sorting. Table 3 shows the upper and lower bounds of the confidence interval when the number of clients is 20. Taking 20 clients as an example, the 95% confidence intervals of FedIFD for accuracy, precision, recall, and F1 score are [0.974, 0.982], [0.970, 0.980], [0.972, 0.982], and [0.968, 0.978], respectively. The ranges are narrow and at a high level, which further demonstrates the statistical significance of the performance improvement and the robustness of the results.
To deeply analyze the internal mechanism of model performance improvement, this study conducts a detailed evaluation of the experimental results under different client scales from three aspects: (1) analysis of the precision, recall, and F1 score for each label; (2) classification behavior analysis based on the confusion matrix; (3) comprehensive evaluation of ROC curve and AUC value.
(1) In terms of the performance of each class, different attack types show differentiated improvement characteristics. This demonstrates the technical advantages of the spatio-temporal dual-branch parallel architecture. The time step T = 10 in this process can effectively capture the attack behavior cycle in the IoV environment. It also avoids the loss of temporal information caused by a too short time window, and prevents noise interference caused by a too long time window.
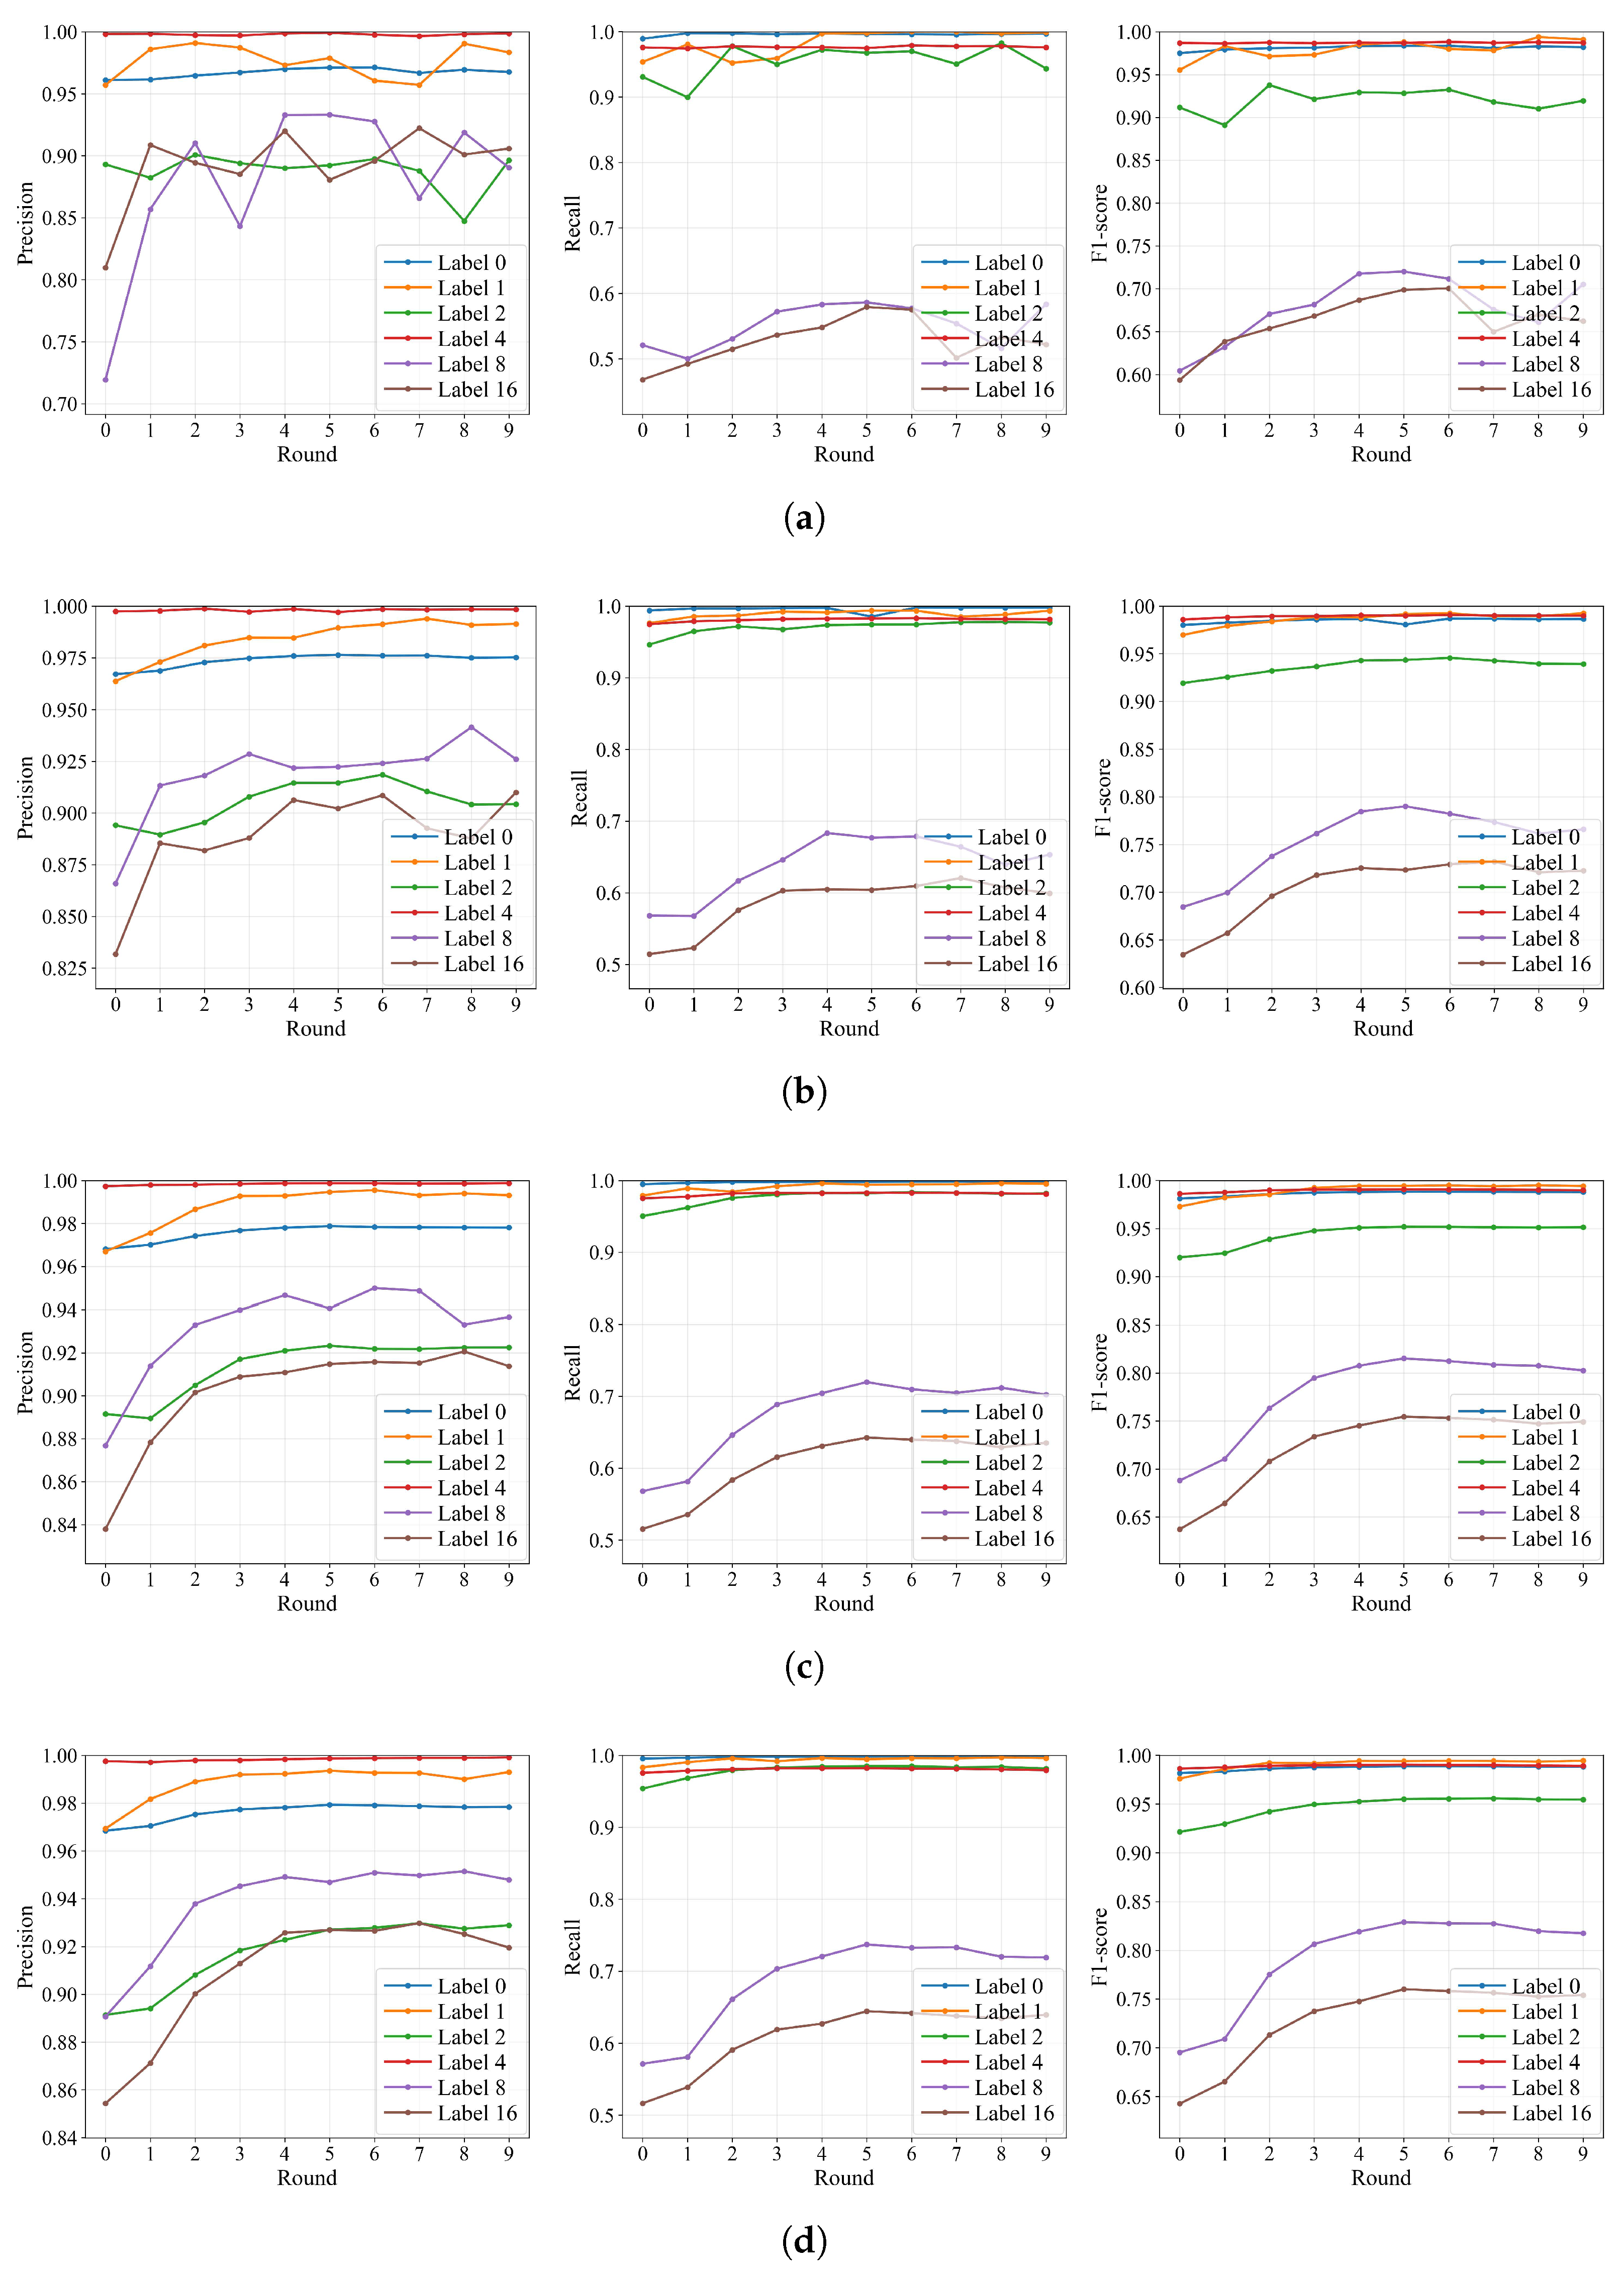
Specifically, as shown in Figure 8, the precision of the benign samples represented by Label 0 can increase from 0.965 to 0.98, and the recall rate is close to 1. The F1 score remains above 0.97, which indicates that the model has very high reliability in recognizing normal traffic. For more common attack types, namely Label 1, Label 2, and Label 4, the model shows excellent detection ability. Label 1 represents fixed-position attacks. Since it shows an obvious static feature in the time window, the precision can converge to above 0.992 as the number of clients increases, and the F1 score gradually stabilizes at 0.983. The precision of attack sample classification for Label 2 can increase from an unstable state under single-client training to 0.928, the recall rate can reach 0.986, and the F1 score gradually stabilizes at 0.953. This indicates that the model captures the drift trajectory pattern through the temporal branch and analyzes the positional inconsistency through the spatial branch. As the amount of data increases, the model can effectively identify the attack. The recall and F1 score of Label 4 always remain at about 0.987, indicating that the model effectively detects position jumps and spatial relationship anomalies. The model can not only detect effectively under the single-client scenario, but also further stabilize detection performance under the multi-client scenario.
The performance improvement for the more complex attack types, Label 8 and Label 16, is more significant. The recall rate of the random offset attacks represented by Label 8 increases from 0.584 to 0.746, and the F1 score rises from 0.718 to 0.834. For Label 16, the precision stabilizes at 0.929 after an initial unstable state, the recall rate gradually stabilizes at 0.648, and the F1 score gradually stabilizes at 0.754. This significant improvement shows that the identification features of these attacks need to be effectively captured through multi-client data aggregation. The dynamic attention mechanism in the 64 × 64 feature fusion weight matrix strengthens the expression of key features in diverse data. These experimental results verify that federated learning can improve the generalization ability of the model by aggregating data from more clients without requiring clients to transmit raw data, thus protecting data privacy. The spatio-temporal dual-branch architecture can better distinguish different attack patterns in diverse data. The adaptive weighting mechanism significantly improves the identification accuracy for complex attacks when data richness increases.
(2) The confusion matrix heatmap further reveals the classification characteristics of the model. Figure 9 shows the test results of randomly selected clients under different numbers of clients. Specifically, the misclassification rates of Label 0, Label 1, Label 2, and Label 4 are all below 3%, demonstrating good classification stability. However, some Label 8 attack samples are misclassified as Label 0 or Label 2. This occurs because random offset attacks may exhibit features similar to normal behavior or a fixed offset in certain time windows. Label 16 attack samples are mainly misclassified as Label 0, reflecting the similarity between the attack stopping at the final stage and normal behavior in the early stage. Through complete temporal analysis within the time window T = 10 , the model can better distinguish these complex attacks from normal behavior and other attack types. As the number of federated learning clients increases and the training data becomes richer, this problem can be significantly alleviated.
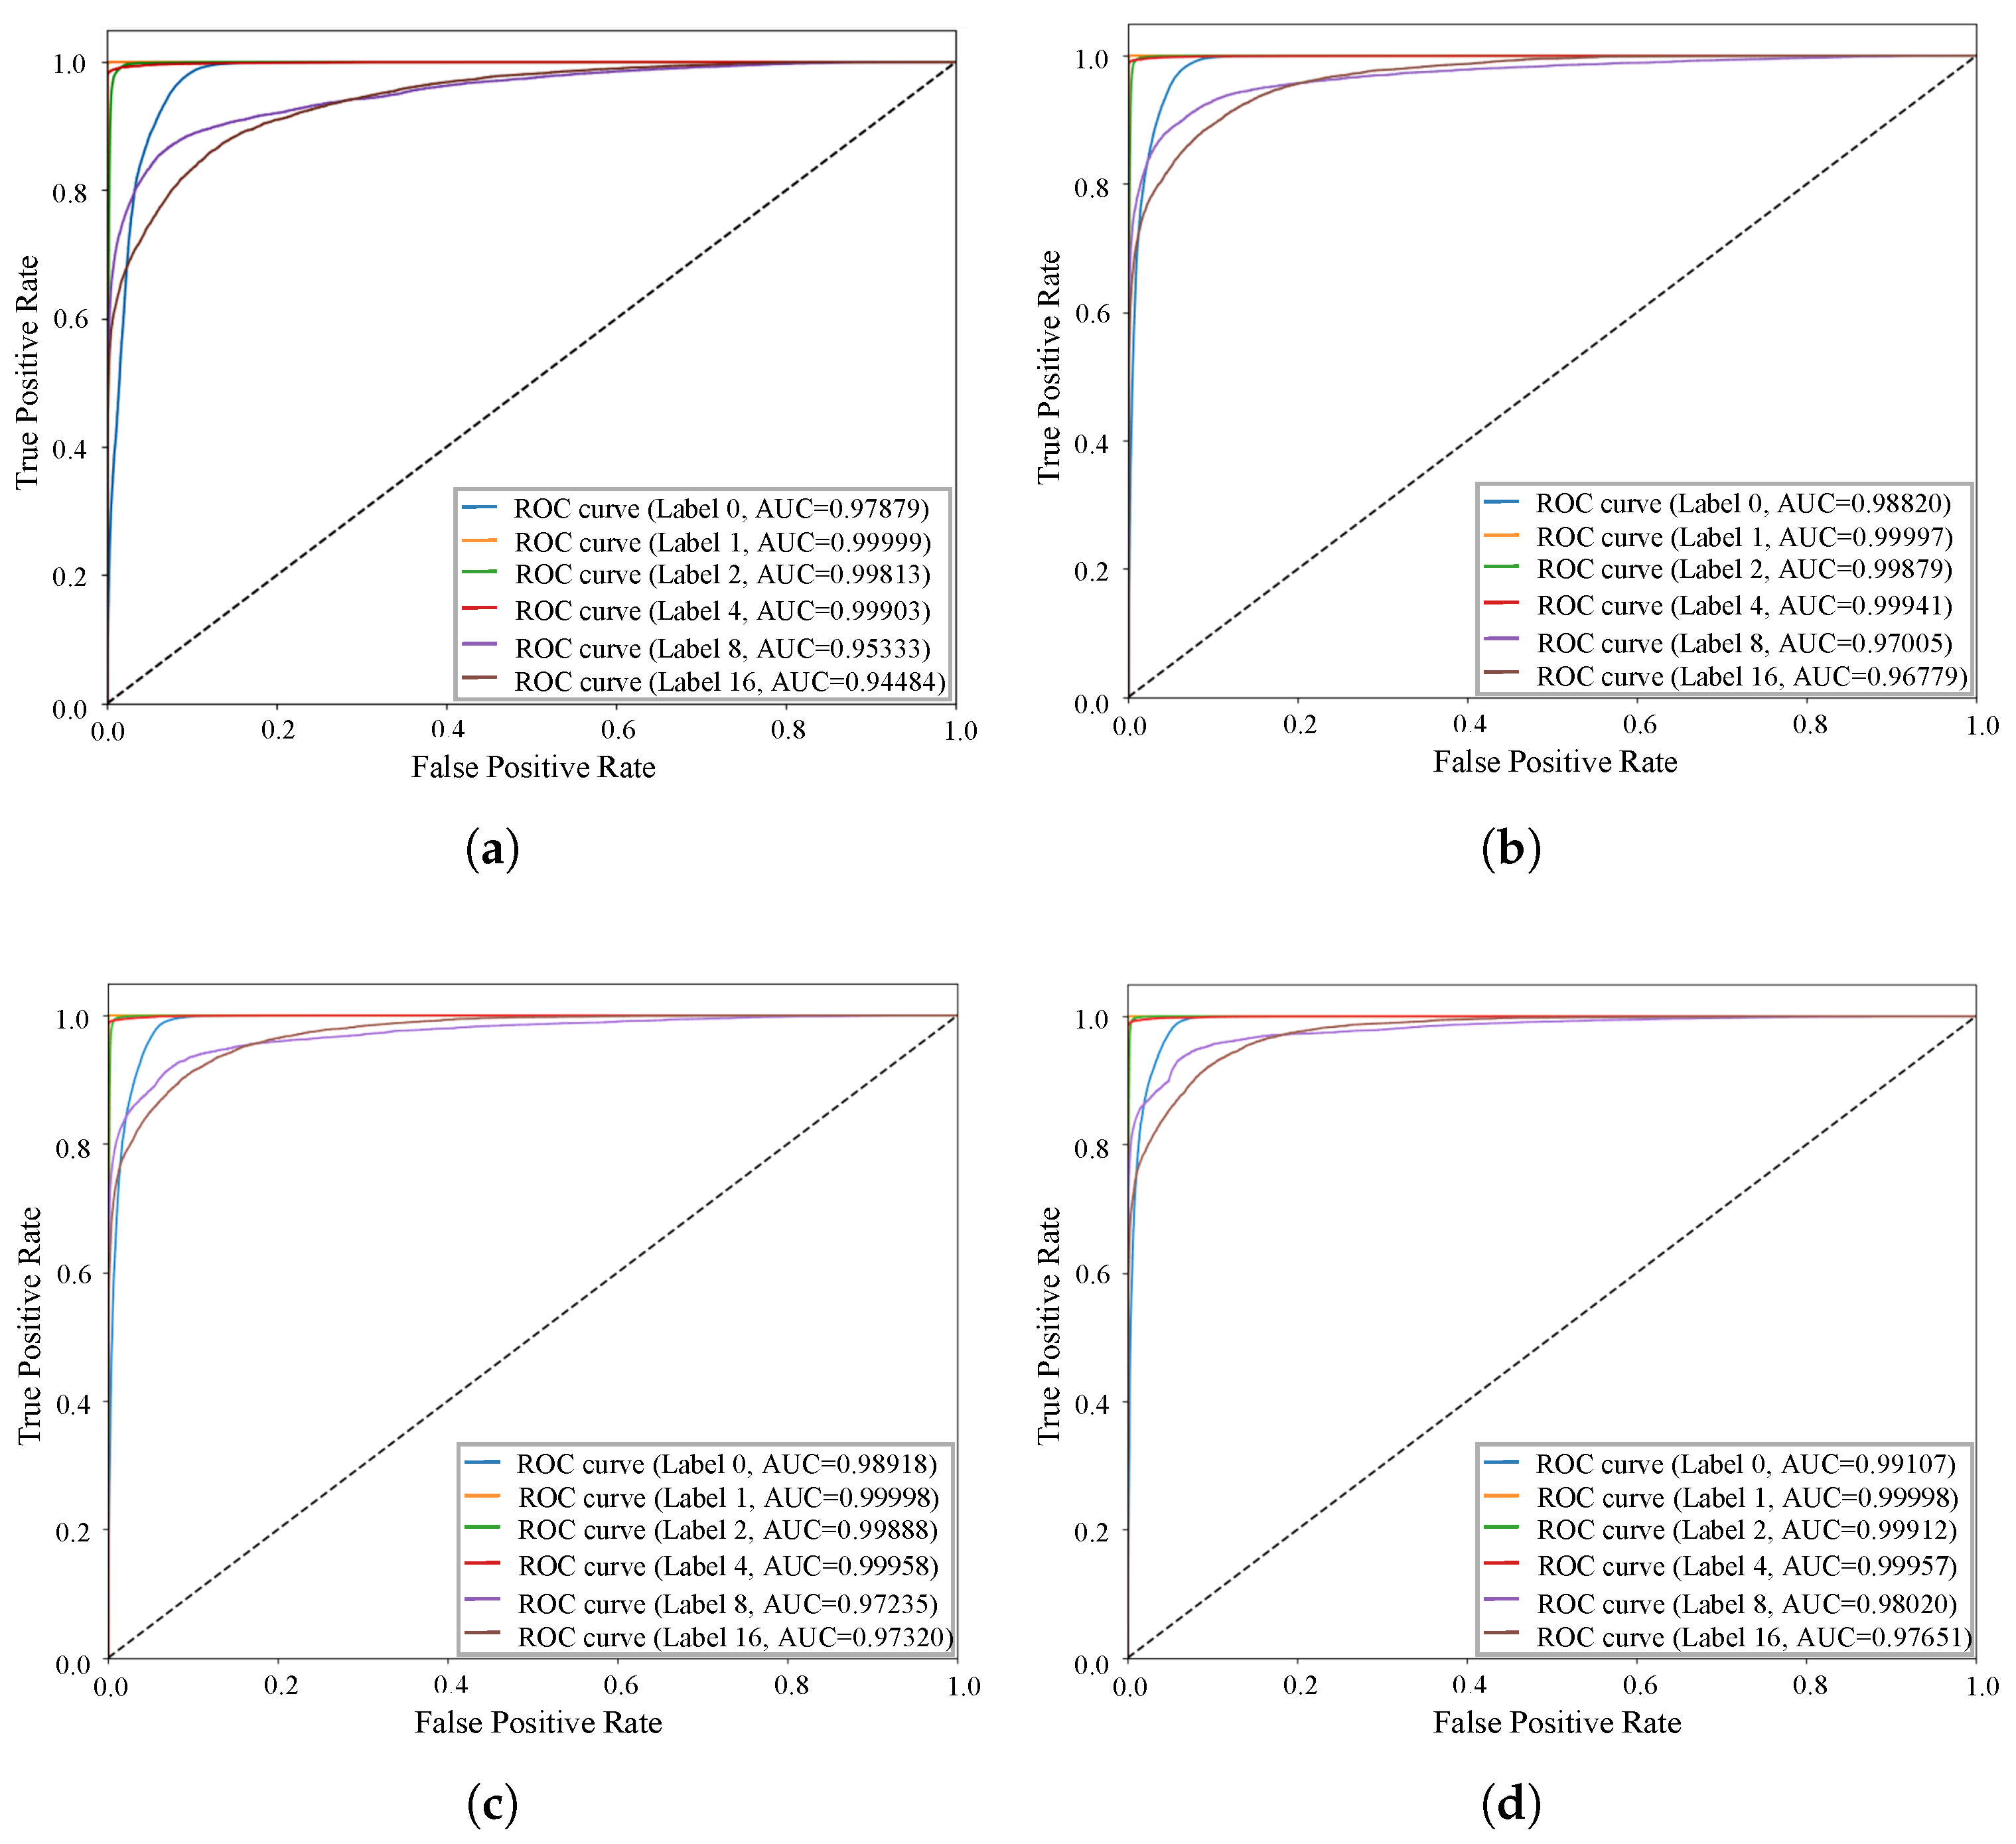
(3) The analysis of ROC curves and AUC values further quantifies the improvement in the model’s discriminative capability. As shown in Figure 10, with the increase in the number of clients participating in federated learning, the ROC curves for each class generally shift toward the upper left corner, indicating higher TPR and lower FPR. This directly demonstrates a systematic improvement in both missed and false detections. Correspondingly, the AUC values for each class increase overall, reflecting that the spatio-temporal dual-branch architecture with a time window setting of T = 10 achieves optimal extraction of attack features and enhances class separability. For Label 8 and Label 16, which have fewer data and weaker initial performance, their AUC values increase significantly by more than 0.03. This result proves the technical advantages of the FedIFD method in handling complex attack patterns: specifically, it can identify the random offset pattern of Label 8 through comprehensive spatio-temporal feature analysis, and for final stop attacks, the model can accurately capture the temporal features indicating a behavioral shift.

4.4.2. Ablation Experiment

To verify the effectiveness of the key design components in the proposed method, this study conducted systematic ablation experiments, focusing on the evaluation of three core technical innovations: (1) the performance advantage of the parallel BiLSTM and Transformer architecture in spatio-temporal feature extraction; (2) the effectiveness of the dimension-level feature weighting mechanism in the FedIFD method; and (3) the advantages of the Q-FedCG strategy compared with traditional federated learning aggregation methods. The detailed analysis is as follows:
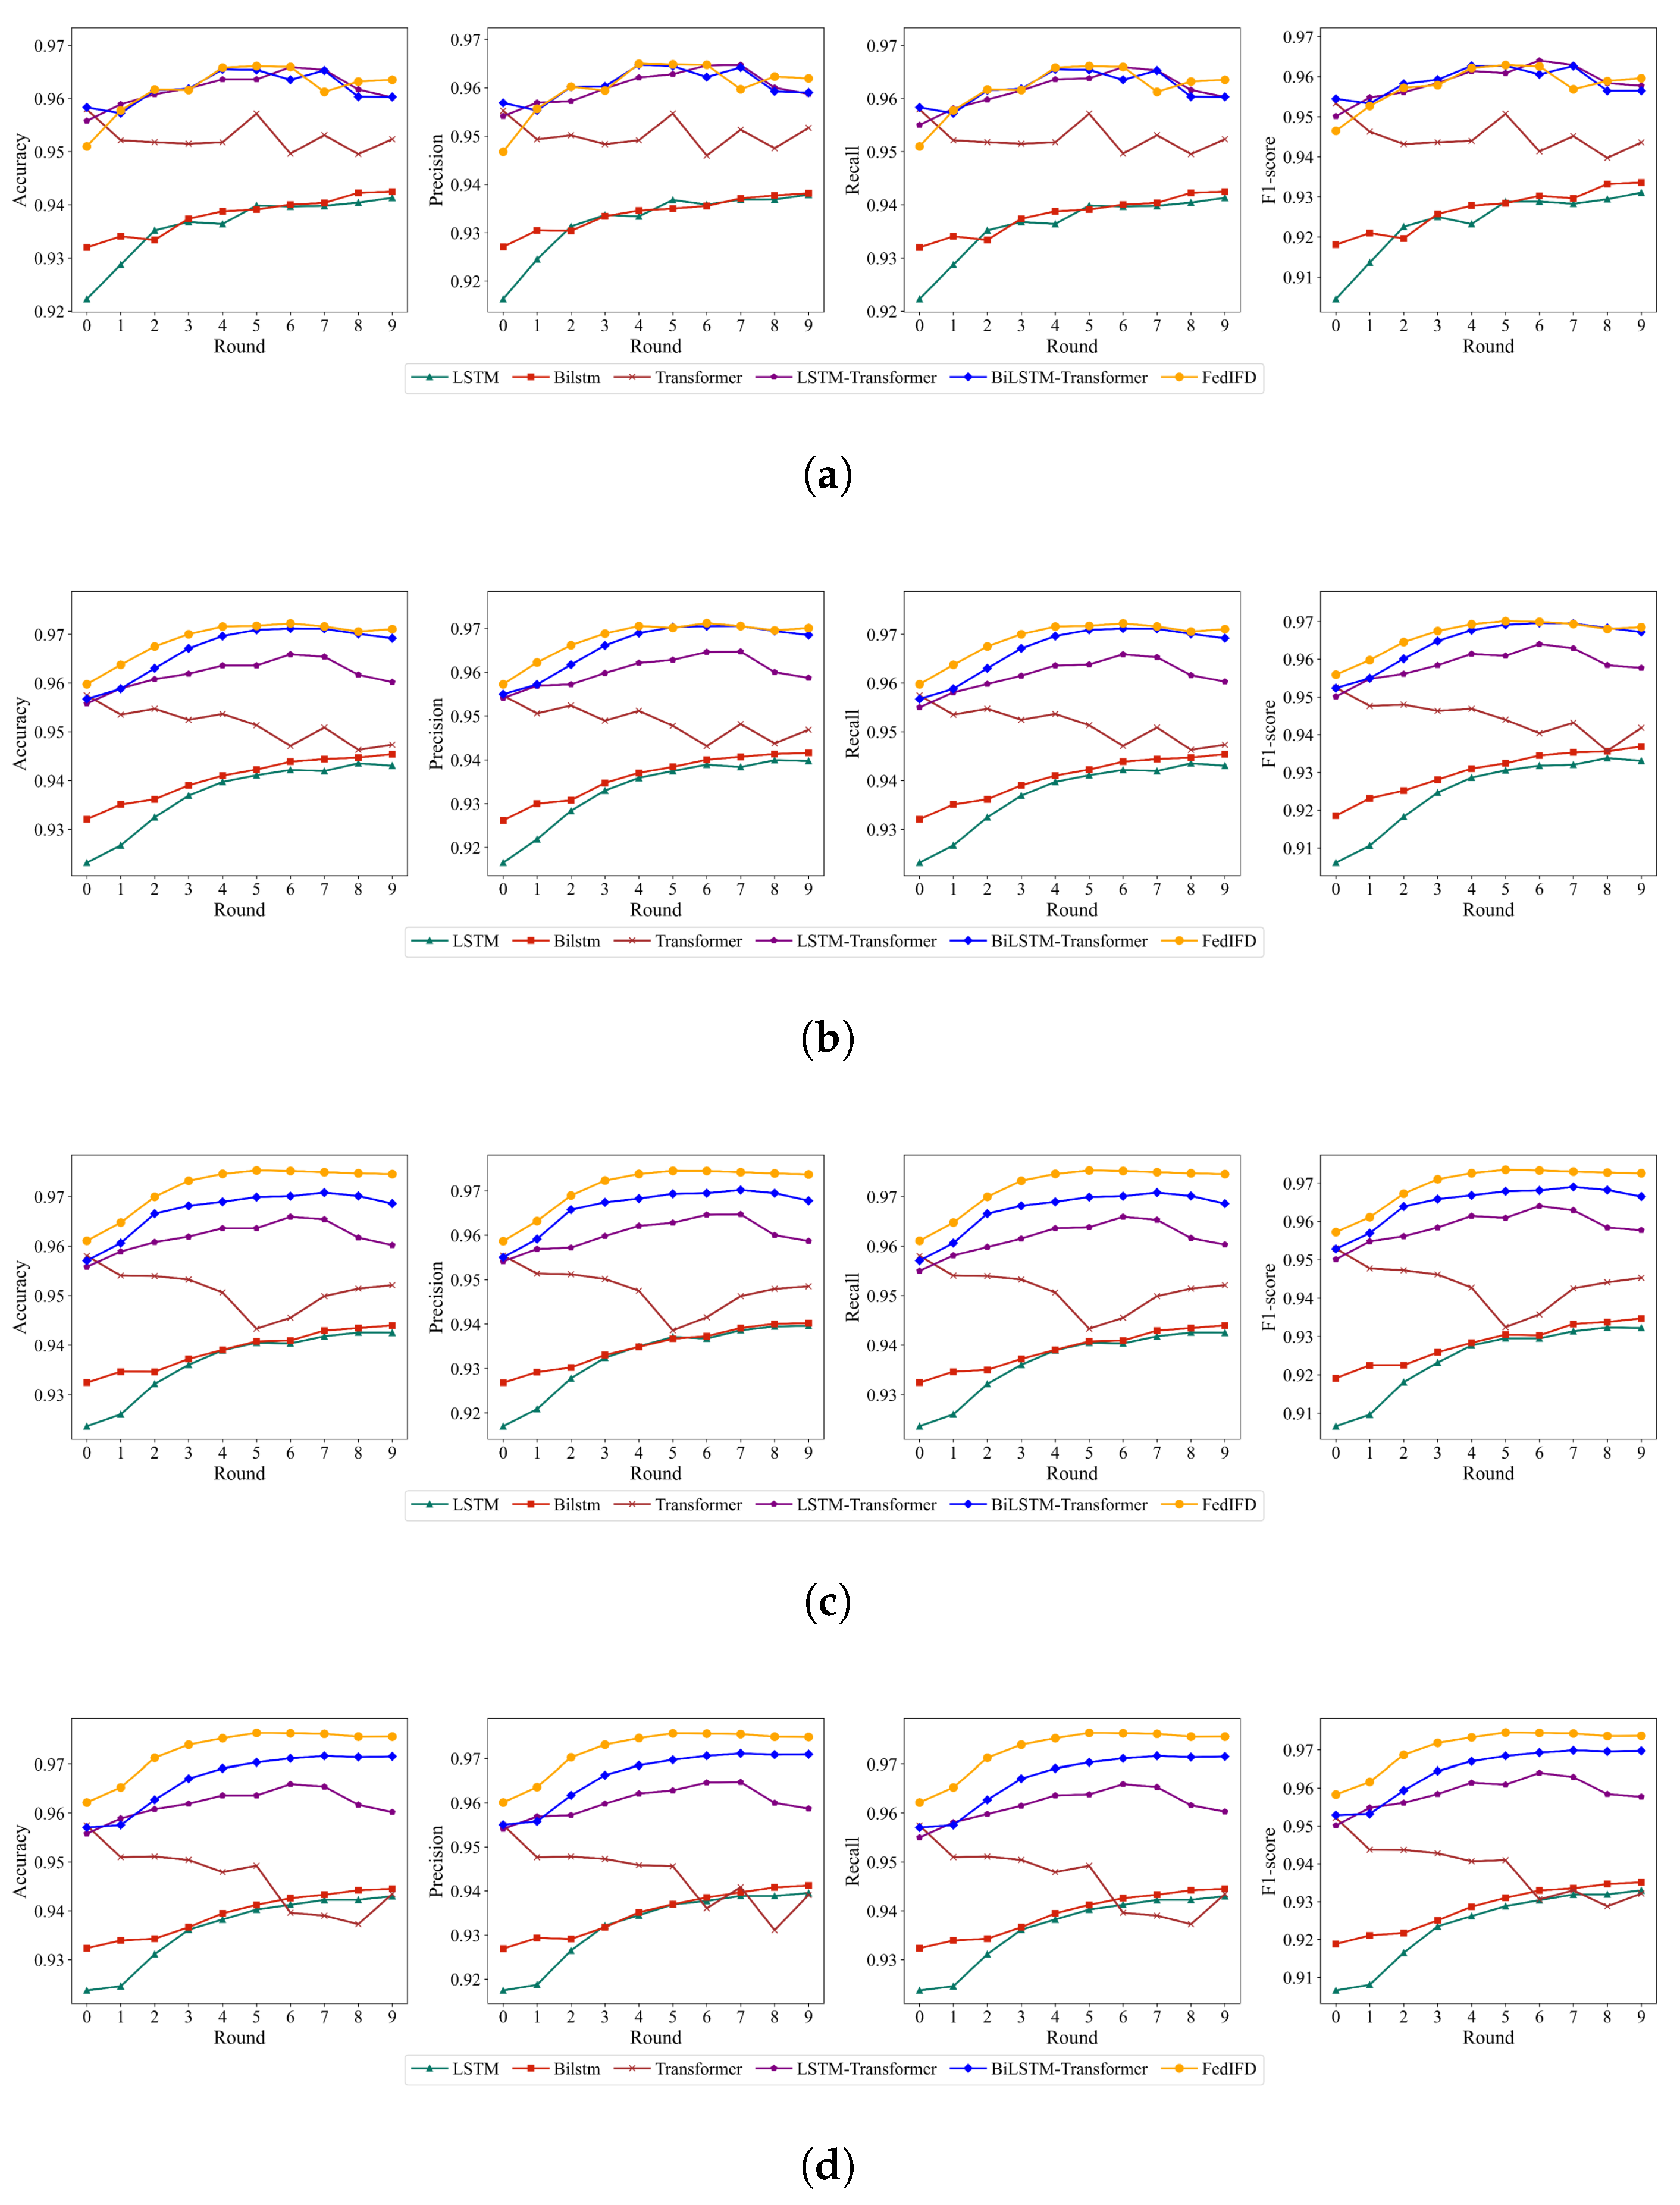
(1) In terms of validating the effectiveness of the architectural design, the experimental results shown in Figure 11 indicate that the BiLSTM-Transformer parallel architecture significantly outperforms single models (LSTM, BiLSTM, or Transformer) in accuracy, precision, recall, and F1 score, achieving performance improvements of 0.02 to 0.04. In addition, this architecture requires only 3–4 rounds of federated aggregation to converge to a stable state, while comparison methods require more than 10 rounds without reaching the same performance level, fully demonstrating the computational efficiency of the parallel architecture. Further comparison with the LSTM–Transformer parallel architecture reveals that when the number of clients is small, the performance of BiLSTM–Transformer is similar to that of LSTM–Transformer; however, as the client scale increases, the former outperforms the latter by approximately 0.01 on all metrics. This indicates that bidirectional temporal modeling provides stronger adaptability to diverse data distributions.
The main reason for the above performance differences lies in the modeling limitations of single-feature extraction methods. Specifically, using only the Transformer provides strong spatial feature extraction capabilities, but its significant training fluctuations indicate insufficient modeling of local temporal patterns. The unidirectional LSTM can only capture historical information and cannot leverage future contextual states. On the other hand, using only BiLSTM for temporal feature extraction lacks the complement of spatial features, resulting in an unsatisfactory training effect. In contrast, the BiLSTM–Transformer parallel architecture proposed in this paper has three major advantages: First, the bidirectional temporal modeling capability enables the BiLSTM to capture both forward and backward information flows, constructing a comprehensive temporal context representation, especially suitable for complex attack sequences with bidirectional dependencies in IoV. Second, spatial–temporal synergy is achieved as the lightweight Transformer supplements the capability to model spatial relationships, compensating for the shortcomings of pure temporal models. Finally, the feature fusion ability of parallel architecture allows it to efficiently extract highly generalizable shared features even when there are large differences in client data distributions, thereby reducing the number of aggregation rounds required for convergence.
(2) Regarding the validation of the effectiveness of the dimension-level feature weighting mechanism, the experimental results show differentiated performance related to the scale of the clients. As illustrated in Figure 11, when the number of clients is small, the performance gap between FedIFD (with dimension-level weighting) and the unweighted BiLSTM–Transformer solution is minimal, and the latter can reach a similar level by one additional round of aggregation. However, as the number of clients increases to 20, the advantage of FedIFD becomes more pronounced, with the differences in various metrics increasing to 0.005. This is because in small-scale data scenarios, the local data distributions among clients are relatively similar, and the importance differences among feature dimensions are minor, so the benefit of the weighting mechanism is limited. However, in large-scale data scenarios, data heterogeneity across clients increases—for example, different vehicles may experience different attack patterns. This enables the dimension-level weighting mechanism to adaptively emphasize more discriminative feature dimensions while mitigating the impact of noisy or irrelevant dimensions, thereby enhancing the model’s robustness.
Figure 12 shows the cumulative training time required for each model to reach the specified accuracy threshold under different numbers of clients. It can be observed that FedIFD achieves high accuracy performance in all client configurations. Especially as the number of clients increases, FedIFD demonstrates a more obvious advantage when using accuracy as the evaluation metric for model training. However, compared to single-branch models, FedIFD requires slightly more training time to reach the same accuracy threshold. This reflects the increased training complexity brought by the integration of spatiotemporal feature fusion and adaptive mechanisms in the model. At the same time, it can be seen from the figure that the cumulative training time required by FedIFD to achieve the same accuracy is always lower than that of BiLSTM–Transformer. This highlights that FedIFD provides higher training efficiency while maintaining detection performance. The fundamental reason for this performance advantage lies in the adaptive feature dimension weighting mechanism introduced by FedIFD. This mechanism uses a 64 × 64 weight matrix to dynamically weight the outputs of the spatial–temporal dual-branch feature fusion. It enables dimension-level differentiated attention, allowing the model to more effectively emphasize and capture key threat features, thus improving detection efficiency and discrimination ability. Moreover, although the adaptive feature dimension weighting mechanism enhances feature representation and convergence speed, it is implemented in a highly parallel and lightweight manner. This does not significantly increase the overall network complexity or computational burden, effectively avoiding training bottlenecks caused by excessive parameters and redundant computations. Therefore, FedIFD can achieve high accuracy while further reducing the total training time, demonstrating excellent practical value and cost-effectiveness.
(3) In a highly heterogeneous Internet of Vehicles, there are clear differences between nodes in data distribution, data volume, and computational power. These differences limit the efficiency of federated learning and the performance of the global model. Traditional aggregation methods like FedAvg use a simple weighted average of local model parameters from each client. While this is easy to implement and has low communication cost, it cannot adapt well to data and resource heterogeneity. FedProx adds a regularization term to help deal with some heterogeneity, but it still has limitations in very heterogeneous settings. FedNova introduces normalization techniques and local iteration correction mechanisms to better handle differences in client computational capabilities and improve convergence stability. Compared to FedAvg and FedProx, FedNova shows better adaptation to heterogeneity, but its optimization for communication efficiency remains limited.
To solve these problems, the paper uses the Q-FedCG aggregation strategy. Q-FedCG can dynamically select which nodes join each training round, based on their local data characteristics and available resources. It also assigns an optimal gradient compression ratio to each node. By adaptively adjusting the gradient compression precision and using weighted aggregation, Q-FedCG reduces communication overhead and helps reduce uncertainty caused by node heterogeneity. As shown in Figure 13, we compare the effect of different aggregation strategies in the FedIFD framework under various client sizes (1, 5, 10, 20). The results show that Q-FedCG achieves better accuracy, precision, recall, and F1 score than FedAvg, FedProx, and FedNova in all cases. While FedNova demonstrates improved performance compared to traditional methods, Q-FedCG’s advantages are even more pronounced. This advantage comes from Q-FedCG’s ability to aggregate high-quality information, improve adaptation to edge data, and use communication and computation resources more efficiently. In summary, Q-FedCG effectively improves federated learning performance in IoV, and it has good scalability and practical value.

4.4.3. Work Comparison

To validate the advancement of the proposed method, several representative federated learning approaches from existing research were selected and evaluated under the same federated learning environment as the method presented in this paper. The experiments were conducted with a client configuration of 10. Uprety et al. [25] employed an Artificial Neural Network (ANN) as the local vehicle model for misbehavior detection; Mansouri et al. [34] designed a CW-RNN local model architecture consisting of two GRU layers and a fully connected layer with a softmax activation function; Ahsan et al. [35] proposed combining federated learning with BERT for intrusion detection in VANET; Campos et al. [36] developed a Multilayer Perceptron (MLP) model for local training, which was optimized through grid search and employed SMOTE-Tomek for class balancing. Table 4 shows the attack detection performance of federated learning using these four models. It can be seen that the overall accuracy and precision of the FedIFD method reached 0.97, which is an improvement of 0.04 to 0.17 compared to the other methods. The overall recall reached 0.97, exceeding the other methods by 0.04 to 0.11. These experimental results validate the superiority of the FedIFD method, indicating that its spatiotemporal parallel architecture and dimension-level feature weighting mechanism can effectively reduce false positive rates and missed detection risks in vehicular network threat detection scenarios.
A further fine-grained analysis focuses on the detection performance for the five attack categories in the VeReMi dataset. As shown in Table 5, the precision of FedIFD for all attack categories consistently remains above 0.93. For Label 8 and Label 16, which have relatively few samples and more complex attack patterns, FedIFD achieves the best precision compared to the other three methods. This advantage is mainly attributed to the setting of a time window T = 10 , which provides optimal temporal granularity for capturing the complete feature evolution of different attack types. Moreover, the dual-branch spatio-temporal parallel architecture adopted by FedIFD enables effective extraction of both the temporal evolution patterns and spatial distribution characteristics of attack behaviors. The dimension-level adaptive feature weighting mechanism further enhances the representation of key discriminative features for complex attack patterns through the dynamic attention computation of a 64 × 64 weight matrix. This shows that when facing different security threats, the model can adaptively focus on the relationships between key features and adjust their importance weights. In this way, it can more effectively and specifically detect and identify attack behaviors. This multi-level technical integration enables FedIFD to maintain excellent detection precision even for complex attack types with scarce samples.
As shown in Table 6, the recall comparison results indicate that the FedIFD method is particularly outstanding on the major attack categories. The recall for Label 1 reaches 1.00, while the recalls for Label 2 and Label 4 are 0.99, representing a remarkable improvement of over 30% compared to the ANN and CW-RNN methods. Compared with FL-BERT, FedIFD demonstrates more stable and higher detection capability. Even compared to the next-best MLP model, recall for these three labels is noticeably higher. However, for attack types Label 8 and Label 16, the recall is relatively lower. The main reasons are twofold: first, in terms of data distribution, Label 8 and Label 16 have a relatively small sample proportion, and the lack of sufficient training instances hampers the model’s ability to learn the characteristics of these attacks, causing the federated aggregation and gradient update processes to be dominated by majority classes; Secondly, from the perspective of attack characteristics, these two attack types represent random offset attacks and eventual stop attacks, respectively. Their behavioral features include abrupt, unanticipated position jumps and instantaneous, dramatic changes in vehicle speed. These patterns are more complex and covert than others and exhibit significant feature differences compared to other attack categories, making it difficult for the model to effectively capture their key discriminative characteristics when sample sizes are limited. Despite this challenge, the recall rates for these two types can be further improved by increasing the number of clients, which demonstrates that the federated learning framework can address this issue by expanding the scale and diversity of training data.

4.5. Limitations of the Study

Although the FedIFD method proposed in this paper demonstrates significant advantages in the task of detecting false data injection attacks in the Internet of Vehicles, it still has certain boundary conditions and limitations that require further exploration and improvement in future research. Meanwhile, it is necessary to clarify its most suitable application scenarios and computational efficiency characteristics to guide practical deployment decisions.
(1)
Gap Between Experimental Assumptions and Real-World Conditions. First, regarding communication anomalies commonly found in the Internet of Vehicles—such as packet loss, delays, node disconnections, and data corruption—this study assumes that in typical scenarios involving such anomalies, vehicle nodes can ensure that local training results are eventually and effectively aggregated into the global model through methods like retries, data caching, or uploading at a later time. If a node remains offline for an extended period, its update is simply excluded from the current global aggregation process and does not affect the overall aggregation workflow. However, in real deployment, if there is a long-lasting high packet loss rate or severe latency—especially when attacks and network problems occur at the same time, such as attacks combined with poor communication to avoid detection—the global model’s detection performance can drop a lot. This can affect the model’s ability to recognize complex attacks (such as Label 8 and Label 16). In addition, the experiments mainly use one VeReMi simulation dataset to study five common attack types. The study assumes that data across different clients are similar and of good quality. However, simulation data cannot fully capture the complex changes, noise, and variety found in real vehicular networks. In real-world scenarios, data and attack patterns may be highly unbalanced due to different locations and driving behaviors. Also, the experiments only test a limited number of attack types. The study has not included more complex or newer attacks like Sybil attacks and replay attacks. This means the model’s performance may not fully show how well it works against real threats. To address these limitations, future research will incorporate real or hybrid vehicular network data and expand experiments to cover more diverse, collaborative, and stealthy attack scenarios. This will help to systematically improve the practicality and robustness of our approach and better meet real-world application needs. We will also consider extending our work by using models such as CNN, GNN, and Graph Transformer as future baselines.
(2)
Analysis of Computational Efficiency and Resource Consumption. The FedIFD approach improves detection performance while achieving a relative balance between accuracy and computational cost through careful design. It also enhances model training efficiency to some extent. However, this integrated multi-module structure inevitably increases the overall computational complexity. On vehicle terminals or RSUs with limited computing resources, the added computational load may lead to inference delays and deployment limitations. Therefore, the trade-off between model efficiency and accuracy must consider the resource constraints of real deployment environments. Further validation on edge devices is still needed to evaluate the efficiency in practical scenarios.
(3)
Privacy and Robustness Considerations. Although federated learning preserves the privacy of raw data, risks such as gradient inversion and membership inference attacks may still occur during collaborative training across clients. These attacks can be used to infer sensitive distribution features or whether an individual sample participated in training. In addition, when there are malicious or compromised clients, Byzantine attacks and poisoning attacks may arise. These can contaminate the global model, resulting in significant performance degradation, manipulated predictions, or even privacy data leakage. To address these issues, future work will focus on two directions: first, exploring differential privacy to protect uploaded gradients by adding carefully tuned noise that mitigates gradient inversion and membership inference attacks while keeping training stable, thereby preventing the leakage of sensitive information from individual clients; second, investigating a reputation-based mechanism to identify and exclude malicious nodes by tracking client behavior, update quality, and consistency to compute trust scores, flagging and isolating nodes with abnormally low or declining scores, and excluding their updates during aggregation to enhance robustness against Byzantine and poisoning attacks.
Based on experimental results, statistical significance analysis, and the above discussion of limitations, it is clear that the FedIFD method is mainly suitable for the following application scenarios: Firstly, it is well-suited for critical IoV systems with high security requirements. This includes application environments that demand high accuracy and low false positive rates, such as autonomous vehicle safety control systems, fleet management systems, and intelligent transportation infrastructure. Experimental results show that FedIFD significantly outperforms baseline methods in identifying complex attack types (such as Label 8 and Label 16), which is especially important in safety-critical applications. Secondly, FedIFD is suitable for high-end in-vehicle systems with relatively ample computing resources. Modern intelligent connected vehicles equipped with high-performance onboard computing platforms can provide the hardware support required by the FedIFD method, ensuring that the additional computational demands result in inference delays that remain within an acceptable range. Finally, FedIFD is also suitable for connected vehicle fleets operating under stable communication conditions. In scenarios such as urban roads or highways, where communication is relatively reliable, effective aggregation of model parameters can be ensured, allowing the advantages of federated learning to be fully realized. Meanwhile, in scenarios that require higher privacy or stronger defense against threats, security strategies such as secure aggregation and differential privacy can be applied in future work to achieve better privacy protection and enhanced resistance to attacks.

5. Conclusions and Future Work

This paper proposes a federated learning-based method called FedIFD for detecting false data injection attacks in IoV. The method constructs a spatio-temporal two-branch parallel feature extraction architecture for vehicle local models based on a federated learning framework, captures temporal dependencies through a three-layer stacked BiLSTM, extracts global spatial features in conjunction with a lightweight Transformer, and designs an adaptive dimension-level feature weighting mechanism to achieve dynamic fusion of key features. At the same time, the method uses the Q-FedCG algorithm to compress gradients and realize efficient global model aggregation. This ensures detection performance and effectively adapts to the limited computational resources of vehicles. Future work will focus on the following aspects: First, to address the non-IID data distribution in vehicular networks, more adaptive federated aggregation mechanisms will be designed. For instance, aggregation weights can be dynamically assigned based on node characteristics and previous model performance. The generalization improvement of these methods will be systematically evaluated on real traffic datasets containing diverse attack types and data distributions. Second, a node trust evaluation framework will be developed. This will involve introducing anomaly detection and a points-based penalty mechanism to identify and dynamically isolate potential malicious or abnormal nodes. Related experiments will be performed on a federated learning simulation platform, simulating multi-node heterogeneous environments to assess the impact on overall security and robustness. Finally, considering the demand for lightweight and real-time models in vehicular edge computing, model pruning and knowledge distillation techniques will be combined to develop efficient attack detection models suitable for heterogeneous devices. Metrics such as accuracy, latency, and resource consumption will be tested under different hardware conditions to verify practical performance.

Author Contributions

Conceptualization, H.W. and J.Y.; methodology, H.W., J.Y. and J.S.; software, J.Y.; validation, J.S. and Z.W.; formal analysis, Q.L. and S.L.; investigation, H.W. and J.Y.; resources, H.W.; data curation, J.Y.; writing—original draft preparation, J.Y.; writing—review and editing, J.S.; visualization, Z.W. and S.L.; supervision, H.W.; project administration, Q.L.; funding acquisition, H.W. and Z.W. All authors have read and agreed to the published version of the manuscript.

Funding

This work was supported in part by the National Natural Science Foundation of China under Grant 62562006, the Natural Science Foundation of Guangxi Zhuang Autonomous Region under Grant 2024GXNSFAA010242, Guangxi Education Department Program 2025KY0343, and in part by Guangxi Key Research and Development Program Projects under Grant GuiKe AB24010309.

Data Availability Statement

The data that support the findings of this study are publicly available in the VeReMi dataset, which can be accessed at https://github.com/VeReMi-dataset/VeReMi (accessed on 8 December 2024).

Conflicts of Interest

Shaoxuan Luo was employed by Liuzhou Huating New Energy Technology Co., Ltd. The remaining authors declare that the research was conducted in the absence of any commercial or financial relationships that could be construed as a potential conflict of interest.

Abbreviations

The following abbreviations are used in this manuscript:
IoVInternet of Vehicles
FLFederated Learning
BSMBasic Safety Messages
BiLSTMBidirectional Long Short-Term Memory
FDIFalse Data Injection
ICTInformation and Communication Technology
GDPRGeneral Data Protection Regulation
RSURoad-Side Units
VANETVehicle Ad Hoc Network
RNNRecurrent Neural Networks
LSTMBidirectional Long Short-Term Memory
GRUGated Recurrent Unit
GATGraph Attention Network
CNNConvolutional Neural Network
ReLURectified Linear Unit
DNNDeep Neural Network
FNNFeed-forward Neural Network
non-IIDNon-Independent and Identically Distributed
HFLHorizontal Federated Learning
CIConfidence Interval
ROCReceiver Operating Characteristic
AUCArea Under the ROC Curve
TPRTrue Positive Rate
FPRFalse Positive Rate
ANNArtificial Neural Network
MLPMultilayer Perceptron

References

  1. Biroon, R.A.; Biron, Z.A.; Pisu, P. False data injection attack in a platoon of CACC: Real-time detection and isolation with a PDE approach. IEEE Trans. Intell. Transp. Syst. 2021, 23, 8692–8703. [Google Scholar] [CrossRef]
  2. He, N.; Ma, K.; Li, H.; Li, Y. Resilient self-triggered model predictive control of discrete-time nonlinear cyberphysical systems against false data injection attacks. IEEE Intell. Transp. Syst. Mag. 2023, 16, 23–36. [Google Scholar] [CrossRef]
  3. Ahmad, F.; Kurugollu, F.; Adnane, A.; Hussain, R.; Hussain, F. MARINE: Man-in-the-middle attack resistant trust model in connected vehicles. IEEE Internet Things J. 2020, 7, 3310–3322. [Google Scholar] [CrossRef]
  4. Chen, C.; Hui, Q.; Xie, W.; Wan, S.; Zhou, Y.; Pei, Q. Convolutional Neural Networks for forecasting flood process in Internet-of-Things enabled smart city. Comput. Netw. 2021, 186, 107744. [Google Scholar] [CrossRef]
  5. Mahmood, M.R.; Matin, M.A.; Sarigiannidis, P.; Goudos, S.K. A comprehensive review on artificial intelligence/machine learning algorithms for empowering the future IoT toward 6G era. IEEE Access 2022, 10, 87535–87562. [Google Scholar] [CrossRef]
  6. Laghrissi, F.; Douzi, S.; Douzi, K.; Hssina, B. Intrusion detection systems using long short-term memory (LSTM). J. Big Data 2021, 8, 65. [Google Scholar] [CrossRef]
  7. Nguyen, M.T.; Kim, K. Genetic convolutional neural network for intrusion detection systems. Future Gener. Comput. Syst. 2020, 113, 418–427. [Google Scholar] [CrossRef]
  8. Chen, R.; Chen, X.; Zhao, J. Private and utility enhanced intrusion detection based on attack behavior analysis with local differential privacy on IoV. Comput. Netw. 2024, 250, 110560. [Google Scholar] [CrossRef]
  9. Yan, H.; Ma, X.; Pu, Z. Learning dynamic and hierarchical traffic spatiotemporal features with transformer. IEEE Trans. Intell. Transp. Syst. 2021, 23, 22386–22399. [Google Scholar] [CrossRef]
  10. Wang, Z.; Wang, Q.; Deng, W.; Guo, G. Learning multi-granularity temporal characteristics for face anti-spoofing. IEEE Trans. Inf. Forensics Secur. 2022, 17, 1254–1269. [Google Scholar] [CrossRef]
  11. Taslimasa, H.; Dadkhah, S.; Neto, E.C.P.; Xiong, P.; Ray, S.; Ghorbani, A.A. Security issues in Internet of Vehicles (IoV): A comprehensive survey. Internet Things 2023, 22, 100809. [Google Scholar] [CrossRef]
  12. Regulation, P. Regulation (EU) 2016/679 of the European Parliament and of the Council. Regulation 2016, 679, 2016. [Google Scholar]
  13. Zeng, Y.; Qiu, M.; Zhu, D.; Xue, Z.; Xiong, J.; Liu, M. DeepVCM: A deep learning based intrusion detection method in VANET. In Proceedings of the 2019 IEEE 5th Intl Conference on Big Data Security on Cloud (BigDataSecurity), IEEE Intl Conference on High Performance and Smart Computing,(HPSC) and IEEE Intl Conference on Intelligent Data and Security (IDS), Washington DC, USA, 27–29 May 2019; IEEE: Piscataway, NJ, USA, 2019; pp. 288–293. [Google Scholar]
  14. Chhabra, R.; Singh, S.; Khullar, V. Privacy enabled driver behavior analysis in heterogeneous IoV using federated learning. Eng. Appl. Artif. Intell. 2023, 120, 105881. [Google Scholar] [CrossRef]
  15. Ilango, H.S.; Ma, M.; Su, R. A misbehavior detection system to detect novel position falsification attacks in the internet of vehicles. Eng. Appl. Artif. Intell. 2022, 116, 105380. [Google Scholar] [CrossRef]
  16. Anyanwu, G.O.; Nwakanma, C.I.; Lee, J.M.; Kim, D.S. Novel hyper-tuned ensemble random forest algorithm for the detection of false basic safety messages in internet of vehicles. ICT Express 2023, 9, 122–129. [Google Scholar] [CrossRef]
  17. Zhu, K.; Chen, Z.; Peng, Y.; Zhang, L. Mobile edge assisted literal multi-dimensional anomaly detection of in-vehicle network using LSTM. IEEE Trans. Veh. Technol. 2019, 68, 4275–4284. [Google Scholar] [CrossRef]
  18. Zhou, H.; Kang, L.; Pan, H.; Wei, G.; Feng, Y. An intrusion detection approach based on incremental long short-term memory. Int. J. Inf. Secur. 2023, 22, 433–446. [Google Scholar] [CrossRef]
  19. He, C.; Xu, X.; Jiang, H.; Jiang, J.; Chen, T. Cyber-attack detection for lateral control system of cloud-based intelligent connected vehicle based on BiLSTM-Attention network. Measurement 2025, 247, 116740. [Google Scholar] [CrossRef]
  20. Nguyen, T.P.; Nam, H.; Kim, D. Transformer-based attention network for in-vehicle intrusion detection. IEEE Access 2023, 11, 55389–55403. [Google Scholar] [CrossRef]
  21. Gu, K.; Ouyang, X.; Wang, Y. Malicious Vehicle Detection Scheme Based on Spatio-Temporal Features of Traffic Flow Under Cloud-Fog Computing-Based IoVs. IEEE Trans. Intell. Transp. Syst. 2024, 25, 11534–11551. [Google Scholar] [CrossRef]
  22. Li, X.; Hu, L.; Lu, Z. Detection of false data injection attack in power grid based on spatial-temporal transformer network. Expert Syst. Appl. 2024, 238, 121706. [Google Scholar] [CrossRef]
  23. Cheng, P.; Han, M.; Li, A.; Zhang, F. STC-IDS: Spatial–temporal correlation feature analyzing based intrusion detection system for intelligent connected vehicles. Int. J. Intell. Syst. 2022, 37, 9532–9561. [Google Scholar] [CrossRef]
  24. Xing, L.; Wang, K.; Wu, H.; Ma, H.; Zhang, X. Intrusion detection method for internet of vehicles based on parallel analysis of spatio-temporal features. Sensors 2023, 23, 4399. [Google Scholar] [CrossRef] [PubMed]
  25. Uprety, A.; Rawat, D.B.; Li, J. Privacy preserving misbehavior detection in IoV using federated machine learning. In Proceedings of the 2021 IEEE 18th Annual Consumer Communications & Networking Conference (CCNC), Las Vegas, NV, USA, 9–12 January 2021; IEEE: Piscataway, NJ, USA, 2021; pp. 1–6. [Google Scholar]
  26. Lv, P.; Xie, L.; Xu, J.; Wu, X.; Li, T. Misbehavior detection in vehicular ad hoc networks based on privacy-preserving federated learning and blockchain. IEEE Trans. Netw. Serv. Manag. 2022, 19, 3936–3948. [Google Scholar] [CrossRef]
  27. Bonfim, K.A.; Dutra, F.D.S.; Siqueira, C.E.T.; Meneguette, R.I.; Dos Santos, A.L.; Júnior, L.A.P. Federated learning-based architecture for detecting position spoofing in basic safety messages. In Proceedings of the 2023 IEEE 97th Vehicular Technology Conference (VTC2023-Spring), Florence, Italy, 20–23 June 2023; IEEE: Piscataway, NJ, USA, 2023; pp. 1–5. [Google Scholar]
  28. Huang, H.; Hu, Z.; Wang, Y.; Lu, Z.; Wen, X.; Fu, B. Train a central traffic prediction model using local data: A spatio-temporal network based on federated learning. Eng. Appl. Artif. Intell. 2023, 125, 106612. [Google Scholar] [CrossRef]
  29. Yuan, X.; Chen, J.; Yang, J.; Zhang, N.; Yang, T.; Han, T.; Taherkordi, A. Fedstn: Graph representation driven federated learning for edge computing enabled urban traffic flow prediction. IEEE Trans. Intell. Transp. Syst. 2022, 24, 8738–8748. [Google Scholar] [CrossRef]
  30. Li, Z.; Fu, Y.; Tian, M.; Li, C.; Yu, F.R.; Cheng, N. FedSTDN: A Federated Learning-Enabled Spatial-Temporal Prediction Model for Wireless Traffic Prediction. IEEE Trans. Mob. Comput. 2025, 24, 8945–8958. [Google Scholar] [CrossRef]
  31. Tao, L.; Xiyang, Z. Spatial-temporal cooperative in-vehicle network intrusion detection method based on federated learning. IEEE Access 2025, 13, 97194–97207. [Google Scholar] [CrossRef]
  32. Xu, Y.; Jiang, Z.; Xu, H.; Wang, Z.; Qian, C.; Qiao, C. Federated learning with client selection and gradient compression in heterogeneous edge systems. IEEE Trans. Mob. Comput. 2023, 23, 5446–5461. [Google Scholar] [CrossRef]
  33. Van Der Heijden, R.W.; Lukaseder, T.; Kargl, F. Veremi: A dataset for comparable evaluation of misbehavior detection in vanets. In Proceedings of the Security and Privacy in Communication Networks: 14th International Conference, SecureComm 2018, Singapore, 8–10 August 2018; Proceedings, Part I. Springer: Berlin/Heidelberg, Germany, 2018; pp. 318–337. [Google Scholar]
  34. Mansouri, F.; Tarhouni, M.; Alaya, B.; Zidi, S. A distributed intrusion detection framework for vehicular ad hoc networks via federated learning and blockchain. Ad Hoc Netw. 2025, 167, 103677. [Google Scholar] [CrossRef]
  35. Ahsan, S.I.; Legg, P.; Alam, S. Privacy-preserving intrusion detection in software-defined VANET using federated learning with BERT. arXiv 2024, arXiv:2401.07343. [Google Scholar]
  36. Campos, E.M.; Hernandez-Ramos, J.L.; Vidal, A.G.; Baldini, G.; Skarmeta, A. Misbehavior detection in intelligent transportation systems based on federated learning. Internt Things 2024, 25, 101127. [Google Scholar] [CrossRef]
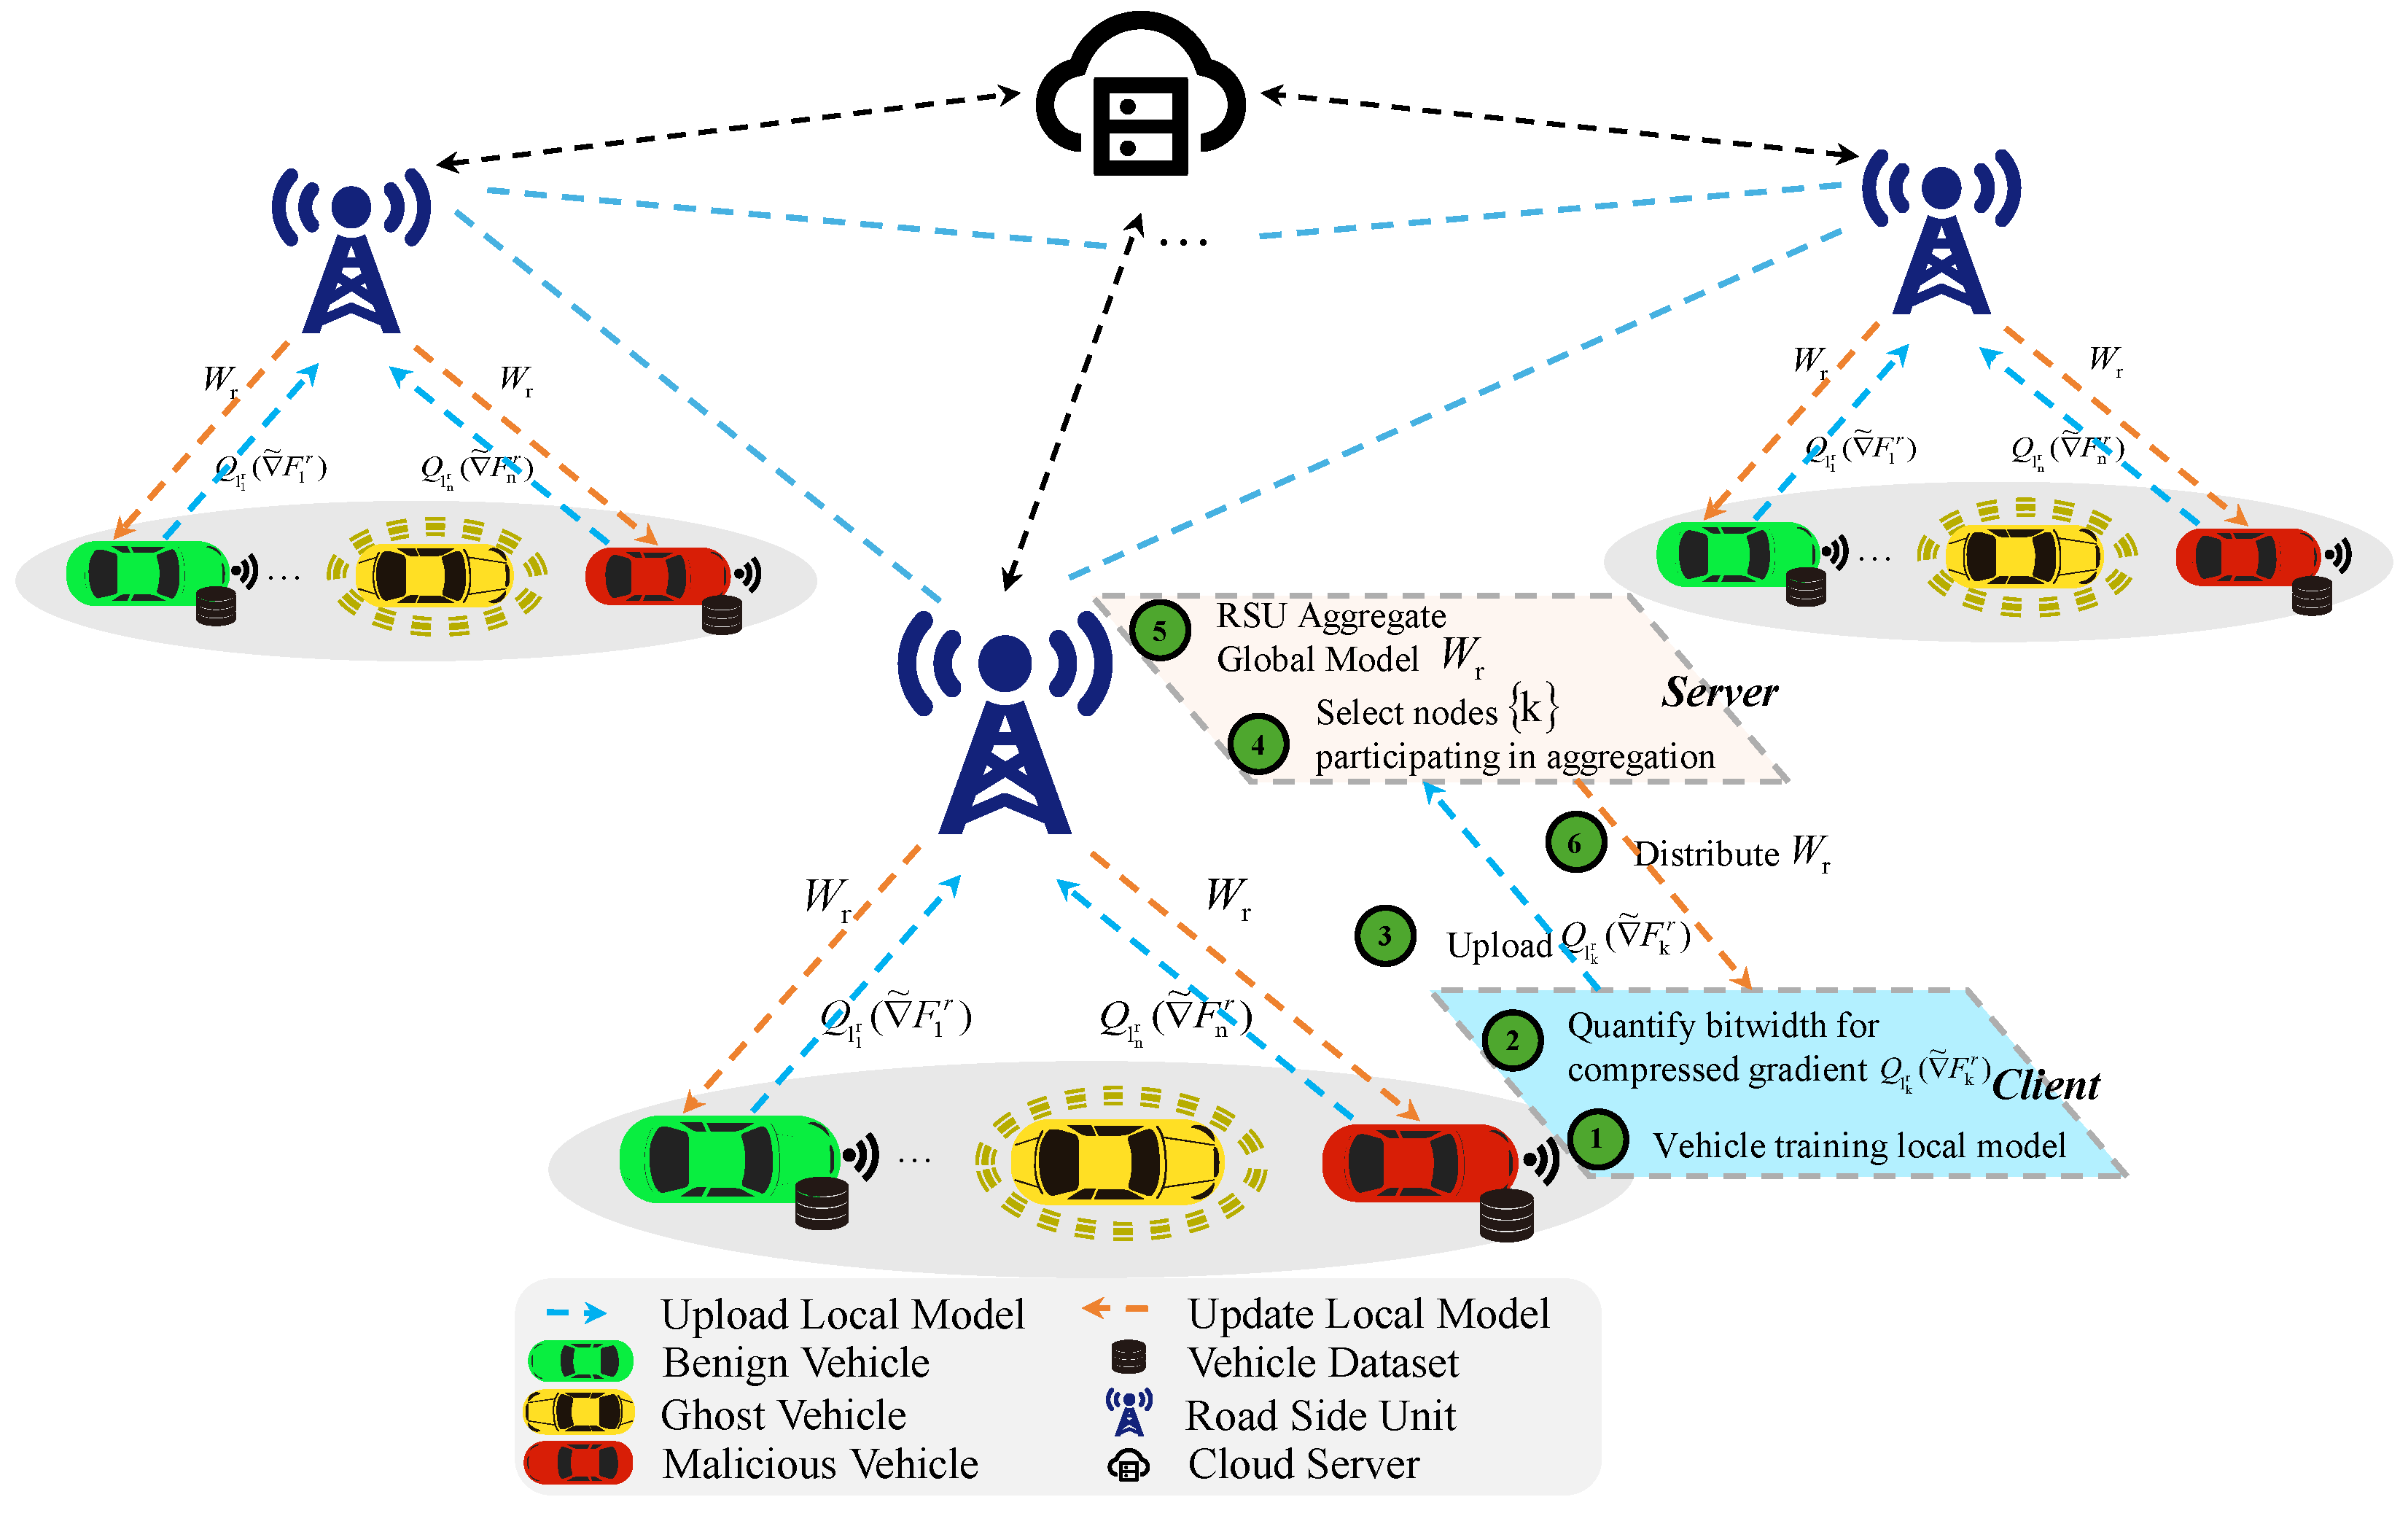
Figure 1. Overall framework process.
Bdcc 09 00246 g001
Figure 2. Overall architecture of the vehicle local model.
Bdcc 09 00246 g002
Figure 3. Changes in feature dimensions of the temporal branch.
Bdcc 09 00246 g003
Figure 4. Changes in feature dimensions of the spatial branch.
Bdcc 09 00246 g004
Figure 5. Changes in feature dimensions during feature weighting, fusion, and classification.
Bdcc 09 00246 g005
Figure 6. Overall process of the Q-FedCG strategy.
Bdcc 09 00246 g006
Figure 7. Pearson correlation coefficients of each feature.
Bdcc 09 00246 g007
Figure 8. Precision value, recall value and F1 score of each label. (a) Classification results of each label with 1 client. (b) Classification results of each label with 5 clients. (c) Classification results of each label with 10 clients. (d) Classification results of each label with 20 clients.
Bdcc 09 00246 g008
Figure 9. Confusion matrix for one client under collaborative training with varying client numbers in FedIFD. (a) Confusion matrix for 1 client. (b) Confusion matrix for one of 5 clients. (c) Confusion matrix for one of 10 clients. (d) Confusion matrix for one of 10 clients.
Bdcc 09 00246 g009
Figure 10. ROC curve for one client under collaborative training with varying client numbers in FedIFD. (a) ROC curve of 1 client. (b) ROC curve for one of 5 clients. (c) ROC curve for one of 10 clients. (d) ROC curve for one of 10 clients.
Bdcc 09 00246 g010
Figure 11. Effect of different methods and numbers of clients on training. (a) Evaluation results of each model with 1 client. (b) Evaluation results of each model with 5 clients. (c) Evaluation results of each mode with 10 clients. (d) Evaluation results of each mode with 20 clients.
Bdcc 09 00246 g011
Figure 12. Cumulative training time for different models to reach the accuracy threshold under various client numbers.
Bdcc 09 00246 g012
Figure 13. Comparison of model performance under different aggregation strategies and client scales.
Bdcc 09 00246 g013
Table 1. Veremi dataset attack type characteristics.
Attack LabelAttack TypeDescription
0Benignlegal vehicles
1Constant attackVehicle transmits fixed position instead of actual position
2Constant offset attackAdd a fixed offset to the actual position of the vehicle
4Random attackRandom position in vehicle transmission simulation area
8Random offset attackRandomly select the position in the pre configured rectangular area around the vehicle
16Eventual stop attackThe vehicle performs normally at the initial stage, and then transmits the current position repeatedly
Table 2. Experimental setup and configuration.
CategoryConfiguration ItemSepcification
HardwareOperating SystemUbuntu 22.04
CPUAMD EPYC 7T83
GPUNVIDIA GeForce RTX 4090
SoftwarePython3.8.19
Deep Learning FrameworkTensorFlow 2.11.0
Federated Learning FrameworkFlower framework 1.11.1
Table 3. Classification metrics and 95% confidence intervals for FedIFD with 20 clients.
MetricsMean95%CI
Accuracy0.978[0.974,0.982]
Precision0.975[0.970,0.980]
Recall0.977[0.972,0.982]
F1 score0.973[0.968,0.978]
Table 4. Effect evaluation of different methods.
AccuracyRecallPrecision
ANN [25]0.800.800.75
CW-RNN [34]0.820.820.77
FL-BERT [35]0.840.850.84
MLP [36]0.930.930.92
FedIFD0.970.970.97
Table 5. Precision value of different methods in attack type.
Label 1Label 2Label 4Label 8Label 16
ANN [25]0.950.680.870.870.93
CW-RNN [34]0.940.680.700.870.92
FL-BERT [35]1.000.650.980.690.79
MLP [36]0.980.950.980.830.89
FedIFD0.990.931.000.950.93
Table 6. Recall value of different methods in attack type.
Label 1Label 2Label 4Label 8Label 16
ANN [25]0.810.630.870.610.73
CW-RNN [34]0.880.570.610.630.80
FL-BERT [35]1.000.880.740.450.95
MLP [36]0.980.980.960.860.89
FedIFD1.000.990.990.740.65
Disclaimer/Publisher’s Note: The statements, opinions and data contained in all publications are solely those of the individual author(s) and contributor(s) and not of MDPI and/or the editor(s). MDPI and/or the editor(s) disclaim responsibility for any injury to people or property resulting from any ideas, methods, instructions or products referred to in the content.