Article

Machine Learning Approaches for Predicting Risk of Cardiometabolic Disease among University Students

1
Department of Computer Science, College of Computer Science and Information Technology, Imam Abdulrahman Bin Faisal University, P.O. Box 1982, Dammam 31441, Saudi Arabia
2
Self-Development Department, Deanship of Preparatory Year, Imam Abdulrahman Bin Faisal University, P.O. Box 1982, Dammam 31441, Saudi Arabia
3
Department of Physiology, College of Medicine, Imam Abdulrahman Bin Faisal University, P.O. Box 1982, Dammam 31441, Saudi Arabia
*
Author to whom correspondence should be addressed.
Big Data Cogn. Comput. 2024, 8(3), 31; https://doi.org/10.3390/bdcc8030031
Submission received: 13 January 2024 / Revised: 4 March 2024 / Accepted: 11 March 2024 / Published: 13 March 2024

Abstract

:
Obesity is increasingly becoming a prevalent health concern among adolescents, leading to significant risks like cardiometabolic diseases (CMDs). The early discovery and diagnosis of CMD is essential for better outcomes. This study aims to build a reliable artificial intelligence model that can predict CMD using various machine learning techniques. Support vector machines (SVMs), K-Nearest neighbor (KNN), Logistic Regression (LR), Random Forest (RF), and Gradient Boosting are five robust classifiers that are compared in this study. A novel “risk level” feature, derived through fuzzy logic applied to the Conicity Index, as a novel feature, which was previously unused, is introduced to enhance the interpretability and discriminatory properties of the proposed models. As the Conicity Index scores indicate CMD risk, two separate models are developed to address each gender individually. The performance of the proposed models is assessed using two datasets obtained from 295 records of undergraduate students in Saudi Arabia. The dataset comprises 121 male and 174 female students with diverse risk levels. Notably, Logistic Regression emerges as the top performer among males, achieving an accuracy score of 91%, while Gradient Boosting lags with a score of 72%. Among females, both Support Vector Machine and Logistic Regression lead with an accuracy score of 87%, while Random Forest performs least optimally with a score of 80%.

1. Introduction

Obesity denotes a pathological state distinguished by the excessive accrual of adipose tissue in the body, which is attributed to inequity between energy consumption and expenditure [1]. The World Health Organization (WHO) defines overweight and obesity as the accumulation of an abnormal or excessive buildup of fat, which has the potential to adversely impact health. Several studies have indicated that the accumulation of body fat is associated with elevated morbidity and mortality in connection with cardiometabolic diseases (CMDs). This association elevates the likelihood of developing various conditions, including hypertension, stroke, and diabetes. Cardiometabolic disease refers to a group of health conditions, including heart failure, heart attack, stroke, and various disorders that affect the heart and blood vessels. CMDs present a considerable public health challenge due to their pervasive prevalence. Numerous scoring systems are available for predicting the probability of CMD development. Employing anthropometric indices for measurement emerges as the most effective and appropriate approach to differentiate between individuals at low and high risk, highlighting the necessity for intensive control. Anthropometric measurements are pivotal tools for evaluating the propensity of adolescents to develop overweight or obesity.
The body mass index (BMI) is a widely recognized metric employed to assess overweight and obesity. The BMI is calculated by dividing the body weight by the square of body height. If the BMI value falls between 25 and 29.9, it categorizes the individual as overweight, and a BMI exceeding 30 indicates obesity [1].
Another method for evaluating central obesity involves utilizing the Conicity Index (C index). This approach is based on the concept that the amassed abdominal fat gives rise to a silhouette resembling a double cone [2].
Adolescents are facing a significant health risk due to the increasing prevalence of overweight and obesity. This is mainly due to their rapid growth and the accompanying health problems, including CMDs [2]. According to the WHO report, the prevalence of obesity has approximately tripled since 1975. The data show that 39% of individuals aged 18 and above are characterized as being overweight, with 13% classified as being obese. The report also emphasizes that, in 2016, 41 million children under the age of 5 were either classified as being obese or overweight, and the number rose to over 340 million for individuals aged 5 to 19. Notably, there has been a significant rise in the obesity rate for children and young people aged 5–19, climbing from 4% in 1975 to nearly 18% in 2016. Obesity has experienced a concerning rise in Saudi Arabia in recent years, emerging as a significant risk factor for various non-communicable diseases in the country.
A prior study conducted among students (aged 19–25 years) at the Faculty of Medicine, Northern Border University, Saudi Arabia revealed that 10.6% were underweight, 58.3% fell within the average weight range, and 31.1% were classified as being overweight or obese [1].
The current study aims to build an artificial intelligence model for forecasting the likelihood of developing a cardiometabolic disease among university students in Saudi Arabia.

2. Literature Review

Many studies in the literature have utilized machine learning techniques for forecasting the risk of obesity/overweight and the associated health conditions.
In a prior work, based on the number of easily accessible exposome factors, the researchers presented a novel, fair machine learning approach for predicting the risk of cardiovascular diseases (CVDs) and type 2 diabetes (T2DM) [3]. They assessed their model using multi-center cohorts from internal and external validation groups. They found 5348 and 1534 individuals from the UK Biobank who, within 13 years of their initial visit, had been given the diagnosis of T2DM and CVD, respectively. As the control group, a comparable number of individuals who did not experience these medical conditions were randomly chosen. From the individual’s baseline visit, 109 simple-to-access exposure variables from six distinct groupings (physical measurements, environmental, lifestyle, mental wellness events, sociodemographics, and early-life characteristics) were considered. To predict those who were likely to contract the diseases, they used the XGBoost ensemble model. The model was contrasted with a machine learning model that considered many elements, such as biological, clinical, physical, and sociodemographic elements, and the Framingham risk score for CVD. Additionally, they examined the suggested model for any sex, racial, and age-related biases. Finally, they used SHAP, a cutting-edge explain-ability method, to analyze the model’s outcomes. Despite only utilizing exposome data, the proposed ML model has comparable results to the integrative ML model, obtaining ROC-AUC values of 0.78 ± 0.01 and 0.77 ± 0.01 for CVD and T2DM, respectively. Furthermore, the exposome-based approach outperforms the conventional Framingham risk score in predicting CVD risk. Additionally, they discovered exposome characteristics such as daytime naps, prior cigarette use, frequency of fatigue/lack of excitement, and other factors that are crucial in identifying individuals who are at risk of developing CVD and T2DM.
Along the same line, a study used the retinal scans of 3000 residents of Qatar to build deep learning models. The researchers examined certain factors, like age, sex, blood pressure, smoking habits, blood sugar levels, lipid levels, sex hormones, and body composition measurements, to predict the risks related to CMDs by analyzing pictures of the back of the eye [4]. They also investigated how age and sex influence the accuracy of predicting these health risks using eye pictures. They used deep learning models based on the MobileNet-V2 architecture to combine information from images of both eyes’ optic discs and maculae and make individual-level predictions. They could accurately predict age and sex with a small error in age prediction (2.78 years) and high accuracy in sex prediction (area under the curve: 0.97). On the other hand, the predictions of systolic blood pressure, diastolic blood pressure, hemoglobin A1c, relative fat mass, and testosterone had acceptable levels of accuracy (errors: 8.96mmHg, 6.84mmHg, 0.61%, 5.68 units, and 3.76 nmol/L, respectively). The researchers concluded that age and sex can be accurately predicted from an eye picture and that certain data related to blood pressure, hemoglobin A1c, and body fat composition can be identified in the retina.
Electronic healthcare record (EHR) data of children up to the age of two years were used to create seven machine learning models to predict pediatric obesity (2 to 7 years). The Children’s Hospital of Philadelphia provided EHR information for 860,510 patients with 11,194,579 clinical visits. After applying strict quality control measures to remove unrealistic growth values and including only participants who had all recommended health checkups by the age of seven years, 27,203 individuals (50.78% male) were chosen for model development. The goal was to predict obesity based on the Centers for Disease Control and Prevention’s definition, which considers a BMI greater than the 95th percentile, adjusted for age and sex, as obese [5]. The performance of the seven machine learning models was evaluated using various metrics commonly used for classifiers. The Cochran’s Q test and post hoc pairwise testing were used to compare the performance of the different models. The XGBoost model achieved the highest area under the curve (AUC) score of 0.81 (0.001), outperforming all of the other models. It also statistically outperformed all other models in terms of precision (30.90%), F1-score (44.60%), accuracy (66.14%), and specificity (63.27%) when the sensitivity was set at 80%.
In a study conducted between 2017 and 2018, 284 male university students from Saudi Arabia’s Eastern Province examined the relationship between cardiometabolic (CM) risk factors and blood pressure. The objective was to investigate this relationship among young Saudi males in a university setting [6]. Various measurements were taken, including the waist-to-hip ratio, blood pressure, body mass index, body adiposity index, waist-to-height ratio, body fat percentage, waist circumference, and basal metabolic rate. The United States of America Sixth Joint National Committee guidelines were used to classify blood pressure. The results indicated that blood pressure was significantly correlated with CM risk factors among young Saudi males. The prevalence of prehypertension was 31.3%, and that of hypertension was 16.2%. Furthermore, the study found that 28.5% of participants were classified as being overweight, and 14.1% were classified as being obese. Additionally, the study highlighted the strong association between a sedentary lifestyle, obesity, and cardiovascular morbidity and mortality. Unfortunately, young students tend not to consider the future risk of cardiovascular diseases associated with a sedentary lifestyle.
Waleed et al. (2021) conducted a study to assess the occurrence of adiposity and evaluate the risk of CMD among university students in the Eastern Province of Saudi Arabia. A total of 310 students (127 males and 183 females) were examined using standardized instruments to measure various adiposity indicators, including Mass of Body Fat (MBF), body fat percentage (BFP), BMI, visceral fat area (VFA), waist circumference (WC), waist-to-hip ratio (WHR), Fat Mass Index (FMI), and A Body Shape Index (ABSI). Indicators of CMD risk, such as the Conicity Index (C index), WC, and WHR, were also calculated. The results showed that most students were either classified as being overweight or obese, with males having higher levels of adiposity compared to females. Additionally, male students had significantly higher percentages of CMD risk indicators than females. Positive correlations were observed between the C index quartiles and BMI with other CMD risk indicators [2]. These findings highlight the need for the early prediction and prevention of adiposity-related health issues and for policymakers to raise awareness about healthy eating habits and the link between physical inactivity and chronic diseases among university students.
Furthermore, a previous study was conducted to accurately identify different subtypes of heart failure (HF), which could help with personalized treatment approaches. Although machine learning has been utilized in previous research to investigate the subtypes of HF, such approaches have been limited in their application to small datasets and have not comprehensively addressed the diverse causes and presentations of HF. Furthermore, validation through multiple machine learning methods and large, independent, population-based datasets has yet to be conducted. To address these limitations, researchers have used published libraries to identify and validate the HF subtypes. The researcher used four unsupervised machine learning algorithms (clustering algorithms), and they compared the results. The algorithms are K-means, hierarchical clustering, K-adenoids, and mixture modeling algorithms [7]. However, the study did not focus on how the machine learning algorithms are implemented but on the subtypes of heart failure itself and on discovering any hidden relations among other diseases, including cardiometabolic diseases, besides clinical diagnostics and laboratory tests. The researchers could identify five subtypes of heart failure with high accuracy for distinguishing between them both within and across datasets. These subtypes were also found to have good predictive accuracy for mortality within one year.
The research article by O’Sullivan et al. (2020) included pediatric studies on the relationships between whole-fat and reduced-fat dairy consumption and adiposity measurements, as well as indicators of the risk of cardiometabolic illness. Most of the research, which was primarily observational, revealed in the review that whole-fat dairy products were not linked to higher levels of weight gain or adiposity. Also, there is insufficient evidence supporting switching from whole-fat to reduced-fat dairy for better results for specific risk factors. However, whole-fat dairy intake was typically not linked to an elevated cardiometabolic risk. The analysis drew attention to the absence of randomized controlled studies comparing the health effects of whole-fat dairy to reduced-fat dairy in children, which would have produced more trustworthy data. The authors contend that obtaining improved quality data in this area requires high-quality randomized controlled studies among kids. Also, the authors emphasize the necessity to consider the type of dairy product ingested, any production or processing processes, and any potential impact change due to a person’s sex, stage of puberty, or level of body fat. Lastly, the authors stress the significance of evidence-based dietary recommendations for a child’s dairy fat consumption to address the rising public health issue of childhood obesity and lower the risk of developing chronic illnesses [8].
Arisaka O. et al. (2020) published a study aiming to assess the latest research on the association between rapid early growth and the subsequent risks of developing obesity and conditions in the future. The research specifically draws attention to the varied degrees of relevance associated with fast weight increase in the early childhood and infantile stages. They assess infantile obesity, adiposity rebound, catch-up growth (CUG), sexual dimorphism, the early prediction of future cardiometabolic risk, and the evaluation of rapid weight gain and adiposity rebound, noting that both early and late rapid weight increase throughout infancy and the early years of childhood may portend a future risk of obesity. An infant’s weight often drops in the first 7 to 14 days after birth and then rapidly increases in the next six months. The relevance of early infancy was noted as a potential predictor of future obesity, particularly for people who were born underweight and experienced rapid catch-up growth. Also, the rapid weight growth in toddlers throughout the first three years is strongly linked to cardiometabolic risk [9].
Tsai T. et al. (2020) conducted a cross-sectional study aimed at clustering cardiometabolic risk factors and sedentary behavior using a factor analysis. The study involved 210 adults aged 20–65 years who were recruited from a community in South Korea. The researchers collected data on the subjects’ anthropometric and biochemical measurements, sedentary behavior, and physical activity. A factor analysis was used to identify the patterns of cardiometabolic risk factors and sedentary behavior. The study found that sedentary behavior and cardiometabolic risk factors were positively correlated and that the clustering of these factors could be used to discover individuals who are at risk of developing cardiometabolic diseases. The study highlights the importance of reducing sedentary behavior and addressing multiple cardiometabolic risk factors to prevent cardiometabolic diseases [10].
Berkowitz S. et al. (2019) [11] investigated the association between access to social service resources and CMD risk factors using machine learning and multilevel modeling analysis. 11,638 people from the American NHANES were included in the study. To categorize individuals according to their access to resources for social services including health insurance, housing help, and food assistance, the researchers employed machine learning algorithms. The potential relationship between the availability of social service resources and the prevalence of risk factors for cardiometabolic disorders, such as but not limited to obesity, diabetes, and hypertension, was then examined using multilevel modeling analysis. The research discovered a link between social service resources and a reduced risk of obesity, diabetes, and high blood pressure. The researchers propose that increasing access to social service resources might be a successful method for lowering cardiometabolic risk variables in the populace.
Machine learning methods and a healthy diet score were used by Shang X. et al. (2020) to examine the primary dietary determinants influencing changes in cardiometabolic risk factors in children. 1550 youngsters between the ages of 5 and 12 participated in the study. The researchers used machine learning to determine the main factors in our diet that affect our risk of heart and metabolic problems over time. They also developed a score based on healthy eating guidelines to see how diet quality affects these risk factors. The study found that things like processed foods and sugary drinks greatly impact children’s risk factors. The healthy diet score was also a good predictor of changes in these risk factors. The researchers believe that if we help kids eat better can make a difference in reducing their risk of heart and metabolic problems and improving their long-term health. This study shows that machine learning and a healthy diet score can help us identify the most important dietary factors that contribute to these health issues in children, which is crucial for preventing heart and metabolic diseases [12].
Taghiyev A. et al. (2020) conducted a study that used machine learning techniques to identify the causes of obesity. They developed a hybrid model in two separate stages: the first stage includes feature selection, while the second stage includes classification. They also compared the hybrid model with other classifiers, such as Decision Trees and Logistic Regression. The hybrid model designed by the researchers gives a more accurate classification of obese people as well as a valuable technique for measuring obesity-related characteristics. They achieved 91.4% accuracy, 90.4% recall, and 92.9% specificity, which turned out to be better than DT and LR [13].
Chatterjee Ayan. et al. (2020) published a paper about “Identification of Risk Factors Associated with Obesity and Overweight”, in addition to an overview of the same topic. The used dataset contains 500 records with four parameters: gender, height, weight, and index. The index attribute includes five numbers, each indicating a different obesity level. In the preprocessing phase, they added a new feature, “BMI” to the dataset. Due to the high correlation, this feature was removed later in the model training. Moreover, they developed five classifiers, Support Vector Machine, Naïve Bayes, Decision Tree, and K-Nearest Neighbor. The result shows the Support Vector Machine (SVM) provided the most optimal classification, with 95% accuracy [14].
Ferdowsy F. et al. (2021) worked on a machine learning model that predicts obesity risk. The dataset used in this approach contains 1000 records that include both obesity and non-obesity people of different ages. They used different classification algorithms such as K-Nearest Neighbor (KNN), Logistic Regression, multilayer perceptron (MLP), SVM, Naïve Bayes (NB), Adaptive Boosting (ADA Boosting), Decision Tree, and Gradient Boosting. Moreover, they used the performance metrics to measure the performance of each classifier individually. The Logistic Regression classifier shows the best accuracy among all the other classifiers, with 97.09%, while the Gradient Boosting classifier achieves the lowest accuracy, 64.08% [15].
Avery big study analyzed Magnetic resonance imaging (MRI) imaging data of 40,032 participants from the UK Biobank. The researchers used previously collected data on three types of adipose tissue volume from up to 9041 participants to train convolutional neural networks (CNNs) to calculate deviations in the adipose tissue depots of the participants. These deviations were calculated independently of BMI and were used to uncover relationships with cardiometabolic diseases. The study found that CNNs using two-dimensional projected images were highly accurate in predicting the adipose tissue volumes. However, there was significant heterogeneity in the associations between local adiposity measures and cardiometabolic diseases. Therefore, it is found that using deep learning models with MRI data could provide highly accurate results on adipose tissue volumes and that local adiposity measures have varying associations with cardiometabolic diseases at different BMIs [16].
Machine learning techniques have been used to predict obesity by analyzing publicly available health data. In this regard, various classifiers, including LR, CART, and NB, utilized the Synthetic Minority Oversampling Technique to account for data imbalance and predict overweight status based on risk factors. The dataset included BMI as one of its main features, and the researchers applied some preprocessing techniques, such as eliminating missing values, before utilizing it. Their findings indicated that Logistic Regression was the most effective classifier for predicting obesity with the highest performance [17]. On the other hand, a systematic literature review of 93 papers was conducted to determine the machine learning models suitable for detecting obesity. The review found that obesity is closely linked to co-morbidities like CVD and chronic conditions, underscoring the significance of using machine learning techniques for early detection. The researchers noted that the most commonly used approach in the literature for detecting obesity is Artificial Neural Networks (ANN) [18].
Kerkadi A. et al. (2020) conducted a study aimed to analyze several techniques for measuring adiposity to identify persons from Qatar who were at risk of developing CMDs. Five hundred fifty-eight healthy Qatari adults between the ages of 20 and 50 were randomly chosen from survey data from the Qatar Biobank. The researchers also collected anthropometric information, such as height, along with information obtained from dual-energy X-ray absorptiometry (DXA) and CMD risk markers. Researchers employed three measurements to evaluate the accuracy of adiposity signs as predictors of CMD risk factors: a Receiver Operating Characteristics (ROC) curve, an area under the curve (AUC), and a Spearman partial correlation coefficient. The study discovered that DXA-derived adiposity indicators were superior to conventional anthropometric indicators as predictors of CMD risk. Particularly, CMD risk variables, including blood pressure, fasting glucose, triglyceride, HDL cholesterol, and HbA1c levels, were strongly correlated with DXA-derived markers like visceral adipose tissue, trunk fat, android fat, gynoid fat, and total body fat mass. These findings have important implications for public health interventions in Qatar. More than 70% of adults are overweight or obese. Identifying individuals at higher risk of developing CMDs using more accurate adiposity assessment methods like DXA scans rather than relying on traditional anthropometric measures alone can help healthcare providers develop targeted interventions to prevent or manage these diseases [19].
Research by Ashraf S. et al. (2021) sought to create an anthropometric prediction equation for visceral adiposity in people with spinal cord damage (SCI). The study highlights the important physical and SCI-related elements that affect how visceral adipose tissue (VAT) is distributed in people with SCI. The review looks at the variables that affect visceral adiposity in people with SCI and suggests that WC can work as a stand-in marker for central obesity, CMD, and associated illnesses. The study suggests that WC can be a valuable tool for healthcare providers to identify those at risk of developing central obesity and associated health complications. Prior research relied on expensive imaging. Various imaging methods, such as computed tomography (CT), MRI, DXA, and ultrasound scanning, were utilized in the techniques employed in the study. Due to their high price and restricted availability, these procedures are not usually practicable or feasible for frequent clinical usage. The study shows that WC can be a helpful tool for healthcare providers to identify those at risk of developing central obesity and related health complications, even though there is currently no SCI-specific WC or AC cut-off value to predict VAT and diagnose people at risk of central obesity, CMS, and cardiovascular disease after SCI [20].
Research was conducted in 2022 to evaluate the potential association between adult persons’ body MRI-based measurements of adipose tissue distribution and brain ages. The study used cross-sectional and longitudinal methodologies to investigate the relationships between follow-up adipose measurements and brain age gap (BAG) measurements. A subgroup of 286 people, aged between 19 and 86, who made up the study’s total of 790 participants, supplied cross-sectional body MRI data. The estimation of tissue-specific brain aging at two time periods and research into the relationships between adipose measurements and BAG were carried out using Bayesian multilevel modeling. The study also examined the cross-sectional relationships among tissue-specific BAG, comprehensive measurements of adipose tissue (body composition), and traditional anthropometric measurements (BMI and WHR) that were applied in a previous investigation. The study’s findings suggest that there is a relationship between adipose tissue distribution measurements and brain aging. However, the study’s follow-up sample size was somewhat small, which reduced the study’s statistical power. This must be taken into consideration. The body MRI data were only collected at the follow-up examination, which further reduced the statistical power of the inquiry. The subsequent loss of statistical power is demonstrated by the posterior distributions for the breadth of the body MRI, which exhibit higher levels of uncertainty than the BMI and WHR, both of which were available longitudinal measures with larger sample sizes. In conclusion, this research sheds important light on the potential relationship between adult individuals’ body MRI-determined adipose tissue distributions and brain ages [21].
To improve prediction accuracy, a new study was conducted to evaluate the drawbacks of the current risk prediction models (RPMs) for CVDs and suggested using alternative machine learning-based RPMs. The research involved testing and comparing multiple machine learning models to the traditional logistic regression analysis (LRA) model using a dataset of 460 participants in Pakistan. In addition to identifying a significantly diverse order of features, the results demonstrate that ML-based RPMs, such as artificial neural networks and linear Support Vector Machines, beat LRA in terms of prediction accuracy and discriminating capacities. The study concluded that nonlaboratory characteristics can be good substitutes for low-cost RPMs in low–middle-income nations and that tailored and localized RPMs should be favored for the exact assessment of CVD risk. However, for a significant increase in performance matrices, bigger and more complex datasets are required. The study’s findings generally imply that ML-based RPMs can enhance the functionality of current models and uncover hidden feature behavior [22].
Another study by Guarneros-Nolasco LR. et al. (2021) explored the application of machine learning algorithms to the detection and prognosis of CVDs. The study compared ten distinct machine learning algorithms’ performance using two datasets for CVD diagnosis and two for CVD prediction. Using the train–test split approach and k-fold cross-validation, the study concentrated on the top two and top four attributes/features of the datasets regarding five performance measures, including accuracy, precision, recall, F1-score, and roc-auc. The findings demonstrate that MLAs function appropriately in terms of classification and prediction, particularly when it comes to the top two features, which indicate three key risk factors, such as arrhythmia and tachycardia, and that they may be utilized to enhance existing CVD diagnostic efforts. The findings of the study reveal that age, heart rate, and blood pressure are the most significant factors, while weight, cholesterol levels, smoking status, serum creatinine levels, ejection fraction, type of chest discomfort, number of affected arteries, platelet count, and obesity are ranked as secondary and tertiary factors in terms of their associations with the outcome of interest. According to the study, the risk variables can be employed for follow-up in the early detection of CVDs, such as arrhythmia or tachycardia, and for prompt and effective treatment when required. The report suggests that other medical databases should be used to replicate the study and that mobile applications for heart disease monitoring should be created utilizing the discovered risk variables [23].
Machine learning has been applied to predict the risk of heart disease using classifiers. The Cleveland Heart dataset was utilized for training ten distinct ML classifiers from various categories, and three attribute assessors were used to choose the most essential features. A 10-fold cross-validation testing option was used to assess the classifiers’ performance, and the hyperparameter “k” was tweaked to increase precision. Using the chi-squared attribute evaluator, the SMO classifier had the greatest prediction performance with an accuracy of 86.468%. The maximum ROC area of 0.91 was given by the meta-classifier bagging with Logistic Regression. The study concluded that proper attribute selection and hyperparameter tweaking may greatly enhance machine learning classifier performance when predicting the risk of heart disease. However, because of the tiny dataset and few feature selection techniques and machine learning algorithms’, the researchers are aware of the study’s limitations. As a result, they recommend further study that integrates several datasets to enhance the classifier’s prediction performance [24].
We reviewed previous related work and summarized their key points in Table 1.
Based on the existing literature, there is a need to explore the risk of obesity and overweight among adolescents in Saudi Arabia to achieve high accuracy.
None of the current studies have explored the use of the C index to predict the risk factors for CMD that contribute to the probability of developing overweight and obesity.
Integrating the fuzzy logic approach is crucial for predicting the “risk level”, as it possesses the ability to handle uncertainty in a manner closely resembling human reasoning. This integration offers a natural way to express the risk level, thereby improving the interpretability and applicability of the model in practical scenarios.
Therefore, in the current study, we aimed to build an artificial intelligence model to predict the likelihood of CMD among university students in Saudi Arabia who are overweight or obese based on various obesity indicators. The dataset used to train the model will be sourced and will consist of information pertaining to participants who are also enrolled as students at the university. The aim of the model was to identify the most significant obesity indicators and CMD risk factors that contribute to the likelihood of overweight and obesity and to develop a predictive model that could be used to screen university students for these health conditions. The model could also be used to create personalized intervention plans for university students in Saudi Arabia who have a high risk of being overweight and obese to promote healthy lifestyles and physical activity.

3. Dataset Description

3.1. Overview

In this study, we utilized a pre-existing dataset. This dataset was gathered from undergraduate students in their preparatory year at Imam Abdulrahman Bin Faisal University in the city of Dammam (Eastern Province, Saudi Arabia). The dataset was collected by a specialized team from the College of Medicine at the same university. The dataset consists of 310 anonymous patient records for both males and females, stored in a CSV file. Among these records, 183 of them are female records, while the remaining 127 are male records. Each record contains 12 features, excluding the target class. The dataset includes only numerical characteristics. Significant quantitative characteristics, such as age, height, weight, Mass of Body Fat (MBF), body fat percentage (BFP), BMI, visceral fat area (VFA), waist circumference (WC), waist-to-hip ratio (WHR), as well as Fat Mass Index (FMI), Conicity Index (C index), and A Body Shape Index (ABSI), are included in the numerical features. The following section provides descriptions of each of these aspects.

3.2. Features

Each characteristic used in the dataset is listed in this section, along with a brief explanation. The features are as follows:
  • Age: The age of an instance, typically measured in years;
  • Height: The height in m;
  • Weight: The weight in kg;
  • MBF: The mass body fat in kg;
  • BFP: The percentage of body fat;
  • BMI: The body mass index, calculated by dividing the weight in kg by the square of the height in m;
  • VFA: The visceral fat area, which is the fat surrounding the internal organs, in cm2;
  • WC: The waist circumference measurement in cm;
  • WHR: The waist-to-hip ratio, which is an indicator of the fat distribution in the body;
  • FMI: The Fat Mass Index, which is similar to the BMI but focuses on the amount of body fat;
  • C index: The Conicity Index, which is calculated using the waist and hip circumference;
  • ABSI: A Body Shape Index, which is used to assess the risk of obesity-related diseases.

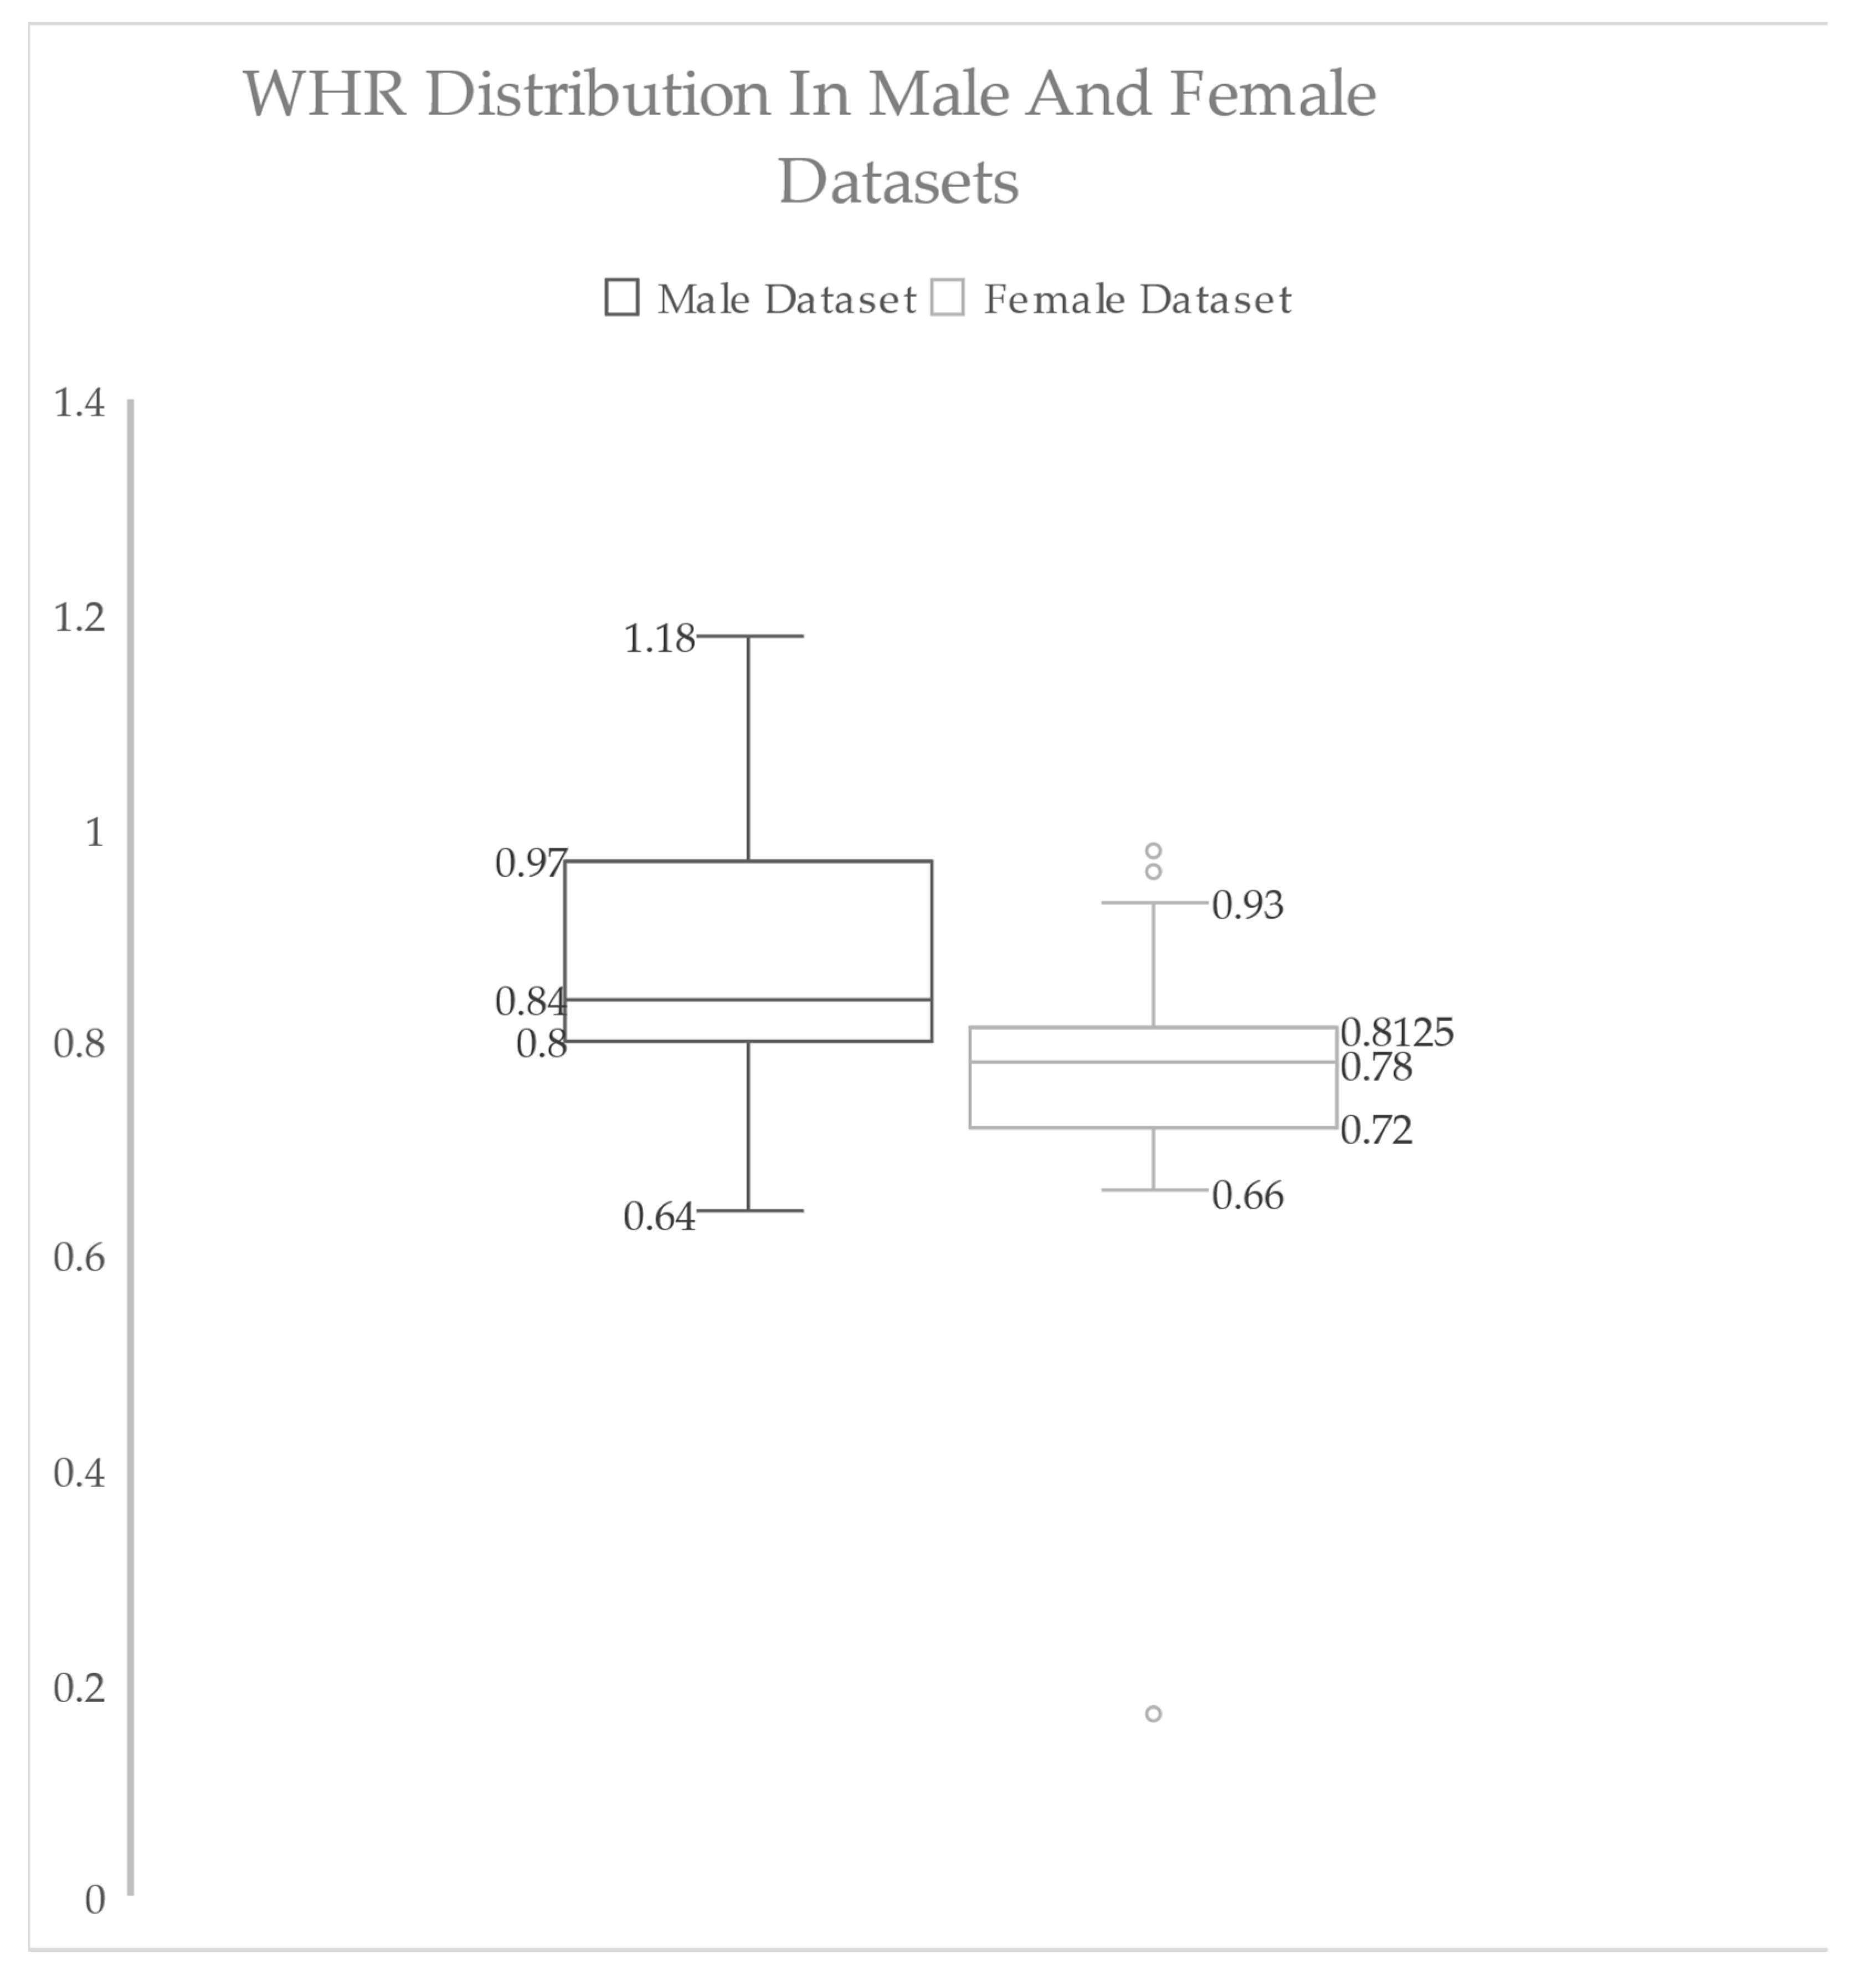
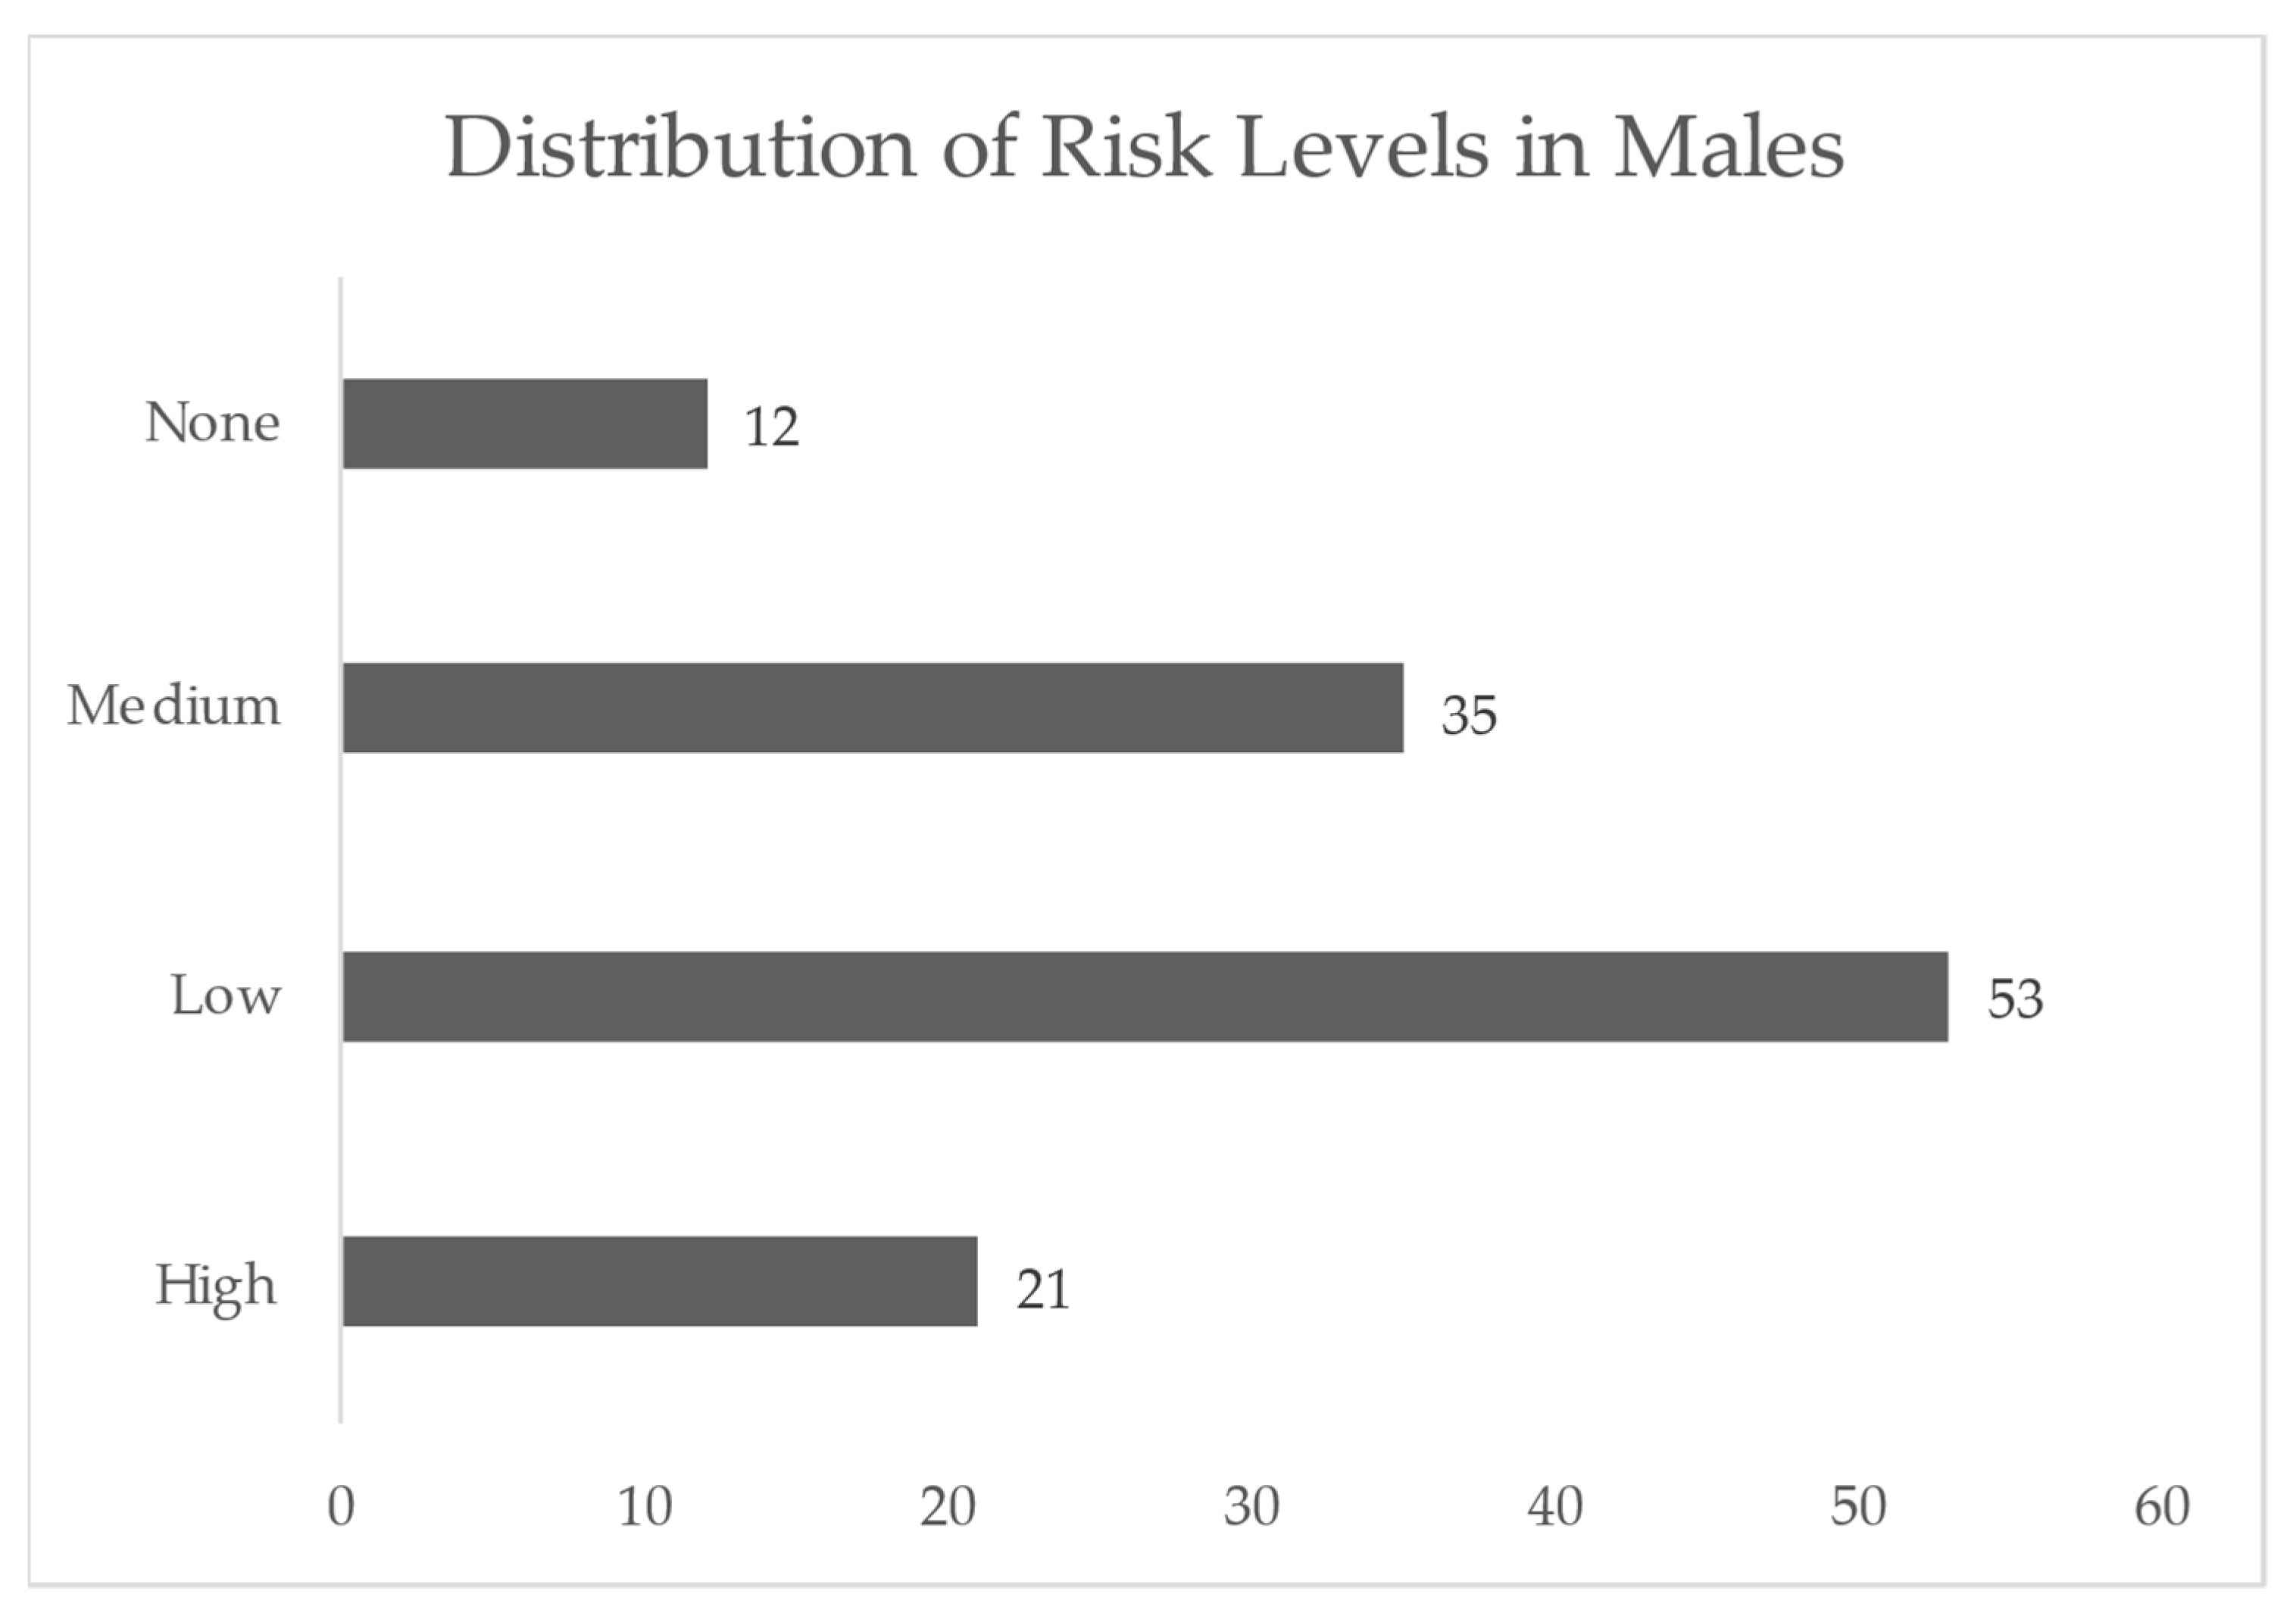
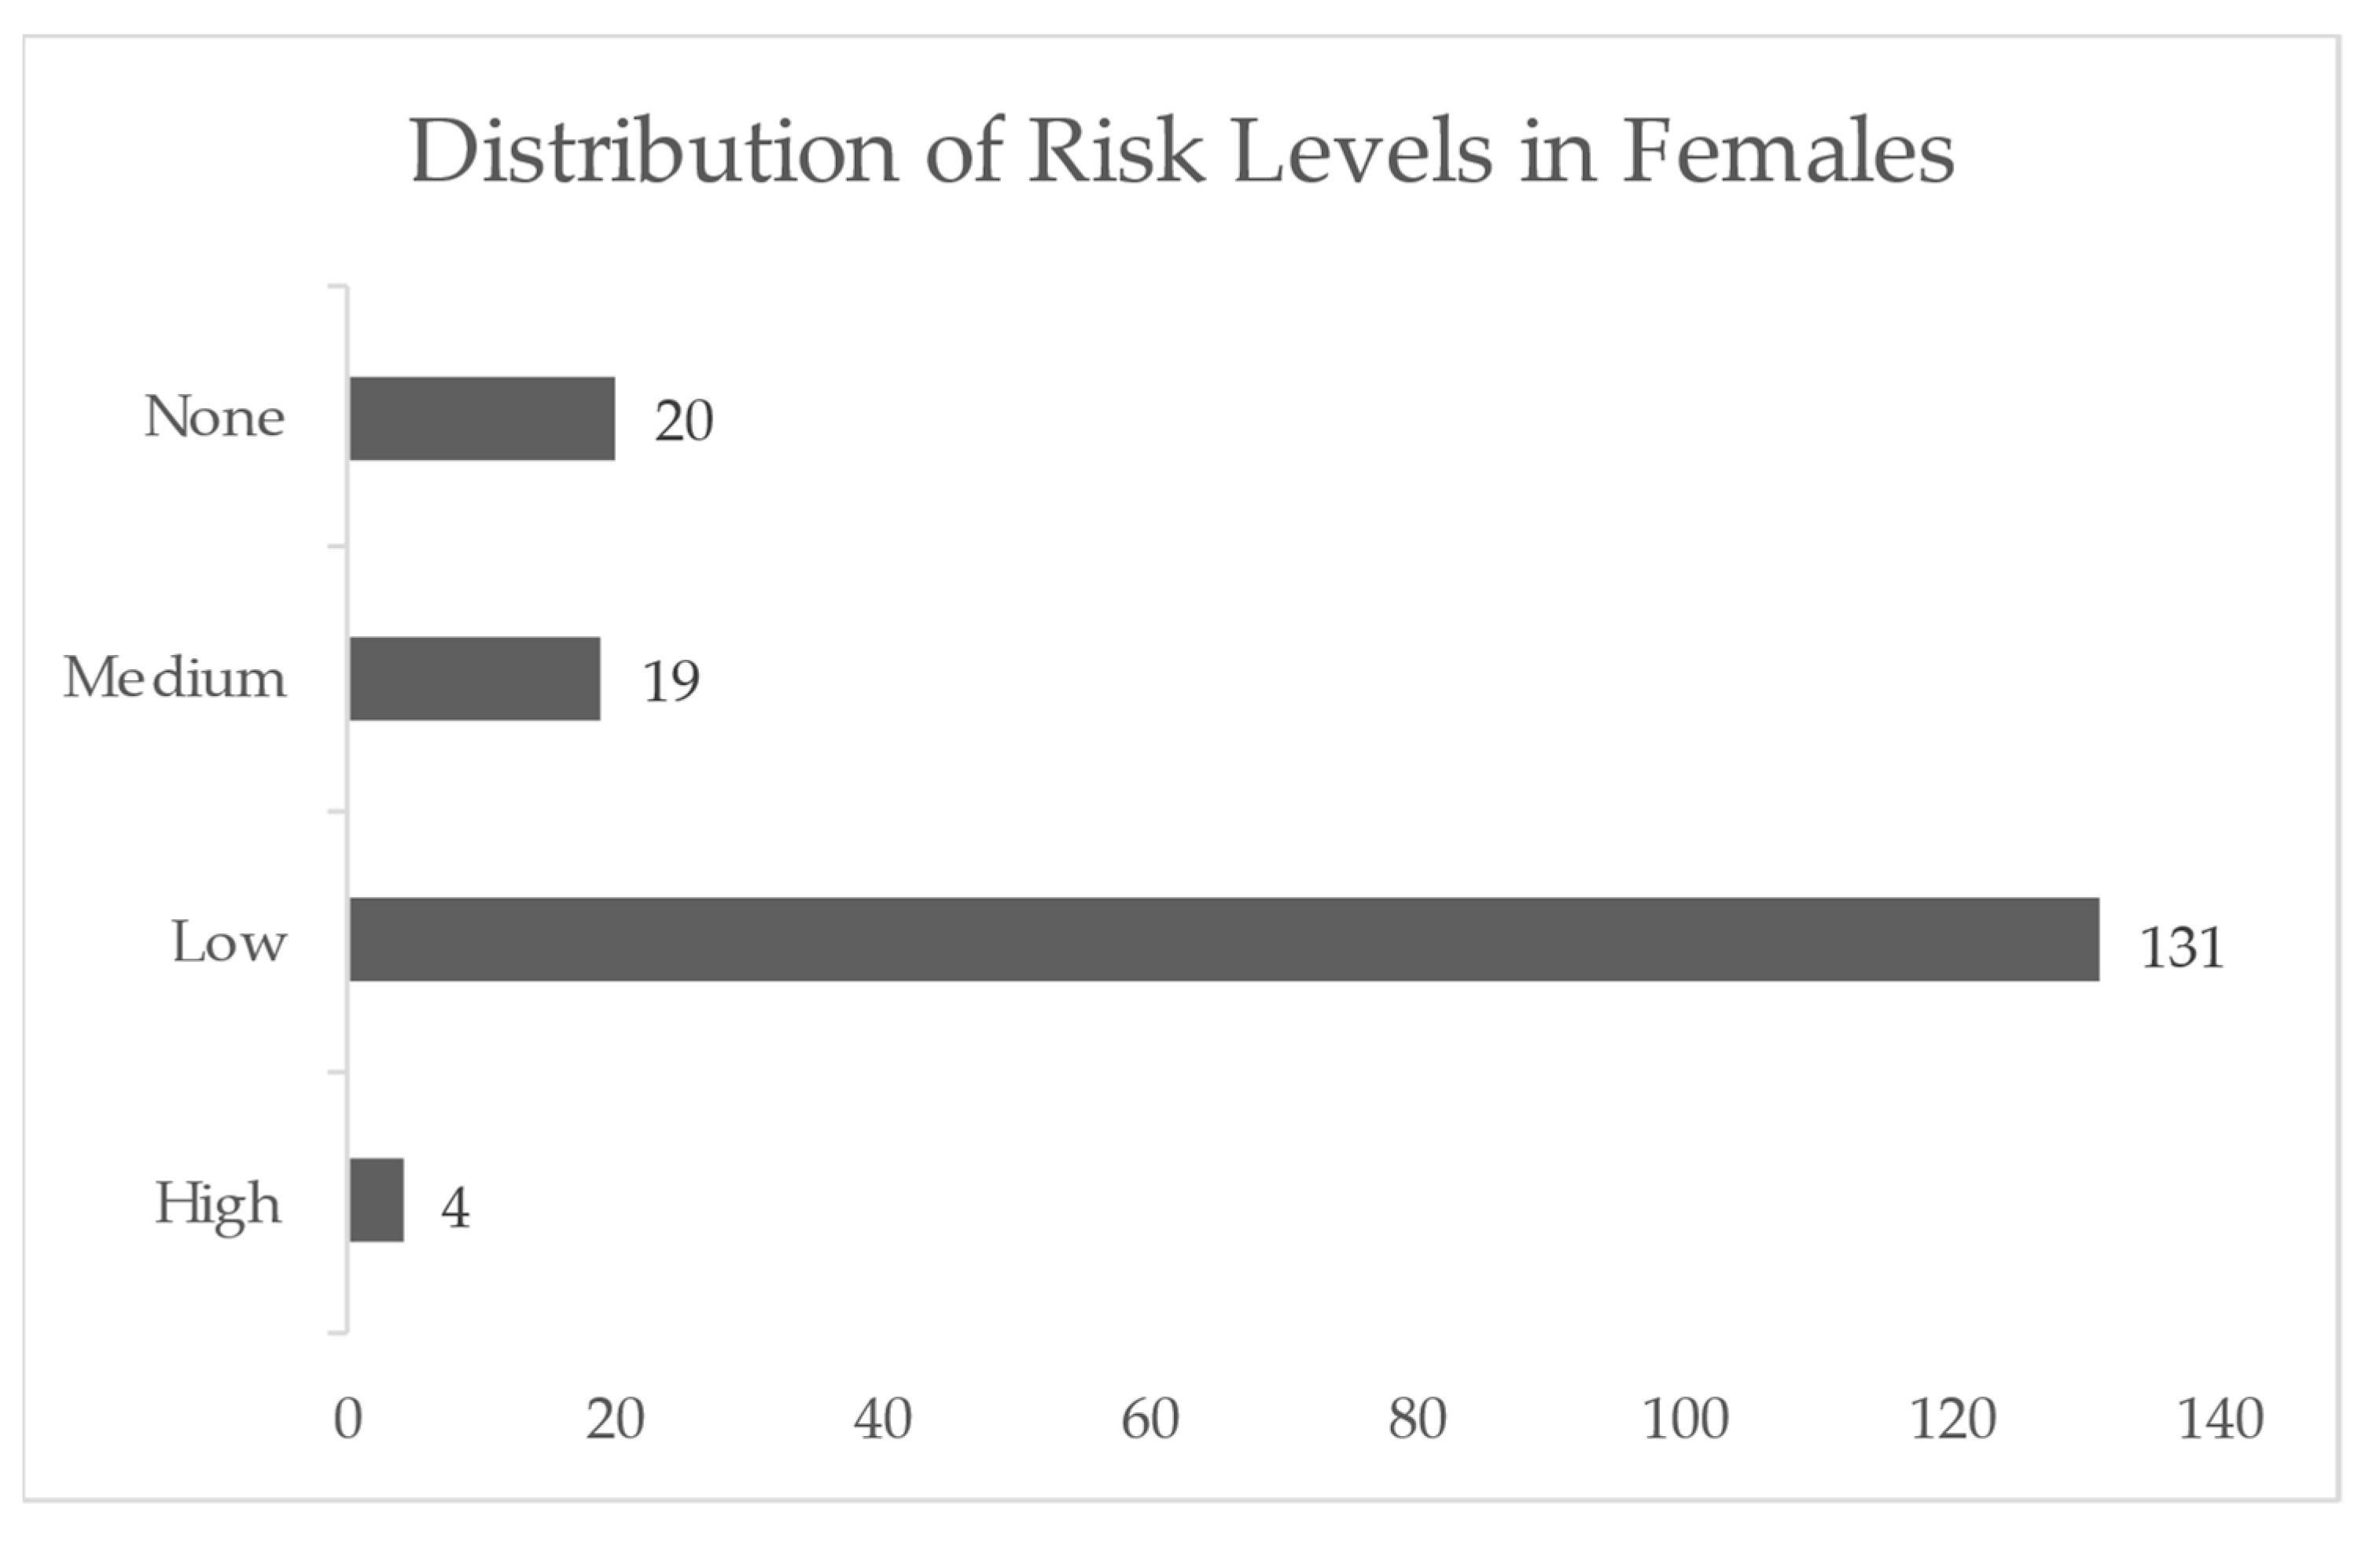
3.3. Overview of Statistics and Data Exploration Insights before Preprocessing
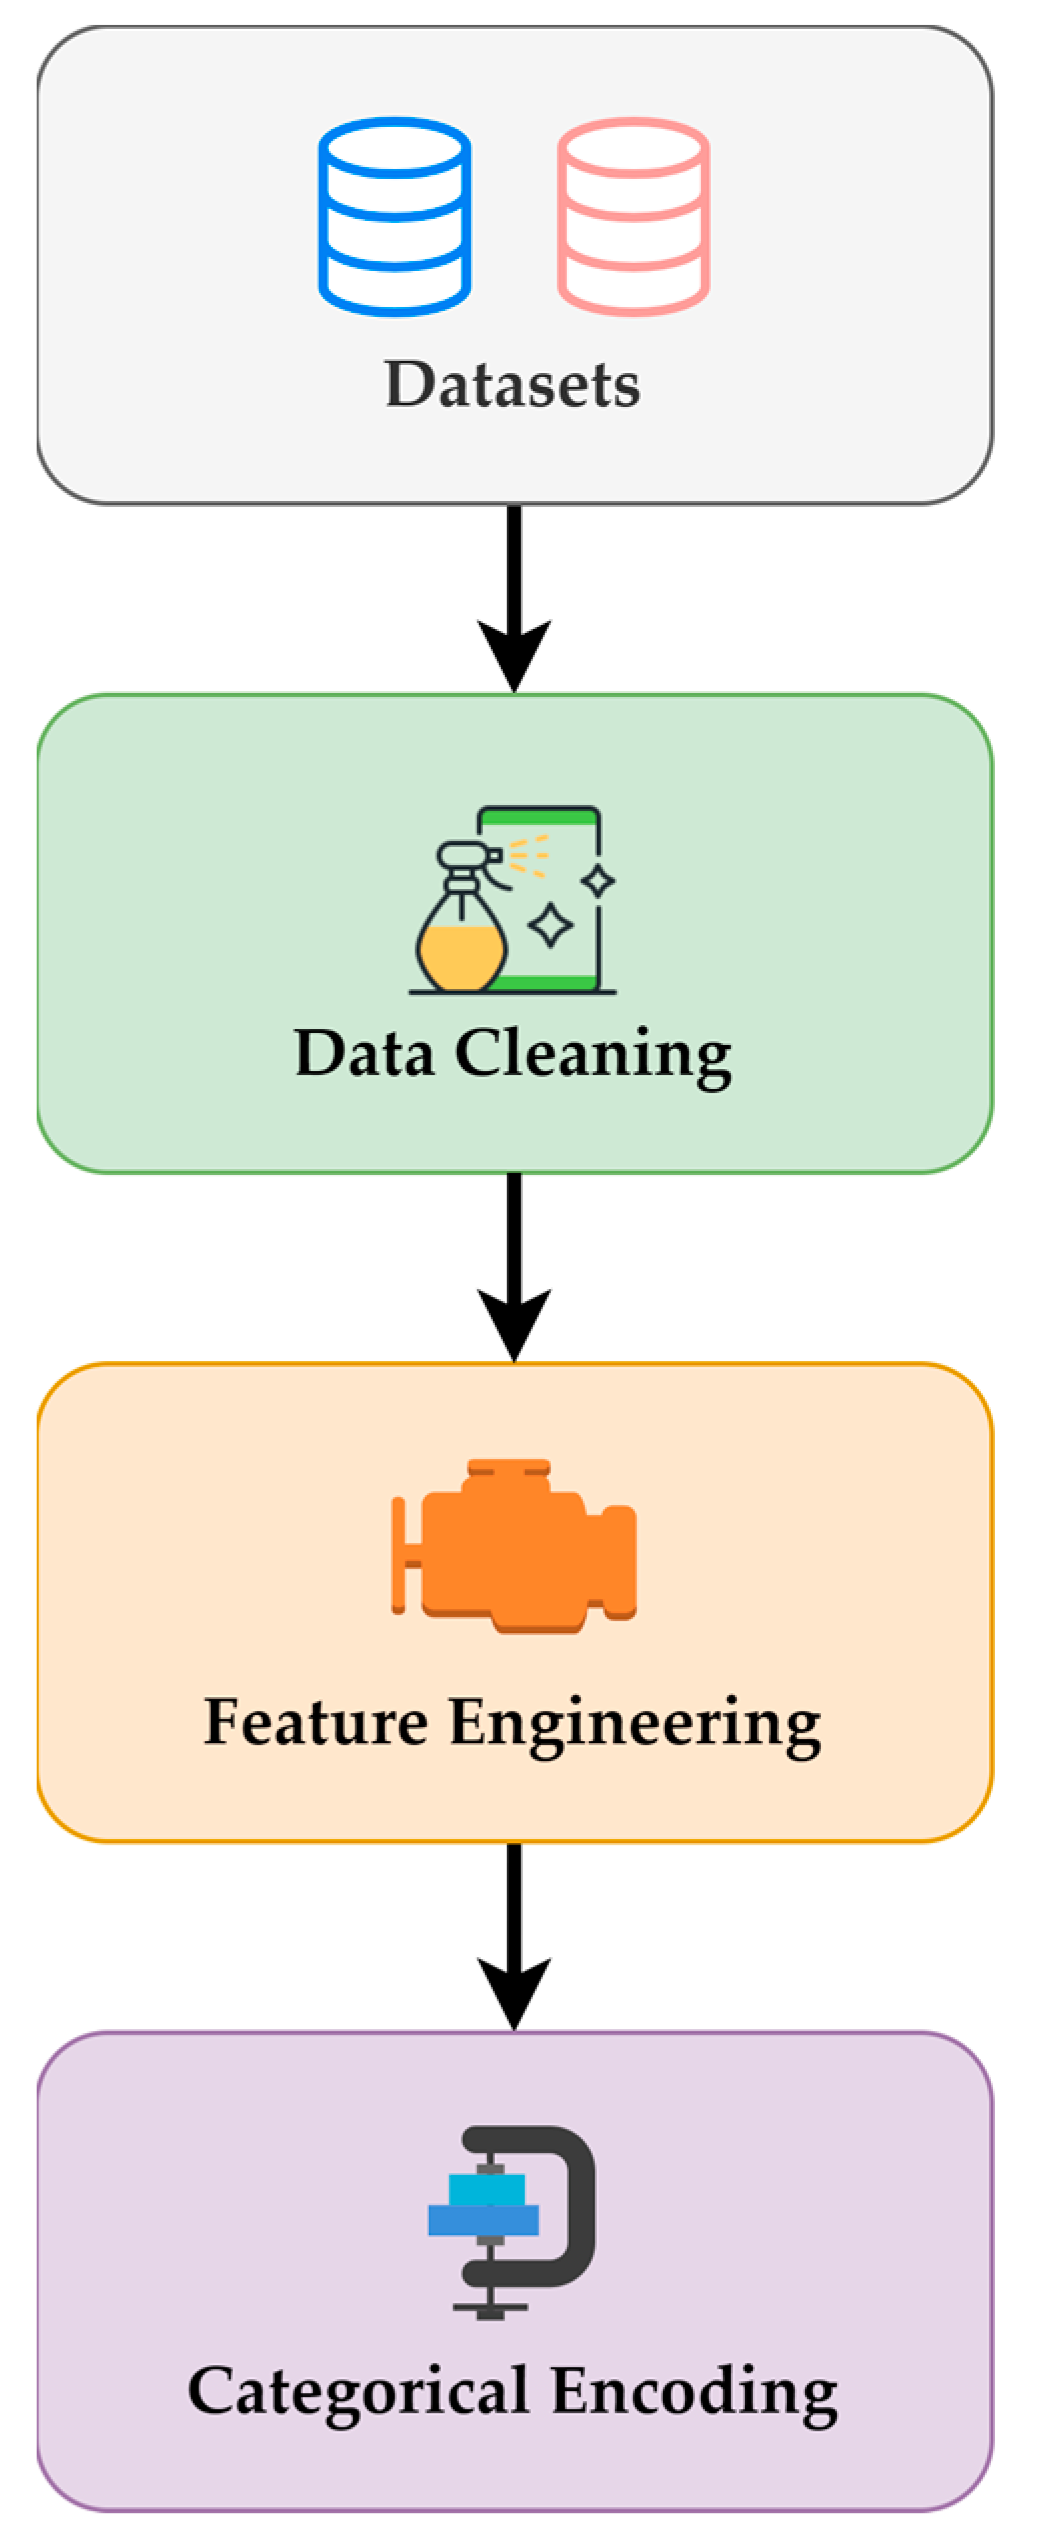
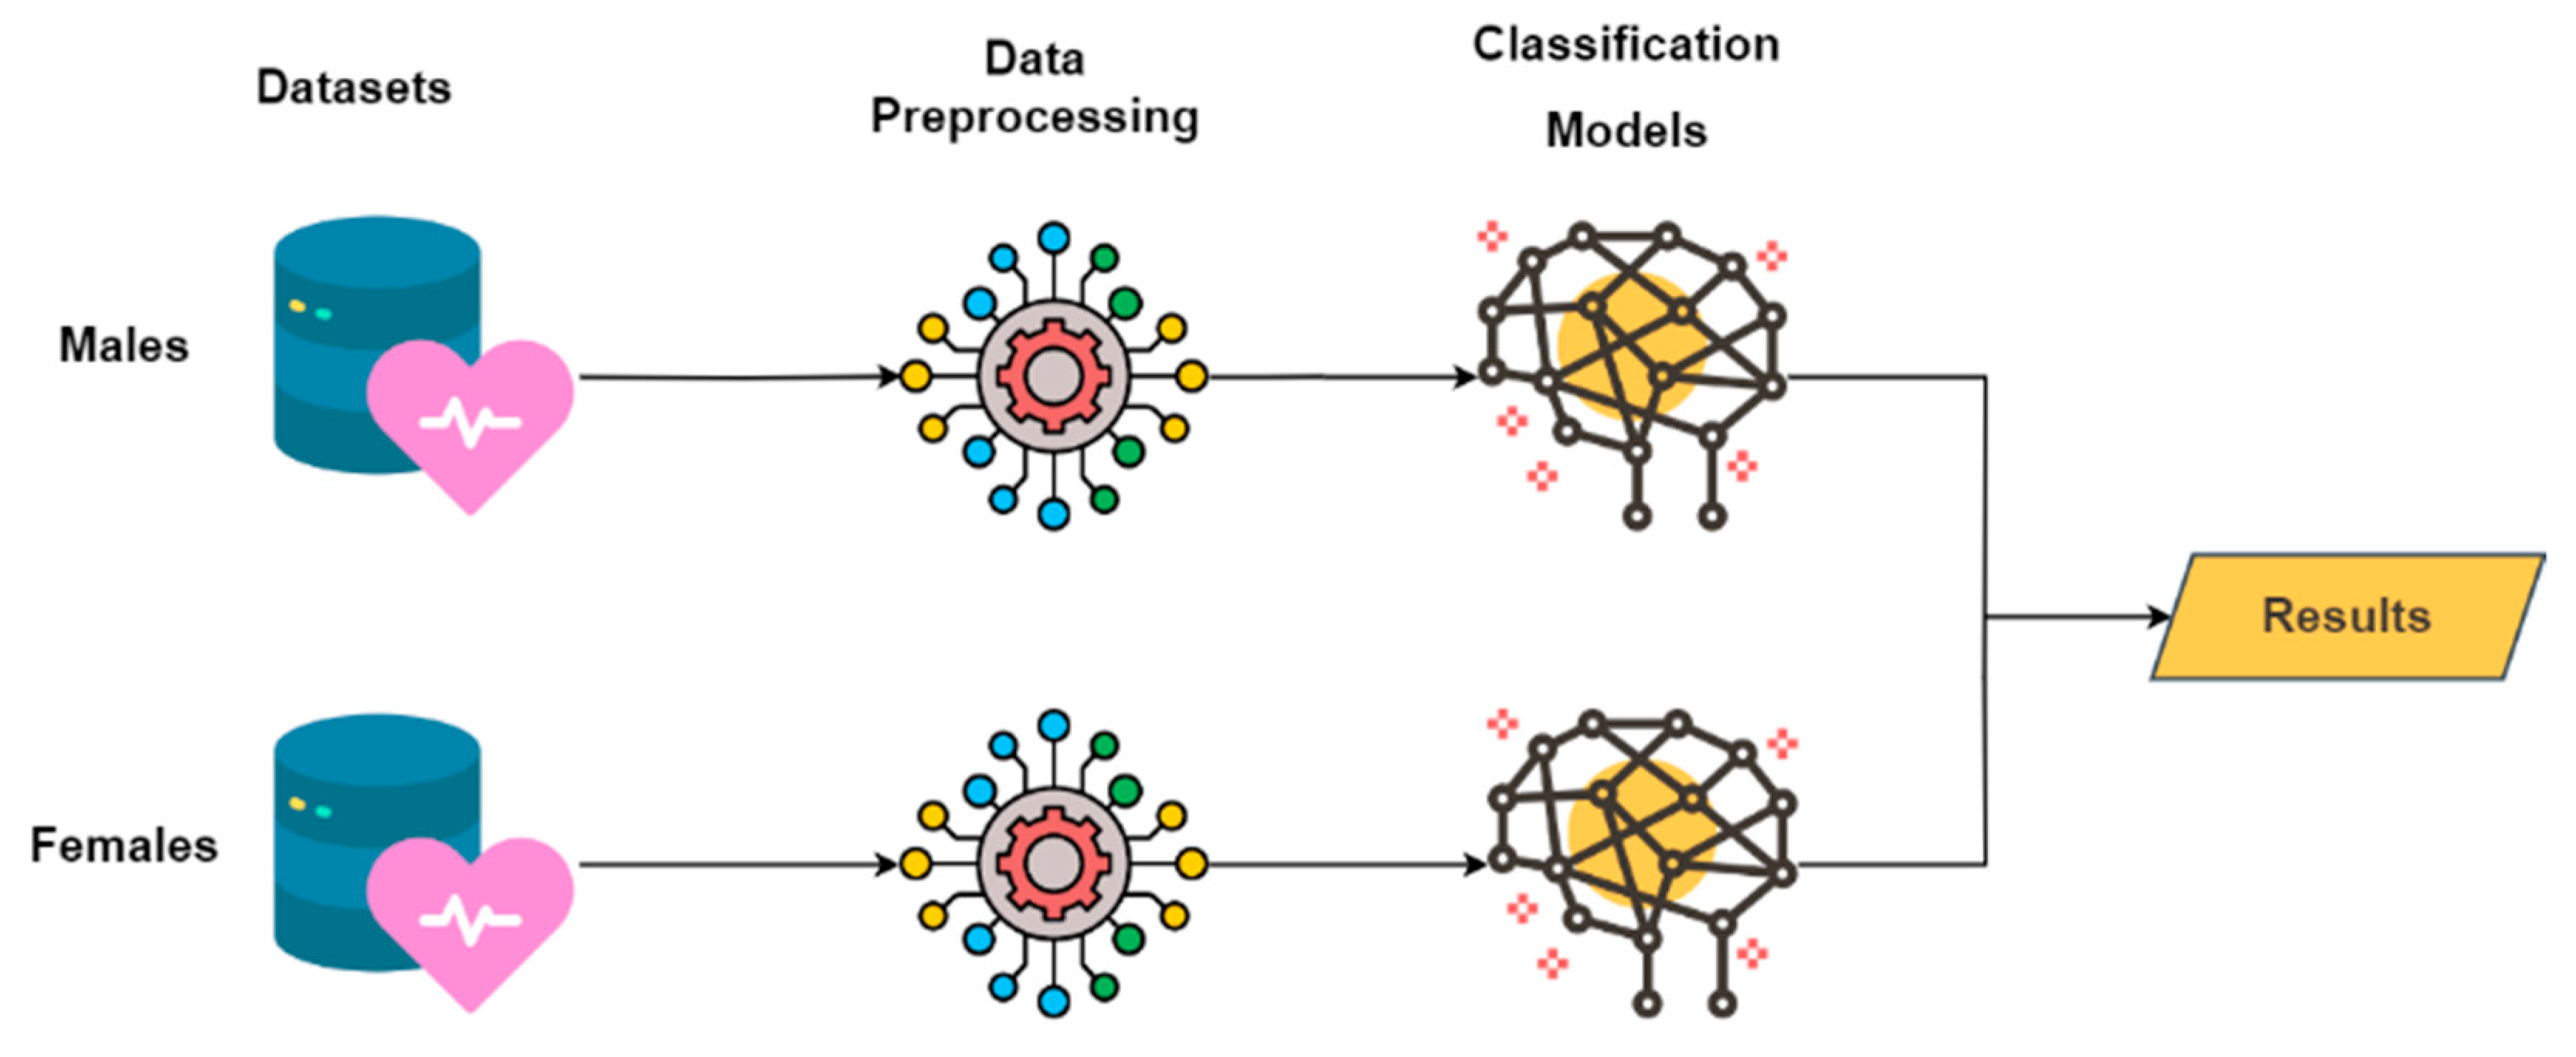
Table 2 and Table 3 summarize the numerical feature statistics of both the male and female datasets before the preprocessing step. The features include height, weight, MBF, BFP, BMI, VFA, WC, WHR, and FMI. The table provides the mean, median, standard deviation, range, minimum, and maximum values for each feature. These two tables show some unrealistic values that could lead to wrong conclusions, such as the minimum value of WC in both tables. Later, in the preprocessing section, the updated versions of these two tables are provided, which reflect more realistic values.

4. Methodology

Cardiometabolic disease encompasses a range of health conditions, such as heart failure, heart attack, stroke, and disorders affecting the heart and blood vessels. These conditions pose a significant public health challenge due to their widespread prevalence.
This study aims to build an artificial intelligence model for predicting the likelihood of developing a cardiometabolic disease among university students in Saudi Arabia. The dataset used in this study was collected from Imam Abdulrahman Bin Faisal University in the city of Dammam, Saudi Arabia.
This section addresses the dataset and its preprocessing steps, such as data cleaning, feature engineering, and other steps, in addition to the summary statistics for the dataset after the preprocessing steps. Moreover, we briefly describe each machine learning algorithm used in our research. Figure 1 presents the architectural design of the model.

4.1. Preprocessing Steps

Preprocessing, which includes essential processes to clean and improve raw data, is a crucial stage in data analysis and machine learning. The preprocessing step can vary depending on the dataset being used. In this section, we discuss the preprocessing steps that are necessary for the used datasets. Figure 2 below illustrates the sequence of these steps, encompassing data cleaning, feature engineering, and categorical encoding.

4.1.1. Data Cleaning

Through data cleaning, missing values in specific features were addressed to ensure the reliability and integrity of the data. There were several instances in the male and female datasets with missing values in some features. The features are VFA (cm2), WC (cm), and WHR. Due to the limited number of instances with missing values and to prevent potential errors or biases introduced by imputation or replacement, as well as to preserve the original distribution and variance of the data, we chose to eliminate instances with missing values. For females, the removal decreased instances from 183 to 174, while for males, it reduced from 127 to 121 instances. This step was crucial to maintain the data quality used in the analysis.

4.1.2. Feature Engineering

Feature engineering has the potential to extract new meaningful features that can uncover new observations and relationships within the dataset based on existing features. One of the features that exists in the datasets is the C index. This is a kind of measurement used to assess central obesity. It is based on the theory that individuals with more visceral fat have the shape of a cylinder. In contrast, those with more abdominal fat have a silhouette resembling a double cone, with one cone positioned above the other. Consequently, the C index falls between 1.73 (a perfect double cone) and 1.0 (a perfect cylinder). Compared to other anthropometric markers, the C index—which consists of three measurements, namely height, weight, and WC—is highly correlated with CMDs. Furthermore, compared to the other obesity indices, it was observed that the C index and the WHR were strong discriminators for CMD occurrences. A C index score equal to or exceeding 1.18 for women and 1.25 for men suggests a risk [2]. To facilitate the interpretation of C index scores within the datasets, we employed feature engineering by introducing a new feature termed “risk level.” We applied a fuzzy logic approach to predict the risk level feature. The fuzzy logic approach was chosen for predicting the “risk level” feature due to its ability to handle uncertainty and imprecision in a human-like manner. It provides a natural way to express the risk level, making the model more interpretable and applicable in practical scenarios. The fuzzy logic approach was implemented by categorizing the Conicity Index into four distinct risk levels for each gender. Since the C index scores indicating CMD risk vary between men and women, two distinct models were constructed to address each gender separately. For males, the categories are defined as follows: “None” for C index values ≤ 1.20, “Low” for values ranging from 1.21 to 1.30, “Medium” for values between 1.31 and 1.40, and “High” for values ≥ 1.41. Similarly, for females, the categories are designated as “None” for C index values ≤ 1.15, “Low” for values in the range of 1.16 to 1.20, “Medium” for values spanning 1.21 to 1.25, and “High” for values ≥ 1.26. This categorization helps us better grasp the risk linked to C index values and enhances the interpretability of the C index. See Table 4 and Table 5.

4.1.3. Categorical Encoding

Categorical encoding transforms categorical variables into numerical representations, enabling their seamless integration into machine learning algorithms. In the datasets used, all variables were already in the form of categorical encoding. However, the newly added risk level feature, derived through feature engineering, is categorical. To encode the risk level, we assigned numerical values as follows: 0 for None, 1 for Low, 2 for Medium, and 3 for High. This categorical encoding ensures that machine learning algorithms can effectively utilize the risk level feature for further analysis and modeling.

4.1.4. Overview of Statistics and Data Exploration Insights following Preprocessing

After preprocessing, the number of instances in the male dataset decreased from 127 to 121, and in the female dataset, it decreased from 183 to 174.
The distribution of risk levels among male instances, as illustrated in Figure 3, reveals the following breakdown: None (12), Low (53), Medium (35), and High (21). A noteworthy observation is the relatively higher prevalence of low-risk instances among males. Shifting the focus to females in Figure 4, the distribution is as follows: None (20), Low (131), Medium (19), and High (4). These data highlight a notable concentration of low-risk instances among females.
As mentioned in Section 4.1.2, among the other obesity indices, the WHR is one of the effective discriminators for CMD. Figure 5 comprehensively compares the WHR distributions between male and female instances. The box and whisker plot visually encapsulates the key statistical measures, including the median, quartiles, and outliers, providing a nuanced understanding of the WHR variation within each gender. The median WHR for males is calculated at 0.84, with an interquartile range (IQR) spanning from 0.80 to 0.97. On the other hand, the females exhibit a lower median WHR of 0.78, with an IQR extending from 0.72 to 0.8125.
Table 6 and Table 7 present the summary statistics of the numeric features in both the male and female datasets after preprocessing. The features include height, weight, MBF, BFP, BMI, VFA, WC, WHR, and FMI. For each feature, the table provides the mean, median, standard deviation, minimum, and maximum values. These statistics offer a concise overview of the central tendency, variability, and range of each feature in the dataset. Noticeable improvements have been made to the values in several features compared to the original dataset before preprocessing. These updates reflect a more realistic representation of the data.

4.2. Machine Learning Algorithms

Machine learning algorithms are categorized into two main types based on the learning they employ. The process of selecting an appropriate algorithm involves comparing the characteristics of the data with existing methods. Supervised learning algorithms, the first category, utilize labeled data to make predictions or classifications on new and untainted data, thus creating predictive models. On the other hand, unsupervised learning algorithms, the second category, identify patterns, connections, or structures in unlabeled data, enabling them to create descriptive models. These machine learning techniques significantly differ from conventional IT approaches as they rely on the learning process itself and extract specific behaviors from data to address various issues. Their versatility and ability to improve performance based on encountered data make them valuable tools across multiple fields [25].

4.2.1. Logistic Regression

Logistic Regression, a highly effective machine learning technique, is commonly employed for binary classification tasks. Despite its classification-based name, this method focuses on modeling the relationship between input factors and the likelihood of belonging to a specific class. By utilizing the sigmoid function, Logistic Regression converts the output of linear regression into a probability value ranging from 0 to 1, enabling precise binary classification decisions. Its praise stems from its simplicity, interpretability, and computational efficiency. Logistic Regression excels at handling both numerical and categorical features, making it particularly suitable for high-dimensional datasets. Its versatility is demonstrated by its application in various industries, including healthcare, banking, marketing, and social sciences, where it proves invaluable for tasks such as churn prediction, fraud detection, and sentiment analysis. With its interpretable nature and probabilistic outputs, Logistic Regression stands as an indispensable tool for real-world machine learning applications [26].

4.2.2. Random Forest

The utilization of Random Forest, a versatile and highly effective machine learning technique, is a widespread practice across various domains. This method, belonging to the ensemble learning family, is built upon Decision Trees. Random Forest effectively tackles the issue of overfitting and enhances generalization by combining multiple trees and making predictions through majority voting or averaging. Its applications encompass feature selection, regression, and classification tasks. Random Forest excels in handling vast datasets and high-dimensional spaces, making it an optimal choice for complex undertakings. Employing bootstrapping and random feature selection methods ensures diversity among the trees, thereby enhancing accuracy and robustness. Additionally, it provides feature importance scores, enabling efficient ranking and selection. The adaptability, scalability, and remarkable performance of Random Forest make it a go-to option for generating precise and comprehensible outcomes across a wide range of machine learning tasks [27].

4.2.3. Support Vector Machine

SVM is a machine learning approach that is a statistical learning-based algorithm. SVM has gained significant recognition as a robust method for classifying data. It relies on support vectors, which are data points positioned closest to the decision surface, playing a pivotal role in the SVM algorithm. SVM effectively categorizes data vectors by employing a hyperplane in a space with multiple dimensions. The maximal margin classifier, a fundamental variant of SVM, focuses on scenarios where training data can be linearly separated with binary classification. It identifies the hyperplane that maximizes the margin in complex real-world situations. SVM offers numerous benefits, such as versatility in handling diverse classification problems, including those with high-dimensional data and nonlinear separability. Nonetheless, a notable limitation of SVM is the necessity to accurately set multiple parameters to attain optimal classification outcomes [28].

4.2.4. K-Nearest Neighbors

KNN is a well-known and widely used machine learning technique employed in classification and regression tasks. It operates by identifying the closest neighboring data points in the feature space. By storing the training dataset and applying a chosen distance metric, KNN identifies the K-Nearest neighbors. In regression, it calculates the average values of these neighbors, while in classification, it assigns the most prevalent class label among the neighbors. The strength of KNN lies in its clarity and interpretability, making it a valuable tool across various domains. However, as the dataset size increases, the computational complexity of KNN may also rise. Nonetheless, KNN proves to be highly effective in tasks such as anomaly detection, pattern identification, and recommendation systems, providing a straightforward and adaptable solution to machine learning challenges [23].

4.2.5. Gradient Boosting

A Gradient Boosting (GB) Algorithm employs a sequential ensemble of trees, where an initial weak tree model with minimal splits is trained and iteratively improved by incorporating new trees [29]. Each subsequent tree in the sequence aims to rectify the previous prediction errors.
In the context of Gradient Boosting, commonly known as GB, the learning process iteratively fits new models to enhance the accuracy of the response variable predictions. The choice of loss functions can be arbitrary, but for illustrative purposes, if the chosen loss function is the traditional squared-error loss, the learning process would focus on iteratively minimizing errors. The selection of a suitable loss function is typically left to the practitioner, given the wide range of available options and the potential for custom loss functions. This adaptability empowers GB to be tailored to specific data-driven tasks, granting considerable flexibility in model design and necessitating a trial-and-error approach in selecting the most appropriate loss function. Nonetheless, boosting algorithms are relatively straightforward to implement, enabling experimentation with different model designs. Furthermore, GB has demonstrated notable success in practical applications and across various machine learning and data mining challenges.

5. Experimental Results and Discussion

5.1. Evaluation Metrics

The evaluation metrics discussed in this section are performance assessment indicators that gauge the classification precision of a predictive model. They offer a comprehensive overview of the model’s predictions in relation to the true labels of the data.

5.1.1. Accuracy

Accuracy is a commonly used performance measure in machine learning classification tasks. It quantifies the overall correctness of a predictive model by calculating the proportion of correctly classified instances out of the total number of instances. Accuracy is calculated using the following formula:
A c c u r a c y = T P + F N T P + F P + T N + F N ×   100 %
where
  • TP (True Positive): The number of occurrences that are accurately identified as positive or falling within the positive category;
  • TN (True Negative): A measure of how many instances were accurately identified as negative or falling under the category of negatives;
  • FP (False Positive): The number of occurrences that are falsely predicted as positive when they really fall under the negative class (Type I error or false alarms);
  • FN (False Negative): The number of cases that are falsely predicted as negative when they really fall within the positive class (Type II error or missed detections).
Accuracy is a straightforward and intuitive measure. It provides a single value that indicates the percentage of correct predictions made by the model. Higher accuracy values indicate a more accurate and reliable model [30].

5.1.2. Precision

Precision is a performance measure in machine learning classification tasks that evaluates the accuracy of positive predictions made by a model. It quantifies the proportion of correctly predicted positive instances out of all instances that were predicted as positive. Precision is calculated using the following formula:
P r e c i s i o n = F P T P + F P   ×   100 %
Precision is a critical metric, especially in machine learning model evaluations where the cost of false positives is high or when the focus is on the positive class. It provides in-depth information about the model’s capability to avoid false alarms and accurately identify positive instances. A high precision value indicates that the model has a low rate of incorrectly predicting negative instances as positive. It suggests that, when the model predicts an instance as positive, it is more likely to be correct. On the other hand, a low precision value indicates a higher rate of false positives, indicating that the model may be prone to incorrectly classifying negative instances as positive [24,30].

5.1.3. Recall

Recall plays a crucial role in evaluating the effectiveness of machine learning algorithms, particularly for tasks that prioritize the accurate identification of positive instances. It measures the ability of the model to correctly distinguish all positive cases from the actual positives that are present in the dataset. The recall calculation involves dividing the total number of TPs by the sum of TPs and FNs. A higher recall score is advantageous as it reduces the likelihood of false negatives, indicating a lower chance of missing important examples. In medical diagnostics, recall holds significant importance as it helps prevent patients with certain illnesses from being misclassified as negative, ensuring precise and accurate diagnoses. By optimizing recall, the model’s sensitivity and overall predictive power are enhanced, leading to improved performance.
R e c a l l = T P T P + F N   ×   100 %

5.1.4. F1-Score

The F1-score is a popular measurement used in machine learning to evaluate how well a model performs. It gives a fair assessment by looking at both precision and recall. It is beneficial when working with imbalanced datasets, where there is a big difference in the number of positive and negative cases. The F1-score is calculated as the harmonic mean of recall and precision, effectively combining these two measures. While recall evaluates a model’s ability to identify all positive instances, precision gauges the accuracy of the positive predictions. By incorporating both precision and recall, the F1-score provides a comprehensive measure of a model’s performance in balancing the two. A higher F1-score indicates an improved balance and enhances the model’s reliability. The F1-score is valuable in decision-making processes as it offers a complete performance evaluation, helping to reduce false positives and negatives in applications such as spam detection or disease diagnosis [24,30].
F 1 - Score = 2   ( P r e c i s i o n   ×   R e c a l l ) P r e c i s i o n + R e c a l l   ×   100 %

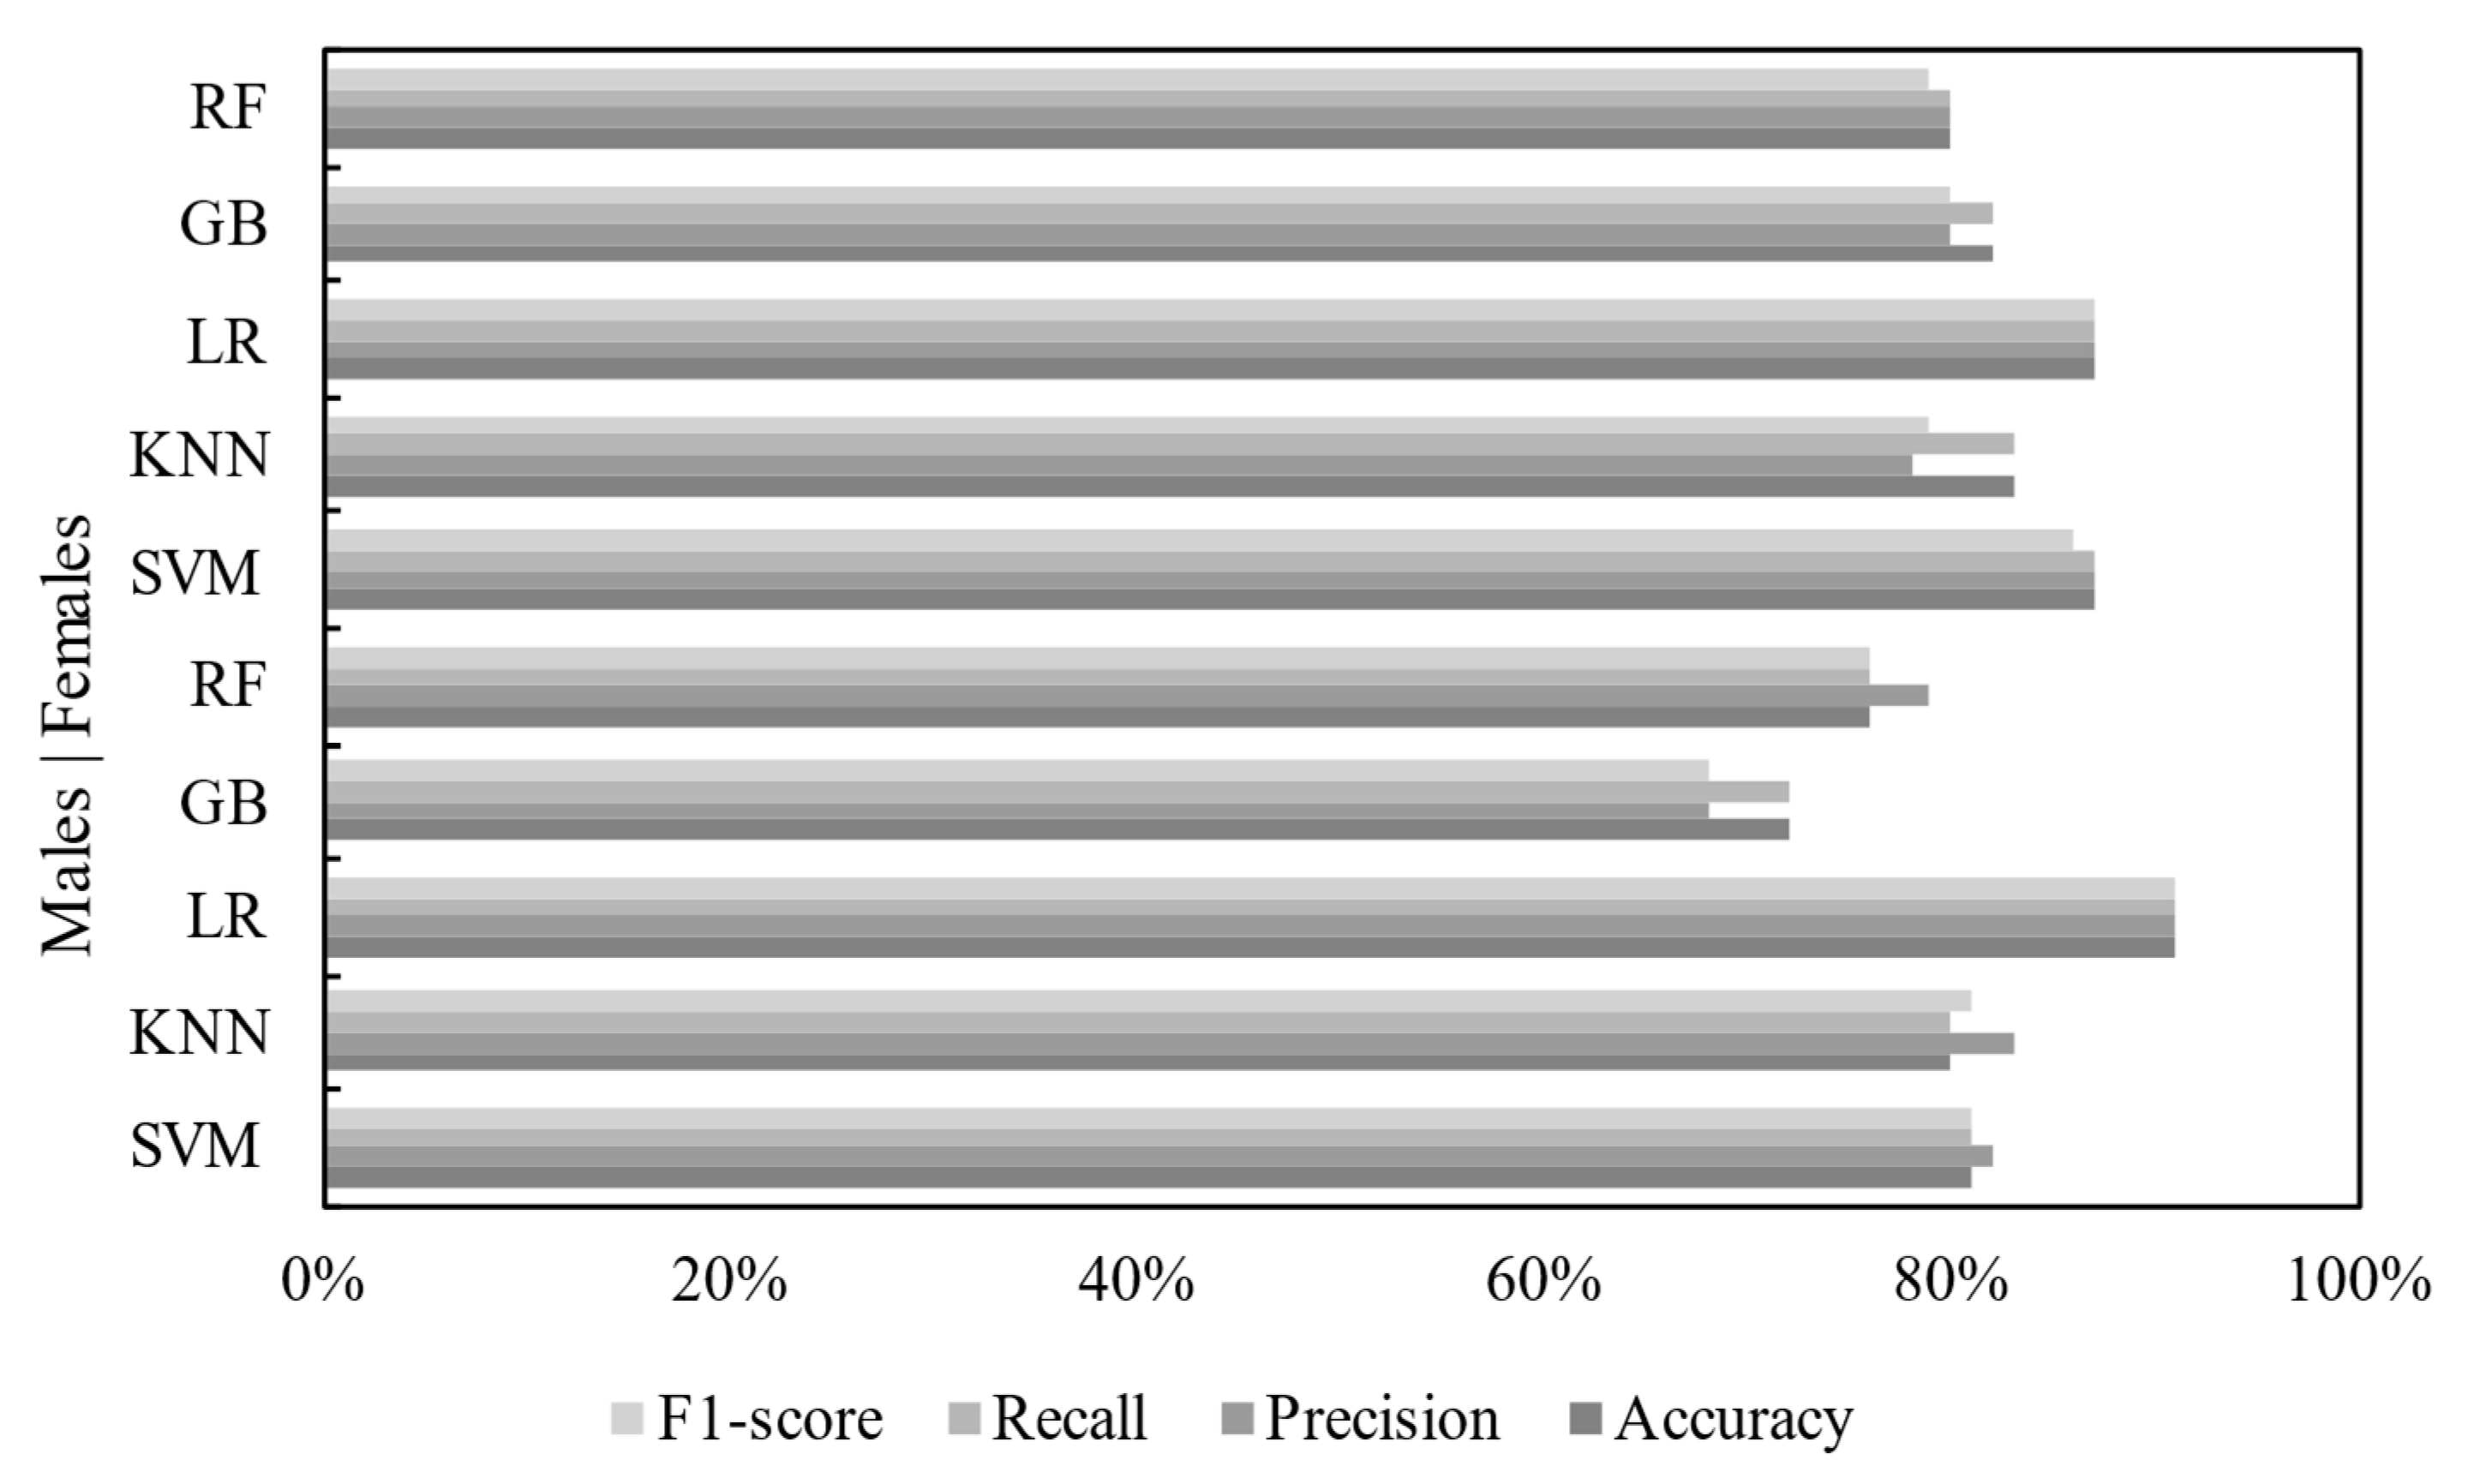
5.2. Model Performance Results

Five different classifiers were used in this study to predict the presence of CMDs based on the genders of patient profiles. In the context of CMD prediction among males, a thorough evaluation of five distinct classifiers—SVM, K-Nearest Neighbor (KNN), Logistic Regression, Gradient Boosting, and Random Forest—revealed intriguing insights. Logistic Regression emerged as the top performer with an outstanding accuracy score of 91%, showcasing its proficiency in identifying CMD patterns in male patient profiles. However, the lowest performer among males was Gradient Boosting, attaining an accuracy score of 72%. The Table 8 demonstrates the scores achieved by the classifiers among males.
Both Support Vector Machine and Logistic Regression emerged as the top performers among females, each securing an accuracy score of 87%, which indicates their effectiveness in identifying CMD patterns in female patient profiles. In contrast, the lowest performer in the female cohort was Random Forest with an accuracy score of 80%. These results underscore the nuanced landscape of CMD prediction among females, emphasizing the importance of classifier selection and tailoring predictive models to gender-specific patterns. The Table 9 illustrates the detailed scores achieved by each classifier among females.
A comparative analysis of the performance measure scores between male and female populations in predicting CMDs reveals intriguing patterns (Figure 6). In the male demographic, Logistic Regression emerged as the top performer with a remarkable accuracy score of 91%, showcasing its exceptional proficiency in identifying CMD patterns. The best precision score, recall score, and F1-score were all achieved by Logistic Regression, each reaching 91%. On the other hand, females exhibited dual leadership, with both Support Vector Machine and Logistic Regression achieving the top accuracy, precision, and recall scores of 87%. Logistic Regression attained the highest F1-score, reaching 87%. Notably, Gradient Boosting demonstrated the lowest accuracy among males, scoring 72%, while Random Forest performed the lowest among females with an accuracy score of 80%. Below lies a graphical representation illustrating the comparative scores across male and female populations.
In comparison with the studies in the literature, presented in Table 1, it is clear that the studies in the literature exhibit a considerable level of diversity, with each study incorporating unique features, methodologies, and datasets, making a fair comparison difficult. However, generally, the obtained results show that the proposed model effectively predicts the risk of cardiometabolic diseases.
Additionally, the proposed model utilizes the fuzzy logic approach to predict the risk level of cardiometabolic diseases, which is a methodology that was not employed in prior studies. This approach enhances the interpretability of the model and provides a more intuitive way of expressing the risk level.
Furthermore, the proposed model explores the use of the C index, as a novel feature that was previously unused, to predict the risk factors associated with cardiometabolic diseases.
Although the results of this study are promising, it is important to acknowledge several limitations before drawing conclusions. The dataset used in this study is limited, comprising only 174 records for the female model and 121 records for the male model. In addition, the current dataset lacks a correlation between the data on cardiometabolic profiles and other health and lifestyle information of the participants. It is recommended that future research should take these aspects into consideration during the data collection process.
Artificial intelligence models have emerged as powerful tools in the early detection of diseases or their complications, revolutionizing the field of medicine by using complex algorithms to analyze archived patient data, including genetic information, medical history, and lifestyle factors [31].
Multimodal artificial intelligence holds great promise in carrying out more accurate disease risk assessments and stratifications, as well as optimizing the key driving factors in CMD management. For instance, a study by Weng et al. (2017) found a 3.2% improvement in the prediction accuracy for coronary artery disease using machine learning algorithms [32].
Recently, researchers have demonstrated the practicality of machine learning algorithms and building clinical risk prediction models. By leveraging artificial intelligence, healthcare professionals can detect subtle changes in patient health that may indicate the onset of CVDs and optimize the key driving factors in CMD management using a simple method before medical interventions. This early detection is crucial, especially for CVDs, as it enables timely interventions and prevents fatal outcomes.
The application of artificial intelligence in predicting CVDs represents a significant advancement in preventive medicine, offering a proactive approach to managing these life-threatening conditions. Additionally, machine learning can help to identify temporal relations among events in electronic health records to improve a model’s performance in predicting initial diagnosis results.

6. Conclusions

CMDs encompass a variety of health conditions, such as heart attack, stroke, and various disorders. The early detection and diagnosis of CMDs are crucial for providing effective care. This study systematically investigated the application of machine learning algorithms to predict the risk of developing CMDs utilizing a dataset of 295 records and focusing on male and female university students in Saudi Arabia.
A fuzzy logic approach was utilized for the Conicity Index feature, as a novel feature that was previously unused, enhancing the interpretability and discriminatory power of the proposed models. The implementation of fuzzy logic included categorizing the risk into four levels: None, Low, Medium, and High. Given the differences in the Conicity Index scores indicating CMD risk between men and women, two distinct models will be developed to address each gender individually.
It is concluded that the findings of the present study will also improve the economic, social, and medical outcomes of patients with CVDs. Unusual detected features may also aid healthcare providers in assessing individuals’ medical conditions.

Author Contributions

Conceptualization, D.M. and M.A.-H.; methodology, A.A., I.A., M.A. (Mohammed Alghamdi), H.A., M.A. (Mohammed Albugami), F.A. and S.E.-A.; supervision, D.M. and M.A.-H.; writing original draft, A.A., I.A., M.A. (Mohammed Alghamdi), H.A., M.A. (Mohammed Albugami), and F.A.; validation and editing original draft, D.M., M.A.-H and A.A. All authors have read and agreed to the published version of the manuscript.

Funding

The authors received no financial support for this research.

Institutional Review Board Statement

Ethical review and approval were obtained from the Institutional Review Board of Imam Abdulrahman Bin Faisal University (IRB-2018-19-112).

Data Availability Statement

Data are available upon request from the authors.

Conflicts of Interest

The authors declare no conflicts of interest.

References

  1. Ahmad, A.; Elbadawi, N.E.; Osman, M.S.; Elmahdi, E.M. The Prevalence and Risk Factors of Obesity among Medical Students at Shaqra University, Saudi Arabia. Ann. Med. Health Sci. Res. 2020, 10, 903–906. [Google Scholar]
  2. Albaker, W.; El-Ashker, S.; Baraka, M.A.; El-Tanahi, N.; Ahsan, M.; Al-Hariri, M. Adiposity and Cardiometabolic Risk Assessment among University Students in Saudi Arabia. Sci. Prog. 2021, 104, 0036850421998532. [Google Scholar] [CrossRef]
  3. Atehortúa Labrador, A.M.; Gkontra, P.; Camacho, M.; Diaz, O.; Bulgheroni, M.; Simonetti, V.; Chadeau-Hyam, M.; Felix, J.F.; Sébert, S.P.; Lekadir, K. Cardiometabolic Risk Estimation Using Exposome Data and Machine Learning. Int. J. Med. Inform. 2023, 179, 105209. [Google Scholar] [CrossRef]
  4. Gerrits, N.; Elen, B.; Van Craenendonck, T.; Triantafyllidou, D.; Petropoulos, I.N.; Malik, R.A.; De Boever, P. Age and Sex Affect Deep Learning Prediction of Cardiometabolic Risk Factors from Retinal Images. Sci. Rep. 2020, 10, 9432. [Google Scholar] [CrossRef] [PubMed]
  5. Pang, X.; Forrest, C.B.; Lê-Scherban, F.; Masino, A.J. Prediction of Early Childhood Obesity with Machine Learning and Electronic Health Record Data. Int. J. Med. Inform. 2021, 150, 104454. [Google Scholar] [CrossRef] [PubMed]
  6. El-Ashker, S.; Pednekar, M.S.; Narake, S.S.; Albaker, W.; Al-Hariri, M. Blood Pressure and Cardio-Metabolic Risk Profile in Young Saudi Males in a University Setting. Medicina 2021, 57, 755. [Google Scholar] [CrossRef]
  7. Banerjee, A.; Chen, S.; Dashtban, M.; Pasea, L.; Thygesen, J.H.; Fatemifar, G.; Tyl, B.; Dyszynski, T.; Asselbergs, F.W.; Lund, L. Identifying Subtypes of Heart Failure with Machine Learning: External, Prognostic and Genetic Validation in Three Electronic Health Record Sources with 320,863 Individuals. medRxiv 2022, 2022–2026. [Google Scholar] [CrossRef]
  8. O’Sullivan, T.A.; Schmidt, K.A.; Kratz, M. Whole-Fat or Reduced-Fat Dairy Product Intake, Adiposity, and Cardiometabolic Health in Children: A Systematic Review. Adv. Nutr. 2020, 11, 928–950. [Google Scholar] [CrossRef]
  9. Arisaka, O.; Ichikawa, G.; Koyama, S.; Sairenchi, T. Childhood Obesity: Rapid Weight Gain in Early Childhood and Subsequent Cardiometabolic Risk. Clin. Pediatr. Endocrinol. 2020, 29, 135–142. [Google Scholar] [CrossRef]
  10. Tsai, T.-Y.; Hsu, P.-F.; Lin, C.-C.; Wang, Y.-J.; Ding, Y.-Z.; Liou, T.-L.; Wang, Y.-W.; Huang, S.-S.; Chan, W.-L.; Lin, S.-J. Factor Analysis for the Clustering of Cardiometabolic Risk Factors and Sedentary Behavior, a Cross-Sectional Study. PLoS ONE 2020, 15, e0242365. [Google Scholar] [CrossRef]
  11. Berkowitz, S.A.; Basu, S.; Venkataramani, A.; Reznor, G.; Fleegler, E.W.; Atlas, S.J. Association between Access to Social Service Resources and Cardiometabolic Risk Factors: A Machine Learning and Multilevel Modeling Analysis. BMJ Open 2019, 9, e025281. [Google Scholar] [CrossRef]
  12. Shang, X.; Li, Y.; Xu, H.; Zhang, Q.; Liu, A.; Du, S.; Guo, H.; Ma, G. Leading Dietary Determinants Identified Using Machine Learning Techniques and a Healthy Diet Score for Changes in Cardiometabolic Risk Factors in Children: A Longitudinal Analysis. Nutr. J. 2020, 19, 1–16. [Google Scholar] [CrossRef]
  13. Taghiyev, A.; Altun, A.A.; Caglar, S. A Hybrid Approach Based on Machine Learning to Identify the Causes of Obesity. J. Control Eng. Appl. Inform. 2020, 22, 56–66. [Google Scholar]
  14. Chatterjee, A.; Gerdes, M.W.; Martinez, S.G. Identification of Risk Factors Associated with Obesity and Overweight—A Machine Learning Overview. Sensors 2020, 20, 2734. [Google Scholar] [CrossRef] [PubMed]
  15. Ferdowsy, F.; Rahi, K.S.A.; Jabiullah, M.I.; Habib, M.T. A Machine Learning Approach for Obesity Risk Prediction. Curr. Res. Behav. Sci. 2021, 2, 100053. [Google Scholar] [CrossRef]
  16. Agrawal, S.; Klarqvist, M.D.R.; Diamant, N.; Stanley, T.L.; Ellinor, P.T.; Mehta, N.N.; Philippakis, A.; Ng, K.; Claussnitzer, M.; Grinspoon, S.K. Association of Machine Learning-Derived Measures of Body Fat Distribution with Cardiometabolic Diseases in >40,000 Individuals. medRxiv 2021, 2021–2025. [Google Scholar] [CrossRef]
  17. Thamrin, S.A.; Arsyad, D.S.; Kuswanto, H.; Lawi, A.; Nasir, S. Predicting Obesity in Adults Using Machine Learning Techniques: An Analysis of Indonesian Basic Health Research 2018. Front. Nutr. 2021, 8, 669155. [Google Scholar] [CrossRef] [PubMed]
  18. Safaei, M.; Sundararajan, E.A.; Driss, M.; Boulila, W.; Shapi’i, A. A Systematic Literature Review on Obesity: Understanding the Causes & Consequences of Obesity and Reviewing Various Machine Learning Approaches Used to Predict Obesity. Comput. Biol. Med. 2021, 136, 104754. [Google Scholar]
  19. Kerkadi, A.; Suleman, D.; Salah, L.A.; Lotfy, C.; Attieh, G.; Bawadi, H.; Shi, Z. Adiposity Indicators as Cardio-Metabolic Risk Predictors in Adults from Country with High Burden of Obesity. Diabetes Metab. Syndr. Obes. Targets Ther. 2020, 13, 175. [Google Scholar] [CrossRef] [PubMed]
  20. Gorgey, A.S.; Ennasr, A.N.; Farkas, G.J.; Gater, D.R., Jr. Anthropometric Prediction of Visceral Adiposity in Persons with Spinal Cord Injury. Top. Spinal Cord Inj. Rehabil. 2021, 27, 23–35. [Google Scholar] [CrossRef] [PubMed]
  21. Beck, D.; De Lange, A.-M.G.; Alnæs, D.; Maximov, I.I.; Pedersen, M.L.; Leinhard, O.D.; Linge, J.; Simon, R.; Richard, G.; Ulrichsen, K.M. Adipose Tissue Distribution from Body MRI Is Associated with Cross-Sectional and Longitudinal Brain Age in Adults. NeuroImage Clin. 2022, 33, 102949. [Google Scholar] [CrossRef]
  22. Sajid, M.R.; Almehmadi, B.A.; Sami, W.; Alzahrani, M.K.; Muhammad, N.; Chesneau, C.; Hanif, A.; Khan, A.A.; Shahbaz, A. Development of Nonlaboratory-Based Risk Prediction Models for Cardiovascular Diseases Using Conventional and Machine Learning Approaches. Int. J. Environ. Res. Public Health 2021, 18, 12586. [Google Scholar] [CrossRef]
  23. Guarneros-Nolasco, L.R.; Cruz-Ramos, N.A.; Alor-Hernández, G.; Rodríguez-Mazahua, L.; Sánchez-Cervantes, J.L. Identifying the Main Risk Factors for Cardiovascular Diseases Prediction Using Machine Learning Algorithms. Mathematics 2021, 9, 2537. [Google Scholar] [CrossRef]
  24. Reddy, K.V.V.; Elamvazuthi, I.; Aziz, A.A.; Paramasivam, S.; Chua, H.N.; Pranavanand, S. Heart Disease Risk Prediction Using Machine Learning Classifiers with Attribute Evaluators. Appl. Sci. 2021, 11, 8352. [Google Scholar] [CrossRef]
  25. Khennou, F.; Fahim, C.; Chaoui, H.; Chaoui, N.E.H. A Machine Learning Approach: Using Predictive Analytics to Identify and Analyze High Risks Patients with Heart Disease. Int. J. Mach. Learn. Comput. 2019, 9, 762–767. [Google Scholar] [CrossRef]
  26. Schober, P.; Vetter, T.R. Logistic Regression in Medical Research. Anesth. Analg. 2021, 132, 365. [Google Scholar] [CrossRef] [PubMed]
  27. Sun, W.; Zhang, P.; Wang, Z.; Li, D. Prediction of Cardiovascular Diseases Based on Machine Learning. ASP Trans. Internet Things 2021, 1, 30–35. [Google Scholar] [CrossRef]
  28. Soofi, A.A.; Awan, A. Classification Techniques in Machine Learning: Applications and Issues. J. Basic Appl. Sci 2017, 13, 459–465. [Google Scholar] [CrossRef]
  29. Natekin, A.; Knoll, A. Gradient Boosting Machines, a Tutorial. Front. Neurorobotics 2013, 7, 21. [Google Scholar] [CrossRef]
  30. Ghosh, P.; Azam, S.; Jonkman, M.; Karim, A.; Shamrat, F.M.J.M.; Ignatious, E.; Shultana, S.; Beeravolu, A.R.; De Boer, F. Efficient Prediction of Cardiovascular Disease Using Machine Learning Algorithms with Relief and LASSO Feature Selection Techniques. IEEE Access 2021, 9, 19304–19326. [Google Scholar] [CrossRef]
  31. Gollapalli, M.; Alansari, A.; Alkhorasani, H.; Alsubaii, M.; Sakloua, R.; Alzahrani, R.; Al-Hariri, M.; Alfares, M.; AlKhafaji, D.; Al Argan, R.; et al. A Novel Stacking Ensemble for Detecting Three Types of Diabetes Mellitus Using a Saudi Arabian Dataset: Pre-Diabetes, T1DM, and T2DM. Comput. Biol. Med. 2022, 147, 105757. [Google Scholar] [CrossRef] [PubMed]
  32. Weng, S.F.; Reps, J.; Kai, J.; Garibaldi, J.M.; Qureshi, N. Can Machine-Learning Improve Cardiovascular Risk Prediction Using Routine Clinical Data? PLoS ONE 2017, 12, e0174944. [Google Scholar] [CrossRef] [PubMed]
Figure 1. The architectural design of the model.
Bdcc 08 00031 g001
Figure 2. The preprocessing steps for the used datasets.
Bdcc 08 00031 g002
Figure 3. The distribution of risk levels among instances in the male dataset.
Bdcc 08 00031 g003
Figure 4. The distribution of risk levels among instances in the female dataset.
Bdcc 08 00031 g004
Figure 5. WHR distribution in males and females.
Bdcc 08 00031 g005
Figure 6. Gender comparison of classifier performance metrics.
Bdcc 08 00031 g006
Table 1. Summary of literature review on utilizing machine learning approaches for cardiometabolic disease.
Ref.Authors (Year)AimModels or ClassifiersDataset Size and SourceStrengthWeaknessPerformance Measurements
[18]Safaei, M. et al. (2021)Reviewing ML techniques used for obesity prediction; one study conducted for early childhood obesityRandom Forest, ID3, Naïve Bayes, Random Tree, J48, Bayes trainedA pediatric clinical decision support system called CHICAContributes to a concerning topicThe accuracy score was not that great compared to that of other papers reviewed in the same paper85% accuracy and 89% sensitivity
[16]Agrawal, S. et al. (2021)Exploring the clinical implications of how fat is distributed in the bodyCNNsMRI imaging data of 40,032 UK Biobank participantsAccuracy was near perfectDoes not mention the exact percentage of accuracyNear perfection (number not mentioned)
[17]Thamrin, S.A. et al. (2021)Utilizing machine learning methods to predict obesity in adultsLogistic Regression, Classification and Regression Trees (CARTs), and Naïve Bayes634,709 respondents; was requested at the Institute of Health Research and Development of the Indonesian Ministry of HealthUsed a novel approach with sophisticated ML techniques instead of using traditional prediction modelsN/AAccuracy of 0.798
[7]Banerjee, A. et al. (2022)Identifying subtypes of heart failure with machine learningUnsupervised ML methods (Kmeans, hierarchical, K-Medoids, and mixture model clustering)320,863 Clinical Practice Research Datalink, CPRD, and the Health Improvement NetworkLarge dataset sizeThe accuracy score, F1 score, and precision score were not mentionedGood predictive accuracy, as authors claim
[10]Tsai, T.-Y. et al. (2020)Exploring the clustering pattern of CVD risk factors using exploratory factor analysis to investigate the underlying relationships between various CVD risk factorsN/A5606 from Taipei Veterans General Hospital InstitutionalReducing sedentary behavior and addressing multiple cardiometabolic risk factors to prevent cardiometabolic diseasesN/AN/A
[11]Berkowitz, S.A. et al. (2019)Determining association between access to social
service resources and cardiometabolic
risk factors
Random Forest with multilevel modeling method123,355 participants from the National Health and Nutrition Examination Survey (NHANES) in the United StatesUsed multilevel modeling analysis to examine the association between access to social service resources and cardiometabolic risk factors, such as obesity, diabetes, and high blood pressure Restricted access to social service resourcesN/A
[12]Shang, X. et al. (2020)Urgently identifying leading dietary determinants for cardiometabolic risk (CMR) factors to
prioritize interventions in children
Random Forest, gradient boost machine, and multiple linear regression model5676 children aged 6–13 yearsUsed multiple linear regression modelMachine learning methodology was not very precise or clearN/A
[13]Taghiyev, A. et al. (2020)Using a machine learning model to identify the causes of obesityHybrid model, DT, and LR56 attributes and
500 instances
Compared the hybrid model with other classification models, such as DT and LR N/AHybrid model achieved 91.4% accuracy, 90.4% recall, and 92.9% specificity
[15]Ferdowsy, F. et al. (2021)Using a machine learning model to predict obesity risksKNN, LR, MLP, SVM, NB, ADA Boosting, DT, and Gradient Boosting 1000 records High accuracy Small dataset compared to other papersLR achieved 97.09% accuracy
[14]Chatterjee, A. et al. (2020)Using a machine learning approach to identify obesity risk factors in addition to presenting an overviewSVM, NB, DT, RF, and KNN500 recordsHigh accuracySmall dataset compared to other papersSVM achieved 95% accuracy
[9]Arisaka, O. et al. (2020)Assessing the latest research on the relationship between early fast growth and future risks for obesity and cardiometabolic conditionsN/AN/AN/AN/AN/A
[3]Atehortúa, A. et al. (2023)Introducing a fair machine learning model that predicts the risks of acquiring cardiovascular disease (CVD) and type 2 diabetes (T2D) by utilizing easily accessible exposome factorsA novel, fair machine learning (ML) model5348 participants who were diagnosed with CVD and 1534 participants who were diagnosed with (T2D)Novel approach, large dataset, and comparative analysisLimited generalizability and model complexityROC-AUC values of 0.78 ± 0.01 and 0.77 ± 0.01 for CVD and T2D risk prediction, respectively
[2]Albaker, W. et al. (2021)Determining the prevalence of adiposity and the risk of cardiometabolic disease among Saudi university studentsN/A310 subjects (with 127 males and 183 females), Imam Abdulrahman Bin Faisal University (IAU)Assessment of adiposity and cardiometabolic risk among university students, emphasizing early prediction and prevention of obesity-related health issuesLimited sample size and potential generalizability limitationsN/A
[5]Pang, X. et al. (2021)Comparing machine learning models for predicting childhood obesity using EHR data up to age 2 and evaluating their performance in predicting obesity incidence up to 7 years of ageXGBoost, DT, SVM, LR, NN, GNB, and BNB860,510 patients with 11,194,579 healthcare encounters, Children’s Hospital of PhiladelphiaLarge dataset, comparison of multiple modelsData limitation and model performanceUsing XGBoost:
AUC: 0.81
Sensitivity: 80%
Precision: 30.90%
F1-score: 44.60%
Accuracy: 66.14%
Specificity: 63.27%
[4]Gerrits, N. et al. (2020)Examining the use of deep learning models trained on retinal images to predict cardiometabolic risk factorsMobileNet-V2 architectureRetinal images from 3000 Qatari citizens, Qatar Biobank studyLarge dataset, acceptable performance for several cardiometabolic risk factorsLimited generalizabilityAge prediction: MAE of 2.78 years
Sex prediction: AUC of 0.97
SBP prediction: MAE of 8.96 mmHg
DBP prediction: MAE of 6.84 mmHg
[6]EL-Ashker et al. (2021)Investigating the metabolic risk factors and their association with blood pressure alteration in young Saudi males in a university settingROC and AUC curves and Logistic Regression284 male university students from the Eastern ProvinceProvides valuable insights into the cardiovascular health of young Saudi men in a university settingThe study only focuses on male university students in one region of Saudi Arabia, so the results may not be generalizable to other populationsROC curve BMI (specificity = 0.806, sensitivity = 0.811)
WC (sensitivity = 0.876, specificity = 0.746)
WHR (sensitivity = 0.908 specificity = 0.092)
WHtR (sensitivity = 0.811 specificity = 0.776)
[19]Kerkadi et al. (2020)Comparing different methods of assessing adiposity to identify risk of developing CM issues among Qatari adultsROC and AUC curves558 healthy Qatari adults aged 20 to 50 years; data obtained from Qatar Biobank surveyUsed a large sample size and compared different methods of assessing adiposityDoes not provide explicit information on the study’s resultsTG
(AUC = 0.556), HDL (AUC = 0.556), and TG/HDL (AUC = 0.581)
HbA1c (AUC = 0.629), and VAT for Tyr (AUC = 0.626)
[20]Gorgey et al. (2021)Creating a formula that can predict visceral adiposity in people with spinal cord injury using anthropometric measurementsN/AMen who had complete motor spinal cord injuriesOffers insights into the factors causing visceral adiposity in individuals with SCI; suggests a practical tool for healthcare providers to identify those at risk of central obesity-related health problemsOnly analyzed data from a small group of men who had complete motor spinal cord injuriesN/A
[21]Beck et al. (2022)Examining the correlation between adipose tissue distribution from body MRI and brain ages in middle-aged individuals Bayesian multilevel modeling and XGBoost1062 brain MRI data from 790 participants with age range of 19–86; data obtained from NIPH’s Twin StudyCombined cross-sectional and longitudinal designs to explore link between adipose measures during follow-up and brain’s biological age; examined cross-sectional relationships between tissue-specific BAG, adipose tissue measures, and conventional anthropometric measuresSmall sample size during follow-up, which reduces its statistical power; additionally, body MRI data were only collected during the follow-up examination, further limiting its powerN/A
[8]O’Sullivan et al. (2020)Conducting pediatric studies on whole-fat and reduced-fat dairy intake and adiposity, biomarkers of cardiometabolic disease risk, and glucose homeostasis; authors suggest that high-quality randomized controlled trials are needed to obtain better evidence on recommending reduced-fat dairy products for childrenN/AN/AProvides a clear definition of whole-fat and reduced-fat dairy products and includes studies conducted in different countriesThe limited literature in the field is not consistent with dietary guidelines recommending reduced-fat dairy products for childrenN/A
[22]Sajid et al. (2021)Using ML-based RPMs for CVDs in LMICs using non-laboratory features; comparing their performance with that of conventional RPMs and determining the best models and feature order for predicting CVD statusANN, SVMDataset based on case–control study conducted at the Punjab Institute of Cardiology, Pakistan; dataset includes 460 subjects aged between 30 and 76 yearsShows the importance of developing customized and region-specific RPMs for accurate risk estimates in new populationsThe study focuses on only one LMIC, Pakistan, which may not be representative of other LMICsN/A
[24]Reddy K et al. (2021)Using a machine learning model to predict heart disease risk using the Cleveland heart dataset; evaluates ten classifiers, proposing that an automated system using patient data and ML can achieve accurate predictionsNaïve Bayes,
Bayesian network,
Decision Table,
Decision Tree,
KNN,
Random Forest,
AdaBoostM1,
Bagging, LR, and SMO
The Cleveland heart dataset comprising 303 patient recordsThe research improves the accuracy of one of the classifiers, IBk, by tuning the hyperparameter “k” to 9 with the chi-squared attribute set, achieving an 8.25% accuracy improvementThe study was conducted using only the Cleveland Heart dataset, which limits the generalizability of the findings to other populations or datasetsAcc (%): 86.468
Pre: 0.865
Sen: 0.865
AUC: 0.861
[23]Guarneros-Nolasco et al. (2021)Analyzing 10 ML algorithms on 4 datasets for CVD prediction/diagnosis, identifying top 2/4 risk attributes, and determining main CVD risk factors with suggestions for improving diagnosis in regions with limited medical staff; ML has been shown to be effective/reliable in discerning patients with CVDDecision Tree,
Random Forest,
Gradient Boosting,
SVM, KNN, NB, and LR
The Cleveland dataset: containing 303 patient records,
the Faisalabad
Dataset containing
299 patients with heart failure (105 women and 194 men), and
the South African Hearth dataset containing
462 records of patient data
It mentions all of the advantages and disadvantages and the performance of each classifier algorithm independentlyN/AAccuracy:
1-Cleveland (LR): 77.22%
2-Faisalabad (CatBoost Classifier): 76.28%
3-South African Hearth
(Decision Tree Classifier): 72.51%
Table 2. Summary statistics of numeric features in male dataset before preprocessing.
Height (m)Weight (kg)MBF (kg)BFP (%)BMIVFA (cm2)WC (m)WHRFMI
Mean1.7082.9625.2727.1528.46118.830.950.888.65
Median1.6974.3020.7026.5025.6084.000.900.846.72
Std. Dev.0.0729.0917.9910.589.4581.830.310.126.06
Range0.40118.8077.4047.0044.50378.001.650.5429.42
Minimum1.5247.201.403.0015.2025.000.000.640.46
Maximum1.92166.0078.8050.0059.70403.001.651.1829.87
Table 3. Summary statistics of numeric features in female dataset before preprocessing.
Height (m)Weight (kg)MBF (kg)BFP (%)BMIVFA (cm2)WC (m)WHRFMI
Mean1.5756.1617.2429.4622.7354.650.710.776.98
Median1.5653.8015.9029.5021.8046.000.740.786.21
Std. Dev.0.0512.257.526.464.7431.030.200.083.00
Range0.2559.9036.1031.5021.60140.001.050.7913.98
Minimum1.4638.805.8012.9015.3020.000.000.171.98
Maximum1.7198.7041.9044.4036.90160.001.050.9615.97
Table 4. Risk levels and their Conicity Index ranges in males.
Risk LevelConicity Index Range
None≤1.20
Low1.21–1.30
Medium1.31–1.40
High≥1.41
Table 5. Risk levels and their Conicity Index ranges in females.
Risk LevelConicity Index Range
None≤1.15
Low1.16–1.20
Medium1.21–1.25
High≥1.26
Table 6. Summary statistics of numeric features in male dataset after preprocessing.
Height (m)Weight (kg)MBF (kg)BFP (%)BMIVFA (cm2)WC (m)WHRFMI
Mean1.7183.4725.5527.1828.61118.830.990.888.74
Median1.6974.3019.2026.5025.6084.000.920.846.72
Std. Dev.0.0729.6418.3410.769.6381.830.240.126.18
Range0.40118.8077.4047.0044.50378.000.980.5429.42
Minimum1.5247.201.403.0015.2025.000.660.640.46
Maximum1.92166.0078.8050.0059.70403.001.651.1829.87
Table 7. Summary statistics of numeric features in female dataset after preprocessing.
Height (m)Weight (kg)MBF (kg)BFP (%)BMIVFA (cm2)WC (m)WHRFMI
Mean1.5757.2717.8729.7623.1258.550.770.787.22
Median1.5754.1515.9529.7022.1047.000.750.786.53
Std. Dev.0.0513.238.296.905.1936.250.100.083.32
Range0.2565.1042.7034.5025.20208.000.500.8216.92
Minimum1.4635.705.1012.9014.7020.000.620.171.98
Maximum1.71100.8047.8047.4039.90228.001.120.9918.91
Table 8. Performance measure scores of classifiers in males.
ClassifierAccuracyPrecisionRecallF1-Score
Support Vector Machine81%82%81%81%
K-Nearest Neighbor80%83%80%81%
Logistic Regression91%91%91%91%
Gradient Boosting72%68%72%68%
Random Forest76%79%76%76%
Table 9. Performance measure scores of classifiers in females.
ClassifierAccuracyPrecisionRecallF1-Score
Support Vector Machine87%87%87%86%
K-Nearest Neighbor83%78%83%79%
Logistic Regression87%87%87%87%
Gradient Boosting82%80%82%80%
Random Forest80%80%80%79%
Disclaimer/Publisher’s Note: The statements, opinions and data contained in all publications are solely those of the individual author(s) and contributor(s) and not of MDPI and/or the editor(s). MDPI and/or the editor(s) disclaim responsibility for any injury to people or property resulting from any ideas, methods, instructions or products referred to in the content.

