1. Introduction
Historic districts are the center of social development, urban structure, culture, and cultural heritage [
1]. The Washington Charter (International Council of Monuments and Sites, ICOMOS) defines historic districts as cities, towns, historical centers, and residential areas and describes their natural and man-made environments [
2]. United Nations Educational, Scientific and Cultural Organization (UNESCO) considers the landscape of historic districts a product of historical significance with cultural and natural values and attributes [
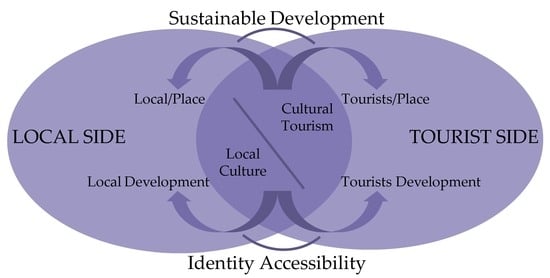
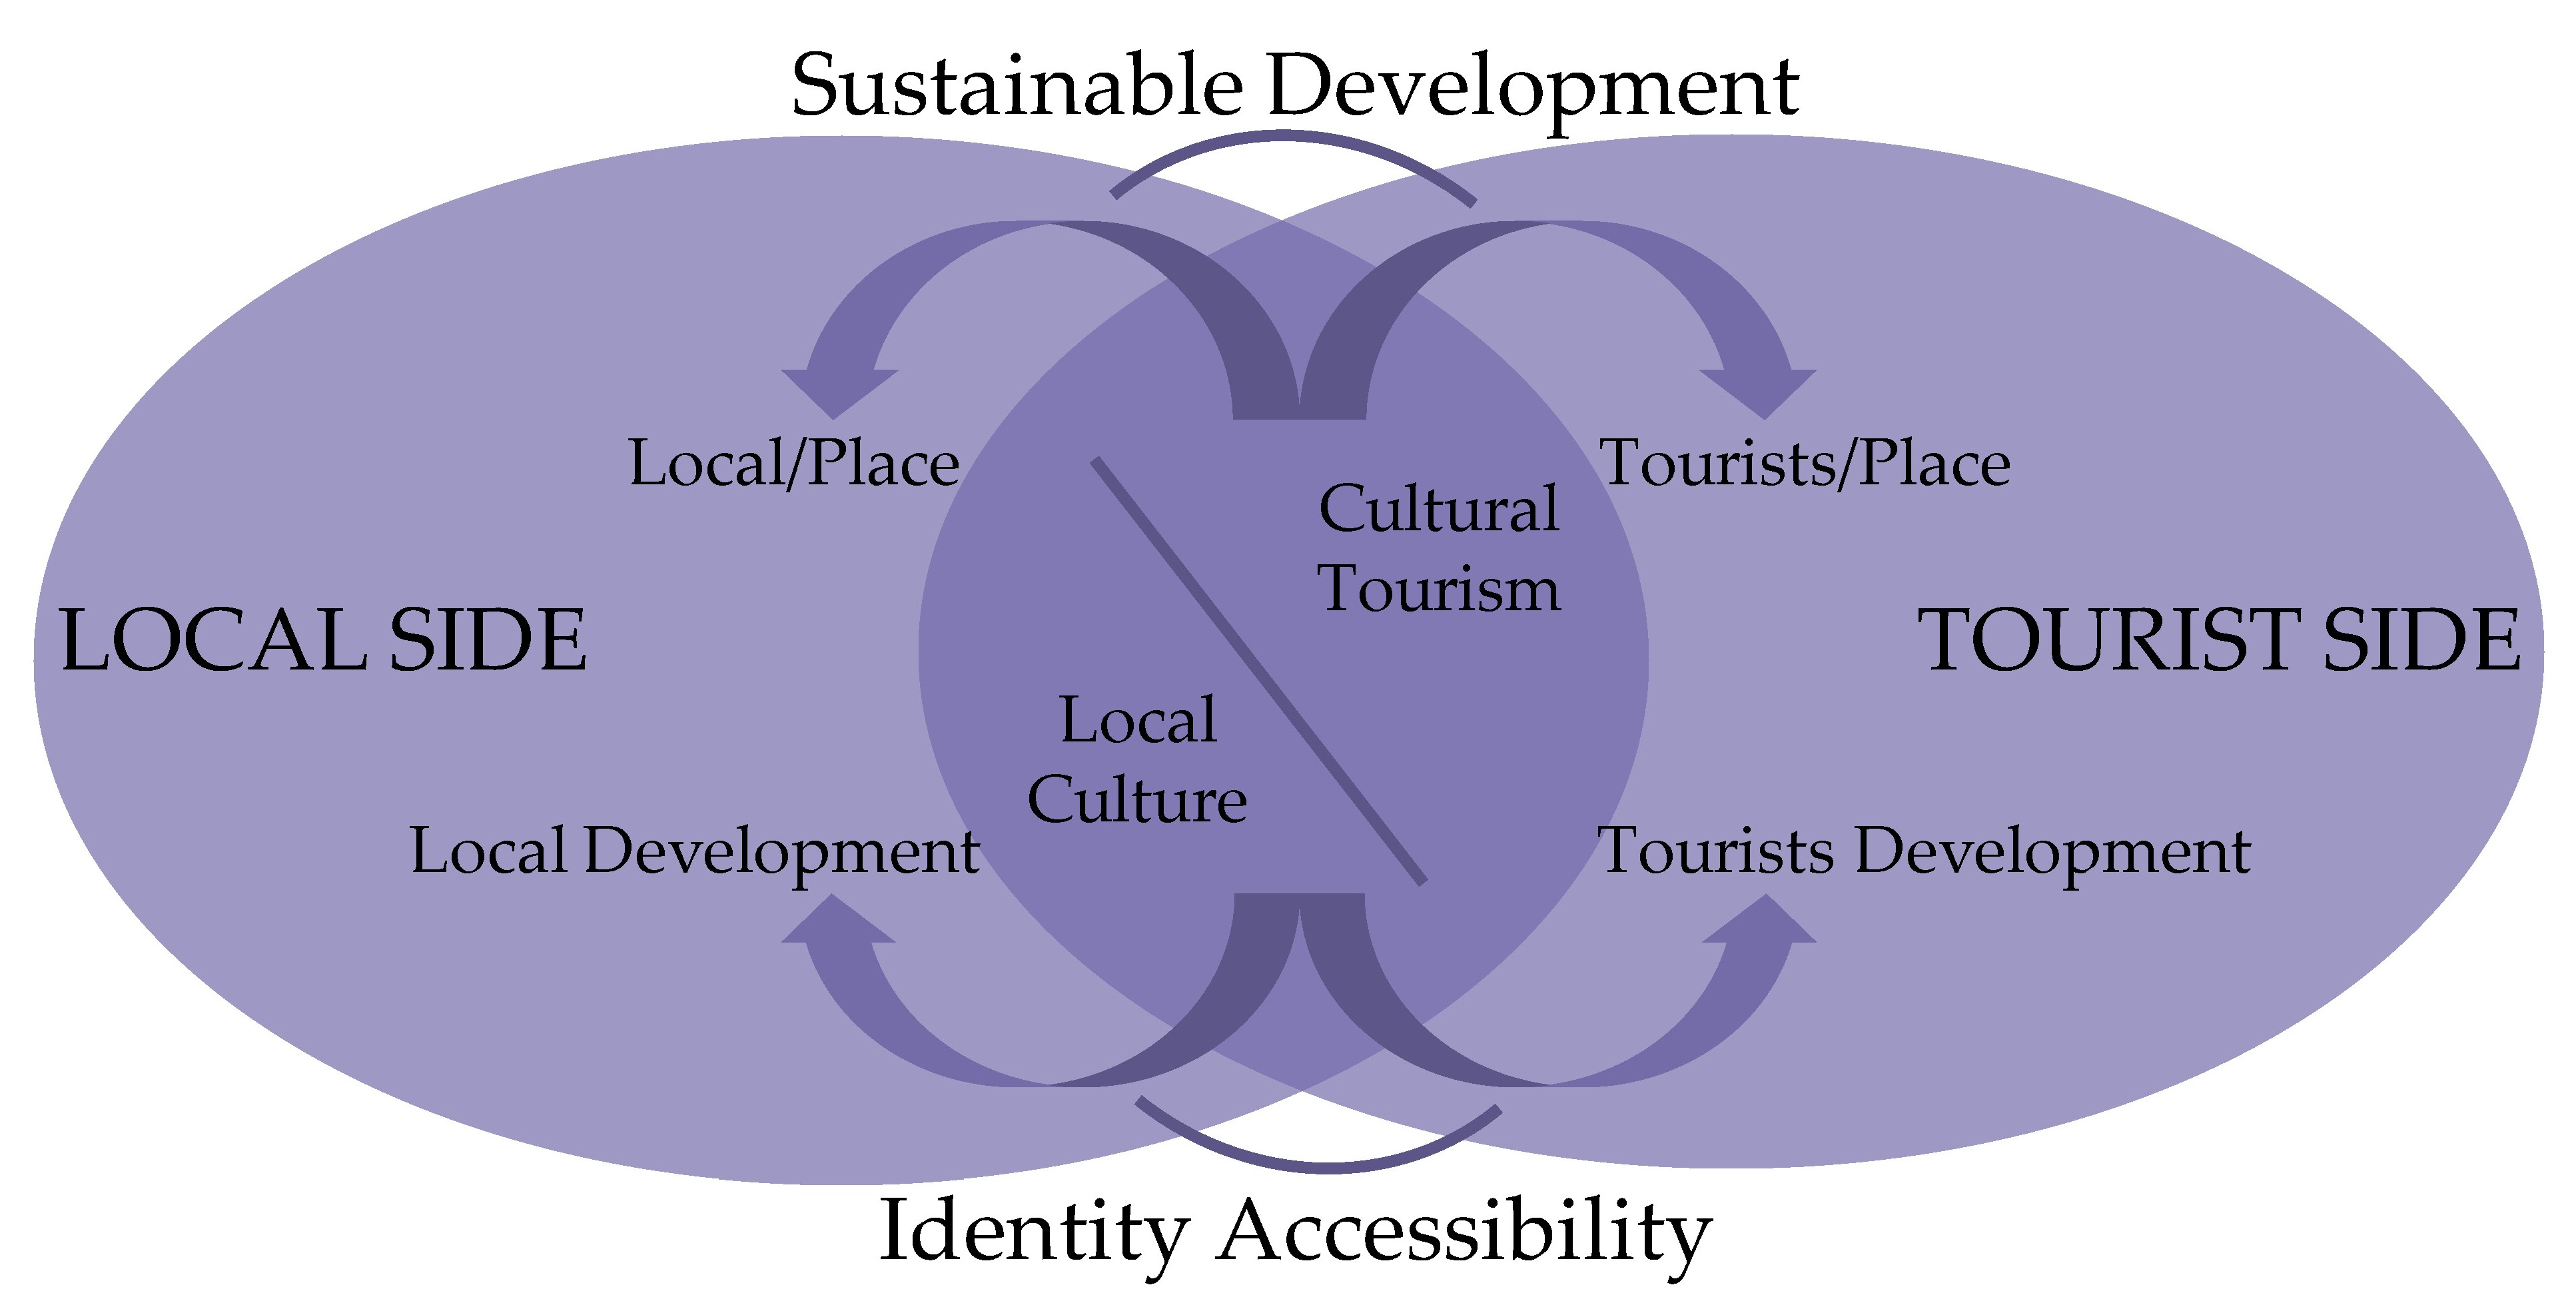
3]. Countries with profound cultural heritage, such as Italy, Germany, and Spain, have always been committed to developing cultural heritage in an effort to revive historic districts. The sustainability of historic districts is key to improving livability, promoting economic development and social cohesion. Compared to traditional industries, the development of tourism is more conducive to the social, environmental, and cultural sustainability of historic districts [
4]. The Charter for Sustainable Tourism Development states that sustainable development strategies for tourism should be formulated in conjunction with local cultural heritage, tradition, and other activities [
5]. Tourism should be developed in regard to cultural resources. By acknowledging the historical significance of cultural resources, one can reap economic benefits and achieve economic sustainability. Therefore, thoroughly exploring the cultural significance and the potential of historic districts, reasonably developing and utilizing elements of tourism, developing cultural tourism, and acknowledging the value of cultural capital are golden opportunities for the economic, social, and cultural revival and environmental restoration of historic districts.
Roads are an important infrastructure for the development of tourism. Jameel Khadaroo believes that the quality, quantity, distribution, and strategic planning of roads significantly impact travel efficiency, safety, and comfort, thereby influencing the development of the tourism industry [
6]. Shamsa Kanwal supported this claim by confirming a positive correlation between roads and tourism benefits through extensive questionnaire data [
7]. The development of tourism presents a significant opportunity for the rejuvenation of historical districts. Consequently, numerous scholars have explored the relationship between historical urban roads and the tourism industry. For instance, Jinyu Fan conducted a study on the evolving accessibility of road networks within the historic urban area of Changsha [
8]. Cruz-Ramírez, L.C., demonstrated the relationship between tourism facilities and roads by analyzing changes in building usage. However, it is important to note that the data used in this study were obtained through observation, which may have limitations in terms of accuracy and scale [
9]. In a case study focused on the Drum Tower Muslim District in Xi’an, China, Jing Huang utilized geospatial data to explore factors influencing the vitality of historical neighborhoods. Huang’s research underscored the pivotal role played by road layout and infrastructure distribution in augmenting the vitality of these historic neighborhoods [
10]. Although an increasing number of studies have demonstrated the correlation between historical regional road structures and tourism elements, a comprehensive analysis of their underlying mechanisms and functional dynamics remains notably absent.
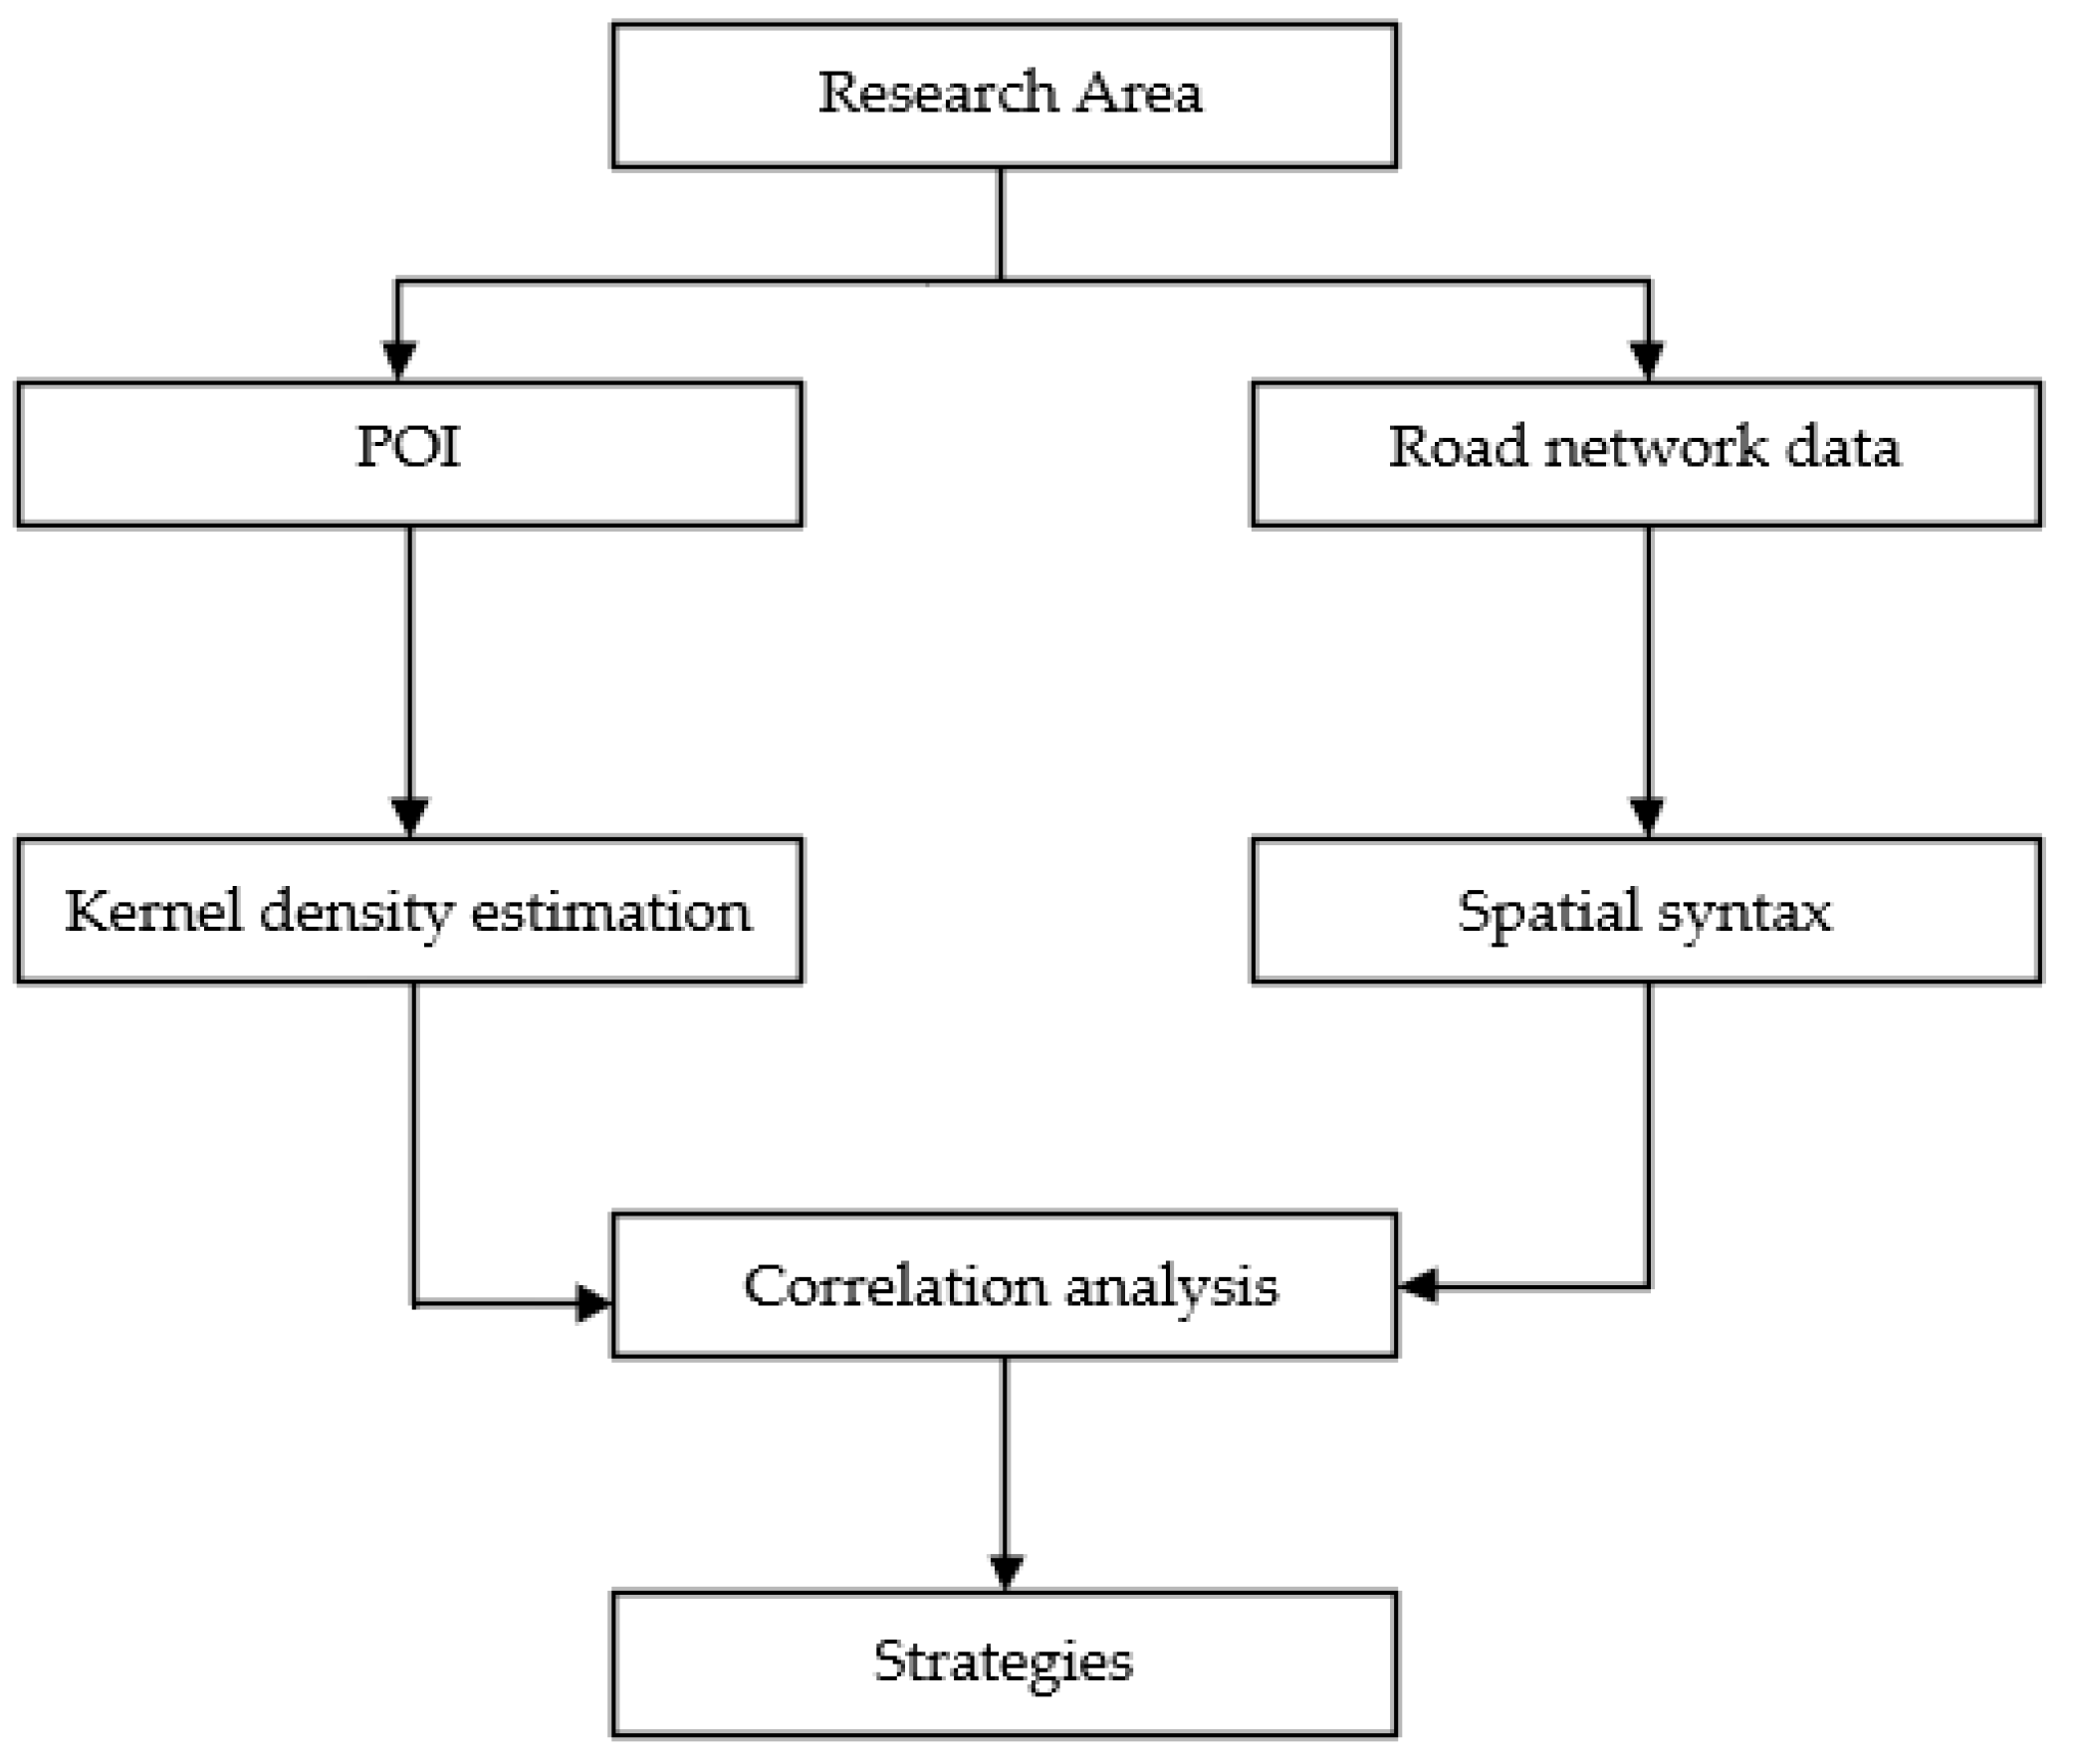
This research is based on the GIS platform and employs spatial syntax to quantify the road network within historical districts. Furthermore, it employed kernel density analysis to examine the spatial distribution of tourism elements in these historic districts based on point of interest (POI) data. Correlation analysis was then applied to explore the relationship between the distribution pattern of these elements and road accessibility. The study provides both theoretical and empirical evidence for a reasonable distribution of tourism elements within historic districts, their optimization, and the enhancement of tourism vitality. The main objectives of this paper are as follows: (1) analyzing the distribution of tourism elements within historical districts using the Jiangbei and Pan Guifang districts of Meizhou City as case studies, (2) evaluating the accessibility of the road network within the Jiangbei and Pan Guifang districts, (3) assessing the relationship between road network accessibility and the distribution of tourism elements through correlation analysis, and (4) providing scientific recommendations based on the research findings to promote the revitalization of the historical districts of Jiangbei and Pan Guifang (
Figure 1).
2. Research Area and Data
2.1. Research Area
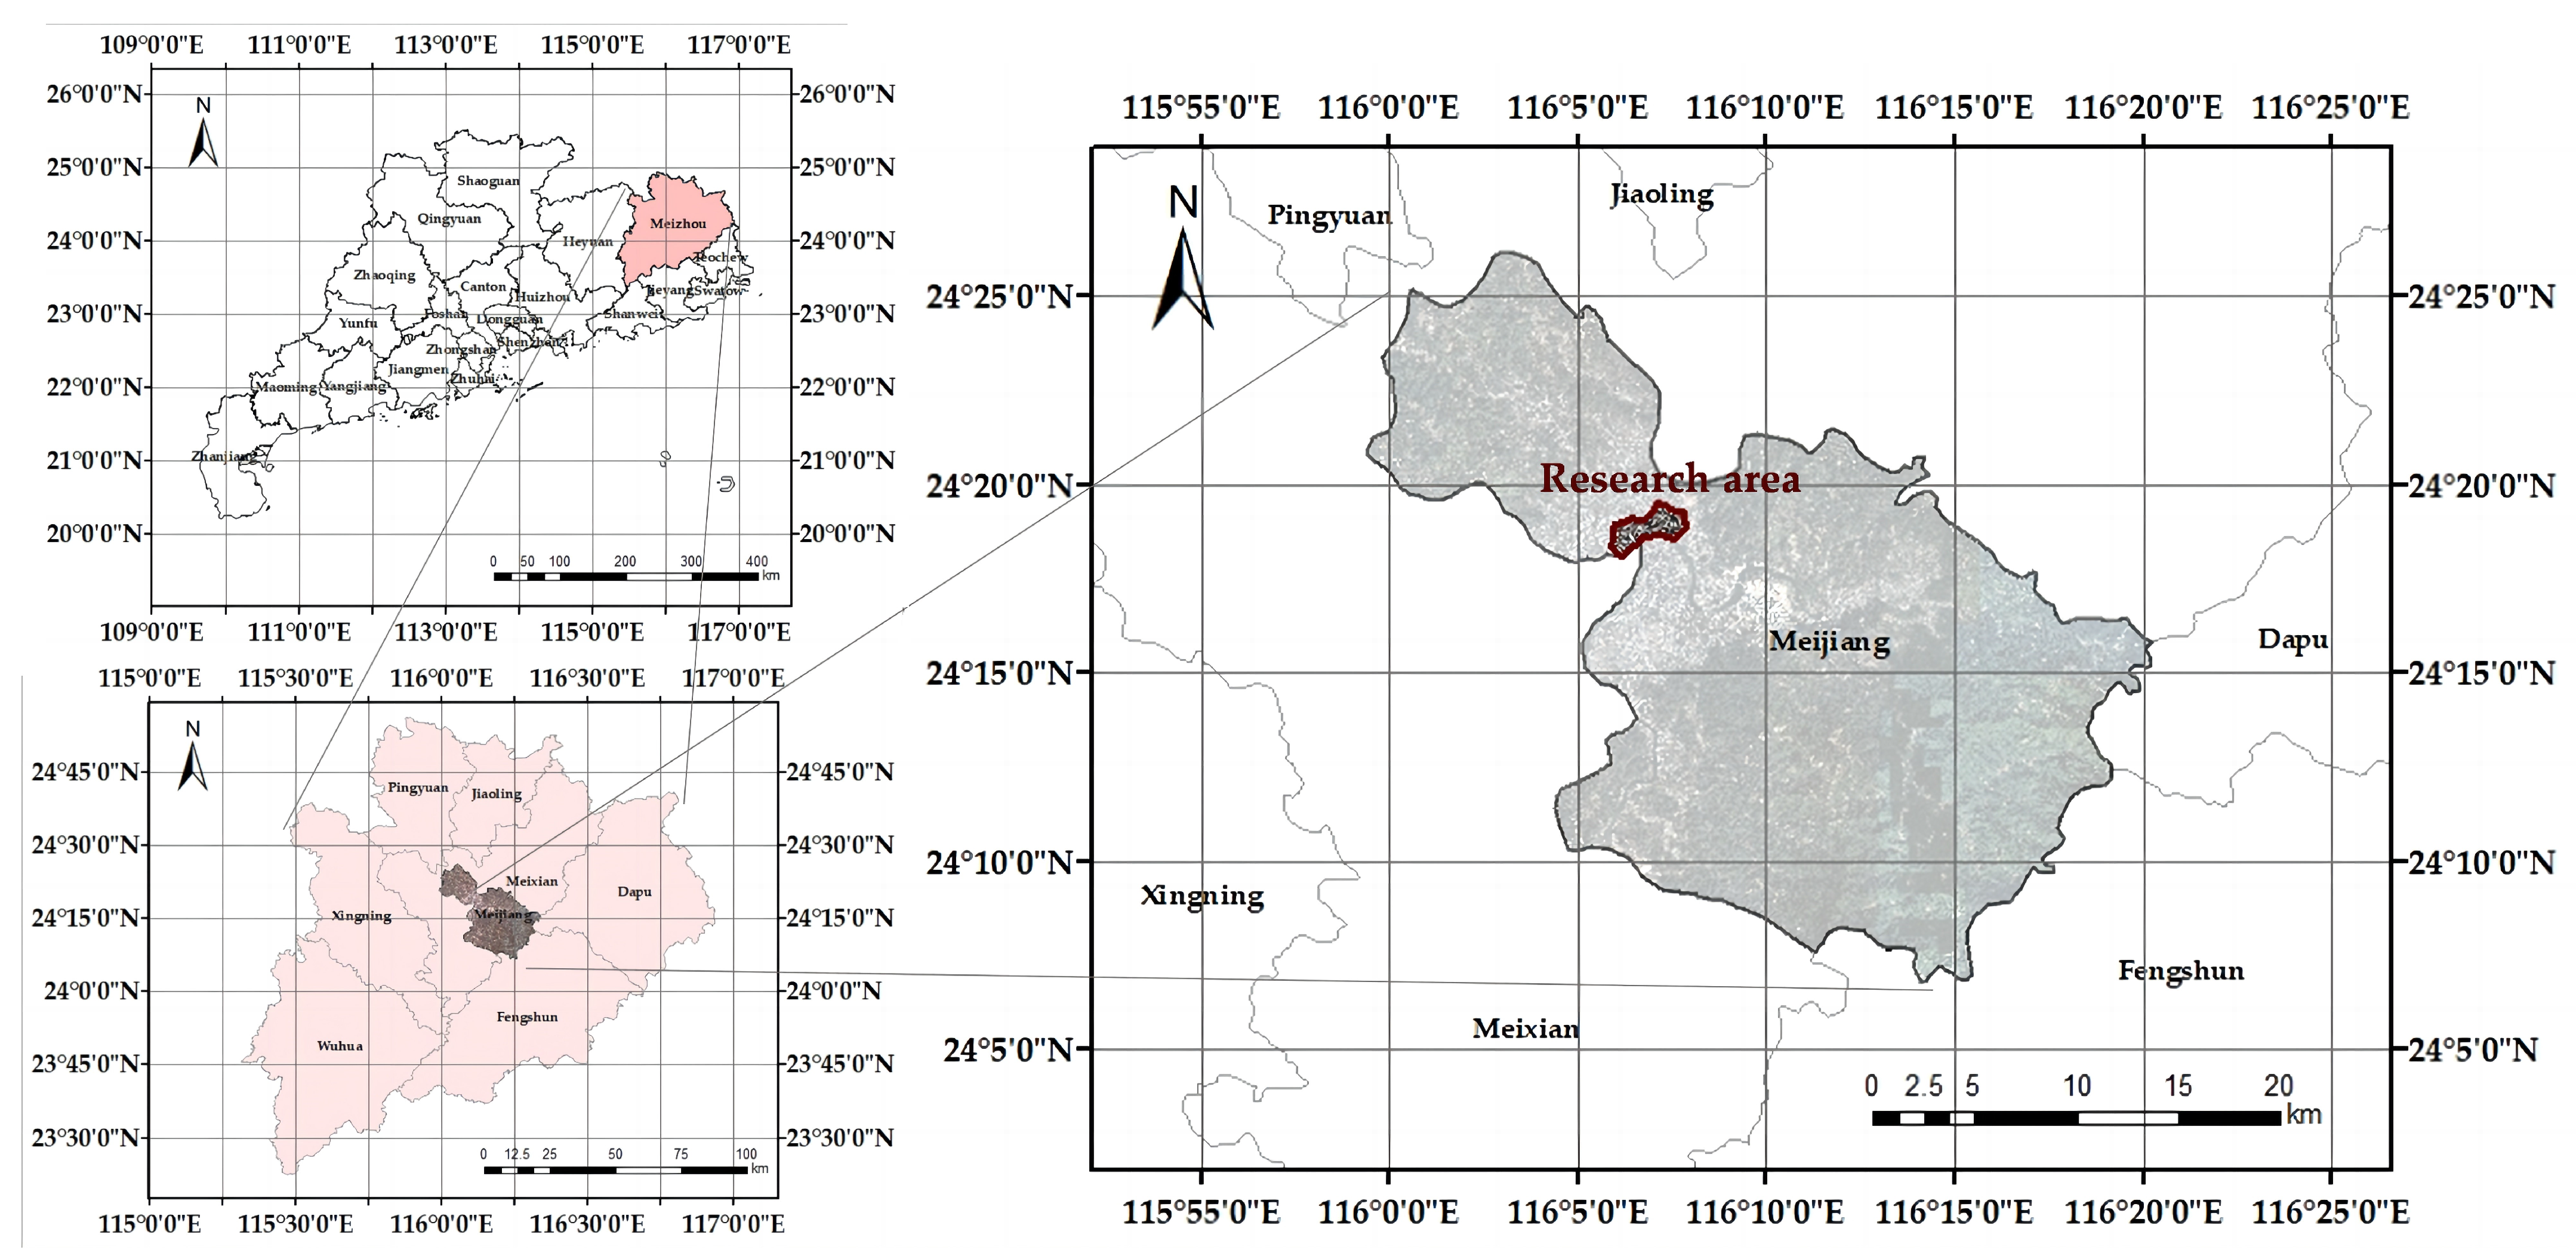
Meizhou is a prefectural city under the jurisdiction of Guangdong Province, China (
Figure 2). It is located in the northeastern part of the province at the junction of Fujian, Guangdong, and Jiangxi. It has a national 5A-level scenic spot (Yannanfei Tea Fields) and 50 national 3A-level, or higher, tourist attractions, ranking second in Guangdong Province. Meizhou has a long history and rich cultural heritage. It has two historic and cultural districts and is a national historic and cultural city. Compared to other historic districts, the ones in Meizhou have kept the old city style dating back to the Song Dynasty, with traditional regional characteristics preserved in cultural relics and traditional houses. Best preserved traditional house styles are Meizhou’s Hakka weilou, Beijing’s siheyuan, Shaanxi’s yaodong, Guangxi’s pole column style, and Yunnan’s one stamp. These have been recognized by Chinese and foreign architectural circles as the five traditional house styles with the most distinct local characteristics.
Meizhou has abundant cultural resources and a natural advantage in developing tourism. Nevertheless, the different positioning of historical buildings corresponds to different development statuses. In Meizhou, most of the historical buildings were developed in conjunction with developments of culture and tourism. However, their development is affected by the spatial distribution of tourism elements, resulting in an uneven and incomplete development of historic districts. This uneven development fails to fully reflect the historical and era value of the districts, resulting in resource inefficiency and the gradual neglect of historical culture. As a result, numerous challenges persist in the pursuit of the sustainable development of tourism in Meizhou’s historic districts. This study thus selected Jiangbei and Panguifang, since they are districts with abundant cultural heritage and tourism attractions, to provide reference and suggestions for the optimization of the elements of tourism in Meizhou.
2.2. Data
This study used the following datasets: (1) Administrative boundary data were obtained from the Resource and Environment Science and Data Center (
https://www.resdc.cn/, accessed on 8 October 2022). The boundary data for the research area were sourced from the government-published “Controlled Detailed Planning for the Jiangbei and Pangui Fang Areas in Meizhou City” (
https://www.meizhou.gov.cn/zwgk/fggw/szfhj/content/post_2449409.html, accessed on 8 October 2022). The data were analyzed using mapping and analytics software ArcGis10.5 (GeoScene In-formation Technology Co., Ltd., Beijing, China). (2) POI data were obtained from the Resource and Environment Science and Data Center (
https://www.resdc.cn/, accessed on 8 October 2022), which were analyzed using ArcGis10.5. (3) Road network data were obtained from OpenStreetMap (
https://openstreetmap.de/, accessed on 8 October 2022), with adjustments made based on the officially announced control detailed planning drawings. The spatial distribution of roads was analyzed using depthMapx Version 10.14.00b software (University College London, London, UK) to assess connectivity, selectivity, depth, and integration values.
3. Methodology
3.1. Kernel Density Estimation (KDE)
Kernel density analysis involves estimating the density of point and line elements in the surrounding area by employing a density function clustering method on the dataset [
11]. Through the ongoing simulation of density distribution, a smooth continuous surface is generated based on the peak point, which is the distance from the feature point to the estimation point, and it represents the distribution of measured values across a continuous area. The kernel density value of each grid represents the spatial distribution of elements [
12]. It negatively correlates with the distance from the center point. In other words, the closer the element is to the center point, the greater is the kernel density, and vice versa. It is often used in spatial distribution studies of elements such as epidemics and disasters [
13]. The kernel density calculated using the following formula:
is the kernel density function; is the kernel density value at the spatial position x; is the distance from the estimation point to the feature point ; represents the number of data points in the sample data set; and is the bandwidth. When is >0, the kernel density value at the threshold radius is significant, and the configuration of the threshold affects the generation of results.
3.2. Spatial Syntax
Spatial syntax is a mathematical analysis method that abstracts space into a syntactic model, enabling quantitative analysis while ensuring that spatial topological relationships remain unchanged [
14]. This study used the depthMapx Version 10.14.00b software (University College London, London, UK) to quantitatively analyze the connectivity, selectivity, depth, and integration values of the spatial distribution of roads, streets, and alleys in the Jiangbei and Panguifang districts.
- (1)
Connectivity value
The connectivity value refers to the number of nodes one node is connected to. This represents how well one road is connected to other roads. The higher the connectivity value, the higher the degree of urban permeability [
8]. Its calculation formula is as follows:
is the connectivity value of the i-th road; q is the total number of roads connected to the i-th road.
- (2)
Selectivity value
The selectivity value indicates the proportion of the shortest topological steps between any two spatial units in the spatial system and a specific spatial unit relative to all the shortest topological paths between the two spatial units. This measurement serves as an indicator of the frequency of path selection [
15]. Its calculation formula is as follows:
is the selectivity value of point ; is the number of the shortest paths between points and ; is the number of shortest paths that pass through point and are located between and .
- (3)
Depth value
The interval between two connected nodes represents a single step. The minimum number of steps from one node to another represents the depth between the two nodes. The average of the minimum number of steps from one node to all other nodes in the entire space indicates the average depth value of the node. The total depth value in the entire space is the sum of the average depth values of each node [
16]. The calculation formula for the depth value is as follows:
n is the total number of nodes; is the minimum number of steps from node i to node j.
- (4)
Integration value
The integration value represents the accessibility of a certain spatial node. The larger the integration value, the more easily accessible and permeable the space [
17]. Steadman suggested normalizing the integration value, i.e., using the relative asymmetry value
RA = 2 (
MD − 1) (
n − 2), where
n is the total number of nodes, and
MD is the average depth. Later, the reciprocal of
RA represented the integration value, with the intention of ensuring a positive correlation with the actual meaning. Hillier and Hanson went on to standardize the integration value using
RRA and introduced the improved integration algorithm termed “
HH”, representing the initials of the two scholars’ names [
18]. Its calculation formula is as follows:
represents global integration; is the actual relative asymmetry value; is the local average depth value. It refers to the average number of minimum steps from any node in the entire space to other nodes.
3.3. Correlation Analysis
Correlation analysis represents the degree of correlation between two variables [
19]. In this study, SPSSPRO Version 1.15 software (Suzhou Zhongyan Network Technology Co., Ltd., Shanghai, China) was used to calculate the Pearson correlation coefficient between the calculation results from depthMapx and the kernel density analysis of the tourism elements. The overall Pearson correlation coefficient is defined as the quotient of the covariance and standard deviation between two variables, often represented by the Greek letter
in lowercase.
By estimating the covariance and standard deviation of the sample, the study obtained the Pearson correlation coefficient, which is often represented by
:
can also be estimated by the mean of the standard scores of the sample points
, resulting in an expression equivalent to the above formula:
is the standard score; is the sample mean; is the sample standard deviation.
4. Results
4.1. Spatial Distribution of the Elements of Tourism
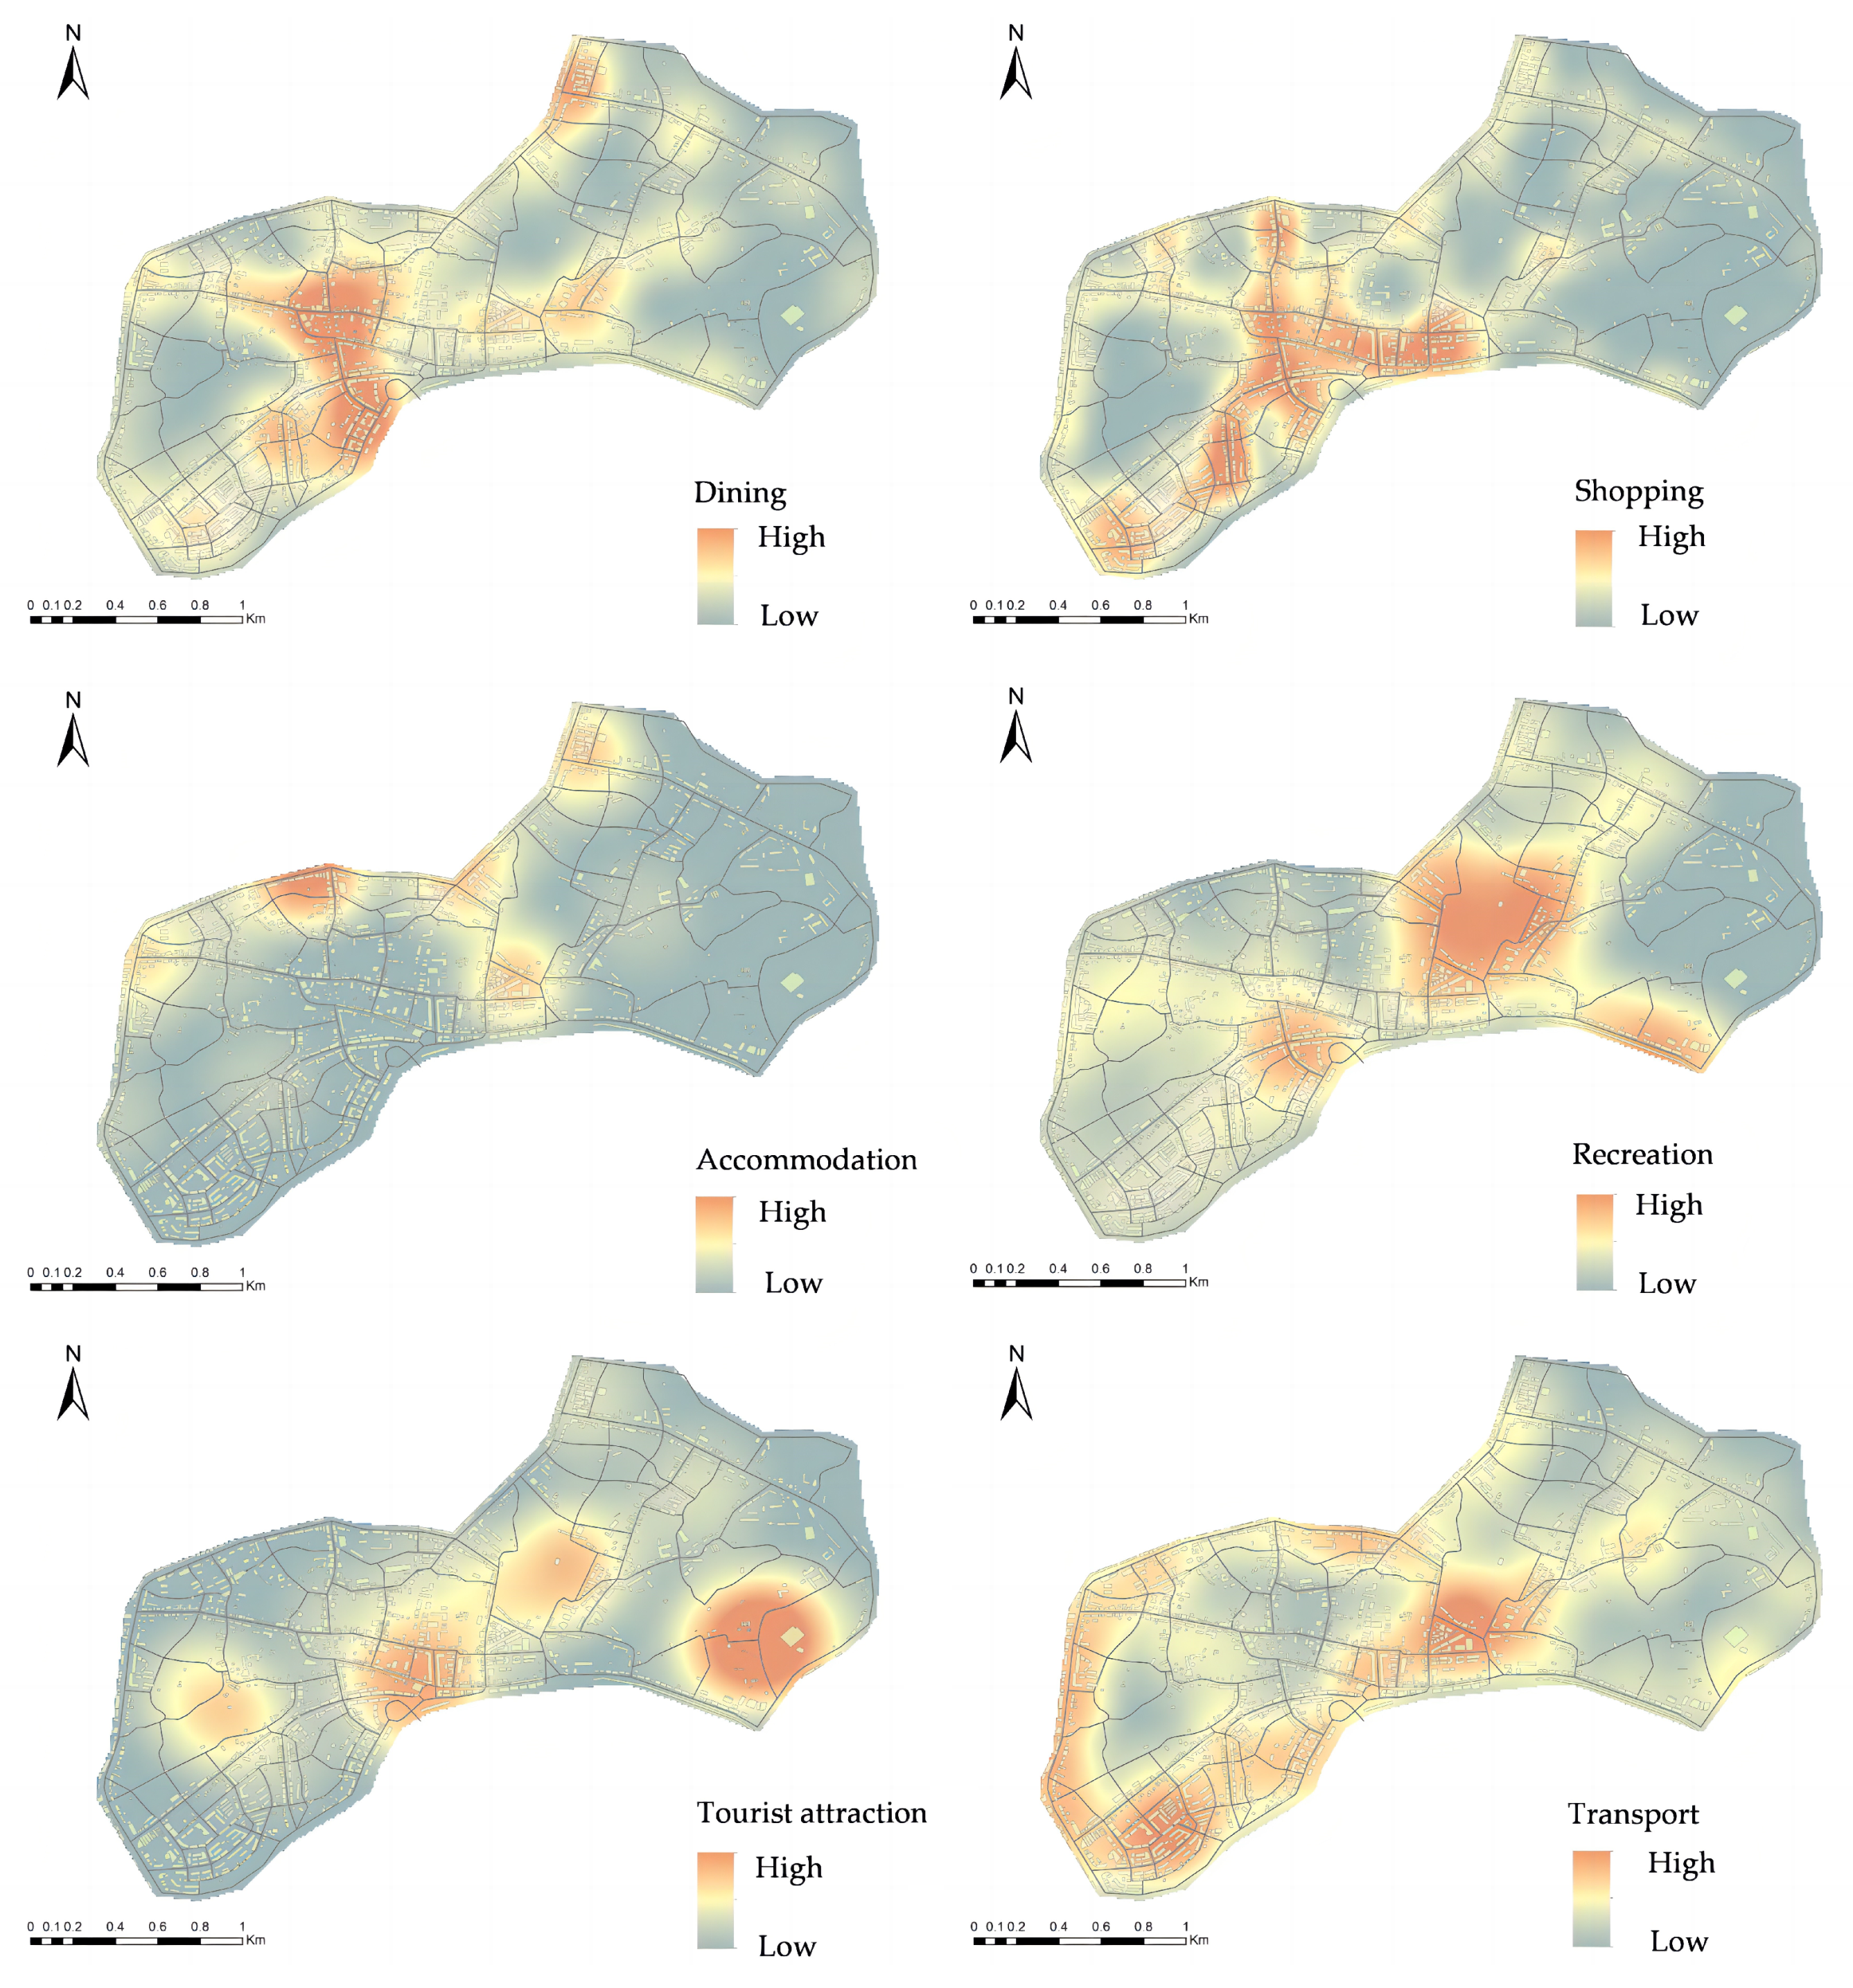
The overall spatial distribution of the elements of tourism in the Jiangbei and Panguifang districts was high in the west and low in the east. This can be attributed to a high proportion of commercial service facilities in the western district, with a dense distribution of tourism elements such as catering and shopping. The eastern Panguifang district primarily comprises a residential area, with relatively few tourism elements. In addition, the POI data of the elements in Jiangbei and Panguifang were distributed along major transportation arteries, which is in line with the fact that elements of tourism depend on transportation accessibility (
Figure 3).
In particular, accommodation elements were predominantly distributed in multiple layers along Guangmei Road, Meizhou Avenue, and Meisong Road. They concentrated near the Culture Park. Being important roads in Meizhou, the three aforementioned roads reflect how the distribution of accommodation elements is affected by the convenience and accessibility of transportation. In addition, urban landscapes and commerce also affect the distribution of accommodation elements. Catering elements are distributed in a belt between Jinlilai Street and Zhongyuan Road, with the kernel density value decreasing on both sides along the axis of Zhongshan Road and Youluo Street. Notably, there was a certain degree of clustering of the catering elements at the intersection of Dongshan Avenue and Meisong Road, as well as the Shunfeng Road and Qiaoxin Road area. These elements are mainly affected by neighboring medical and educational facilities.
Furthermore, the distribution of shopping elements was similar to catering elements, with both being concentrated in the Jinlilai Street and Zhongyuan Road area. The distribution extended in the north–south direction along Meishi Road, Zhongshan Road, and Youluo Street, eastward along Zhongyuan and Lingfeng Road all the way to Dongshan Market, and southwestward along Jinlilai Street. The areas with a high distribution of shopping elements were primarily located in the commercial areas of Jiangbei and Panguifang. Some shopping elements were also distributed along high-capacity urban roads, such as Guangmei Road, Chengxi Avenue, and Meisong Road.
Leisure and entertainment elements were mainly concentrated around the Culture Park, followed by a relatively concentrated distribution near Dongshan Park and Mei River Park. Moreover, scenic spot elements were distributed in multiple rings, with a high distribution in the Panguifang Cultural Creative Zone and a relatively concentrated distribution in the Mei River Park, Culture Park, and Pearl Park area. Lastly, traffic facility elements were distributed in a ring in the western parts of Jiangbei and Panguifang, with relatively high distributions near sport centers, commercial public service centers, and the Guangmei Road.
4.2. Evaluation of the Accessibility of Tourism Elements in Meizhou
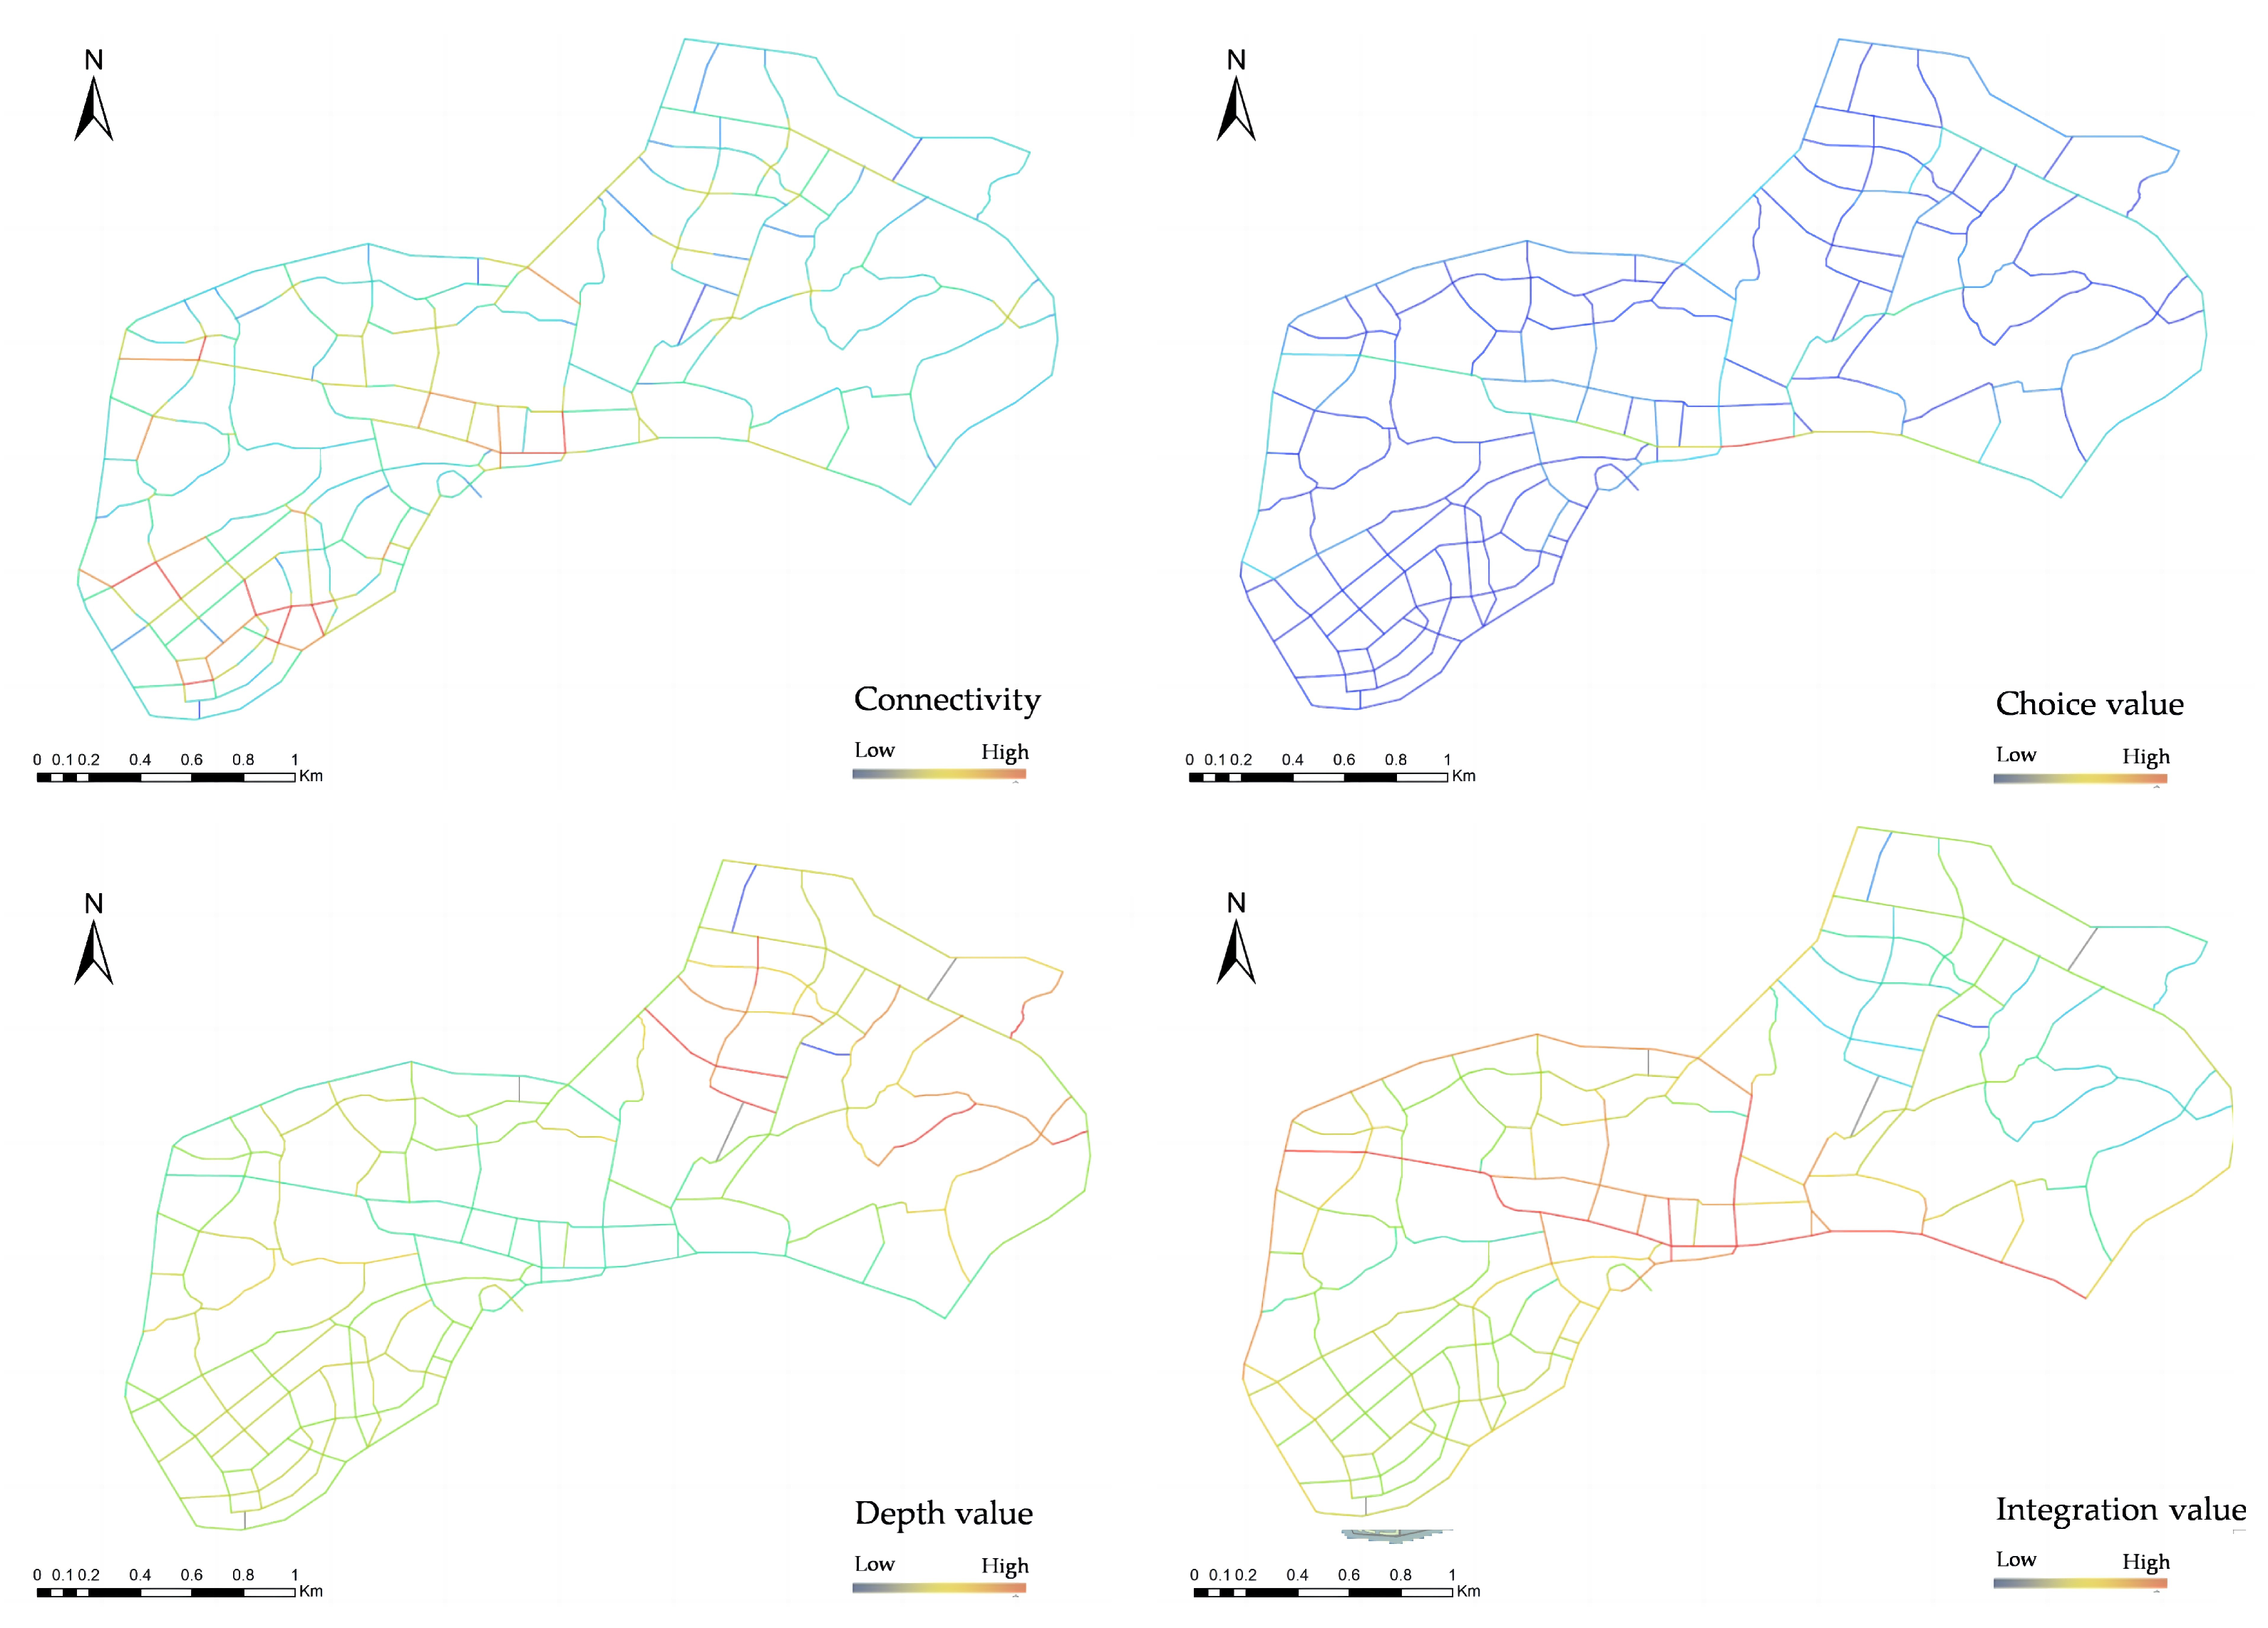
The calculation results show that the roads with higher connectivity values were concentrated near Meixing Road and Qiuyuan Road and Lingfeng Road and Zhongyuan Road. The higher the connectivity value, the better the connectivity with surrounding nodes and the higher the degree of urban permeability. Likewise, higher connectivity values often bring about more transportation facility elements. The two districts have strong and interconnected road networks, indicating an overall high connectivity of the area. Furthermore, selectivity is a measure of an area’s potential to attract transportation. The change of the color from cold to warm on the selectivity axis represents low-to-high traversability, thereby reflecting weak-to-strong attraction toward transportation (
Figure 4).
The overall selectivity value of Jiangbei and Panguifang was relatively low. However, some areas had high selectivity, such as areas along Chengxi Avenue, Lingfeng Road, and Jiangbian Road. It was observed that the larger the depth value, the lower the accessibility. Put differently, the warmer the color on the axis, the lower the accessibility.
Figure 2 shows that the depth value of Jiangbei and Panguifang presented a distribution trend of high in the northeast and low in the southwest. Specifically, the accessibility of the southwest region was generally higher than that of the northeast.
Conversely, the integration value exhibited an opposite pattern of distribution than the depth value. The overall integration value of Jiangbei and Panguifang presented a distribution trend that was higher in the west than the east. In accordance with the measured integration and depth values, it can be concluded that the accessibility of the western side of Jiangbei and Panguifang was higher than that of the eastern side.
This result conforms to the spatial distribution of tourism elements in Jiangbei and Panguifang. The elements were mainly concentrated in the western part of the districts. It was also observed that there was high accessibility and density of the elements on Chengxi Avenue and Lingfeng Road.
4.3. Correlation Analysis of the Distribution and Accessibility of Tourism Elements
The results show that the depth value of Jiangbei and Panguifang negatively correlated with the results of kernel density analysis. It was found that the larger the depth value, the lower the kernel density. The depth value is an important indicator of road accessibility. However, in this study, the value negatively correlated with accessibility and kernel density. In contrast, the integration value, which is also an indicator of road accessibility, positively correlated with kernel density. Greater integration values correspond to better spatial accessibility and permeability as indicated by urban arrival and a more concentrated distribution of tourism elements. The correlation analysis of the depth, integration, and kernel density values shows that better road accessibility pertains to a more concentrated distribution of the elements of tourism. The results of the correlation analysis are shown in
Table 1.
The depth and integration value strongly correlated with transportation facility, shopping, and catering elements. As a result, potential adjustments to the road network accessibility can affect the distribution of transportation facility, shopping, and catering elements. Moreover, the selectivity value negatively correlated with accommodation, transportation facility, and shopping elements, but positively correlated with attraction and leisure and entertainment elements. Nevertheless, the degree of influence of the selectivity value on the distribution of the elements was not high. Similarly, the impact of road connectivity on the distribution of tourism elements was relatively low, and it, in part, positively correlated only with transportation facility and shopping elements. Therefore, the key to improving the distribution of tourism elements is to improve the connectivity of roads and reduce their depth values.
5. Strategies for Future Development
The 14th Five-Year Plan of Meizhou proposes a focus on the protection, revitalization, and utilization of the historic and cultural areas of Jiaying Ancient City, Panguifang, and Wangxingfang, collectively known as “One City, Two Fangs”. This study selected Panguifang to analyze its elements of tourism and their spatial distribution. Based on the results, the study offers suggestions for optimizing the elements of tourism in the historic and cultural districts, thereby creating an opportunity for the development of regional economy and culture-related research.
As an important region for the development of cultural tourism in Guangdong Province, Meizhou has seen significant achievements after years of development. At the same time, there seem to be significant differences in tourism resources, traffic conditions, and public services in the historic urban areas of Meizhou. There are problems such as slow development of cultural industries, obvious drawbacks in urban tourism, insufficient integration of tourism elements, and limited brand development. To solve these problems and promote further development of the tourism industry, it is necessary to optimize and adjust the elements of tourism in Meizhou’s historic urban areas.
5.1. Elevating the Status of Cultural Tourism and Emphasizing the Importance of Tourism Elements
Strategically establishing culture and tourism as core industries can drive the industrial transformation and development of Meizhou, expand domestic demand and economic structuring, and enhance the city’s comprehensive development. It is crucial to stress the importance of tourism elements, especially those that protect cultural heritage [
20]. As a matter of fact, the industry praises the process of revitalizing and innovating the means to preserve cultural relics using novel utilization models and transforming ancient dwellings and modern historical buildings for the purposes of tourism. For example, the revitalization and utilization of ancient Hakka dwellings, such as Junzhilou, Chengdelou, Yutinglou, and Guifanglou, the development of homestays, catering, cultural and creative production, and other industries, coupled with the active expansion of spaces fostering the integration of culture and tourism, have successfully navigated the shift from serious challenges to growth and vitality. Promoting the protection of cultural relics and improving the level of cultural relic protection are also important steps. What can further increase these efforts is developing a national cultural relic resource database and improving the existing management system of these resources in Meizhou.
5.2. Enhancing the Quality of Tourism Elements and Creating High-End Cultural Tourism Brands
It is crucial to improve the quality and quantity of tourism elements. Enhancing the environmental quality and creating a good urban landscape are key strategies towards this end [
21]. Establishing a tourism promotion center can enhance the reputation and influence of cultural tourism brands and promote Meizhou’s cultural tourism brand as the “World Hakka Capital”. There should also be more city festivals, industry exhibitions, and regional cooperation. Similarly, organizing anniversary events and hosting major cultural tourism theme events is also important. A new coordinated development can be achieved by actively strengthening cultural tourism cooperation with surrounding cities, such as the Greater Bay Area, the Pilot Demonstration Zone in Shenzhen, 13 cities in Fujian, Guangdong, and Jiangxi, and the Belt and Road Initiative.
Improving the development of the city’s visual system can enhance its image, enrich the understanding of the city’s spirit, and capture the essence of Hakka culture. It is also important to focus on the development of emerging media formats and create novel and effective publicity methods for social media posts. Focusing on self-platform marketing involves expanding existing media marketing channels, such as the “Meizhou Wenguang Tourism” WeChat public account and smart tourism applications. Additionally, it can be beneficial to create and upload videos on social media platforms. Promoting cultural tourism festivals and enhancing cultural tourism activities are also crucial strategies. Moreover, it is beneficial to develop events such as “the World Hakka Merchants Conference” and “Hakka Cultural Tourism Expo” to attract more participants from other countries and regions. Developing film and television marketing to increase publicity is another useful strategy. In particular, this development can be achieved by encouraging and supporting news media from all over the world to conduct interviews and shoot documentaries in Meizhou, focusing especially on Meizhou culture, or even creating various film and television dramas with Meizhou culture at its center.
5.3. Introducing New Business Formats and Exploring a Novel Utilization of Tourism Elements
Introducing new business formats such as technology tourism, homestay, night tourism, and sports tourism can accelerate the development of cultural tourism [
22]. By attracting external capital and collaborating with professional institutions, along with leveraging existing tourism elements that can launch night-time tourism, one can tap into the potential of the night-time cultural experience in Meizhou and launch other similar projects. Another important strategy aims at introducing technology elements that can influence the development of novel attractions. A beneficial venture is the development of homestays and related models and cultivating an eco-friendly homestay experience. Encouraging the development of boutique hotels in urban areas, creating culturally rich and service-oriented boutique hotels and small boutique homestays can contribute to the revitalization and preservation of historic urban areas. Additionally, relying on influential celebrities and commemorative activities to attract resources to Meizhou is also an effective strategy.
5.4. Promoting Integration and Development of Various Tourism Elements
Integrating and developing tourism elements involves the use of cultural venues for tourism activities and supporting venues capable of providing night tour services. Promoting the improvement of traditional scenic spots and introducing new cultural facilities to enrich the cultural significance of tourist attractions are also important strategies [
23]. What can significantly improve the integration of tourism elements in Meizhou is the fusion of industries such as theaters, performances, and animation with the tourism industry, innovating pathways for the integration of culture and tourism, and creating cultural and tourist attractions that integrate traditional experience, spiritual heritage, and leisure sightseeing. Furthermore, novel products and services should be developed in accordance with the needs of tourists and the advantages of tourism elements in historic urban areas in Meizhou. It is important to cooperate with leading tourism institutions, promote the integration of healthcare institutions and tourism enterprises, and encourage qualified resorts and scenic spots to develop health centers, health management centers, and other related facilities.
5.5. Optimizing the Supporting Facilities of Tourism Public Services
To optimize the supporting facilities, key strategies are creating a comprehensive tourism demonstration area, improving the city’s public service system, and developing a public service system for tourism. A helpful step would be establishing and operating a city-wide big data platform for the tourism industry and a comprehensive tourism service center. Effectively advancing the “toilet revolution”, constructing new and larger public toilets and entering the location of public toilets into electronic maps are also important steps. Moreover, if tourists use WeChat applets, it will allow them to enjoy various services within one device. Another related step is to develop a public cultural tourism smart management platform and promote the digital development of public cultural tourism [
24]. This can be achieved by using big data technology to build a city-wide public cultural smart management platform, co-developing and sharing cultural resources between the city and nearby villages, and developing a shared and interconnected public digital cultural tourism service system.
Additionally, there should be an extensive, three-dimensional, and fast tourism transportation system. The tourist experience can be enhanced by creating a golden corridor for cultural tourism, improving the self-drive tour support and service system, and promoting urban and rural greenway systems related to the “park city” concept. Integrating cultural tourism functions and improving the level of smart cultural tourism services can further enhance these efforts. Other key strategies also include deepening the digital transformation and upgrading within the tourism sector, popularizing achievements in information technology, and cultivating and developing new business forms and models for quality tourism development.
6. Conclusions
The distribution of tourism elements in Jiangbei and Panguifang has a significant impact on main transportation arteries. It was found that the spatial distribution between the elements and arteries positively correlated. Firstly, all of the tourism elements in Jiangbei and Panguifang were high in the west and low in the east and were distributed along the main transportation arteries. This distribution conforms to the dependence of tourism elements on transportation accessibility.
Secondly, keeping in mind the level of integration and depth, it can be concluded that accessibility of the western side of Jiangbei and Panguifang was higher than that of the eastern side. This result conforms to the spatial distribution of tourism elements in the two districts. The elements of the districts were mainly concentrated on their western sides, especially on Lingfeng Road, which has high accessibility.
Lastly, the depth value of Jiangbei and Panguifang negatively correlated with kernel density, while the integration value positively correlated with it. The accessibility of roads has a significant impact on the distribution of tourism elements. Therefore, the key to improving the distribution of the elements is to improve road connectivity and reduce its depth value.
Overall, this paper uses the GIS platform, point of interest (POI) data, and OpenStreetMap data to analyze the spatial distribution characteristics of tourism elements and assess the accessibility of road networks within the historic and cultural districts of Jiangbei and Panguifang in Meizhou City. Employing kernel density estimation and spatial syntax techniques enhances the objectivity and accuracy of the research. Through correlation analysis, the paper further explores the relationship between road accessibility and the spatial distribution of different tourism elements, thereby enriching the research content in related fields. However, certain limitations persist in the paper. In terms of data, some elements cannot be updated in time because of the dynamic POI data. In the future, we can consider crawling through open-source maps and social platforms to update the POI database in time. In addition, the relationship and direction of effects can not be shown in the geographical space through the correlation analysis of SPSS, and the interactive relationship between elements in the geographical space can be simulated through the geographical model in the future. With the development and application of big data technology, future research can consider combining mobile phone signaling data to feed back the vitality of historical districts and provide more scientific support for their revitalization.
Author Contributions
Conceptualization, W.-L.H. and Y.-J.C.; Formal analysis, J.-W.H.; Funding acquisition, W.-L.H. and Y.-J.C.; Investigation, J.-W.H.; Methodology, L.M., Y.-J.C. and H.-L.L.; Project administration, W.-L.H.; Resources, Y.-J.C. and H.-L.L.; Software, L.M., H.-L.L. and J.-W.H.; Supervision, W.-L.H.; Writing—original draft, J.-W.H.; Writing—review and editing, W.-L.H. All authors have read and agreed to the published version of the manuscript.
Funding
Humanities and Social Sciences Foundation of the Chinese Ministry of Education (Grant No. 20YJAGAT002) and Jiaying, University of Engineering, Dr. Scientific Research Fund (Grant Nos. 2022WRC12 and 2022WRC20).
Institutional Review Board Statement
Not applicable.
Informed Consent Statement
Not applicable.
Data Availability Statement
The data presented in this study are available on request from the corresponding author.
Acknowledgments
We would like to thank anonymous reviewers for their valuable comments and suggestions for improving this paper.
Conflicts of Interest
The authors declare no conflicts of interest.
References
- Kou, H.; Zhou, J.; Chen, J.; Zhang, S. Conservation for Sustainable Development: The Sustainability Evaluation of the Xijie Historic District, Dujiangyan City, China. Sustainability 2018, 10, 4645. [Google Scholar] [CrossRef]
- Xie, S.; Gu, K.; Zhang, X. Urban conservation in China in an international context: Retrospect and prospects. Habitat Int. 2020, 95, 102098. [Google Scholar] [CrossRef]
- Chahardowli, M.; Sajadzadeh, H.; Aram, F.; Mosavi, A. Survey of Sustainable Regeneration of Historic and Cultural Cores of Cities. Energies 2020, 13, 2708. [Google Scholar] [CrossRef]
- Chang, C.-L.; McAleer, M.; Ramos, V. A Charter for Sustainable Tourism after COVID-19. Sustainability 2020, 12, 3671. [Google Scholar] [CrossRef]
- du Cros, H.; Bauer, T.; Lo, C.; Rui, S. Cultural Heritage Assets in China as Sustainable Tourism Products: Case Studies of the Hutongs and the Huanghua Section of the Great Wall. J. Sustain. Tour. 2005, 13, 171–194. [Google Scholar] [CrossRef]
- Khadaroo, J.; Seetanah, B. Transport infrastructure and tourism development. Ann. Tour. Res. 2007, 34, 1021–1032. [Google Scholar] [CrossRef]
- Kanwal, S.; Rasheed, M.I.; Pitafi, A.H.; Pitafi, A.; Ren, M. Road and transport infrastructure development and community support for tourism: The role of perceived benefits, and community satisfaction. Tour. Manag. 2020, 77, 104014. [Google Scholar] [CrossRef]
- Hajrasouliha, A.; Yin, L. The impact of street network connectivity on pedestrian volume. Urban Stud. 2014, 52, 2483–2497. [Google Scholar] [CrossRef]
- Cruz-Ramírez, L.C. Integración turística en centros históricos: Adaptaciones de uso por tipo de vialidad. Cuad. Vivienda Urban. 2022, 15, 1–15. [Google Scholar] [CrossRef]
- Huang, J.; Hu, X.; Wang, J.; Lu, A. How Diversity and Accessibility Affect Street Vitality in Historic Districts? Land 2023, 12, 219. [Google Scholar] [CrossRef]
- Luo, Y.; Lin, Z. Spatial Accessibility Analysis and Optimization Simulation of Urban Riverfront Space Based on Space Syntax and POIs: A Case Study of Songxi County, China. Sustainability 2023, 15, 14929. [Google Scholar] [CrossRef]
- Yang, J.; Zhu, J.; Sun, Y.; Zhao, J. Delimitating urban commercial central districts by combining kernel density estimation and road intersections: A case study in nanjing city, china. ISPRS Int. J. Geo-Inf. 2019, 8, 93. [Google Scholar] [CrossRef]
- Węglarczyk, S. Kernel density estimation and its application. ITM Web Conf. 2018, 23, 00037. [Google Scholar] [CrossRef]
- Bafna, S. Space Syntax: A Brief Introduction to Its Logic and Analytical Techniques. Environ. Behav. 2003, 35, 17–29. [Google Scholar] [CrossRef]
- Li, X.; Lv, Z.; Zheng, Z.; Zhong, C.; Hijazi, I.H.; Cheng, S. Assessment of lively street network based on geographic information system and space syntax. Multimed. Tools Appl. 2017, 76, 17801–17819. [Google Scholar] [CrossRef]
- Hölscher, C.; Brösamle, M.; Vrachliotis, G. Challenges in Multilevel Wayfinding: A Case Study with the Space Syntax Technique. Environ. Plan. B Plan. Des. 2012, 39, 63–82. [Google Scholar] [CrossRef]
- Jiang, B.; Claramunt, C.; Klarqvist, B. Integration of space syntax into GIS for modelling urban spaces. Int. J. Appl. Earth Obs. Geoinf. 2000, 2, 161–171. [Google Scholar] [CrossRef]
- Kim, H.-K.; Sohn, D.W. An analysis of the relationship between land use density of office buildings and urban street configuration: Case studies of two areas in Seoul by space syntax analysis. Cities 2002, 19, 409–418. [Google Scholar] [CrossRef]
- Cleophas, T.J.; Zwinderman, A.H. Bayesian Pearson Correlation Analysis. In Modern Bayesian Statistics in Clinical Research; Cleophas, T.J., Zwinderman, A.H., Eds.; Springer International Publishing: Cham, Switzerland, 2018; pp. 111–118. [Google Scholar] [CrossRef]
- Cai, Z.; Fang, C.; Zhang, Q.; Chen, F. Joint development of cultural heritage protection and tourism: The case of Mount Lushan cultural landscape heritage site. Herit. Sci. 2021, 9, 86. [Google Scholar] [CrossRef]
- Cheshmehzangi, A. Urban Regeneration and Creating Urban Landscapes: Enhancing City Life Experiences in Lijiang. In Mapping Urban Regeneration: City Life Experiences in Yunnan, China; Springer: Berlin/Heidelberg, Germany, 2023; pp. 139–169. [Google Scholar] [CrossRef]
- Garau, C. Emerging Technologies and Cultural Tourism: Opportunities for a Cultural Urban Tourism Research Agenda; Springer: Berlin/Heidelberg, Germany, 2017; pp. 67–80. [Google Scholar] [CrossRef]
- Tang, M.; Xu, H.J.T. Cultural integration and rural tourism development: A scoping literature review. Tour. Hosp. 2023, 4, 75–90. [Google Scholar] [CrossRef]
- Kaluarachchi, Y.J.S.C. Implementing data-driven smart city applications for future cities. Smart Cities 2022, 5, 455–474. [Google Scholar] [CrossRef]
| Disclaimer/Publisher’s Note: The statements, opinions and data contained in all publications are solely those of the individual author(s) and contributor(s) and not of MDPI and/or the editor(s). MDPI and/or the editor(s) disclaim responsibility for any injury to people or property resulting from any ideas, methods, instructions or products referred to in the content. |
© 2024 by the authors. Licensee MDPI, Basel, Switzerland. This article is an open access article distributed under the terms and conditions of the Creative Commons Attribution (CC BY) license (https://creativecommons.org/licenses/by/4.0/).


