Article

A Novel Approach for Diabetic Retinopathy Screening Using Asymmetric Deep Learning Features

by
Pradeep Kumar Jena
1,
Bonomali Khuntia
2,
Charulata Palai
1,
Manjushree Nayak
1,
Tapas Kumar Mishra
3 and
Sachi Nandan Mohanty
4,*
1
Department of Computer Science and Engineering, NIST Institute of Science and Technology, Berhampur, Odisha 761008, India
2
Department of Computer Science, Berhampur University, Brahmapur, Odisha 760007, India
3
Department of Computer Science and Engineering, SRM University-AP, Amaravati, Andhra Pradesh 522240, India
4
School of Computer Science & Engineering (SCOPE),VIT-AP University, Amaravati, Andhra Pradesh 522508, India
*
Author to whom correspondence should be addressed.
Big Data Cogn. Comput. 2023, 7(1), 25; https://doi.org/10.3390/bdcc7010025
Submission received: 30 November 2022 / Revised: 30 December 2022 / Accepted: 6 January 2023 / Published: 29 January 2023

Abstract

:
Automatic screening of diabetic retinopathy (DR) is a well-identified area of research in the domain of computer vision. It is challenging due to structural complexity and a marginal contrast difference between the retinal vessels and the background of the fundus image. As bright lesions are prominent in the green channel, we applied contrast-limited adaptive histogram equalization (CLAHE) on the green channel for image enhancement. This work proposes a novel diabetic retinopathy screening technique using an asymmetric deep learning feature. The asymmetric deep learning features are extracted using U-Net for segmentation of the optic disc and blood vessels. Then a convolutional neural network (CNN) with a support vector machine (SVM) is used for the DR lesions classification. The lesions are classified into four classes, i.e., normal, microaneurysms, hemorrhages, and exudates. The proposed method is tested with two publicly available retinal image datasets, i.e., APTOS and MESSIDOR. The accuracy achieved for non-diabetic retinopathy detection is 98.6% and 91.9% for the APTOS and MESSIDOR datasets, respectively. The accuracies of exudate detection for these two datasets are 96.9% and 98.3%, respectively. The accuracy of the DR screening system is improved due to the precise retinal image segmentation.

1. Introduction

Diabetic retinopathy is emerging as an efficient and affordable method for clinical practice [1,2,3]. Diabetic retinopathy (DR) detection at the primary stage is very important because it can save the person from vision loss. Retinal damage is incurable in the advanced stage of diabetes. The early stage of retinopathy is known as non-prolific diabetic retinopathy (NPDR) [4] and is curable if detected in time. In the case of NPDR, the retina is affected by red lesions, i.e., microaneurysms (MAs) and hemorrhages (HMs) [5]. MAs are the early stage of DR, and these are formed due to disruption of the internal elastic lamina. The number of MAs usually increases as the diabetic symptoms worsen. The next stage of DR is HMs, which are like MAs but its having an irregular margin and are larger in size. Here, the capillary walls become fragile and broken, resulting in the leakage of blood from the vascular tree. In the case of leakage near the macula, it is referred to as diabetic macular edema (DME) [6]. The advanced stage of DR is referred to as prolific diabetic retinopathy (PDR), where the retinal damage has become incurable and can lead to vision loss [4,7]. In PDR, the retina is affected by dark lesions called exudates (EX) [7,8,9]. The exudates are yellowish and irregularly shaped spots that appear in the eye retina. Exudates are of two types, hard exudates and soft exudates. In hard exudates, lipoprotein and other proteins leak from abnormal retinal vessels, which appear with a sharp white and yellowish margin. These soft exudates are known as cotton wool. They have a cloud-like structure and white-gray color. Cotton wool is produced due to the occluded arteriole.
Fluorescein fundus angiography (FFA) [10] is the process of detecting macular degeneration and manual DR classification by an ophthalmologist. In this case, fundus images are manually examined [11] to understand the health of the retina, optic disc, choroid, blood vessels, and macular condition of the eye. Image level annotation is done in terms of DR grade [12] by an ophthalmologist. The ocular macula helps to focus the eye; hence, macular degeneration causes blurred vision and sometimes destroys central vision. The FFA process is time-consuming, and the result depends on the experience of the ophthalmologist. In addition, there is also a risk of adverse effects from the fluorescent dye used in FFAs. Automatic DR screening is a process of detecting and grading DR from the fundus image with a computerized system; it is hazard-free, cheaper, and can help experts make better decisions. This motivated researchers to employ a computer-aided diagnostic (CAD) system [4,13,14] for the early detection of DR. It may also be useful to observe and monitor the development of other micro-vascular impediments. The two major aspects of the CAD system for DR detection are precise segmentation of the blood vessels (BV) and optic disc (OD) [4,15], followed by proper classification of the lesions in the fundus images. Several approaches have been proposed by researchers to develop an automated DR diagnostic system. Traditional machine learning (ML) approaches show competent efficiency only if hand-engineered features [2,6,16,17] are chosen proficiently. Here, the process of manually selecting features is stimulating and difficult to generalize. Various deep learning (DL) techniques [3,18,19,20,21] are also proposed to explore the state of the retina from the fundus image. In this case, the performance depends on the architecture of the deep neural network and its tuning parameter. The efficacy of the automated DR diagnostic system is decided by the efficiency of all the different stages, such as the segmentation of the blood vessels, the extraction of the optic disc region [3], and then the detection and classification of DR.
The major challenges in developing an automatic screening system are the lack of uniformity in the fundus image data sets, as these images are captured in different environments and with different resolutions [4]. In most cases, microaneurysms coexist with hemorrhages [9]. The lesions exhibit varying intensity levels in the case of NPDR and PDR, which increases the level of complications for the segmented retinal vessels and optic disc. This work proposes an asymmetric deep learning framework where the feedback weights are updated separately from the feedforward, applying the local learning rules to deal with the unlikely symmetry in connections between network layers [22]. As U-Net is effectively useful for the segmentation of medical images [23,24,25,26,27,28], two U-Nets, i.e., U-Net_BV and U-Net_OD are respectively used for blood vessel and optical disc segmentation [28]. The convolutional neural network (CNN) with an SVM model [21] is used for the DR classification. A comprehensive assessment of the proposed framework is performed using parameters such as sensitivity, specificity, precision, and receiver operating characteristics (ROC) curve analysis [2,29] on two publicly available fundus image datasets.
The major contributions of this work are mentioned below:
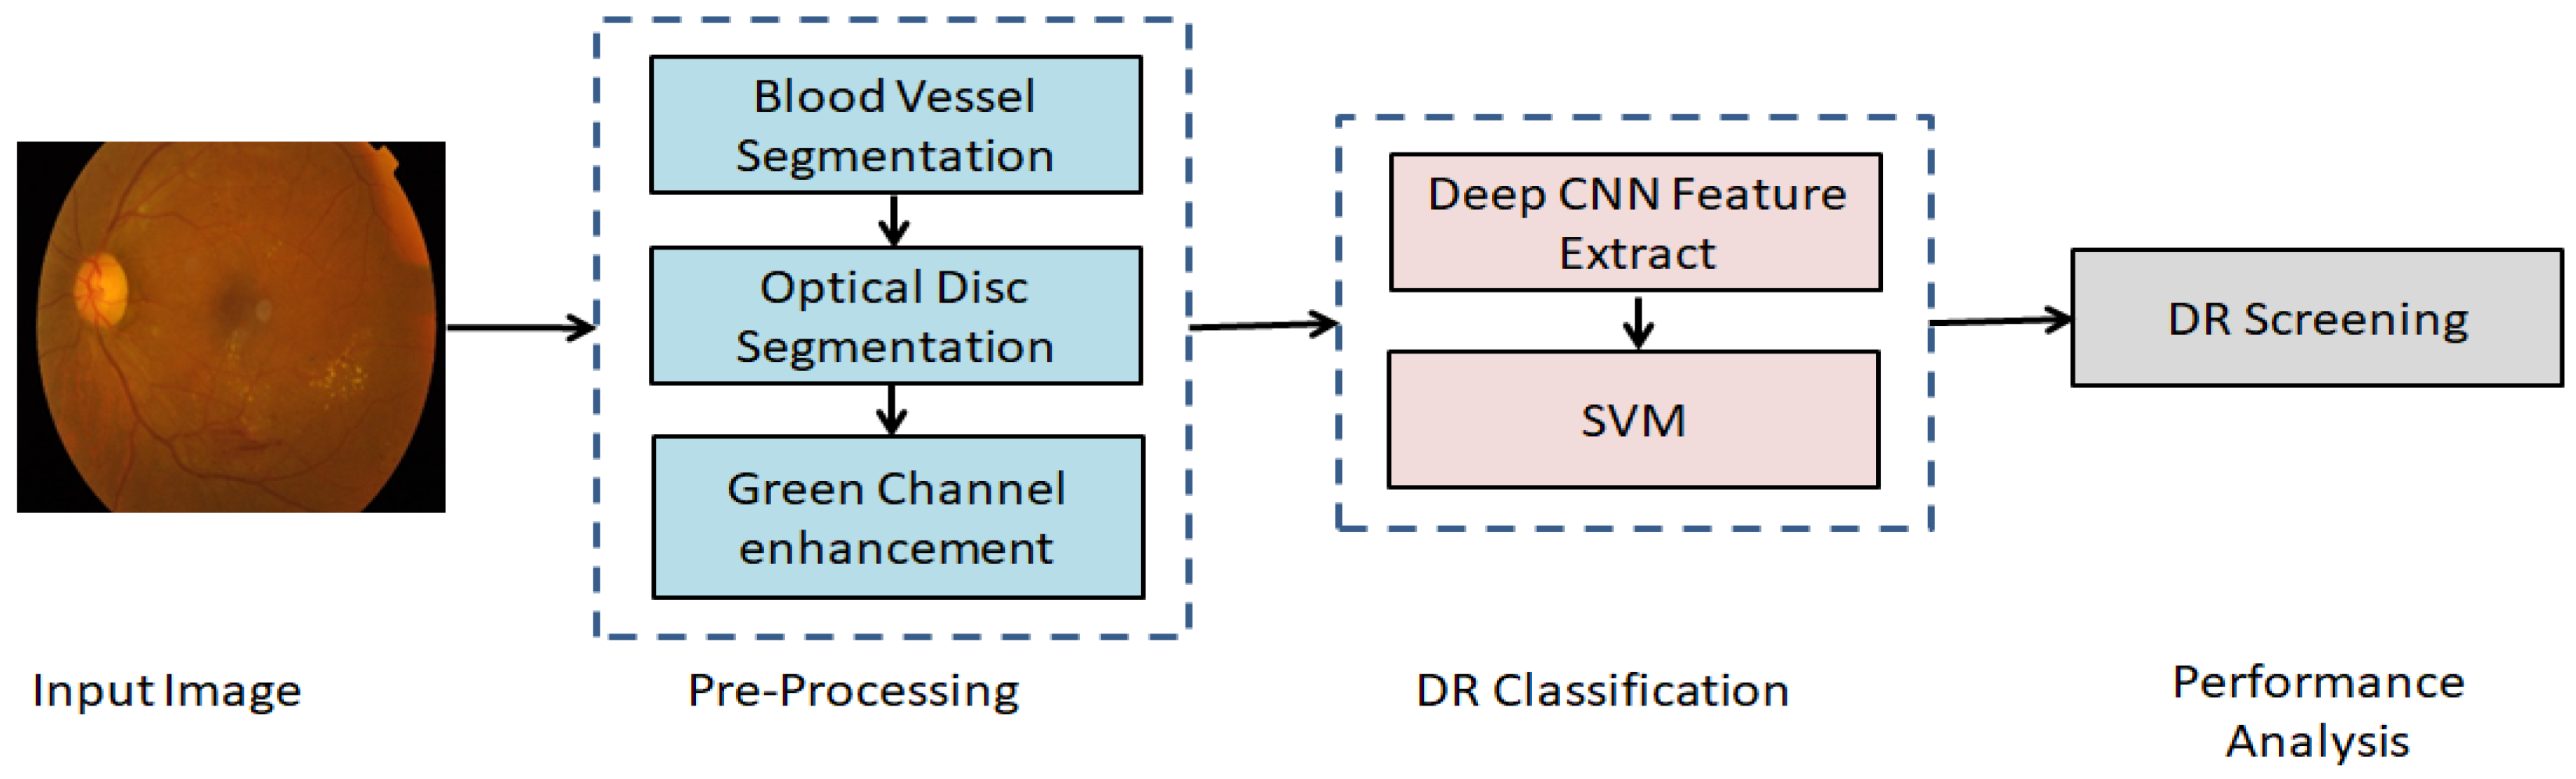
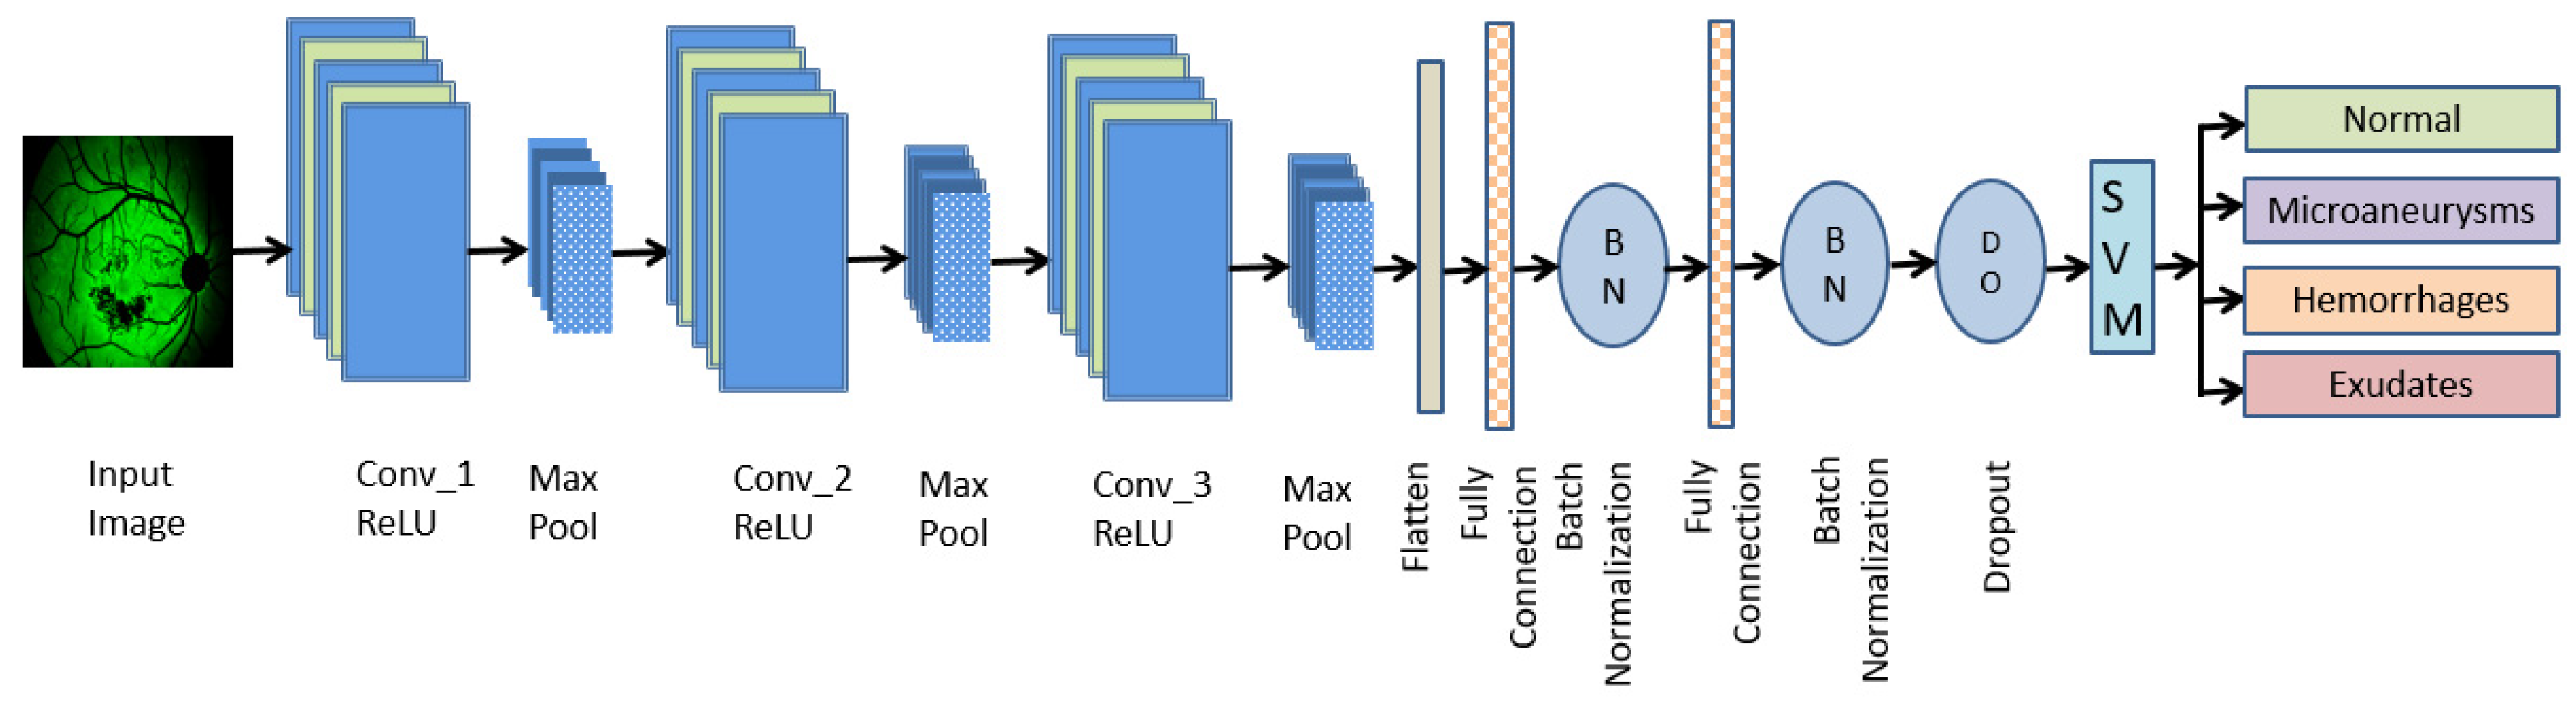
  • An asymmetric deep learning approach is for the classification of diabetic retinopathy into Normal, MAs, HMs, and EXs.
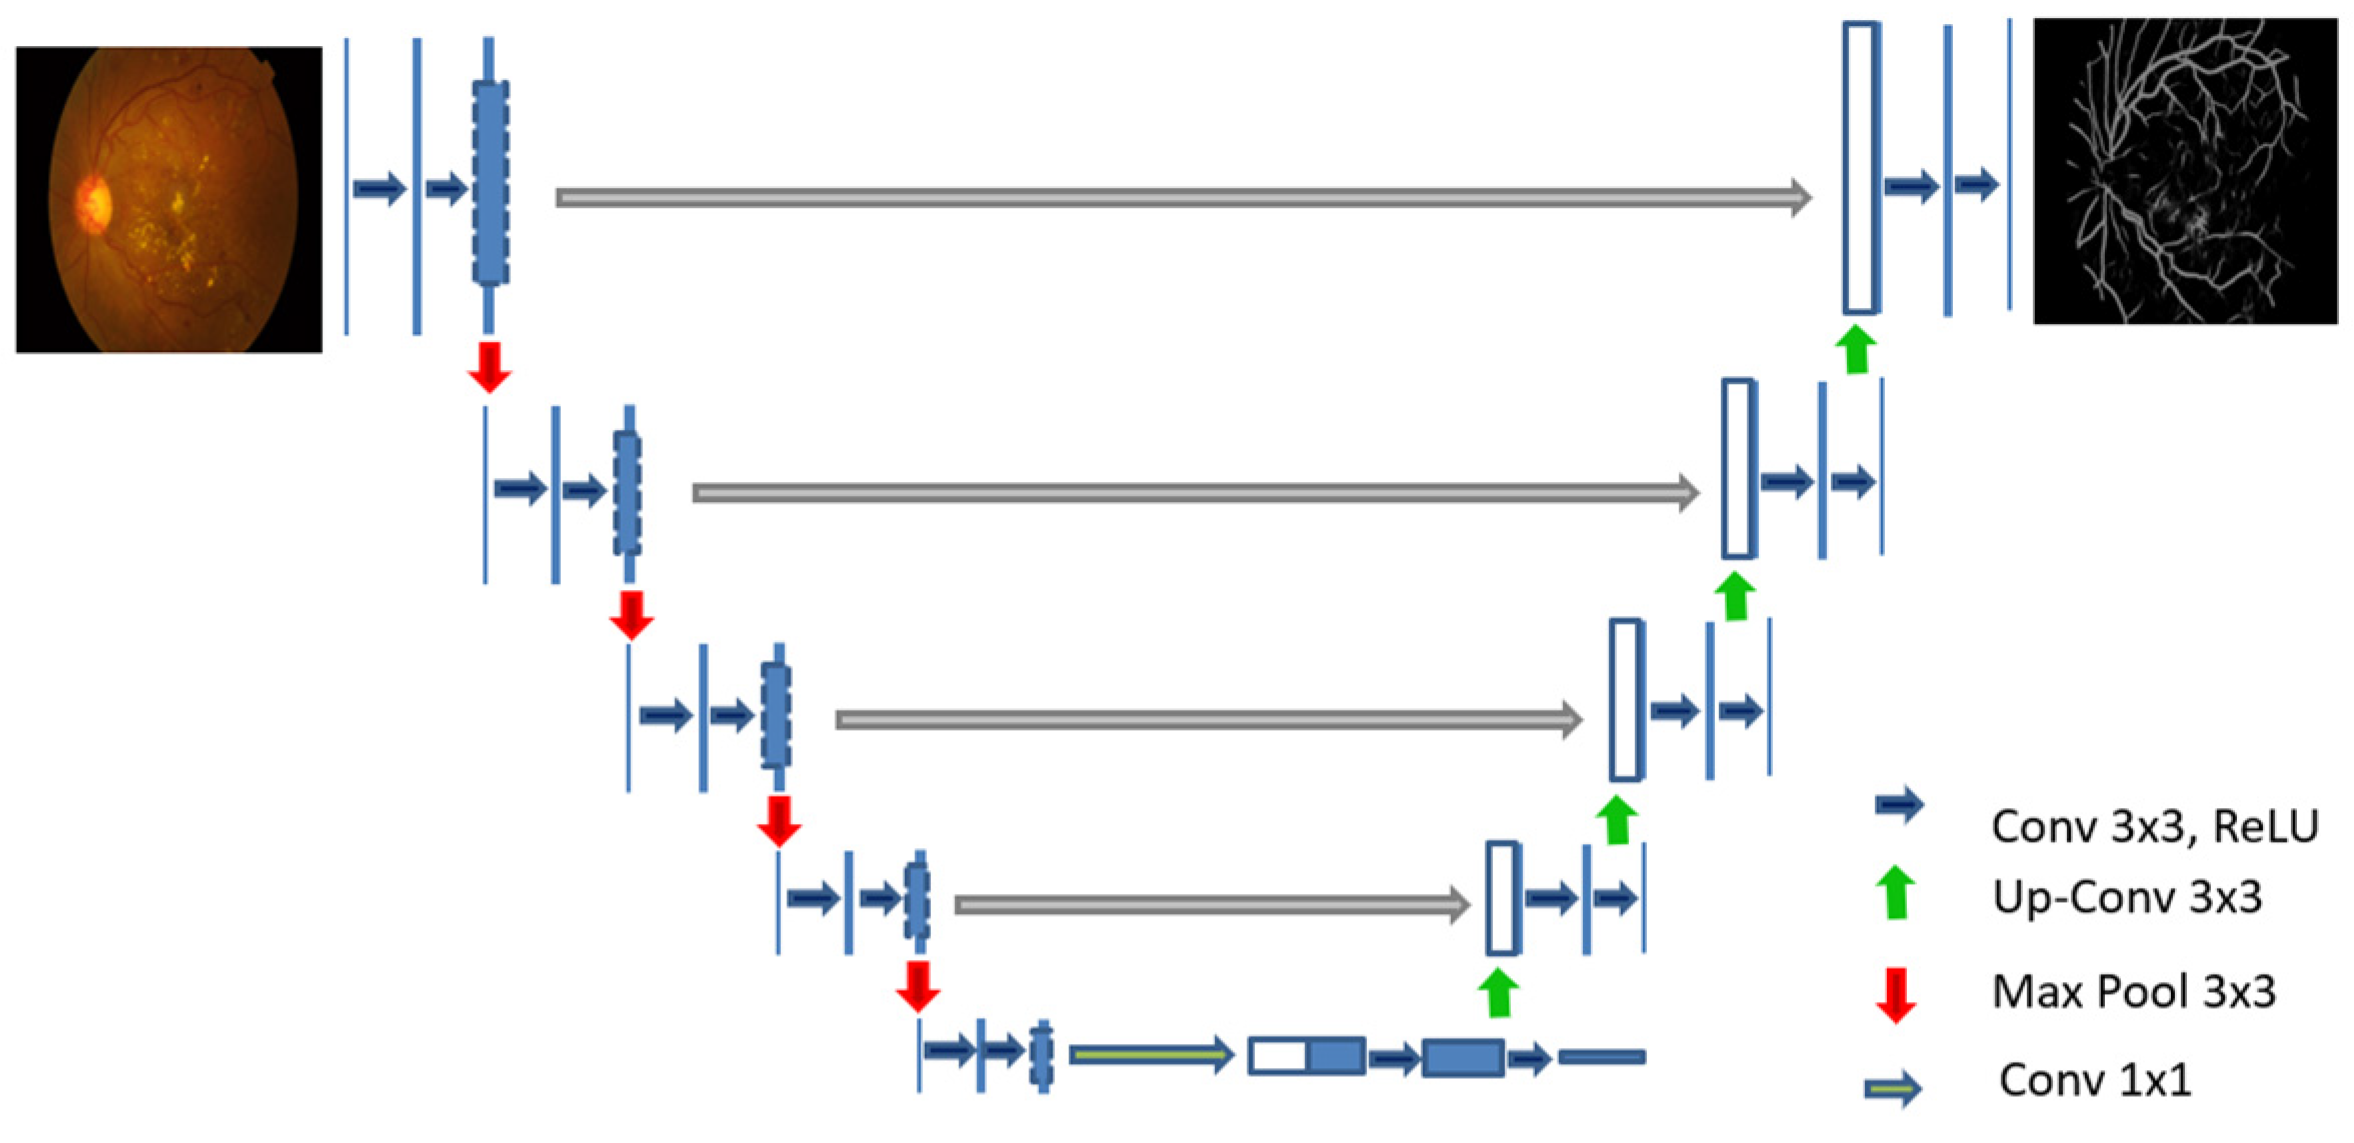
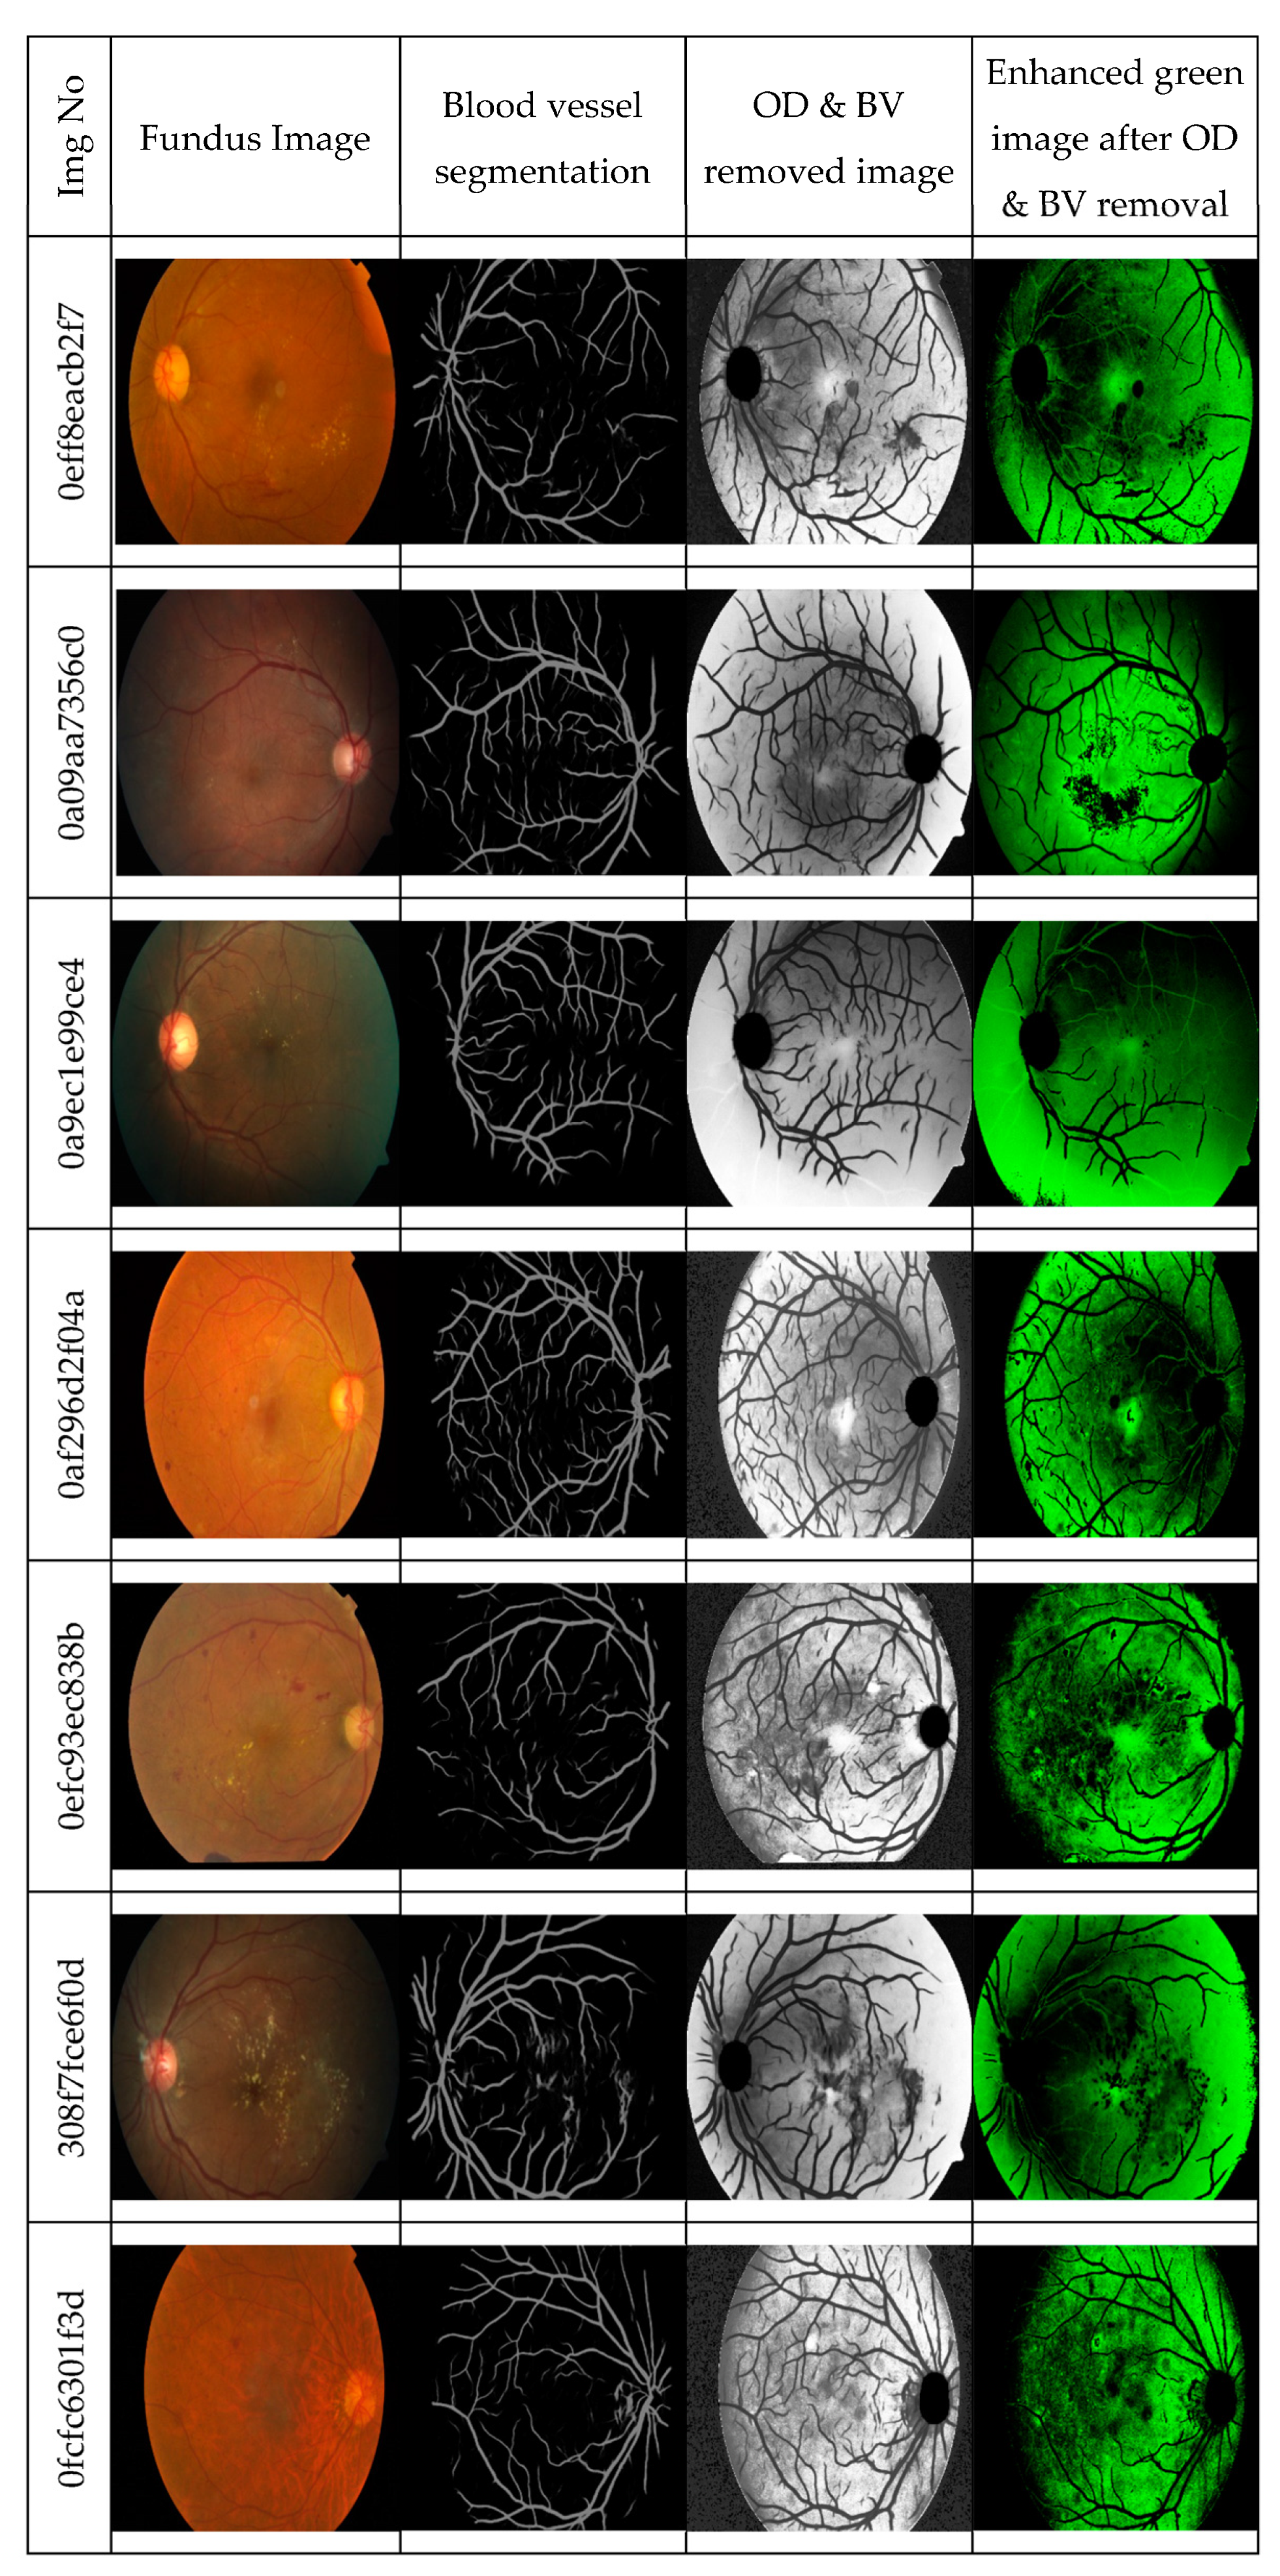
  • Two U-Nets are trained through supervised learning for the retinal vessel segmentation, i.e., the U-Net_OD for optic-disc segmentation and the U-Net_BV for blood vessel segmentation, to enhance the individual learning performance.
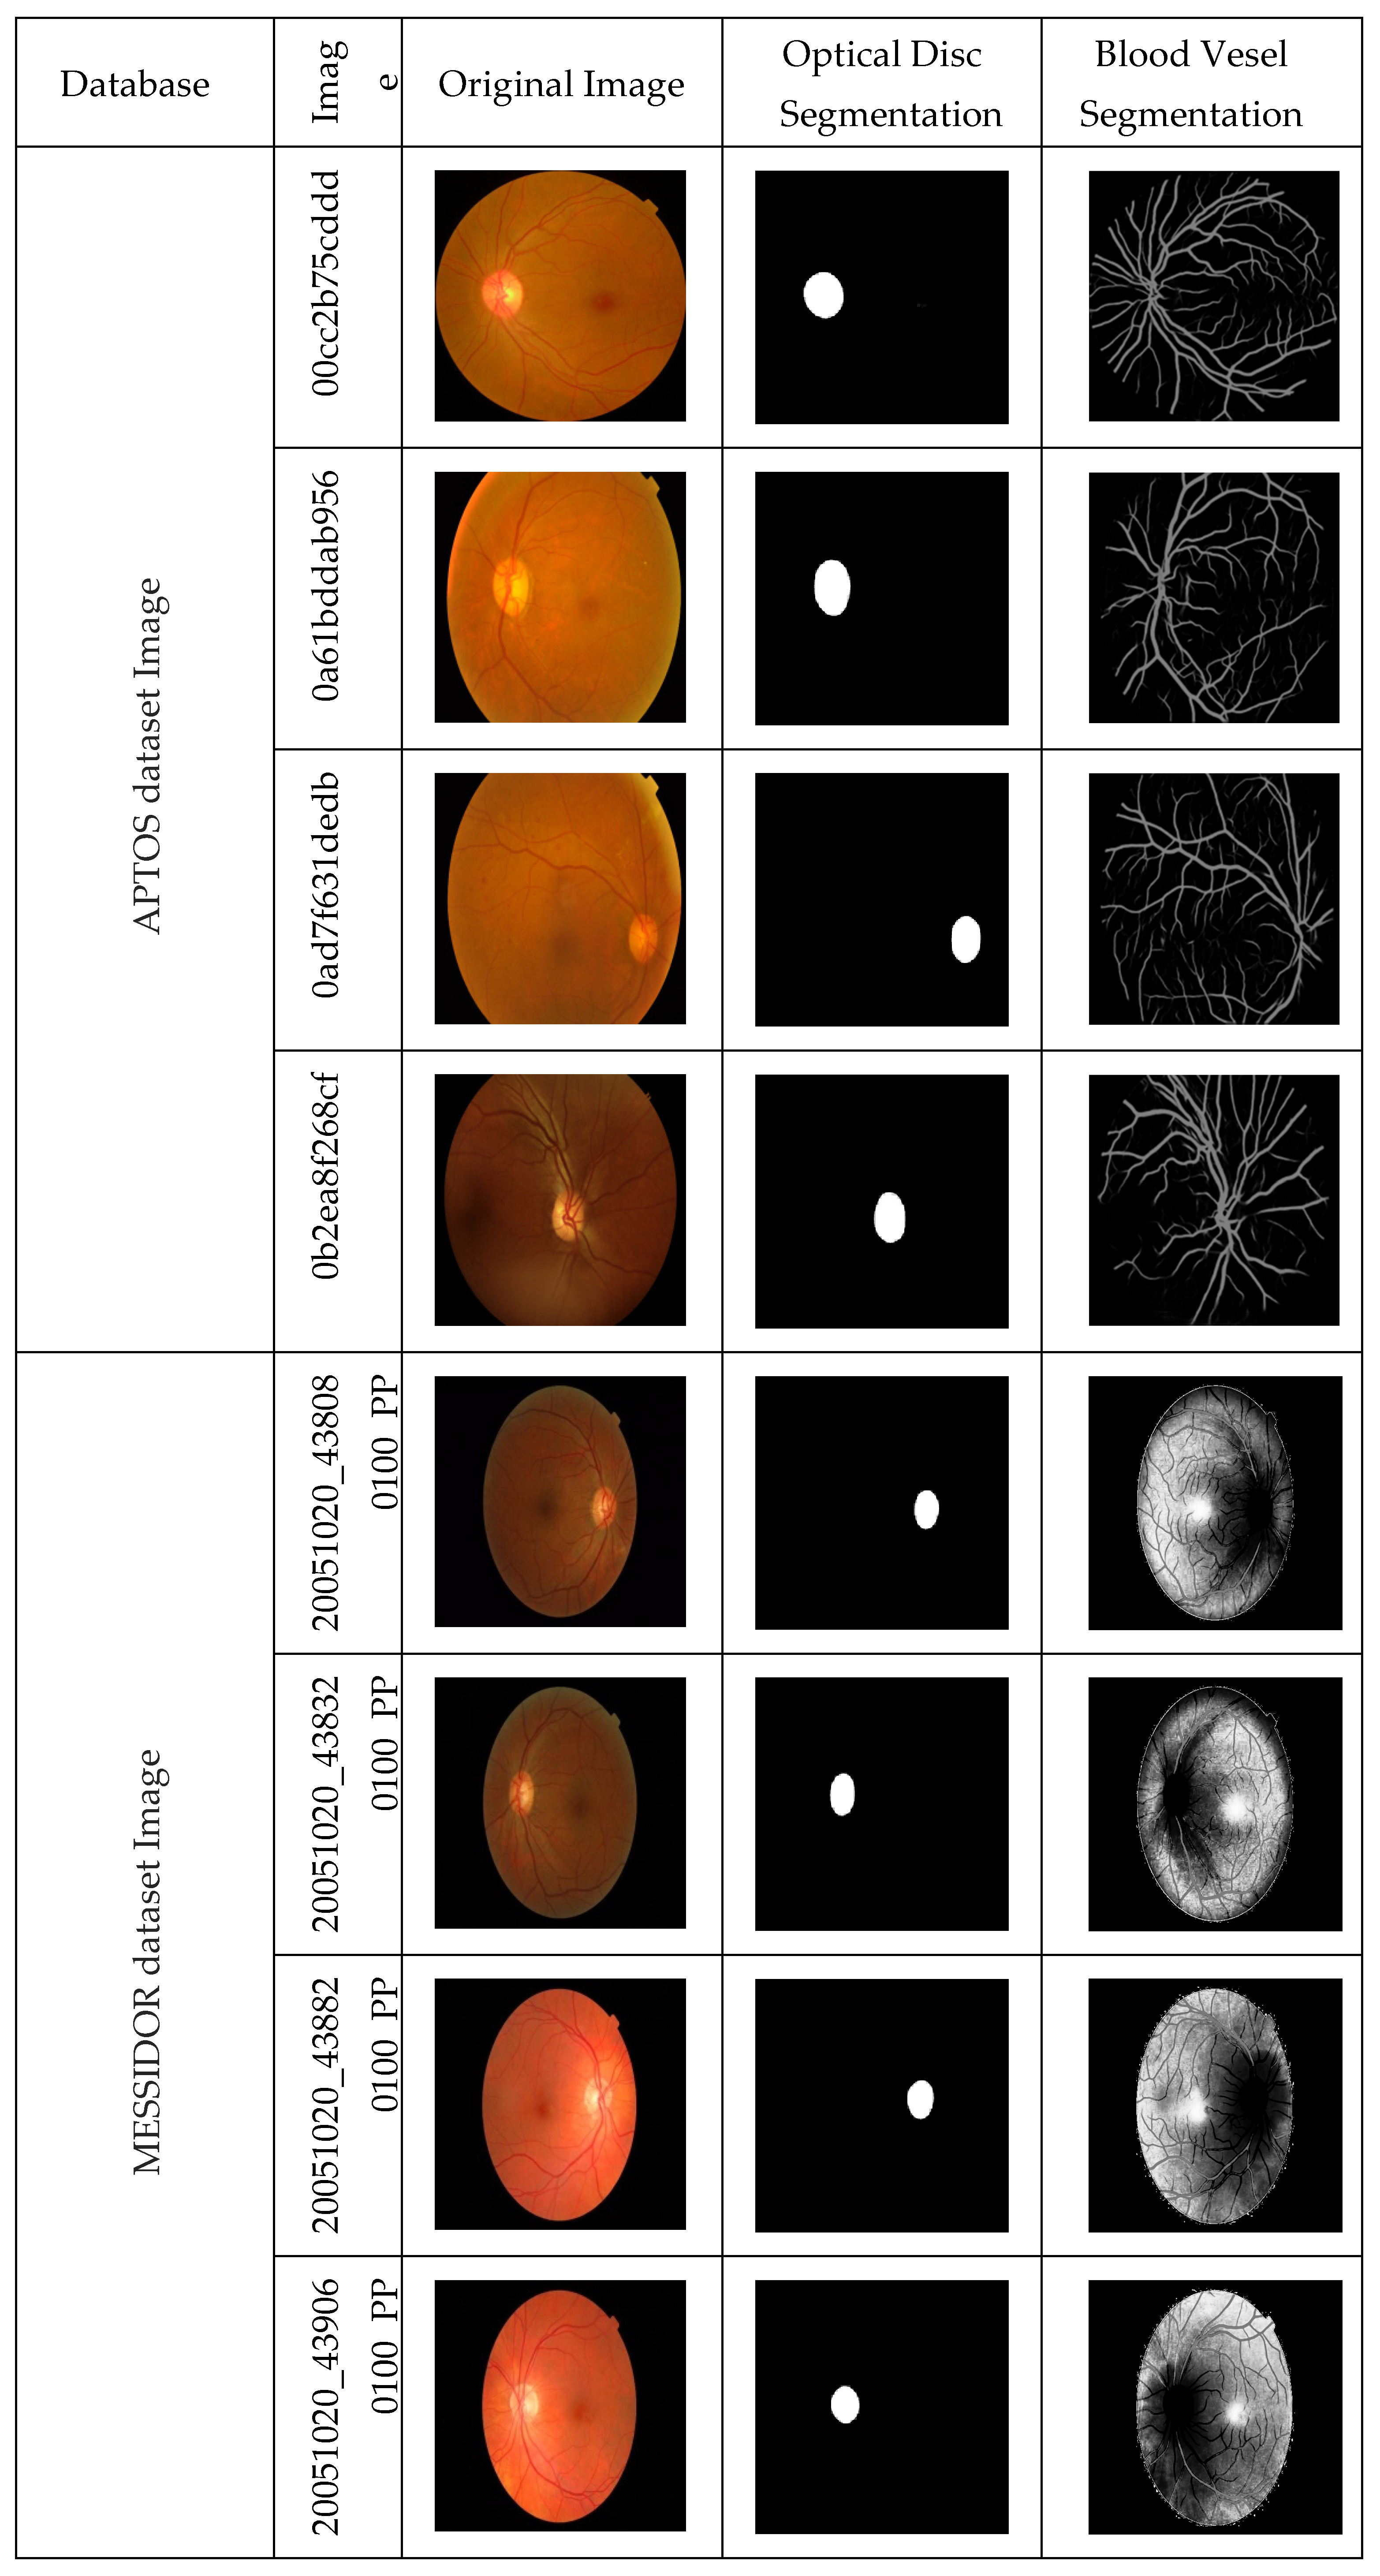
  • DR classification is done using CNN and SVM on the APTOS and MESSIDOR fundus image datasets, which are public datasets and can be downloaded with prior registration.
  • The APTOS dataset consists of 3662 fundus images, out of which 1805 images are Normal, 370 images belong to MAs, 999 images are of HMs types, and 295 images belong to the EXs category.
  • The MESSIDOR dataset consists of 1200 fundus images, out of which 548 images are Normal, 152 images belong to MAs, 246 images are of HMs types, and 254 images belong to the EXs category.
As per the literature survey, the state-of-the-art shows a limited number of works are on public datasets. Since the DIABET DB1 is having a smaller number of images, we have tested our model with APTOS and MESSIDOR datasets. The advantage of deep learning is that it can be used for both segmentation and classification. The proposed model shows significant improvement in the average sensitivity and average specificity.
The result shows 99.35% recognition of non-diabetic retinopathy in the case of the APTOS dataset and 93.65% recognition in the MESSIDOR dataset. Other analyses, such as sensitivity, specificity, precision, ROC, and area under the curve (AUC) for each type of lesion, are shown in the Section 3.
The subsequent part of the paper is arranged in the following order: Section 2 presents a review of DR detection and classification. Section 3 shows the complete framework of the proposed model, U-Net architecture, and performance evaluation metrics. The detailed results have been reported the results with discussions in Section 4. The conclusion of the work is presented in Section 5.

2. Related Work

This section presents a review of various state-of-art diabetic retinopathy performed by different researchers. The retinal image analysis is categorically classified into two major extents i.e., retinal image segmentation and retinopathy screening. Wang, L. et al. [1] presented a deep learning network to identify the OD regions using a classical U-Net framework where the sub-network and the decoding convolutional block are used to preserve important textures. Aslani S. et al. [30] advocated a multi-feature supervised segmentation method for retinal blood vessels segmentation by pixel classification using a multi-scale Gabor wavelet and B-COSFIRE filter for enhanced segmentation. As CNN became popular in image processing, Wang S. et al. [15] presented a hierarchical method for retinal blood vessel segmentation using ensemble learning; in addition to the last layer output, the intermediate output of CNN is also used to encourage multi-scale feature extraction. Lim G. et al. [31] presented a convolutional neural network feature-based integrated approach for the optic disc and cup segmentation. Lahiri A. et al. [18] defined ensemble deep neural network architecture for the segmentation of retinal vessels. Here training space generates a diversified dictionary referred to as visual kernels used for identifying a specific vessel orientation. In the year 2015, Ronneberger O et al. [23] introduced convolutional networks known as U-net having a typical training strategy based on data augmentation. The architecture consists of a contracting path followed by an expanding path to capture and learn the context from the localized information precisely.
Various retinopathy screening techniques are proposed by the researchers. Mahum R. et al. [32] proposed a hybrid approach using convolutional neural network (CNN), HOG, LBP, and SURF features for glaucoma detection. An ensemble-based framework for MAs detection and diabetic retinopathy grading was proposed by Antal B. et al. [33], which is claimed to provide high efficiency in case of open online challenges. Junior S.B. et al. [5] presented an automated approach for microaneurysm and hemorrhage detection in fundus images using mathematical morphology operations. Kedir M. Adal et al. [34] proposed a semi-supervised method for automatic screening of early diabetic retinopathy via microaneurysm detection. S.S. Rahim et al. [2] introduced an automated approach for the acquisition, screening, and classification of DR. They employed circular Hough transform for microaneurysm detection. A novel convolutional neural networks model to combine exudates localization and diabetic macular edema classification using fundus images was introduced by Perdomo O et al. [9]. A hybrid feature vector model for red lesion detection proposed by Orlando J. et al. [19] consists of the CNN and hand-crafted features; here, the CNN is trained using patches around the lesion with the aim of learning patches automatically. Mansour R.F. [35] discussed a Deep-learning-based CAD system using multilevel optimization with enhanced GMM-based background subtraction. Here the DR feature extraction using Caffee–AlexNet, and the DR classification is done with the two-class SVM classifier. Tzelepi M. et al. [36] used a re-training methodology with deep convolutional features for image retrieval; here, the authors claim a fully unsupervised model where the re-training is done using the available relevant feedback. A 2D Gaussian fitting for the hemorrhage extraction with Gaussian fitting and a human visual characteristic is proposed by Wu J. et al. [16], and the model is claimed to screen hemorrhages more effectively. Zhou Q. et al. [28] explored the multi-scale deep context information for semantic segmentation by combining the information of the fine and coarse layers that helps to produce semantically accurate predictions. A multi-context ensemble CNNs architecture for small lesion detection is proposed by Savelli B. et al. [29]; here, the authors tried to train the CNN on image patches of different dimensions to learn at different spatial contexts and ensemble their results. Wang X. et al. [37] presented a cascade framework fundus image classification; the framework includes background normalization, retinal vessel segmentation, weighted color channel fusion, feature extraction, and dimensionality reduction. Saha S.K. et al. [38] presented a review of the state-of-the-art of longitudinal color fundus image registration, including preprocessing for the automation of DR progression analysis. Asiri N. et al. [3] presented an overview of the fundus image datasets, deep-learning architectures designed and employed for the detection of the DR lesions such as exudates, microaneurysms, hemorrhages, referable SDRs, and the deep-learning methods used for optic disc and retinal blood vessels segmentation. They also compared the overall performance with hand-engineered features. Kumar S. et al. [4] also compared the performances of the different classifiers, such as Probabilistic Neural Network (PNN), SVM, and Feed Forward Neural Network, propose an early diabetic retinopathy detection system for proliferative diabetic retinopathy detection considering the abnormal blood vessels and cotton wools from color fundus images. A review of deep learning models for glaucoma detection with diabetic retinopathy and age-related macular degeneration is presented by Sengupta S. et al. [10] that contains chronological updates till 2019. Khojasteh P. et al. [7] compared different deep-learning approaches for the detection of exudate using Resnet-50 and SVM based on their sensitivity and specificity values. Kobat S.G. et al. [39] presented a DR image classification technique using transfer learning, they used DenseNet201 architecture to extract the deep features of the DR image, and the model was tested on APTOS 2019 dataset. Ali R. et al. [40] proposed Incremental Modular Networks (IMNets); here, the small subNet modules are used for exploiting the salient features of a specific problem, and integration of such subNets can be used to build a powerful network. The authors claim this will reduce the computational complexity and will help to optimize the network performance.

3. Proposed Model

In this work, we have proposed an asymmetric deep-learning feature-based model for diabetic retinopathy. The extraction of the biomarkers from the retinal images is difficult due to their varying intensity level. The intensity of the optic disc is brighter than the background, so inappropriate segmentation of the optic disc affects the detection of bright lesions such as MAs and HMs. On the other hand, the blood vessel intensities are darker, which results in a substantial number of junctures with the exudates.

3.1. Segmentation Using U-Net

The U-Net is a well-established segmentation tool for biomedical image segmentation [23]. It achieves high accuracy in the 2D and 3D image segmentation with a limited number of training images. This is flexible and faster since all the layers are not fully connected. To overcome the effect of the retinal biomarkers in the DR detection we proposed a hybrid model with two different U-Nets for the retinal vessel and optic disc.
The architecture of U-Net is presented in Figure 1, it consists of two phases, the first contracting path and the second the expansive path. The contracting path performs CNN operations, i.e., convolution operation defined by Equation (1), the Equation (2) represents ReLU and pooling operation used in the CNN encoder. The expansive path shows the function of the CNN decoder, where the pooling operations are substituted by up-sampling operators. This allows the network to propagate the precise context information of the image to a higher resolution using the extrapolation technique [23].
Figure 1. U-Net architecture for blood vessel segmentation.
Bdcc 07 00025 g001
I * f x ,   y = s = 1 l t = 1 w f s , t . I x + s 1 ,   y + t 1 + b
The regularized training error of a particular layer is presented in Equation (3). The sigmoid function Si shown in Equation (4) is used to map the output value between (0,1) [8].
R e L U x = M a x 0 , x
where:
x = input value of the neuron
E w , b = 1 n i = 1 n L y i ,   f x i + α R w
where:
L = loss function, i.e., model loss parameter
R = regularization factor used to penalize the model complexity
α = regularization strength control parameter
S i x = 1 1 + e x
Figure 2 shows the original images of APTOS and MESSIDOR datasets and their respective optical disc segmented images applying U-Net_OD and blood vessels images applying U-Net_BV.
Figure 3 shows the results of the (a) blood vessel, (b) optic disc segmentations (c) after the removal of the blood vessel and optic disc, the green channel image is enhanced. Then the enhanced green channel images are resized to 512 × 512 images and used as the input to the convolutional network.
The block diagram of the proposed asymmetric deep learning model for the automatic DR screening is shown in Figure 4. The U-Net_BV is trained to detect the blood vessels, and the U-Net_OD is trained to detect the optic disc.
The bright lesions are more prominent in the green channel due to the lesser absorption property of the green channel [4], so the green channel is less affected by the fovea. We have chosen this channel for the DR screening. Many color fundus images in the database have non-uniform brightness and suffer from low contrast due to the environment or lighting conditions. The green channel contents are enhanced by applying Contrast Limited Adaptive Histogram Equalization (CLAHE) [16]. The optic disc and the blood vessel are removed from the enhanced green image. Then the Deep Convolutional Neural Network is used to learn the DR grade from the enhanced green image with supervised learning. Figure 5 shows the architecture of deep CNN with SVM [41]. The enhanced green channel image after the removal of the BV and OD is used as the input to the proposed CNN model. The model is trained and tested using the labeled fundus images of APTOS and MESSIDOR datasets. The inimitability of the CNN architecture is subsampling in the spatial domain with local receptive features and weight sharing. The glaucoma-affected features are automatically learned and classified by the CNN classifier from retinal images.
In this proposed model, the CNN architecture consists of seven convolution layers, where each layer comprises a convolution operation followed by ReLU and MAX pooling operations. The ReLU activation function introduces the nonlinear to the output convolution layer. The pooling layer performs the down-sampling operation that reduces the size of the image after each convolution. Then the image is flattened to a fully connected feature vector of size 1 × 1024, which is followed by two dense layers that reduce the feature vector of size 1 × 512, then finally reduced to a size of 1 × 64. The soft-max value computed at the pixel level is used to calculate the energy function over the feature map, which also includes the cross-entropy loss as a penalty value. Classification is done using SVM with a sigmoid kernel function, as the DR classes are linearly separable. The cross-entropy loss at each position is defined by Equation (5) [3].
L o g L o s s =   1   N i = 1 N j = 1 M y i j l o g P i j
where N represents the number of samples and M represents the number of labels, the y i j is the indicator if the label j is correctly classified as, for instance, i . The P i j is the probability of the model that assigns the label j to the instance i . As segmentation is a pixel-level classification, the loss matrix defined for classification is also applicable to the segmentation [41].
The multi-class SVM is constructed by defining multiple hyperplanes, which define the piecewise decision boundary. The kth class hyperplane is shown in Equation (6) [42].
f x = w k T x + b k
r k = f x w = w k T x + b k w
where:
r k is the distance from the sample and kth hyperplane
k = 1, 2, 3, 4, i.e., the number of classes
The class label for a given input x is decided by the hyperplane having the highest value of w k T x + b k , i.e.,
y k = arg max k ( w k T x + b k )
The proposed deep learning framework using CNN with SVM is developed using the standard learning rate, and early stop parameter value of 0.99 and classification is done with 80:20 hold-out validation. We have used a GTX 1650 graphics system with 16 GB RAM to test the model.
According to the severity of diabetes, the retinal images are affected in different grades [12]. The gradation of DME is done as mentioned below:
Class 1: Normal
Class 2: Microaneurysms, i.e., presence of mild diabetic retinopathy.
Class 3: Hemorrhages, i.e., moderate level DR without affecting the fovea.
Class 4: Exudates, i.e., severe DR condition that affects the fovea, i.e., the PDR state.

3.2. Performance Measures

To evaluate the performance of the proposed deep learning framework, we used the parametric quantifiers such as recall or sensitivity, precision, accuracy, specificity, and f1-score [16,27,31], which are defined in the equations mentioned below:
R e c a l l =   T P   T P + F N
P r e c i s i o n =   T P   T P + F P
A c c u r a c y =   T P + T N T P + T N + F P + F N
S p e c i f i c i t y =   T N   T N + F P
f 1 S c o r e = 2 ×   P r e c i s i o n × R e c a l l   P r e c i s i o n + R e c a l l
The true positive (TP) represents the number of images correctly recognized by the model, and the true negative (TN) shows the number of truly rejected images, whereas the false positive (FP) represents the number of images recognized incorrectly, and the false negative (FN) shows the number of images wrongly rejected. The recall or the sensitivity defines the correctly classified retinal images. The precision shows the number of correctly classified images with respect to the total number of classified images. The specificity measures the true negative rate, i.e., high specificity implies less chance of a false positive acceptance rate by the system. The f1-score presents the harmonic mean of the classes [29,43,44] that illustrates the balance between the precision and the recall values. The accuracy shows the number of correctly recognized and correctly rejected images with respect to the total number of input images. The ROC curve is plotted using the true-positive rate and false-positive rate, which graphically represents the performance of the classifier. The performance model is represented using AUC analysis, where a more AUC value implies a better classification rate [13].

4. Results and Discussions

The results of the proposed deep learning method for DR are presented in this section. Here two U-Nets are employed for the blood vessel and optic disc segmentation. The DR grading is done with a CNN classifier according to the affected level of the retinal image. The proposed model is tested using the images of two challenging datasets i.e., the APTOS and the MESSIDOR color fundus images. Performances of models are presented in terms of recall, precision, accuracy, and f1-score values. The f1-score shows the harmonic mean of the average recall and precision values.

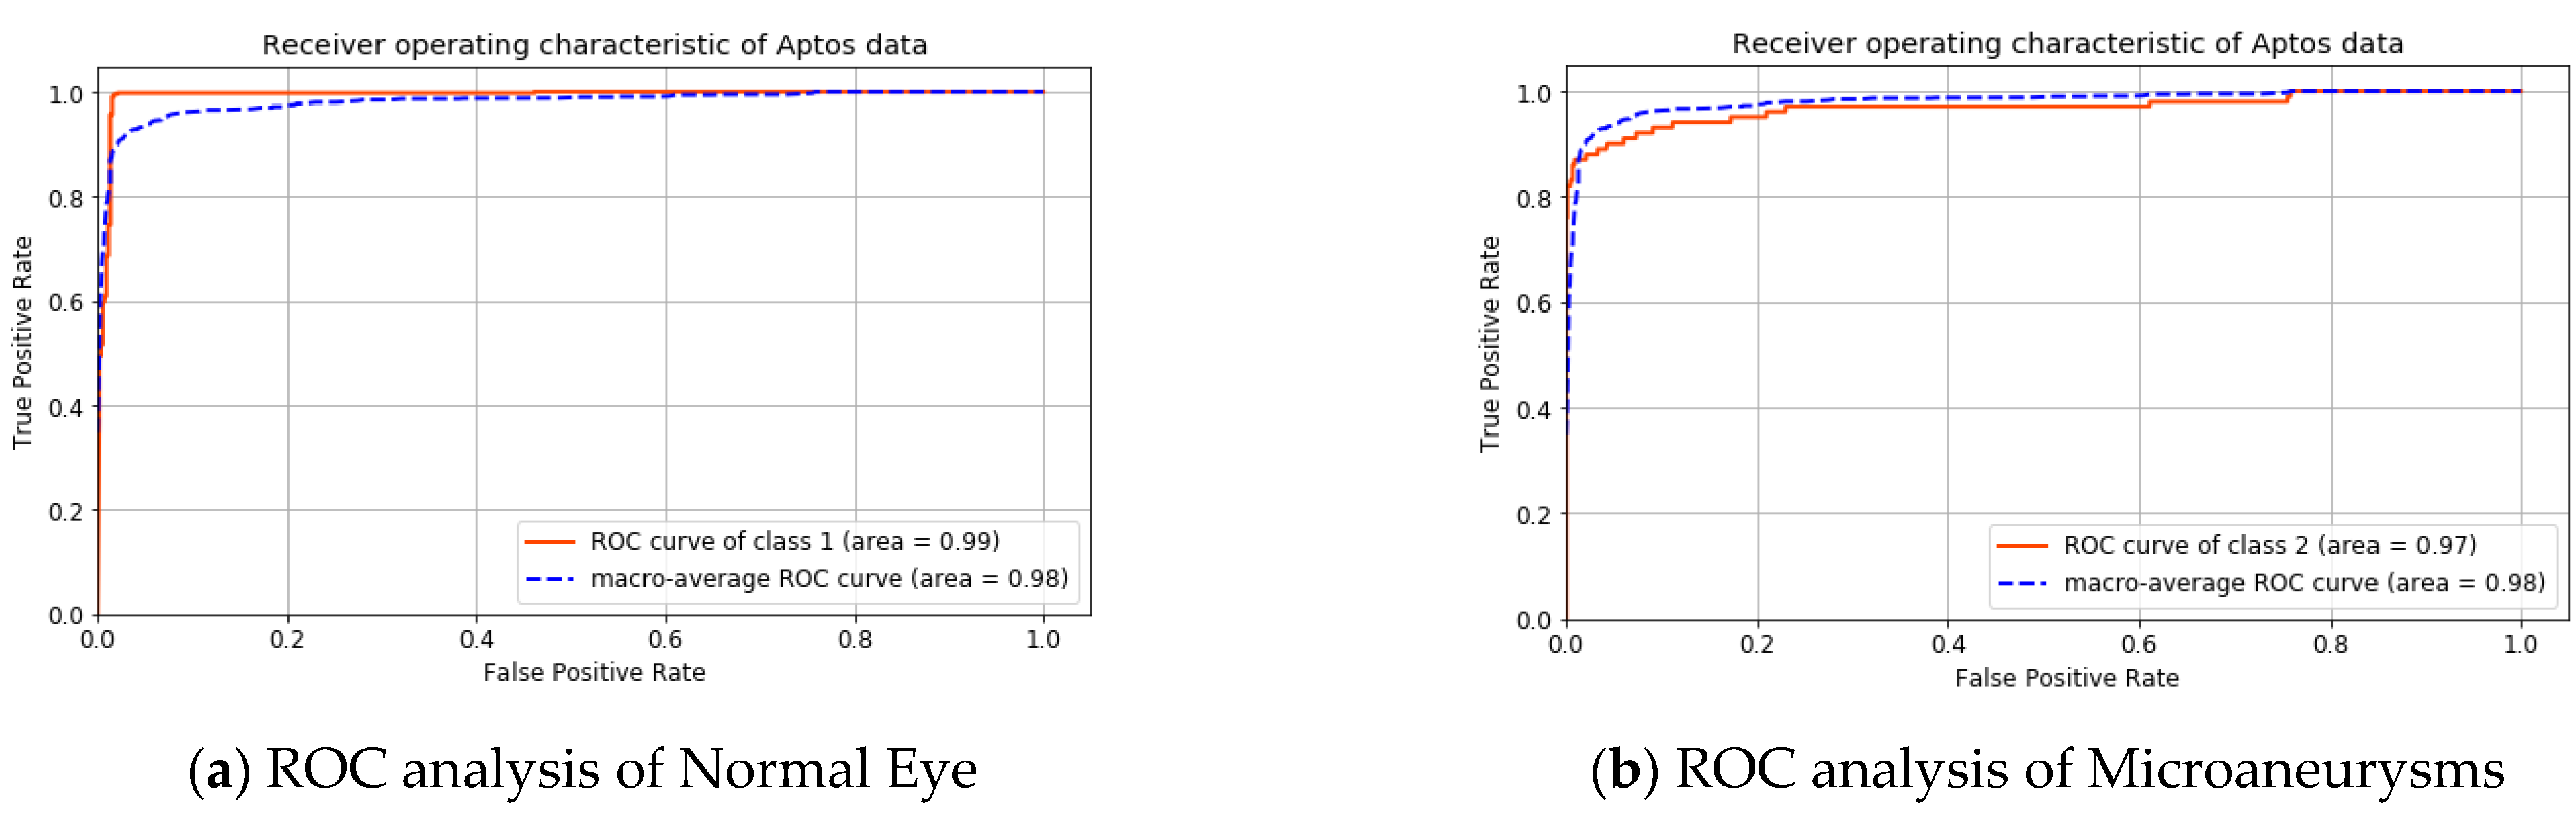
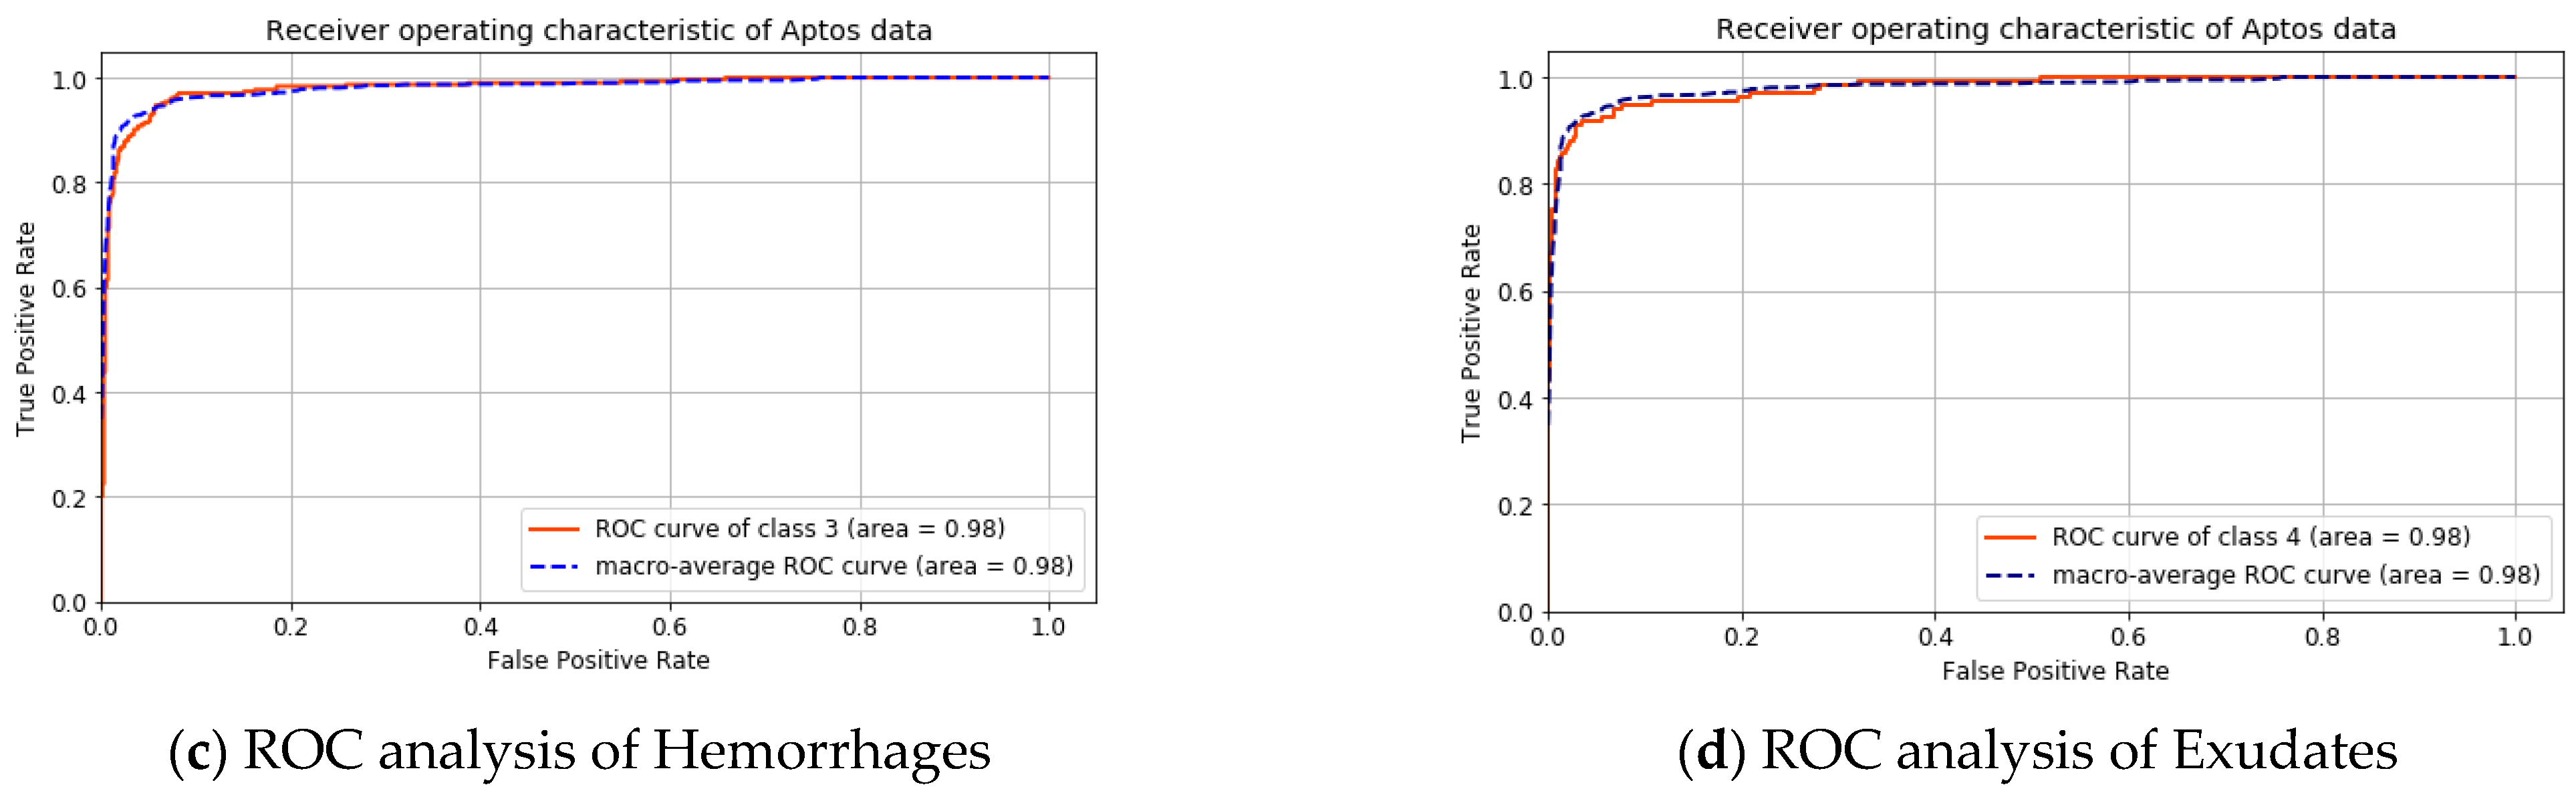
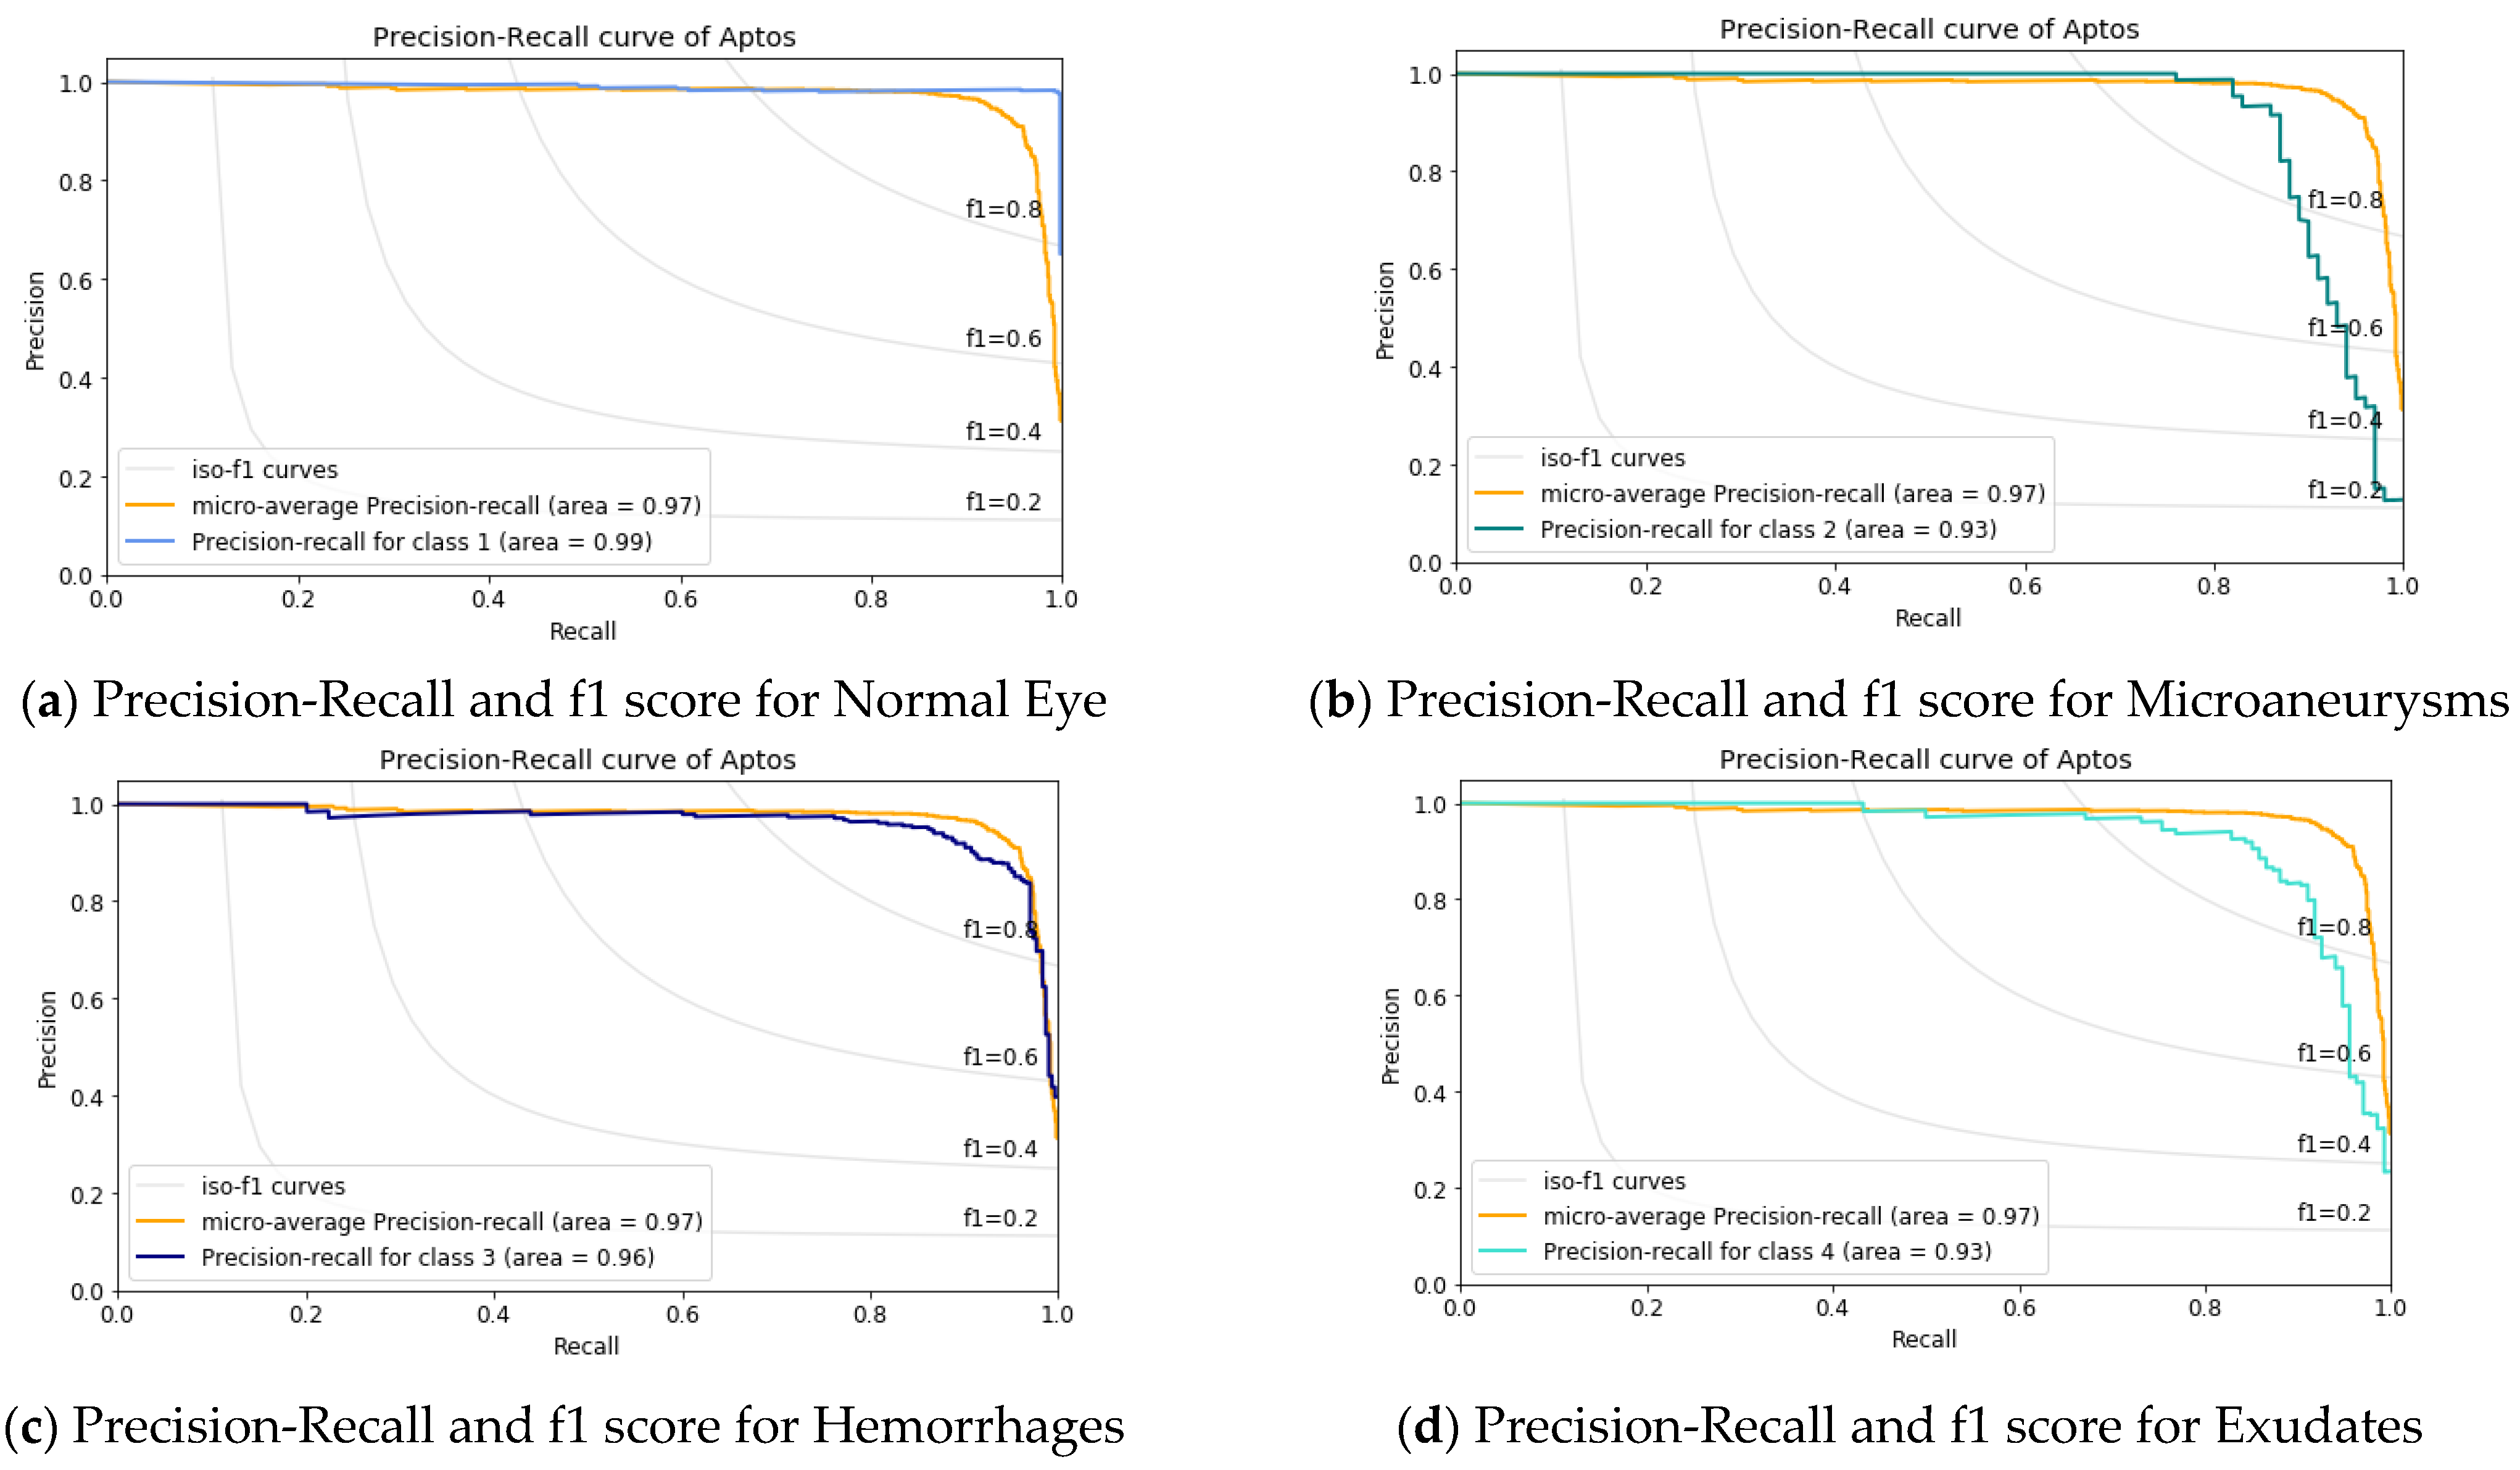
4.1. Result Analysis Using Aptos Dataset

Table 1 shows the results of the APTOS dataset where the accuracy value of the class-1 normal eye, i.e., the non-diabetic case, is 98.6% and the accuracy of MAs, HMs, and EXs are 98.0%, 95.5%, and 96.9% respectively, the overall accuracy is 97.25%.
A graphical analysis of the APTOS dataset is presented in Figure 6 and Figure 7. The ROC curve of the individual class and the macro-average are shown in Figure 6. The area under the curve for the macro-average is 98.0%. The area under the curve for the non-diabetic case is 99.0% and 97.0% for microaneurysms, this is 98.0% for hemorrhages and exudates.
Figure 7 shows the precision vs. recall curve. Here, the macro-average value is 97%. It illustrates that the class-1, i.e., the normal eye has the maximum 99% AUC value and the AUC value of 93% for Microaneurysms and Exudates, whereas, for the Hemorrhages case, it is 96.0%. This result infers that the detection of early diabetes is more challenging than the other stages.

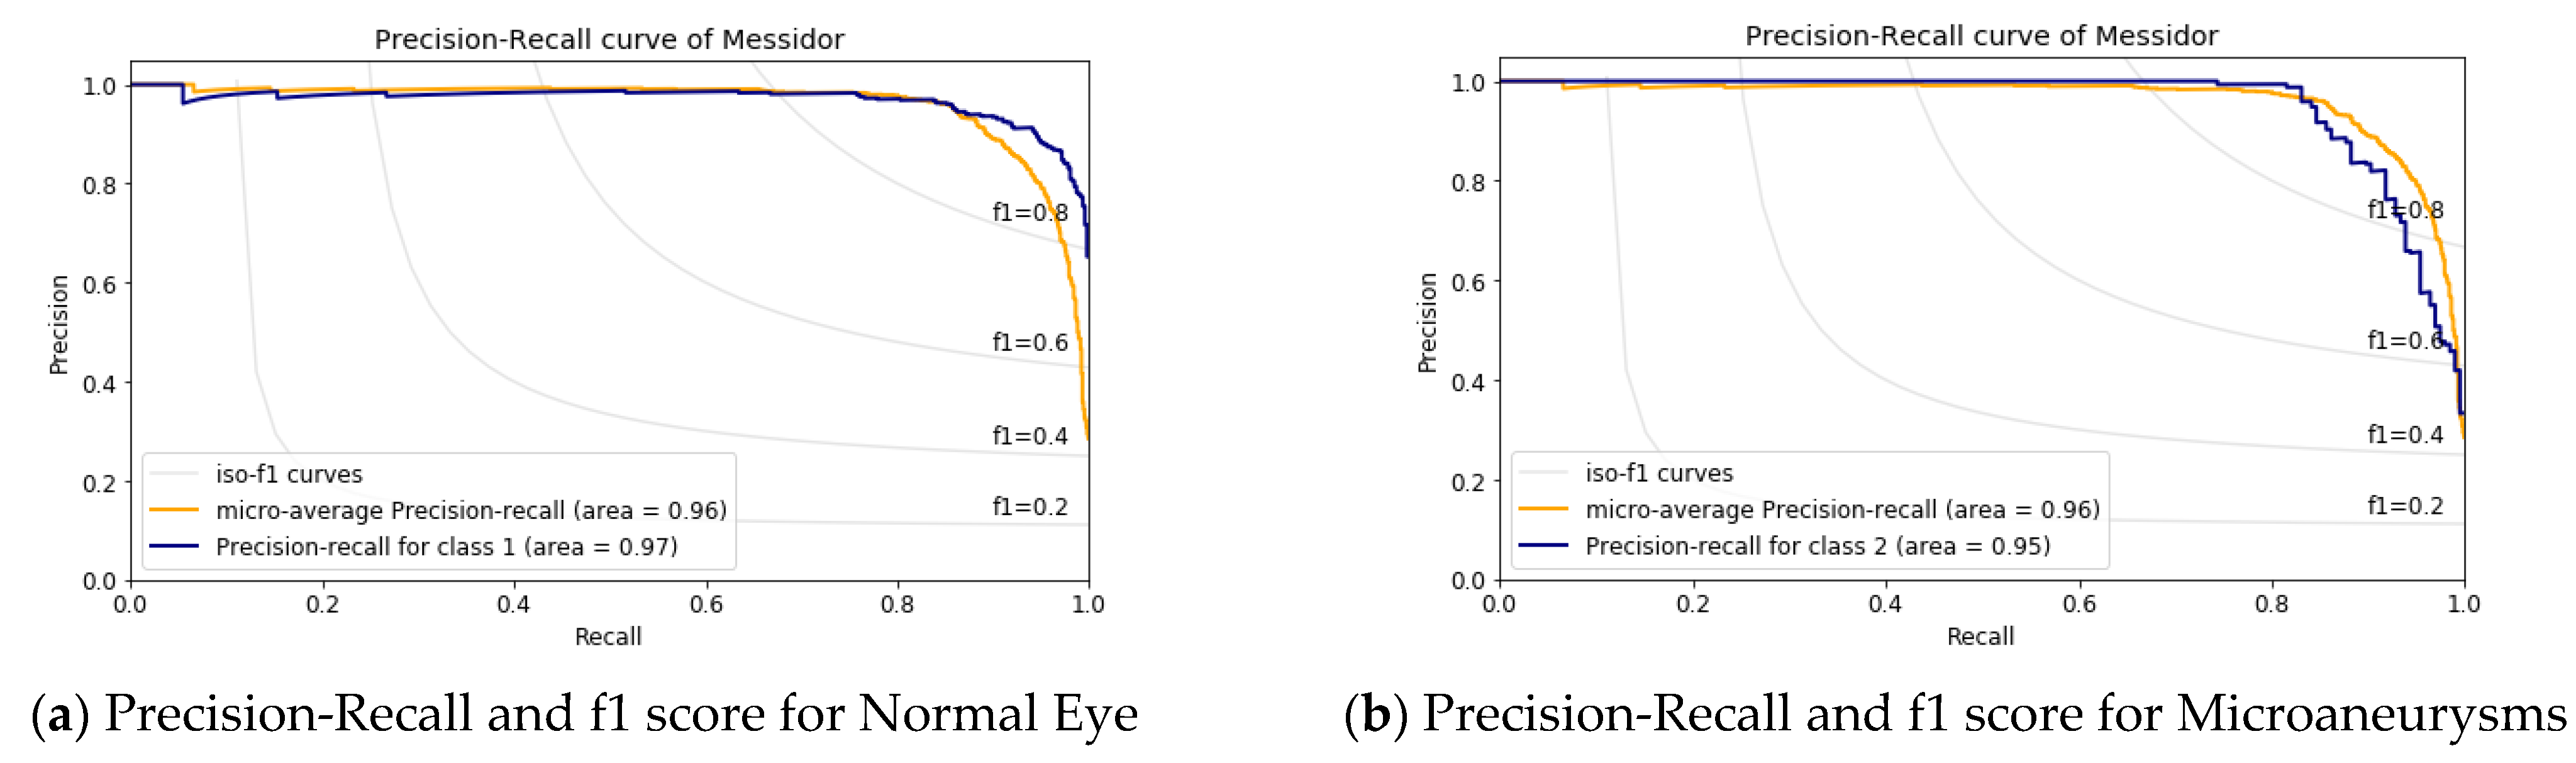
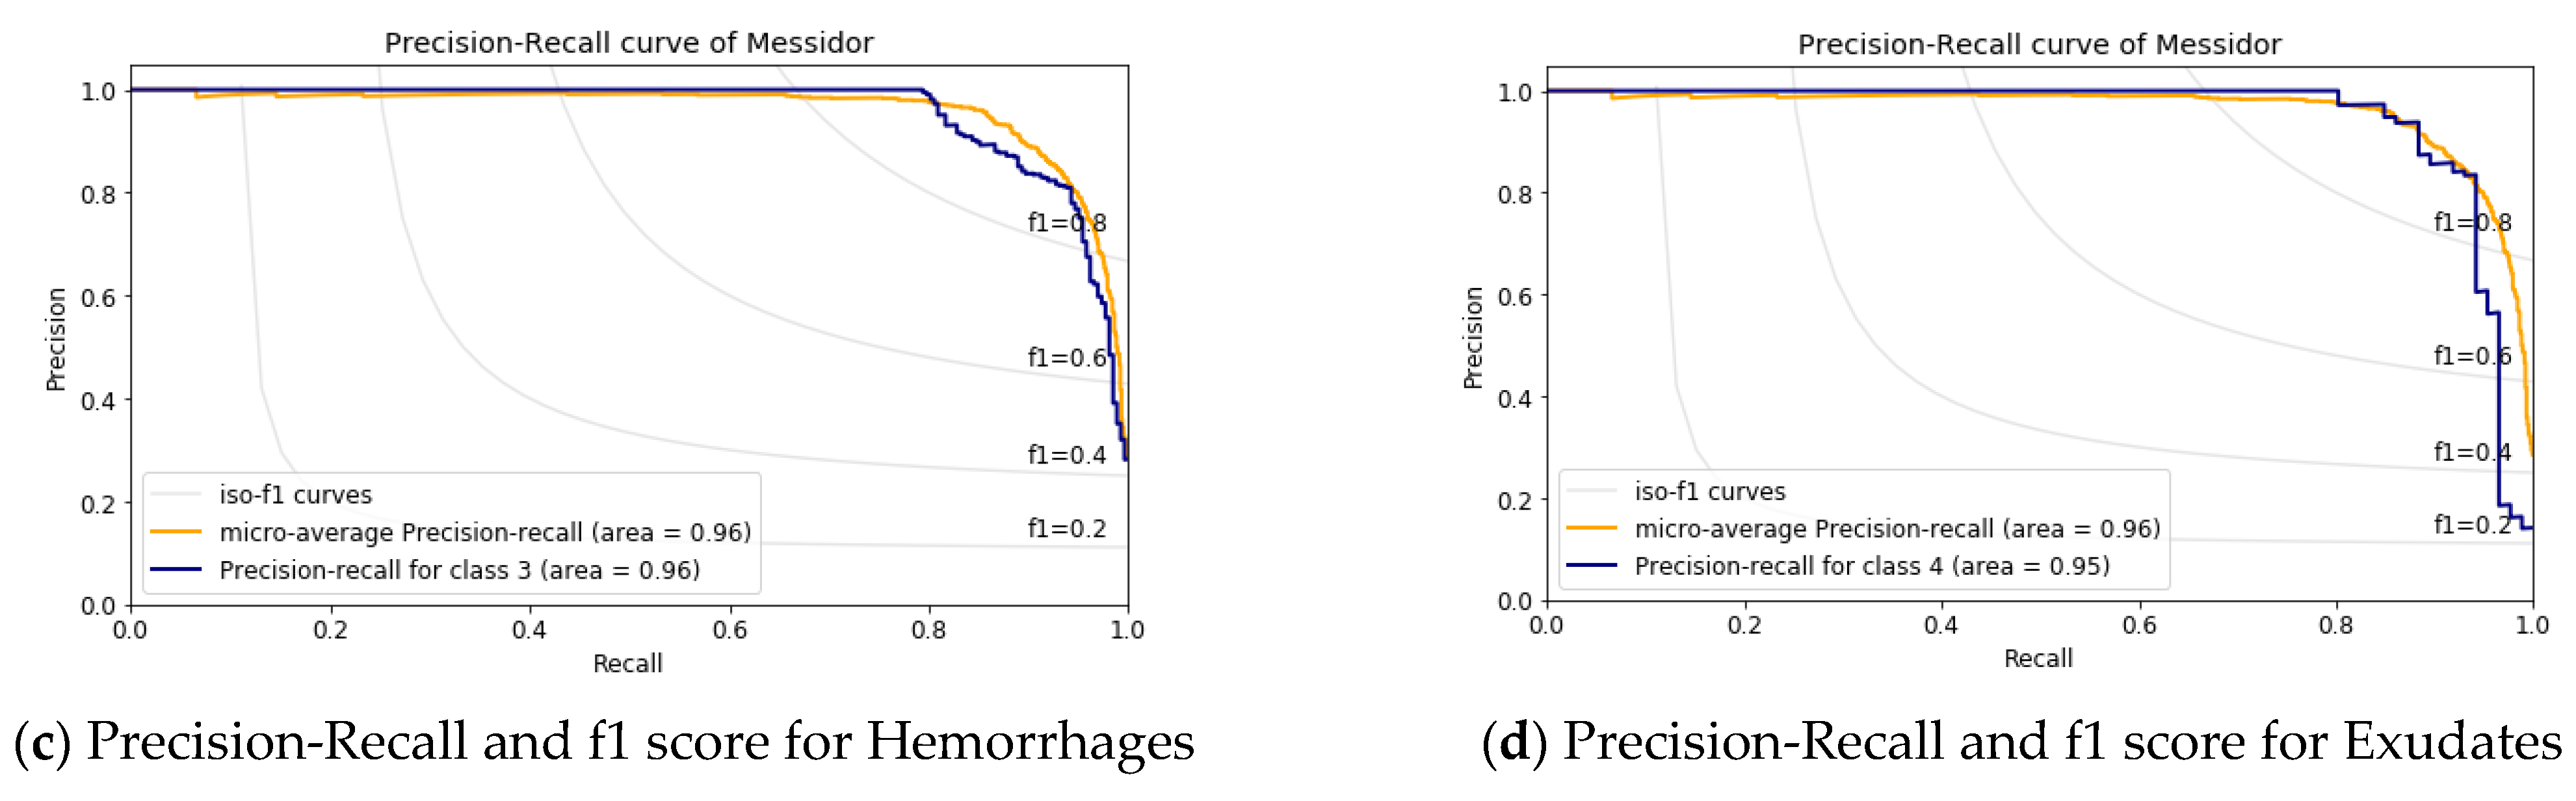
4.2. Result Analysis Using Messidor Dataset

Table 2 presents the result analysis of the MESSIDOR dataset. Here the accuracy of class-1, i.e., the normal eye, is 91.9%, and the accuracy results of MAs, HMs, and EXs are 95.4%, 93.6%, and 98.3%, respectively, with an overall accuracy of 94.8%. It is observed that the DR screening is more challenging in the MESSIDOR dataset.
The analysis of the MESSIDOR dataset is shown in Figure 8 and Figure 9. In Figure 8, the ROC curve of the individual class with the macro-average value is shown. Here the area under the macro-average is 98.0%. The area under the curve is 98.0% for non-diabetic cases, microaneurysms, and also for exudates. This value for hemorrhages is 97.0%.
The precision vs. recall curve for the MESSIDOR dataset is shown in Figure 9; here, the macro-average value is 96%. Figure 9a shows class-1, i.e., the normal eye having an AUC value of 97% and an AUC value of 95% for Microaneurysms and Exudates shown in Figure 9b,d, whereas, for the Hemorrhages case, it is 96.0% as in Figure 9c. This result implies there is more inference in case-1, i.e., the normal eye and in case-2, which is Microaneurysms.
This above result analysis shows an average accuracy of 97.25% for the APTOS dataset and 94.80 for the MESSIDOR dataset. The normal eye, i.e., non-diabetic cases, are classified more accurately with a sensitivity of 99.35 % and 93.65% for the APTOS and MESSIDOR datasets. In the case of PDR classes, the classification of microaneurysms is very important for the early detection of DR. According to the proposed model, it is detected with 98.0% and 95.4% accuracy for the APTOS and MESSIDOR datasets. The timely detection of hemorrhages is crucial so that action can be taken before further spreading; it is detected with an accuracy of 95.5% and 93.6% for the above-mentioned datasets. The exudates detection and proper course of action can save the person from complete blindness, according to our proposed model, the accuracy of exudates detection is 96.9% and 98.3% for both datasets respectively. This shows that the average accuracy of the PDR case is 96.8% for the APTOS and 95.76% MESSIDOR dataset.

4.3. Performance Comparison

Table 3 presents the available state-of-the-art for automatic DR classification. It shows the performance comparison of the existing models and the proposed using the average sensitivity and average specificity values. It is worth mentioning that the results reported for the APTOS dataset have a sensitivity of 91.81% and a specificity of 98.07%, whereas the average sensitivity using DenseNET [34] is 80.6% for the same dataset. The results of the MESSIDOR dataset also outperform, having a sensitivity of 87.04% and a specificity of 95.67%. The DIABET DB0 & DB1, which are used by Kumar S. et al. [4] and Rahim S.S. et al. [2], have fewer fundus images, hence not suitable for deep learning training. The enhancement in average sensitivity implies that a DR case can be more precisely recognized as per its actual class. Whereas improvement in the average specificity represents, a non-DR case will never be inferred with any type of DR class.

5. Conclusions

This paper proposed an asymmetric deep learning framework for retinal image segmentation and DR screening. Two U-Nets networks are trained, using fundus images and their corresponding segmented images, for the OD and BV segmentation. It is observed that segmentation of blood vessels and optic discs using U-Net is more competent than the other methods, i.e., the watershed transforms for precise segmentation of the DR images. Since the pixel values in the green channel are less affected by the fovea, the green channel images are used for our analysis. After removing the optic disc and blood vessels, these images are enhanced with CLAHE. Then CNN architecture is designed and trained using these enhanced images. The proposed model is tested using the fundus images of two publicly available datasets, i.e., the APTOS and the MESSIDOR datasets. The proposed model obtains improved DR grading in terms of sensitivity, specificity, and accuracy due to better OD and BV segmentation. The non-diabetic retinopathy detection accuracy is 98.6% for APTOS and 91.9% for the MESSINDOR dataset. The PDR detection accuracy is 96.8% and 95.76% for APTOS and MESSINDOR datasets, respectively. The result analysis shows that although the proposed model detects the non-DR case more precisely, there are inferences among the DR classes. Further investigation can be done on other type of medical image segmentation using U-Net and classification with deep learning to support clinical practices.

Author Contributions

Conceptualization, P.K.J., B.K. and T.K.M.; methodology, P.K.J., B.K. and C.P.; software, P.K.J., B.K. and C.P.; validation, P.K.J., T.K.M. and S.N.M.; formal analysis, P.K.J. and B.K.; investigation, T.K.M. and C.P.; resources, P.K.J., B.K. and S.N.M.; data curation, P.K.J., C.P. and M.N.; writing, P.K.J., B.K., C.P., M.N. and T.K.M.; original draft preparation, P.K.J., B.K., C.P. and T.K.M.; writing, review and editing, P.K.J., B.K., C.P. and T.K.M.; visualization, P.K.J., B.K., C.P.; supervision, B.K. and T.K.M.; project administration, P.K.J., B.K. and C.P. All authors have read and agreed to the published version of the manuscript.

Funding

This research received no external funding.

Institutional Review Board Statement

Not applicable.

Informed Consent Statement

Not applicable.

Data Availability Statement

The data supporting for this work can be found in https://github.com/khornlund/aptos2019-blindness-detection, https://www.adcis.net/en/third-party/messidor2/, all accessed on 29 November 2022.

Conflicts of Interest

The authors declare no conflict of interest.

References

  1. Wang, L.; Gu, J.; Chen, Y.; Liang, Y.; Zhang, W.; Pu, J.; Chen, H. Automated segmentation of the optic disc from fundus images using an asymmetric deep learning network. Pattern Recognit. 2021, 112, 107810. [Google Scholar] [CrossRef] [PubMed]
  2. Rahim, S.S.; Jayne, C.; Palade, V.; Shuttleworth, J. Automatic detection of microaneurysms in colour fundus images for diabetic retinopathy screening. Neural Comput. Appl. 2015, 27, 1149–1164. [Google Scholar] [CrossRef]
  3. Asiri, N.; Hussain, M.; Al Adel, F.; Alzaidi, N. Deep learning based computer-aided diagnosis systems for diabetic retinopathy: A survey. Artif. Intell. Med. 2019, 99, 101701. [Google Scholar] [CrossRef] [PubMed]
  4. Kumar, S.; Adarsh, A.; Kumar, B.; Singh, A.K. An automated early diabetic retinopathy detection through improved blood vessel and optic disc segmentation. Opt. Laser Technol. 2019, 121, 105815. [Google Scholar] [CrossRef]
  5. Júnior, S.B.; Welfer, D. Automatic Detection of Microaneurysms and Hemorrhages in Color Eye Fundus Images. Int. J. Comput. Sci. Inf. Technol. 2013, 5, 21–37. [Google Scholar] [CrossRef]
  6. Zhu, C.; Zou, B.; Zhao, R.; Cui, J.; Duan, X.; Chen, Z.; Liang, Y. Retinal vessel segmentation in colour fundus images using Extreme Learning Machine. Comput. Med. Imaging Graph. 2017, 55, 68–77. [Google Scholar] [CrossRef]
  7. Khojasteh, P.; Júnior, L.A.P.; Carvalho, T.; Rezende, E.; Aliahmad, B.; Papa, J.P.; Kumar, D.K. Exudate detection in fundus images using deeply-learnable features. Comput. Biol. Med. 2018, 104, 62–69. [Google Scholar] [CrossRef]
  8. Nayak, D.R.; Das, D.; Majhi, B.; Bhandary, S.V.; Acharya, U.R. ECNet: An evolutionary convolutional network for automated glaucoma detection using fundus images. Biomed. Signal Process. Control. 2021, 67, 102559. [Google Scholar] [CrossRef]
  9. Perdomo, O.; Otalora, S.; Rodríguez, F.; Arevalo, J.; González, F.A. A novel machine learning model based on ex-udate localization to detect diabetic macular edema. Lect. Notes Comput. Sci. 2016, 1, 137–144. [Google Scholar]
  10. Sengupta, S.; Singh, A.; Leopold, H.A.; Gulati, T.; Lakshminarayanan, V. Ophthalmic diagnosis using deep learning with fundus images—A critical review. Artif. Intell. Med. 2019, 102, 101758. [Google Scholar] [CrossRef]
  11. Zhao, R.; Li, S. Multi-indices quantification of optic nerve head in fundus image via multitask collaborative learning. Med. Image Anal. 2019, 60, 101593. [Google Scholar] [CrossRef] [PubMed]
  12. Akram, M.U.; Khalid, S.; Tariq, A.; Khan, S.A.; Azam, F. Detection and classification of retinal lesions for grading of diabetic retinopathy. Comput. Biol. Med. 2014, 45, 161–171. [Google Scholar] [CrossRef] [PubMed]
  13. Deepak, S.; Ameer, P. Brain tumor classification using deep CNN features via transfer learning. Comput. Biol. Med. 2019, 111, 103345. [Google Scholar] [CrossRef] [PubMed]
  14. Nazir, T.; Irtaza, A.; Shabbir, Z.; Javed, A.; Akram, U.; Mahmood, M.T. Diabetic retinopathy detection through novel tetragonal local octa patterns and extreme learning machines. Artif. Intell. Med. 2019, 99, 101695. [Google Scholar] [CrossRef] [PubMed]
  15. Wang, S.; Yin, Y.; Cao, G.; Wei, B.; Zheng, Y.; Yang, G. Hierarchical retinal blood vessel segmentation based on feature and ensemble learning. Neurocomputing 2015, 149, 708–717. [Google Scholar] [CrossRef]
  16. Wu, J.; Zhang, S.; Xiao, Z.; Zhang, F.; Geng, L.; Lou, S.; Liu, M. Hemorrhage detection in fundus image based on 2D Gaussian fitting and human visual characteristics. Opt. Laser Technol. 2018, 110, 69–77. [Google Scholar] [CrossRef]
  17. Leontidis, G.; Al-Diri, B.; Hunter, A. A new unified framework for the early detection of the progression to diabetic retinopathy from fundus images. Comput. Biol. Med. 2017, 90, 98–115. [Google Scholar] [CrossRef] [PubMed]
  18. Lahiri, A.; Roy, A.G.; Sheet, D.; Biswas, P.K. Deep neural ensemble for retinal vessel segmentation in fundus images towards achieving label-free angiography. In Proceedings of the 2016 38th Annual International Conference of the IEEE Engineering in Medicine and Biology Society (EMBC), Orlando, FL, USA, 6–10 August 2016; pp. 1340–1343. [Google Scholar]
  19. Orlando, J.I.; Prokofyeva, E.; del Fresno, M.; Blaschko, M.B. An ensemble deep learning based approach for red lesion detection in fundus images. Comput. Methods Programs Biomed. 2018, 153, 115–127. [Google Scholar] [CrossRef]
  20. Zhang, D.; Wang, J.; Noble, J.H.; Dawant, B.M. HeadLocNet: Deep convolutional neural networks for accurate classification and multi-landmark localization of head CTs. Med. Image Anal. 2020, 61, 101659. [Google Scholar] [CrossRef]
  21. Alyoubi, W.L.; Abulkhair, M.F.; Shalash, W.M. Diabetic retinopathy fundus image classification and lesions lo-calization system using deep learning. Sensors 2021, 21, 3704. [Google Scholar] [CrossRef]
  22. Amit, Y. Deep Learning With Asymmetric Connections and Hebbian Updates. Front. Comput. Neurosci. 2019, 13, 18. [Google Scholar] [CrossRef] [PubMed]
  23. Ronneberger, O.; Fischer, P.; Brox, T. U-net: Convolutional networks for biomedical image segmentation. In International Conference on Medical Image Computing and Computer-Assisted Intervention; Springer: Cham, Switzerland, 2015; pp. 234–241. [Google Scholar]
  24. Dunnhofer, M.; Antico, M.; Sasazawa, F.; Takeda, Y.; Camps, S.; Martinel, N.; Micheloni, C.; Carneiro, G.; Fontanarosa, D. Siam-U-Net: Encoder-decoder siamese network for knee cartilage tracking in ultrasound images. Med. Image Anal. 2020, 60, 101631. [Google Scholar] [CrossRef] [PubMed]
  25. Karimi, D.; Zeng, Q.; Mathur, P.; Avinash, A.; Mahdavi, S.; Spadinger, I.; Abolmaesumi, P.; Salcudean, S.E. Accurate and robust deep learning-based segmentation of the prostate clinical target volume in ultrasound images. Med. Image Anal. 2019, 57, 186–196. [Google Scholar] [CrossRef]
  26. Prusty, S.; Dash, S.K.; Patnaik, S. A Novel Transfer Learning Technique for Detecting Breast Cancer Mammograms Using VGG16 Bottleneck Feature. ECS Trans. 2022, 107, 733–746. [Google Scholar] [CrossRef]
  27. Prusty, S.; Patnaik, S.; Dash, S.K. SKCV: Stratified K-fold cross-validation on ML classifiers for predicting cervical cancer. Front. Nanotechnol. 2022, 4, 972421. [Google Scholar] [CrossRef]
  28. Zhou, Q.; Yang, W.; Gao, G.; Ou, W.; Lu, H.; Chen, J.; Latecki, L.J. Multi-scale deep context convolutional neural networks for semantic segmentation. World Wide Web 2018, 22, 555–570. [Google Scholar] [CrossRef]
  29. Savelli, B.; Bria, A.; Molinara, M.; Marrocco, C.; Tortorella, F. A multi-context CNN ensemble for small lesion de-tection. Artif. Intell. Med. 2020, 103, 101749. [Google Scholar] [CrossRef]
  30. Aslani, S.; Sarnel, H. A new supervised retinal vessel segmentation method based on robust hybrid features. Biomed. Signal Process. Control. 2016, 30, 1–12. [Google Scholar] [CrossRef]
  31. Lim, G.; Cheng, Y.; Hsu, W.; Lee, M.L. Integrated optic disc and cup segmentation with deep learning. In Proceedings of the 2015 IEEE 27th International Conference on Tools with Artificial Intelligence (ICTAI), Vietri sul Mare, Italy, 9–11 November 2015; pp. 162–169. [Google Scholar]
  32. Mahum, R.; Rehman, S.U.; Okon, O.D.; Alabrah, A.; Meraj, T.; Rauf, H.T. A Novel Hybrid Approach Based on Deep CNN to Detect Glaucoma Using Fundus Imaging. Electronics 2021, 11, 26. [Google Scholar] [CrossRef]
  33. Antal, B.; Hajdu, A. An Ensemble-Based System for Microaneurysm Detection and Diabetic Retinopathy Grading. IEEE Trans. Biomed. Eng. 2012, 59, 1720–1726. [Google Scholar] [CrossRef]
  34. Adal, K.M.; Sidibé, D.; Ali, S.; Chaum, E.; Karnowski, T.P.; Mériaudeau, F. Automated detection of microaneurysms using scale-adapted blob analysis and semi-supervised learning. Comput. Methods Programs Biomed. 2014, 114, 1–10. [Google Scholar] [CrossRef] [PubMed]
  35. Mansour, R.F. Deep-learning-based automatic computer-aided diagnosis system for diabetic retinopathy. Biomed. Eng. Lett. 2017, 8, 41–57. [Google Scholar] [CrossRef] [PubMed]
  36. Tzelepi, M.; Tefas, A. Deep convolutional learning for Content Based Image Retrieval. Neurocomputing 2018, 275, 2467–2478. [Google Scholar] [CrossRef]
  37. Wang, X.; Jiang, X.; Ren, J. Blood vessel segmentation from fundus image by a cascade classification framework. Pattern Recognit. 2018, 88, 331–341. [Google Scholar] [CrossRef]
  38. Saha, S.K.; Xiao, D.; Bhuiyan, A.; Wong, T.Y.; Kanagasingam, Y. Color fundus image registration techniques and applications for automated analysis of diabetic retinopathy progression: A review. Biomed. Signal Process. Control. 2018, 47, 288–302. [Google Scholar] [CrossRef]
  39. Kobat, S.G.; Baygin, N.; Yusufoglu, E.; Baygin, M.; Barua, P.D.; Dogan, S.; Yaman, O.; Celiker, U.; Yildirim, H.; Tan, R.-S.; et al. Automated Diabetic Retinopathy Detection Using Horizontal and Vertical Patch Division-Based Pre-Trained DenseNET with Digital Fundus Images. Diagnostics 2022, 12, 1975. [Google Scholar] [CrossRef]
  40. Ali, R.; Hardie, R.C.; Narayanan, B.N.; Kebede, T.M. IMNets: Deep Learning Using an Incremental Modular Network Synthesis Approach for Medical Imaging Applications. Appl. Sci. 2022, 12, 5500. [Google Scholar] [CrossRef]
  41. Sharifrazi, D.; Alizadehsani, R.; Roshanzamir, M.; Joloudari, J.H.; Shoeibi, A.; Jafari, M.; Hussain, S.; Sani, Z.A.; Hasanzadeh, F.; Khozeimeh, F.; et al. Fusion of convolution neural network, support vector machine and Sobel filter for accurate detection of COVID-19 patients using X-ray images. Biomed. Signal Process. Control. 2021, 68, 102622. [Google Scholar] [CrossRef]
  42. Guo, Y.; Zhang, Z.; Tang, F. Feature selection with kernelized multi-class support vector machine. Pattern Recognit. 2021, 117, 107988. [Google Scholar] [CrossRef]
  43. Jena, P.K.; Khuntia, B.; Palai, C.; Pattanaik, S.R. Content based image retrieval using adaptive semantic signature. In Proceedings of the 2019 IEEE 5th International Conference for Convergence in Technology (I2CT), Pune, India, 29–30 March 2019; pp. 1–4. [Google Scholar]
  44. Jena, P.K.; Khuntia, B.; Anand, R.; Patnaik, S.; Palai, C. Significance of texture feature in NIR face recog-nition. In Proceedings of the 2020 First International Conference on Power, Control and Computing Technologies (ICPC2T), Raipur, India, 3–5 January 2020; pp. 21–26. [Google Scholar]
Figure 2. Segmentation of optic disc and blood vessel of the APTOS and MESSIDOR fundus images.
Bdcc 07 00025 g002
Figure 3. Green channel image after removal of the blood vessel and optic disc.
Bdcc 07 00025 g003
Figure 4. The block diagram of the proposed asymmetric deep learning model for the automatic DR screening.
Bdcc 07 00025 g004
Figure 5. Deep CNN with SVM model.
Bdcc 07 00025 g005
Figure 6. ROC analysis for APTOS dataset.
Bdcc 07 00025 g006aBdcc 07 00025 g006b
Figure 7. Precision-Recall and f1 score analysis for APTOS dataset.
Bdcc 07 00025 g007
Figure 8. ROC analysis for the MESSIDOR dataset.
Bdcc 07 00025 g008
Figure 9. Precision-Recall and f1 score analysis for the MESSIDOR dataset.
Bdcc 07 00025 g009aBdcc 07 00025 g009b
Table 1. Class-wise performance of APTOS dataset.
ClassPrecision%Recall%f1-Score%Specificity%Accuracy%
197.6699.3598.5097.9598.60
292.5587.0089.6999.2298.00
393.0092.0892.5496.9995.50
488.1588.8188.4898.1596.90
Macro Avg92.8491.8192.3098.0897.25
Table 2. Class -wise performance of the MESSIDOR dataset.
ClassPrecision%Recall%f1-Score%Specificity%Accuracy%
188.8093.6591.1690.0691.90
282.7888.7285.6495.5395.40
391.8882.0686.6997.4393.60
496.0083.7289.4499.6798.30
Macro Avg89.8687.0488.2395.6794.80
Table 3. Comparison of results of existing methods and the proposed method.
ReferencesDatasetMethods UsedAvg. Sensitivity%Avg. Specificity%
Kumar S. et al. [4]DIABET DB1RBFN Network8793
Rahim S.S. et al. [2]DIABET DB0 & DB1Circular Hough Transform8055
Kedir M. Adal et al. [34]DIABET DB1KNN Classifier81.0892.3
Kobat, S. G [39]APTOSDenseNET 80.6-
Our proposed methodAPTOSUNet and CNN with SVM91.8198.08
Our proposed methodMESSIDORUNet and CNN with SVM87.0495.67
Disclaimer/Publisher’s Note: The statements, opinions and data contained in all publications are solely those of the individual author(s) and contributor(s) and not of MDPI and/or the editor(s). MDPI and/or the editor(s) disclaim responsibility for any injury to people or property resulting from any ideas, methods, instructions or products referred to in the content.

