Article

How Does Learning Analytics Contribute to Prevent Students’ Dropout in Higher Education: A Systematic Literature Review

by
Catarina Félix de Oliveira
1,2,
Sónia Rolland Sobral
1,
Maria João Ferreira
1,3 and
Fernando Moreira
1,4,5,*
1
REMIT, Universidade Portucalense, 4200-072 Porto, Portugal
2
LIAAD-INESC TEC, 4200-465 Porto, Portugal
3
ALGORITMI, Universidade do Minho, 4800-058 Guimarães, Portugal
4
IJP, Universidade Portucalense, 4200-072 Porto, Portugal
5
IEETA, Universidade de Aveiro, 3810-193 Aveiro, Portugal
*
Author to whom correspondence should be addressed.
Big Data Cogn. Comput. 2021, 5(4), 64; https://doi.org/10.3390/bdcc5040064
Submission received: 16 September 2021 / Revised: 14 October 2021 / Accepted: 25 October 2021 / Published: 4 November 2021
(This article belongs to the Special Issue Educational Data Mining and Technology)

Abstract

:
Retention and dropout of higher education students is a subject that must be analysed carefully. Learning analytics can be used to help prevent failure cases. The purpose of this paper is to analyse the scientific production in this area in higher education in journals indexed in Clarivate Analytics’ Web of Science and Elsevier’s Scopus. We use a bibliometric and systematic study to obtain deep knowledge of the referred scientific production. The information gathered allows us to perceive where, how, and in what ways learning analytics has been used in the latest years. By analysing studies performed all over the world, we identify what kinds of data and techniques are used to approach the subject. We propose a feature classification into several categories and subcategories, regarding student and external features. Student features can be seen as personal or academic data, while external factors include information about the university, environment, and support offered to the students. To approach the problems, authors successfully use data mining applied to the identified educational data. We also identify some other concerns, such as privacy issues, that need to be considered in the studies.

1. Introduction

Nowadays, society and the global economy are undergoing a more profound and widespread transformation than any other identified in the history of the world due to the impact of digital technologies; this transformation is called digital transformation. This can be defined as a disruptive change of organisations supported by digital technologies. Those disruptive forces transform the different sectors of activity, including higher education institutions. At the same time, and according to the literature, it can be stated that a country’s progress is highly dependent on the education of its citizens. Higher education is responsible for preparing students to act as professionals and creating environments for national progress based on creativity and innovation, supporting the country’s economic growth.
The development of digital transformation, including the widespread implementation of the internet, has led to an increased number of students in higher education, including through online courses/distance learning. However, this growth was/is accompanied by high dropout rates [1]. Dropout is a concern for higher education institutions because of the negative impact on the well-being of students and the community. The early withdrawal of students from degree programs has, on the one hand, monetary costs to educational institutions (i.e., loss of cash inflows) and, on the other hand, broad social costs [2]. Thus, understanding the causes of higher education dropout is essential to eliminate or at least minimise them as much as possible. However, this is a task of great complexity since dropping out is a multifaceted phenomenon in which heterogeneous variables are implicit [3].
In this scenario, and with the increasing development and implementation of learning support software tools, the analysis and prediction of student behaviour, including dropout, are crucial aspects of teaching environments, particularly in higher education. Here, the monitoring and analysis of student behaviour are fundamental key activities since they can contribute to improve students’ learning [4] and decrease the level of school dropout. According to Bañeres et al. [5], tools based on automatic recommendations are examples of systems that can improve the way learning processes are currently carried out and enhance the work of teachers in learning environments with a large number of students.
In this context and at this moment, learning analytics (LA), a multidisciplinary approach, has gained increasing relevance with the use of big data analysis to inform decisions in higher education [6]. The Horizon Report [7] predicted that LA will soon be adopted widely because it provides “ways … to improve student engagement and provide a high-quality, personalised experience for learners”. This prediction is supported by the availability of large amounts of student data (demographic information, grades, behaviours in learning management systems, etc.) that will allow to transform the ways in which educational institutions use data to address issues of retention, dropout and student success, and focus on the needs of each student in a personalised and data-driven way. Thus, LA solutions have started to appear, and many programs now offer degrees in LA research and practice [8].
The main objective of the research presented in this paper is to analyse and evaluate the contribution of LA to prevent students’ dropout in higher education. In this research, we use the systematic literature review methodology, which according to [9], concerns the “review of the evidence on a clearly formulated question that uses systematic and explicit methods to identify, select and critically appraise relevant primary research, and to extract and analyse data from the studies that are included in the review”. Furthermore, with this approach, the subjectivity and partiality that may occur can be reduced. A systematic review is methodical, comprehensive, transparent, and replicable [10], thus providing a reliable knowledge base on a research topic. The articles are then analysed and synthesised based on the specific research questions [11]. There are some articles in the literature that review literature related to this topic. Some address only one area of education, such as programming [12] or introductory programming courses [13]; others are quite old [14,15]; others relate only to some dimensions [16]; and others are not just dedicated to higher education [17]. That is why we feel the need for this article to exist: it is comprehensive, up-to-date, and aimed at higher education.
The paper is structured as follows: Section 2 provides definitions and related works. In Section 3, we show the methodology used to carry out the systematic literature review. Section 4 shows the results obtained during the extraction and analysis of data. Finally, Section 5 describes the conclusions and future work.

2. Background

In this section, we explain some concepts required for understanding the remainder of this document. We start by defining data mining and machine learning (Section 2.1), including supervised (classification and regression) and unsupervised learning problems. We then define LA (Section 2.2) and educational data mining (Section 2.3), while also clarifying the concept of dropout (Section 2.4).

2.1. Data Mining and Machine Learning

Data mining is a discipline that has emerged to analyse data in an automated manner by finding patterns and relationships in raw data [18]. It is the process of (semi-)automatically discovering useful patterns in data [19], which is commonly represented as a dataset: a set of variables in tabular form. It is composed of independent (often called features) and dependent (also called target or objective) variables. Let us consider a generic dataset containing E instances of I independent variables x 1 , , x I and one dependent variable y. Thus, x i e represents the value of the ith independent variable in the eth instance of the dataset, y ^ represents the predictions for the dependent variable, and y e ^ represents the eth value of the predictions. Machine learning (ML) techniques aim to analyse data to find meaningful patterns. ML problems can be divided into unsupervised and supervised learning problems, each of which has specific tasks. Here, we focus on the tasks, algorithms, and evaluation metrics found on the analysed studies.

2.1.1. Supervised Learning Problems

In supervised learning problems, the value of the dependent variable is present in the data and can be considered for building the prediction model and evaluating the models’ performance. For the model evaluation, the dataset is usually split into different sets of data. Then, the model is fitted (or trained) in one set and evaluated (or tested) on the other. This process is called validation and its objective is to avoid overfitting (when the model is too biased to the data it was fitted in).
The validation process can be performed in several ways. In the analysed studies, we found the following validation types:
  • Train/test: the data are split in two sets of data (train and test sets). The model is trained on the train set and then tested on the test set.
  • Train/validation/test: the data are split in three sets of data (train, validation and test sets). The model is trained on the train set and then validated on the validation set. After the validation phase, the model is tested on the test set.
  • Cross validation (CV): the data are split into n samples (folds), and the model training is repeated n times, each considering a different sample as the test set. The remainder of the dataset is the train set. For example, in ten-fold cross validation (10F-CV), the dataset is split into ten folds and the model training is repeated ten times, each considering a different fold as the test set and the other nine as the train set.
  • Leave one out cross validation (LOO-CV): in this case, the dataset is split into as many folds as the number of instances (i) it contains. The model is trained i times, each considering a different instance as the test set and the rest of the data as the train set.
There are several tasks on supervised ML, which consists of creating a model m that tries to fit the function f : y ^ = f ( x 1 , , x I ) that best approximates the true value of the dependent variable y.
  • Classification
In classification, the dependent variable can assume a value from within a finite set of values (classes): { c 1 , , c K } , where K is the number of classes that y can take. There are many algorithms for classification, and the evaluation of the predictive performance of classification methods can be made with several metrics [20,21].
  • Regression
In regression, the dependent variable is generally continuous ( y e R ). However, it can also be ordinal or binary. As for classification, there are many algorithms for regression; the evaluation of the predictive performance of regression methods can be made with several metrics [20,21].
Furthermore, the evaluation of supervised learning models is sometimes performed by comparison with a baseline model. This is a simple model that predicts, for example, the average value of y for regression approaches. In the case of classification models, they can be compared to, for example, the baseline model that predicts the most frequent class present in y.

2.1.2. Unsupervised Learning Problems

In unsupervised learning problems, the dependent variable is absent or not considered. The main objective is to find relationships between the instances of the datasets.
An example of unsupervised learning is clustering, where the objective is to group the instances into clusters. This grouping is often performed by calculating the similarity between the objects, and similar objects are attributed to the same cluster, while objects that are not similar are supposed to belong to different clusters.
Another example of unsupervised learning is the mining of association rules. These rules are simple if/then statements, for example, “If a happens, then b also happens”. The rules help to find hidden relationships between the objects available on the dataset.

2.2. Learning Analytics

Long et al. defined learning analytics (LA) as “the measurement, collection, analysis and reporting of data about learners and their contexts, for purposes of understanding and optimising learning and the environments in which it occurs” [22]. Another definition presented by [23] about LA is analysing and representing “data about learners in order to improve learning”. LA users include students, teachers and academic advisors [24,25]. In general, the field of LA aims to “harness unprecedented amounts of data collected by the extensive use of technology in education” [21]. The main focus of LA is to use the data produced by students when interacting with digital technologies in the teaching–learning process (TLP) to leverage human decisions, such as designing educational interventions [26]. In this context, methods are used to filter information and visualise data, including clustering analysis, network analysis, text mining, and process and sequencing mining [27,28]. LA topics include understanding students’ behaviours in online learning systems [29], predictive modelling of student outcomes [30] and LA methodologies [31]. However, according to Siemens and Maker [26], all the insights obtained by these methods will serve not only the TLP, but also the choice of different methodologies that allow to adapt to new realities (i.e., phenomena such as the pandemic caused by COVID-19) and will also assist decision makers in managing the education process as a whole.

2.3. Educational Data Mining

The large amount of digital content allows the development of solutions that use different techniques that make it easier to search, organise and analyse this content. In recent years, several models have been developed that use data mining models. Based on the constant growth of educational data available in educational institutions, educational data mining (EDM) emerged and aims to predict students’ performance and, consequently, the institution’s performance. Thus, EDM can help improve the quality of the training provided [32]. According to [33], EDM has “a concern of developing, researching, and applying computerised methods to detect patterns in large collections of educational data that would otherwise be hard or impossible to analyse.” Additionally, Yahya and Osman [34] stated that “in an educational context, there are many interesting and difficult problems that may arise from four aspects: administrative problems and problems associated with school, academic staff, and student”. A different approach was taken by Misuraca et al. [35], where the authors proposed an automatic strategy to analyse the sentiment in students’ comments, ultimately aiming at evaluating the subjective opinion of students about instructors and courses.

2.4. Dropout

Dropout has been, over the last few decades, an issue of vital concern to educational institutions (at all levels, but with a particular emphasis on higher education), due to its negative impact on the well-being of students. This situation also has implications and costs in several dimensions: social, economic, and personal [36]. Research on this topic began in the 1970s and 1980s [37,38,39,40]; these approaches are still the basis for developing new solutions [41,42,43,44,45]. However, it is necessary to note that dropout can happen throughout the academic course (from the first to the second year [46], and from the second to the third year [47]). Therefore, the risk factors may be differentiated.
It is interesting to note that, despite the high number of support programs implemented [48], associated with research regarding the success of learning [49,50], it is very worrying to see that, in higher education, dropout remains at around 30% in OECD member countries [51]. For example, in courses in STEM areas, despite the growing demand for these graduates from the job market, statistics show that the dropout is very high [52]. In 2015, there was a 13% growth in the demand for engineers and scientists in Europe, and it is expected to increase by 14% until 2025. However, student enrolment in engineering and architecture decreased by 24.6% (2004–2014), which can be understood as one in four students having dropped out of their courses [53].
Higher education institutions (HEIs) regard this issue with great concern because they have a student community, often coming from various geographies (national and often international), which may, for example, be one of the factors that significantly contribute to dropout. Some reasons can be pointed out for the criticality of this factor since for students, it is often the first time that they live outside of their parents’ home and, from one moment to the next, they have to manage their lives. In this context, Spady’s model [37] considered that social integration in HEIs determines the student’s commitment or decision to dropout. Tinto’s model [38] considered that most dropout decisions are voluntary and are produced by inadequate integration of the student who leaves the institution’s social and intellectual environment. Thus, it is possible to conclude that dropout arises through different factors, classified as academic and non-academic risks [54,55,56,57]. It is possible to highlight several features that affect the student’s academic potential and performance: academic performance and institutional habitus [58], demographic data, social interaction, financial constraints, motivation and personality [59], the choice of the wrong study program, lack of motivation, personal circumstances, and lack of university support services, among others [60,61].
Over the years, some approaches have been presented to respond positively to each risk factor, with solutions such as academic assistance (for example, tutoring, counselling and mentoring [62,63]), social involvement and individual attachment to the institution [64,65,66], purpose and completion of the course (for example, vocational education, job placement, part-time, internships) and financial assistance. In addition to these solutions, interdisciplinary approaches have also been proposed, using psychological variables to model student wear and tear as the interaction between a student and the educational environment [37]. Another interesting study is presented in [38], where the emphasis is placed on the relationship between the attributes of pre-registration and interaction with the environment.

3. Systematic Literature Review

To analyse, evaluate and interpret relevant studies with the aim of answering research questions, a specific phenomenon or a certain area, a systematic literature review is used [67]. This method was initially used in the medical science field because there are many studies in the area [68], and it has proven to be a method for identifying as well as guiding research for an uninvestigated subject [69].
Kitchenham and Charters [68] proposed a series of steps for the application of protocols that we follow in this document, which are adapted to our needs and are presented in the following sections of this document. This systematic literature review aims to obtain important data on scientific production to identify the status of the use of LA to prevent dropout in higher education. In this study, different databases were used for our research to answer the following research questions:
  • PQ1 Where, how, and in what ways has LA been deployed in the studies produced?
  • PQ2 How effective is LA in reducing student dropout?

3.1. Information Sources

We consider different databases to query the search strings. Access to databases is private; the databases are shown in Table 1.

3.2. Search Strategy

The query string was built and complemented by logical operators to obtain the best possible results. We limit the search process to documents published in journals. For each database, it was necessary to build a specific query, as each one has a different syntax. An example of a resulting query is shown below:
((‘Learning Analytics’) OR (‘Academic Analytics’) OR (‘Educational Analytics’) OR (‘Educational Data Science’) OR (‘Educational Data Mining’) OR (‘Learning Process’) OR (‘Education Big Data’)) AND (‘Data Mining’) AND ((‘Dropout’) OR (‘Retention’)) AND ((‘Higher education’) OR (‘University’)).

3.3. Collected Information

The PRISMA diagram, adapted from [70], presented in Figure 1 identifies the studies considered for this work.
As shown in the figure, we first identified an initial set of 182 studies obtained from the four databases referenced in Table 1. From this set, we removed 44 duplicate records, which left us with 138 studies for screening.
In the screening phase, we removed 78 studies after analysing the titles and abstracts, because these were not suited for answering our research questions. We removed 3 articles that could not be retrieved. We also excluded 2 of them for not being written in English, another 2 that consisted in literature reviews themselves, and 3 because the studies did not focus on university students.
At the end of this phase, we obtained 50 studies. These are the ones that are going to be analysed in the remainder of this work.

4. Data Analysis and Results

In this section, we try to answer the research questions referred to in Section 3.

4.1. Where, How, and in What Ways Has LA Been Deployed in the Studies Produced?

The first research question (RQ1), Where, how, and in what ways has LA been deployed in the studies produced?, was approached in two different ways: first, we conducted a bibliometric analysis, which was followed by a bibliographic analysis. The results are described next.

4.1.1. Bibliometric Analysis

The 50 articles were published between the years 2006 and 2020 as can be seen in Figure 2. The last two years considered are those in which there was greater scientific production in the area, with 17 articles in 2019 and 15 articles in 2020, representing 34% and 30%, respectively.
There are 40 different publication sources: 33 with one publication, 5 with two publications and 2 with four publications. The two journals with four publications are IEEE Access and the International Journal of Emerging Technologies in Learning, journals with an H-Index of 86 and 19 and SJR 2019 of 0.78 and 0.33, respectively. IEEE Access’s subject and category are computer science (Computer Science (miscellaneous)), engineering (Engineering (miscellaneous)) and materials science (Materials Science (miscellaneous)). The subject and categories of the International Journal of Emerging Technologies in Learning are also three: “Engineering (Engineering (miscellaneous))”, “Social Sciences (Education)” and “Social Sciences (E-learning)”. Table 2 shows the number of publications (Nr.), H.Index (H), the scientific journal ranking (SJR), as well as the quartiles (Q) by subject and categories of publications with more than one article published.
The average number of authors per article is 3.3. The most frequent number of authors is 3. There are 6 articles with only one author and one article with nine authors. The following graph shows the frequency of the number of authors of the 50 articles. Figure 3 shows the frequency of articles by number of authors.
There are 158 different authors, 150 of which have only one publication. There is an author with four publications (Kotsiantis, Sotiris B.) and seven authors with two publications. Table 3 shows the names and affiliations of these eight authors, as well as the number of corresponding publications (N).
There are 98 different affiliations. The University of South Australia, Adelaide, Australia is the affiliation of six of the authors and six publications. Panepistimion Patron, Patra, Greece is an affiliation of five authors and eleven publications. Table 4 lists the number of publications and authors of affiliations that have at least three publications.
There are 309 different keywords: educational data mining appears 26 times, data mining 23 times and students 11 times. In Figure 4, we present a cloud of words that occur at least twice in the keywords provided by the authors.
There are 34 countries that participated in the 50 articles. A total of 21 countries participated in just one article. The United States was part of seven articles. In Table 5, we list the countries that participated in at least two articles.
We checked the citations that each article has on Scopus—this was not possible in three articles. As for the remaining 48, there are 32 articles that were cited fewer than 10 times. Table A1 in Appendix A shows the names of the authors, the title, year (Y), source title and number of citations (N).
Considering the authors of these most cited articles, we found that there are 42 authors (Table A2 in Appendix A) and that only one wrote two articles (Delen, Dursun from Haliç Üniversitesi, Istanbul, Turkey). There are 28 different affiliations, and six of the authors are affiliated with the University of South Australia, Adelaide, Australia.

4.1.2. Bibliographic Analysis

In the bibliographic analysis, we divided the research question PQ1 (Where, how, and in what ways has LA been deployed in the studies produced?) into three parts: (1) where, (2) how, and (3) in what ways. The results obtained for each part are described next.
  • Where Has LA Been Deployed in the Studies Produced?
We start by analysing the university, course, disciplines, school year and number of students considered for the study, together with whether the class methodology included online teaching. Fifteen of the analysed studies were performed with online classes. These are the ones referred to in the following studies addressed in [71,72,73,74,75,76,77,78,79,80,81,82,83,84]. Additionally, the studies referred to in [85,86] include both traditional and online classes. We refer to the ones that explicitly state being conducted with, or including, online classes and assume that the remaining ones were performed in traditional classes.
The articles collected referred studies conducted in different countries and continents: Asia (sixteen studies with data retrieved from universities in ten different countries), Europe (thirteen studies with data from universities in six different countries), North America (ten studies with data obtained from universities in two different countries), South America (seven studies concerning data of universities from four different countries), Africa (the study in [77] considers 496 records of data obtained from an online course of Management Informatics on the Abdelmalek Essaadi University, in Morocco), and Australia (the study published in [78] was performed using data about online learning activities of an Australian university). Furthermore, the study described in [87] does not state the university where it is performed, only revealing that it focuses on 16,000 grade records obtained from students. Finally, the study referred to in [88] includes engineering courses of six different universities in five different countries of the European Union. These three studies are not considered as being conducted in any specific country.
The Asian countries where most of the analysed studies have occurred are India and Thailand (three studies in each), and Indonesia and China (two studies in each). We have also analysed one study conducted in each of the following countries: Japan, Malaysia, Palestine, Pakistan, Philippines, and Turkey (for this study, Turkey is considered to belong to the Asian continent).
Three of the analysed studies were performed in Indian Universities. The study described in [89] was performed considering the data of 240 undergraduate students from an unidentified university. The study referred to in [81] uses postgraduate student data of the open and distance learning directorate of the University of North Bengal from 2006 until 2008. The work described in [90] was conducted with data regarding 163 students enrolled in a Zoology course of the Dr Ambedkar Government College.
We found three works conducted in Thai universities. The study referred to in [91] was conducted using the data of 811 students enrolled in the Mae Fah Luang University between 2009 and 2012, and the other two studies were performed in a business computer program of the University of Phayao. The first one is the work described in [92], which used data of 2017 students enrolled between 2001 and 2019. Then, the study referred to in [93] used data of 389 students enrolled in the university between 2012 and 2019. These two studies are complementary to one another and do not overlap since their objectives are different, as will be stated later in this work.
Two of the analysed studies were conducted in Indonesian Universities. The work referred to in [94] considered data on 17,432 students enrolled between 2016 and 2018 in the Faculty of Social and Political Science of a private university in Jacarta. The study described in [95] refers to data on 425 students enrolled in information systems and in informatics engineering courses in an East Java university between the years 2009 and 2015.
We found two works ( [83] and [72]) conducted with data retrieved from XuetangX, a Chinese Massive Online Open Course (MOOC) platform, which consists of 39 courses, 79,186 students, and 120,542 student enrolments in 39 courses in 2015. This is a publicly available EDM dataset that was used on the 2015 KDD CUP (data available at http://moocdata.cn/challenges/kdd-cup-2015, accessed 13 October 2021).
The remaining six works analysed that took place on Asian universities are referred to next. The work described in [85] used data on 1167 students enrolled in six consecutive semesters (from 2012–2013 to 2017–2018) in a digital signal processing discipline of a sophomore-level course with online and traditional classes taking place in the Engineering Faculty of Kumamoto University, Japan. Data regarding students enrolled between 2015 and 2016 in the courses of chemical engineering, electrical and electronic engineering, and mechanical engineering of the School of Engineering of Taylor’s University in Malaysia were used for the work described in [96]. The study referred to in [97] used data about students enrolled between 2010 and 2015 in five courses (architectural engineering, industrial automation, computer programming and database, office automation, and fashion design and dress making) of the Technical University of Palestine. The work described in [98] was conducted using data of 128 students enrolled in the Spring term of 2016 in the first-year electrical engineering and computer science courses of the School of Electrical Engineering and Computer Science (SEECS) of the National University of Sciences and Technology (NSUT), Islamabad and Abasyn University, Pakistan. The study conducted in [99] regards 3765 civil, electrical, electronics and communication, and mechanical engineering students that, between 2008 and 2015, were enrolled in maths and physics disciplines in the Technological University of the Philippines. In [100], the study described concerns data on 127 students of the Department of Computer Education and Instructional Technology in Fırat University, Turkey.
The European country where most of the analysed studies occurred is Greece (four studies, all with data regarding the same university—Hellenic Open University) followed by Italy (three studies), Germany and Spain (two studies each), and Bulgaria and Scotland (one study each).
Four studies used data from Greek Hellenic Open University online classes. The study described in [73] focused on data obtained from 453 students enrolled, in 2017–2018, in six sections of same module of the master’s in information systems. The remaining studies used data obtained from computer science students. The work in [76] used the data of 492 students enrolled in the discipline of principles of software technology and the other two studies used data regarding students enrolled in the introduction to informatics discipline: the study in [79] used data of 3882 students enrolled between 2008 and 2010, and the study described in [71] used data of 1073 students enrolled in 2013–2014.
We found tree studies conducted with data from Italian universities. The study referred to in [101] used data of 6000 students enrolled since 2009 in the department of education of Roma Tre university. In [102], the authors used data regarding 561 undergraduate students enrolled in a first level three-year program of five degree-courses of an unidentified university. For the study published in [103] the data were retrieved from 11,000 students enrolled in all the bachelor’s degree programs in University of Bari Aldo Moro in the school year of 2015–2016.
Two studies considered data from German universities. The first one [104] occurred in the Karlsruhe Institute of Technology regarding data retrieved from 3176 students between the years 2007 and 2012. The second study [105] considered data retrieved from 17,910 first year students enrolled in the winter term of 2010/2011 in bachelor’s, state examination, master’s or specific art and design degrees.
Two studies were performed with data obtained from Spanish universities. The work described in [75] focused on data obtained from over 11,000 students enrolled in several online courses in the National Distance Education University. The study referred in [106] considered data obtained from 323 students enrolled, from 2010 to 2018, in the computer sciences and information course of a public unidentified university.
We analysed two other studies performed with data from European universities. The study described in [107] uses data on 252 students enrolled in a web programming course of an unidentified Bulgarian university. Finally, in [108], the study describes the use of data on 141 students enrolled in the University of the West of Scotland in the first semester of 2016.
The North American country in which most of the analysed studies occurred is the United States of America (nine studies). The study described in [109] entailed data on 25,224 students enrolled as freshmen between 1999 and 2006 in a public university. Then, in [110], the authors used records on 272 students enrolled, between 2001 and 2007, in a maths major of a Mid-Eastern university. After that, the study in [111] analysed data concerning students enrolled in aerospace engineering, biomedical engineering, chemical engineering, chemistry, civil engineering, computer science, electrical engineering, material science, mathematics, mechanical engineering, physics, and statistics courses in the University of Minnesota in the periods of Fall 2002 to Fall 2013 (10,245 students) and Fall 2002 to Spring 2015 (12,938 students). The study in [112] considered 140 students enrolled in 2014 in a computer science course at Washington State University. There was also a study ([113]) conducted with data collected from the Fall 2017 and Spring 2018 periods of the Virginia Commonwealth University (VCU) College of Engineering. There were two studies that used data from MOOC available from American universities: [74] used data concerning a total of 1,117,411 students of three datasets obtained from the Massachusetts Institute of Technology (MIT), Harvard; and in [84], the data considered regard 29,604 students enrolled in eleven public online classes from Stanford University. Finally, the study in [114] was performed with data obtained from six unidentified universities, and the study described in [115] used data obtained on 16,066 students enrolled on a public American university.
We have also analysed one study described in [116], which analysed data retrieved from 200 students enrolled in several public universities in Mexico, but also 300 students enrolled in public universities in the same country.
The South American country in which most of the analysed studies occurred is Brazil (4 studies). We have also analysed one study each, conducted in Chile, Ecuador, and Peru (one study in each country).
Four studies occurred in Brazilian universities. The study referred in [117] considered a total of 706 students enrolled in computer science and production engineering courses from 2004 to 2014 in Fluminense Federal University. In [80], the study focused on two online classes on the discipline of family health that occurred in the Federal University of Maranhão: the class of 2010 (with 349 students), and the class of 2011 (with 753 students). The study described in [86] regards two different classes of an introductory programming discipline occurring in several courses of the Federal University of Alagoas: an online class of 262 students enrolled in 2013, and a traditional class of 161 students enrolled in 2014. Finally, the study referred to in [118] used data on 49 students enrolled in the discipline of differential and integral calculus I of the mathematics major of Universidade Estadual do Oeste do Paraná.
In the study described in [2], the data consist of records on 3362 students enrolled between 2012 and 2016 in three bachelor courses of a Chilean university. Furthermore, in [82], the authors used data regarding 2030 students enrolled from March 2014 to September 2018 in an online course of an unidentified university in Ecuador. Finally, the study described in [119] used the data of 970 students enrolled in the Institute of Computing of the Professional School of Systems Engineering of the National University of San Agustín (UNSA), Peru.
  • How Has LA Been Deployed in the Studies Produced?
For this part of the study, we focused on the main objectives of the analysed articles. Most of the studies aim at providing some prediction, such as, for example, [73], where the authors wish to predict a set of 8 variables. Some studies aim at predicting student performance [79,91] or grades [71,90,111] in order to improve it [100].
However, the majority of the analysed studies aim at predicting student attrition (the reduction in numbers of students attending courses as time goes by, including dropout and desertion) in order to better understand [88] the reasons and find the most important factors [93,110,116] and causes [74,76,81,82,89,95,102,109,115,117,118] of those results, with the objective of preventing [75] or reducing [76,98,99] those outcomes. In this context, some works analyse student attrition [76,109,115], but we can also include in this group its underlying causes: student dropout [72,75,76,80,81,83,88,89,93,95,97,98,99,101,102,103,104,105,110,116,118] and desertion [82,119] as well as students’ risk of failure [78,85,86,107,113,119] or retention [74,117] (retention here means that students fail the discipline and need to be retained—e.g., in the following year—in order to complete it).
Furthermore, there are studies that evaluate and compare prediction models [73,77,92,94,100,108] in order to find the best suited ones for the problem at hand. There are also some approaches that aim at early prediction [88] for the anticipation of dropout [75] and risk of failure [86,107].
Other studies aim at developing some tool or framework to help students or tutors in the process of reducing dropout or increasing performance. For example, in [2], the authors developed a modelling framework to maximise the effectiveness of retention efforts. In [88], a tool was developed with the objective of supporting tutors on the process. Another example is the work described in [98], where EDM is used to warn students of poor performance. In [106], students are provided with recommended subjects based on historic data. In [112], a tool identifies the urgency in student posts so that a tutor can prioritise the answers.
We also found that some of the analysed studies had very specific objectives. These include implementing retention strategies [75] (retention here means to convince students to not desert or drop out); identifying student satisfaction [114]; recommending strategies to reduce attrition by reducing dropout [76]; analysing students’ learning behaviour through the creation of a feature matrix for keeping information related to the local correlation of learning behaviour [72]; analysing activity, polarity, and emotions of students and tutors to perform sentiment analysis to help in dropout prediction [73]; monitoring the learning process and performing student profiling to support pedagogical actions to reduce dropout [80]; predicting remedial actions [87]; using data to improve courses [96] and learning experiences [96]; and exploring relationships between programming behaviour, student participation, and the outcomes obtained [112].
  • In What Ways Has LA Been Deployed in the Studies Produced?
As referred, EDM uses data mining techniques on educational data. In this section, we focus on this and analyse the dataset: target variable and features; the ML task considered and the ML algorithm used to solve it; the validation and evaluation processes performed, including the ML metrics and the baselines considered (if used); and also the ML results obtained.
The target variable is the information that we want to be able to predict with DM. Most of the analysed studies try to predict student status [110,116] to try to prevent attrition [109], including desertion [82] but, most of all, dropout [2,72,74,76,79,80,81,83,88,89,91,92,93,94,95,97,98,99,101,102,103,104,105,106,115,117,118] as well as the students’ risk of failure [75,78,85,86,108,113,119]. In some cases, the authors approached this by trying to predict the students’ performance or grades [71,73,77,88,90,100,108,111,112]. However, there are also approaches where the target variable is the students’ satisfaction [114], ranking [107], or graduation rates [96]. Some also tried to predict remedial actions to take if the student is at risk of failure [87], or even the urgency in replying to students’ posts on the learning management system (LMS) forum [84]. To perform the predictions, the authors took advantage of a set of information (features) that will be described next.
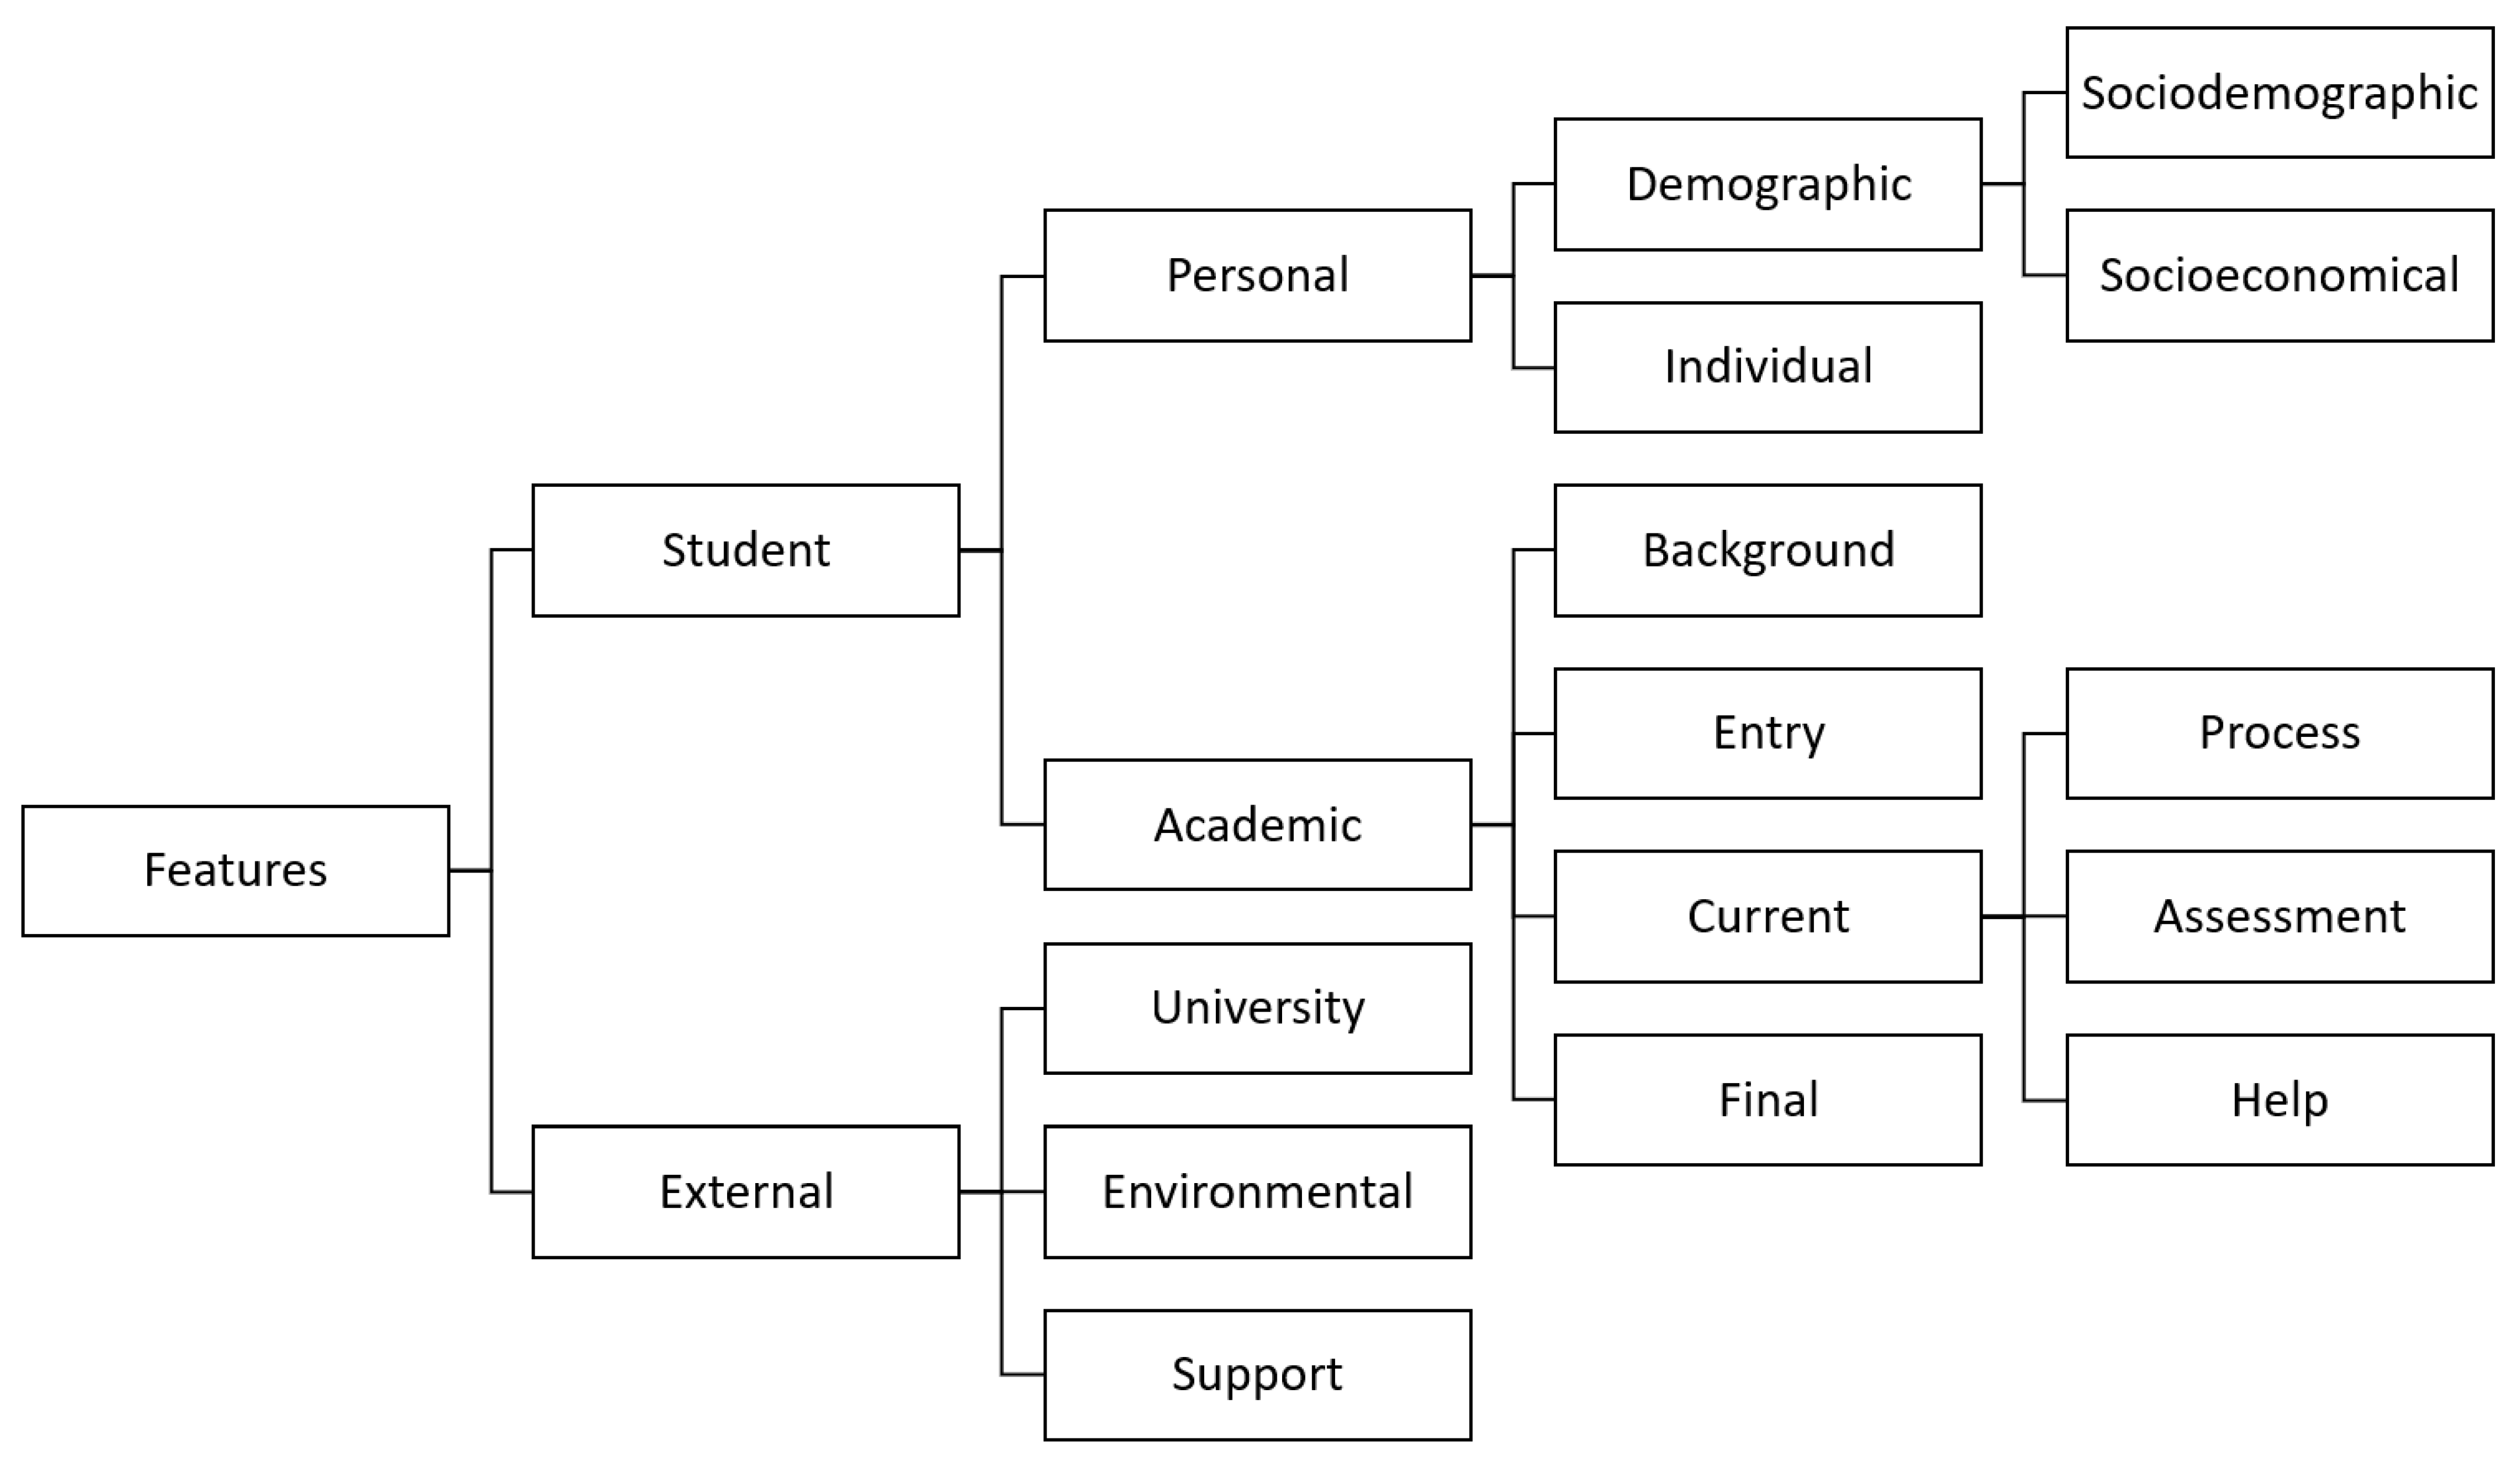
Apart from the study referred in [114], where the authors used web scraping methods to extract information from reviews for the university and its competitors, the features considered in the analysed studies can be grouped into categories and subcategories that can be represented by the hierarchy depicted in Figure 5.
As presented in the figure, the features used in the analysed works can be split into two main categories: student data, and external data. Student data is the most-used category of data and can be split into data concerning personal and academic information.
Regarding personal information, the analysed studies take into account demographic data [71,84,105,119], such as the students’ age [78,79,80,81,82,86,88,94,95,103,104,108,109,115], but also sociodemographic data [2], such as gender [78,79,80,81,82,86,88,94,95,98,103,104,108,109,110,114,115], country of birth [88,104], race or ethnicity [108,109,110,115], regional origin or residence postal code [80,86,89,95,108,109,115], marital status [79,80,81,86,109,115], number of children [79], parents’ cohabitation status [91], and social status [81]. Socioeconomic variables are also included, and these encompass the family background [2,113,116]; socioeconomic environment [75,97,102,113,118]; information regarding the students’ parents (income [89,94,108], educational level [89,91,94], profession [89], work hours and pressure [89,108], and if they can meet university expenses [89]); students’ economic status [78]; employment status (including type of employment and profession) [79,80,81,91,108]; income [81,85]; and whether the student receives financial aid, has a student loan, or a grant [109,115].
The studies also account for personal [102] data, such as personal information [75,93,113], satisfaction [89,97,108] and adaptation [108], computer knowledge and usage at work [79], average hours spent studying [89,98,108,109,115], technology impact [108], learning style [108], health status [98,108], prior course knowledge [108], psychological factors [108], cognitive features [91], and level of concentration [109,115]. The study presented in [98] takes some different features into account: time management, self concept and appraisal, free time, independence, and whether the student often goes out. The study presented in [89] considers yet another set of different features, as the existence of family problems, homesickness, change of goal, adjustment problems, and whether the student is enrolled in other universities.
The students’ academic data [81] encompass career [119] and administrative [75,101], including the students’ background data (data from previous academic experiences), entry-level data (the data that are recorded at the moment when the student enrols in the university), current status (data concerning the courses and subjects that the student is enrolled in at the moment), and also final status. This last category includes information on dropout [2,92], and final graduation result [88,104,110] together with the date of this result [80,104,106].
The background student data include, for example, data regarding the student’s path in high school or in previous university enrolments. These include the results obtained by the student [82,89,91,95,103,107,108,116], specifically in assessments, such as the Standardised Admission Test (SAT) [2,88,109,110,113,115], or the Test of English as a Foreign Language (TOEFL) [109,113].
Another set of important information regards the data recorded at the entry of the university. This includes the entry type [2,75,78,89,91,108,109,110,115], the preferences stated about the area [94,103], type of degree [103], the study [98] and more specifically the bachelor [2] or major [109,110,115] program, the enrolment date or year [86,92,95,104,113], data regarding the enrolment and coexistence [75,116], the entry grade [113], data recorded on transfer transcripts [113], data regarding the first term [109,110,115] or semester [97], number of University Educational Credits (UECs) in the first year [103,106] or in total [94], the attendance type (full or partial time) [78], and whether the student is a new student at the university [79].
The information that was accounted for in the current academic data can be, in its turn, divided into process, assessment, and help. The process data concern data obtained during the student’s frequency of the study program; the assessment regards data obtained during evaluations; and the help data concern the help that was provided to the student and whether it was accepted or not. This last one includes participation in tutorials offered [2], and in tutoring and advice programs [116].
The process data concern the data obtained during the process of frequenting the program and includes students’ achievements and performance [2,71,75,82,87,91,116], interaction with the university’s LMS [71,72,73,74,75,76,77,83,84,85,86,93,107,108,113], lecture attendance [90,91,93,94,113] and participation [113], degree [82,85,87,88,89,92,105,106,109,115,118] and subjects [81,82,85,88,92,106,118] the student is enrolled in, study progression data [104], discipline precedence [117], lecture programme [95], final grades obtained in maths and physics [99], syllabus of the course [89] and, more specifically, the students’ programming log [112].
The assessment data include examination data [104], assessment or test grades [73,76,77,86,88,90,91,94,106,107,111,112,113], the score in each subject [88,92], students’ performance [97], and homework grade [94]. They also include data regarding course grades [113] that, in some cases, can be measured by the grade point average (GPA) [92,94,100,109,110,113,115], or the graduate record examinations (GRE) [113].
Finally, the external data can be split into three subcategories: data regarding the university, environmental data, and data concerning the support offered. University data include information about its infrastructure [89,116], services [116], institutional factors [108], campus location [89,108], the students’ proximity to college [98], data regarding the college campus [85,109,115], and also the existence of extension activities [90]. Environmental data include the cultural and educational environments [102], but also information regarding the campus environment and whether extracurricular activities and entertainment are provided by the university [89]. The support data regard the support given to the student by the community [98], the family [108], and the university [98,108], which also includes the teacher/student relationship [89].
The information regarding the features used in each of the analysed studies is presented in Table A3 in Appendix A. Table A4 presents this information grouped into three main categories: student personal data, student academic data, and external data.
As presented in the table, most of the studies use student personal and academic data, with the following exceptions:
As for the ML task, in the analysed studies, we found works that used both unsupervised and supervised learning techniques. The unsupervised learning techniques found were clustering and mining of association rules. As for the supervised learning approaches, there were some studies that worked with regression, but the majority used classification.
The study described in [88] used the clustering algorithm k-means together with principal component analysis (PCA). The authors divided the dataset into train and test sets for validation, and measured the model’s accuracy for evaluation. However, this study also used classification techniques, which will be referred to later in this work. Another study that used clustering is [102], where the authors used Bayesian profile regression.
There are also cases where the approach consists of mining association rules. This is the approach in [76,78,97,113], where an implementation of the repeated incremental pruning to produce error reduction (RIPPER) algorithm in Java (JRip) was used to solve the problem.
In [73], the authors used both regression and classification. For regression, the authors used additive regression. The classification techniques will be referred to later in this work. The validation occurs with 10F-CV by measuring the models’ mean absolute error (MAE). In [100], the authors used neural networks (NNs), support vector machines (SVMs) and extreme learning machine (ELM) algorithms in a 5F-CV setup to measure the root mean squared (RMS) error, R 2 , and the coefficient of variation (COV). The study described in [77] considered a regression task and used the following algorithms: multilayer perceptron (MLP), Bayes net and deep NNs. The model validation occurs by considering different samples of the dataset for training, validation and testing. The metrics computed were accuracy, Cohen’s kappa, MAE, relative mean squared error (RMSE), root average error (RAE), and root relative squared error (RRSE). The work described in [79,84,112] considered regression with the linear regression (LiR) algorithm. The study described in [71] used semi-supervised regression with the COREG framework, together with K-nearest neighbours (KNN), LiR, gradient boosting, and MLP. This study uses cross validation (specifically 5F-CV) to evaluate the models used, through the calculation of the following metrics: MSE and MAE.
In [114], the approach considered is sentiment analysis. In this case, the algorithm used is valence aware dictionary for sentiment reasoning (VADER). The study in [107] used the analytic hierarchy process (AHP) together with the best–worst method (BWM).
As for the approaches that used classification, the analysed ones used different algorithms, validation techniques, and evaluation metrics. We describe this in detail in the following paragraphs.
The algorithm used in more studies is decision trees (DTs), which is used in 26 of the analysed studies [74,75,76,78,81,82,86,89,90,91,92,93,94,95,97,98,99,103,104,108,109,113,115,116,118,119]. Two algorithms are used in nine studies each: Naive Bayes (NB) [74,76,78,86,91,92,94,95,98], and artificial neural networks (ANNs) [85,86,91,92,98,108,109,115,119]. Logistic regression (LR) was used in seven of the analysed studies [80,83,98,103,104,109,115]. Two algorithms were used in six studies: random forests (RF) [2,74,76,83,95,105], and SVM [73,83,86,88,108,115]. The KNN algorithm was used in five studies [73,74,76,91,94]. The algorithm sequential minimal optimisation (SMO) was used in three studies [76,78,79] and, also in three studies, the authors used the ensemble of classifiers gradient boosting [84,94,95]. There are two algorithms that were used twice in the different studies analysed: convolutional neural networks (CNNs) [72,101], and MLP [76,88]. The following algorithms were used only once in the analysed studies: boosted decision trees [2], Bayes net [76], radial basis function (RBF) [79], the ensembles AdaBoost and LogiBoost [79], PAIRS3 [87], multi-view multi-instance (MVMI) and multi-view Gaussian process (MVGP) [113], and ensemble of linear discriminant analysis (E-LDA) [114].
The most used validation is cross validation [82,92,109]. Specifically, in two studies, the validation is made through 5F-CV [93,118], 10F-CV [2,72,73,76,78,83,89,91,93,94,95,97,99,103,104,105,108,115] was used 18 times, 15-FCV [93] and LOO-CV [93] were used once each. Besides that, there are seven studies in which the data were split into train and test sets [74,81,84,85,87,88,111,119], and also two where the split was made into train, validation and test sets [77,101].
Concerning the metrics used to evaluate classification models, the most used metrics are those that used the confusion matrix: in 23 studies, the authors measured accuracy [42,72,74,76,85,87,88,92,93,94,95,97,98,99,101,103,104,106,107,108,109,115,119], 17 studies considered precision [42,72,78,82,83,84,85,86,89,92,94,95,97,101,104,108,119], 14 used recall [42,72,78,82,83,84,86,89,92,94,95,97,101,108], 12 used some F measure [42,72,78,82,83,84,85,89,97,101,106,108], 7 used sensitivity (true positive rate) [82,85,89,103,104,113,119], 4 used specificity (true negative rate) [89,103,104,113], 2 used the false positive rate [82,89], and 1 used the false negative rate [89]. Besides that, there are 10 studies that considered the receiving operation characteristic (ROC), by using the ROC itself [75,89,104], or the area under the curve (AUC) [76,78,82,99,103,105,113]. Other metrics that were also used are Quini values [2], observed uplift [2], Cohen’s kappa [78,104,113], Matthews correlation coefficient (MCC) [82], and precision recall curve (PRC) area [82].
Only three works reported using baselines in the model evaluation. The study presented in [2] used a random model as the baseline. The study presented in [72] used several baseline models: classification and regression trees (CART), NB, LDA, LR, SVM, RF, and gradient boosting decision trees (GBDT). Finally, the work described in [101] used Bayesian networks as the baseline.
In summary, most of the analysed studies tried to predict student status to try to prevent attrition, desertion and, more importantly, dropout or risk of failure. Regarding the data used for such predictions, student data (personal and academic information) is the most-used category of data. In what concerns the ML task used for the prediction, most of the analysed studies used classification techniques, with several different classification algorithms. The most-used validation technique is cross validation, and the most frequent evaluation metrics are those based on the confusion matrix.

4.2. How Effective Is LA in Reducing Student Dropout?

In general terms, the models and works described in the analysed documents are able to perform early prediction of the intended information (for example, students’ performance or grades), allowing the teacher and/or the institution to take actions to avoid undesired effects (attrition, dropout, desertion, risk of failure or retention). Next, we present a summary of the work described in each of the analysed studies.
In the work in [71], the objective of the study was to implement an algorithm to predict grades. The results indicate that the early prognosis of students at risk of failure can be accurately achieved, compared to supervised models, even for a small amount of initially collected data from the first two semesters. This yields an early alert tool with interpretable models. The future work of the study includes generating synthetic data, applying preprocessing stages that may help discriminate better the initially gathered data, combining semi-supervised clustering with other learners and active learning with semi-supervised learning, the use of transfer learning, and the modification of transductive approaches.
In [72], the objective was to perform an in-depth analysis of the learning behaviour patterns of MOOC learners; for this, the authors proposed a feature matrix for keeping information related to the local correlation of learning behaviours and a CNN model for predicting the dropout. The results showed that the proposed CNN model can be used for temporal dropout prediction and early dropout prediction once a sufficiently large amount of data are obtained. In the future, the authors wish to construct more reasonable network structures to predict dropout and further explore the correlations between parallel MOOCs selected by learners.
In [73], the authors used sentiment analysis on the activity, polarity and emotions of tutors and students, aiming at the implementation of DM methodologies to provide timely, personalised and accurate predictions of students’ grades. Several results were obtained in this study, including that polarity and emotions as independent variables provide better performance in comparative models and that tutors’ variables are highlighted as an important factor for more accurate prediction of student grades. The model allows timely prediction of student grades in different periods during the academic year, promoting “tutors’ self-evaluation and focused interventions, learning content evolution but mainly, students’ retention in the learning process“. Future work includes evaluating the results of the polarity and emotion analysis system, adding the human factor and methods of machine learning and the use of transfer learning methodologies.
The study in [74] explored deciphering the attributes of student retention in e-learning. The total number of events during a MOOC course, days active, played video and the number of chapters explored were exhibited as influential attributes to predict early dropout from a course.
The aim of the work in [75] was to prevent students from abandoning the university by means of retention actions focused on the most at-risk students, trying to maximise the effectiveness of institutional efforts in this direction. They developed SPA (dropout prediction system in Spanish), an early warning system that uses these models to generate static early dropout-risk predictions and dynamic periodically updated ones.
The aim of the study in [76] was to understand the key determinants of dropout, to accurately identify students likely to drop out, and recommend interventions to reduce student attrition.
In [77], the main objective was to evaluate the predictive performance of a parametric forecasting methods in comparative perspective models to predict the learners’ performance. They stated that deep parametric methods perform better than a non-parametric prediction.
The study described in [78] aims to construct prediction models in different sub-populations, considering student gender, age, and attendance type. They found that the rule-based and tree-based methods generated models with higher interpretability, making them more useful for designing effective student support.
To predict student performance in a web-based distance course, a set of classification and regression algorithms were used [79]. The proposed method has an accuracy that varies from the initial stage, based on demographic characteristics of students in 70.07%, and before the final exam in 87%. An accuracy of 82.25% was found to identify students at risk of failing before the middle of the school year.
To support pedagogical actions that reduce dropout rates in the context of distance education [80], the hypothesis that the teaching–learning process, as well as prior knowledge of student profiles, for systematic monitoring is assessed. The results suggest that the use of MonSys caused a significant reduction in dropout. The results showed a greater association between the variables that denote the presence of a monitoring system and female gender.
A study was carried out to verify whether there are categories of students who are more likely to drop out of a course prematurely [81]. The results suggest that students who are married, employed or over 25 are more likely to drop out of the course; mathematics is the subject in which students are most vulnerable.
The focus of the study described in [82] is the desertion of students at a university, and the detection of the causes of university desertion. Knowing that a student who fulfils all the tasks and devotes an appropriate amount of time to self-directed work will pass the course without any problem, it is important to know the causes that lead other students to fail a course, with the aim of recommending a group of activities that can be adjusted to the needs of each student. In the future, they intend to improve the technology to improve the response times in each process, moving to real time. They propose to integrate a system of activity recommendations in BI, to create an autonomous system capable of making decisions, namely, the data processing and analysis phase through data extraction. The results obtained are sent to an expert system, which evaluates the factors that influence defection, academic effectiveness or any other type of eventuality that may be the object of study, transforming learning into an active and personalised activity.
In [83], the aim is to create an integrated framework with feature selection (FSPred) to predict dropout in MOOCs, which includes feature generation, feature selection, and dropout prediction, using the obtained feature subset and the trained LR to predict the new data.
In [84], the work aimed to help teachers prioritise their responses and better manage multiple posts in a MOOC discussion forum, to help reduce dropout rates and improve completion rates. This study fused semantic information and structural information, using Char-CNN to obtain the character-level representation of the sentence, fused it with word-level and used the attention mechanism to learn their weight. Their approach achieved the best results on the Stanford MOOCPosts dataset.
The study in [85] aimed to identify students at risk of failing in a blended learning course. They found that 25% of the failing students could be correctly predicted immediately after the first quiz section, and the prediction accuracy gradually increased week by week, reaching 53% after the 8th quiz and 65% after the mid-term examination.
As for [86], the study aimed to early predict students likely to fail in introductory programming courses, using EDM techniques that they considered to be sufficiently effective to early identify students’ academic failure and useful to provide educators or teachers with relevant information to help decisions. In the future, they want to improve the study by considering other data sources from different universities as well as the use of other techniques of data preprocessing and algorithms fine-tuning.
The aim of the study presented in [87] is to address shortcomings in student attainment rates of course learning outcomes by predicting effective remedial actions through learning from assessment rubrics instances. In the future, they want to use a larger training dataset to produce an even better and more consistent performance rate.
With the objective of better understanding the causes of dropout, the authors in [88] proposed a web-based software tool for tutoring support of engineering students without any need of a data scientist background for usage, which supports the early profiling of students. The authors stated that “the tool offers remarkable insight about the features related to student performance, which can become potentially useful for an initial stage of student profiling”. Several possible future steps were indicated, including the extension of the tool to other knowledge domains (humanities and sciences), and adding further information about classroom attendance and results at the course level obtained from the LMS.
In [89], the authors aimed to identify relevant attributes from sociodemographic, academic and institutional data, and develop an improved decision tree algorithm based on ID3, which can be able to predict whether the students continue or drop their studies.
In [90], the aim was to classify students in order to predict their final grade.
The work in [91] aimed to disclose interesting patterns, which could contribute to predicting student performance and dropout, based on their pre-university characteristics, admission details, and initial academic performance at university. Their empirical findings conducted were better than several other dimensionality reduction techniques.
The aim of the study in [92] was to construct a reasonable students’ dropout prediction model for business computer disciplines, evaluate the model performance, and select the best predictions of the dropout model of students who did not gain academic achievement. They used the CRISP-DM data mining principle.
The aim of the work in [93] was to identify courses and structures that affect student dropout, noting that the first year had the highest number of dropouts.
The main objective of the study in [94] was to find the best modelling solution in identifying dropout student indicators, especially in the first two years of the study period. They found that prediction influence of student dropout rates includes the percentage of student attendance, assignment scores, total credits, scores, parental income, parent’s education, and the gender and age of the students.
The general objective of [95] was to find the factors that most influence student dropout and predict early dropout using various techniques, with random forest and gradient boosting showing better performance.
This work described in [96] aimed to improve engineering programmes, as well as ensure that the programmes evolve in parallel to the developments within the industry and, more importantly, with the needs of the learners. The utilisation of learning outcome attainment data and the tools used to mine them affected the programme and the overall student learning experience. This study detailed out how specific continual quality improvement (CQI) action plans have affected learning outcome attainment as well as their impact on pass, retention, and graduation rates. They used learning outcome data for processes to improve student learning, measured as graduation rates and pass rates.
Al-Jallad and colleagues [97] used student satisfaction as well as socioeconomic factors to reduce the high dimensionality of the data. In this way, they tried to predict different types of student record aspects, using interpretable data mining classifiers. The results suggest the importance of predictors of student satisfaction and socioeconomic status, and that the best results were achieved with the J4.8 algorithm, which trades off accuracy versus interpretability.
Sultana, Khan and Abbas [98] proposed using EDM tools to inform students about their performance (low, to be improved and reducing dropout). The authors found some non-cognitive features to help improve the accuracy of outcome prediction.
The focus of the study in [99] was to reduce the large number of students who dropped out on probation or who were dismissed, and to propose a model (CHAID) as the best early warning system to detect students who are academically at risk based on the predictors from maths and physics.
The aim of the study presented in [100] was to conduct a literature review concerning the EDM to better understand the importance of EDM applications in higher education, especially regarding the improvement of student performance.
The objective of the study described in [101] was to predict, as early as possible, which student will drop out to allow targeted actions to prevent it. The results indicate that the constructed models can be used to predict dropout. The authors outlined future work steps, such as incorporating further data (not included, due to privacy issues) and the extension to other faculties.
The aim of the study described in [102] was to evaluate the usefulness of the Bayesian profile regression for the identification of students more likely to drop out and to discover patterns of covariates that contribute to student dropout (students’ performance, motivation, and resilience).
The paper in [103] focused specifically on the problem of dropouts in Italy: the analysis dealt with dropout rates in Italy between the first and second year to identify the main trends and dynamics at the national level. A specific analysis was carried out on the students of one university. They found that the risk of dropping out was greater for inactive (less than 12 UECs achieved) male students, graduated from professional or technical institutes.
The study in [104] proposed a methodical approach to identify dropout, considering two methods and data collected at universities and directly related to individual study achievement. The results stated that the machine is able to identify future dropouts with high accuracy.
The study in [105] aimed to predict university dropout. The results indicated that the final grade at secondary school and features related to student satisfaction and their subjective academic self-concept and self-assessment are important. The authors stated that this study provides information to universities wishing to implement early warning systems for students at risk of dropping out.
Fernández-García and colleagues [106] built a student decision support system to decrease dropout rates and increase stay in degrees, in the form of a recommendation system to suggest subjects to students. Templates allow students to select the subjects that best suit them. This decision support system, which uses a dataset with few instances and unbalanced attendance, intends to be implemented in the university enrolment system to provide an effective follow-up of the students’ academic trajectory.
As for [107], the aim of this study was early students’ failure detection, using the obtained students’ ranking to help instructors during the semester to detect students who will drop out the course and to plan additional learning activities for these students. In the future, they plan on analysing students’ data from different universities’ courses and majors and mining several academic years to create a reliable assessment index for early prediction of student failure.
Adejo and Connolly [108] proposed a study to compare the performance and efficiency of ensemble techniques with base classifiers with a single data source. The results suggested the efficiency and accuracy of student performance and their risk of attrition, based on the approach of using multiple data sources used with heterogeneous set techniques.
The aim of the work described in [109] was to understand the causes behind the attrition, the basis for accurately predicting at-risk students, and appropriately intervening to retain them.
In the work described in [110], a quantitative analytics was used to identify the impact of specific courses on students’ risk of dropping out of a maths major. They found a general inverse correlation between academic performance and attrition: good performance predicts lower attrition rates; and the further a student goes within the maths major, the greater the risk of dropping out.
The aim of the study in [111] was to predict student performance at the course-level in terms of final grades in classes students have not yet taken, helping in semester-to-semester course selection, the recommendation of “bridge” courses, and early warning systems. Experimental results showed that reasonably good prediction is possible with simple approaches, but very accurate prediction may, to some extent, be possible with more advanced approaches.
The study explained in [112] focused on exploring the relationships between students’ programming behaviours and course outcomes, and students’ participation within an online social learning environment and course outcomes. They developed statistical measures derived from data that significantly correlate with students’ course grades. They performed a replication study of two existing predictive models, the error quotient and the WatWin score, because the measures’ predictive capabilities vary widely based on setting. Knowing the characteristics of the study, particular configuration of programming language (C++), development environment (Visual Studio) and course (CS2), reported that the measures performed much worse than previously reported in the literature. Related to the modelling of student behaviours and the programming state model (PSM), which describes students’ problem-solving behaviour by placing a student in 1 of 11 possible programming states, this study derived a predictive measure that outperformed both the error quotient and WatWin score on their dataset. As future work, they would like to run a replication study under similar circumstances to see if a ceiling is again observed; they also would like to investigate alternate states and factors that might influence the PSM’s predictive powers, not only programming behaviours.
The study in [113] presented a multiview early warning system built with comprehensible genetic programming classification rules adapted to specifically target under-represented and under-performing student populations.
The objective of the paper [114] was to enhance student satisfaction by identifying the current strengths, weaknesses, opportunities, and threats of a university through knowledge mining of online student reviews.
As for [115], the aim of this study was to predict and to explain the reasons behind freshmen student attrition. The models indicated that the most important predictors for student attrition are those related to the past and present educational success of the student, and whether they are receiving financial help.
In [116], the authors applied an attribute selection algorithm to decision trees with the objective of identifying the most important factors influencing drop out decision. The results showed that dropout does not depend on a single factor, but is multi-factorial, with the five main causes of university dropouts being the following: lack of counselling, inadequate student environment, lack of academic follow-up, poor educational quality and poor service in general. In the future, the authors wish to expand the sample to include other cities, allowing mechanisms for reducing university drop-out rates, according to the characteristics of the student population in each region.
In [117], the authors proposed methods, using statistical analysis and a priori–based concepts, to identify retention patterns in undergraduate programs.
The aim of the work described in [118] was to identify the factors that may influence dropout rates, identify the courses that most fail students, identify the factors that may influence the high rate of failures in these courses, and study the profiles of students who graduated in the mathematics major.
The objective of the work presented in [2] was to design an uplift modelling framework to maximise the effectiveness of retention efforts in higher education institutions. The results revealed that this knowledge translates into a better design of tailored retention efforts. Particularly, the importance of prematriculation attributes indicates that the design of retention efforts can take a proactive rather than a reactive approach. The authors stated that, in the future, students should be targeted according to the uplift model, and subsequently corroborate the effectiveness of the customised targeting assignment. The uplift modelling framework could be applied to different institutional contexts, which would enrich the understanding on the effectiveness and limitations of this approach. Another future work item is to incorporate academic information from subsequent semesters, which may enhance model estimates and the comprehension of long-term program effects. Finally, the authors wish to adapt profit metrics for business analytics in order to assess the benefits and costs of student dropout.
In [119], the authors wish to classify student desertion and predict their type of academic risk. The results provided show that it is possible to determine the factors affecting academic performance. For future work, authors wish to include institutional and socioeconomic variables, taking information from students from more professional schools at the university.

5. Conclusions and Future Work

The emergence of digital transformation has brought a profound change in the higher education system and has created a variety of opportunities and facilities for today’s students, including the widespread expansion of internet access worldwide. In this scenario, online learning has emerged as one of the alternative learning approaches used today by many education providers worldwide, particularly in higher education entities. However, there are several barriers and obstacles, namely, the increased number of students attending higher education is accompanied by high dropout rates as previously discussed.
In this context, and in order to help prevent students from dropping out of higher education, a study based on a literature review was conducted to identify the contribution of LA to reverse this trend, i.e., by identifying the students who are likely to drop out of their studies (identification performed through indicators). So, from the literature review, a set of data (features) was identified; those data were used in the research presented in this paper. Those data were grouped into categories and subcategories of features. The categories considered are (1) student, and (2) external. The subcategories concerning the student are (1.1) personal data, and (1.2) academic. Regarding external data, the subcategories considered are (2.1) university, (2.2) environmental and (2.3) support (this information is shown in Table A3 and summarised in Figure 5).
The analysis developed and presented here demonstrates that the models created, and described in the literature, are able to predict the intended information, such as, for example, students’ performance or grades. Another important aspect identified in the study is the fact that the models presented allow early prediction. With this, the teacher and/or the institution can take actions to avoid undesired effects, such as attrition, dropout, desertion, risk of failure or retention. Another aspect to be highlighted from the study that is no less important is privacy issues. As some of the data used for predictions may be personal and sensitive, privacy needs to be considered; this concern is also referred to in some of the studies reviewed.
As future work, based on the results obtained, we will conduct a practical study based on the records of hundreds of students from several courses in a higher education institution, using several of the models presented and comparing them to identify what best applies in the context under study in order to develop our own model and apply it in a real context.

Author Contributions

Conceptualisation, C.F.d.O., S.R.S., M.J.F. and F.M.; methodology, C.F.d.O., S.R.S., M.J.F. and F.M.; validation, C.F.d.O., S.R.S., M.J.F. and F.M.; formal analysis, C.F.d.O. and S.R.S.; data curation, C.F.d.O., S.R.S., M.J.F. and F.M.; writing—original draft preparation, C.F.d.O. and S.R.S.; writing—review and editing, C.F.d.O., S.R.S., M.J.F. and F.M.; supervision, C.F.d.O., S.R.S., M.J.F. and F.M.; project administration, C.F.d.O., S.R.S., M.J.F. and F.M. All authors have read and agreed to the published version of the manuscript.

Funding

This work was supported by the FCT – Fundação para a Ciência e a Tecnologia, I.P. [Project UIDB/05105/2020].

Institutional Review Board Statement

Not applicable.

Informed Consent Statement

Not applicable.

Data Availability Statement

Data are contained within the article.

Conflicts of Interest

The authors declare no conflict of interest.

Abbreviations

The following abbreviations are used in this manuscript:
AHPAnalytic Hierarchy Process
ANNArtificial Neural Network
AUCArea Under the Curve
BWMBest–Worst Method
CARTClassification and Regression Trees
CNNConvolutional Neural Network
COVCoefficient of Variation
CVCross validation
DMData mining
DTDecision Tree
EDMEducational Data Mining
E-LDAEnsemble of Linear Discriminant Analysis
ELMExtreme Learning Machine
GBDTGradient Boosting Decision Trees
GPAGrade Point Average
GREGraduate Record Examinations
HEIHigher Education Institution
KNNK-Nearest Neighbours
LALearning Analytics
LDALinear Discriminant Analysis
LiRLinear Regression
LMSLearning Management System
LOO-CVLeave One Out Cross Validation
LRLogistic regression
MAEMean Absolute Error
MCCMatthews Correlation Coefficient
MITMassachusetts Institute of Technology
MLMachine Learning
MLPMultilayer Perceptron
MOOCMassive Online Open Course
MSEMean Squared Error
MVGPMulti-view Gaussian process
MVMIMulti-view Multi-instance
NBNaive Bayes
NNNeural Network
NSUTNational University of Sciences and Technology
PCAPrincipal Component Analysis
PRCPrecision Recall Curve
PSMProgramming State Model
RAERoot Average Error
RBFRadial basis function
RFRandom Forests
RIPPERRepeated Incremental Pruning to Produce Error Reduction
RMSRoot Mean Squared
RMSERelative Mean Squared Error
ROCReceiving Operation Characteristic
RRSERoot Relative Squared Error
SATStandardised Admission Test
SEECSSchool of Electrical Engineering and Computer Science
SMOSequential Minimal Optimisation
SVMSupport Vector Machines
TLPTeaching–Learning process
TOEFLTest of English as Foreign Language
UECUniversity Educational Credit
UNSAUniversity of San Agustín
VADERValence Aware Dictionary for Sentiment Reasoning
VCUVirginia Commonwealth University

Appendix A

Table A1. Number of citations of each publication.
AuthorsTitle and ReferenceYSource TitleN
Costa, EB; Fonseca, B; Santana, MA; de Araujo, FF; Rego, JEvaluating the effectiveness of educational data mining techniques for early prediction of students’ academic failure in introductory programming courses [86]2017Computers in Human Behavior128
Delen, D.A comparative analysis of machine learning techniques for student retention management [115]2010Decision Support Systems114
Helal, S., Li, J., Liu, L., Ebrahimie, E., Dawson, S., Murray, D.J., Long, Q.Predicting academic performance by considering student heterogeneity [78]2018Knowledge-Based Systems34
Delen, D.Predicting student attrition with data mining methods [109]2011Journal of College Student Retention: Research, Theory and Practice31
Adejo, O.W., Connolly, T.Predicting student academic performance using multi-model heterogeneous ensemble approach [108]2018Journal of Applied Research in Higher Education28
Sivakumar, S., Venkataraman, S., Selvaraj, R.Predictive modeling of student dropout indicators in educational data mining using improved decision tree [89]2016Indian Journal of Science and Technology26
Tekin, A.Early prediction of students’ grade point averages at graduation: A data mining approach [100]2014Egitim Arastirmalari—Eurasian Journal of Educational Research25
YasminApplication of the classification tree model in predicting learner dropout behaviour in open and distance learning [81]2013Distance Education24
Almutairi, F.M., Sidiropoulos, N.D., Karypis, G.Context-Aware Recommendation-Based Learning Analytics Using Tensor and Coupled Matrix Factorization [111]2017IEEE Journal on Selected Topics in Signal Processing23
Iam-On, N., Boongoen, T.Improved student dropout prediction in Thai University using ensemble of mixed-type data clusterings [91]2017International Journal of Machine Learning and Cybernetics17
Carter, Adam S.; Hundhausen, Christopher D.; Adesope, OlusolaBlending Measures of Programming and Social Behavior into Predictive Models of Student Achievement in Early Computing Courses [112]2017ACM Trans. Comput. Educ.16
Srinivas, S., Rajendran, S.Topic-based knowledge mining of online student reviews for strategic planning in universities [114]2019Computers and Industrial Engineering14
Sultana, S., Khan, S., Abbas, M.A.Predicting performance of electrical engineering students using cognitive and non-cognitive features for identification of potential dropouts [98]2017International Journal of Electrical Engineering Education12
Sukhbaatar, O; Usagawa, T; Choimaa, LAn Artificial Neural Network Based Early Prediction of Failure-Prone Students in Blended Learning Course [85]2019International Journal of Emerging Technologies in Learning12
Shyamala, K., Rajagopalan, S.P.Data mining model for a better higher educational system [90]2006Information Technology Journal10
L. Qiu; Y. Liu; Y. LiuAn Integrated Framework With Feature Selection for Dropout Prediction in Massive Open Online Courses [83]2018IEEE Access10
Table A2. Affiliation of authors, most cited articles.
AuthorAffiliation
Abbas, Muhammad AzeemPMAS-Arid Agriculture University Rawalpindi, Rawalpindi, Pakistan
Adejo, Olugbenga WilsonUniversity of the West of Scotland, Ayr, United Kingdom
Adesope, Olusola O.Washington State University Pullman, Pullman, United States
Almutairi, Faisal M.University of Minnesota Twin Cities, Minneapolis, United States
Boongoen, TossaponAston University, Birmingham, United Kingdom
Carter, Adam ScottHumboldt State University, Arcata, United States
Choimaa, LodoiravsalNational University of Mongolia, Ulaanbaatar, Mongolia
Connolly, Thomas M.University of the West of Scotland, Ayr, United Kingdom
Costa, Evandro De BarrosUniversidade Federal de Alagoas, Maceio, Brazil
Dawson, ShaneUniversity of South Australia, Adelaide, Australia
de Araújo, Fabrísia FerreiraFederal Institute of Alagoas (IFAL), Brazil
Delen, DursunHaliç Üniversitesi, Istanbul, Turkey
Ebrahimie, EsmaeilUniversity of South Australia, Adelaide, Australia
Fonseca, BaldoínoUniversidade Federal de Alagoas, Maceio, Brazil
Helal, SumyeaUniversity of South Australia, Adelaide, Australia
Hundhausen, Christopher D.Washington State University, Pullman, United States
Iam-On, NatthakanAston University, Birmingham, United Kingdom
Karypis, GeorgeUniversity of Minnesota Twin Cities, Minneapolis, United State
Khan, SharifullahNational University of Sciences and Technology Pakistan, Islamabad, Pakistan
Li, JiuyongUniversity of South Australia, Adelaide, Australia
Liu, LinUniversity of South Australia, Adelaide, Australia
Liu, YanshenHuazhong Normal University, Wuhan, China
Liu, YiHuazhong Normal University, Wuhan, China
Long, QiUniversity of Pennsylvania Perelman School of Medicine, Philadelphia, United States
Murray, Duncan J.University of South Australia, Adelaide, Australia
Qiu, LinYangtze University, Jingzhou, China
Rajagopalan, S. P.GKM College of Engineering & Technology, Chennai, India
Rajendran, SuchithraUniversity of Missouri, Columbia, United States
Rego, Joilson B.A.Universidade Federal do Rio Grande do Norte, Natal, Brazil
Santana, Marcelo AlmeidaUniversidade Federal de Alagoas, Maceio, Brazil
Selvaraj, RajalakshmiBotswana International University of Science and Technology, Palapye, Botswana
Shyamala, K.Dr. Ambedkar Government Arts College, Chennai, Chennai, India
Sidiropoulos, Nicholas D.University of Virginia, Charlottesville, United States
Sivakumar, SubithaNew Era College, Gaborone, Botswana
Srinivas, SharanUniversity of Missouri, Columbia, United States
Sukhbaatar, OtgontsetsegKumamoto University, Kumamoto, Japan
Sultana, SaraNational University of Sciences and Technology Pakistan, Islamabad, Pakistan
Tekin, AhmetFirat Üniversitesi, Elazig, Turkey
Usagawa, TsuyoshiKumamoto University, Kumamoto, Japan
Venkataraman, SivakumarBotho University, Gaborone, Botswana
YasminIndira Gandhi National Open University, New Delhi, India
Table A3. Categories of features used in each study.
StudentExternal
PersonalAcademicUniversityEnvironmentalSupport
DemographicIndividualBackgroundEntryCurrentFinal
SociodemographicSocioeconomicalProcessHelpAssessment
[86]
[115]
[78]
[109]
[108]
[89]
[100]
[81]
[111]
[91]
[112]
[114]
[98]
[85]
[90]
[83]
[71]
[72]
[73]
[74]
[75]
[76]
[77]
[79]
[80]
[82]
[84]
[87]
[88]
[92]
[93]
[94]
[95]
[96]
[97]
[99]
[101]
[102]
[103]
[104]
[105]
[106]
[107]
[110]
[113]
[116]
[117]
[118]
[2]
[119]
Table A4. Summary of categories of features used in each study.
StudentExternal
PersonalAcademic
[86]
[115]
[78]
[109]
[108]
[89]
[100]
[81]
[111]
[91]
[112]
[114]
[98]
[85]
[90]
[83]
[71]
[72]
[73]
[74]
[75]
[76]
[77]
[79]
[80]
[82]
[84]
[87]
[88]
[92]
[93]
[94]
[95]
[96]
[97]
[99]
[101]
[102]
[103]
[104]
[105]
[106]
[107]
[110]
[113]
[116]
[117]
[118]
[2]
[119]

References

  1. Brito, M.; Medeiros, F.; Bezerra, E.P. An Infographics-based Tool for Monitoring Dropout Risk on Distance Learning in Higher Education. In Proceedings of the 2019 18th International Conference on Information Technology Based Higher Education and Training (ITHET), Magdeburg, Germany, 26–27 September 2019; pp. 1–7. [Google Scholar] [CrossRef]
  2. Olaya, D.; Vásquez, J.; Maldonado, S.; Miranda, J.; Verbeke, W. Uplift Modeling for preventing student dropout in higher education. Decis. Support Syst. 2020, 134, 113320. [Google Scholar] [CrossRef]
  3. Lázaro Alvarez, N.; Callejas, Z.; Griol, D. Predicting computer engineering students’ dropout in cuban higher education with pre-enrollment and early performance data. JOTSE J. Technol. Sci. Educ. 2020, 10, 241–258. [Google Scholar] [CrossRef]
  4. Gómez-Pulido, J.A.; Park, Y.; Soto, R. Advanced Techniques in the Analysis and Prediction of Students’ Behaviour in Technology-Enhanced Learning Contexts. Appl. Sci. 2020, 10, 6178. [Google Scholar] [CrossRef]
  5. Bañeres, D.; Rodríguez, M.E.; Guerrero-Roldán, A.E.; Karadeniz, A. An Early Warning System to Detect At-Risk Students in Online Higher Education. Appl. Sci. 2020, 10, 4427. [Google Scholar] [CrossRef]
  6. Lacave, C.; Molina, A.I.; Cruz-Lemus, J.A. Learning Analytics to identify dropout factors of Computer Science studies through Bayesian networks. Behav. Inf. Technol. 2018, 37, 993–1007. [Google Scholar] [CrossRef]
  7. Johnson, L.; Becker, S.A.; Estrada, V.; Freeman, A. NMC Horizon Report: 2014 K; The New Media Consortium: Austin, TX, USA, 2014. [Google Scholar]
  8. Siemens, G. Learning analytics: The emergence of a discipline. Am. Behav. Sci. 2013, 57, 1380–1400. [Google Scholar] [CrossRef] [Green Version]
  9. De Menezes, L.M.; Kelliher, C. Flexible working and performance: A systematic review of the evidence for a business case. Int. J. Manag. Rev. 2011, 13, 452–474. [Google Scholar] [CrossRef]
  10. Siddaway, A.P.; Wood, A.M.; Hedges, L.V. How to do a systematic review: A best practice guide for conducting and reporting narrative reviews, meta-analyses, and meta-syntheses. Annu. Rev. Psychol. 2019, 70, 747–770. [Google Scholar] [CrossRef] [PubMed]
  11. Parris, D.L.; Dapko, J.L.; Arnold, R.W.; Arnold, D. Exploring transparency: A new framework for responsible business management. Manag. Decis. 2016, 54, 222–247. [Google Scholar] [CrossRef]
  12. Sobral, S.R.; Oliveira, C.F. Predicting Students Performance in Introductory Programming Courses: A Literature Review. 2021. Available online: http://repositorio.uportu.pt:8080/handle/11328/3396 (accessed on 13 October 2021). [CrossRef]
  13. Ihantola, P.; Vihavainen, A.; Ahadi, A.; Butler, M.; Börstler, J.; Edwards, S.H.; Isohanni, E.; Korhonen, A.; Petersen, A.; Rivers, K.; et al. Educational data mining and learning analytics in programming: Literature review and case studies. In Proceedings of the 2015 ITiCSE on Working Group Reports, Vilnius, Lithuania, 4–8 July 2015; pp. 41–63. [Google Scholar] [CrossRef] [Green Version]
  14. Papamitsiou, Z.K.; Economides, A.A. Learning analytics and educational data mining in practice: A systematic literature review of empirical evidence. J. Educ. Technol. Soc. 2014, 17, 49–64. [Google Scholar]
  15. Avella, J.T.; Kebritchi, M.; Nunn, S.G.; Kanai, T. Learning analytics methods, benefits, and challenges in higher education: A systematic literature review. Online Learn. 2016, 20, 13–29. [Google Scholar]
  16. Aldowah, H.; Al-Samarraie, H.; Fauzy, W.M. Educational data mining and learning analytics for 21st century higher education: A review and synthesis. Telemat. Inform. 2019, 37, 13–49. [Google Scholar] [CrossRef]
  17. Bodily, R.; Verbert, K. Review of research on student-facing learning analytics dashboards and educational recommender systems. IEEE Trans. Learn. Technol. 2017, 10, 405–418. [Google Scholar] [CrossRef]
  18. Romero, C.; Ventura, S.; García, E. Data mining in course management systems: Moodle case study and tutorial. Comput. Educ. 2008, 51, 368–384. [Google Scholar] [CrossRef]
  19. Witten, I.H.; Frank, E.; Hall, M.A.; Pal, C.J. Data Mining: Practical Machine Learning Tools and Techniques; 2005; p. 135. Available online: https://doc1.bibliothek.li/acb/FLMF040119.pdf (accessed on 13 October 2021). [CrossRef] [Green Version]
  20. Friedman, J.; Hastie, T.; Tibshirani, R. The Elements of Statistical Learning; Springer Series in Statistics New York; Springer: Berlin/Heidelberg, Germany, 2001; Volume 1. [Google Scholar]
  21. Han, J.; Kamber, M.; Pei, J. Data mining concepts and techniques third edition. Morgan Kaufmann Ser. Data Manag. Syst. 2011, 5, 83–124. [Google Scholar] [CrossRef]
  22. Long, P. In Proceedings of the LAK’11: 1st International Conference on Learning Analytics and Knowledge, Banff, AB, Canada, 27 February–1 March 2011; ACM: New York, NY, USA, 2011. Available online: https://tekri.athabascau.ca/analytics/ (accessed on 13 October 2021).
  23. Clow, D. An overview of learning analytics. Teach. High. Educ. 2013, 18, 683–695. [Google Scholar] [CrossRef] [Green Version]
  24. Wise, A.F. Designing pedagogical interventions to support student use of learning analytics. In Proceedings of the Fourth International Conference on Learning Analytics and Knowledge, Indianapolis, IN, USA, 24–28 March 2014; pp. 203–211. [Google Scholar] [CrossRef]
  25. Aguilar, S.; Lonn, S.; Teasley, S.D. Perceptions and use of an early warning system during a higher education transition program. In Proceedings of the Fourth International Conference on Learning Analytics and Knowledge, Indianapolis, IN, USA, 24–28 March 2014; pp. 113–117. [Google Scholar] [CrossRef]
  26. Siemens, G.; Baker, R.S.d. Learning analytics and educational data mining: Towards communication and collaboration. In Proceedings of the 2nd International Conference on Learning Analytics and Knowledge, Vancouver, BC, Canada, 29 April 2012–2 May 2012; pp. 252–254. [Google Scholar] [CrossRef]
  27. Dawson, S.; Joksimovic, S.; Poquet, O.; Siemens, G. Increasing the impact of learning analytics. In Proceedings of the 9th International Conference on Learning Analytics & Knowledge, Tempe, AZ, USA, 4–8 March 2019; pp. 446–455. [Google Scholar] [CrossRef]
  28. Matcha, W.; Gašević, D.; Uzir, N.A.; Jovanović, J.; Pardo, A. Analytics of learning strategies: Associations with academic performance and feedback. In Proceedings of the 9th International Conference on Learning Analytics & Knowledge, Tempe, AZ, USA, 4–8 March 2019; pp. 461–470. [Google Scholar] [CrossRef]
  29. Brooks, C.; Greer, J.; Gutwin, C. The data-assisted approach to building intelligent technology-enhanced learning environments. In Learning Analytics; Springer: Berlin/Heidelberg, Germany, 2014; pp. 123–156. [Google Scholar] [CrossRef]
  30. Teplovs, C.; Fujita, N.; Vatrapu, R. Generating predictive models of learner community dynamics. In Proceedings of the 1st International Conference on Learning Analytics and Knowledge, Banff, AB, Canada, 27 February–1 March 2011; pp. 147–152. [Google Scholar] [CrossRef] [Green Version]
  31. Suthers, D.; Rosen, D. A unified framework for multi-level analysis of distributed learning. In Proceedings of the 1st International Conference on Learning Analytics and Knowledge, Banff, AB, Canada, 27 February–1 March 2011; pp. 64–74. [Google Scholar] [CrossRef]
  32. Baker, R. Data mining for education. Int. Encycl. Educ. 2010, 7, 112–118. [Google Scholar]
  33. Yahya, A.A.; Osman, A. Using Data Mining Techniques to Guide Academic Programs Design and Assessment. Procedia Comput. Sci. 2019, 163, 472–481. [Google Scholar] [CrossRef]
  34. Gašević, D.; Kovanović, V.; Joksimović, S. Piecing the learning analytics puzzle: A consolidated model of a field of research and practice. Learn. Res. Pract. 2017, 3, 63–78. [Google Scholar] [CrossRef] [Green Version]
  35. Misuraca, M.; Scepi, G.; Spano, M. Using Opinion Mining as an educational analytic: An integrated strategy for the analysis of students’ feedback. Stud. Educ. Eval. 2021, 68, 100979. [Google Scholar] [CrossRef]
  36. Larsen, M.; Kornbeck, K.P.; Kristensen, R.M.; Larsen, M.R.; Sommersel, H.B. Dropout Phenomena at Universities: What is Dropout? Why does Dropout Occur? What Can be Done by the Universities to Prevent or Reduce it? Available online: https://edudoc.ch/record/115243/files/Dropout_universities_technical_report.pdf (accessed on 13 October 2021).
  37. Spady, W.G. Dropouts from higher education: An interdisciplinary review and synthesis. Interchange 1970, 1, 64–85. [Google Scholar] [CrossRef]
  38. Tinto, V. Dropout from higher education: A theoretical synthesis of recent research. Rev. Educ. Res. 1975, 45, 89–125. [Google Scholar] [CrossRef]
  39. Bean, J.P. Conceptual models of student attrition: How theory can help the institutional researcher. New Dir. Inst. Res. 1982, 1982, 17–33. [Google Scholar] [CrossRef]
  40. Bean, J.P. Interaction effects based on class level in an explanatory model of college student dropout syndrome. Am. Educ. Res. J. 1985, 22, 35–64. [Google Scholar] [CrossRef]
  41. Chen, R.; DesJardins, S.L. Investigating the impact of financial aid on student dropout risks: Racial and ethnic differences. J. High. Educ. 2010, 81, 179–208. [Google Scholar] [CrossRef]
  42. Forsman, J.; Linder, C.; Moll, R.; Fraser, D.; Andersson, S. A new approach to modelling student retention through an application of complexity thinking. Stud. High. Educ. 2014, 39, 68–86. [Google Scholar] [CrossRef] [Green Version]
  43. Fortin, A.; Sauvé, L.; Viger, C.; Landry, F. Nontraditional student withdrawal from undergraduate accounting programmes: A holistic perspective. Account. Educ. 2016, 25, 437–478. [Google Scholar] [CrossRef]
  44. Kehm, B.M.; Larsen, M.R.; Sommersel, H.B. Student dropout from universities in Europe: A review of empirical literature. Hung. Educ. Res. J. 2019, 9, 147–164. [Google Scholar] [CrossRef]
  45. Vásquez, J.; Miranda, J. Student desertion: What is and how can it be detected on time? In Data Science and Digital Business; Springer: Berlin/Heidelberg, Germany, 2019; pp. 263–283. [Google Scholar] [CrossRef]
  46. Caison, A.L. Analysis of institutionally specific retention research: A comparison between survey and institutional database methods. Res. High. Educ. 2007, 48, 435–451. [Google Scholar] [CrossRef]
  47. Yu, C.H.; DiGangi, S.; Jannasch-Pennell, A.; Kaprolet, C. A data mining approach for identifying predictors of student retention from sophomore to junior year. J. Data Sci. 2010, 8, 307–325. [Google Scholar] [CrossRef]
  48. Padgett, R.D.; Keup, J.R.; Pascarella, E.T. The impact of first-year seminars on college students’ life-long learning orientations. J. Stud. Aff. Res. Pract. 2013, 50, 133–151. [Google Scholar] [CrossRef] [Green Version]
  49. Bijsmans, P.; Schakel, A.H. The impact of attendance on first-year study success in problem-based learning. High. Educ. 2018, 76, 865–881. [Google Scholar] [CrossRef] [Green Version]
  50. Schmied, V.; Hänze, M. The effectiveness of study skills courses: Do they increase general study competences? Zeitschrift für Hochschulentwicklung 2015. [Google Scholar] [CrossRef]
  51. All, E. Education at a Glance 2019 OECD Indicators; OECD: Paris, France, 2019. [Google Scholar]
  52. Peña-Calvo, J.V.; Inda-Caro, M.; Rodríguez-Menéndez, C.; Fernández-García, C.M. Perceived supports and barriers for career development for second-year STEM students. J. Eng. Educ. 2016, 105, 341–365. [Google Scholar] [CrossRef]
  53. López, S.; Carpeño, A.; Arriaga, J.; Ruiz, M. Experiencias para el Fomento de las Vocaciones Tecnológicas entre Estudiantes de Enseñanza Secundaria. Available online: https://dialnet.unirioja.es/servlet/articulo?codigo=7316013 (accessed on 13 October 2021).
  54. Bean, J.P. Dropouts and turnover: The synthesis and test of a causal model of student attrition. Res. High. Educ. 1980, 12, 155–187. [Google Scholar] [CrossRef]
  55. Pascarella, E.T.; Terenzini, P.T. Predicting freshman persistence and voluntary dropout decisions from a theoretical model. J. High. Educ. 1980, 51, 60–75. [Google Scholar] [CrossRef]
  56. Ethington, C.A. A psychological model of student persistence. Res. High. Educ. 1990, 31, 279–293. [Google Scholar] [CrossRef]
  57. Migali, G.; Zucchelli, E. Personality traits, forgone health care and high school dropout: Evidence from US adolescents. J. Econ. Psychol. 2017, 62, 98–119. [Google Scholar] [CrossRef] [Green Version]
  58. Thomas, L. Student retention in higher education: The role of institutional habitus. J. Educ. Policy 2002, 17, 423–442. [Google Scholar] [CrossRef]
  59. Dharmawan, T.; Ginardi, H.; Munif, A. Dropout detection using non-academic data. In Proceedings of the 2018 4th International Conference on Science and Technology (ICST), Yogyakarta, Indonesia, 7–8 August 2018; pp. 1–4. [Google Scholar] [CrossRef]
  60. Heublein, U. Student Drop-out from German Higher Education Institutions. Eur. J. Educ. 2014, 49, 497–513. [Google Scholar] [CrossRef]
  61. Willcoxson, L.; Cotter, J.; Joy, S. Beyond the first-year experience: The impact on attrition of student experiences throughout undergraduate degree studies in six diverse universities. Stud. High. Educ. 2011, 36, 331–352. [Google Scholar] [CrossRef]
  62. Bland, C.J.; Taylor, A.L.; Shollen, S.L.; Weber-Main, A.M.; Mulcahy, P.A. Faculty Success through Mentoring: A Guide for Mentors, Mentees, and Leaders; R&L Education: Lanham, MD, USA, 2009. [Google Scholar]
  63. Larose, S.; Cyrenne, D.; Garceau, O.; Harvey, M.; Guay, F.; Godin, F.; Tarabulsy, G.M.; Deschênes, C. Academic mentoring and dropout prevention for students in math, science and technology. Mentor. Tutoring Partnersh. Learn. 2011, 19, 419–439. [Google Scholar] [CrossRef]
  64. Zepke, N.; Leach, L. Improving student engagement: Ten proposals for action. Act. Learn. High. Educ. 2010, 11, 167–177. [Google Scholar] [CrossRef]
  65. Thomas, L. Building student engagement and belonging in Higher Education at a time of change. Paul Hamlyn Found. 2012, 100, 1–99. [Google Scholar]
  66. Yorke, M. The development and initial use of a survey of student ‘belongingness’, engagement and self-confidence in UK higher education. Assess. Eval. High. Educ. 2016, 41, 154–166. [Google Scholar] [CrossRef]
  67. Arango-Lopez, J.; Collazos, C.A.; Velas, F.L.G.; Moreira, F. Using pervasive games as learning tools in educational contexts: A systematic review. Int. J. Learn. Technol. 2018, 13, 93–114. [Google Scholar] [CrossRef]
  68. Kitchenham, B.; Charters, S. Guidelines for Performing Systematic Literature Reviews in Software Engineering; 2007; Available online: https://www.elsevier.com/__data/promis_misc/525444systematicreviewsguide.pdf (accessed on 13 October 2021).
  69. Baptista, A.; Martins, J.; Goncalves, R.; Branco, F.; Rocha, T. Web accessibility challenges and perspectives: A systematic literature review. In Proceedings of the 2016 11th Iberian Conference on Information Systems and Technologies (CISTI), Gran Canaria, Spain, 15–18 June 2016; pp. 1–6. [Google Scholar] [CrossRef]
  70. Page, M.J.; McKenzie, J.E.; Bossuyt, P.M.; Boutron, I.; Hoffmann, T.C.; Mulrow, C.D.; Shamseer, L.; Tetzlaff, J.M.; Akl, E.A.; Brennan, S.E.; et al. The PRISMA 2020 statement: An updated guideline for reporting systematic reviews. BMJ 2021, 372. Available online: https://www.bmj.com/content/372/bmj.n71.full.pdf (accessed on 13 October 2021). [CrossRef]
  71. Karlos, S.; Kostopoulos, G.; Kotsiantis, S. Predicting and Interpreting Students’ Grades in Distance Higher Education through a Semi-Regression Method. Appl. Sci. 2020, 10, 8413. [Google Scholar] [CrossRef]
  72. Wen, Y.; Tian, Y.; Wen, B.; Zhou, Q.; Cai, G.; Liu, S. Consideration of the local correlation of learning behaviors to predict dropouts from MOOCs. Tsinghua Sci. Technol. 2019, 25, 336–347. [Google Scholar] [CrossRef]
  73. Gkontzis, A.F.; Kotsiantis, S.; Kalles, D.; Panagiotakopoulos, C.T.; Verykios, V.S. Polarity, emotions and online activity of students and tutors as features in predicting grades. Intell. Decis. Technol. 2020, 14, 409–436. [Google Scholar] [CrossRef]
  74. Gupta, S.; Sabitha, A.S. Deciphering the attributes of student retention in massive open online courses using data mining techniques. Educ. Inf. Technol. 2019, 24, 1973–1994. [Google Scholar] [CrossRef]
  75. Ortigosa, A.; Carro, R.M.; Bravo-Agapito, J.; Lizcano, D.; Alcolea, J.J.; Blanco, O. From lab to production: Lessons learnt and real-life challenges of an early student-dropout prevention system. IEEE Trans. Learn. Technol. 2019, 12, 264–277. [Google Scholar] [CrossRef]
  76. Gkontzis, A.F.; Kotsiantis, S.; Panagiotakopoulos, C.T.; Verykios, V.S. A predictive analytics framework as a countermeasure for attrition of students. Interact. Learn. Environ. 2019, 1–16. [Google Scholar] [CrossRef]
  77. El Fouki, M.; Aknin, N. Multidimensional Approach Based on Deep Learning to Improve the Prediction Performance of DNN Models. Int. J. Emerg. Technol. Learn. 2019, 14. [Google Scholar] [CrossRef]
  78. Helal, S.; Li, J.; Liu, L.; Ebrahimie, E.; Dawson, S.; Murray, D.J.; Long, Q. Predicting academic performance by considering student heterogeneity. Knowl.-Based Syst. 2018, 161, 134–146. [Google Scholar] [CrossRef]
  79. Kostopoulos, G.; Kotsiantis, S.; Pierrakeas, C.; Koutsonikos, G.; Gravvanis, G.A. Forecasting students’ success in an open university. Int. J. Learn. Technol. 2018, 13, 26–43. [Google Scholar] [CrossRef]
  80. de Castro e Lima Baesse, D.; Monteiro Grisolia, A.; de Oliveira, A.E.F. Pedagogical monitoring as a tool to reduce dropout in distance learning in family health. BMC Med. Educ. 2016, 16, 213. [Google Scholar] [CrossRef] [Green Version]
  81. Yasmin, D. Application of the classification tree model in predicting learner dropout behaviour in open and distance learning. Distance Educ. 2013, 34, 218–231. [Google Scholar] [CrossRef]
  82. Villegas-Ch, W.; Palacios-Pacheco, X.; Luján-Mora, S. A business intelligence framework for analyzing educational data. Sustainability 2020, 12, 5745. [Google Scholar] [CrossRef]
  83. Qiu, L.; Liu, Y.; Liu, Y. An integrated framework with feature selection for dropout prediction in massive open online courses. IEEE Access 2018, 6, 71474–71484. [Google Scholar] [CrossRef]
  84. Guo, S.X.; Sun, X.; Wang, S.X.; Gao, Y.; Feng, J. Attention-based character-word hybrid neural networks with semantic and structural information for identifying of urgent posts in MOOC discussion forums. IEEE Access 2019, 7, 120522–120532. [Google Scholar] [CrossRef]
  85. Sukhbaatar, O.; Usagawa, T.; Choimaa, L. An artificial neural network based early prediction of failure-prone students in blended learning course. Int. J. Emerg. Technol. Learn. (iJET) 2019, 14, 77–92. [Google Scholar] [CrossRef]
  86. Costa, E.B.; Fonseca, B.; Santana, M.A.; de Araújo, F.F.; Rego, J. Evaluating the effectiveness of educational data mining techniques for early prediction of students’ academic failure in introductory programming courses. Comput. Hum. Behav. 2017, 73, 247–256. [Google Scholar] [CrossRef]
  87. Jenhani, I.; Elhassan, A.; Brahim, G.B. A novel possibilistic artificial immune-based classifier for course learning outcome enhancement. Knowl. Inf. Syst. 2020, 62, 3535–3563. [Google Scholar] [CrossRef]
  88. Prada, M.Á.; Domínguez, M.; Vicario, J.L.; Alves, P.A.V.; Barbu, M.; Podpora, M.; Spagnolini, U.; Pereira, M.J.V.; Vilanova, R. Educational Data Mining for Tutoring Support in Higher Education: A Web-Based Tool Case Study in Engineering Degrees. IEEE Access 2020, 8, 212818–212836. [Google Scholar] [CrossRef]
  89. Sivakumar, S.; Venkataraman, S.; Selvaraj, R. Predictive modeling of student dropout indicators in educational data mining using improved decision tree. Indian J. Sci. Technol. 2016, 9, 1–5. [Google Scholar] [CrossRef] [Green Version]
  90. Shyamala, K.; Rajagopalan, S. Data mining model for a better higher educational system. Inf. Technol. J. 2006, 5, 560–564. [Google Scholar] [CrossRef] [Green Version]
  91. Iam-On, N.; Boongoen, T. Improved student dropout prediction in Thai University using ensemble of mixed-type data clusterings. Int. J. Mach. Learn. Cybern. 2017, 8, 497–510. [Google Scholar] [CrossRef]
  92. Nuankaew, P.; Nuankaew, W.; Teeraputon, D.; Phanniphong, K.; Bussaman, S. Prediction Model of Student Achievement in Business Computer Disciplines: Learning Strategies for Lifelong Learning. Int. J. Emerg. Technol. Learn. 2020, 15, 160–181. [Google Scholar] [CrossRef]
  93. Nuankaew, P. Dropout Situation of Business Computer Students, University of Phayao. Int. J. Emerg. Technol. Learn. (iJET) 2019, 14, 115–131. [Google Scholar] [CrossRef] [Green Version]
  94. Hutagaol, N.; Suharjito, S. Predictive modelling of student dropout using ensemble classifier method in higher education. Adv. Sci. Technol. Eng. Syst. J. 2019, 4, 206–211. [Google Scholar] [CrossRef] [Green Version]
  95. Mutrofin, S.; Ginardi, R.V.G.; Fatichah, C.; Kurniawardhani, A. A critical assessment of balanced class distribution problems: The case of predict student dropout. TEST Eng. Manag. 2019, 81. [Google Scholar] [CrossRef] [Green Version]
  96. Namasivayam, S.N.; Fouladi, M.H. Utilisation of learning outcome attainment data to drive continual quality improvement of an engineering programme: A case study of Taylor’s University. Int. J. Eng. Educ. 2018, 34, 905–914. [Google Scholar]
  97. Al-Jallad, N.T.; Ning, X.; Khairalla, M.A.; Al-qaness, M.A. Rule mining models for predicting dropout/stopout and switcher at college using satisfaction and SES features. Int. J. Manag. Educ. 2019, 13, 97–118. [Google Scholar] [CrossRef]
  98. Sultana, S.; Khan, S.; Abbas, M.A. Predicting performance of electrical engineering students using cognitive and non-cognitive features for identification of potential dropouts. Int. J. Electr. Eng. Educ. 2017, 54, 105–118. [Google Scholar] [CrossRef]
  99. Jorda, E.R.; Raqueno, A.R. Predictive Model for the Academic Performance of the Engineering Students Using CHAID and C 5.0 Algorithm. Int. J. Eng. Res. Technol. 2019, 917–928. [Google Scholar]
  100. Tekin, A. Early prediction of students’ grade point averages at graduation: A data mining approach. Eurasian J. Educ. Res. 2014, 54, 207–226. [Google Scholar] [CrossRef]
  101. Agrusti, F.; Mezzini, M.; Bonavolontà, G. Deep learning approach for predicting university dropout: A case study at Roma Tre University. J. e-Learn. Knowl. Soc. 2020, 16, 44–54. [Google Scholar] [CrossRef]
  102. Sarra, A.; Fontanella, L.; Di Zio, S. Identifying students at risk of academic failure within the educational data mining framework. Soc. Indic. Res. 2019, 146, 41–60. [Google Scholar] [CrossRef]
  103. Perchinunno, P.; Bilancia, M.; Vitale, D. A statistical analysis of factors affecting higher education dropouts. Soc. Indic. Res. 2021, 156, 341–362. [Google Scholar] [CrossRef]
  104. Kemper, L.; Vorhoff, G.; Wigger, B.U. Predicting student dropout: A machine learning approach. Eur. J. High. Educ. 2020, 10, 28–47. [Google Scholar] [CrossRef]
  105. Behr, A.; Giese, M.; Theune, K. Early prediction of university dropouts–a random forest approach. Jahrbücher Natl. Stat. 2020, 240, 743–789. [Google Scholar] [CrossRef]
  106. Fernández-García, A.J.; Rodríguez-Echeverría, R.; Preciado, J.C.; Manzano, J.M.C.; Sánchez-Figueroa, F. Creating a Recommender System to Support Higher Education Students in the Subject Enrollment Decision. IEEE Access 2020, 8, 189069–189088. [Google Scholar] [CrossRef]
  107. Ilieva, G.; Yankova, T. Early Multi-criteria Detection of Students at Risk of Failure. TEM J. 2020, 9, 344–350. [Google Scholar] [CrossRef]
  108. Adejo, O.W.; Connolly, T. Predicting student academic performance using multi-model heterogeneous ensemble approach. J. Appl. Res. High. Educ. 2018, 10, 61–75. [Google Scholar] [CrossRef]
  109. Delen, D. Predicting student attrition with data mining methods. J. Coll. Stud. Retention Res. Theory Pract. 2011, 13, 17–35. [Google Scholar] [CrossRef]
  110. Zhuhadar, L.; Daday, J.; Marklin, S.; Kessler, B.; Helbig, T. Using survival analysis to discovering pathways to success in mathematics. Comput. Hum. Behav. 2019, 92, 487–495. [Google Scholar] [CrossRef]
  111. Almutairi, F.M.; Sidiropoulos, N.D.; Karypis, G. Context-aware recommendation-based learning analytics using tensor and coupled matrix factorization. IEEE J. Sel. Top. Signal Process. 2017, 11, 729–741. [Google Scholar] [CrossRef]
  112. Carter, A.S.; Hundhausen, C.D.; Adesope, O. Blending measures of programming and social behavior into predictive models of student achievement in early computing courses. ACM Trans. Comput. Educ. (TOCE) 2017, 17, 1–20. [Google Scholar] [CrossRef]
  113. Cano, A.; Leonard, J.D. Interpretable multiview early warning system adapted to underrepresented student populations. IEEE Trans. Learn. Technol. 2019, 12, 198–211. [Google Scholar] [CrossRef]
  114. Srinivas, S.; Rajendran, S. Topic-based knowledge mining of online student reviews for strategic planning in universities. Comput. Ind. Eng. 2019, 128, 974–984. [Google Scholar] [CrossRef]
  115. Delen, D. A comparative analysis of machine learning techniques for student retention management. Decis. Support Syst. 2010, 49, 498–506. [Google Scholar] [CrossRef]
  116. Urbina-Nájera, A.; Camino-Hampshire, J.; Cruz Barbosa, R. University dropout: Prevention patterns through the application of educational data mining. Electron. J. Educ. Res. Assess. Eval. 2020, 26. [Google Scholar] [CrossRef]
  117. Costa, J.d.J.; Bernardini, F.; Artigas, D.; Viterbo, J. Mining direct acyclic graphs to find frequent substructures—An experimental analysis on educational data. Inf. Sci. 2019, 482, 266–278. [Google Scholar] [CrossRef]
  118. Villwock, R.; Appio, A.; Andreta, A.A. Educational data mining with focus on dropout rates. Int. J. Comput. Sci. Netw. Secur. (IJCSNS) 2015, 15, 17. [Google Scholar]
  119. Bedregal-Alpaca, N.; Cornejo-Aparicio, V.; Zárate-Valderrama, J.; Yanque-Churo, P. Classification Models for Determining Types of Academic Risk and Predicting Dropout in University Students. J. Adv. Comput. Sci. Appl. (IJACSA) 2020, 11. [Google Scholar] [CrossRef] [Green Version]
Figure 1. Identification of studies via databases and registers, adapted from [70].
Bdcc 05 00064 g001
Figure 2. Frequency of publications per year.
Bdcc 05 00064 g002
Figure 3. Frequency of publications by number of authors.
Bdcc 05 00064 g003
Figure 4. Cloud of words that occur at least twice in the keywords provided by the authors.
Bdcc 05 00064 g004
Figure 5. Hierarchy categories and subcategories of the features considered in the analysed studies.
Bdcc 05 00064 g005
Table 1. Databases used for information retrieval.
NameAcronymURL
ACM digital libraryACMhttps://dl.acm.org/ (accessed on 21 January 2021)
IEEE Xplore digital libraryIEEEhttp://ieeexplore.ieee.org/ (accessed on 21 January 2021)
ScopusSCOPUShttps://www.scopus.com/ (accessed on 21 January 2021)
Web of ScienceWoShttp://www.webofknowledge.com (accessed on 21 January 2021)
Table 2. Publications’ characteristics.
SourceNr.HSJRSubject and CategoryQ
Computer Science (Computer Science (miscellaneous));Q1
IEEE Access4860.78Engineering (Engineering (miscellaneous));Q1
Materials Science (Materials Science (miscellaneous))Q2
Engineering (Engineering (miscellaneous));Q2
International Journal of Emerging Technologies in Learning4190.33Social Sciences (Education);Q2
Social Sciences (E-learning)Q3
Arts and Humanities (Arts and Humanities (miscellaneous));Q1
Computers in Human Behavior21552.17Computer Science (Human-Computer Interaction);Q1
Psychology (Psychology (miscellaneous))Q1
Arts and Humanities (Arts and Humanities (miscellaneous));Q1
Decision Support Systems21381.92Business, Management and Accounting (Management Information Systems);Q1
Computer Science (Information Systems);Q1
Decision Sciences (Information Systems and Management);Q1
Psychology (Developmental and Educational Psychology)Q1
Computer Science (Computer Science Applications);Q1
IEEE Transactions on Learning Technologies2440.94Engineering (Engineering (miscellaneous));Q1
Social Sciences (Education);Q1
Social Sciences (E-learning)Q1
Arts and Humanities (Arts and Humanities (miscellaneous));Q1
Social Indicators Research2990.88Psychology (Developmental and Educational Psychology);Q2
Social Sciences (Social Sciences (miscellaneous));Q1
Social Sciences (Sociology and Political Science)Q1
Table 3. Authors with more than one publication.
AuthorAffiliationN
Kotsiantis, Sotiris B.Panepistimion Patron, Patra, Greece4
Kostopoulos, GeorgiosPanepistimion Patron, Patra, Greece2
Delen, DursunHaliç Üniversitesi, Istanbul, Turkey2
Gkontzis, Andreas F.Panepistimion Patron, Patra, Greece2
Karypis, GeorgeUniversity of Minnesota Twin Cities, Minneapolis, United State2
Nuankaew, PratyaUniversity of Phayao, Phayao, Thailand2
Panagiotakopoulos, Chris T.Hellenic Open University, Patra, Greece2
Verykios, Vassilios S.Hellenic Open University, Patra, Greece2
Table 4. Number of publications and authors by affiliation.
AffiliationPublicationsAuthors
Panepistimion Patron, Patra, Greece115
University of South Australia, Adelaide, Australia66
Guilin University of Electronic Technology, Guilin, China55
Hellenic Open University, Patra, Greece53
Northwest University, Xi’an, China44
Quercus Research Group, University of Extremadura, Cáceres, Spain44
Universidad Nacional de San Agustin de Arequipa, Arequipa, Peru44
Universidade Federal Fluminense, Niteroi, Brazil44
Universität Duisburg-Essen, Essen, Germany44
Karlsruhe Institute of Technology, Karlsruhe, Germany33
Universidade Federal de Alagoas, Maceio, Brazil33
Università degli Studi Roma Tre, Rome, Italy33
Western Kentucky University, Bowling Green, United States33
Western Paraná State University (UNIOESTE), Brazil33
Table 5. Countries that participated in at least two articles.
CountryN
The United States7
Greece4
Brazil4
China4
Italy4
Spain4
India3
Turkey3
Germany2
Indonesia2
Thailand2
The United Kingdom2
Publisher’s Note: MDPI stays neutral with regard to jurisdictional claims in published maps and institutional affiliations.

