1. Introduction
Information technology is an important part of most modern businesses. Business processes are mapped and integrated via IT; knowledge is gained from the available information and thus adds value. Business intelligence (BI) processes derive valuable information from internal and external sources of companies [
1]. Big data solutions take this a step further and process immense amounts of data with the help of highly complex and optimized algorithms, in order to draw the best possible economic conclusions. Especially in the age of the fourth industrial revolution (Industry 4.0), whose central basis is the so-called Internet of Things (IoT), an increasing amount of corporate and personal information is being produced, recorded, and analyzed. These data, some of which are critical for competition, are exposed to constant dangers. These data are not only a lucrative target for criminals, so-called industrial espionage is now also specialized in tapping and manipulating company data. However, the threats to companies and organizations are complex. The protection of these data is, therefore, an essential factor not only for an IT department but for an entire company. In addition to value-adding analyses, big data technologies can also be used for safety-relevant calculations.
As people live in a digital world today, enormous amounts of data are generated. To date, companies have dealt with transaction data, that is, structured data. They have made use of these data and used them in making decisions for the company. Structured data are data that can be specifically searched for or sorted according to individual or composite attributes. Due to the ever-increasing social networking of organizations, companies, and researchers such as through social media, web analysis applications, scientific applications, additional terabytes, and hexabytes of data are created [
2,
3]. Mobile devices and sensors are also involved in these data. A property of these data is that they are in an unstructured form. This means that the data are not stored in a predefined, structured table. They usually consist of numbers, texts, and fact blocks and do not have a special format.
A cutting-edge methodology is always required for working at scale with data: this endeavor is always challenged by continuous changes in data structure, and more than ever during the current COVID-19 pandemic, with its incoming unprecedented data processing needs.
The idea of big data is to use an existing large amount of data, meaningful acquisition, and use of decision-relevant knowledge, from qualitatively diverse and differently structured information that is subject to rapid change and is generated to an unprecedented extent, in order to gain competitive advantages for the company and to provide economic benefits. Another idea of big data is to use new analysis methods to gain new information in order to make previously unknown relationships visible on the basis of the vast amounts of data on which they are based.
This is the case for COVID-19 data sharing, which currently develops two unusual characteristics: one is the abolition of barriers between industrial and academic communication; the second one is even more challenging, as it breaks down the barriers between expert and common discussion information. Both create an unprecedented challenge in any kind of data analysis and in natural language exploitation by computers.
In this paper, we would like to provide an overview of the management of big data in the current situation of the COVID-19 pandemic and show the challenges that users of big data are currently facing, for a wide range of uses, which encompass, on one hand, real-time emergency applications in health monitoring and, on the other hand, the most global strategic issues. The possible use of Hadoop is also discussed, and a developed MapReduce framework in Hadoop is presented, which solves the problems of data processing. Since the data to be processed tend to become increasingly large, a solution is required that enables the acceleration of data operations. The MapReduce framework ensures distributed storage of the data on different computers in the cluster and also parallelizes data operations, in that not just one processing unit reads all data, but each processing unit reads different data. This results in a significant reduction in the time required for access operations, which is particularly advantageous with very large and unstructured or semi-structured data volumes. Based on our approach, this can lead to the following research question, which is addressed and answered in this paper: how can users (e.g., data analysts or data scientists) easily use this Hadoop technology to process big data?
Many organizations are, therefore, divided in their strategic analysis, as the implementation of big data brings with it some challenges. The company’s IT infrastructure needs to be restructured into a more flexible and open system. For companies, this means that they have to rethink their approach, be open to new technologies and, above all, be ready to invest in new technologies, such as Hadoop. Hadoop has some advantages, such as the processing and analysis of data volumes in the terabyte to petabyte range, or the parallel processing of the data, which offers a fast analysis option. Possible uses, as in a “Hadoop Fusion approach” that we sketch briefly (1), are conditioned themselves by the present data structure of information on COVID-19, that we sum up (2), and on more general conditions of data processing, that are particularity suitable for COVID-19 issues (3). We conclude by demonstrating the urgent need for robustness. Like the pandemic itself, the data challenge posed by COVID-19 itself is unprecedented. In terms of data science, one of the currently best-educated panoramas of the effects of COVID-19 qualifies the situation as a “massive stress test with many unexpected problems” [
4].
Big Data—Problems and Challenges
In general, the term big data in IT refers to enormous, complex, weakly structured, and/or rapidly changing data sets, especially in the corporate environment. However, there are extremely multifaceted interpretations of the topic of big data. The art term big data encompasses a variety of subject areas, such as Technologies, analytical methods, modeling and design processes, commercial concepts, and legal framework. This generalized listing of very different properties and facts already indicates that there is no uniform, comprehensive and accurate definition of big data.
Big data has come to a new step of its already restless history; it comes to be a topic of public debate on common global needs. This is no longer a question for specialists only as “one often laments that the general population does not have the time or resources to understand the data science behind social scientific concepts—this is a rare scenario in which most now have both” [
5]. Meanwhile, data science becomes a domain of multipurpose and multi-object knowledge as “today, data science, in the spirit of data + science, has become an interdisciplinary enterprise about data-enabled discoveries and inference with scientific theory and methods, algorithms, and systems” [
6].
According to [
7], big data comprises a large volume of complex structured, semi-structured, and unstructured data that goes beyond the processing capabilities of conventional databases. The processing and analysis of big data now plays a central role in decision making, forecasting, business analysis, product development, customer experience, and loyalty, to name just a few [
7].
The characterization of the question “what is big data?” is, therefore, to be understood relative to specific contexts. In the literature, reference is often made to the four V’s when trying to define the term big data [
8,
9,
10,
11,
12]. The four V’s are, however, in a technological context and are therefore only partially suitable for defining big data. They describe the typical big data problems that can no longer be adequately processed with classic standard software tools. The terms volume, variety, velocity, and veracity are understood as the four V’s. These four terms are explained in more detail below [
12]:
Volume (the amount of data can no longer be handled by conventional means): The term volume is understood to mean immense amounts of data that have to be processed. The analysis of these large amounts of data is usually very time-consuming and costly, so that technical big data solutions are often used directly where this data is produced or processed.
Variety (the variety of data sources and data formats require a different data analysis): The term variety describes the challenge of processing data of arbitrary semantics and structure in the big data topic. It is therefore a question of weakly structured amounts of data. In addition, the processing of data in different formats (e.g., TXT, CSV, XML, etc.) and the heterogeneity of the data quality are among the major challenges.
Velocity (the timely processing of data must be ensured): Since the beginning of the information age and the associated representation of information by digital data, the data rate has increased continuously. The data rate indicates the amount of digital data that is processed or transmitted within a unit of time. This continuous improvement of the technologies and thus the increase in the data rate represents a great challenge for the analysis of this data.
Veracity (the data quality determines the success of big data): In classic business intelligence (BI) systems, very high data quality is generally assumed on the basis of predefined models and schemes. Unfortunately, this high data quality is usually not available in practice due to the large amount of unstructured and semi-structured data. Therefore, a certain degree of uncertainty and a lack of trustworthiness must be dealt with in analyses. Good big data analysis solutions are able to identify this potentially lacking trustworthiness of data. This is an essential aspect, especially in automated decision-making.
According to Business Application Research Center (BARC,
https://barc.de/, accessed on 21 January 2021), companies expect most of the benefits of big data at a strategic level, but in order to really get the best possible benefit, it is very important that professionals from different fields work hand in hand. This includes IT specialists, business managers, and experts for collecting and evaluating large amounts of data. The main advantages of big data include the following [
13]:
Better strategic decisions,
Better control of operational processes,
Faster and more detailed analysis of data,
Improved customer service,
Targeted marketing campaigns,
Better understanding of the market/competition,
Lower costs,
Better product and service quality,
Better customer loyalty.
The professional analysis of big data can include competitive advantages, savings potential, and even new business areas. However, technical skills and specialist knowledge are not enough to achieve these advantages. Big data requires interdisciplinary thinking that brings together information from previously clearly defined areas. When big data is distilled and analyzed in combination with traditional corporate data, companies can develop a deeper, more insightful understanding of their business. This can lead to increased productivity, a stronger competitive position, and greater innovation, all of which can have a significant impact on the bottom line.
Despite the benefits of big data, it also has its problems and challenges. Companies have to invest in new IT systems. In addition, there are no standards and only a few ready-made solutions. It is also a huge hassle because, in addition to technical issues, users also need to consider their data organization and associated processes. The large amount of information as well as the variety and the short topicality also pose challenges for companies [
14]. Innovative big data strategies are of great importance in order not to sink into the data jungle. The creation of transparency in the database, in the data sources, and in the variety of data is very important in order to be able to manage, validate, and analyze data effectively at all. Anyone who does not know what information is available in what form is doomed to failure.
2. Materials and Methods
In this section, we briefly describe and discuss our materials and methods.
2.1. Data Processing with Hadoop as Big Data Technology
Hadoop is a technology that meets the needs of big data. It is horizontally scalable and designed as a software framework for processing very large amounts of data [
15]. Hadoop is an open-source implementation for Google MapReduce and is based on the simple programming model MapReduce [
16]. The Hadoop software is part of the Apache project and is a framework written in Java for scalable, distributed software [
16]. The Hadoop Framework handles the processing of details and allows developers to concentrate freely on the application logic. In addition, Hadoop is a well-known technology that is used for realizing big data. Large corporations such as IBM, Intel, and Oracle also rely on an extension of Hadoop support for their big data solutions. Hadoop has the following characteristics [
17,
18]:
Handles both structured and unstructured data,
Whether with a scheme or without a scheme,
Large amounts of data, in the terabyte/petabyte range, and all kinds of analytical aspects,
Their capacity can be expanded by adding additional clusters.
It uses commodity hardware to reduce costs. Many smaller servers enable scaling (scale-out) in smaller stages.
The Hadoop framework consists of three main layers. First the Hadoop Distributed File System (HDFS), and second the MapReduce [
16]. In the newer version branch 2.x of Hadoop there is also YARN (Yet Another Resource Negotiator), which abstracts from MapReduce and also allows the parallel execution of different jobs in a cluster. YARN is the resource manager of Hadoop and is responsible for distributing the requested resources (CPU, memory) of a Hadoop cluster to the various jobs. In this way, certain jobs can be assigned more or fewer resources, which can be configured according to the application and user.
HDFS is the first building block of a Hadoop cluster. It is a Java-based distributed file system that allows persistent and reliable storage and fast access to large amounts of data. It divides the files into blocks and saves them redundantly on the cluster, which is only slightly influenced and perceived by the user. If files are stored in it, it is generally not noticed even if individual files are stored on several computers. This implicit distribution of the data makes the file system interesting because it reduces the administrative effort of data storage in a big data system.
The MapReduce model is supported by Hadoop and is also Java-based. It was introduced by Google as a method of solving a class of petabyte/terabyte magnitude problems with large clusters of inexpensive machines. New, alternative algorithms, frameworks, and database management systems have been developed to resolve the rapidly growing data and its processing. The MapReduce framework is used for the distributed and parallel processing of large amounts of structured and unstructured data, which Hadoop typically stores in HDFS, clustered across large computers [
16]. MapReduce is a programming model to express a distributed computation on a massive scale. MapReduce is a way of breaking down each request into smaller requests that are sent to many small servers to make the most scalable use of the CPU possible. So scaling in smaller steps is possible (scale-out). The model is based on two different stages for an application [
19,
20]: (i) Map—an initial recording and transformation stage in which individual input records can be processed in parallel. (ii) Reduce—an aggregation or consolidation stage in which all related records are processed by a single entity. Two main advantages are associated with the consolidation stage.
Map task and logical blocks: The core concept of MapReduce in Hadoop is that the input (input data) can be split into logical blocks. Each block can be processed independently at the beginning by a map task. The results from these individually working blocks can be physically divided into different sets and then sorted. Each sorted block is then passed on to the reduce task.
Reduce Tasks: A map task can run on any computed nodes on the cluster, and multiple map tasks can run in parallel on the cluster. It is responsible for transforming the input records into key/value pairs. The output from all maps is split, and each split is sorted, but there is only one division for each reduce task. The keys of each sorted division and the values associated with the keys are processed by the reduce task. The multiple reduce tasks can then run in parallel on the cluster.
2.2. Use Cases for Hadoop
Hadoop can be used in many industries. For this reason, some example scenarios are provided in which possible problems can be solved using Hadoop. This is to help better understand Hadoop.
Customer analysis
- ○
Challenge: Why does a company lose customers? Data on these factors come from a variety of sources and are challenging to analyze.
- ○
Solution with Hadoop: Quickly build a behavior model from disparate data sources.
- ○
Structuring and analyzing with Hadoop: This includes traversing data, creating a graph, and recognizing patterns using various information from customer data.
- ○
Typical industries: telecommunications, financial services.
Modeling True Risk
- ○
Challenge: How much risk exposure does an organization really have with a customer? Analyzing multiple sources of data across multiple industries within a company.
- ○
Solution with Hadoop: Obtaining and accumulating disparate data sources, such as call recordings, chat sessions, emails, and bank activities.
- ○
Structure and analysis: sentiment analysis, developing a graph, typical pattern recognition.
- ○
Typical industries: financial services (banks, insurance companies, etc.)
Point of Sale (PoS) transaction analysis
- ○
Challenge: Analysis of PoS data to target promotions and manage operations. The sources are complex and the volume of data grows across chains of stores and other sources.
- ○
Solution with Hadoop: A number of processing frameworks (HDFS, MapReduce) allow parallel execution over large data sets.
- ○
Pattern recognition: Optimization across multiple data sources. Using the information to predict demand or demand.
- ○
Typical industries: retail.
Analyze network data to predict failures
- ○
Challenge: The analysis of data series in real time, from a network of sensors. Over time, calculating the average frequency has become quite tedious due to the need for analyzing terabytes of data.
- ○
Solution with Hadoop: Calculate this data by expanding from simple queries to more complex data mining. This gives you a better understanding of how the network reacts to changes. Separate anomalies can be linked together.
- ○
Typical industries: telecommunications, data centers, utilities.
Analyze research data to support decisions and actions
- ○
Challenge: The amount of data is increasing due to the enormous increase in internal and external data sources, but the time that is available to use this data is getting shorter and shorter.
- ○
Solution with Hadoop: Isolated data sources and data redundancy can be hyped up with the help of data analysis. Data analysis is one of the most important tasks of data quality. However, employees also want to know whether the quality of their research data is sufficient for informed decisions.
- ○
Typical industries: universities and research institutes, libraries.
In addition to the industries mentioned, an integrated Hadoop can also lead to more complex questions and hypotheses in the health sector. With the help of Hadoop, medical researchers are able to analyze huge amounts of data (several petabytes) in a short time in order to better analyze and prevent the development of diseases (e.g., cancer). Research doctors are primarily interested in ensuring that as much knowledge as possible, also from external data sources (e.g., databases on pharmacovigilance or clinical studies), flows into a research infrastructure. In this case, time-critical aspects are rather rare. However, interpretations of the results play a greater role here because medical questions are about the detection of novel patterns and not about the constant use of health data in a complex but well-known diagnostic process. Specifically, this means that the integration of methods and visualizations is very important in this case. The focus on new hypotheses also means that a lot more data and intermediate results or results may be saved than might appear appropriate for economic reasons. Further literature in the context of the processing of big data in medicine and health care can be found in papers [
21,
22,
23].
The areas of application of Hadoop include all areas that have to do with large, semi-structured amounts of data, that is, all areas that include big data. One of the most important advantages of Hadoop is that it can analyze large amounts of data in the terabyte, petabyte range. Since Hadoop splits or partitions the data into blocks and assigns the data to specific nodes for analysis, the data does not have to be uniform because each data block is processed by a separate process on a different node. So, the unstructured data factor of big data does not become a problem. Another advantage of Hadoop is the parallel processing of the data, which leads to a faster analysis speed. This is very helpful with big data as the amount of data is constantly growing. It is more useful if it is analyzed promptly or in real time. Even if the data is constantly growing, it is possible to scale Hadoop clusters by adding additional clusters.
Because Hadoop is open source, Apache Hadoop is free to download. This makes it possible to create a very powerful Hadoop cluster without incurring high costs. Another advantage is the replication of the data, which ensures the robustness of the Hadoop cluster. When data is sent to a node for processing or analysis, it is also replicated to other nodes in the cluster. If the node fails, the data can still be analyzed because additional copies of the data are available on other nodes. While there are many benefits to Hadoop, this does not mean it is always the best choice for enterprise data analysis. If a company does not work with large amounts of data in the terabyte or petabyte range, it makes no sense to use Hadoop, as it is suitable for large amounts of data.
2.3. «Hadoop Fusion» Approach: Performance Analysis of Concurrent Job Executions
How can big data processing capacities, which are required in the case of COVID-19, be assessed accurately? We were able to find a solution based on an existing performance model for Hadoop 1.x, but at the same time integrating architectural changes and the execution flow of the MapReduce job. The cost model which has to be built would then be an intra-job synchronization constraint generated by the contention at shared resources. The main goal to be reached is clearly targeted by the current literature [
19].
The authors summarize their conclusions as follows: “We chose to use heavy map-and-reduce input jobs (i.e., Wordcount1) that process large amounts of input data and also generate large intermediate data” [
24]. MapReduce performance models could then take advantage of the representations and processing capabilities of models of alternative choices and the expression of those choices to inform users at any time, in any context of using Map Reduce, so that they can choose the right type of processing on Map Reduce for themselves. Questions to be solved arise from the paper [
24]: (1) How to build the priority tree taking into account the dynamic resource allocation in contrast with the predefined slot configuration per map and reducing tasks in Hadoop 1.x. (2) How are the synchronization delays caused by the pipeline recorded that occur between the maps and the mixing phase of the reduction tasks?
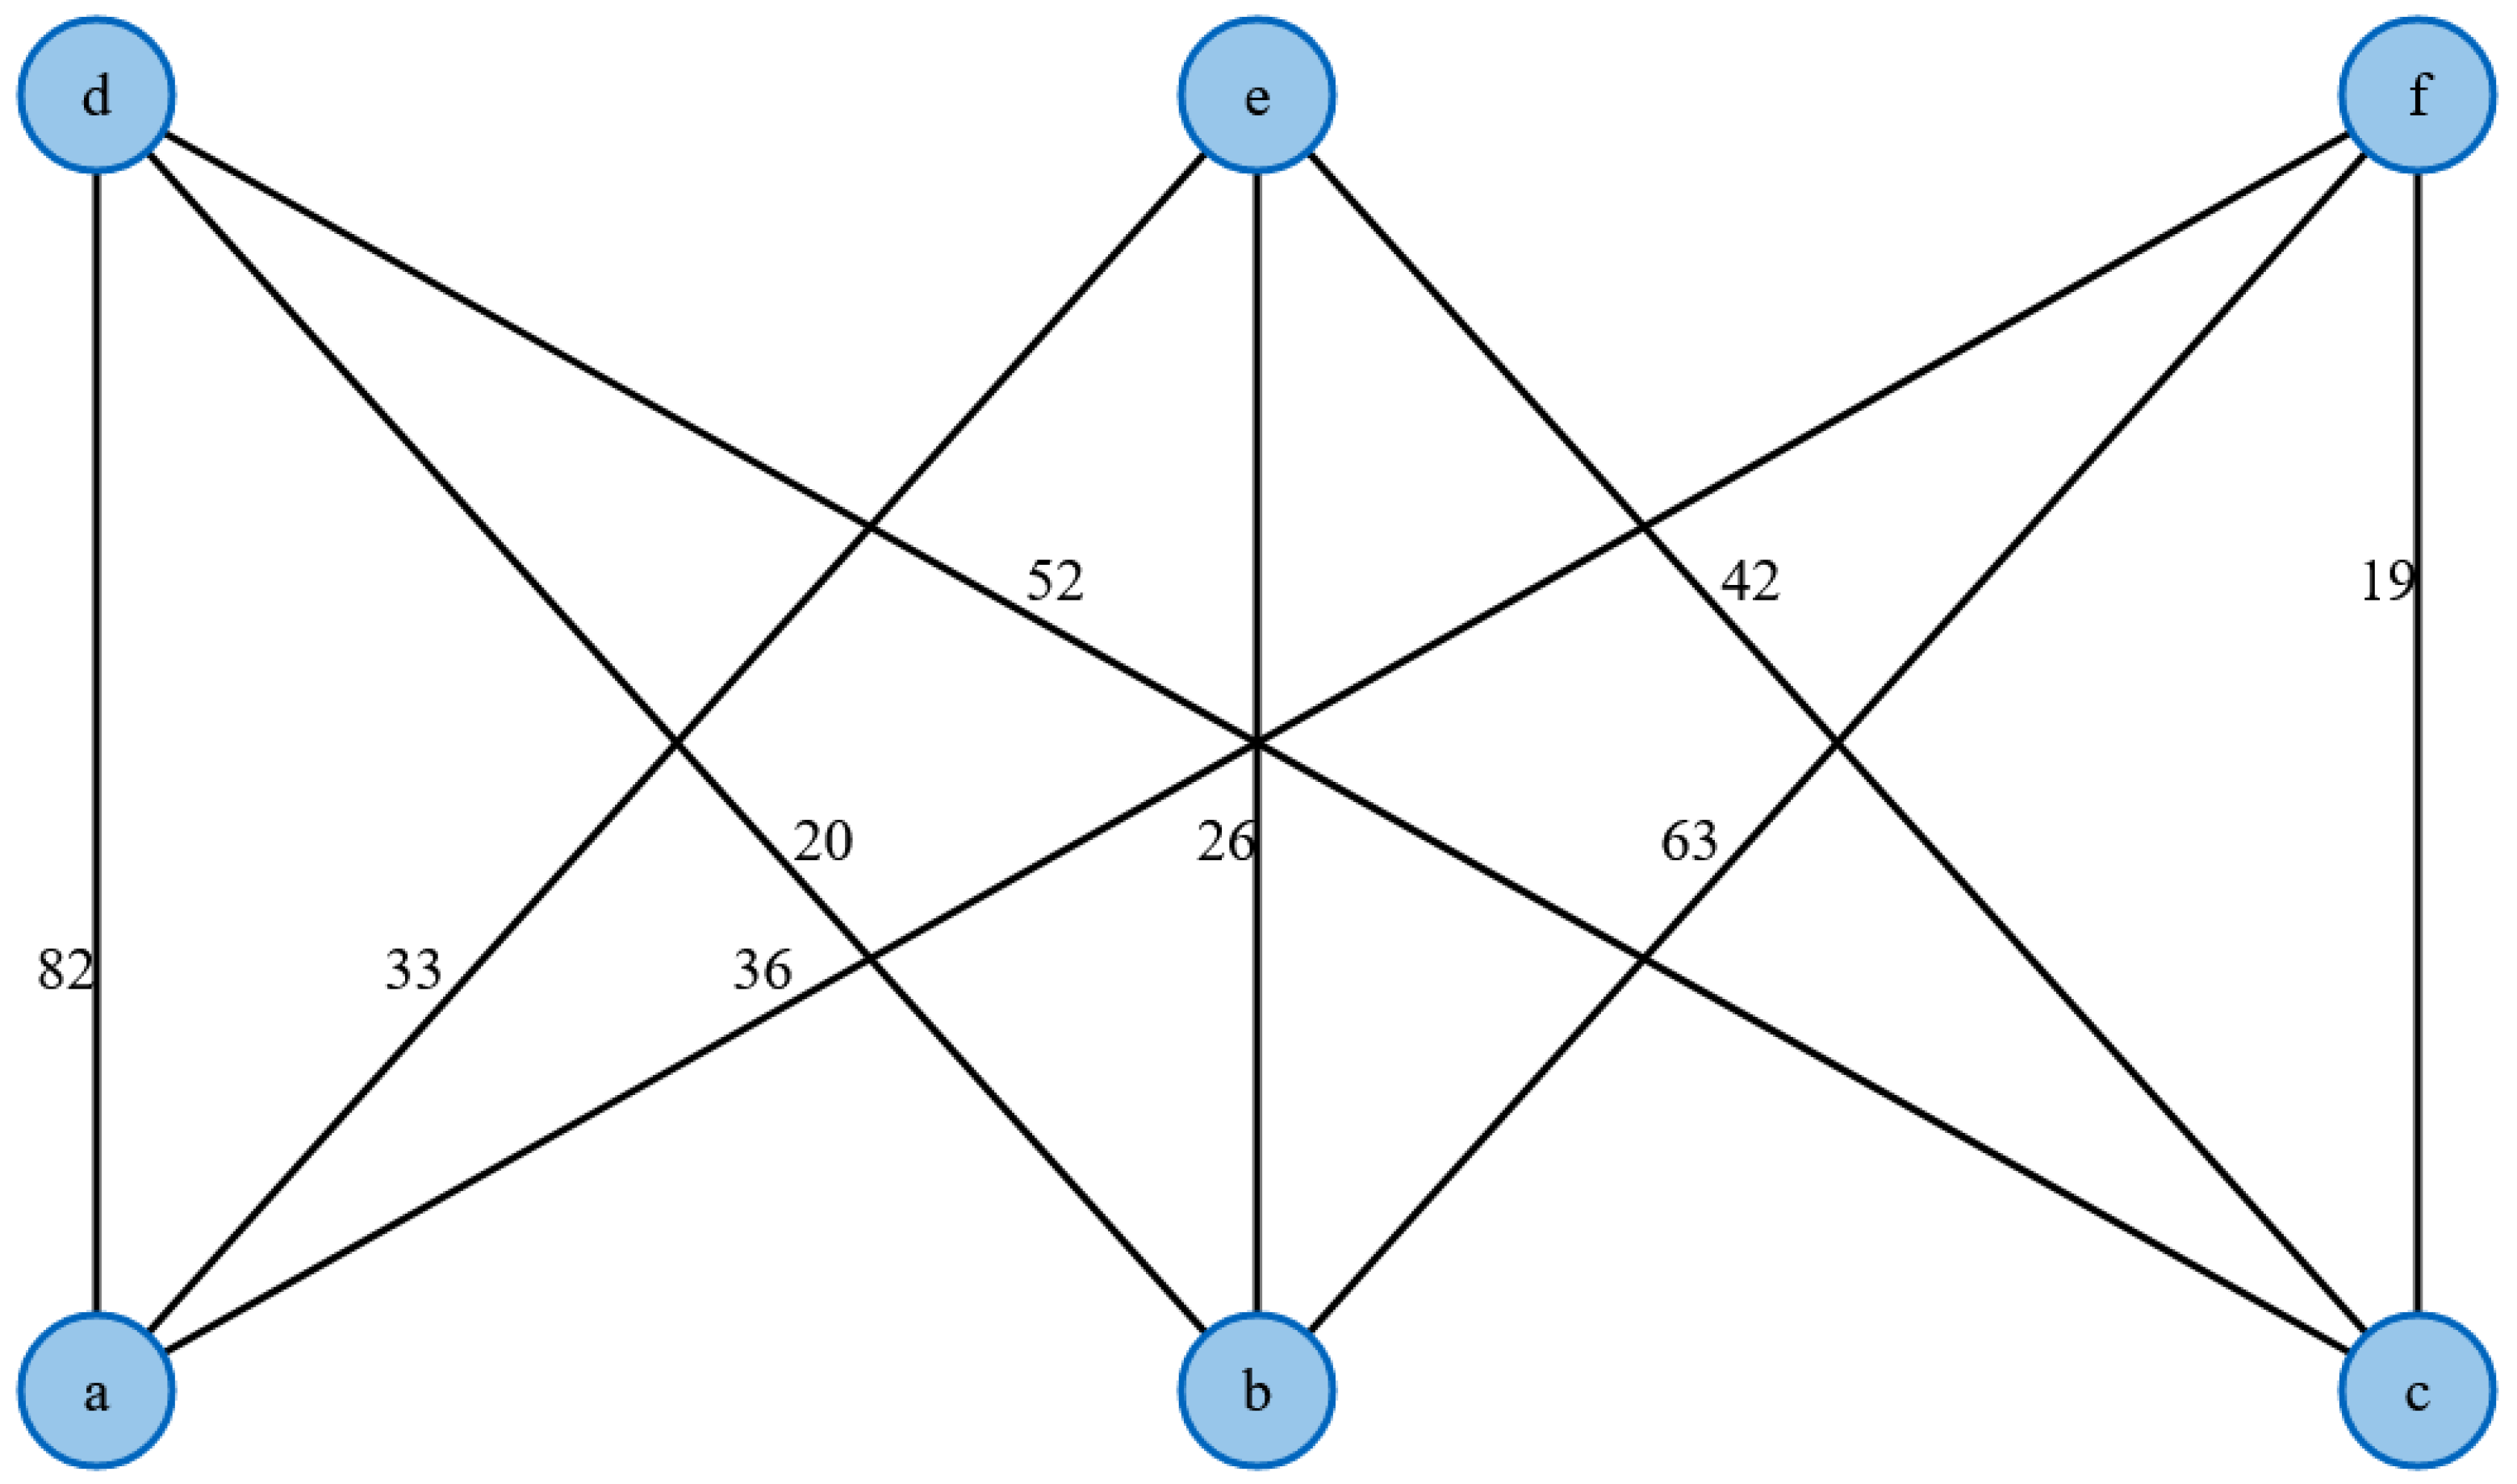
Optimization models are numerous and this is not the place to discuss a choice but to identify the strategic problem. Any combination of map tasks and reduction tasks can be recorded and figured as map (min, max) and reduce (max, min) and combined in vertices. While the corresponding time series of any combination can be represented in triplets, in which way the methodology of bipartite hypergraph operable partitions is developed, which represents a new way of information processing of only non-contradictory solutions of any kind of triplet [
25]. A bipartite graph is shown based on the example in
Figure 1,
Figure 2,
Figure 3 and
Figure 4 and the related code can be found under the GitHub link (
https://github.com/OtmaneAzeroualDZHW/Creating_bipartite_graph, accessed on 4 February 2021).
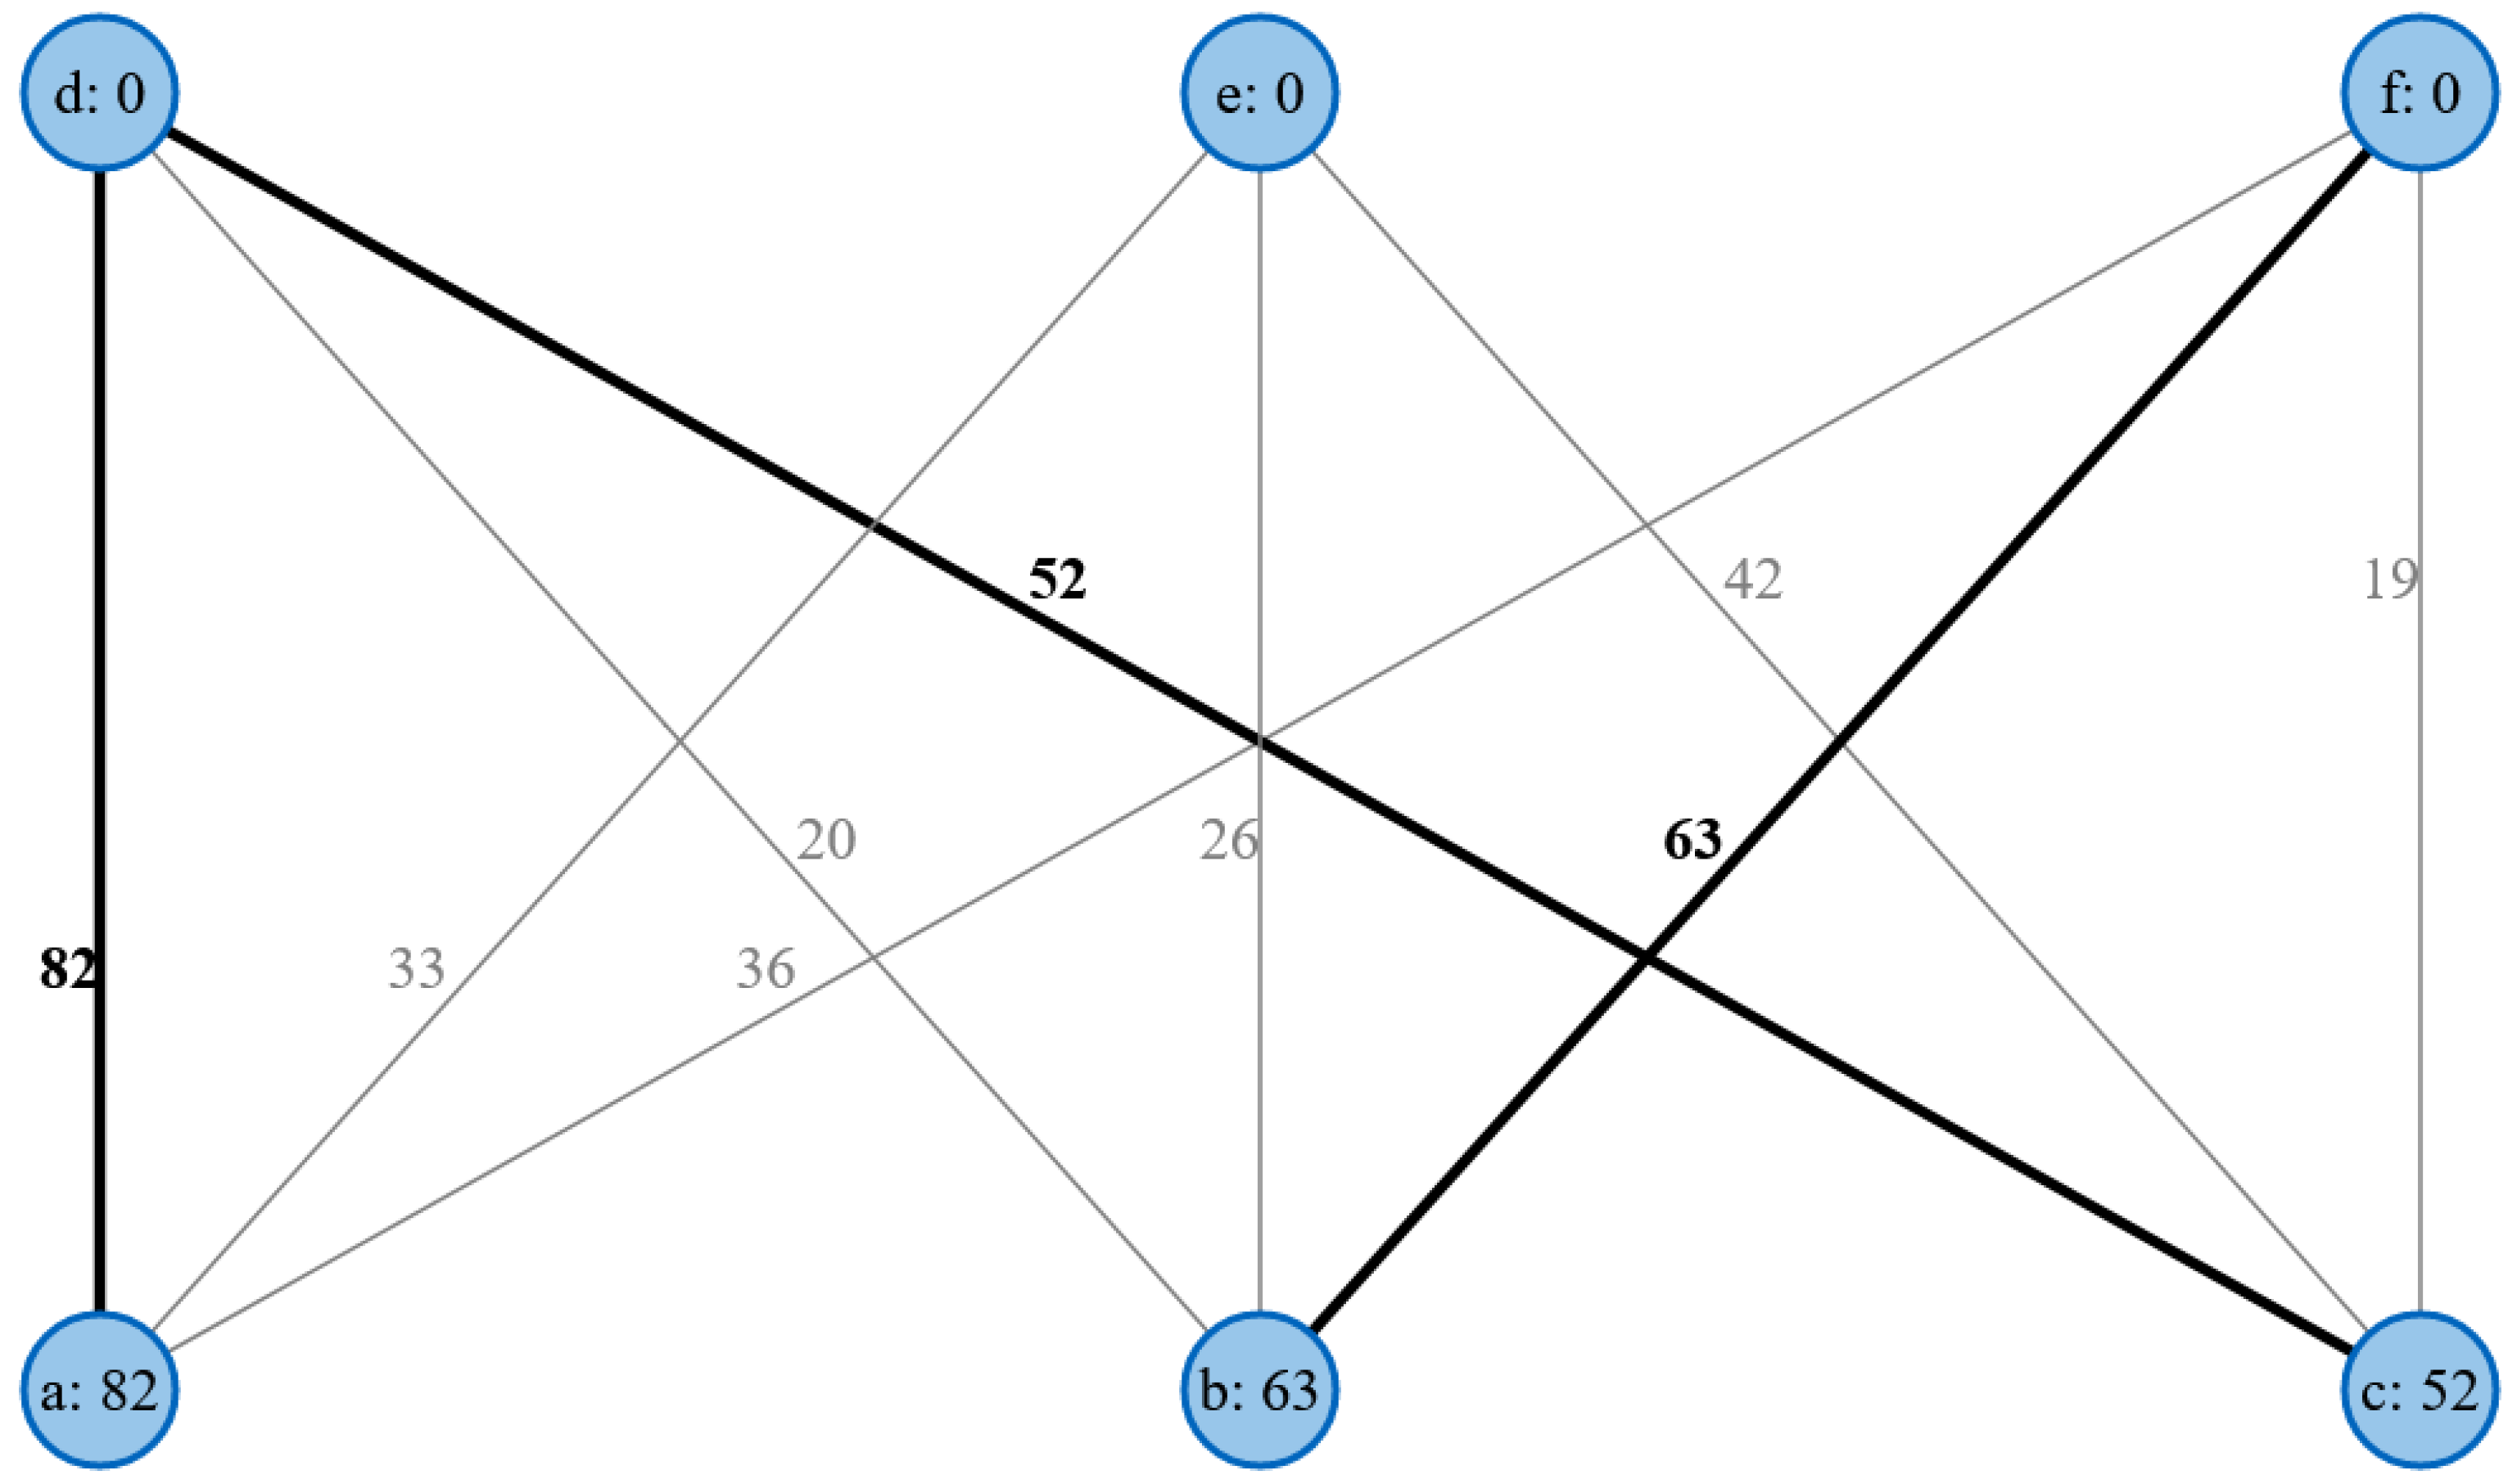
In this example, an equality diagram is generated where each edge weight is equal to the sum of the marks of both neighboring nodes. To determine the equality graph, the algorithm must find the maximum adjacent edge of each node and assign the node its weight as a marker. The equality graph is determined using the node markings (black), as shown in
Figure 2.
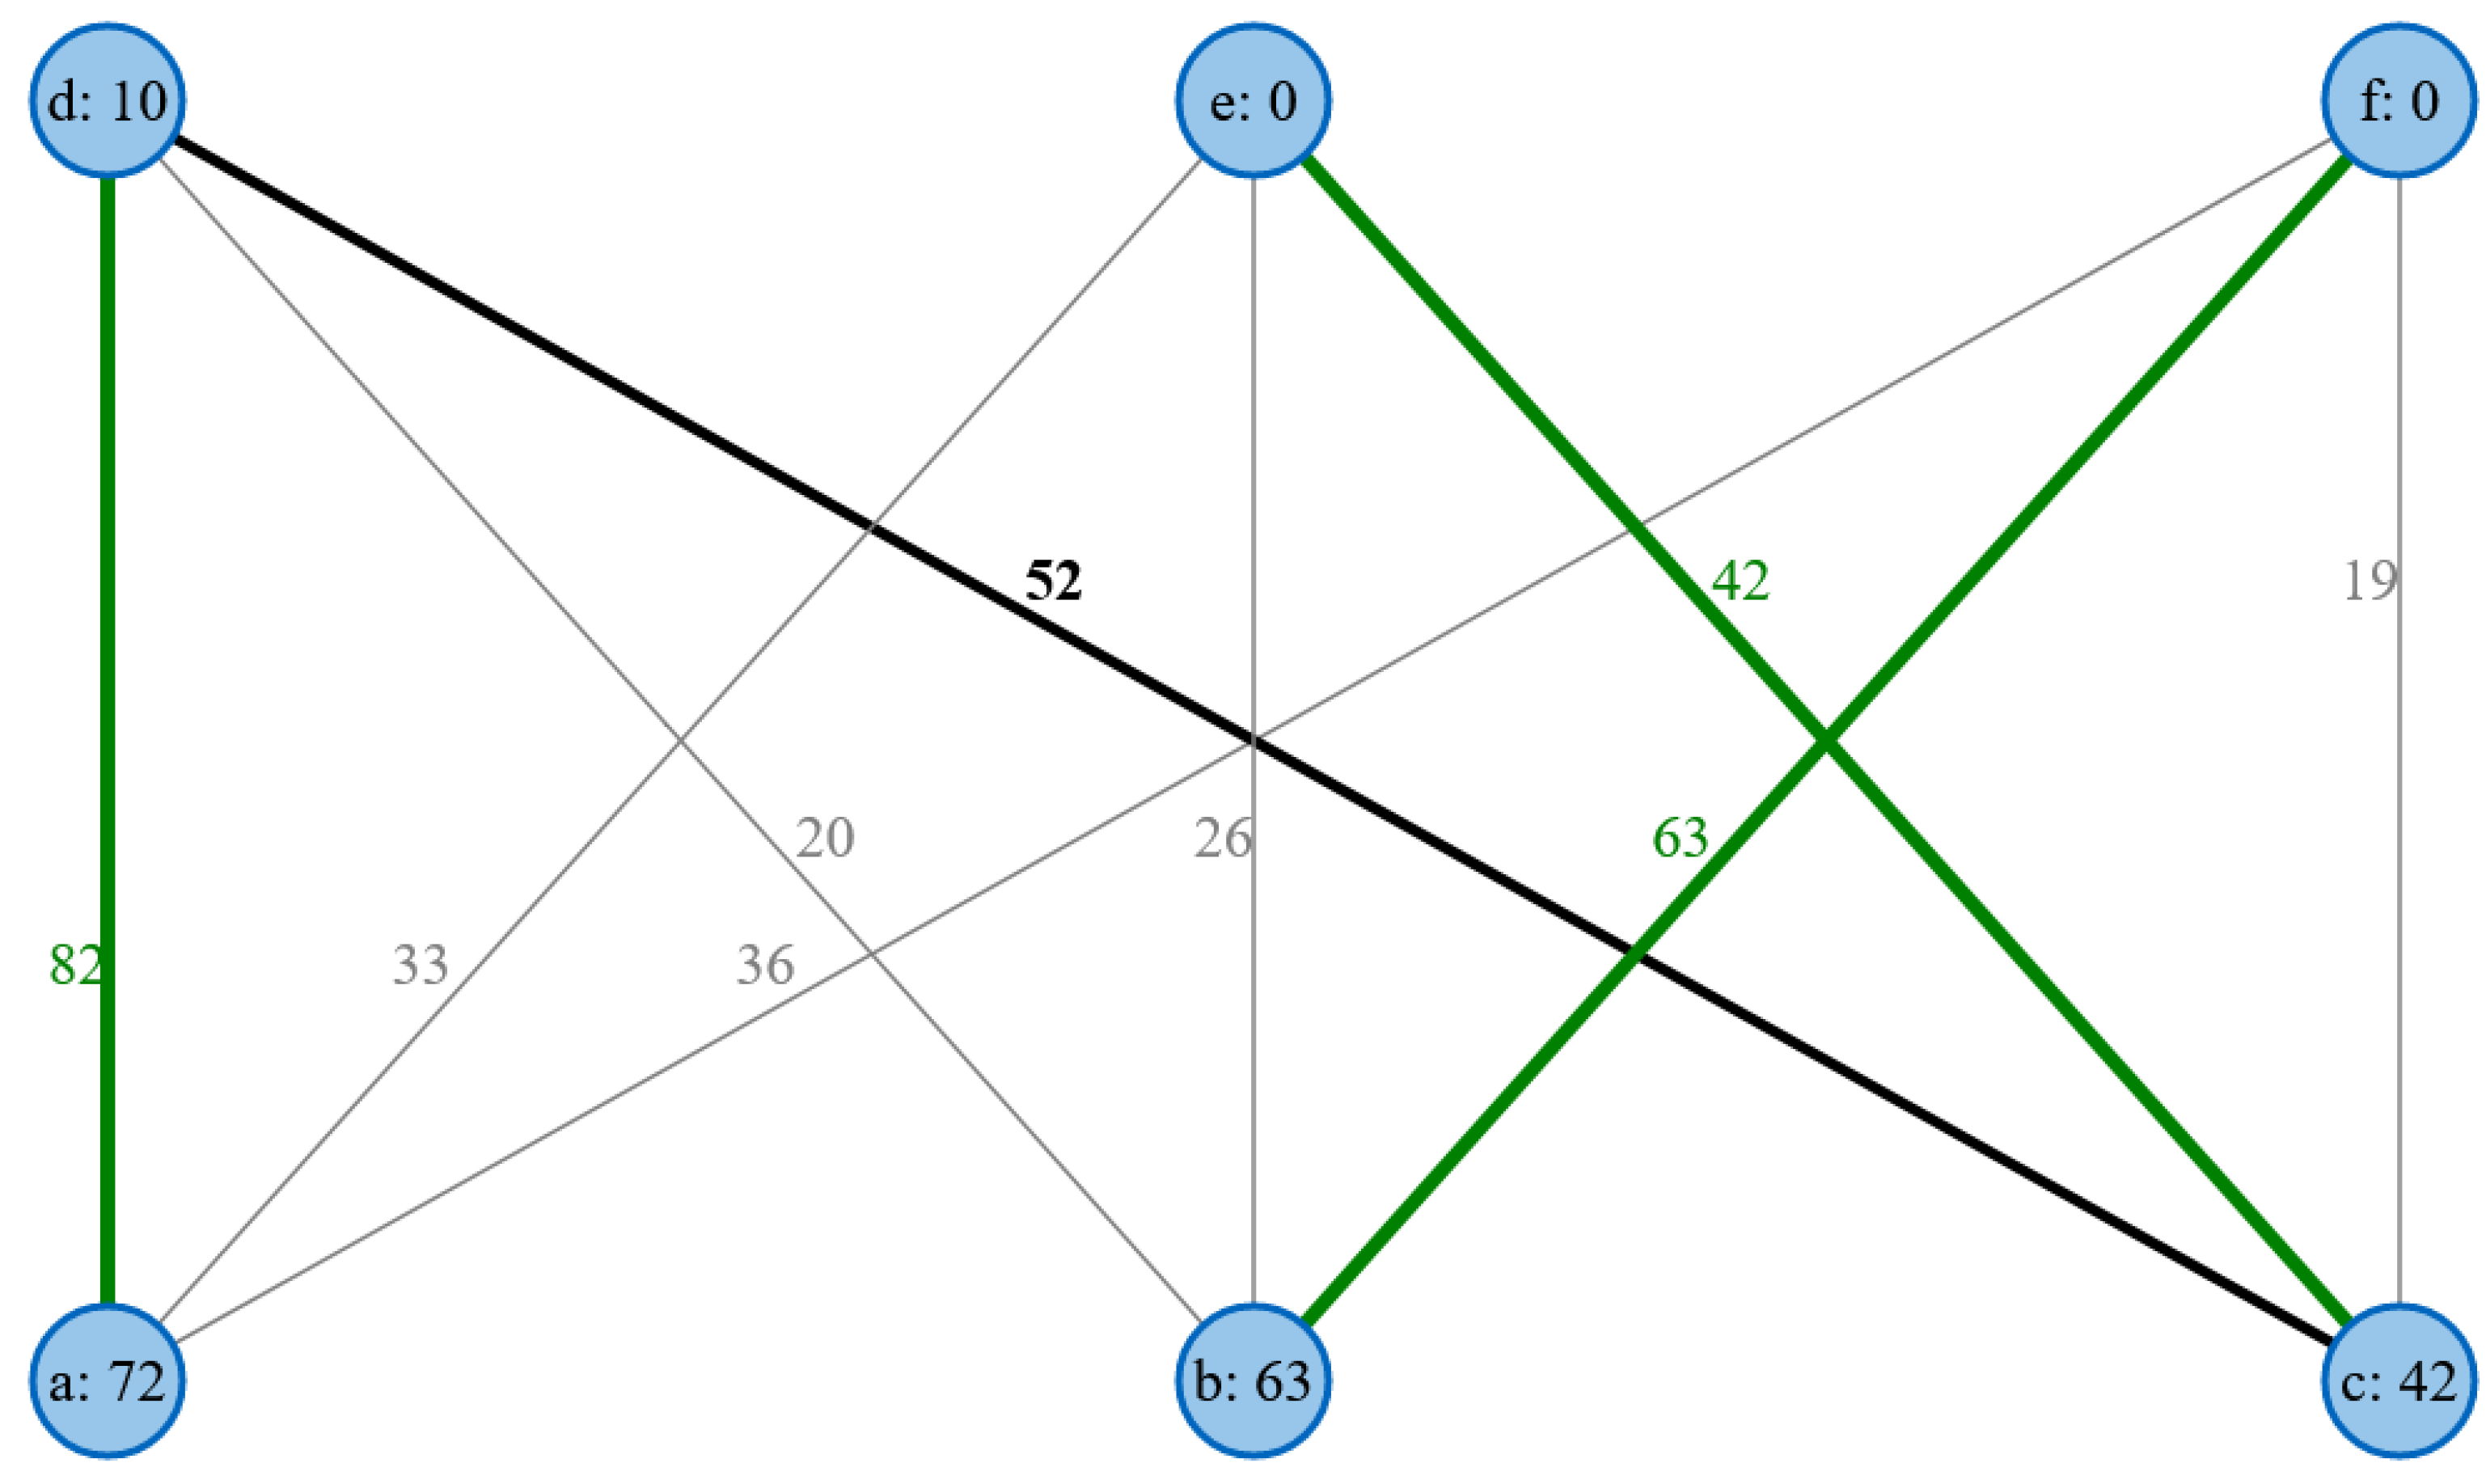
In order to carry out the matching, the algorithm must first determine an augmentation path. The matching could be supplemented using the augmentation path found. This can be seen in the green between the elements, as shown in
Figure 3.
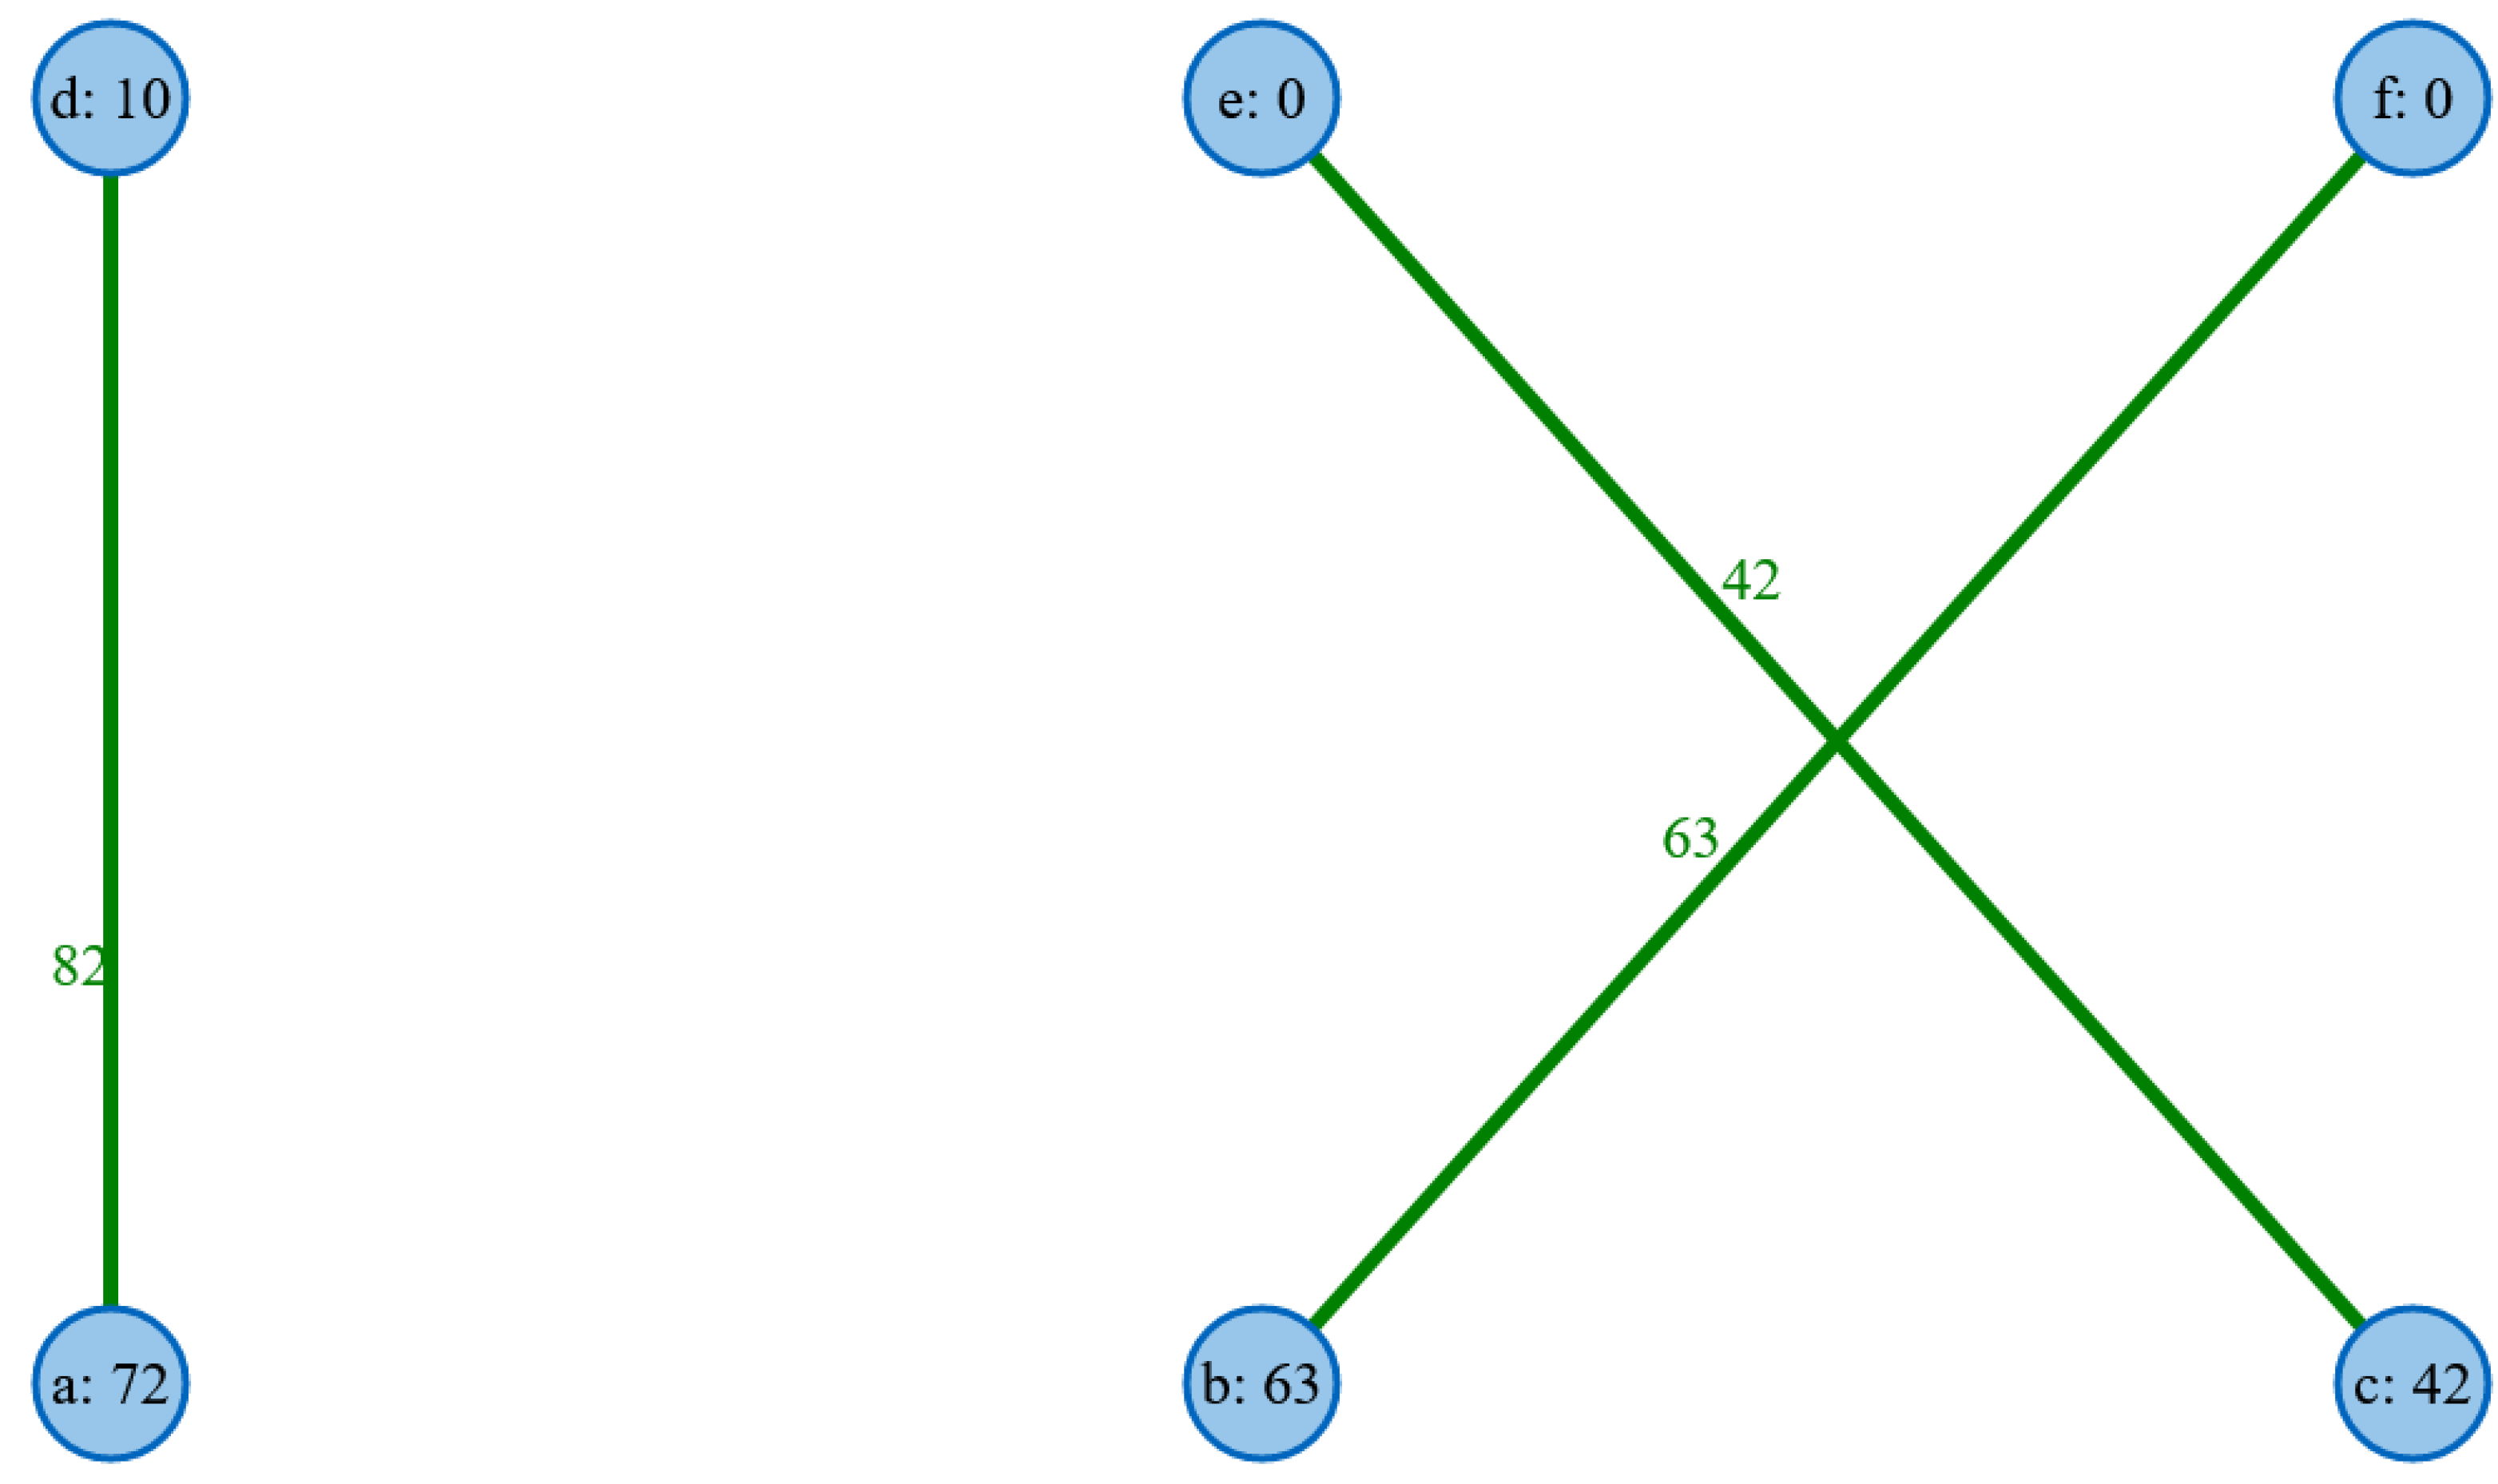
The optimal matching, which can be seen in
Figure 4, successfully determines a maximum match that gives the total weight 187.
Overall, one must carefully assess how to carry out model fusion within the Reduce tasks, as we note that procedures for the map tasks [
26] are most times straightforward to determine and that “the hitch comes when deciding how to carry out the models’ fusion within the Reduce task. At this point, the design depends on many factors, namely whether the sub-models are different and independent among them, or they have a nexus for being able to join them directly”.
We might consider that the Reduce stage can be analyzed as a fusion process that allows the mixing of partial models and information schemes into a final fused outcome. The fusion of models in MapReduce (MR) is typically performed following some sort of ensemble strategy that combines multiple assumptions through voting or attachment.
Other well-known solutions are available with at best the alternatives of Apache Spark and Flink, which differ in their “philosophy” as well as in their responses to data streams, offering “plenty of alternatives to coders”. Those solutions are addressed in [
27].
At least we could identify two models of fusion strategy: one is the fusion on partial sub-models and the other that distributes data and models to iteratively build a final exact system. Tested with huge data sets (Higgs Boson Data set supplied by experiments in Large Hadron Collider at CERN), this approach comes close to exact fusion solutions as both models provide the same predictive solution regardless the partition scheme used.
2.4. Data Structure of Information on COVID-19: Current Issues
Current issues indicate emerging trends towards fuzzy data flows and data structures on COVID-19, which are a common and well-known consequence of the data deluge in a shared new domain. The result is an overview of the current characteristics of the COVID-19 data structure from the related perspective of users and item issues. The first positive outcome is the end of the “valley of death” conditions of networks connecting academics and industry. Presently, publications and databases circulate on a global scale. However, this generates other problems such as overflow and heterogeneity of the information collected, which we will discuss in more detail.
It is well known that the processing of data by computer technologies makes decisive contributions to the resolution of massive health crises, as has been the case in previous pandemic situations [
28]. It helps researchers generate a better description, anticipations, and at the very least prepare for any strategic decision as experienced in the early phases of the COVID-19 crisis [
29].
In this context, the solutions provided by Hadoop are suitable for large volumes of semi-structured data. As a behavior model from different data sources with continuous data and functions for recognizing patterns in a graph, Hadoop analyzes multiple data sources and enables parallel execution on large amounts of data.
How does the current state of data collection and processing of the age of COVID-19 meet these favorable conditions? When evaluating challenges and opportunities, real cases are used using data science [
30]. Effects on global value chains can only be described in such a way that new approaches are required [
31]. The terms and conditions for taking into account the variability and complexity of big data involve analytical approaches returning synthetic data to refine predictive algorithms [
32].
Using analytics to address COVID-19-related issues in current management remains quite difficult; the unprecedented shock caused by pandemia is not challenged by epidemiological global models that are mostly driven by national governments. The deep need for models is confronted with business uncertainties in this special context. These models should encompass the future of work and consumer behavior, the effects on the poorest population groups as well as socially determined changes and unrests [
33].
Changes must be prepared in the behavior and ethics of the researchers themselves as “data science needs to stop feigning neutrality, and instead work collaboratively with domain experts and relevant communities towards forging socially beneficial solutions. As convincingly argued by prominent scholars across virtually all fields, including the emerging field of critical data studies to which the journal Big Data & Society is dedicated, it is imperative that data scientists take responsibility for their role in knowledge production” [
34].
Among big data’s most critical issues of COVID-19, is the renewal of privacy protection of individuals as it exists “central trade-off—increasing the probabilities of accurate user identification, at the cost of greater exclusions”, which coexists with “three forms of data injustice—legal, informational and design-related, previously identified in datafied social protection schemes”, which have to be monitored in the post-pandemic era. It creates needs for solutions that place “digitality within social protection schemes that expand user entitlements rather than constraining them. Implications of such reflections are drawn for the study of data-based social welfare interventions” [
35].
Empirically, we are facing major changes in overseas value chains as countries on the economic periphery take advantage of the global slowdown [
36] while the World Bank highlights the current problems associated with it. The “systemic nature” of the current situation is still unclear as the Organization for Economic Cooperation and Development (OECD) observes increasing supply chain risks, government blockades, and international trade disruptions.
2.5. Hadoop and General Conditions of Data Processing in Contexts of COVID-19 Issues
Overall, the model rules must meet two basic conditions: (1) innovation and (2) integration, in a context where the current literature expresses the opinion that complete coverage of COVID-19 data is already almost impossible [
37].
2.5.1. Innovation
While the current problem is unprecedented, we must find a solution within the scope of the predictive models in place. This does not mean that we have to find solutions from the information processing of existing solutions. In this way, the graphical exploration capabilities could be of great help. The first approach is to mix industrial and academic knowledge in an integrated vision, which could thereby save mobility and creativity on both sides [
38].
Overall, there is room for in-depth and powerful research on knowledge modeling, which today provides results on an unprecedented scale in the field of already known methods of data processing. There are now indications of new possibilities for anticipating real experiences. Far from the earlier notions of stochastic modeling and statistical causal inferences, “meta-learning” is underway and begins with the conceptualization of web-scale queries and the generation of data from click graphs [
39].
At least, due to the extension of complex data sets and the multiplication of definitions of new categories of heterogeneous situations, innovation must respond to the need for a permanent and efficient interaction between “intelligent” information and human choices, as Michael Jordan states: “We will need well-thought-out interactions of humans and computers to solve our most pressing problems. And we will want computers to trigger new levels of human creativity, not replace human creativity (whatever that might mean)” [
40].
2.5.2. Integration
Integration is a challenge from every point of view; knowledge thinking develops in this way [
41]. What is more directly reachable here is the functional advantage of scalability from the user point of view. Graph users can be specialists as well as non-specialists and it is also in that range of application that scalable function of expression of user preferences finds its benefits with Hadoop. Domain-specific search engines give a good example when the zooming function of preferences has to be mobilized for the expression of non-specialists, from a scientifically structured publication database [
42], and explore Scientific Knowledge Graphs (SKGs) with my Domain-specific Insight Graphs (myDig) systems.
In that direction, there is a matter of rhythm in knowledge acquisition that Hadoop can easily handle. The research question of navigation regulation can be understood from a navy metaphor on sailing routes and team shaping. The comparison between flotillas, in which each boat sails on its own route regulated only by the energy of its engine, and squadrons in which the speed of any vessel is aligned with the speed of the slowest vessel, gives the two extreme models which could be kept for the speed of knowledge acquisition. Both have their limits within which modeling of “target routes” must be set to leave the level of knowledge acquisition of the entire group set within a common optimized limit (such as the speed limit on highways) otherwise the whole group would lose any potential advantage linked to sufficient data synergies between users of the same system and a positive feed of user-generated content.
The integration of competition between multiple agents, multiple tasks and audiences has been tested in healthcare applications of Hadoop, with respect to outcomes such as patient classification and disease diagnosis. Hadoop manages health monitoring and assessment tasks in combining remote sensing devices and the big data technologies, in real time applications [
43] due to Hadoop’s “data analytical techniques for data analysis and classification”.
Other ways of data integration come from Hadoop-based file organization that manages efficient storage of heterogeneous data. Mutual help and integrated functionalities of Hadoop and Knowledge Graphs are at work in emerging efficient solutions like Hadoop-based storage architecture for knowledge graphs. These solutions solve problems linked to big RDF data processing. Design strategy is based on semantic analysis properties of knowledge graphs, which offer a wide range of applications in health care and crisis management. We have an example with SemStorm, which defines itself as a “Hadoop-based indexed, polymorphic, signatured file organization that supports efficient storage of data collections with significant data heterogeneity” [
44].
Overall, distributed processing solutions like Apache Spark SQL, in addition to Hadoop, are gaining in popularity in the semantic representation of structured and unstructured data on knowledge graphs based on RDF and SPARQL [
45].
2.5.3. Cases in Which Those Conditions Are Challenged
Current developments of COVID-19 crisis management in its most critical tools like the Geographical Information Systems (GIS) are implemented in conditions where innovation and integration are both required to supply processing and data analysis at a very large scale [
46], with both aiming at controlling spatial data errors and spatial data query analysis and “this tends to occur mainly through batch processing technology such as MapReduce and distributed system infrastructure such as Hadoop” [
47].
With Hadoop, real-time visualization of COVID-19 indicators is an ever-growing application of GIS systems that is being developed for the uses of populations threatened by infections as well as for the political decision-makers for scalable territorial actions. These applications for prevention, intervention, and recovery are spreading rapidly with the development of voluntary geolocation systems to identify close contacts of potential carriers of the virus [
48]. Surveillance of the epidemic situation is therefore linked to challenges for the processing and analysis of big data, as this fact is currently highlighted by the literature in terms of technological capacity, tests are still lacking to identify the way it works, and it remains the need for comprehensive studies and answers.
3. Results
After explaining the Hadoop technology and its possible potential use in different areas, we now want to present our developed solution in this section, which allows the processing of large amounts of data in clusters. MapReduce is often incorrectly compared directly to relational database systems and presented as an inefficient way to manage data. The criticism overlooks the fact that MapReduce is not a database system, but a programming model with which data can also be evaluated, but which is not limited to this. In general terms, Hadoop and MapReduce can be used to solve tasks whose input data can be easily partitioned into pieces so that they can then be processed as independent sub-problems, which correspond to the division of data into individual blocks in HDFS. Examples of this are searching through text files or converting their format.
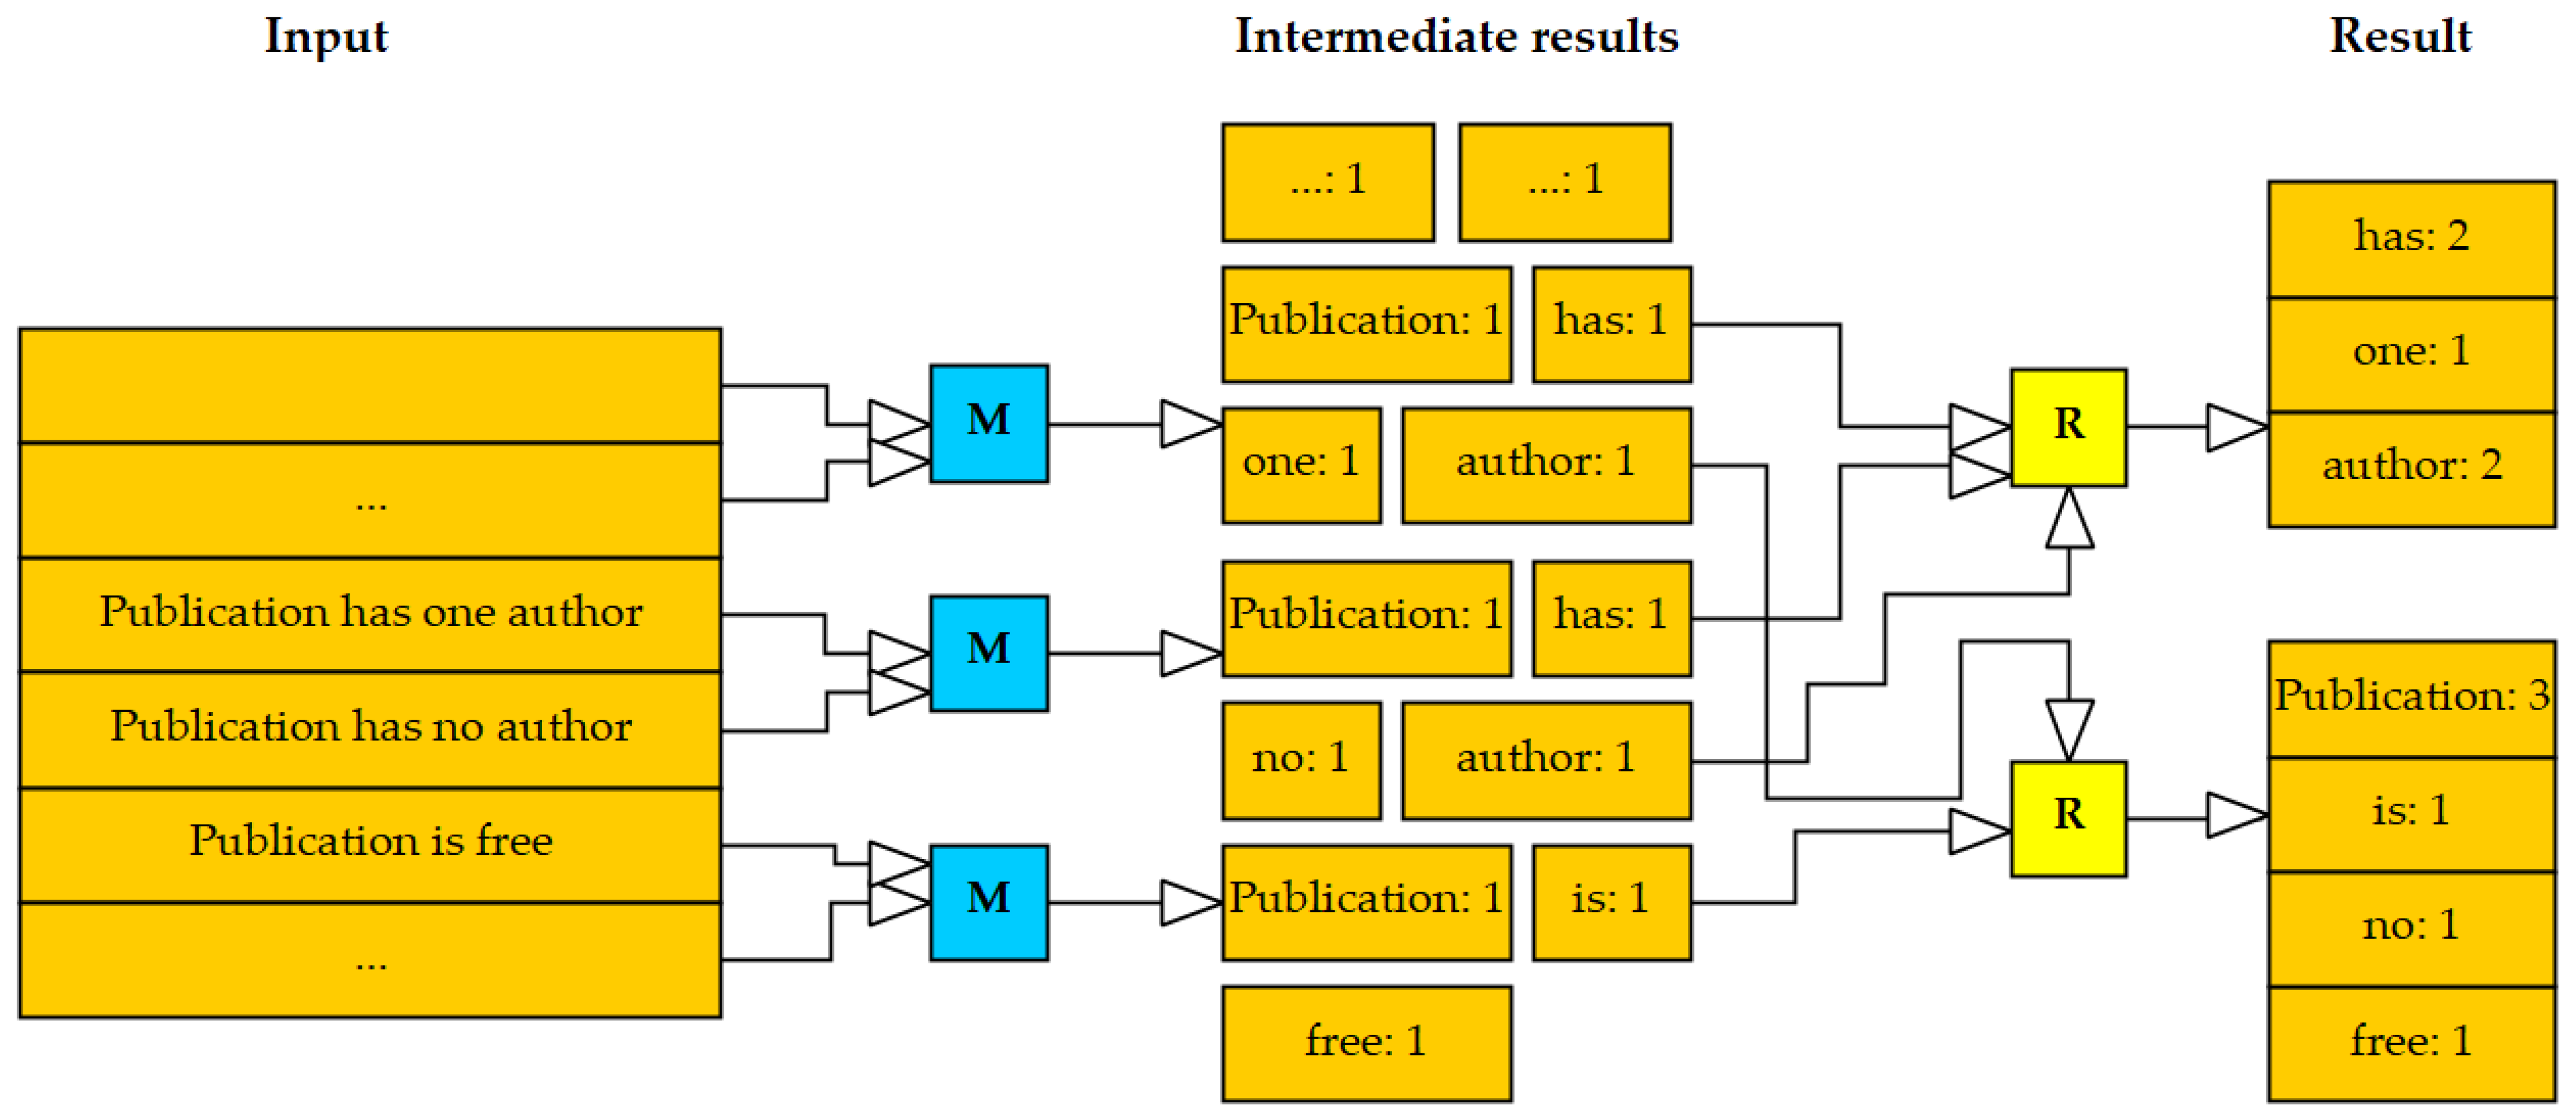
Figure 5 shows a schematic representation of the functionality of a MapReduce as a core component of Hadoop using the example of WordCount. The task is to make a list of the number of times each word occurs in a text. The mappers (M) produce intermediate results that are summarized by the reducers (R). The program code for the MapReduce example including the package will be available and downloaded from the following GitHub website (
https://github.com/OtmaneAzeroualDZHW/MapReduce-in-Hadoop, accessed on 4 February 2021). MapReduce program code has been written in Java. However, it can also be coded in other programming languages such as Python, R, C ++, etc. These program codes will process different data that are stored in various files and database systems. The aim and focus of this paper is to introduce a simple MapReduce programming framework that is extremely easy to set up and use. The simplicity of setting up and expanding our solution enables the users to start small in order to test their ideas for processing the big data. As soon as the idea is mature, scaling can be done very easily.
As shown in
Figure 5, the calculation receives as input a list of pairs consisting of the document name and the document content. For WordCount only the content is relevant, but there are tasks for which key-value pairs are necessary, such as the number of words per document. The output of the calculation is a list of pairs consisting of a word and its number in all input documents. The following pseudocode (Algorithm 1) implements this task as a map and reduce step.
| Algorithm 1 Hadoop-WordCount as pseudocode |
| 1 | map(String key, String value): |
| 2 | //key: document name; value: document contents |
| 3 | for each word w in value: |
| 4 | EmitIntermediate(w, "1"); |
| 5 | reduce(String key, Iterator values): |
| 6 | //key: a word; values: a list of counts |
| 7 | int result = 0; |
| 8 | for each v in values: |
| 9 | result += ParseInt(v); |
| 10 | Emit(AsString(result)); |
The flow of the code can best be illustrated using a concrete example. Three documents are entered as name-content pairs (Algorithm 2):
| Algorithm 2 Documents as a name-content pair |
| 1 | ("doc_I", "Publication has one author") |
| 2 | ("doc_II", "Publication has no author") |
| 3 | ("doc_III", "Publication is free") |
The map function is called once for each of the input documents. For each of the words in the document, it produces an output pair consisting of the word and a “1”. The following intermediate results result from the call (Algorithm 3).
| Algorithm 3 Map Function |
| 1 | map("doc_I","Publication␣has␣one␣author")= {("Publication", "1"), ("has", "1"), ("one", "1"), ("author", "1")} |
| 2 | map("doc_II", "Publication␣has␣no␣author")= {("Publication", "1"), ("has", "1"), ("no", "1"), ("author", "1")} |
| 3 | map("doc_III", "Publication␣is␣free")= {("Publication", "1"), ("is", "1"), ("free", "1")} |
The execution environment summarizes the results of all map calls. It generates a list of ones for each word found. The reduce function is then called for each pair of a word and its associated list of ones. It adds up the ones and thus produces all parts of the end result, which the environment then combines into a list (Algorithm 4).
| Algorithm 4 Reduce Function |
| 1 | reduce("has", {"1", "1"}) = ("has", "2") |
| 2 | reduce("author", {"1", "1"}) = ("author", "2") |
| 3 | reduce("one", {"1"}) = ("one", "1") |
| 4 | reduce("no", {"1"}) = ("no", "1") |
| 5 | reduce("Publication", {"1", "1", "1"}) = ("Publication", "3") |
| 6 | reduce("is", {"1"}) = ("is", "1") |
| 7 | reduce("free", {"1"}) = ("free", "1") |
It can be seen that all calls to map and reduce are independent of one another. The calculations can be carried out on a cluster. The example also shows how much work a MapReduce execution environment—in this paper Hadoop—saves the programmer or user when analyzing large amounts of big data. It takes over the division of the input quantity into small partial calculations, the summarization of the partial results, and the assembly of the final result.
With MapReduce, the typical problems that classic relational databases have with processing large unstructured data volumes can be eliminated. Another decisive advantage of MapReduce compared to other distributed methods of data processing is the low load on the network, since not the data but the programs are sent over the network. Another advantage compared to other methods of data processing in the context of big data is that the data does not have to be partitioned beforehand according to predefined criteria. The functions of MapReduce are relatively easy to program, and the effort to change for other suitable use cases is relatively low. MapReduce is particularly suitable for horizontal scaling and can therefore deal with use cases that have rapidly growing databases. In addition, both the error handling in the event of failure of a node in the cluster and the distribution of the programs are automated.
4. Discussion
Hadoop MapReduce is relatively fault-tolerant and can handle hardware failures well as long as there are enough functioning computers in the cluster. In order to further simplify the use of the system for the programmer, the MapReduce framework in Hadoop takes care of all partitioning, scheduling, error handling, and communication tasks. In general, one can say that MapReduce offers a cheap way to process large amounts of data in parallel and quickly, which are available in an unstructured or semi-structured form. Developers do not need any special prior knowledge to create the map and reduce functions, as long as the required calculations can be mapped to this simple model. However, if tasks are to be carried out that cannot be transferred one-to-one to the MapReduce schedule, then MapReduce reaches its limits and empty mappers have to be executed, for example, which read and write data unnecessarily and thus limit efficiency.
In this paper, we have verified the benefits of Hadoop MapReduce solutions, which, to the best of our knowledge, are clearly highlighted due to their technological capabilities to tackle massive big data challenges, as this paper has pointed out that Hadoop MapReduce conciliates “integration” (processing of vast heterogeneous categories of data in a common processing solution) and “innovation” (find out associations of new “flexible” models and/or sub-models of data integration). Here, however, we are reaching the limits of verified certainties as we currently lack certified results on big data processing regarding COVID-19 events. We need additional results on the anticipation of the dynamics of the pandemic, on the efficiency of various national and/or therapeutic approaches, on the various systemic alternatives of means and ends which are currently at work at the global level.
All those issues, which are all typical results of Hadoop-like big data processing at a very large scale, are not currently available and it could be exceedingly bold to dare expressing certainties about coming results of that kind. Nevertheless, in the course of the discussion of our paper, we can highlight the elements of threat to safe and efficient future uses of big data and the corresponding elements of positive solutions that appear to us. We will thus discuss those contradictory elements still pending, in the present time of deep uncertainty.
The first threat is to the quality of data standards. Scientific knowledge tackles identified difficult challenges of reproducibility and replicability [
49] while it also has to confront unstructured data on a wide range of new data objects, like sentiment analysis at large scales, or screening of close contacts, interacting massively with scientific results. There are thus sources of fragility on both sides.
The second threat is to the integration of data sources. The main source of data for COVID-19 is the scientific results which are numerous and “open” at the global level but, as identified in the first threat already mentioned, are potentially heterogeneous in terms of integrity and relevance. This leads to an unusual threat to systems of integration of data sources and sense-making for expertise. A debate is now open on the solutions of question answering systems (knowledge-based or information retrieval-based) such as the basic article citations which still feed the well-known information retrieval techniques for scholarly papers and their analysis, while altogether knowledge graphs appear sometimes as alternative ways of access to expertise. Either way, recent observations in “nature” regarding a severe “replication crisis” should be taken into account [
50].
Faced with these threats, the positive solutions brought by Hadoop MapReduce are of course not a panacea, but with the support of the referenced advantages described by this paper, they represent decisive tools to promote massive resilient responses that have the advantage, for the first time in history, to be shareable on the scale of the whole of mankind, as are currently the results for COVID-19. Further works for big data solutions should focus on the best of flexible and innovative technological development in computer science, relying in particular on advances in the natural language processing (NLP), and semiotic analysis. It is not a question here of finding solutions by means of automatic processing but of promoting the best combinations of information for the best consensual choices of experts.
As a recent paper coined it out, there is, with the COVID-19 crisis, a new opportunity for science and society mutual recognition; this at least has to be recorded in data challenges [
51].
5. Conclusions
It is time now to find information retrieval techniques that could fit with such a challenge and we are aware that they are not available yet, but that conditions to let them appear are strongly evidenced by the Hadoop toolkit as well as with a series of innovative applications of knowledge reasoning with graphs. There are many reasons to believe that solutions are close to us. Which ones? First, the questions are global and the answers are local, which is always the best way to bestow expertise and common sense as well as operational links between any type of “goodwill” approaches with highly referenced software like Hadoop and local talents of highly skilled developers. Second, we face a common threat, and this is a unique and strong opportunity to unify our information-sharing attitudes. We must consider the unprecedented break in commercial barriers in the publishing industry to imagine similar solutions emerging in the software industry. This could be the case in the perspective of a “Hadoop Fusion” approach on which we plan to offer several principles of common codification in a subsequent paper. Finally, there is a third reason which is, in our opinion, the most stimulating: “integration” has been described just a bit earlier as a strategic condition for data processing in the context of COVID-19, and we suggest that this last condition be developed in various contexts in which knowledge learning is at work to create optimization between data production of “flotillas” and data production of “squadrons”. As a research question, this last challenge is a stimulating idea in the flourishing industry of user-generated content. These new data products are difficult to describe and build. Social media, as a source of sentiment analysis about the dynamics of COVID-19, remains controversial [
52].
Challenges for data processing of massive heterogeneous data, unstructured as well as structured, are unprecedented. Estimates of needs are starting to become available, such as that of [
34] who observes the very wide scope of data use involved in the COVID-19 era, with a vision which “is typically linked to specific expectations about what technical, human and institutional resources (including methods, skills, and supportive socio-economic conditions) should ideally be developed and combined in order to effectively use data to address the emergency, without however presupposing that such resources are readily available”.
This includes post-pandemic predictive modeling on an unprecedented scale, that is, on a mankind scale. It will include the best of big data capabilities and models in the directions we have discussed above, while it has to secure new capacities in assessing “the extent to which epidemic modeling has aligned with the rise of big data, and related expectations that the volume and variety of the data could make up for problems in sourcing, sampling and calibrating the data”. This will of course rely on supported Hadoop-like modeling.
In summary, Hadoop MapReduce is a powerful technology that deals with handling large amounts of data. The technology offers a systematic solution for data storage, data processing, system administration, and integration of further modules. Hadoop can serve as a flexible processing and analysis tool for all types of data and can be used as an inexpensive framework in both small and large businesses.
Our future work will provide a practical insight into the further development of MapReduce applications in areas where we mention critical applications of the Apache Hadoop system to the COVID-19 issues mentioned above.


