1. Introduction
Artificial intelligence (AI) [
1] refers to the ability of human-made systems to mimic rudimentary human thought. The term “artificial superintelligence” [
2] goes beyond this primary ability of AI; it refers to the capability of human-made systems that can surpass humans. For example, they might even be able to rapidly discover hidden motifs or patterns in the data and then make predictions, while humans might find it very challenging to apperceive these hidden patterns within the mind, or perform similar feats at the speeds and performance levels that these systems can. To be clear, it could be argued that an AI system does not care about the need to prove to humans that it has achieved human-like consciousness (also referred to as the state of “singularity” or “artificial general intelligence”) in order to be validated, certified, or given the stamp of approval by humans, so that it can properly be accorded a definitional label of its level of AI. There would probably be no notifications from AI systems the day they autonomously become self-aware, regardless of whether humans like it or not.
Meanwhile, in lieu of that fateful day, researchers have observed in studies that we already have artificial superintelligence working inconspicuously and tirelessly in our midst [
3,
4,
5]. In the field of education, since the 1950s, AI deployed in the form of adaptive learning systems (ALS) [
6,
7], which are contemporary forms of intelligent tutoring systems (ITS) [
8], have been utilized to assist teachers in the training of students [
9]. Great strides have been made by researchers and commercial companies toward creating ALS that are powered by artificial intelligence, and perhaps, even superintelligence [
2], in the sense that some of them have—dare I say—already surpassed the human teacher in terms of the ability to relentlessly perform the task of one-to-one tutoring, initiate progress checks, and conduct remediation. They can concurrently perform these tasks, perpetually to an unlimited number of students, round the clock, whenever and wherever the students choose to learn [
10]. The developers of ALS and the researchers who field-test them have often lauded improvements in learning gains, and efficiencies of learning similar amounts of subject content in reduced amounts of time [
11]. The primary function of an ALS is to educe (draw out) the learning abilities of the students by making them solve problems [
12].
The advent of AI has enabled advanced developments of ALS. In recent years, an artificial intelligence-enabled adaptive learning system (AI-ALS) might utilize, for example, a variant of the AI-based Bayesian Knowledge Tracing (BKT) [
13] algorithm, or some other proprietary algorithms formed from an ensemble of multiple AI-based methods to make “adjustments in an educational environment in order to accommodate individual differences” to provide a personalized learning experience for each student [
14]. An example of a procedure that an AI-ALS might use to interact with the student is: (1) present the student with a topic or sub-topic to learn, (2) present the student with learning material that illustrate the concepts, (3) initiate a short progress check quiz of each sub-topic for the student. If the student could consecutively correctly answer a few questions, the AI-ALS would deem that the student has “passed” the learning objective for that topic or sub-topic (which will be indicated as “topic_passed” in the dataset). Otherwise, the student would be remediated by the AI-ALS until the learning outcome is achieved, and (4) finally, after the student has passed the progress check quiz, the AI-ALS would unlock more topics or sub-topics that are considered to be “ready for learning” by the student (that will be indicated as “topic_ready_for_learning” in the dataset). The AI-ALS is often used in conjunction with the flipped learning pedagogy [
15], where the students are expected to log into the AI-ALS and learn as much as they can on their own at home. Subsequently, when they are in the classroom, the teacher can spend the precious class time more effectively by helping students to address any learning issues that they might have.
The current paper does not purport to be an empirical study of the effectiveness of any current AI-ALS. Rather, it proffers a future-ready human-in-the-loop [
16] analytical framework that is based upon intuitive human-centric probabilistic reasoning, which could be used to characterize the “pedagogical motifs” [
17] of any number of AI-ALS that may be deployed in the future. So long as the data from those systems are available to human analysts, this framework would still be useful for education stakeholders to gain an oversight of the “timbre” of multiple AI-ALS that are deployed in schools, even if those AI-ALS in the future are artificially superintelligent.
4. Descriptive Analytics of “What has Already Happened?”
In this section, the procedures that were carried out in descriptive analytics to make sense of “what has already happened?” in the collected dataset will be presented. The dataset comprising 100 students (20 students from each school, from five different schools, all of whom were about 13–14 years old) who had used the AI-ALS, was imported into Bayesialab to deliberately illustrate the capabilities of BN in handling nonparametric statistical data from a small number of participants [
74]. The purpose is to discover the informational “pedagogical motif” of the learning intervention generated by each AI-ALS. In the context of this study, the notion of “pedagogical motif” is conceptually defined as the pattern, timbre, disposition, and the unique characteristics with which each AI-ALS pedagogically interacts with the students.
4.1. The Dataset Procured from the Reports Generated by AI-ALS
The file “data_five_classes_AI_ALS.csv” contains the combined data of the five datasets from five different groups of students in different schools. For the convenience of the reader who may wish to import the data files from each group of students in each of the respective school into Bayesialab when prompted to do so in this paper, these files “data_ai_als_class_1.csv”, “data_ai_als_class_2.csv”, “data_ai_als_class_3.csv”, “data_ai_als_class_4.csv”, and “data_ai_als_class_5.csv” are also separately available in the zip file. The codebook describing the data, “ai-als-data_codebook.txt” is also included.
4.2. Codebook of the Dataset
The dataset could be procured from the reports that were generated by the server of each AI-ALS. Even though the variables from different datasets of the various AI-ALS would presumably be dissimilar, they could be aggregated to a form that is based on the mathematics topics and sub-topics (see
Table A1 in
Appendix A) that the students are required to learn in their curriculum. Each column in the dataset is presented as a node in the BN. It can be assumed that higher values in the data of both “math_topic_passed” (appended with the letter “P”) and “math_topic_ready_for_learning” (appended with the letters “RL”) are considered to be indicators of better performance, and vice-versa.
4.3. Software Used: Bayesialab
The software which will be utilized is Bayesialab [
75]. A suggested pre-requisite activity for the reader is to peruse the free user-guide from
http://www.bayesia.com/book/ before proceeding with the exemplars illustrated in the following sections, as it documents the tools and functionalities of the Bayesialab software.
4.4. Pre-Processing: Checking for Missing Values or Errors in the Data
It would be prudent to check the data (using the file “data_five_classes_AI_ALS.csv”) for any anomalies or missing values before using Bayesialab to construct the BN. In the dataset used in this study, there were no anomalies or missing values. However, should other analysts encounter missing values in their datasets, they could use Bayesialab to predict and fill in those missing values, rather than discarding the row of data with a missing value. Bayesialab would be able to perform this by machine-learning the overall structural characteristics of that entire dataset being studied, before producing the predicted values. Bayesialab uses the Structural Expectation Maximization (EM) algorithms and Dynamic Imputation algorithms to calculate any missing values [
76].
4.5. Overview of the BN Model
BN, which is also referred to as Belief Networks, Causal Probabilistic Networks, and Probabilistic Influence Diagrams are graphical models, which consist of nodes (variables) and arcs or arrows. Each node contains the data distribution of the respective variable. The arcs or arrows between the nodes represent the probabilities of the correlations between the variables [
77].
Using BN, it becomes possible to use descriptive analytics to analyze the relations between the nodes (variables) and the manner in which initial probabilities, such as the number of hours spent in the AI-ALS and/or topics passed/ready to learn, and/or noncognitive factors, might influence the probabilities of future outcomes, such as the predicted learning performance of the students in the paper-based post-test.
Further, BN can also be used to perform counterfactual speculations regarding the initial states of the data distribution in the nodes (variables), given the final outcome. In the context of the current paper, exemplars will be presented in the predictive analytics segment (in
Section 5) to illustrate how counterfactual simulations can be implemented while using BN. For example, we can simulate these hypothetical scenarios in the BN if we wish to find out the conditions of the initial states in the nodes (variables) that would lead to high probability of attaining high-level scores in the post-test, or if we wish to find out how to prevent students from attaining low scores or failing in the paper-based post-test.
The relation between each pair of connected nodes (variables) is determined by their respective Conditional Probability Table (CPT), which represents the probabilities of correlations between the data distributions of the parent node and the child node [
78]. In the current paper, the values in the CPT are automatically machine-learned by Bayesialab, according to the data distribution of each column/variable/node in the dataset. Nevertheless, it is possible, but optional, for the user to manually enter the probability values into the CPT, if the human user wishes to override the machine learning software. In Bayesialab, the CPT of any node can be seen by double-clicking on it.
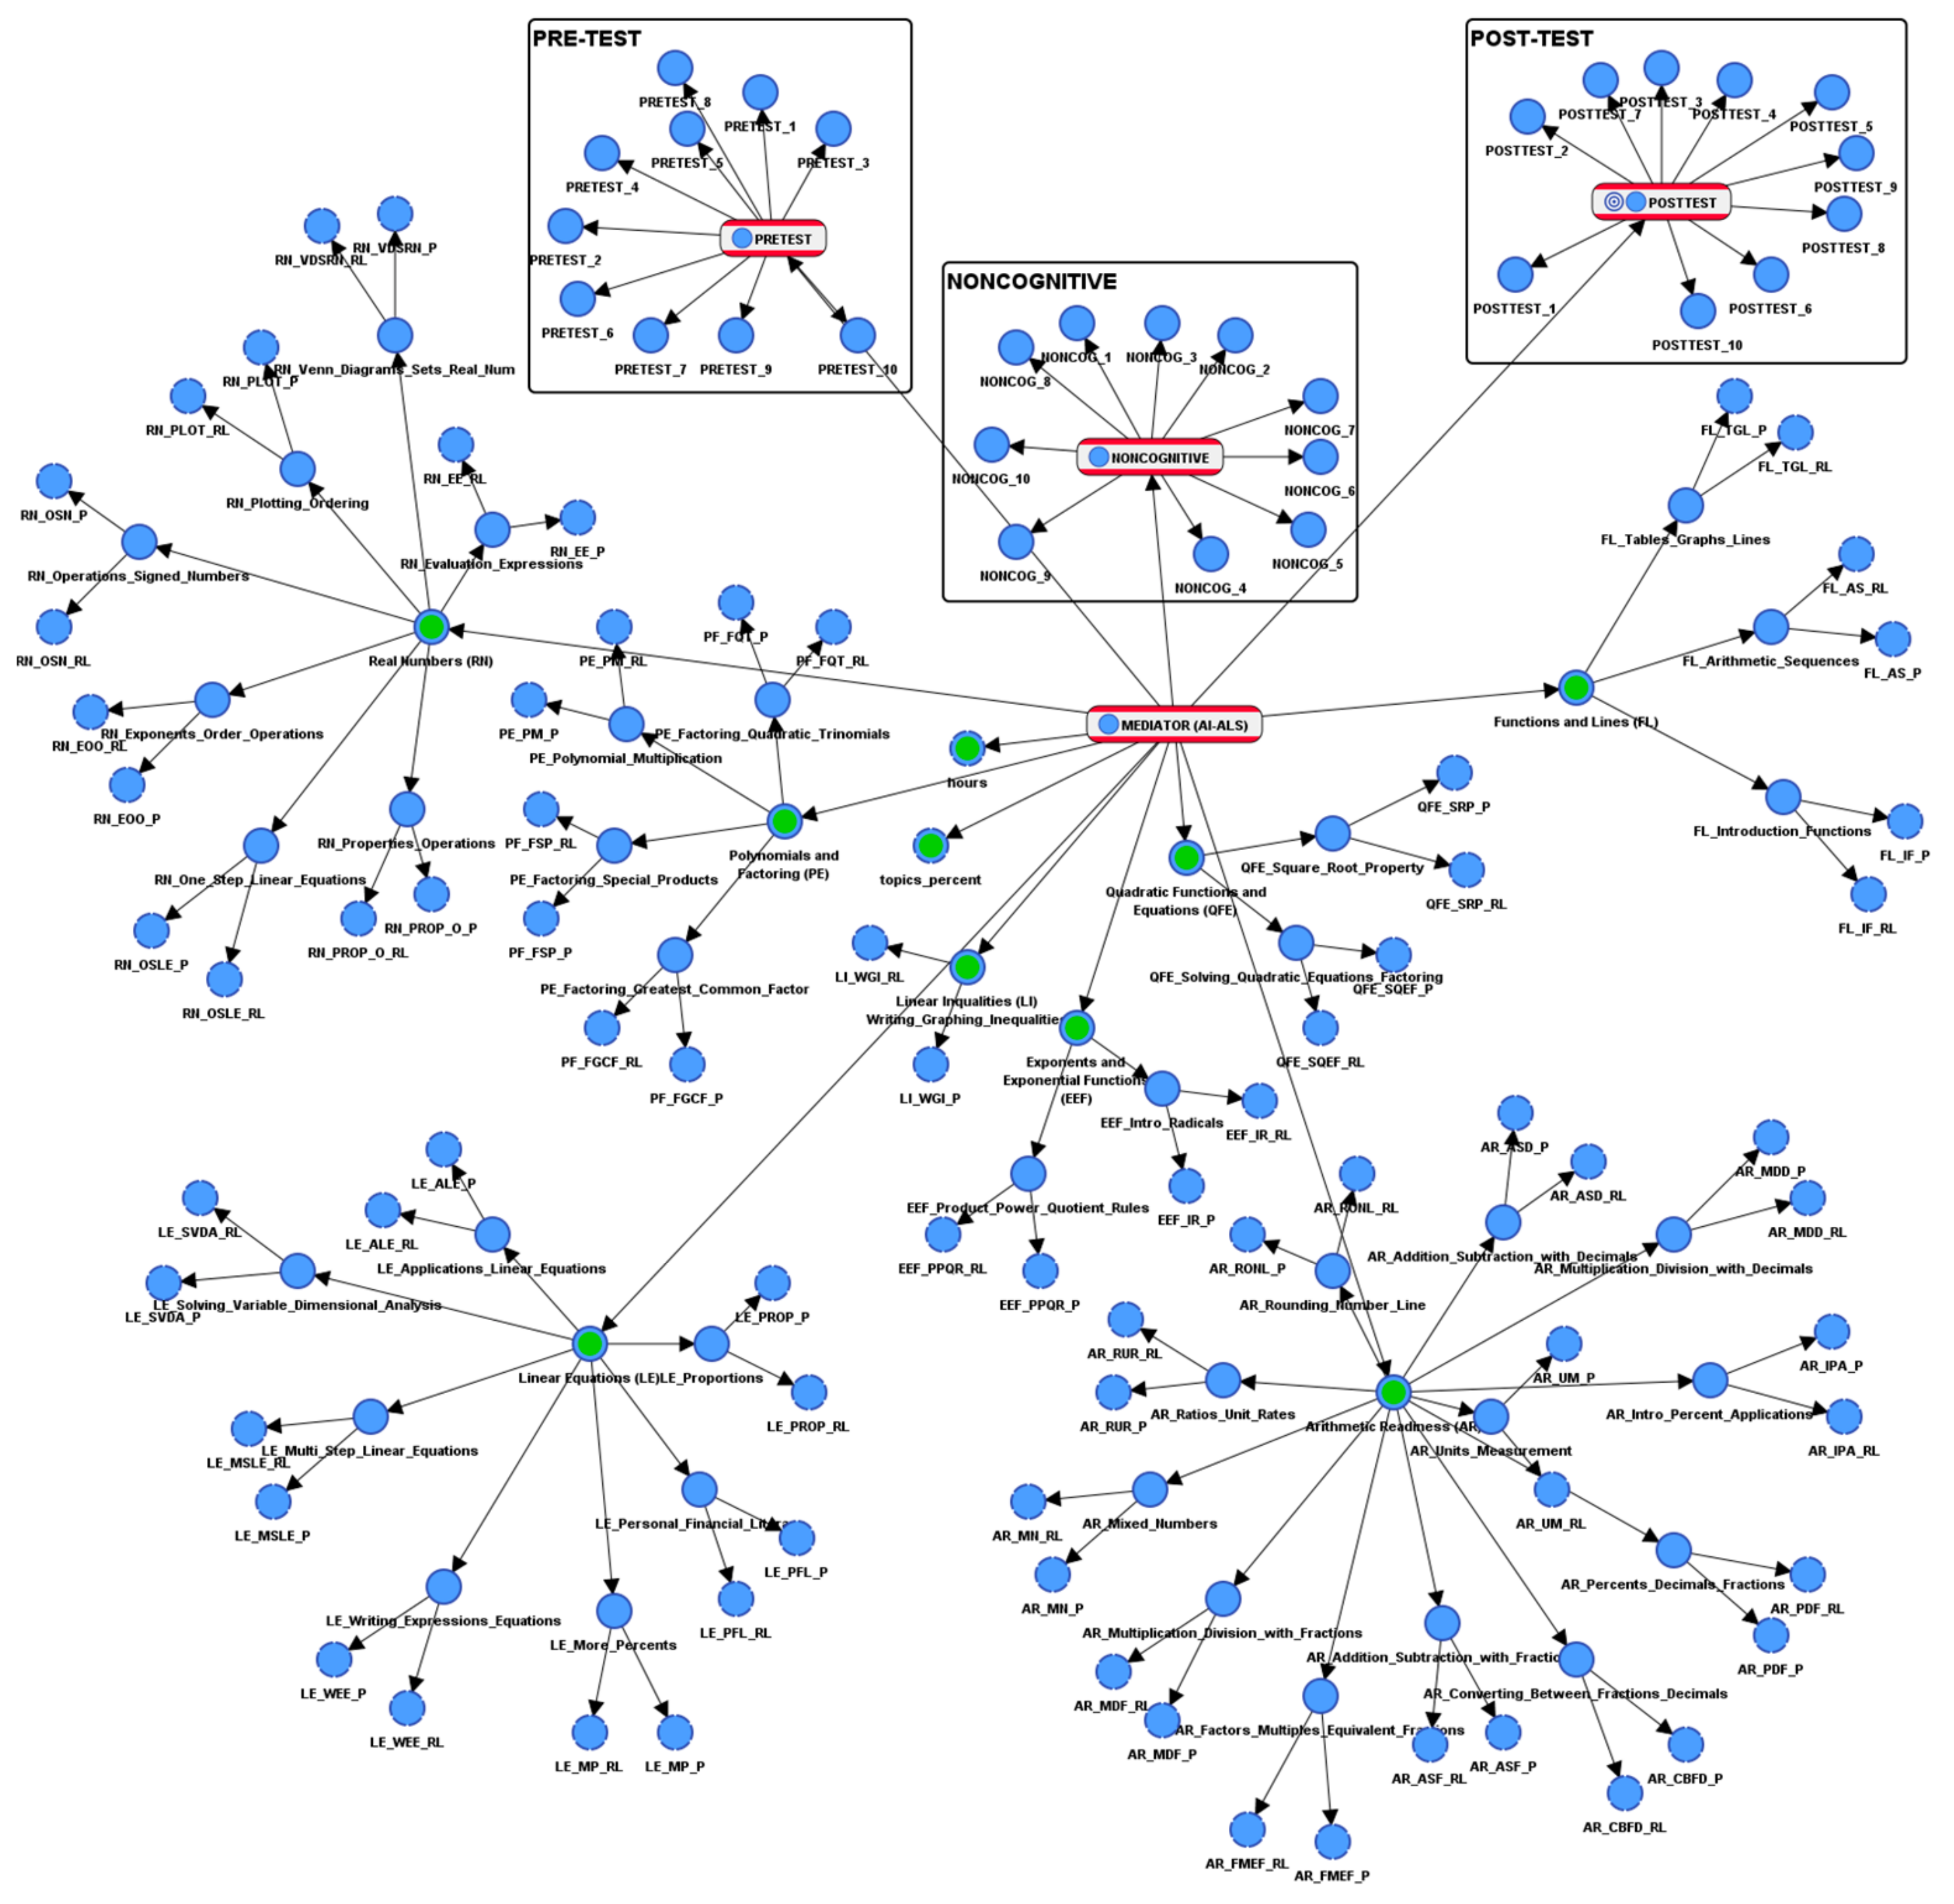
The BN model can be used to depict the data distribution of the students’ score clusters (see
Figure 1) in the AI-ALS in terms of the mathematics topics which include Arithmetic Readiness, Real Numbers, Linear Equations, Linear Inequalities, Functions and Lines, Exponents and Exponential Functions, Polynomials and Factoring, as well as Quadratic Functions and Equations. These score clusters were generated via machine-learning by the Bayesialab software. By generating this model from the data that contained varying levels of performance of the students (even if it was just 20 students from each school, with a total of 100 students from five schools), we could obtain a “pedagogical motif” of each AI-ALS, which meant that we could then perform simulations in each computational model to study how it could behave under certain conditions. This will be elaborated and presented later in
Section 5.
4.6. Detailed Descriptions of the BN in the Current Paper
Nodes (both the blue round dots, as well as the round cornered rectangles showing the data distribution histograms) represent the variables of interest, for example, the score of a particular mathematics topic (connected to nodes with scores from their corresponding sub-topics), the number of hours that are spent by a student in the AI-ALS, the percentage of mathematics topics which a student had passed in the AI-ALS, or the rating of a particular noncognitive factor (e.g., motivation of a student). Such nodes can correspond to symbolic/categorical variables, numerical variables with discrete values, or discretized continuous variables. We exclusively discuss BN with discrete nodes in the current paper even though BN can handle continuous variables, as it is more relevant in helping educational stakeholders categorize students into high, mid, and low achievement groups, so that teachers can utilize differentiated methods to better address the students’ learning needs.
Directed links (the arrows) could represent informational (statistical) or causal dependencies among the variables. The directions are used to define kinship relations, i.e., parent-child relationships. For example, X is the parent node of Y, and Y is the child node in a Bayesian network with a link from X to Y. In the current paper, it is important to note that the Bayesian network presented is the machine-learned result of probabilistic structural equation modeling (PSEM); the arrows represent the probabilistic structural relationships between the parent node and the child nodes. The first letter of the name of each node/data entity is presented in the upper case for better readability.
In the BN model used in the current paper (see
Figure 1), the node representing the Pre-test results (from a paper-based math test) is connected to the “mediator” node representing the pedagogical motif of the AI-ALS, and subsequently the “mediator” node that represents the pedagogical motif of the AI-ALS is also connected to the node that represents the Post-test results (from another paper-based math test). This enables the probabilities of the AI-ALS as a mediator of the students’ performance to be calculated, and subsequently it will be possible to simulate hypothetical scenarios (to be presented later in
Section 5).
4.7. Descriptive Statistical Analysis of the Dataset
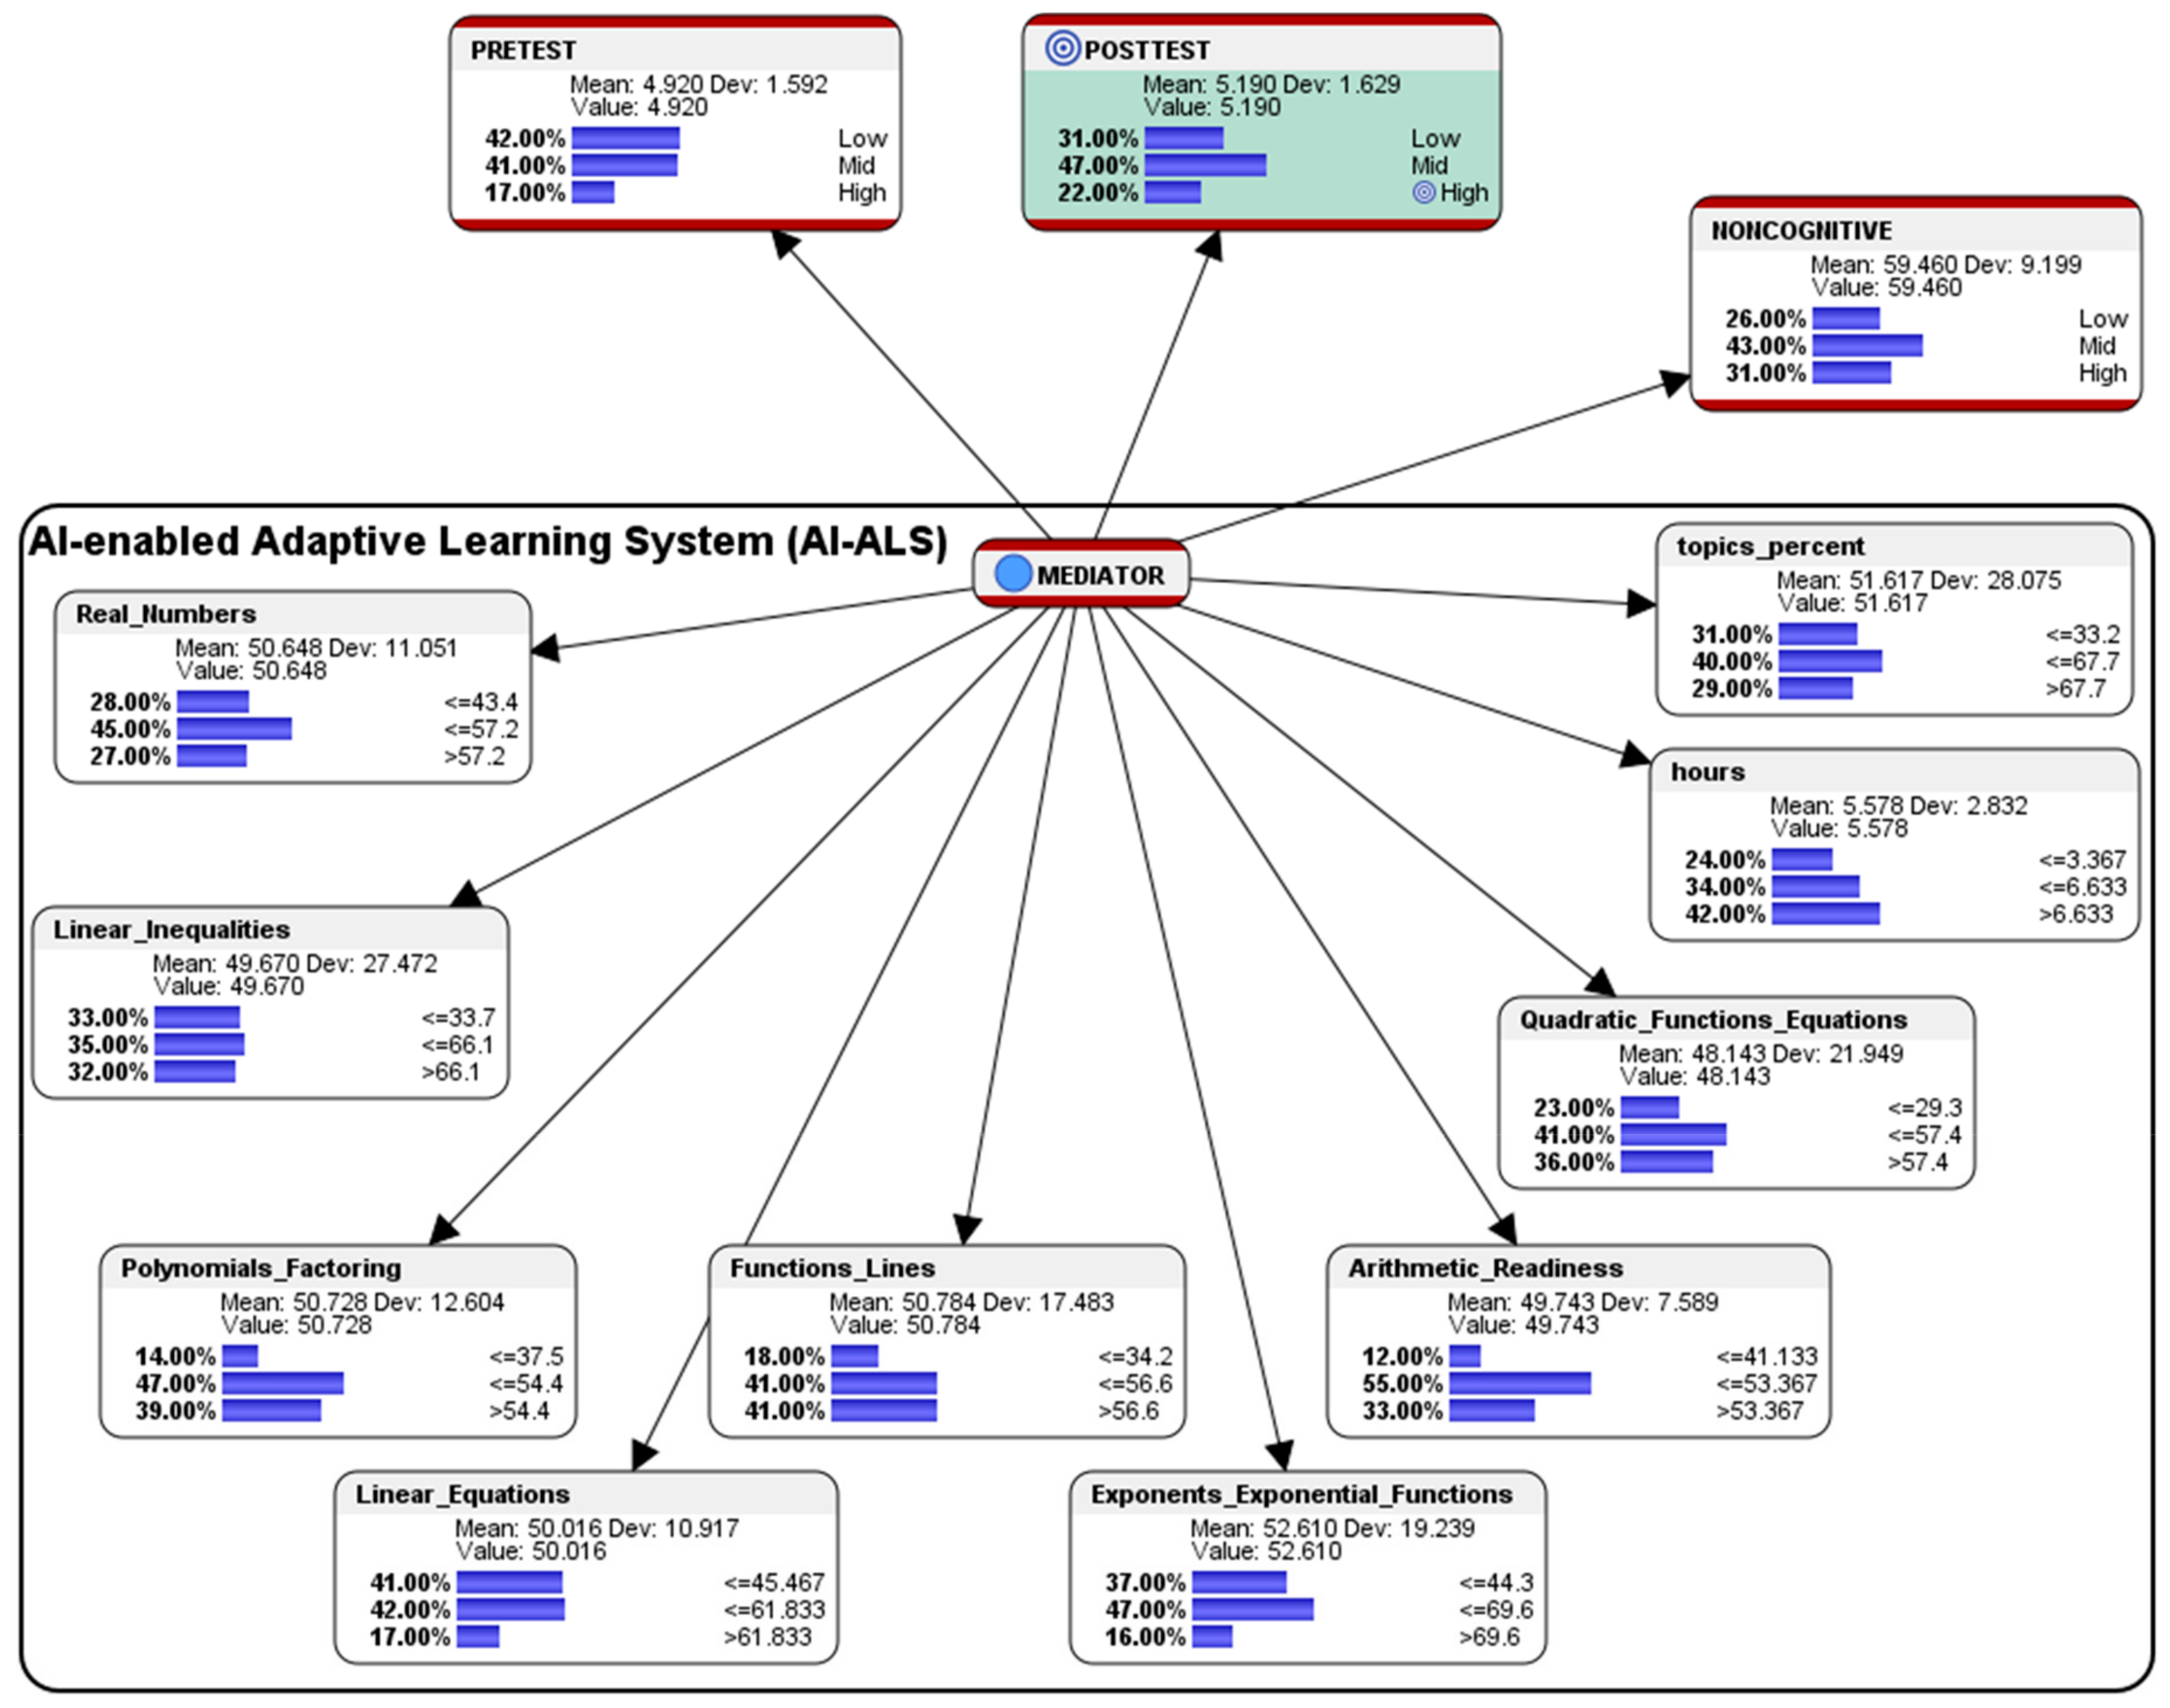
From the combined dataset of all the 100 students’ performance who had used the five different AI-ALS (using the file “data_five_classes_AI_ALS.csv”), the following score-clusters machine-learned by Bayesialab were observed (see
Figure 2):
In the paper-based Pre-test before the students used the AI-ALS, 42% of the students scored at the Low-level, 41% scored at the Mid-level, and 17% scored at the High-level. In the paper-based Post-test after the students had gone through the training within the AI-ALS, 31% scored at the Low-level, 47% scored at the Mid-level, and 22% scored at the High-level. Overall, in terms of conventional gains, there was an improvement of 11% of the students who had scored at the Low-level (a decrease from 42% in the Pre-test to 31% in the Post-test); there was an improvement of 6% in the students who had scored at the Mid-level (an increase from 41% in the Pre-test to 47% in the Post-test); and, there was an improvement of 5% in the students who had scored at the High-level (an increase from 17% in the Pre-test to 22% in the Post-test).
In the aggregated Noncognitive factor, 26% of the students were at the so-called Low-level, 43% were at the Mid-level, and 31% were at the High-level.
Within the AI-ALS, in the topic of Real Numbers, 28% of the students scored at the Low-level (<=43.4% of the total marks for Real Numbers), 45% scored at the Mid-level (>43.4 and <=57.2), and 27% scored at the High-level (>57.2).
In the topic of Linear Inequalities, 33% scored at the Low-level (<=33.7), 35% scored at the Mid-level (>33.7 and <=66.1), and 32% scored at the High-level (>66.1).
In the topic of Polynomials and Factoring, 14% of the students scored at the Low-level (<=37.5), 47% scored at the Mid-level (>37.5 and <=54.4), and 39% scored at the High-level (>54.4).
In the topic of Linear Equations, 41% of the students scored at the Low-level (<=45.467), 42% scored at the Mid-level (>45.467 and <=61.833), and 17% scored at the High-level (>61.833).
In the topic of Functions and Lines, 18% of the students scored at the Low-level (<=34.2), 41% scored at the Mid-level (>34.2 and <=56.5), and 41% scored at the High-level (>56.6).
In the topic of Exponents and Exponential Functions, 37% of the students scored at the Low-level (<=44.3), 47% scored at the Mid-level (>44.3 and <=69.6), and 16% scored at the High-level (>69.6).
In the topic of Arithmetic Readiness, 12% of the students scored at the Low-level (<=41.133), 55% scored at the Mid-level (>41.133 and <=53.367), and 33% scored at the High-level (>53.367).
In the topic of Quadratic Functions and Equations, 23% of the students scored at the Low-level (<=29.3), 41% scored at the Mid-level (>29.3 and <=57.4), and 36% scored at the High-level (>53.4).
Regarding the average number of hours spent by each student in the AI-ALS, 24% of the students were at the Low-level (<=3.367 h), 34% of the students were at the Mid-level (>3.367 and <=6.633 h), and 42% were at the High-level (>6.633 h).
In the percentage of the total number of topics that were mastered by the students in the AI-ALS, 31% of the students were at the Low-level (<=33.3%), 40% were at the Mid-level (>33.3% and <=67.7%), and 29% were at the High-level (>67.7%).
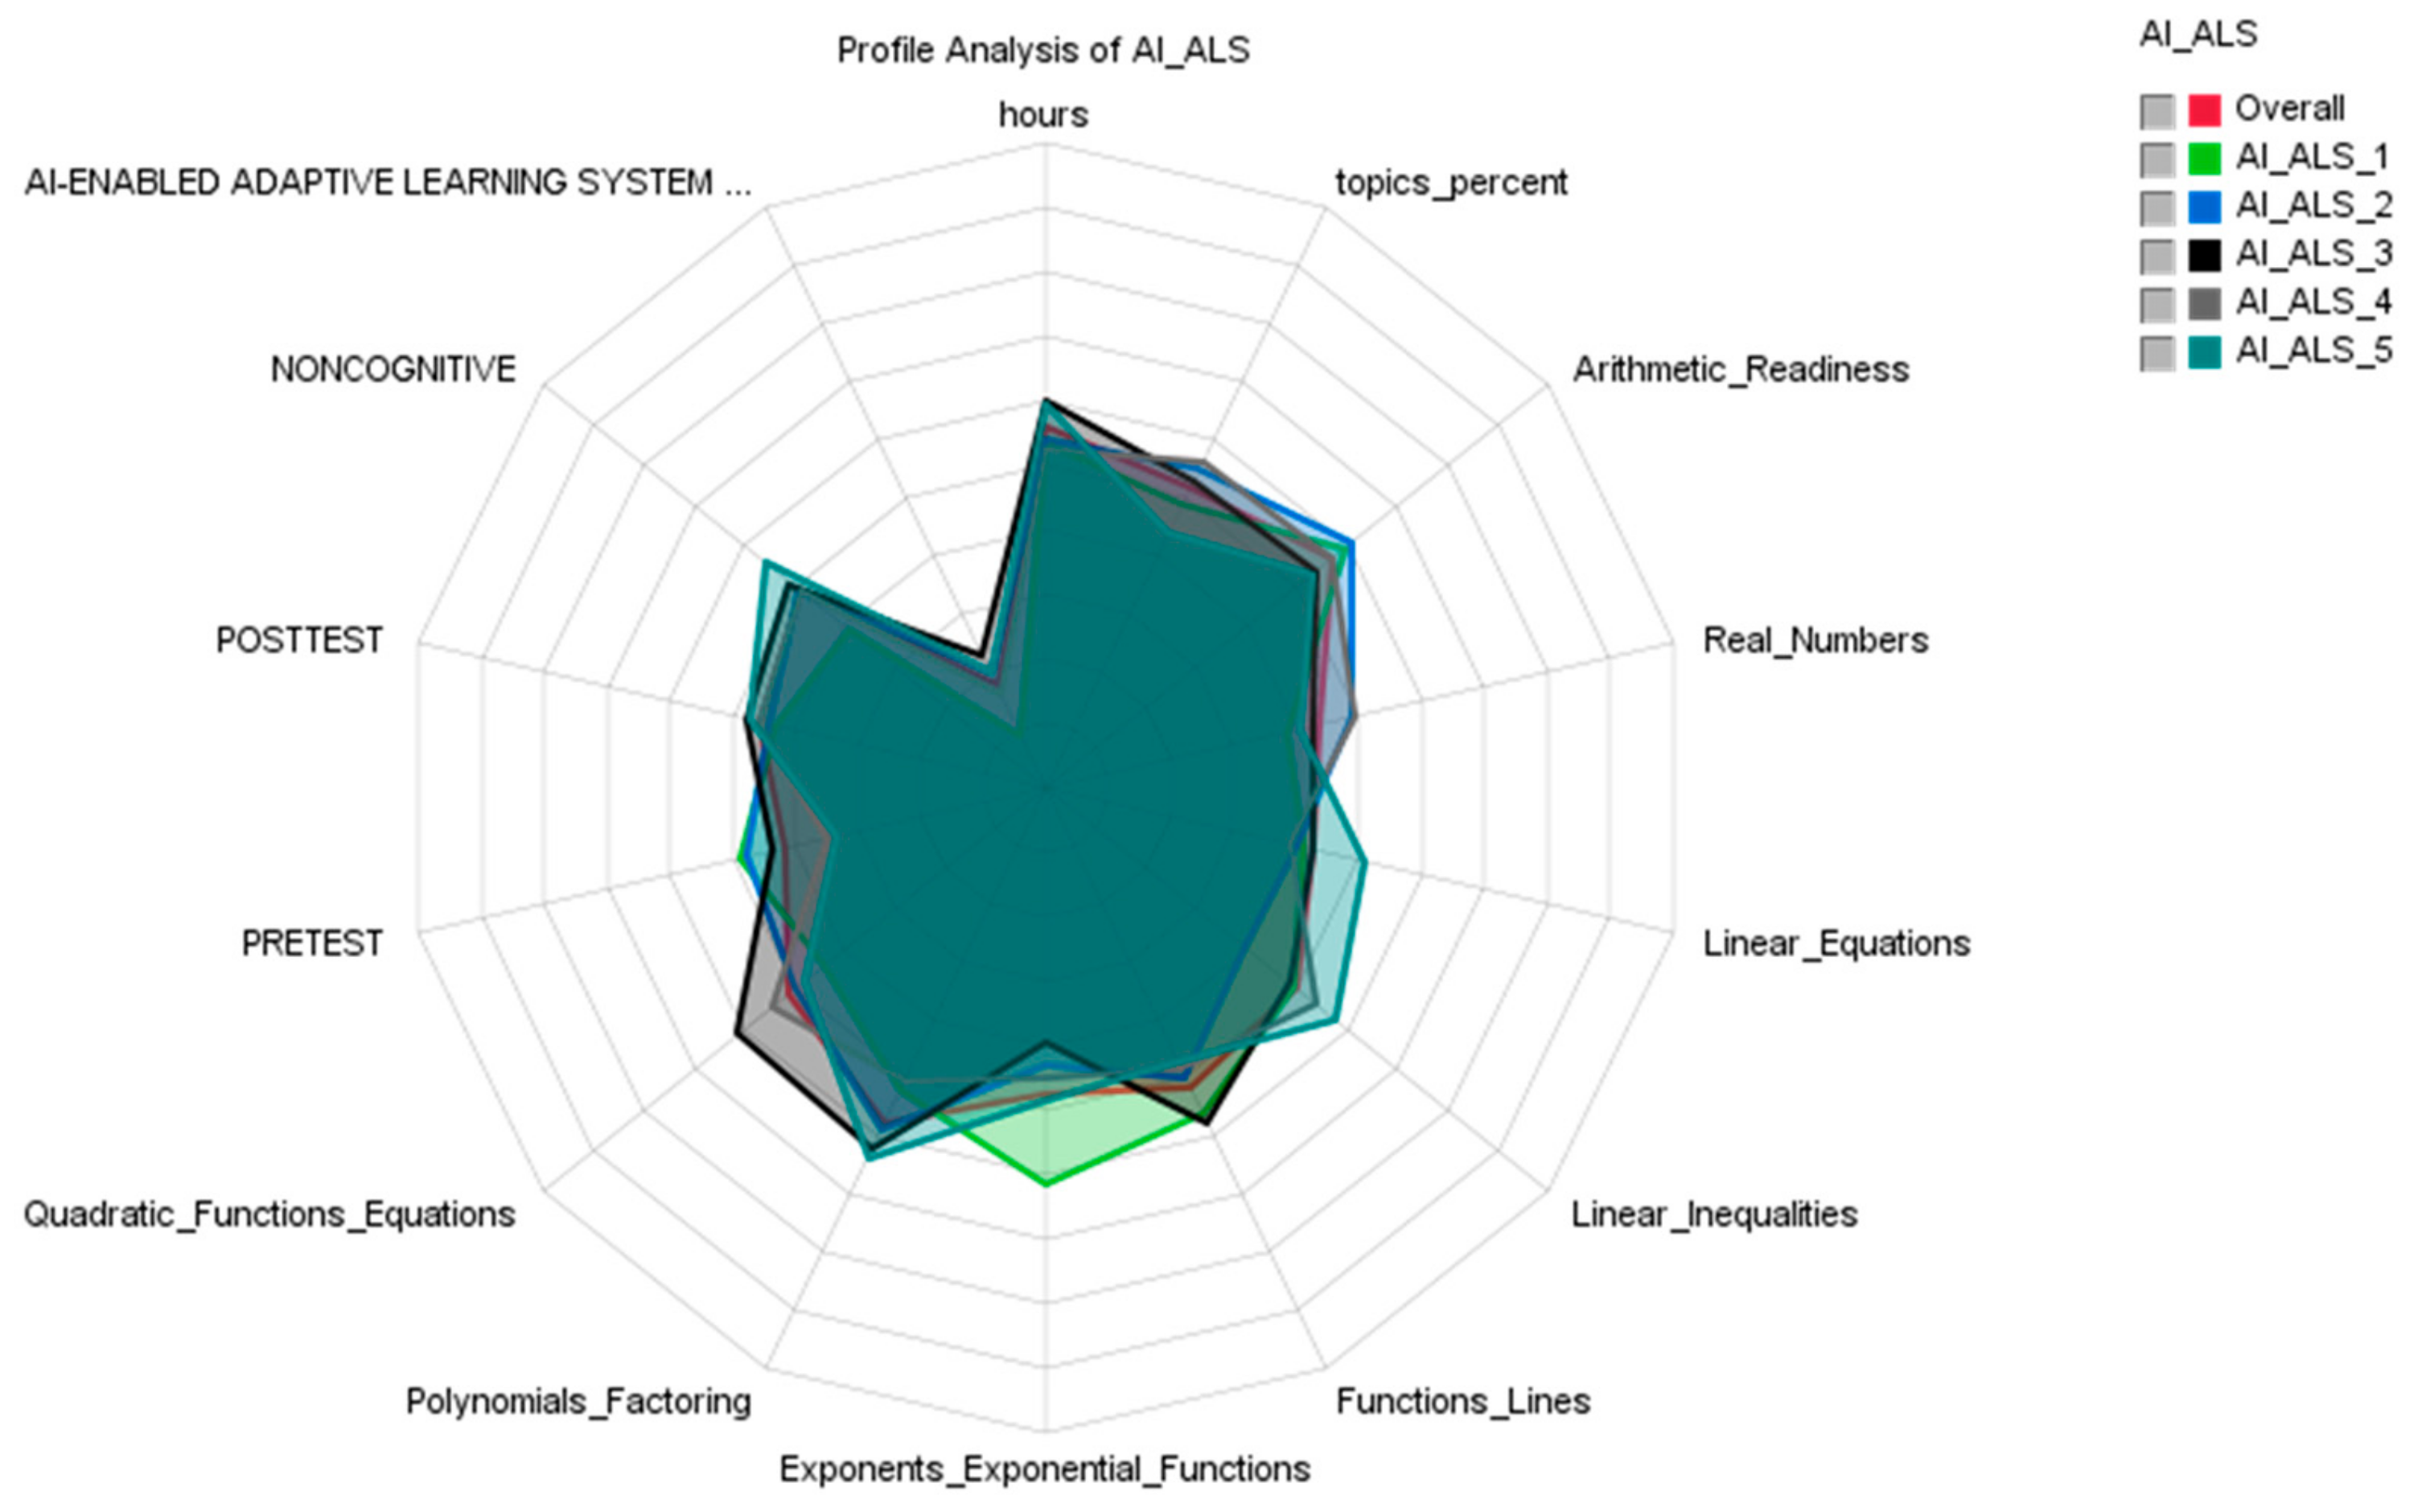
4.7.1. Descriptive Analytics: Profile Analysis of Each AI-ALS
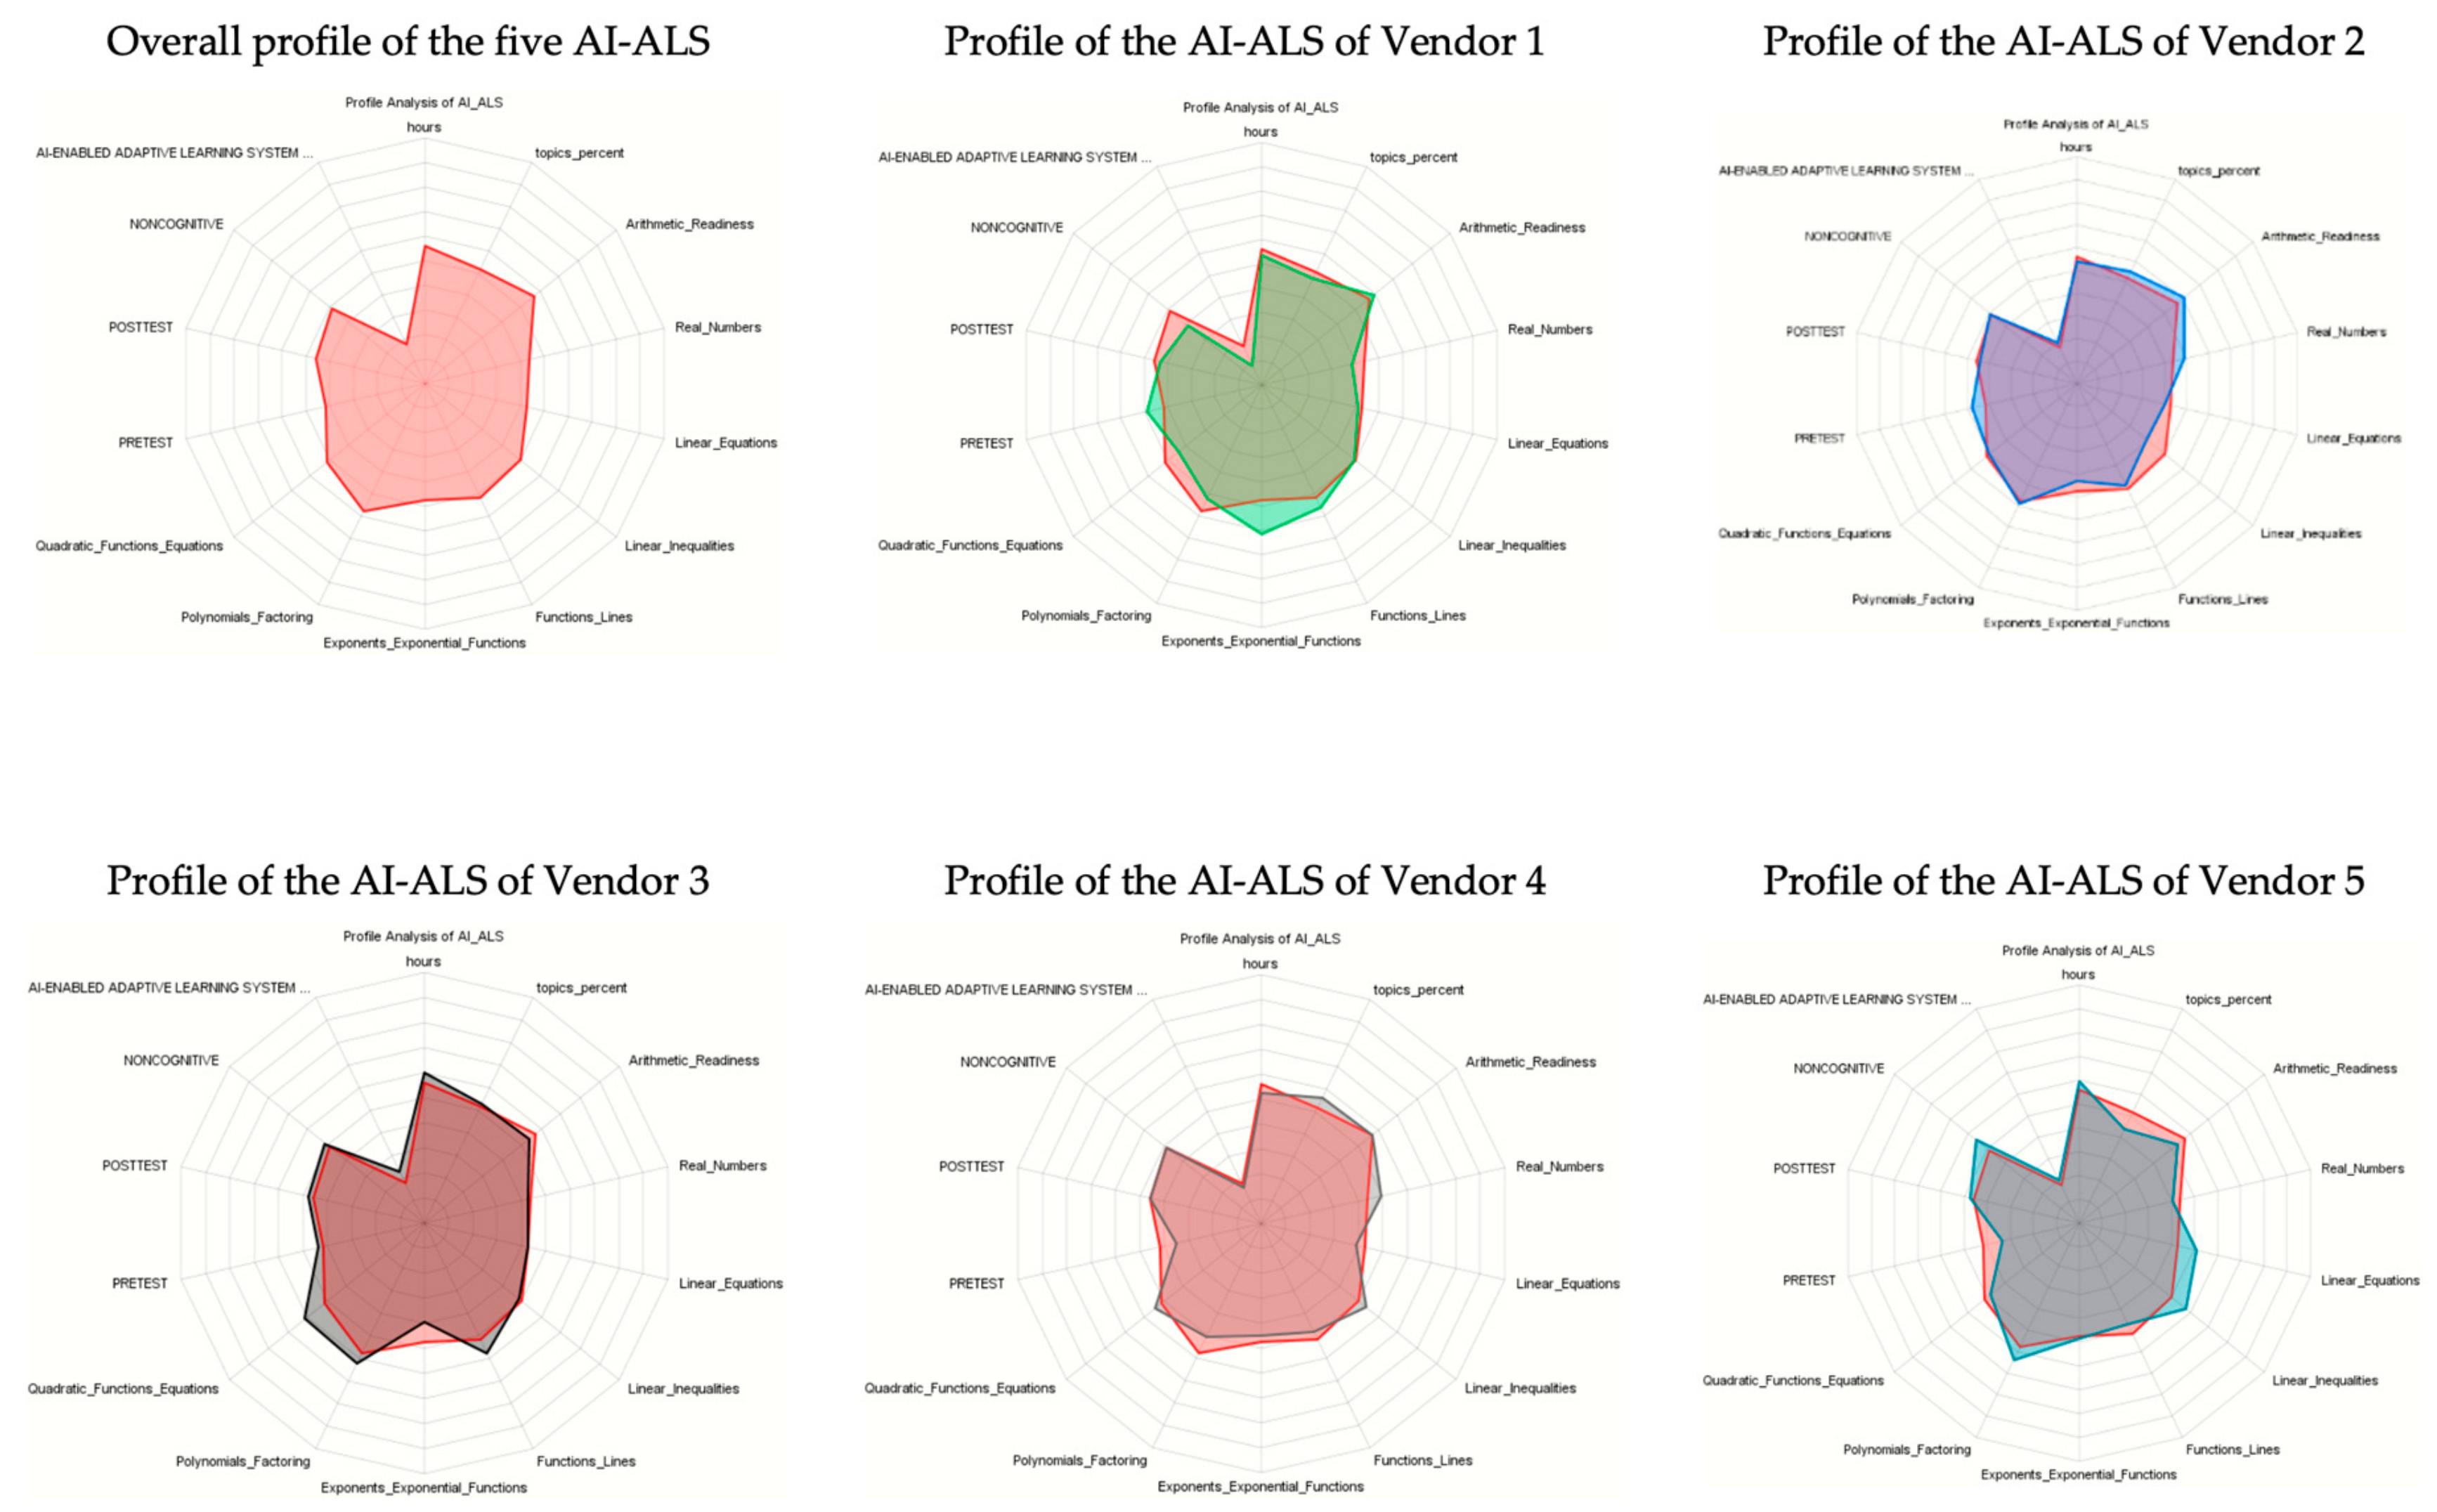
A strategic overview of how the students performed (see
Figure 3 and
Figure 4) could be accomplished via profile analysis. This tool can be activated in Bayesialab via these steps:
Bayesialab (validation mode) > Visual > Segment > Profile.
Figure 4 is an alternative presentation of the profiles presenting the performance of the five groups of students in different schools, each of which had used a different AI-ALS.
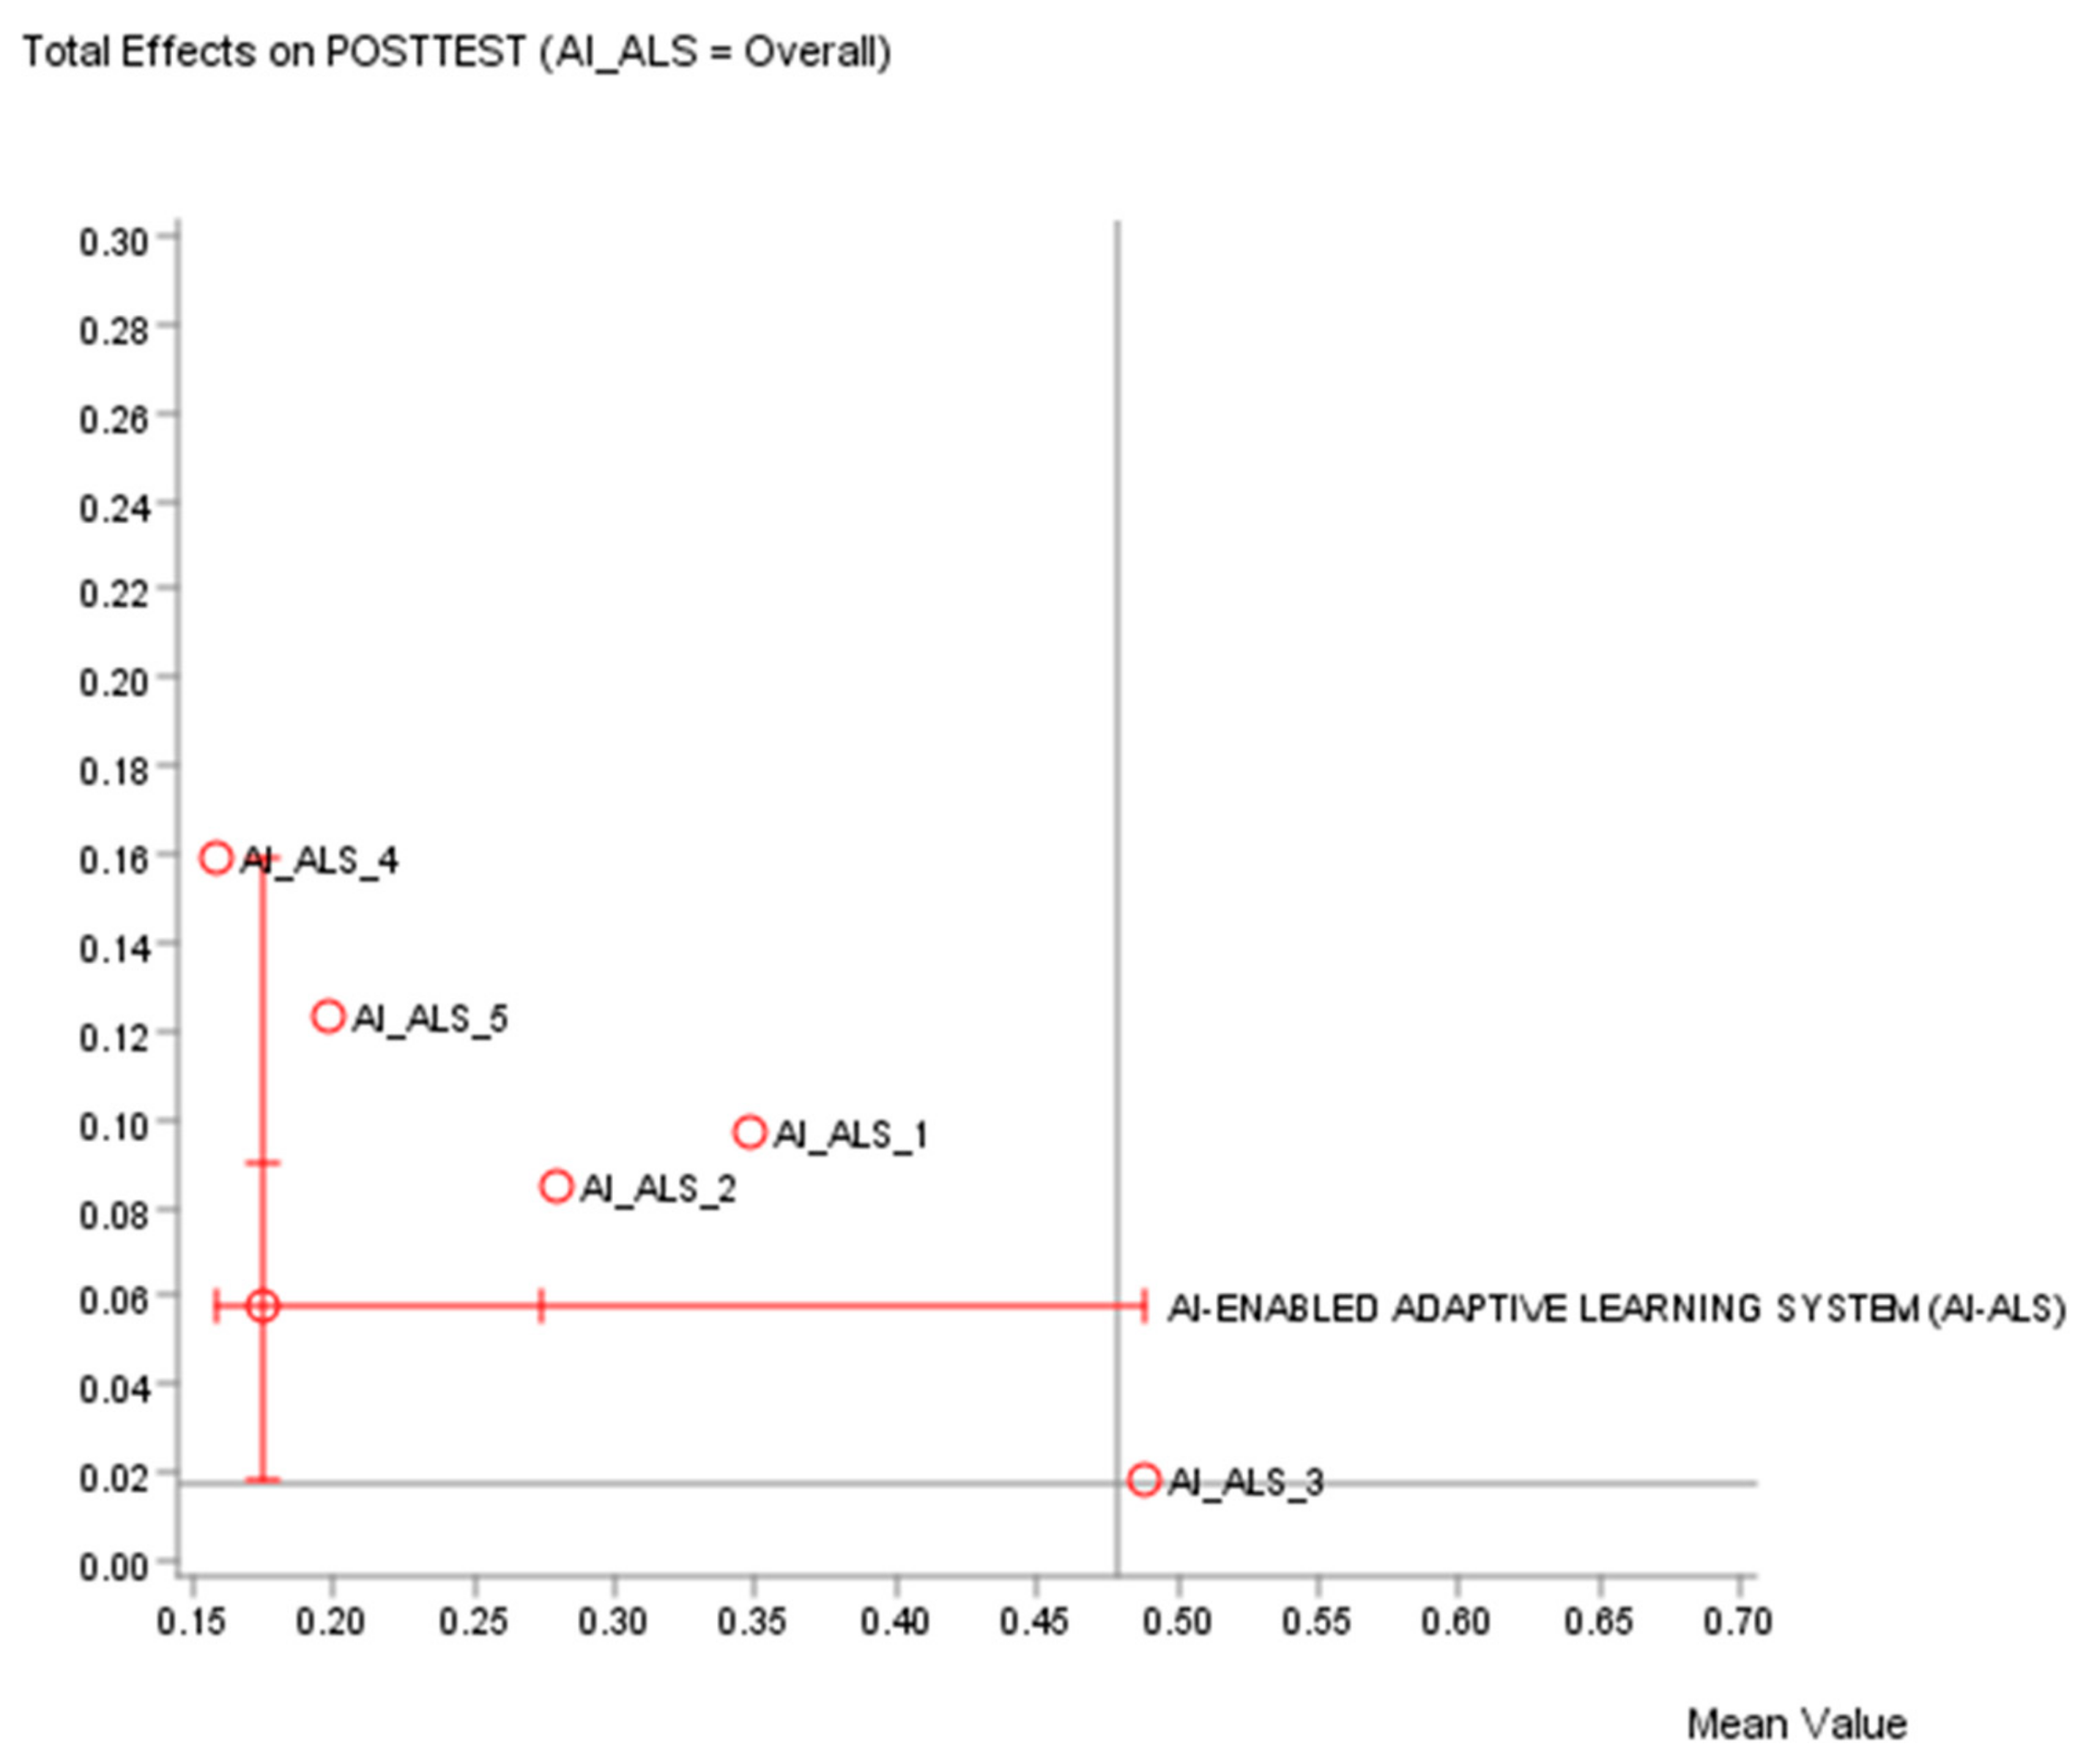
4.7.2. Descriptive Analytics: Quadrant Analysis
Comparison of Total Effects of the five different AI-ALS on the paper-based Post-test can be performed while using quadrant analysis. This tool can be activated in Bayesialab via these steps: Bayesialab (validation mode) > Analysis > Report > Target > Total Effects on Target > Quadrants.
It would be contrived to measure the correlation between the scores achieved by the students in their respective AI-ALS against their scores in the hardcopy paper-based post-test, because some students could have scored poorly in the AI-ALS as their poor understanding of certain math concepts might have been “surfaced” by the systems, but subsequently, they might have scored well in the paper-based post-test. Conversely, some students might have scored high in the AI-ALS because the questions were easy, but they might have scored low in the paper-based post-test. Hence, it absolutely does not mean that an AI-ALS would be ranked higher in the quadrant analysis chart if the students’ scores within the AI-ALS are higher.
Each chart of the quadrant analysis generated by Bayesialab (see
Figure 5 and
Figure 6) is divided into four quadrants. The variables’ means (of each mathematics topic) are represented along the x-axis. The mean of the standardized total effect on the target (the paper-based post-test) is represented along the y-axis. Quadrant analysis example 1 (see
Figure 5) utilized the file “data_five_classes_AI_ALS.csv”. As a suggestion, the quadrants could be interpreted, as follows:
Top Right Quadrant (high volume, high impact on target node): This group contains the important variables with greater total effect on the target than the mean value. These AI-ALS are effective in contributing to the success of the students in the paper-based post-test. The AI-ALS supplied by Vendor 1, Vendor 2, Vendor 4, and Vendor 5 are in this category.
Top Left Quadrant (low volume, high impact on target node): Any AI-ALS in this category might be beneficial to the high-performing students, but not so beneficial to the mid- or low-performing students. There is no AI-ALS from any vendor in this quadrant.
Bottom Right Quadrant (high volume, low impact on target node): The AI-ALS from Vendor 3 is in this category, so educational stakeholders should consider conducting further investigation to find out why this AI-ALS could not contribute to beneficial results in the paper-based post-test for the students.
Bottom Left Quadrant (low volume, low impact on target node): Any AI-ALS in this category has relatively lower impact on the target node (the paper-based post-test). There is no AI-ALS from any vendor in this quadrant.
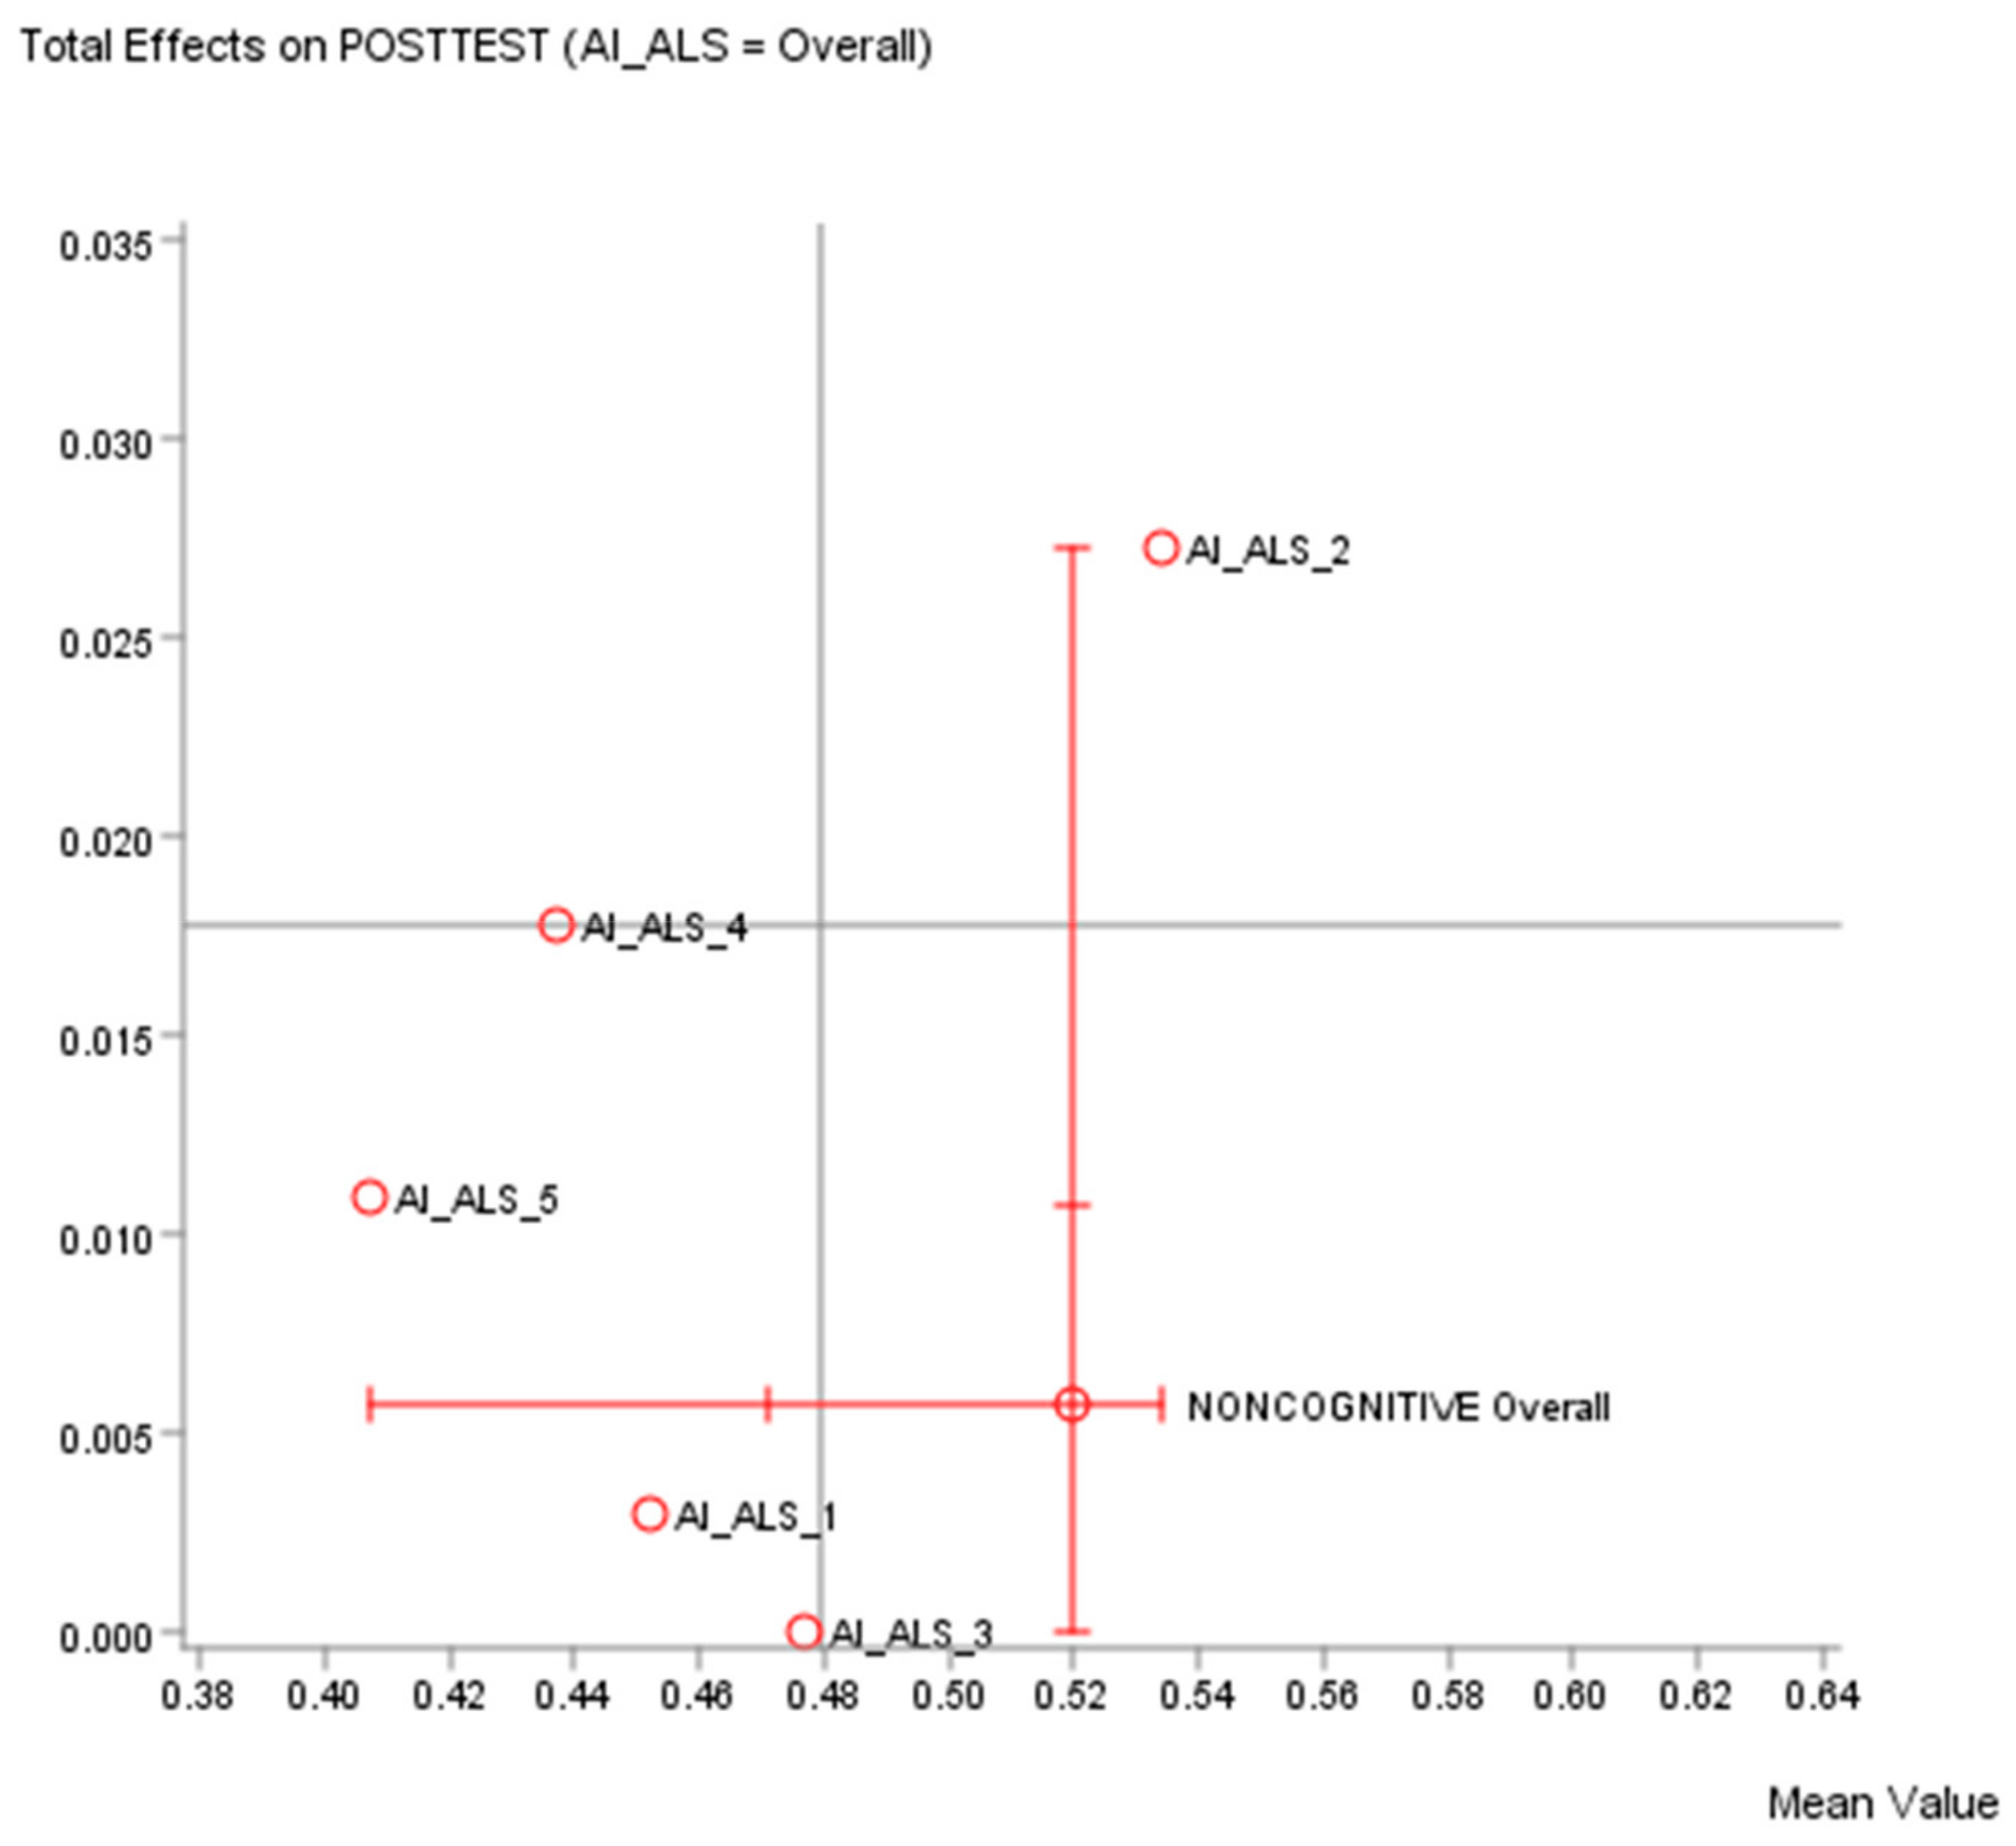
Quadrant analysis example 2 (see
Figure 6) utilized the file “data_five_classes_AI_ALS.csv”. As a suggestion, the quadrants could be interpreted, as follows:
Top Right Quadrant (high volume, high impact on target node): This quadrant contains the AI-ALS with greater total effect on the target than the mean value. Only the AI-ALS from Vendor 2 is in this quadrant. These noncognitive factors associated with this AI-ALS are important to the success of the students in the paper-based post-test, and the educational stakeholders should further explore how the noncognitive factors (e.g., motivation, stress management, psychological well-being, etc.) that are associated with the AI-ALS from Vendor 2 could be beneficial in helping the students to understand and learn the concepts well in these mathematics topics.
Top Left Quadrant (low volume, high impact on target node): Any AI-ALS in this category is associated with the noncognitive factors that might be beneficial for the high-performing students, but might not be so beneficial to the mid- or low-performing students. The AI-ALS supplied by Vendor 4 and Vendor 5 are in this quadrant.
Bottom Right Quadrant (high volume, low impact on target node): There is no AI-ALS from any vendor in this quadrant. If there is any AI-ALS in this category, educational stakeholders should consider conducting further investigation to find out why the noncognitive factors associated with this AI-ALS could not contribute to beneficial results in the paper-based post-test for the students.
Bottom Left Quadrant (low volume, low impact on target node): Any AI-ALS in this category has noncognitive factors that have relatively lower impact on the target node (the paper-based post-test). The AI-ALS from Vendor 1 and Vendor 3 are in this quadrant.
4.7.3. Descriptive Analytics: Comparative Analysis of the Five AI-ALS
In this section, the performance results of the five classes of students who had used five dissimilar AI-ALS in five different schools will be presented.
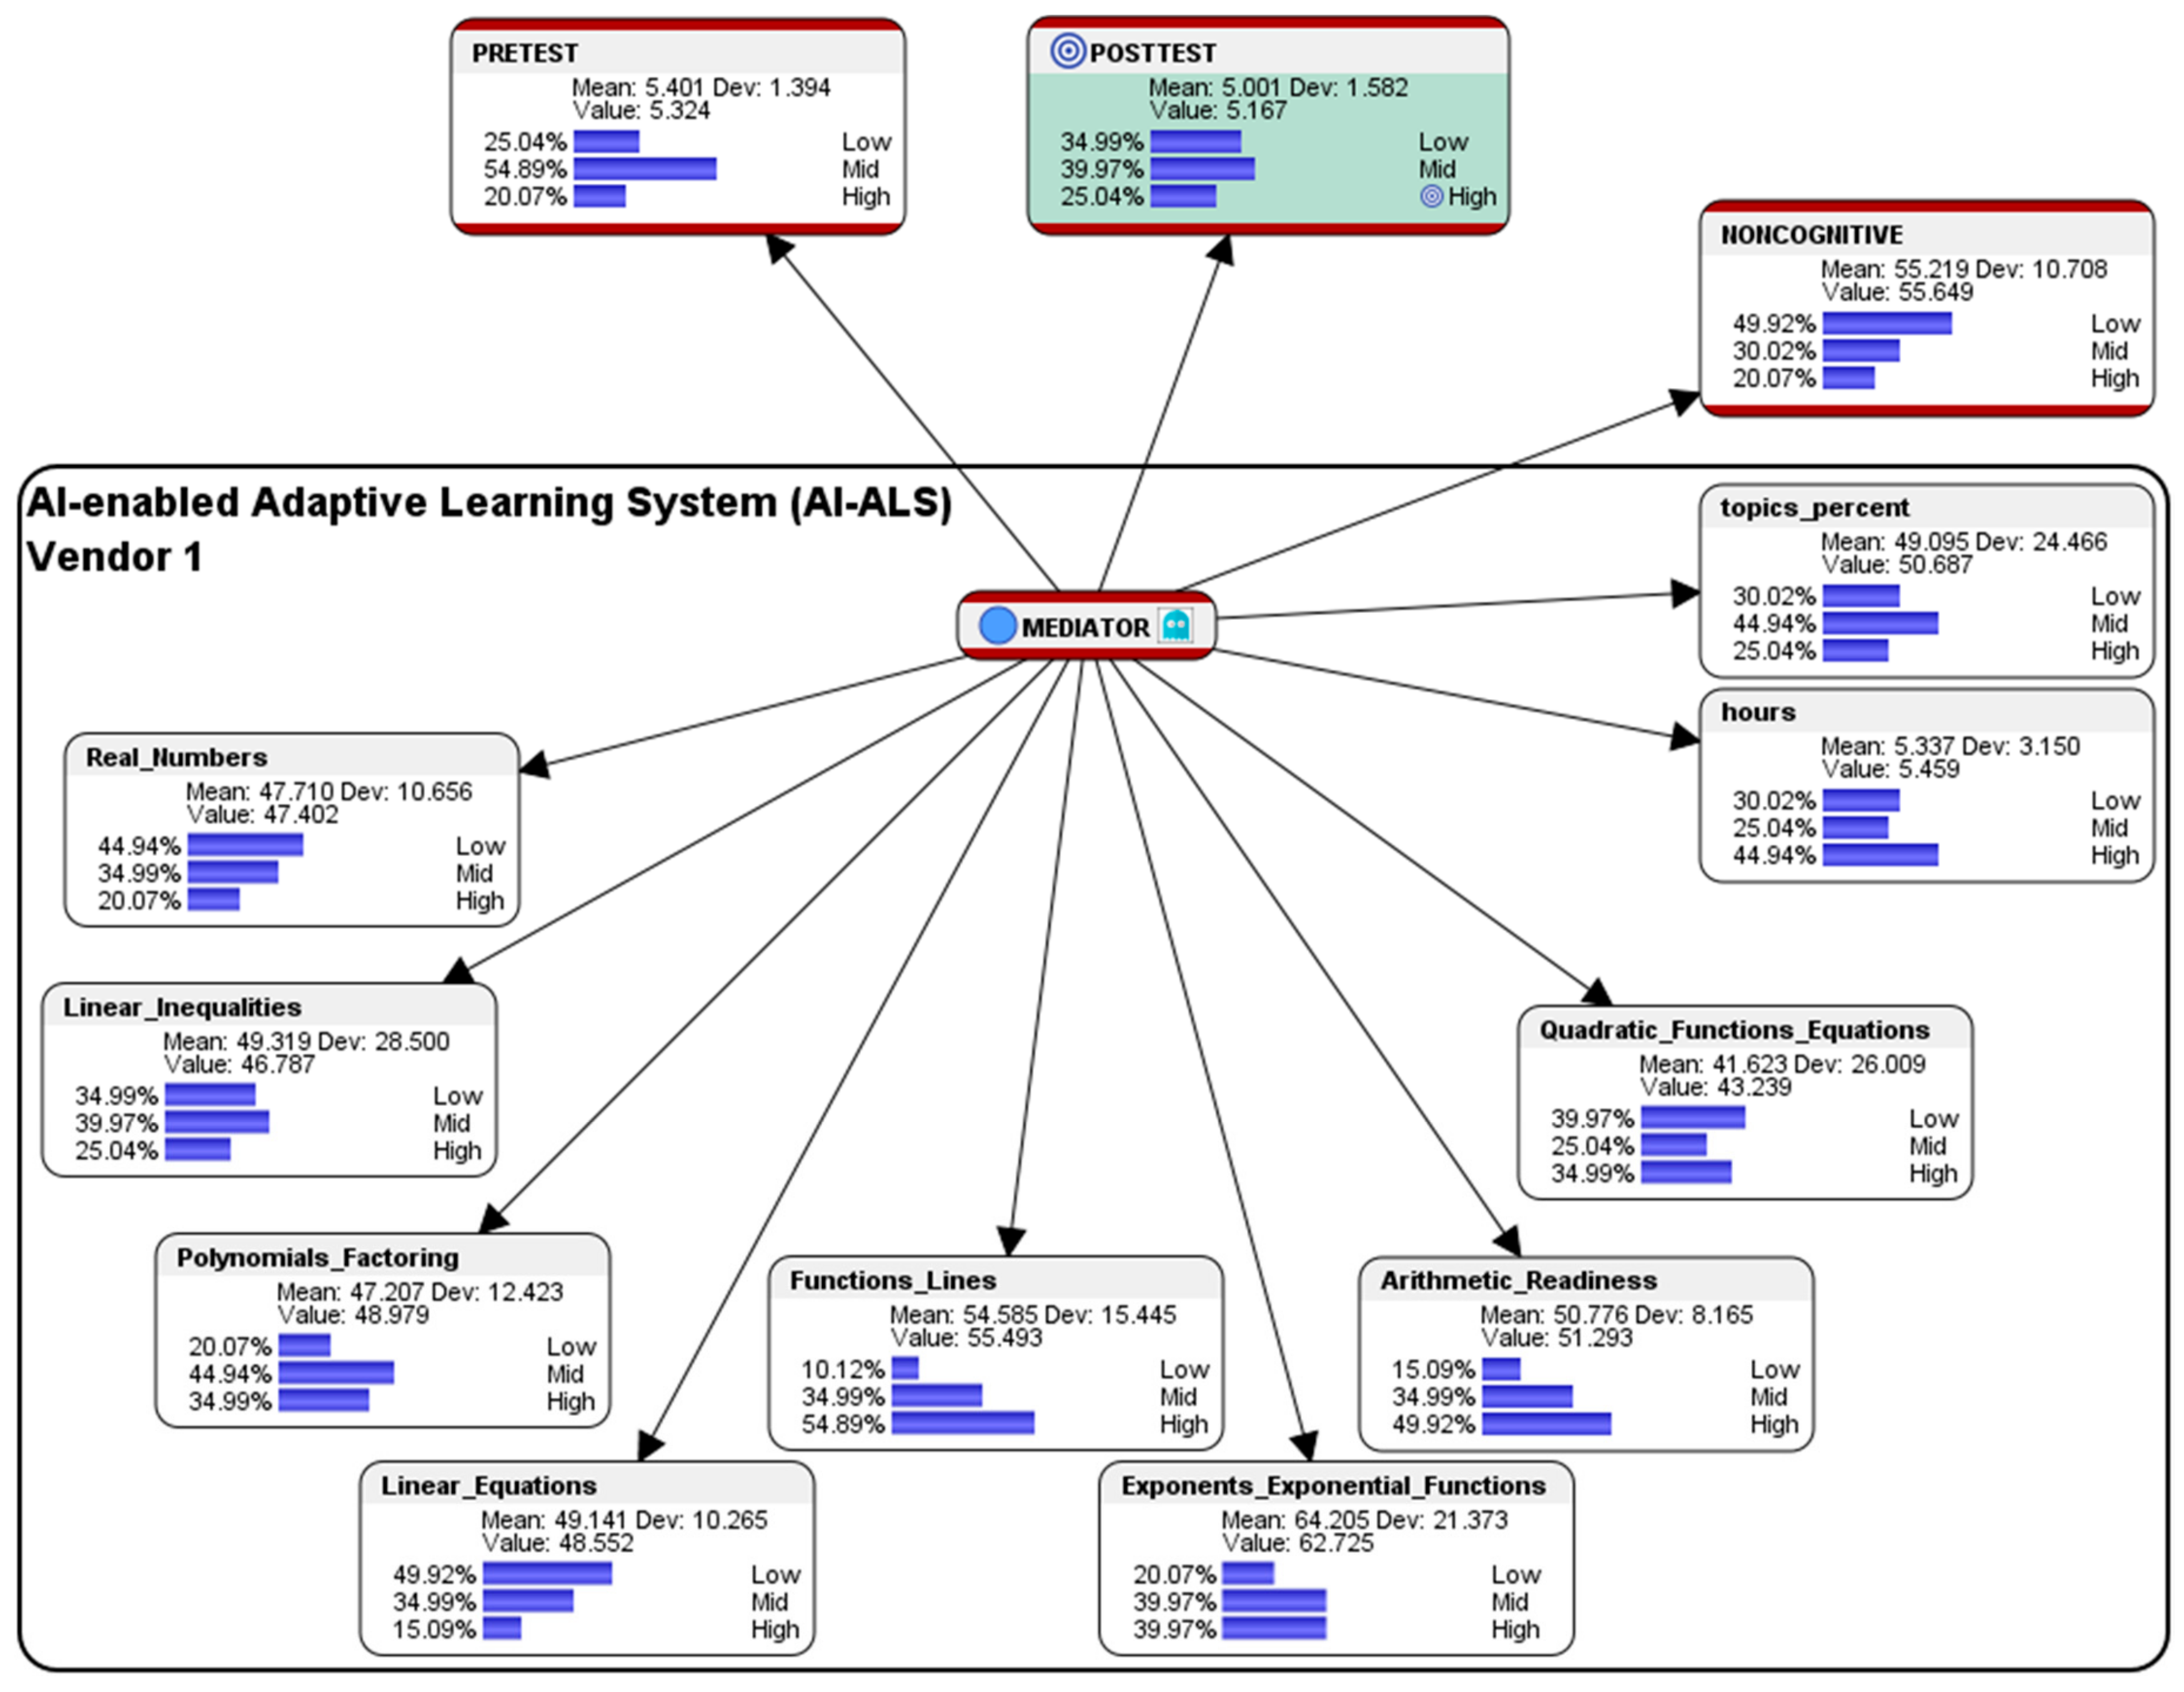
Comparison between the AI-ALS from Vendor 1 and the Combined Average of the Five AI-ALS:
Using the file “data_ai_als_class_1.csv” via the Data Association tool in Bayesialab, the following score-clusters machine-learned by Bayesialab were observed from the dataset depicting the performances of the 20 students who had used the AI-ALS from Vendor 1 (see
Figure 7):
In the paper-based Pre-test before the students used the AI-ALS from Vendor 1, 25.04% had scored at the Low-level (as compared to the combined average of 42% of the students who had scored at the Low-level), 54.89% had scored at the Mid-level (when compared to the combined average of 41% who had scored at the Mid-level), and 20.07% had scored at the High-level (as compared to the combined average of 17% scored at the High-level).
In the paper-based Post-test after the students had gone through the training within the AI-ALS from Vendor 1, 34.99% had scored at the Low-level (as compared to the combined average of 31% who had scored at the Low-level), 39.97% had scored at the Mid-level (when compared to the combined average of 47% who had scored at the Mid-level), and 25.04% had scored at the High-level (as compared to the combined average of 22% who had scored at the High-level). Overall, in terms of conventional gains by comparing the Pre-test vis-à-vis the Post-test, there was an unfavorable higher difference of 9.95% of the students who scored at the Low-level (from 25.04% in the Pre-test to 34.99% in the Post-test); there was a decline of 14.92% in the students who scored at the Mid-level (an decrease from 54.89% in the Pre-test to 39.97% in the Post-test); however, there was a favorable higher difference of 4.97% in the students who scored at the High-level (from 20.07% in the Pre-test to 25.04% in the Post-test).
In the aggregated Noncognitive factor, 49.92% of the students who had used the AI-ALS from Vendor 1 were at the so-called Low-level (a higher difference of 23.92% as compared to the combined average of 26% of the students who were at the Low-level), 30.02% were at the Mid-level (a lower difference of 12.98% as compared to the combined average of 43% of students who were at the Mid-level), and 20.07% were at the High-level (a lower difference of 10.93% when compared to the combined average of 31% of student who were at the High-level).
Within the AI-ALS from Vendor 1, in the topic of Real Numbers, 44.94% of the students scored at the Low-level (a higher difference of 16.94% as compared to the combined average of 28% of the students who scored at the Low-level), 34.99% of the students scored at the Mid-level (a lower difference of 10.01% as compared to the combined average of 45% of the students who scored at the Mid-level, and 20.07% of the students scored at the High-level (a lower difference of 6.93% compared to the combined average of 27% of the students who scored at the High-level.
In the topic of Linear Inequalities, 34.99% of the students scored at the Low-level (a higher difference of 1.99% compared to the combined average of 33% of the students who scored at the Low-level), 39.97% of the students scored at the Mid-level (a higher difference of 4.97% when compared to the combined average of 35% of the students who scored at the Mid-level), and 25.04% of the students scored at the High-level (a lower difference of 6.96% as compared to the combined average of 32% of the students who scored at the High-level.
In the topic of Polynomials and Factoring, 49.92% of the students scored at the Low-level (a higher difference of 35.92% when compared to the combined average of 14% of the students who scored at the Low-level), 34.99% scored at the Mid-level (a lower difference of 12.01% as compared to the combined average of 47% of the students who scored at the Mid-level), and 15.09% scored at the High-level (a lower difference of 23.91% when compared to the combined average of 39% of the students who scored at the High-level).
In the topic of Linear Equations, 49.92% scored at the Low-level (a higher difference of 8.92% when compared to the combined average of 41% of the students who scored at the Low-level), 34.99% scored at the Mid-level (a lower difference of 7.01% when compared to the combined average of 42% of the students who scored at the Mid-level), and 15.09% scored at the High-level (a lower difference of 1.91% when compared to the combined average of 17% scored at the High-level).
In the topic of Functions and Lines, 10.12% scored at the Low-level (a lower difference of 7.88% compared to the combined average of 18% of the students who scored at the Low-level), 34.99% scored at the Mid-level (a lower difference of 6.01% as compared to the combined average of 41% of the students who scored at the Mid-level), and 54.89% who scored at the High-level (a higher difference of 13.89% as compared to the combined average of 41% of the students who scored at the High-level).
In the topic of Exponents and Exponential Functions, 20.07% scored at the Low-level (a higher difference of 16.93% when compared to the combined average of 37% of the students who scored at the Low-level), 39.97% scored at the Mid-level (a lower difference of 7.03% as compared to the combined average of 47% of the students who scored at the Mid-level), and 39.97% scored at the High-level (a higher difference of 23.97% when compared to the combined average of 16% of the students who scored at the High-level).
In the topic of Arithmetic Readiness, 15.09% scored at the Low-level (a higher difference of 3.09% compared to the combined average of 12% of the students who scored at the Low-level), 34.99% scored at the Mid-level (a lower difference of 20.01% compared to the combined average of 55% of the students who scored at the Mid-level), and 49.92% scored at the High-level (a higher difference of 16.92% s compared to the combined average of 33% scored at the High-level).
Regarding the topic of Quadratic Functions and Equations, 39.97% of the students scored at the Low-level (a higher difference of 16.97% as compared to the combined average of 23% of the students who scored at the Low-level), 25.04% scored at the Mid-level (a lower difference of 15.96% compared to the combined average of 41% scored at the Mid-level), and 34.99% scored at the High-level (a lower difference of 1.01% when compared to the combined average of 36% of the students who scored at the High-level).
Within the AI-ALS by Vendor 1, in the average number of hours spent by each student, 30.02% of the students were at the Low-level (a higher difference of 6.02% compared to the combined average of 24% of the students were at the Low-level), 25.04% were at the Mid-level (a lower difference of 8.96% as compared to the combined average of 34% of the students who were at the Mid-level), and 44.94% were at the High-level (a higher difference of 2.94% when compared to the combined average of 42% who were at the High-level).
In the percentage of the total number of topics that were mastered by the students in the AI-ALS by Vendor 1, 30.02% of the students were at the Low-level (a slightly lower difference of 0.98% compared to the combined average of 31% of the students who were at the Low-level), 44.94% were at the Mid-level (a higher difference of 4.94% compared to the combined average of 40% who were at the Mid-level), and 25.04% were at the High-level (a lower difference of 3.96% when compared to the combined average of 29% who were at the High-level).
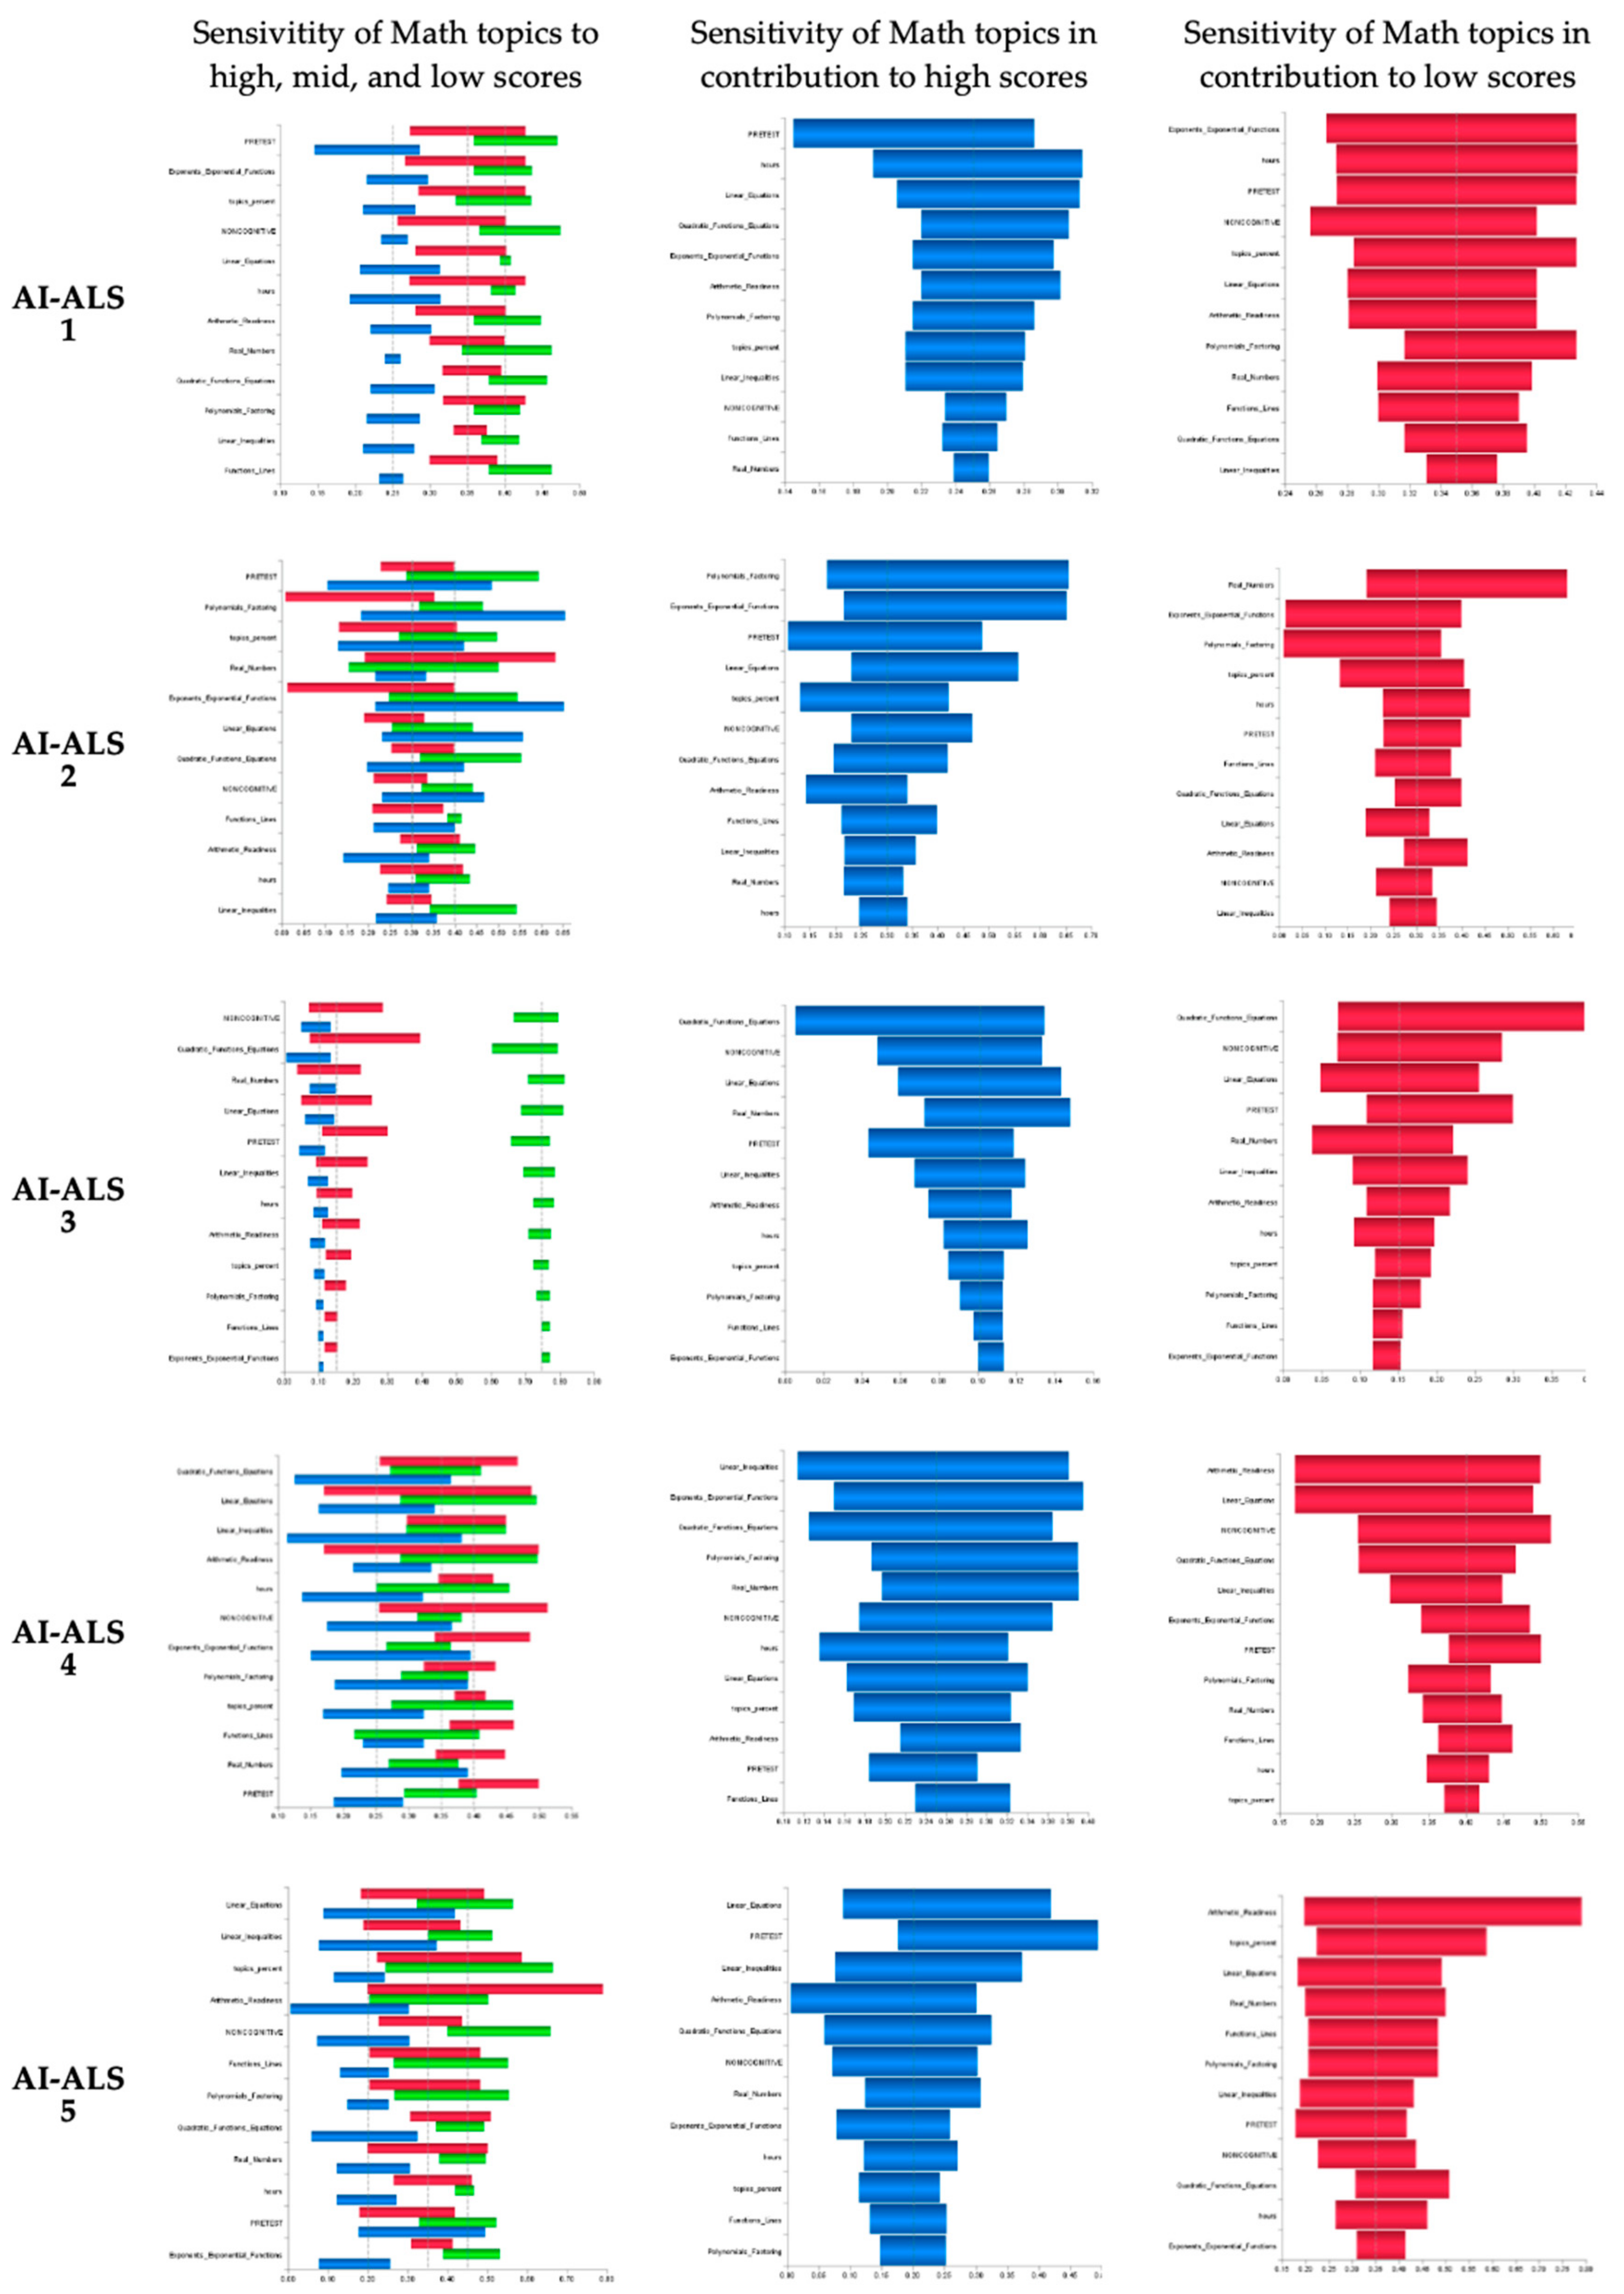
4.7.4. Sensitivity Analysis of the Mathematics Topics that Contribute to the Performance of the Students who had Used the Five Dissimilar AI-ALS from the Five Vendors
Posterior Probability of the Post-test can be performed on the data from each school, while using tornado diagrams (see
Figure 12). Sensitivity analysis can be activated in Bayesialab via these steps:
Bayesialab (validation mode) > Analysis > Visual > Sensitivity > Tornado diagrams on Total Effects.
Each blue tornado chart of the total effects presents the performance (in the learning progress) of the students in each mathematics topic within the AI-ALS, in terms of the posterior probability of achieving high-level scores in the paper-based post-test. This implies that, in the AI-ALS proved by each vendor, the problem-solving practice that the students had in certain mathematics topics might have contributed to the high scores that were achieved by the students in the paper-based post-test. The longer blue bars represent higher sensitivity, in terms of how changes in the score of each mathematics topic (that is, their learning progress within each AI-ALS) could potentially affect the outcome in the paper-based post-test. Further coordination between the education stakeholders and the vendor of each respective AI-ALS should be carried out to understand how the teachers can focus on providing the students remediation of the more sensitive mathematics topics (represented with longer blue bars), as they seem to be important in affecting the performance of their students who could score high marks in the paper-based post-test.
Each red tornado chart of the total effects presents the performance of the students in each mathematics topic within the AI-ALS, in terms of the posterior probability of achieving low-level scores in the paper-based post-test. This implies that, in the AI-ALS proved by the vendor, the problem-solving practice that the students had in the mathematics topics might have contributed to the high scores that were achieved by the students in the paper-based post-test. The longer red bars represent higher sensitivity, in terms of how changes in the score of each mathematics topic (that is, their learning progress within each AI-ALS) could potentially affect the outcome in the paper-based post-test. Further coordination via discussions between the education stakeholders and each respective vendor of the AI-ALS should be carried out to understand how the teachers can focus on providing the students remediation of the more sensitive mathematics topics (represented with longer red bars), as they seem to be affecting the performance of their students who could only score low marks in the paper-based post-test.
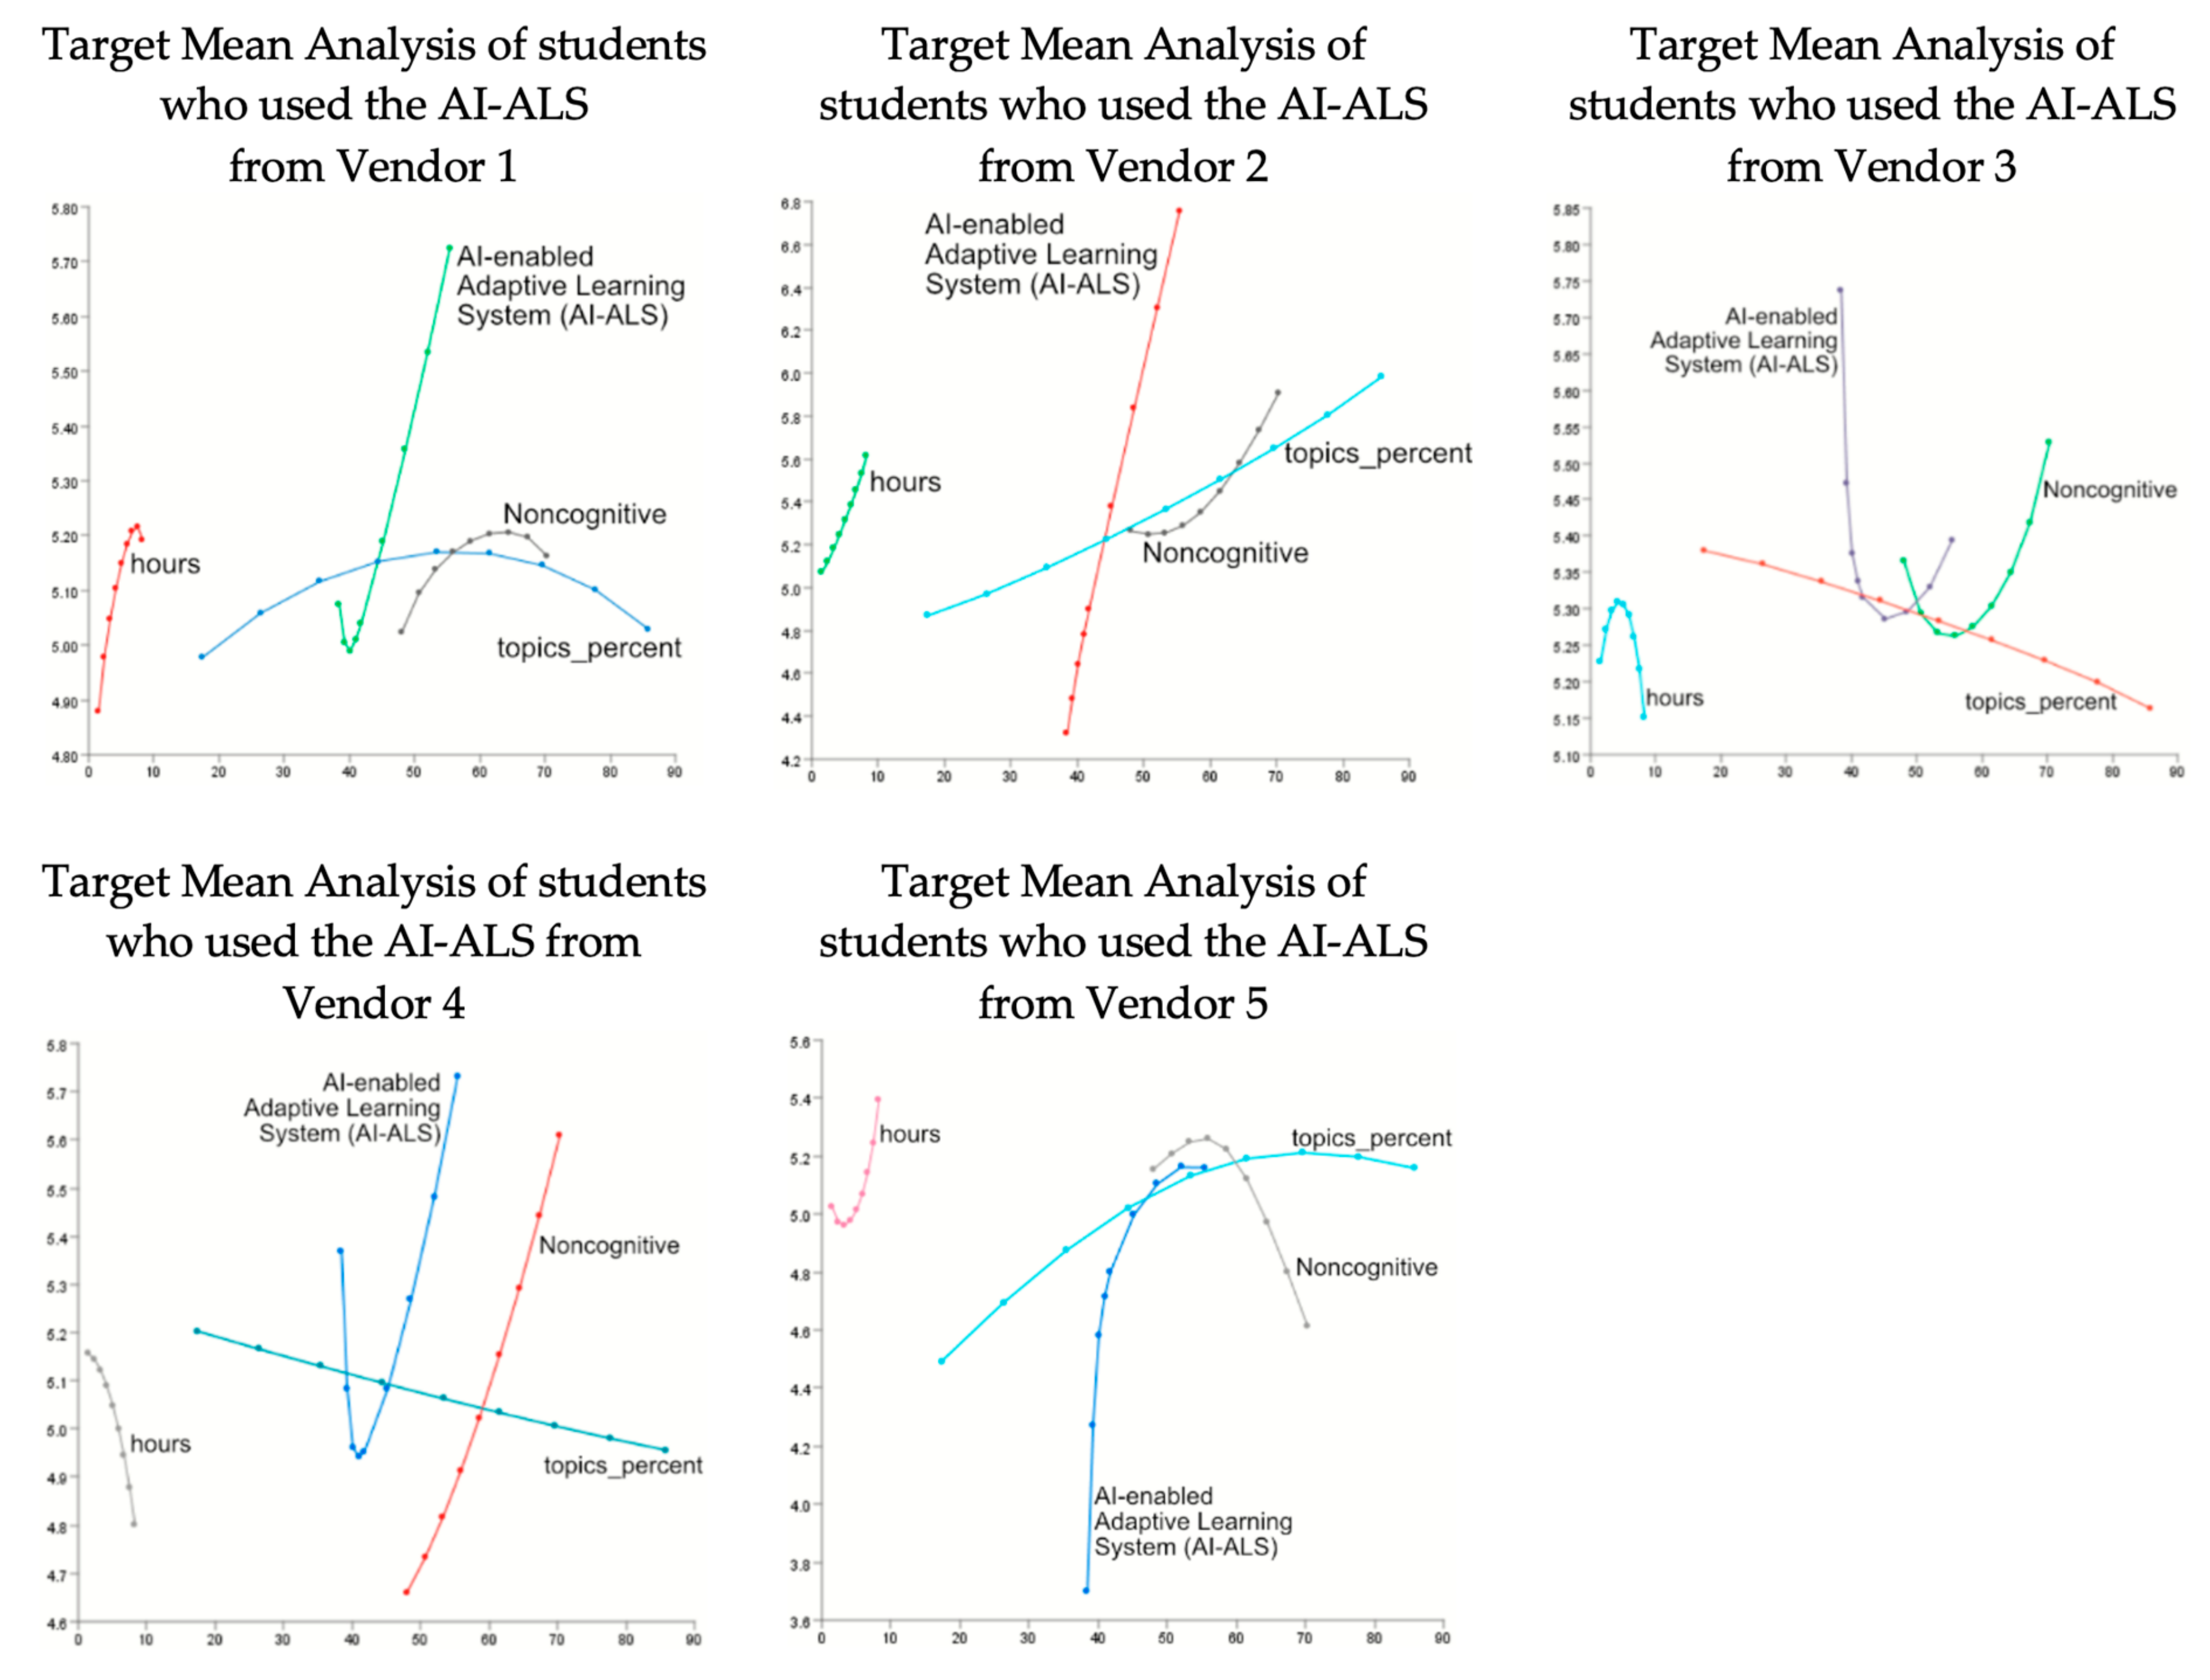
4.7.5. Descriptive Analytics: Oversight Using Curves Analysis of the AI-ALS from the Five Vendors
Another way to visualize the influence of the students’ mastery of the various mathematics topics on their paper-based post-test can be accomplished by using this tool in Baysialab via these steps on the menubar: Bayesialab (validation mode) > Analysis > Visual > Target > Target’s Posterior > Curves > Total Effects.
As observed in
Figure 13, the plots of the data reveal that the relationships between the total effects and the various factors on the target node (that is, the paper-based post-test) could be linear or curvilinear. The curvilinear lines suggest that there might be “peaks” or “valleys” in some of the relationships between the input variables (e.g., the number of hours spent using the AI-ALS, or the quality of the noncognitive factors, or the scores achieved by the students within each AI-ALS, or the percentage of mathematics topics mastered within the AI-ALS) and their respective educational outcomes in the paper-based post-test. With these curves analysis charts, further discussions could be initiated amongst the policy makers, technology vendors, teachers, parents, and students to help improve the learning experiences of the students.
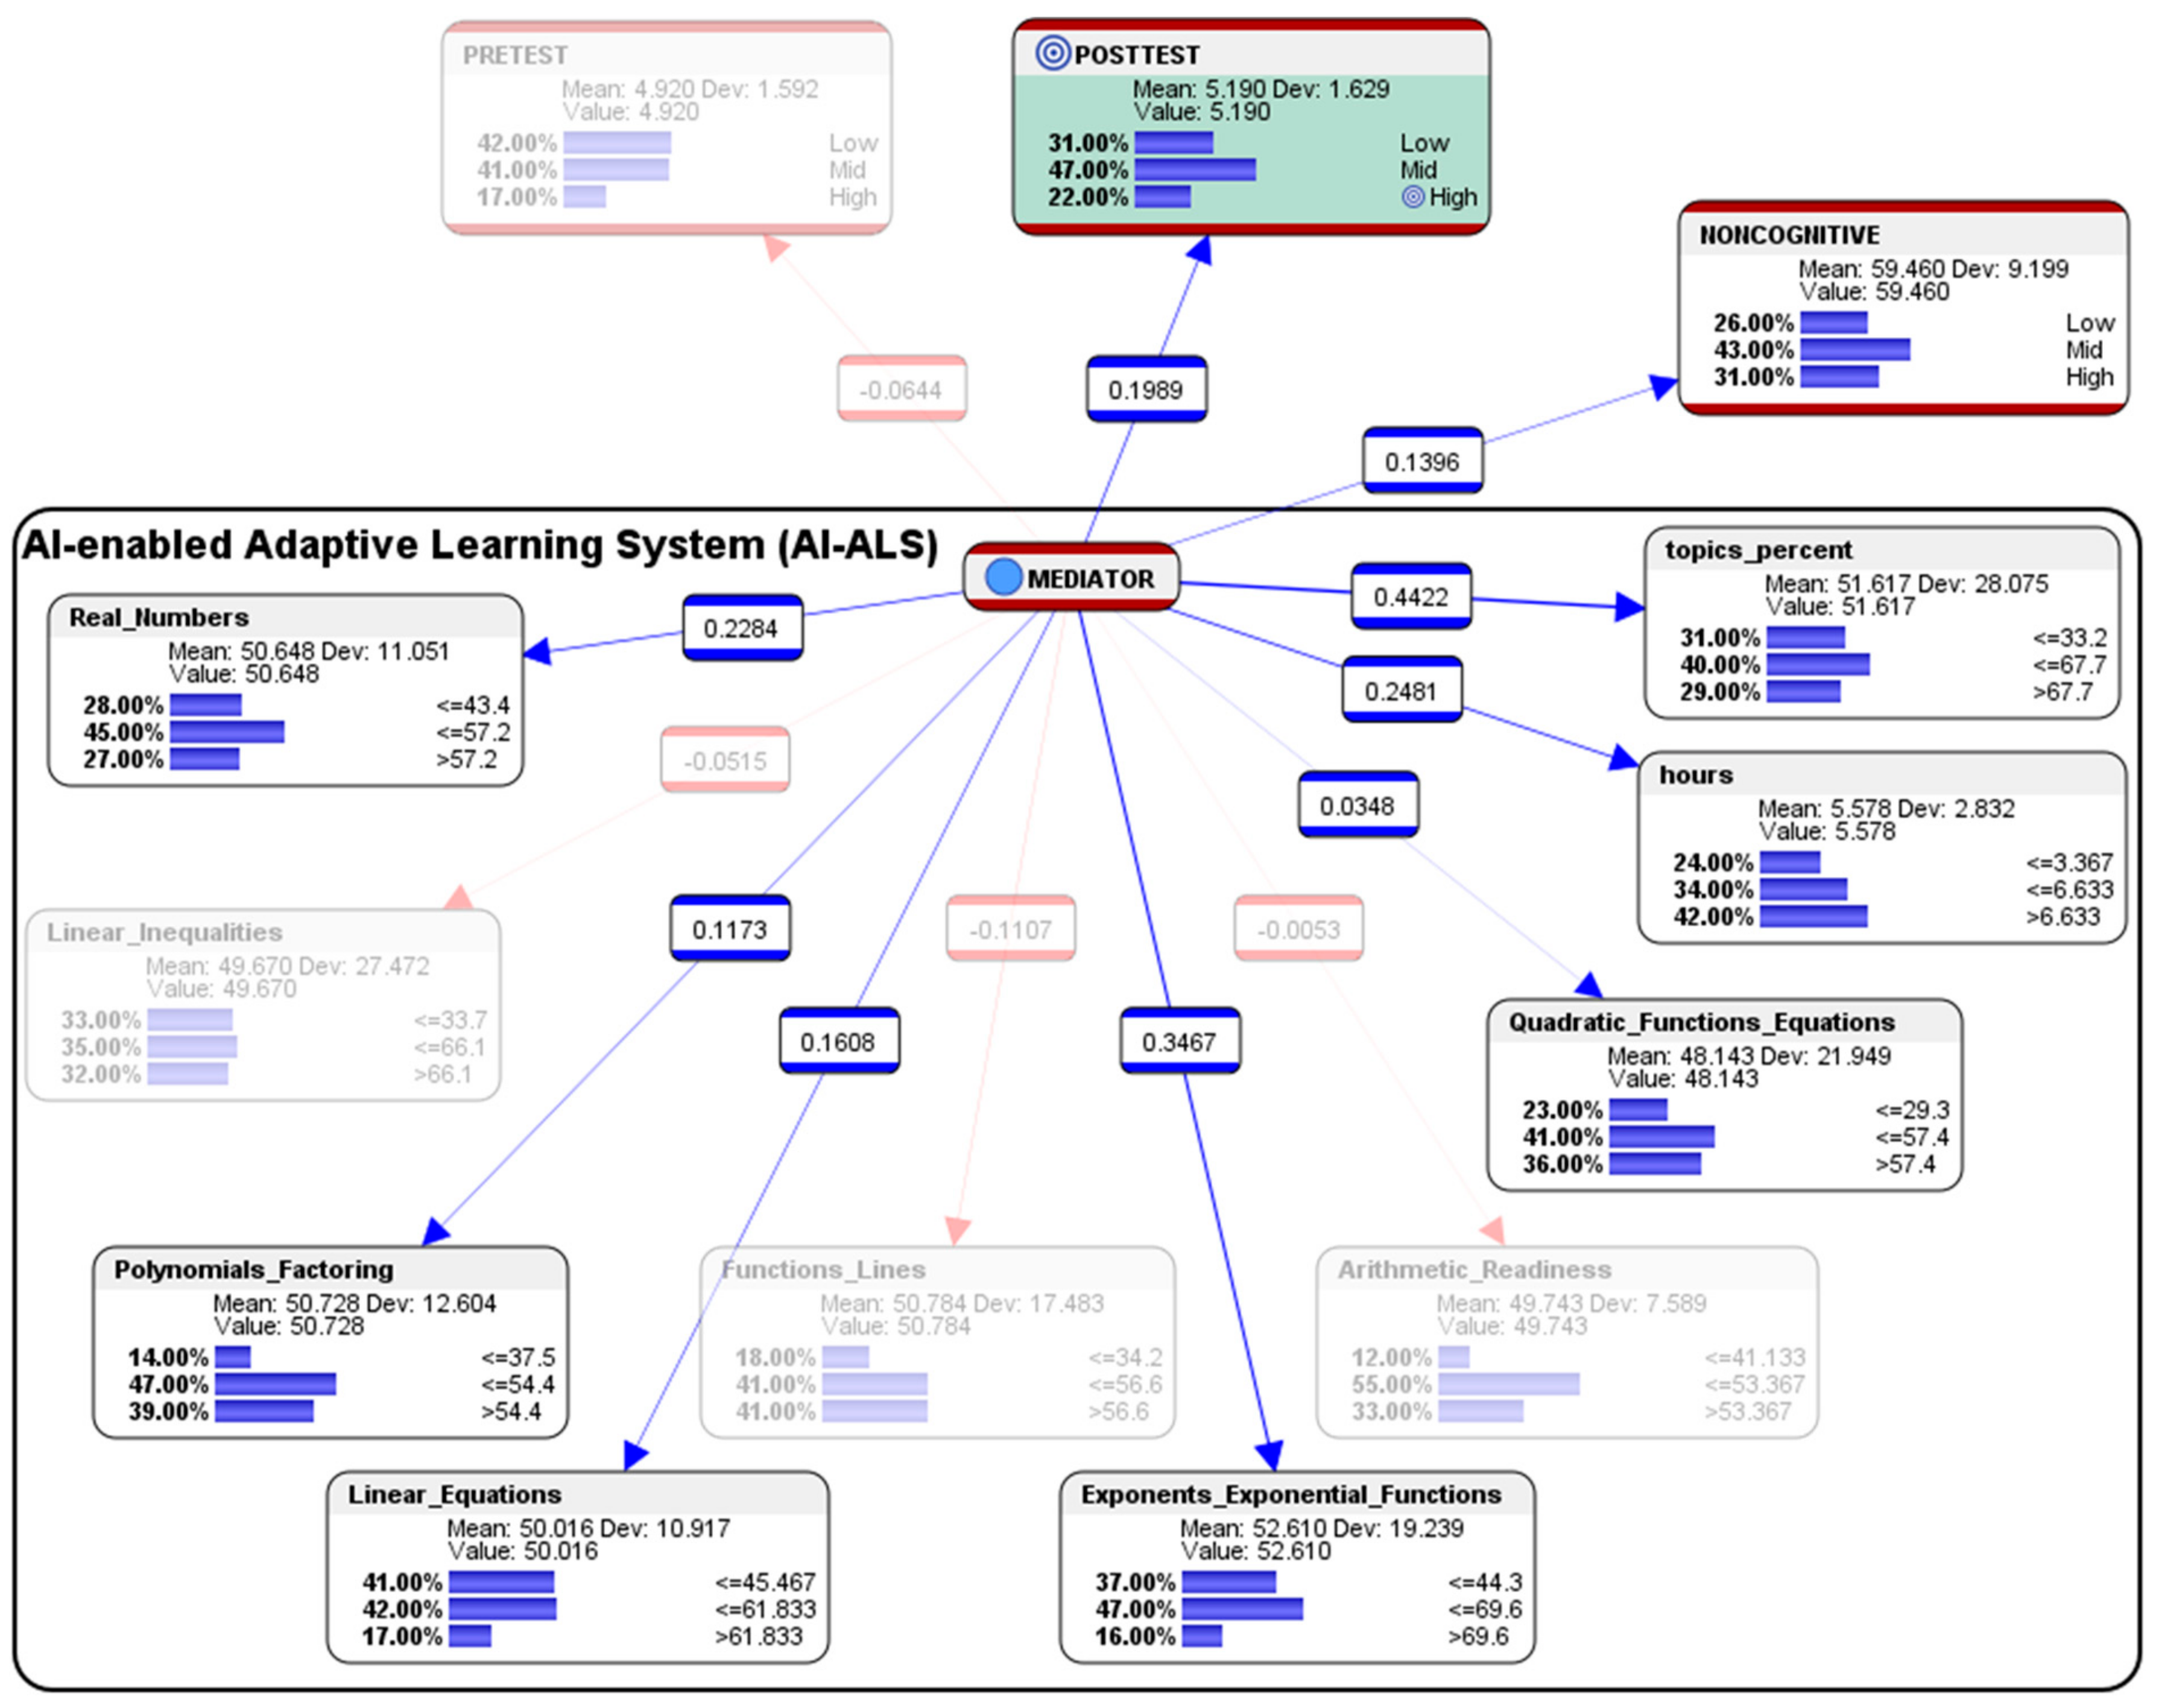
4.7.6. Descriptive Analytics: Pearson Correlation Analysis
Descriptive analytics can also be performed using the Pearson correlation analysis tool in Bayesialab. It can be used for the corroboration of the relationship analyses between the students’ learning performances in the AI-ALS and their corresponding performances in the paper-based post-test. The visualizations of the Pearson correlations can be presented, so that it is easier to see the positive correlations highlighted in blue, and the negative correlations faded out in red (see
Figure 14). This tool can be activated in Bayesialab via these steps on the menubar: Analysis > Visual > Overall > Arc > Pearson Correlation.
One suggestion for interpretation of the negative Pearson correlations could be that the red lines and nodes might represent the regions where the weaknesses of the students were “surfaced” or educed (drawn out) by the AI-ALS. It might not necessarily be an undesirable situation, provided that the teacher could provide remediation to the students so that the gaps that the AI-ALS could not bridge for the students (e.g., if the AI-ALS could not read the students’ workings to pin-point where the mathematical calculation mistakes were for the students) were addressed.
4.7.7. Descriptive Analytics: Oversight of the Gains in the Different Groups of Students
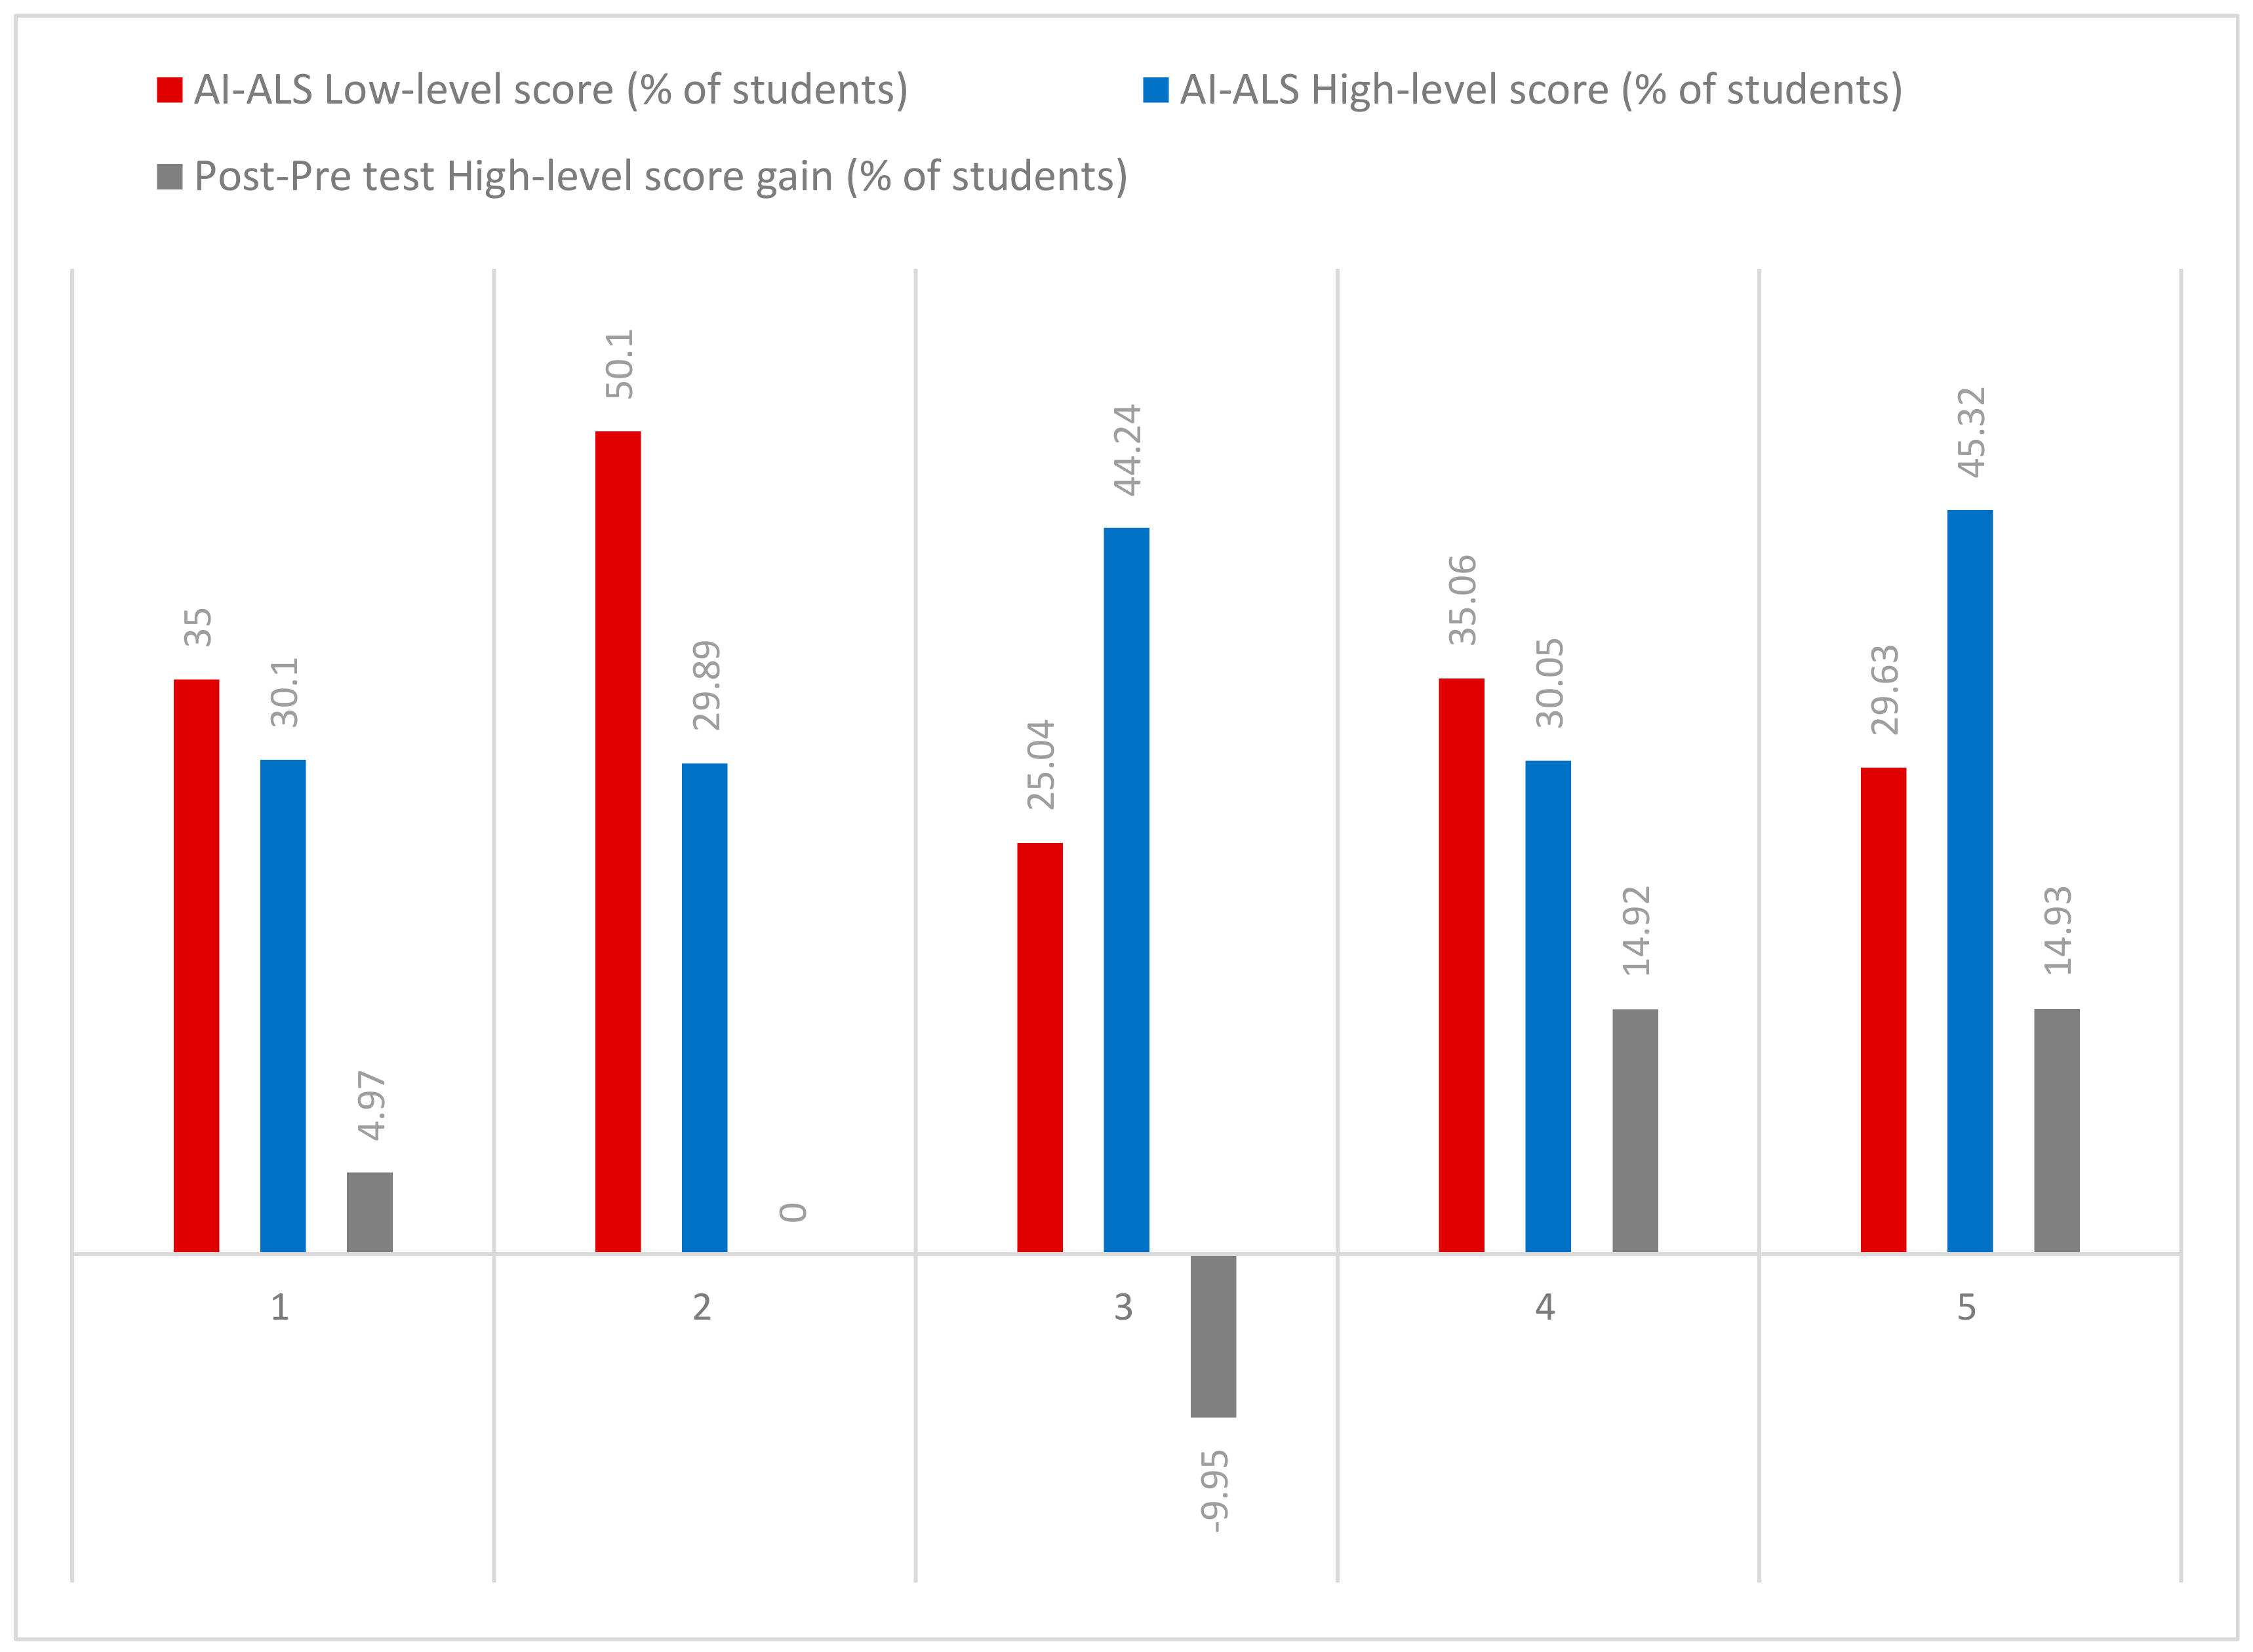
No gain in performance (scores in the post-test vis-à-vis the pre-test) was observed for the students who had used AI-ALS from Vendor 2, and negative gain (the scores in the post-test were lower than those in the pre-test) was observed for the students who had used the AI-ALS from Vendor 3, as observed in
Table 1 and
Figure 15. However, it might not be the fault of the AI-ALS that those students underperformed. Further qualitative interviews with the students might reveal the possible reasons for these preliminary observations.
There seemed to be no clear pattern of correlation between the difficulty of scoring high-level scores or low-level scores within each AI-ALS and the gains in the high-level scores in the paper-based post-test, contrary to what was initially hypothesized by the researcher in
Section 2.2. In other words, making it easy (or even difficult) for the students to score at the high-level might not necessarily result in corresponding high-level gains in the paper-based post-test, probably because of the uniqueness of each AI-ALS and each class of students.
However, although direct comparisons between the five AI-ALS might seem challenging, it would still be possible to predict how the performance of each group of students within their respective AI-ALS could be optimized to achieve high scores in the paper-based post-test. To demonstrate that, “what-if?” predictive analytics would be utilized in the subsequent section.
5. “What-If?” Predictive Analytics
In this section, the following predictive analytics reports will be presented unabridged, in order to delineate how human-centric reasoning could be applied to interpret the counterfactual results that were generated by the AI-based BN model. For better readability, the first letter of the names of the BN nodes and entities would be presented in the upper case.
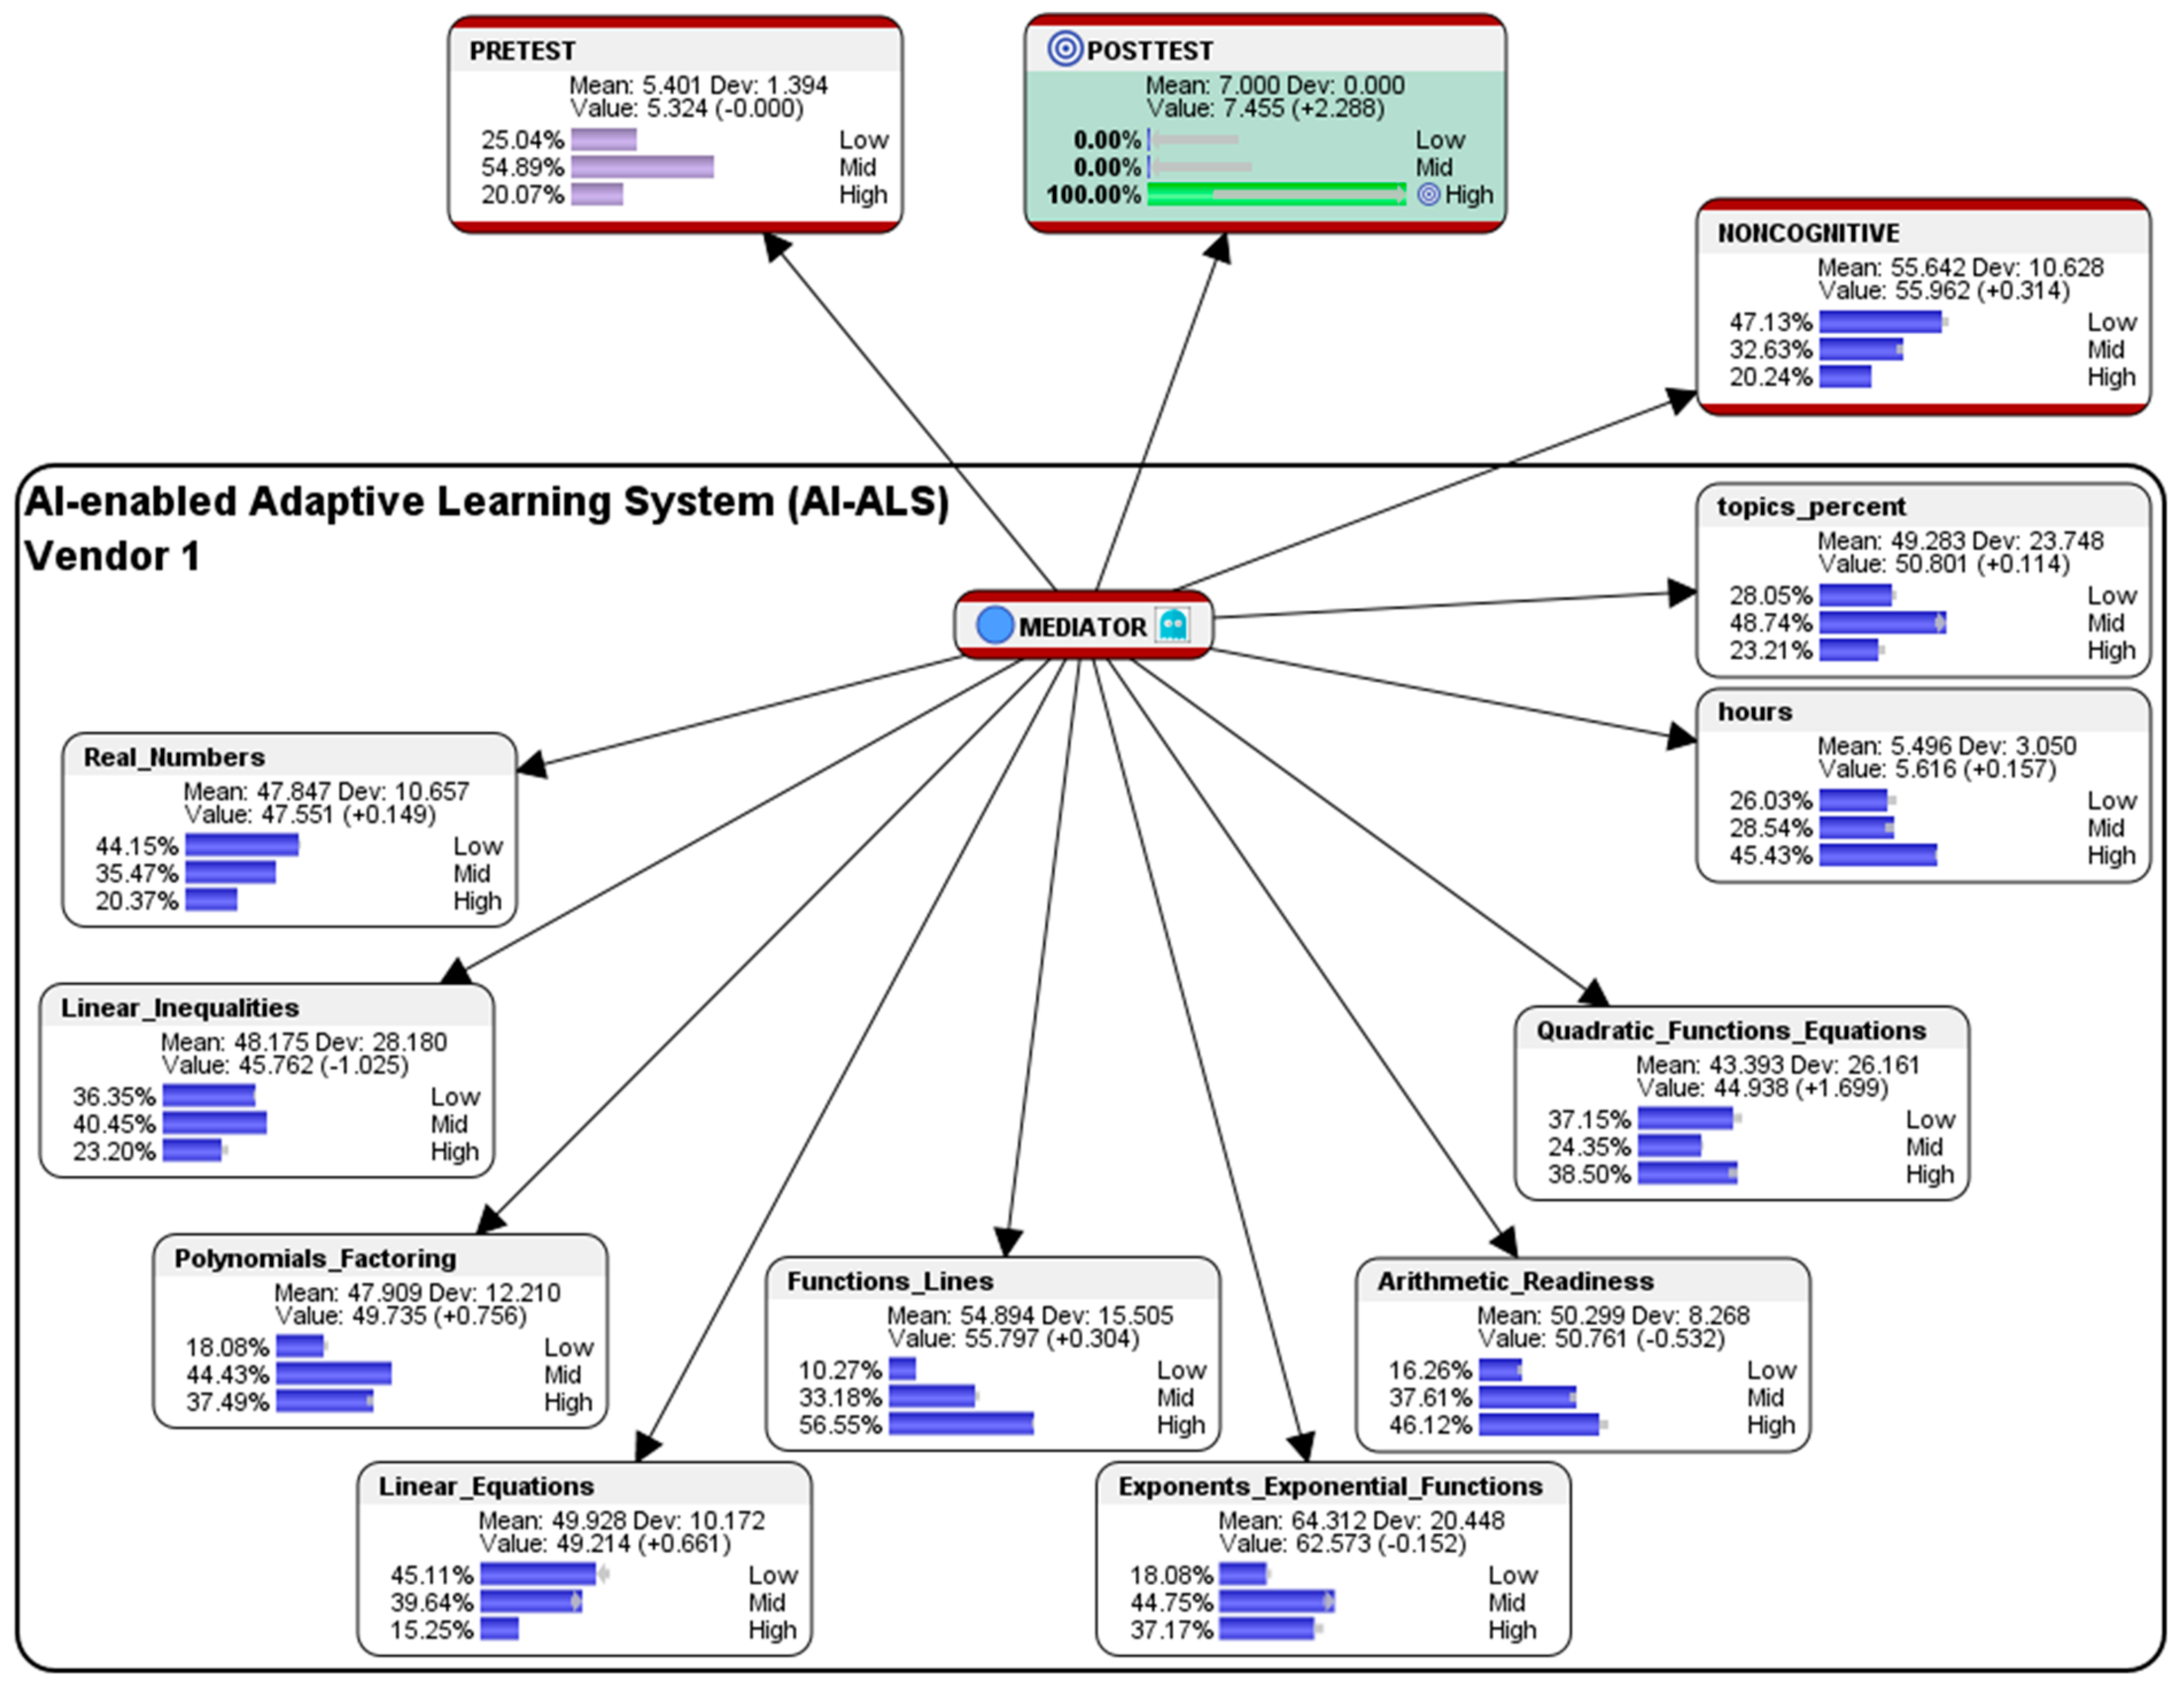
5.1. Simulation of Hypothetical Scenario for Students Who had Used the AI-ALS from Vendor 1
This section presents a sample performance prediction report that could be shared with the educational stakeholders in School 1, so that they could consider having further discussions with their AI-ALS provider to fine-tune the system, e.g., by adjusting the level of difficulty of the questions that are being offered to their students to better correspond to their learning capabilities.
Hypothetical question: what are the conditions needed in the AI-ALS from Vendor 1 and in the noncognitive parameter if we wish that 100% of the students could score at the High-level in the paper-based Post-test?
To predict the conditions that would enable 100% of the students in Class 1, who had used Vendor 1′s AI-ALS to score at the High-level in the paper-based Post-test, hard evidence was set on it (by double-clicking on the High-level histogram bar in Bayesialab). The following counterfactually simulated results of score-clusters were observed (see
Figure 16):
Within the AI-ALS from Vendor 1, in the aggregated Noncognitive factor, ideally 47.13% of the students who had used the AI-ALS from Vendor 1 should be at the so-called Low-level (a lower difference of 2.79% when compared to the original 49.92% of the students who were at the Low-level); 32.63% should be at the Mid-level (a higher difference of 2.61% compared to the original 30.02% of students who were at the Mid-level); and 20.64% should be at the High-level (an almost negligible higher difference of 0.57% as compared to the original 20.07% of students who were at the High-level).
Within the AI-ALS from Vendor 1, in the topic of Real Numbers, ideally 44.15% of the students should score at the Low-level (a slightly lower difference of 0.79% compared to the original 44.94% of the students who scored at the Low-level), 35.47% of the students should score at the Mid-level (a slightly higher difference of 0.48% as compared to the original 34.99% of the students who scored at the Mid-level), and 20.37% of the students should score at the High-level (a slightly higher difference of 0.3% when compared to the original 20.07% of the students who scored at the High-level. The simulated results for the topic of Real Numbers suggest that Vendor 1′s AI-ALS was already performing close to optimum in terms of contributing the students scoring at the High-level for this topic in the paper-based Post-test.
Within the AI-ALS from Vendor 1, in the topic of Linear Inequalities, ideally 36.35% of the students should score at the Low-level (a higher difference of 1.36% as compared to the original 34.99% of the students who scored at the Low-level); 40.45% of the students should score at the Mid-level (an almost negligible higher difference of 0.48% when compared to the original 39.97% of the students who scored at the Mid-level); and, 23.20% of the students should score at the High-level (a slightly lower difference of 1.84% as compared to the original 25.04% of the students who scored at the High-level. The simulated results suggest that, if Vendor 1′s AI-ALS could ideally make it slightly more difficult for students to score at the High-level, it might contribute to their probability of scoring at the High-level for this topic in the paper-based Post-test.
Within the AI-ALS from Vendor 1, in the topic of Polynomials and Factoring, ideally 18.08% of the students should score at the Low-level (a substantially lower difference of 16.91% as compared to the original 49.92% of the students who scored at the Low-level); 44.43% should score at the Mid-level (a higher difference of 9.44% when compared to the original 34.99% of the students who scored at the Mid-level); and, 37.49% should score at the High-level (a substantially higher difference of 22.40% as compared to the original 15.09% of the students who scored at the High-level). The simulated results suggest that, if Vendor 1′s AI-ALS could ideally make it easier for students in Class 1 to score at the High-level, it might contribute to their probability of scoring at the High-level for this topic in the paper-based Post-test.
Within the AI-ALS from Vendor 1, in the topic of Linear Equations, ideally 45.11% of the students should score at the Low-level (a lower difference of 4.81% when compared to the original 49.92% of the students who scored at the Low-level); 39.64% should score at the Mid-level (a lower difference of 4.65% when compared to the original 34.99% of the students who scored at the Mid-level); and, 15.25% should score at the High-level (an almost negligible higher difference of 0.16% when compared to the original 15.09% that scored at the High-level). The simulated results suggest that, if Vendor 1′s AI-ALS could ideally make it slightly easier for students in Class 1 to score at the High-level, it might contribute to their probability of scoring at the High-level for this topic in the paper-based Post-test.
Within the AI-ALS from Vendor 1, in the topic of Functions and Lines, ideally 10.27% of the students should score at the Low-level (an almost negligible higher difference of 0.15% as compared to the original 10.12% of the students who scored at the Low-level); 33.18% should score at the Mid-level (a lower difference of 1.81% when compared to the original 34.99% of the students who scored at the Mid-level); and, 56.55% should score at the High-level (a higher difference of 1.66% compared to the original 54.89% of the students who scored at the High-level). The simulated results suggest that, if Vendor 1′s AI-ALS could ideally make it slightly easier for students in Class 1 to score at the High-level, it might contribute to their probability of scoring at the High-level for this topic in the paper-based Post-test.
Within the AI-ALS from Vendor 1, in the topic of Exponents and Exponential Functions, ideally 18.08% should score at the Low-level (a lower difference of 1.99% as compared to the original 20.07% of the students who scored at the Low-level); 44.75% should score at the Mid-level (a higher difference of 4.78% when compared to the original 39.97% of the students who scored at the Mid-level); and, 37.17% should score at the High-level (a lower difference of 2.8% compared to the original 39.97% of the students who scored at the High-level). The simulated results suggest that, if Vendor 1′s AI-ALS could ideally make it slightly more difficult for students to score at the High-level, it might contribute to their probability of scoring at the High-level for this topic in the paper-based Post-test.
Within the AI-ALS from Vendor 1, in the topic of Arithmetic Readiness, ideally 16.26% should score at the Low-level (a slightly higher difference of 1.17% as compared to the original 15.09% of the students who scored at the Low-level); 37.61% should score at the Mid-level (a higher difference of 2.62% when compared to the original 34.99% of the students who scored at the Mid-level); and, 46.12% should score at the High-level (a lower difference of 3.8% compared to the original 49.92% scored at the High-level). The simulated results suggest that, if Vendor 1′s AI-ALS could ideally make it slightly more difficult for students to score at the High-level, it might contribute to their probability of scoring at the High-level for this topic in the paper-based Post-test.
Within the AI-ALS from Vendor 1, in the topic of Quadratic Functions and Equations, ideally 37.15% of the students should score at the Low-level (a lower difference of 2.82% as compared to the original 39.97% of the students who scored at the Low-level); 24.35% should score at the Mid-level (an almost negligible lower difference of 0.69% when compared to the original 25.04% who scored at the Mid-level); and, 38.50% should score at the High-level (a higher difference of 3.51% as compared to the original 34.99% of the students who scored at the High-level). The simulated results suggest that if Vendor 1′s AI-ALS could ideally make it slightly easier for students in Class 1 to score at the High-level, it might contribute to their probability of scoring at the High-level for this topic in the paper-based Post-test.
Within the AI-ALS by Vendor 1, in the average number of hours spent by each student, ideally 26.03% of the students should be at the Low-level (a lower difference of 3.99% as compared to the original 30.02% of the students who were at the Low-level); 28.54% should be at the Mid-level (a higher difference of 3.5% when compared to the original 25.04% of the students who were at the Mid-level); and 45.43% should be at the High-level (an almost negligible higher difference of 0.49% as compared to the original 44.94% who were at the High-level). The simulated results suggest that more time spent using the AI-ALS might contribute to their probability of scoring at the High-level in the paper-based Post-test.
Within the AI-ALS from Vendor 1, in the percentage of the total number of topics that were mastered by the students in the AI-ALS by Vendor 1, ideally 28.05% of the students should be at the Low-level (a slightly lower difference of 1.97% as compared to the original 30.02% of the students who were at the Low-level); 48.74% should be at the Mid-level (a higher difference of 3.8% compared to the original 44.94% who were at the Mid-level); and, 23.21% should be at the High-level (a lower difference of 1.83% when compared to the original 25.04% who were at the High-level). The simulated results suggest that Vendor 1′s AI-ALS was effective in providing adaptive learning to the students and was contributing well to their probability of scoring high marks in the paper-based Post-test.
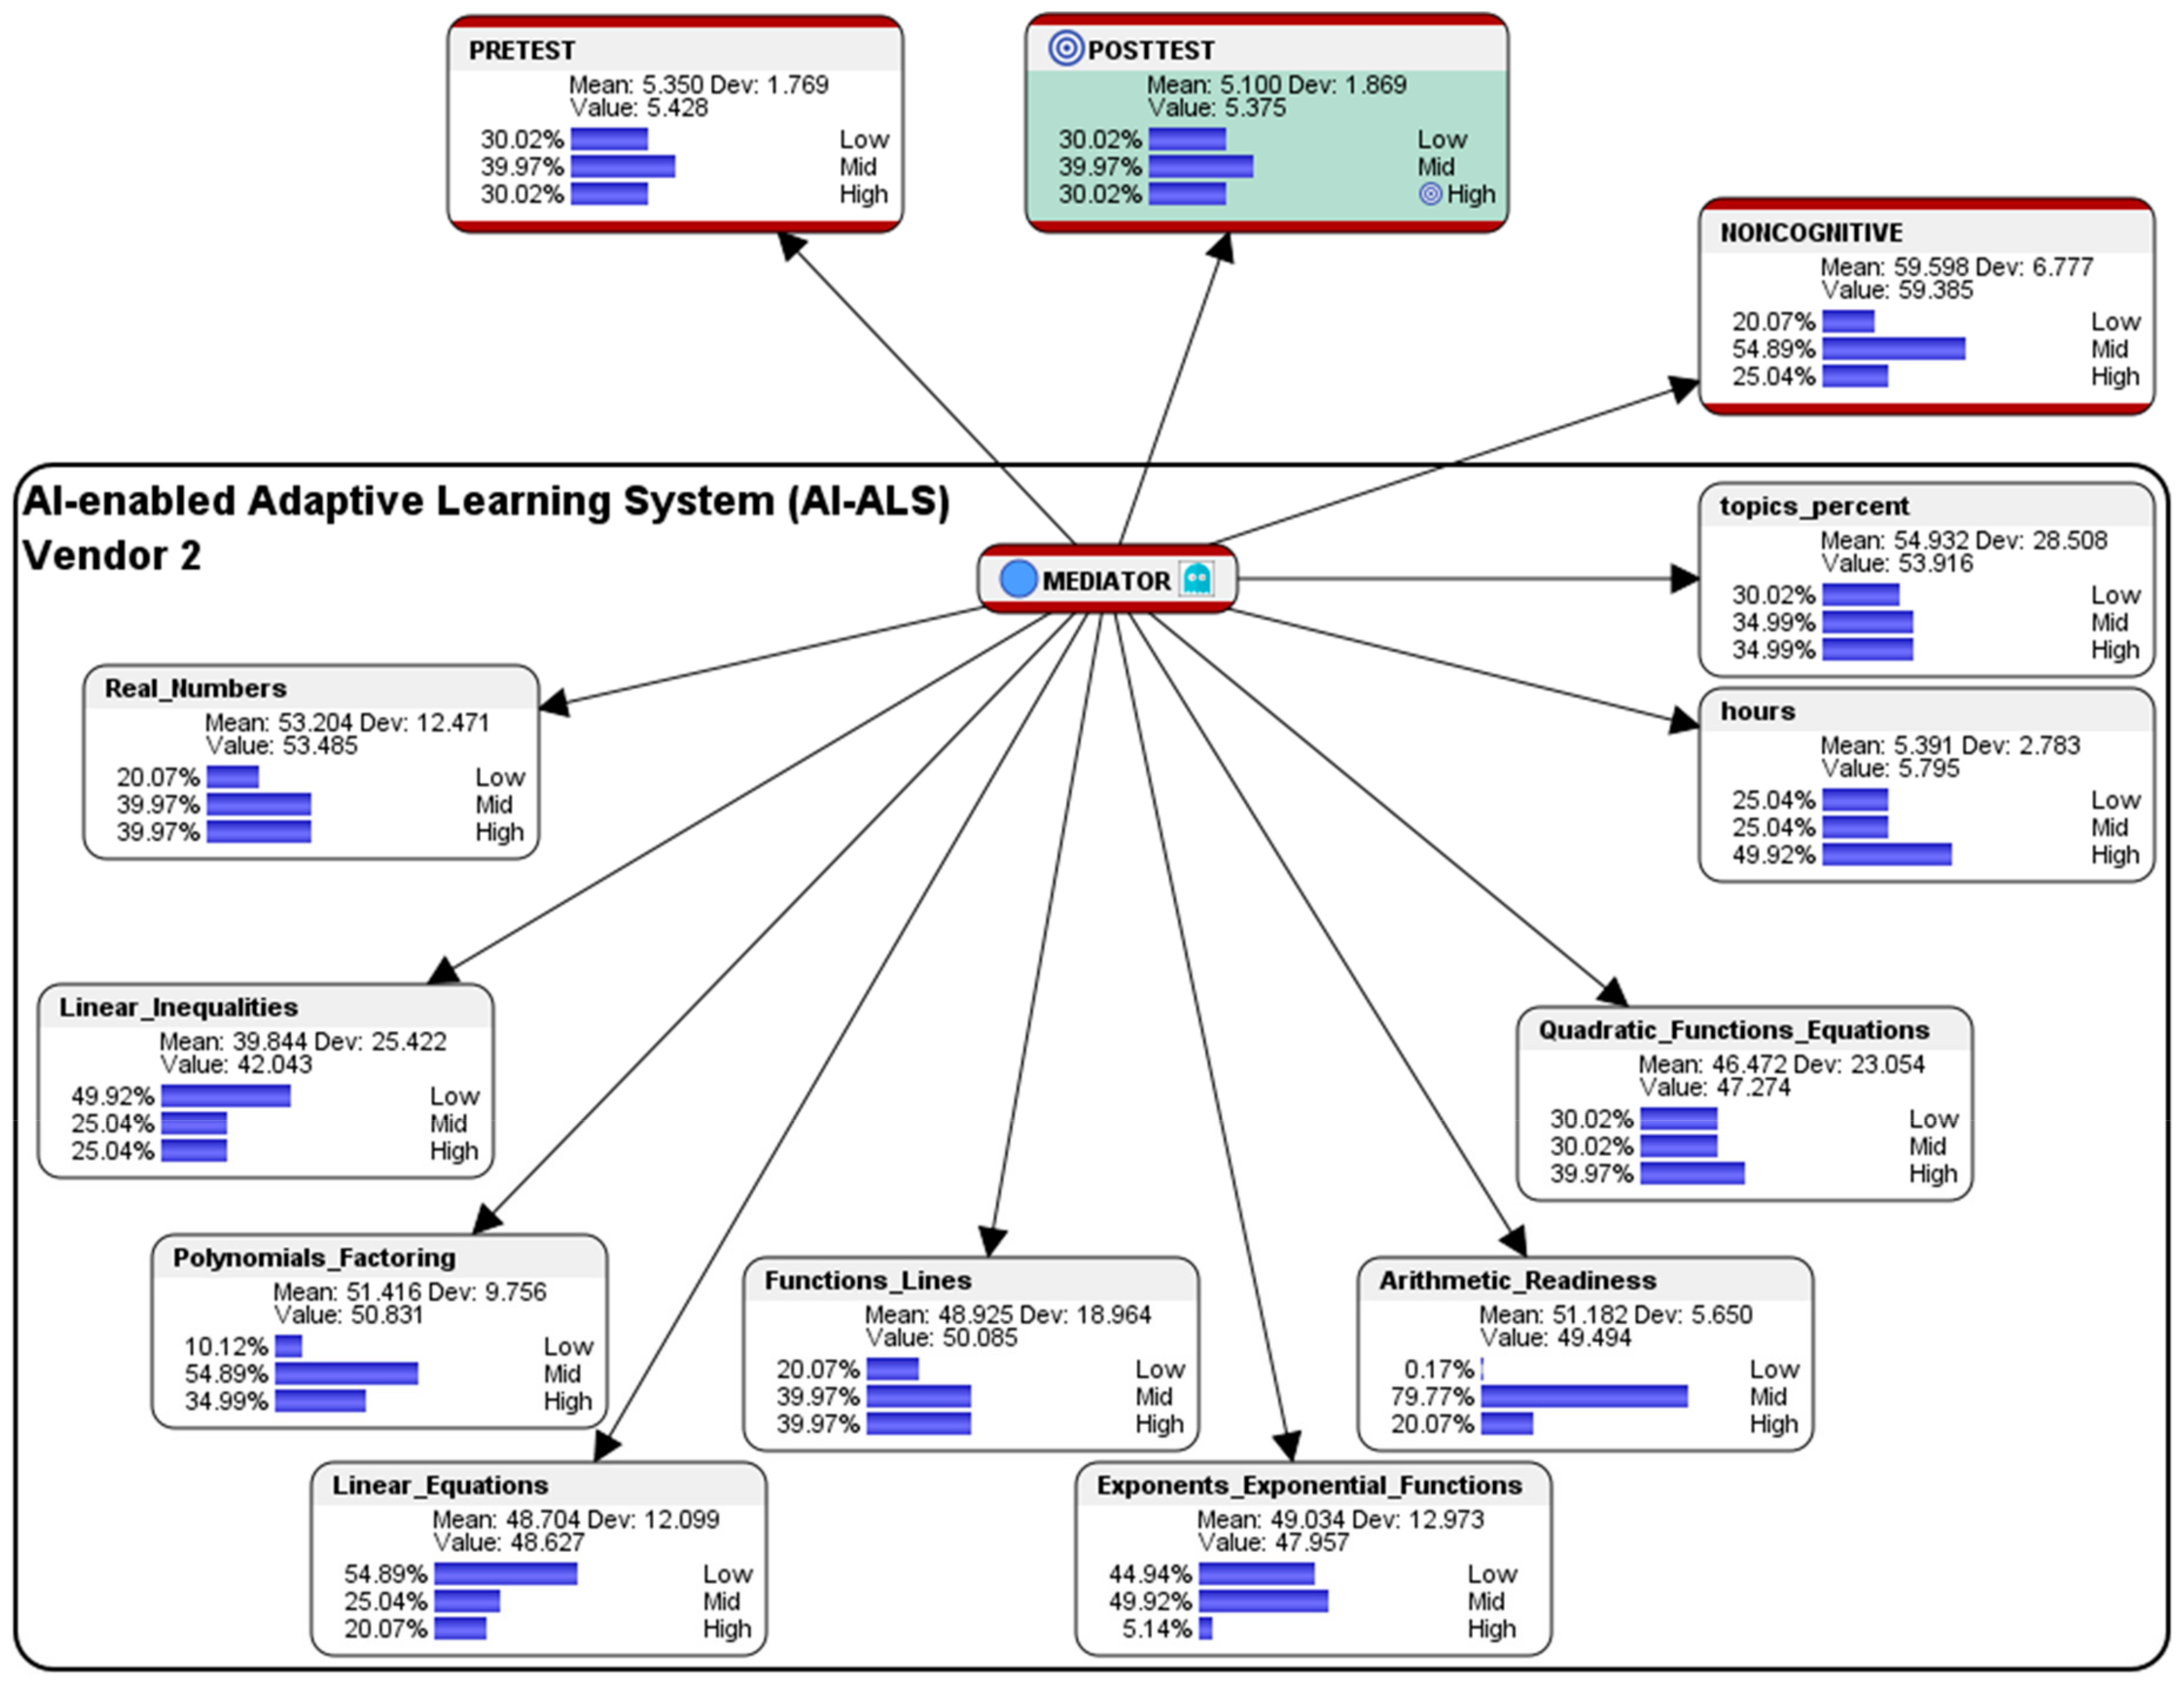
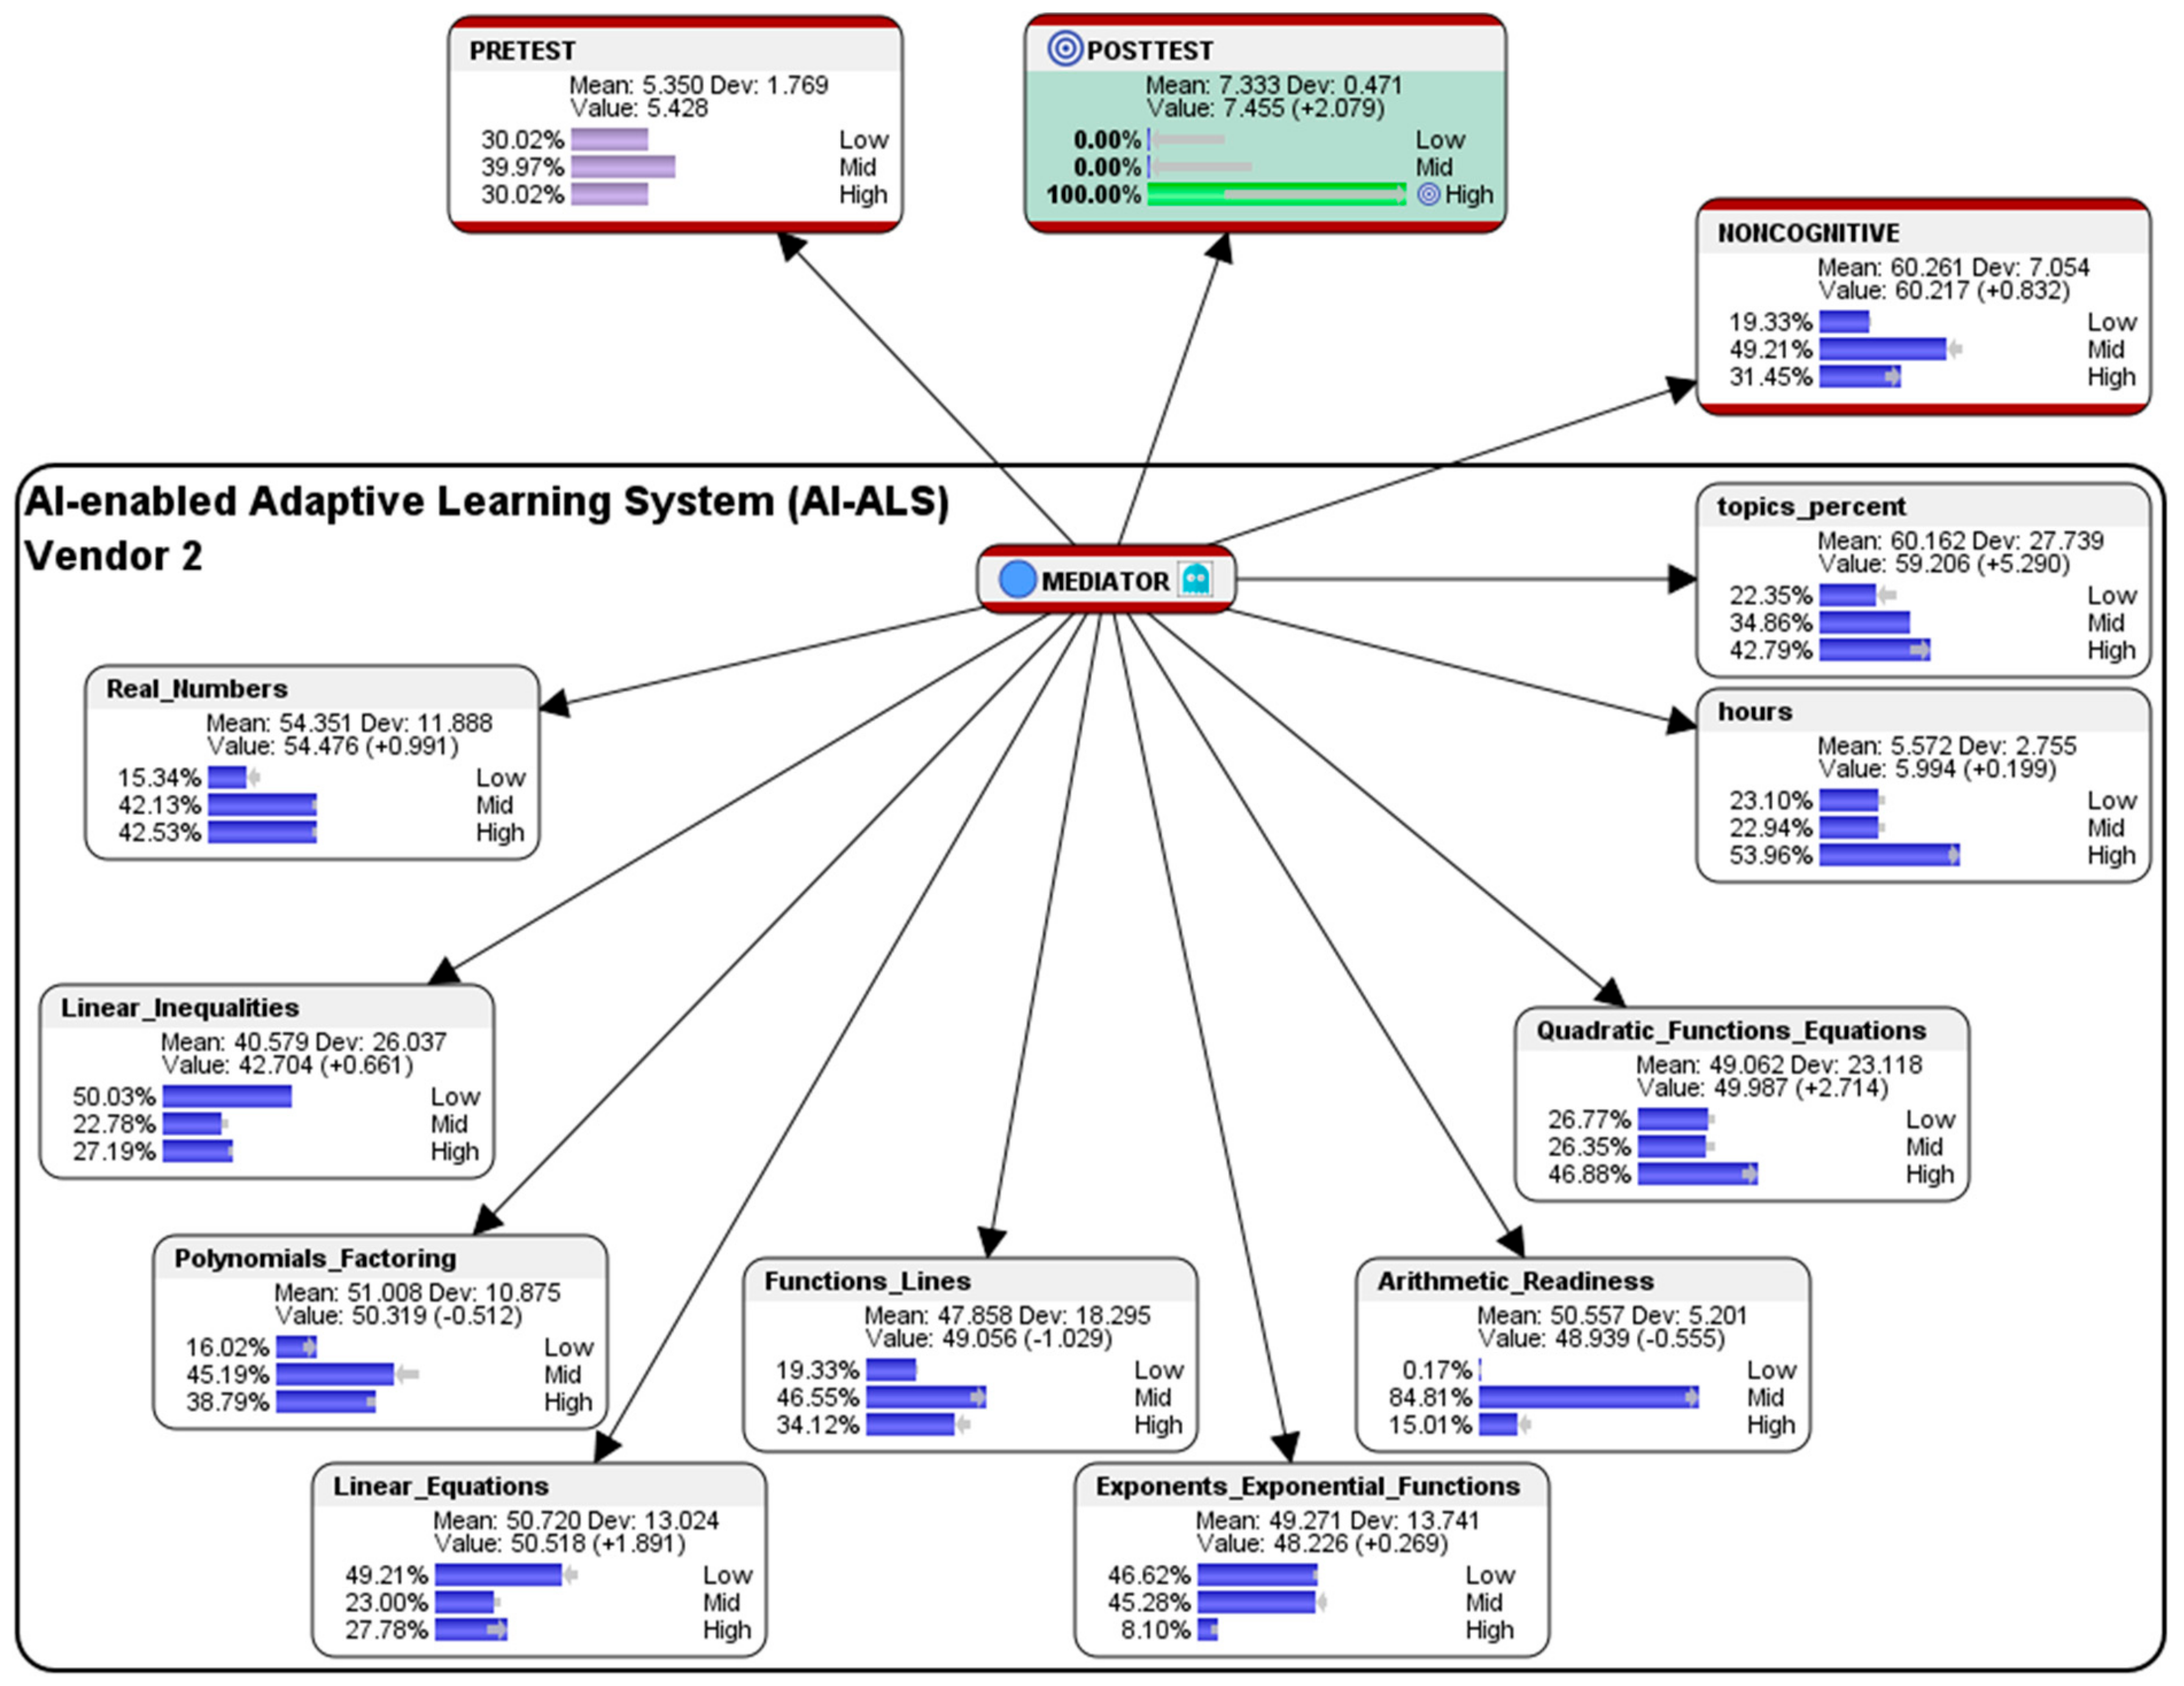
5.2. Simulation of Hypothetical Scenario for Students Who had Used the AI-ALS from Vendor 2
This section presents a sample performance prediction report that could be shared with the educational stakeholders in School 2, so that they could consider having further discussions with their AI-ALS provider to fine-tune the system, e.g., by adjusting the level of difficulty of the questions that are being offered to their students to better correspond to their learning capabilities.
Hypothetical question: what are the conditions needed in the AI-ALS from Vendor 2 and in the noncognitive parameter if we wish that 100% of the students could score at the High-level in the paper-based Post-test?
To predict the conditions that would enable 100% of the students in Class 2 who had used Vendor 2′s AI-ALS to score at the High-level in the paper-based Post-test, hard evidence was set on it (by double-clicking on the High-level histogram bar in Bayesialab). The following counterfactually simulated results of the score-clusters were observed (see
Figure 17):
Within the AI-ALS from Vendor 2, in the aggregated Noncognitive factor, ideally 19.33% of the students who had used the AI-ALS from Vendor 2 should be at the so-called Low-level (an almost negligible lower difference of 0.74% as compared to the original 20.07% of the students who were at the Low-level); 49.21% should be at the Mid-level (a higher difference of 5.68% when compared to the original 54.89% of students who were at the Mid-level); and, 31.45% should be at the High-level (a higher difference of 6.41% as compared to the original 25.04% of students who were at the High-level). The counterfactual results suggest that, if the mid-level and high-level of noncognitive attributes (e.g., emotional intelligence to manage stress, interest in learning mathematics, motivation, level of engagement, etc.) could be increased, it might contribute to their probability of scoring at the High-level in the paper-based Post-test.
Within the AI-ALS from Vendor 2, in the topic of Real Numbers, ideally 15.34% of the students should score at the Low-level (a slightly lower difference of 4.73% as compared to the original 20.07% of the students who scored at the Low-level); 42.13% of the students should score at the Mid-level (a slightly higher difference of 2.16% when compared to the original 39.97% of the students who scored at the Mid-level); and, 42.53% of the students should score at the High-level (a slightly higher difference of 2.56% as compared to the original 39.97% of the students who scored at the High-level. The simulated counterfactual results for the topic of Real Numbers suggest that, if Vendor 2′s AI-ALS could ideally make it slightly easier for students in Class 2 to score at the High-level, it might contribute to their probability of scoring at the High-level for this topic in the paper-based Post-test.
Within the AI-ALS from Vendor 2, in the topic of Linear Inequalities, ideally 50.03% of the students should score at the Low-level (an almost negligible higher difference of 0.11% as compared to the original 49.92% of the students who scored at the Low-level); 22.78% of the students should score at the Mid-level (a slightly lower difference of 2.26% when compared to the original 25.04% of the students who scored at the Mid-level); and, 27.19% of the students should score at the High-level (a slightly higher difference of 2.15% as compared to the original 25.04% of the students who scored at the High-level. The simulated counterfactual results for the topic suggest that, if Vendor 2′s AI-ALS could ideally make it slightly easier for students in Class 2 to score at the High-level, it might contribute to their probability of scoring at the High-level for this topic in the paper-based Post-test.
Within the AI-ALS from Vendor 2, in the topic of Polynomials and Factoring, ideally 16.02% of the students should score at the Low-level (a lower difference of 5.90% as compared to the original 10.12% of the students who scored at the Low-level); 45.19% should score at the Mid-level (a substantially lower difference of 9.70% when compared to the original 54.89% of the students who scored at the Mid-level); and, 38.79% should score at the High-level (a slightly higher difference of 3.80% compared to the original 34.99% of the students who scored at the High-level). The simulated results suggest that, if Vendor 2′s AI-ALS could ideally make it slightly easier for students in Class 2 to score at the High-level, it might contribute to their probability of scoring at the High-level for this topic in the paper-based Post-test.
Within the AI-ALS from Vendor 2, in the topic of Linear Equations, ideally 49.21% of the students should score at the Low-level (a lower difference of 5.68% when compared to the original 54.89% of the students who scored at the Low-level); 23.00% should score at the Mid-level (a lower difference of 2.04% when compared to the original 25.04% of the students who scored at the Mid-level); and 27.78% should score at the High-level (a higher difference of 7.71% when compared to the original 20.07% who scored at the High-level). The simulated results suggest that, if Vendor 2′s AI-ALS could ideally make it slightly easier for students in Class 2 to score at the High-level, it might contribute to their probability of scoring at the High-level for this topic in the paper-based Post-test.
Within the AI-ALS from Vendor 2, in the topic of Functions and Lines, ideally 19.33% of the students should score at the Low-level (an almost negligible lower difference of 0.74% as compared to the original 20.07% of the students who scored at the Low-level); 46.55% should score at the Mid-level (a higher difference of 6.58% when compared to the original 39.97% of the students who scored at the Mid-level); and, 34.12% should score at the High-level (a lower difference of 5.85% compared to the original 39.97% of the students who scored at the High-level). The simulated results suggest that if Vendor 2′s AI-ALS could ideally make it more difficult for students in Class 2 to score at the High-level, it might contribute to their probability of scoring at the High-level for this topic in the paper-based Post-test.
Within the AI-ALS from Vendor 2, in the topic of Exponents and Exponential Functions, ideally 46.62% should score at the Low-level (a slightly higher difference of 1.68% when compared to the original 44.94% of the students who scored at the Low-level); 45.28% should score at the Mid-level (a lower difference of 4.64% as compared to the original 49.92% of the students who scored at the Mid-level); and, 8.10% should score at the High-level (a lower difference of 2.96% compared to the original 5.14% of the students who scored at the High-level). The simulated results suggest that, if Vendor 2′s AI-ALS could ideally make it slightly easier for students to score at the High-level, it might contribute to their probability of scoring at the High-level for this topic in the paper-based Post-test.
Within the AI-ALS from Vendor 2, in the topic of Arithmetic Readiness, ideally 0.17% should score at the Low-level (a difference of 0.00% as compared to the original 0.17% of the students who scored at the Low-level); 84.81% should score at the Mid-level (a higher difference of 5.04% compared to the original 79.77% of the students who scored at the Mid-level); and, 15.01% should score at the High-level (a lower difference of 5.06% compared to the original 20.07% who scored at the High-level). The simulated results suggest that, if Vendor 2′s AI-ALS could ideally make it slightly more difficult for students to score at the High-level, it might contribute to their probability of scoring at the High-level for this topic in the paper-based Post-test.
Within the AI-ALS from Vendor 2, in the topic of Quadratic Functions and Equations, ideally 26.77% of the students should score at the Low-level (a lower difference of 3.25% when compared to the original 30.02% of the students who scored at the Low-level); 26.35% should score at the Mid-level (a lower difference of 3.67% as compared to the original 30.02% who scored at the Mid-level); and, 46.88% should score at the High-level (a higher difference of 6.91% when compared to the original 39.97% of the students who scored at the High-level). The simulated results suggest that, if Vendor 2′s AI-ALS could ideally make it easier for students in Class 2 to score at the High-level, it might contribute to their probability of scoring at the High-level for this topic in the paper-based Post-test.
Within the AI-ALS by Vendor 2, in the average number of hours spent by each student, ideally 23.10% of the students should be at the Low-level (a lower difference of 1.94% as compared to the original 25.04% of the students who were at the Low-level); 22.94% should be at the Mid-level (a slightly lower difference of 2.10% when compared to the original 25.04% of the students who were at the Mid-level), and, 53.96% should be at the High-level (a slightly higher difference of 4.04% as compared to the original 49.92% who were at the High-level). The simulated results suggest that if the students could spend more time learning mathematics within Vendor 2’s AI-ALS, it could contribute to their probability of scoring at the High-level in the paper-based Post-test.
Within the AI-ALS from Vendor 2, in the percentage of the total number of topics that were mastered by the students, ideally 22.35% of the students should be at the Low-level (a slightly higher difference of 7.67% as compared to the original 30.02% of the students who were at the Low-level); 34.86% should be at the Mid-level (an almost negligible lower difference of 0.13% compared to the original 34.99% who were at the Mid-level); and, 42.79% should be at the High-level (a higher difference of 7.8% compared to the original 34.99% who were at the High-level). The simulated results suggest that if the students could master a higher percentage of topics within Vendor 2′s AI-ALS, it could contribute to their probability of scoring at the High-level in the paper-based Post-test.
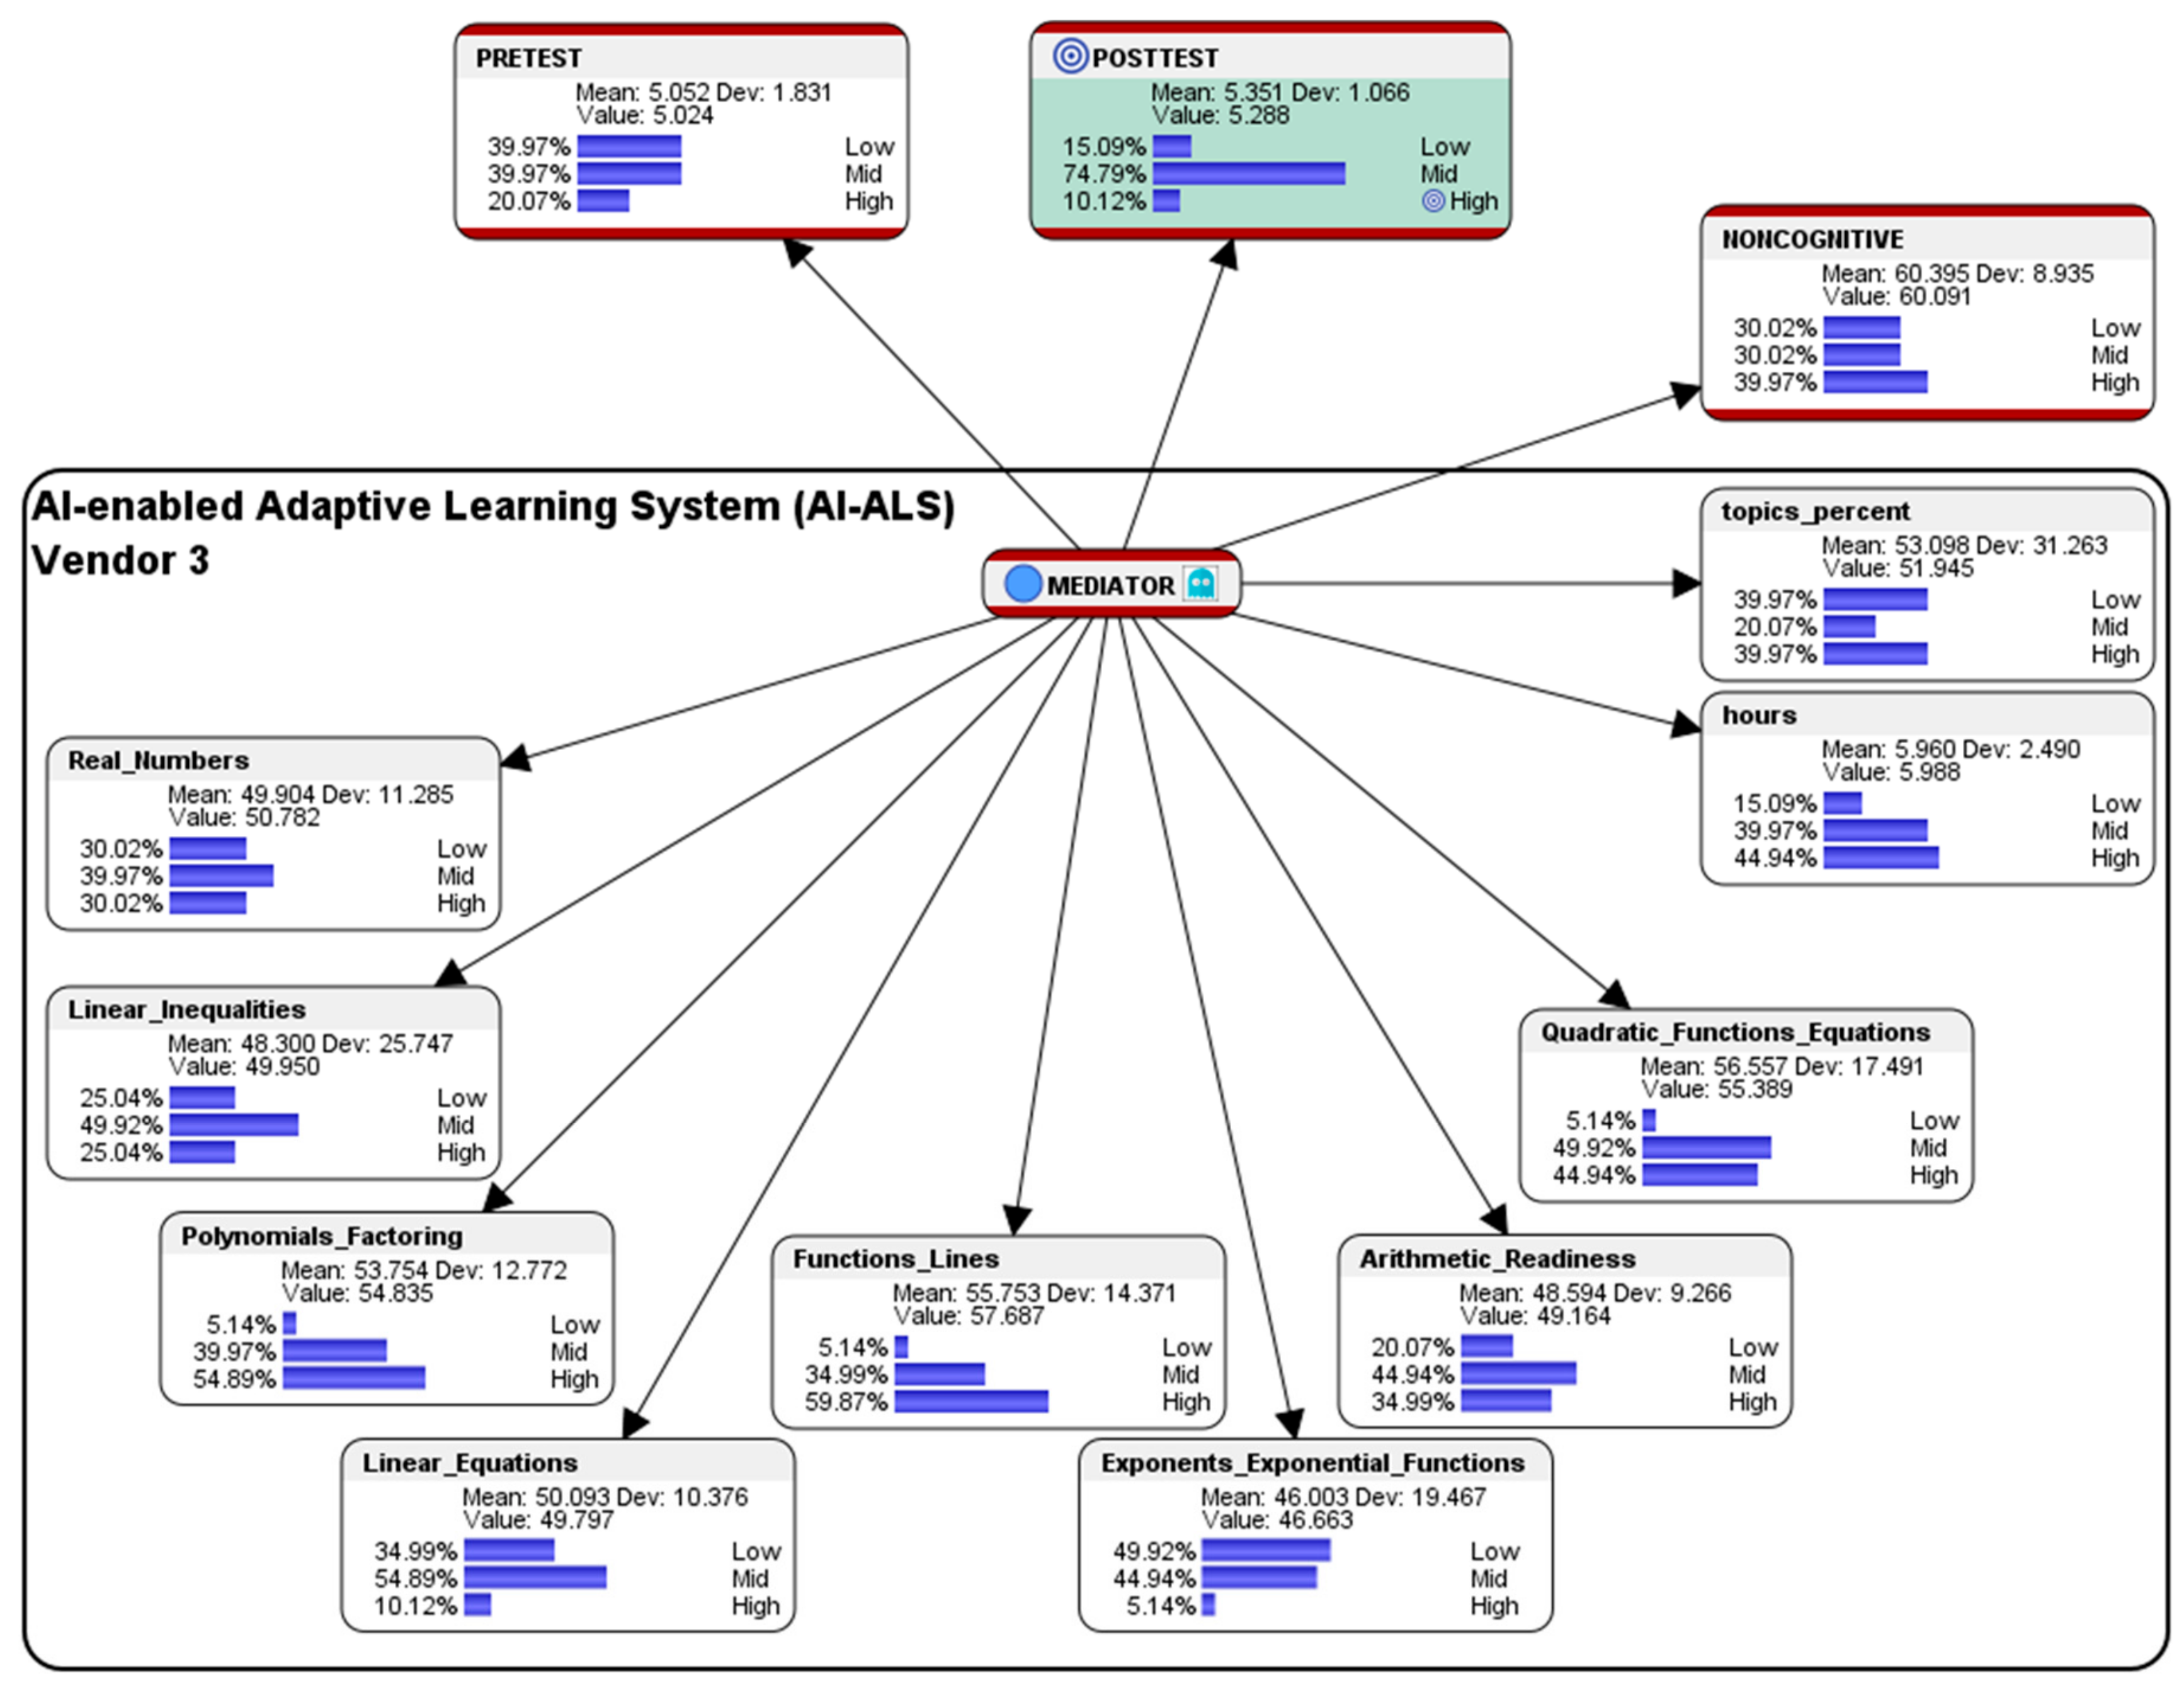
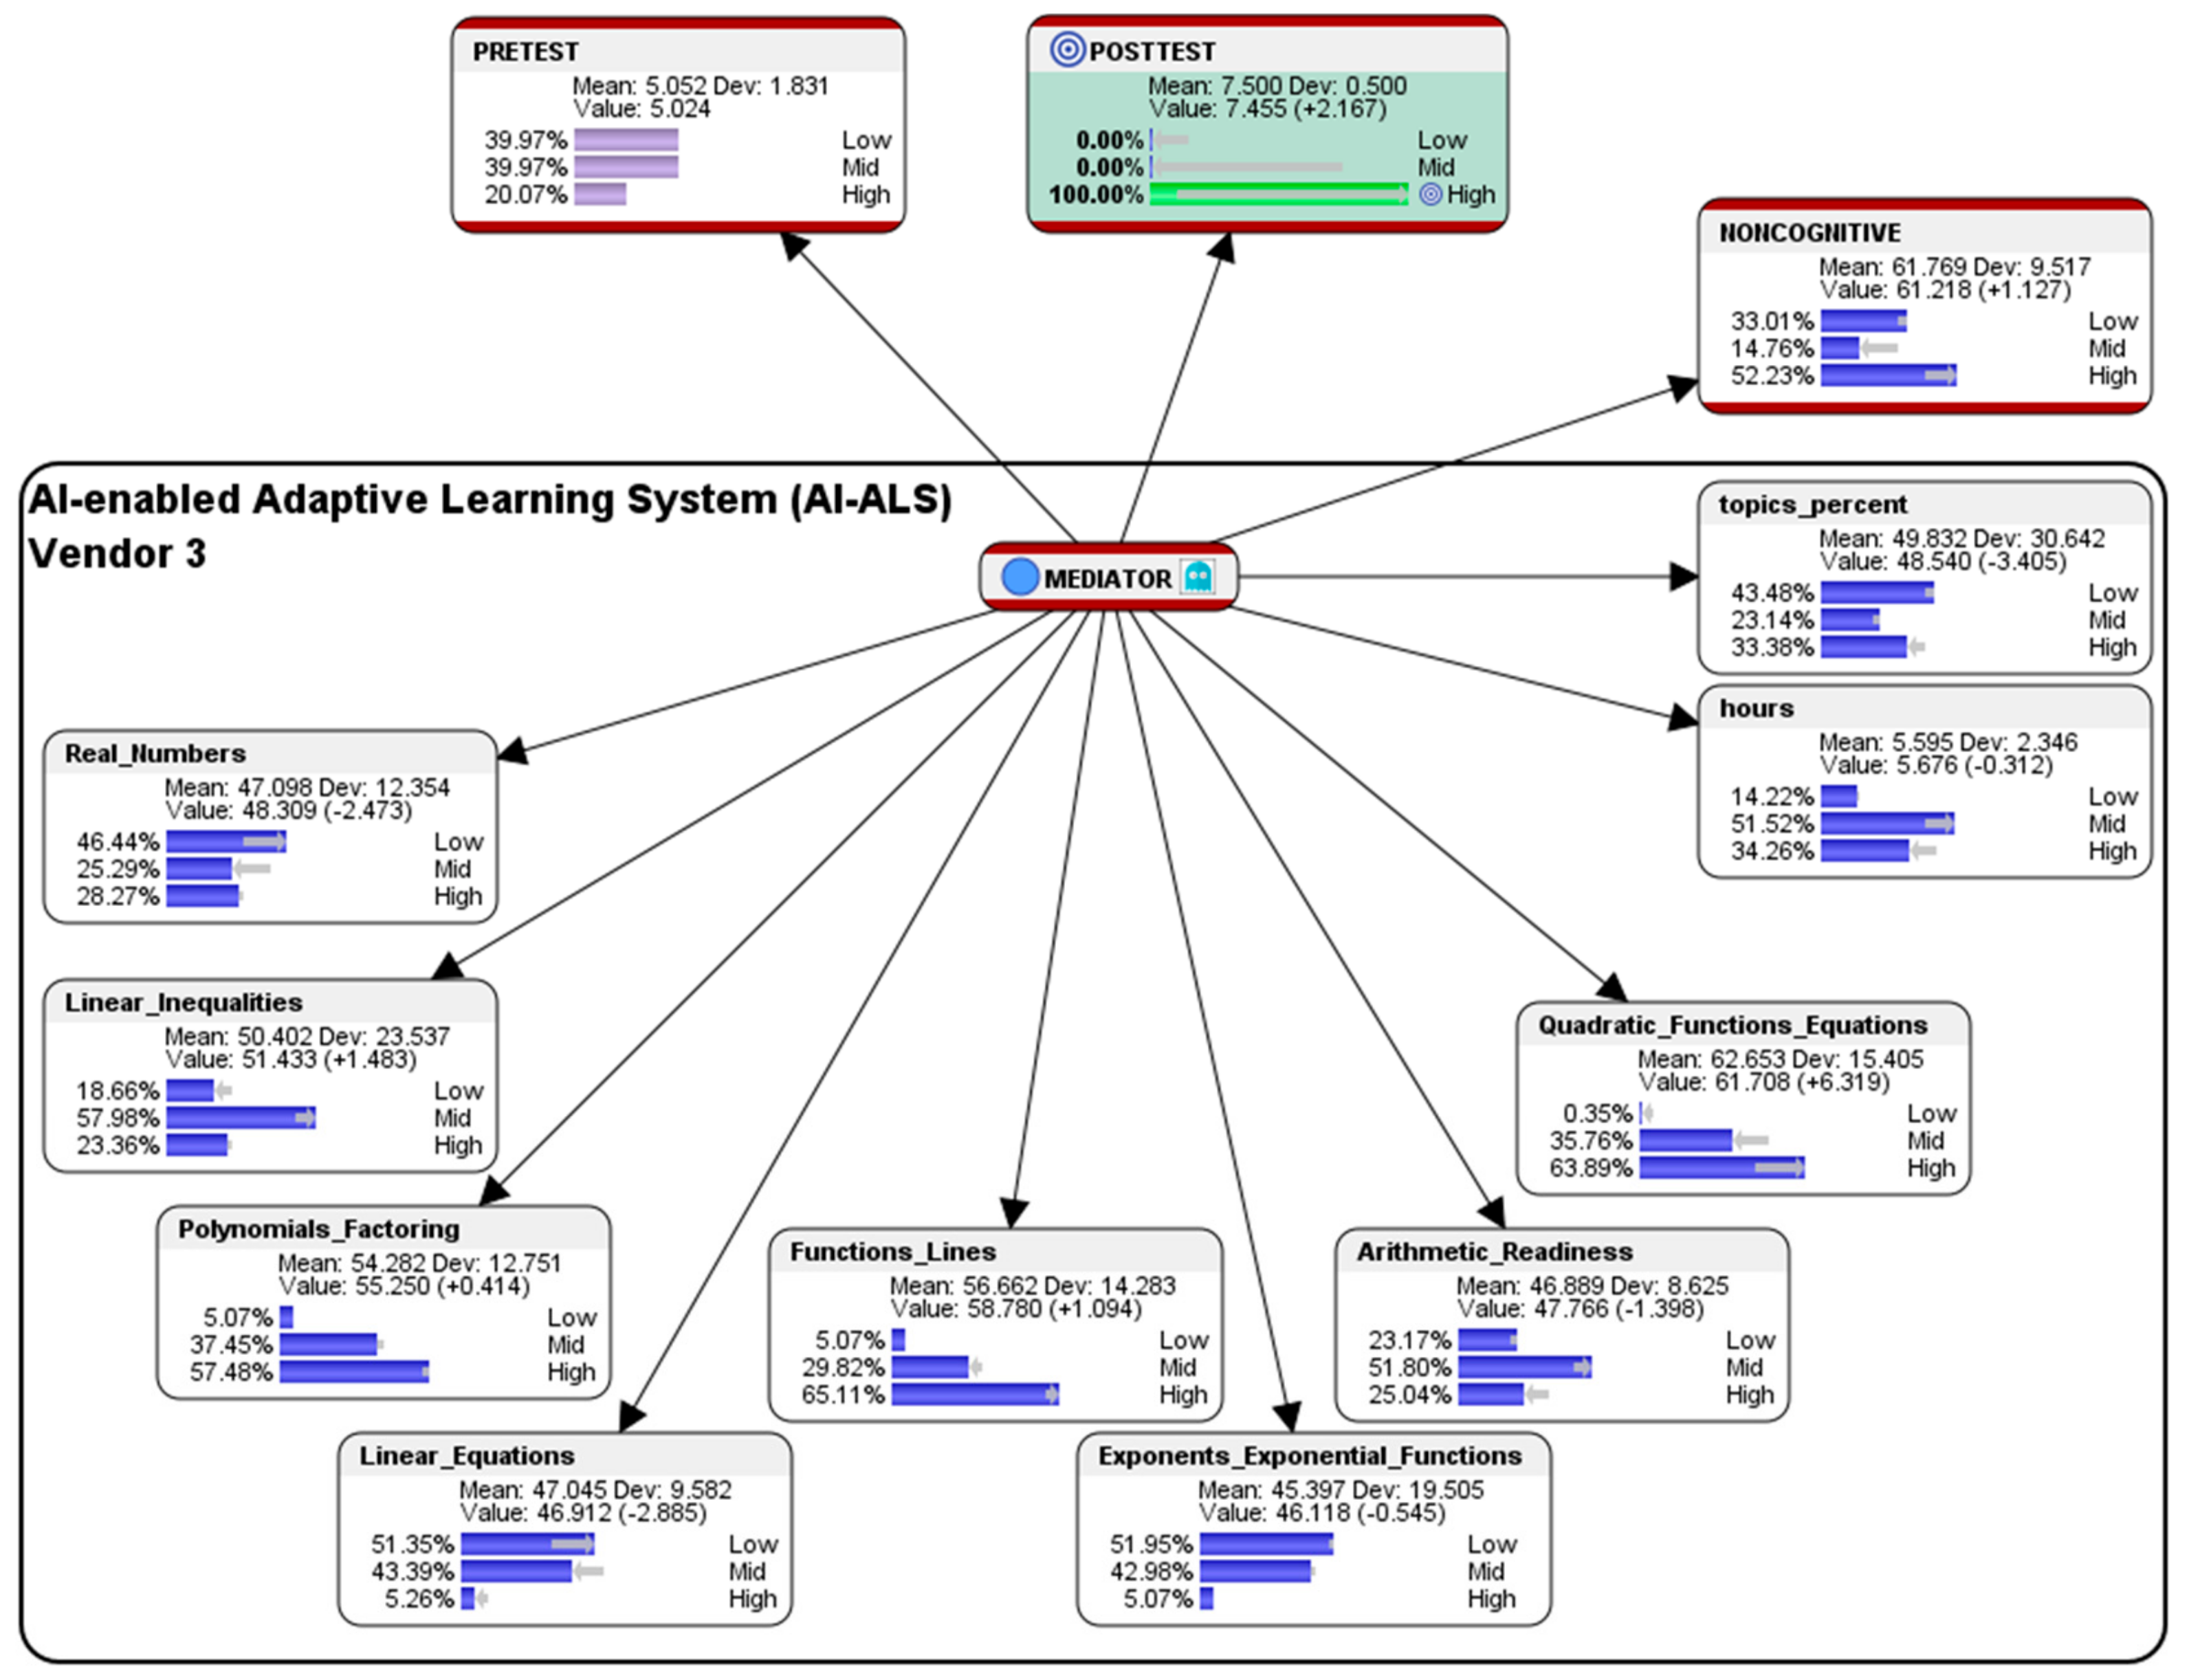
5.3. Simulation of Hypothetical Scenario for Students Who had Used the AI-ALS from Vendor 3
This section presents a sample performance prediction report that could be shared with the educational stakeholders in School 3, so that they could consider having further discussions with their AI-ALS provider to fine-tune the system, e.g., by adjusting the level of difficulty of the questions that are being offered to their students to better correspond to their learning capabilities.
Hypothetical question: what are the conditions that are needed in the AI-ALS from Vendor 3 and in the noncognitive parameter if we wish that 100% of the students could score at the High-level in the paper-based Post-test?
Here is an opportunity that the following analysis can be used as a starting point for discussions to foster strategic coordination between the educational stakeholders and Vendor 3 which provided the AI-ALS. As previously observed in
Table 1 and
Figure 15, there was a decrease in the number of students who scored at the High-level of the marks in the paper-based post-test. Realistically, since the algorithm with which the AI-ALS from Vendor 3 interacts with the students cannot be changed much, if at all, the mathematics teacher would have to provide remediation for the students. The AI-ALS from Vendor 3 might not be a good choice in the selection for in-service deployment from the perspective of the policy makers and educational stakeholders, as it might be realistically impractical to ask Vendor 3 to change their proprietary algorithm to suit the students of Class 3. However, the simulated counterfactual results (see
Figure 18) could still be used as a guide for remediation by the teacher to “level-up” the students in the mathematics topics that they might be weaker in.
To predict the conditions that would enable 100% of the students in Class 3 who had used Vendor 3′s AI-ALS to score at the High-level in the paper-based Post-test, hard evidence was set on it (by double-clicking on the High-level histogram bar in Bayesialab). The following counterfactually simulated results of score-clusters were observed (see
Figure 18):
In the aggregated Noncognitive factor, ideally 33.01% of the students who had used the AI-ALS from Vendor 3 should be at the so-called Low-level (a slightly higher difference of 2.99% compared to the original 30.02% of the students who were at the Low-level); 14.76% should be at the Mid-level (a substantially lower difference of 15.26% as compared to the original 30.02% of students who were at the Mid-level); and, 50.23% should be at the High-level (a substantially higher difference of 10.26% as compared to the original 39.97% of students who were at the High-level). The results suggest that noncognitive factors of the students such as motivation, interest, attitude towards mathematics, etc. might need to be improved.
Within the AI-ALS from Vendor 3, in the topic of Real Numbers, ideally 46.44% of the students should score at the Low-level (a substantially higher difference of 16.42% when compared to the original 30.02% of the students who scored at the Low-level), 25.29% of the students should score at the Mid-level (a substantially lower difference of 14.68% as compared to the original 39.97% of the students who scored at the Mid-level), and 28.27% of the students should score at the High-level (a slightly lower difference of 1.75% when compared to the original 30.02% of the students who scored at the High-level. The simulated results suggest that, if Vendor 3′s AI-ALS could ideally make it slightly more difficult for students to score at the High-level, it might contribute to their probability of scoring at the High-level for this topic in the paper-based Post-test.
Within the AI-ALS from Vendor 3, in the topic of Linear Inequalities, ideally 18.66% of the students should score at the Low-level (a lower difference of 6.38% when compared to the original 25.04% of the students who scored at the Low-level); 57.98% of the students should score at the Mid-level (a higher difference of 8.06% as compared to the original 49.92% of the students who scored at the Mid-level); and, 23.36% of the students should score at the High-level (a slightly lower difference of 9.74% as compared to the original 25.04% of the students who scored at the High-level. The simulated results suggest that, ideally, if Vendor 3′s AI-ALS could make it slightly more difficult for students to score at the High-level, but yet, not so difficult that students find it too challenging to score at the Mid-level, it might contribute to their probability of scoring at the High-level for this topic in the paper-based Post-test.
Within the AI-ALS from Vendor 3, in the topic of Polynomials and Factoring, ideally 5.07% of the students should score at the Low-level (an almost negligible lower difference of 0.07% when compared to the original 5.14% of the students who scored at the Low-level); 37.45% should score at the Mid-level (an almost negligible lower difference of 0.04% as compared to the original 39.97% of the students who scored at the Mid-level); and, 57.48% should score at the High-level (a slightly higher difference of 2.59% when compared to the original 54.89% of the students who scored at the High-level). The simulated results suggest that Vendor 3′s AI-ALS might already be close to optimally adapting to the students in Class 3 in training them to score at the High-level for this topic in the paper-based Post-test.
Within the AI-ALS from Vendor 3, in the topic of Linear Equations, ideally 51.35% of the students should score at the Low-level (a substantially higher difference of 16.36% when compared to the original 34.99% of the students who scored at the Low-level); 43.39% should score at the Mid-level (a substantially lower difference of 11.5% when compared to the original 54.89% of the students who scored at the Mid-level); and, 5.26% should score at the High-level (a lower difference of 4.86% when compared to the original 10.12% scored at the High-level). The simulated results suggest that, if Vendor 3′s AI-ALS could ideally make it much more difficult for students to score at the High-level and at the Mid-level, it might contribute to their probability of scoring at the High-level for this topic in the paper-based Post-test.
Within the AI-ALS from Vendor 3, in the topic of Functions and Lines, ideally 5.07% of the students should score at the Low-level (an almost negligible lower difference of 0.07% when compared to the original 5.14% of the students who scored at the Low-level); 29.82% should score at the Mid-level (a lower difference of 5.17% as compared to the original 34.99% of the students who scored at the Mid-level); and, 65.11% should score at the High-level (a higher difference of 5.24% compared to the original 59.87% of the students who scored at the High-level). The simulated results suggest that if Vendor 3′s AI-ALS could ideally make it slightly easier for students in Class 3 to score at the High-level, it might contribute to their probability of scoring at the High-level for this topic in the paper-based Post-test.
Within the AI-ALS from Vendor 3, in the topic of Exponents and Exponential Functions, ideally 51.95% should score at the Low-level (a lower difference of 2.03% as compared to the original 49.92% of the students who scored at the Low-level); 42.98% should score at the Mid-level (a lower difference of 6.94% when compared to the original 49.92% of the students who scored at the Mid-level); and, 5.07% should score at the High-level (an almost negligible lower difference of 0.07% when compared to the original 5.14% of the students who scored at the High-level). The simulated results suggest that Vendor 3′s AI-ALS might already be close to optimally adapting to the students in Class 3 in training them to score at the High-level for this topic in the paper-based Post-test.
Within the AI-ALS from Vendor 3, in the topic of Arithmetic Readiness, ideally 23.17% should score at the Low-level (a slightly higher difference of 3.1% as compared to the original 20.07% of the students who scored at the Low-level); 51.80% should score at the Mid-level (a higher difference of 6.86% when compared to the original 44.94% of the students who scored at the Mid-level); and, 25.04% should score at the High-level (a lower difference of 9.95% as compared to the original 34.99% scored at the High-level). The simulated results suggest that if Vendor 3′s AI-ALS could ideally make it much more difficult for students to score at the High-level, it might contribute to their probability of scoring at the High-level for this topic in the paper-based Post-test.
Within the AI-ALS from Vendor 3, in the topic of Quadratic Functions and Equations, ideally 0.35% of the students should score at the Low-level (a lower difference of 4.79% as compared to the original 5.14% of the students who scored at the Low-level); 35.76% should score at the Mid-level (a substantially lower difference of 14.16% when compared to the original 49.92% who scored at the Mid-level); and, 63.89% should score at the High-level (a substantially higher difference of 18.95% as compared to the original 44.94% of the students who scored at the High-level). The simulated results suggest that if Vendor 3′s AI-ALS could ideally make it much easier for students in Class 3 to score at the High-level, it might contribute to their probability of scoring at the High-level for this topic in the paper-based Post-test.
Within the AI-ALS by Vendor 3, in the average number of hours were spent by each student, 14.22% of the students should be at the Low-level (an almost negligible lower difference of 0.87% compared to the original 15.09% of the students who were at the Low-level), 51.52% should be at the Mid-level (a substantially higher difference of 11.55% as compared to the original 39.97% of the students who were at the Mid-level), and 34.26% should be at the High-level (a substantially lower difference of 10.68% compared to the original 44.94% who were at the High-level). The simulated results suggest that if students spend less time within Vendor 3′s AI-ALS, it could contribute to their probability of scoring at the High-level in the paper-based Post-test. Perhaps, one way of interpreting this could be: spending less time within the Vendor 3’s AI-ALS could help prevent diminishing marginal returns, as the students would not have to suffer from undue fatigue or stress.
In the percentage of the total number of topics that were mastered by the students in the AI-ALS by Vendor 3, ideally 43.48% of the students should be at the Low-level (a slightly lower difference of 3.51% as compared to the original 39.97% of the students who were at the Low-level); 23.14% should be at the Mid-level (a slightly higher difference of 3.07% when compared to the original 20.07% who were at the Mid-level); and 33.38% should be at the High-level (a lower difference of 6.59% as compared to the original 39.97% who were at the High-level). The simulated results suggest that mastering the topics at a slower pace within Vendor 3′s AI-ALS could contribute to their probability of scoring at the High-level in the paper-based Post-test. At first glance, this might seem counterintuitive. However, one way of interpreting this might be: a slower pace of mastering the mathematics topics could be more beneficial, as it could potentially contribute to a deeper level of understanding of the subject matter by the students.
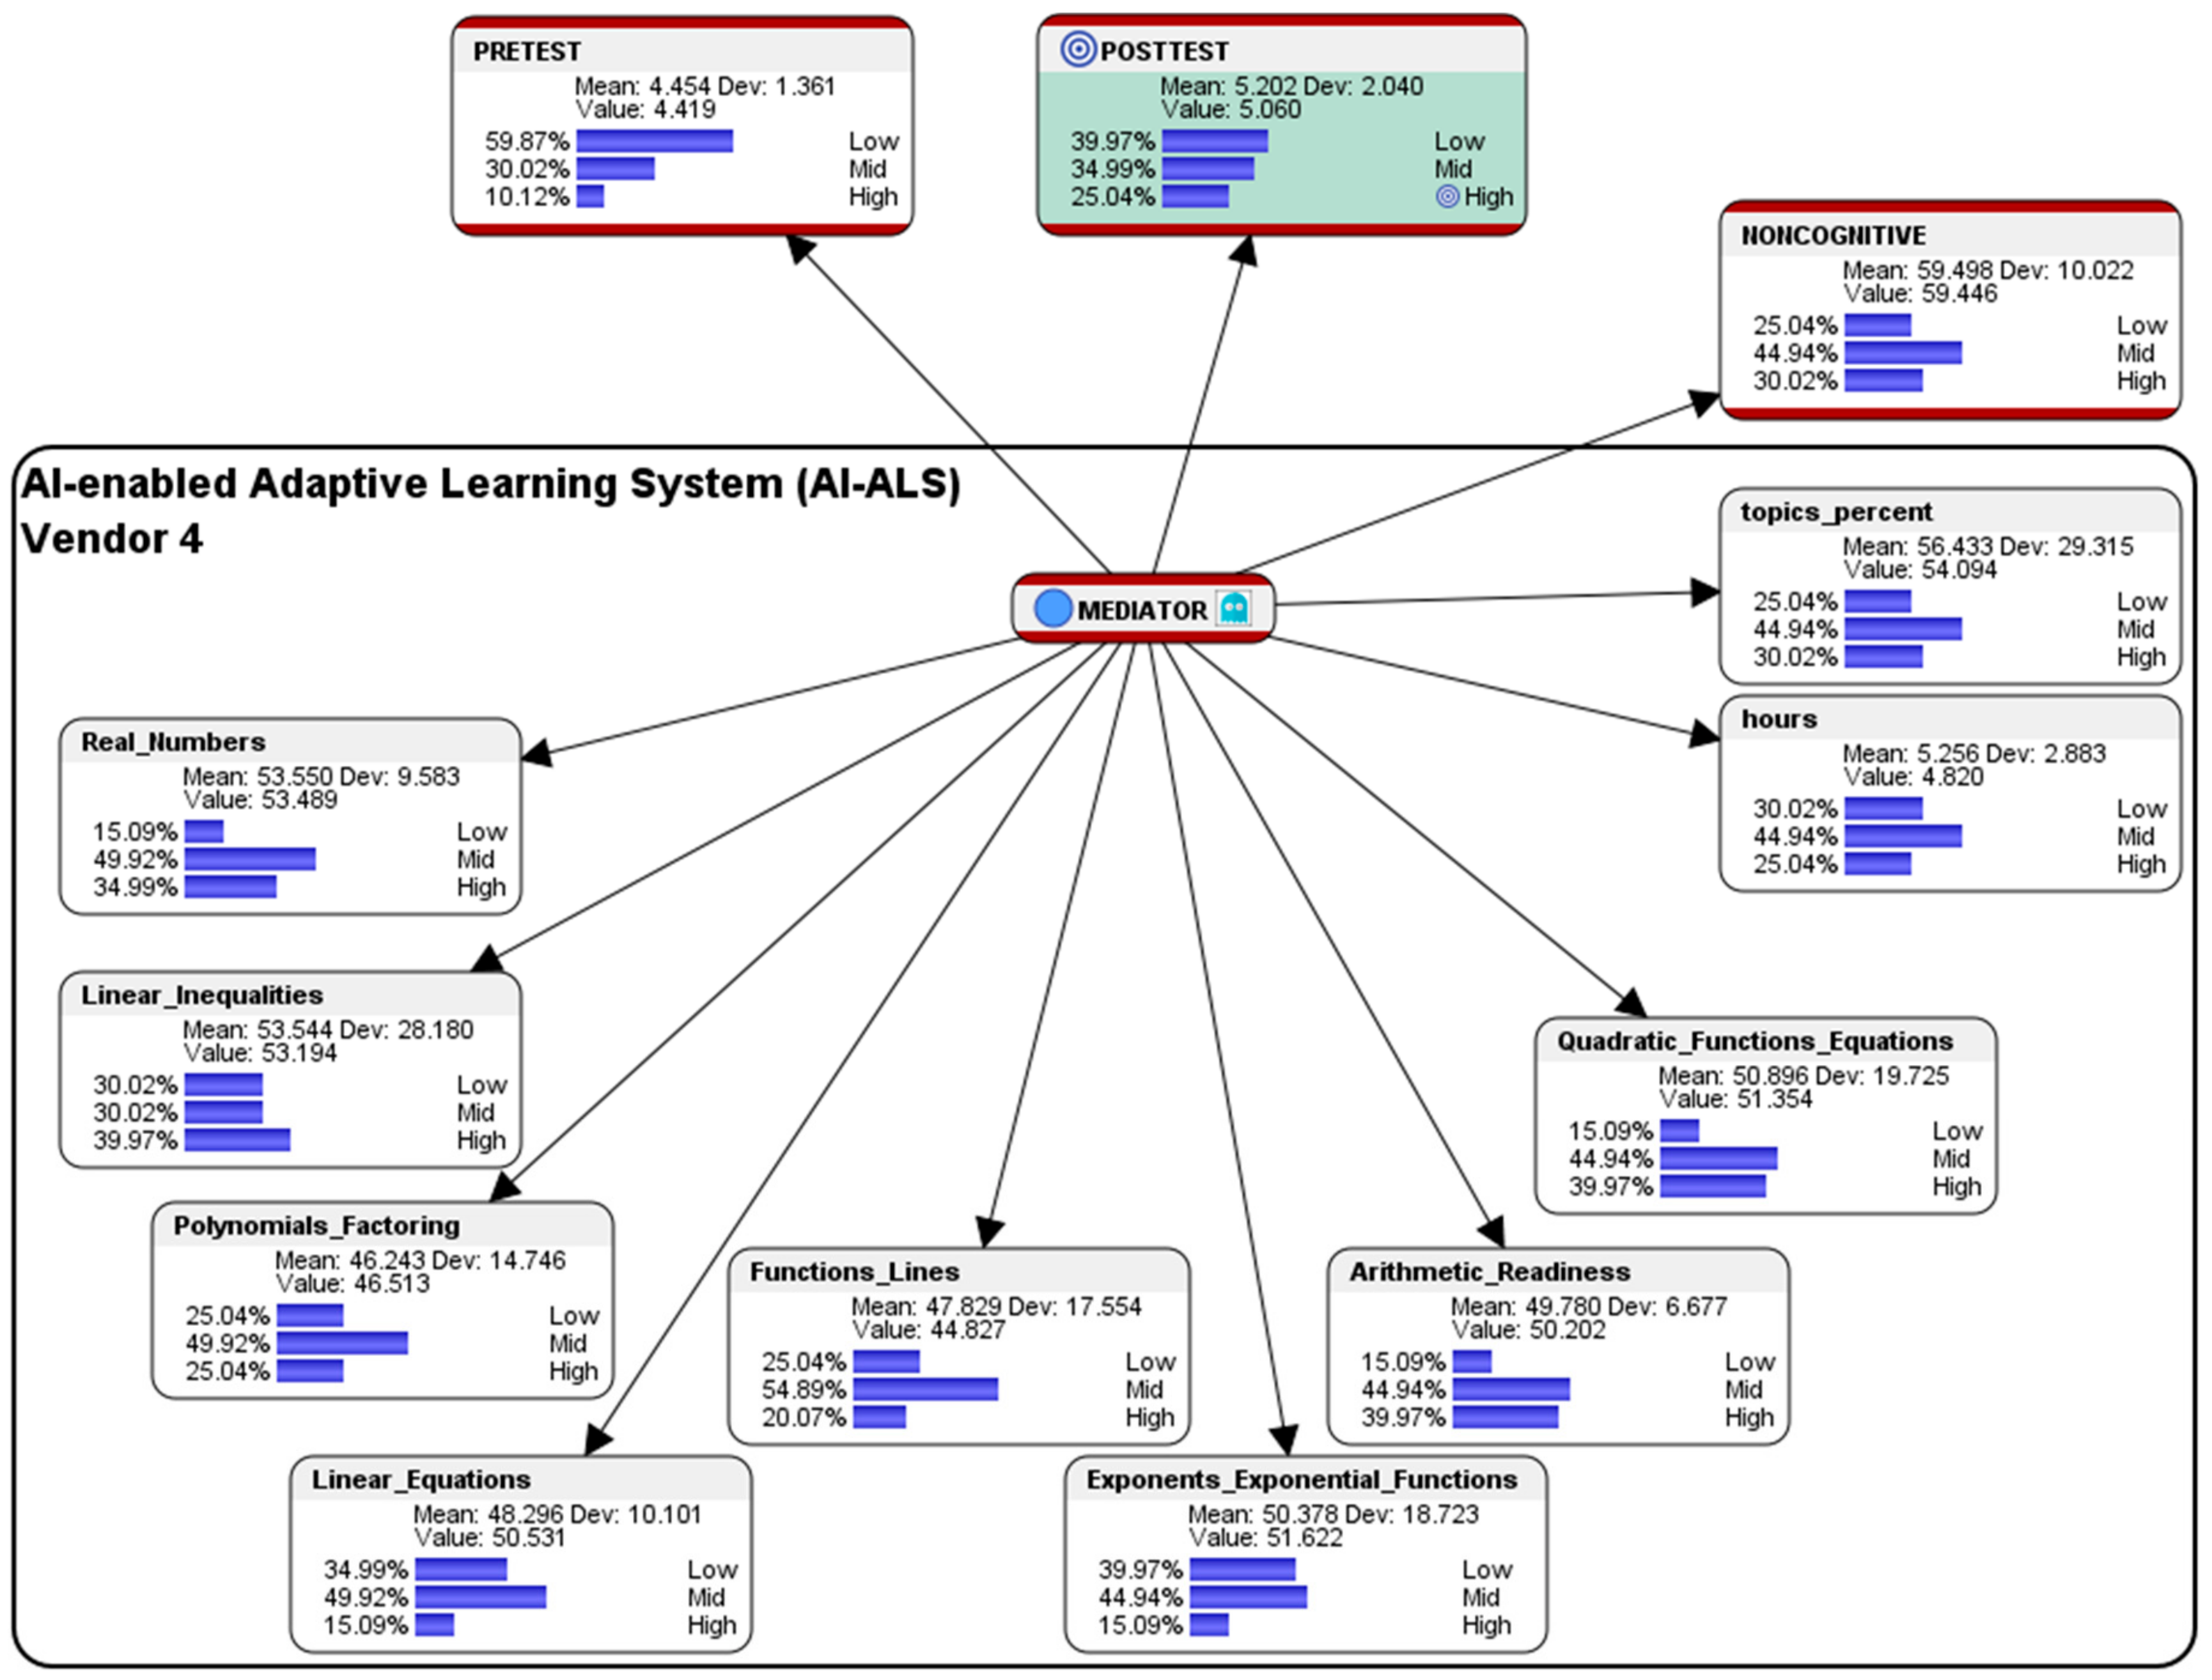
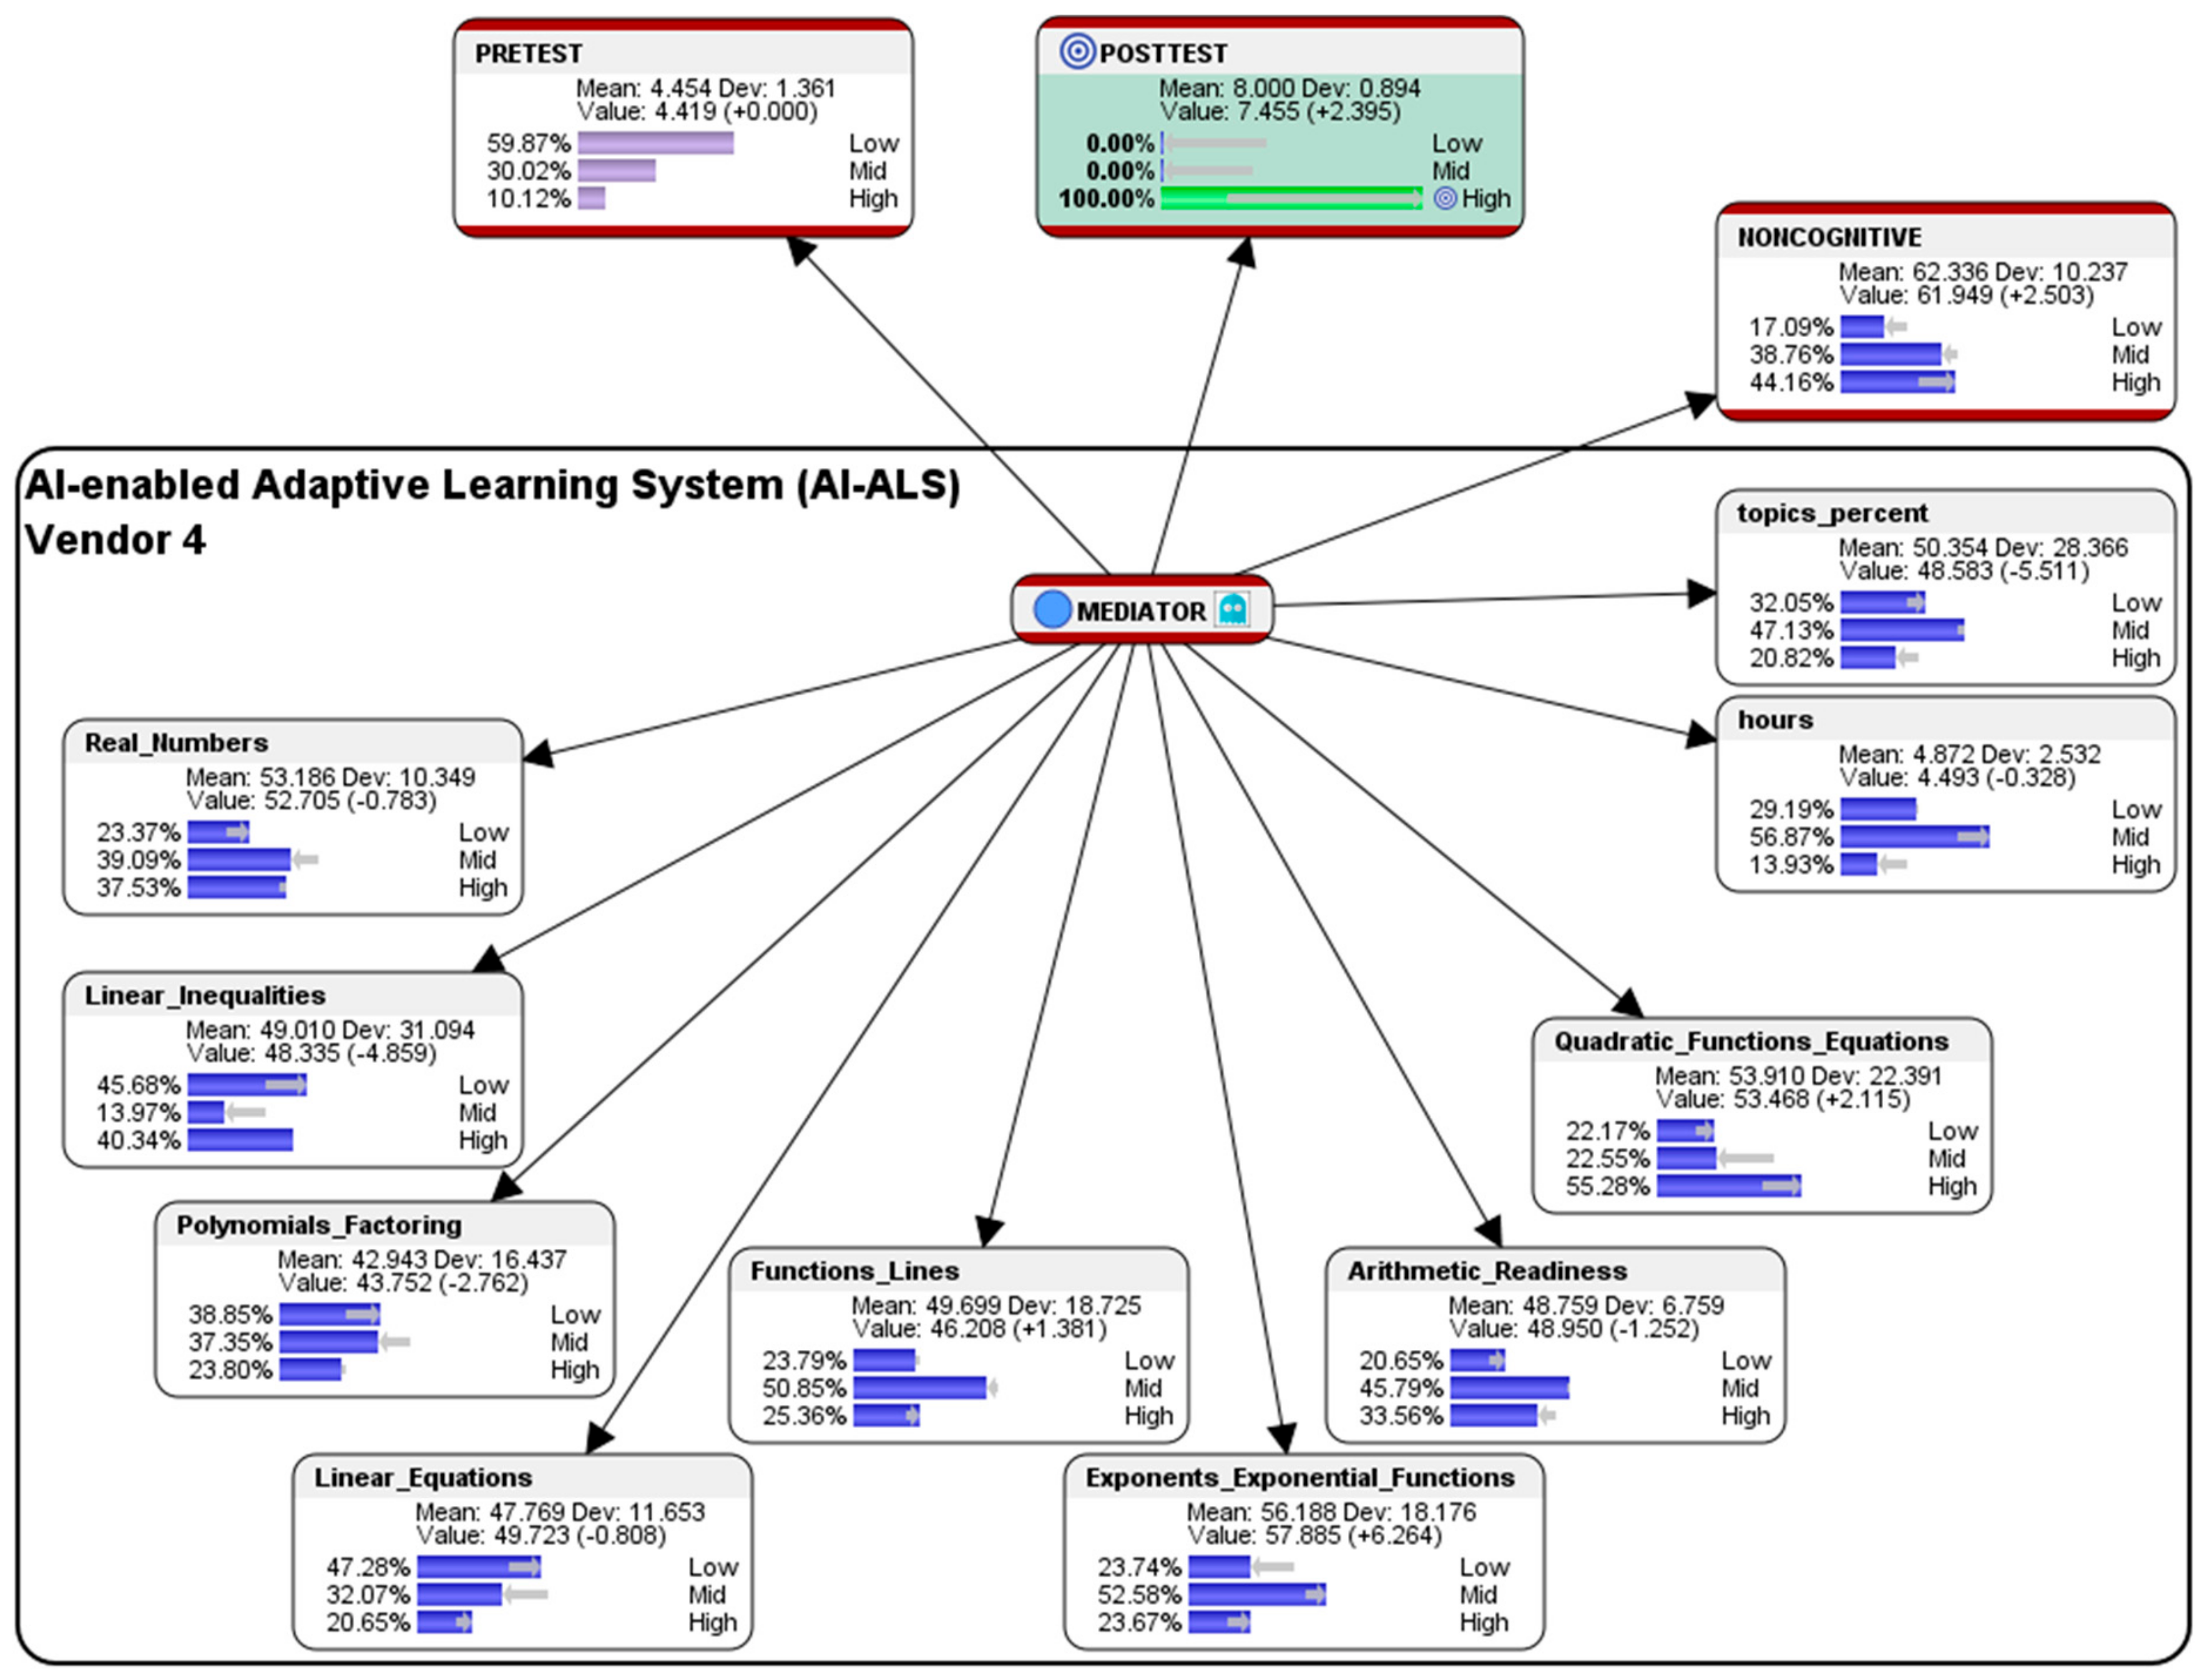
5.4. Simulation of Hypothetical Scenario for Students Who had Used the AI-ALS from Vendor 4
This section presents a sample performance prediction report that could be shared with the educational stakeholders in School 4, so that they could consider having further discussions with their AI-ALS provider to fine-tune the system, e.g., by adjusting the level of difficulty of the questions that are being offered to their students to better correspond to their learning capabilities.
Hypothetical question: what are the conditions needed in the AI-ALS from Vendor 4 and in the noncognitive parameter if we wish that 100% of the students could score at the High-level in the paper-based Post-test?
The following simulated counterfactual results for the conditions that would optimize the performance of students who had used the AI-ALS from Vendor 4 (see
Figure 19) and Vendor 5 (see
Figure 20) would only be presented in summarized graphical form due to space constraints for publication, since they also had positive gains in the High-level marks in the Post-test (as presented earlier in
Table 1 and
Figure 15), and they could be considered to be similar to the case in which the students had used the AI-ALS from Vendor 1 (see
Section 5.1).
Overall, within the AI-ALS from Vendor 4, the simulated counterfactual results suggest that, in order to train them in score at the High-level in the paper-based Post-test, the finer details of the predictions that recommend whether it should be made easier or more difficult in the various mathematics topics could be perused in
Figure 19.
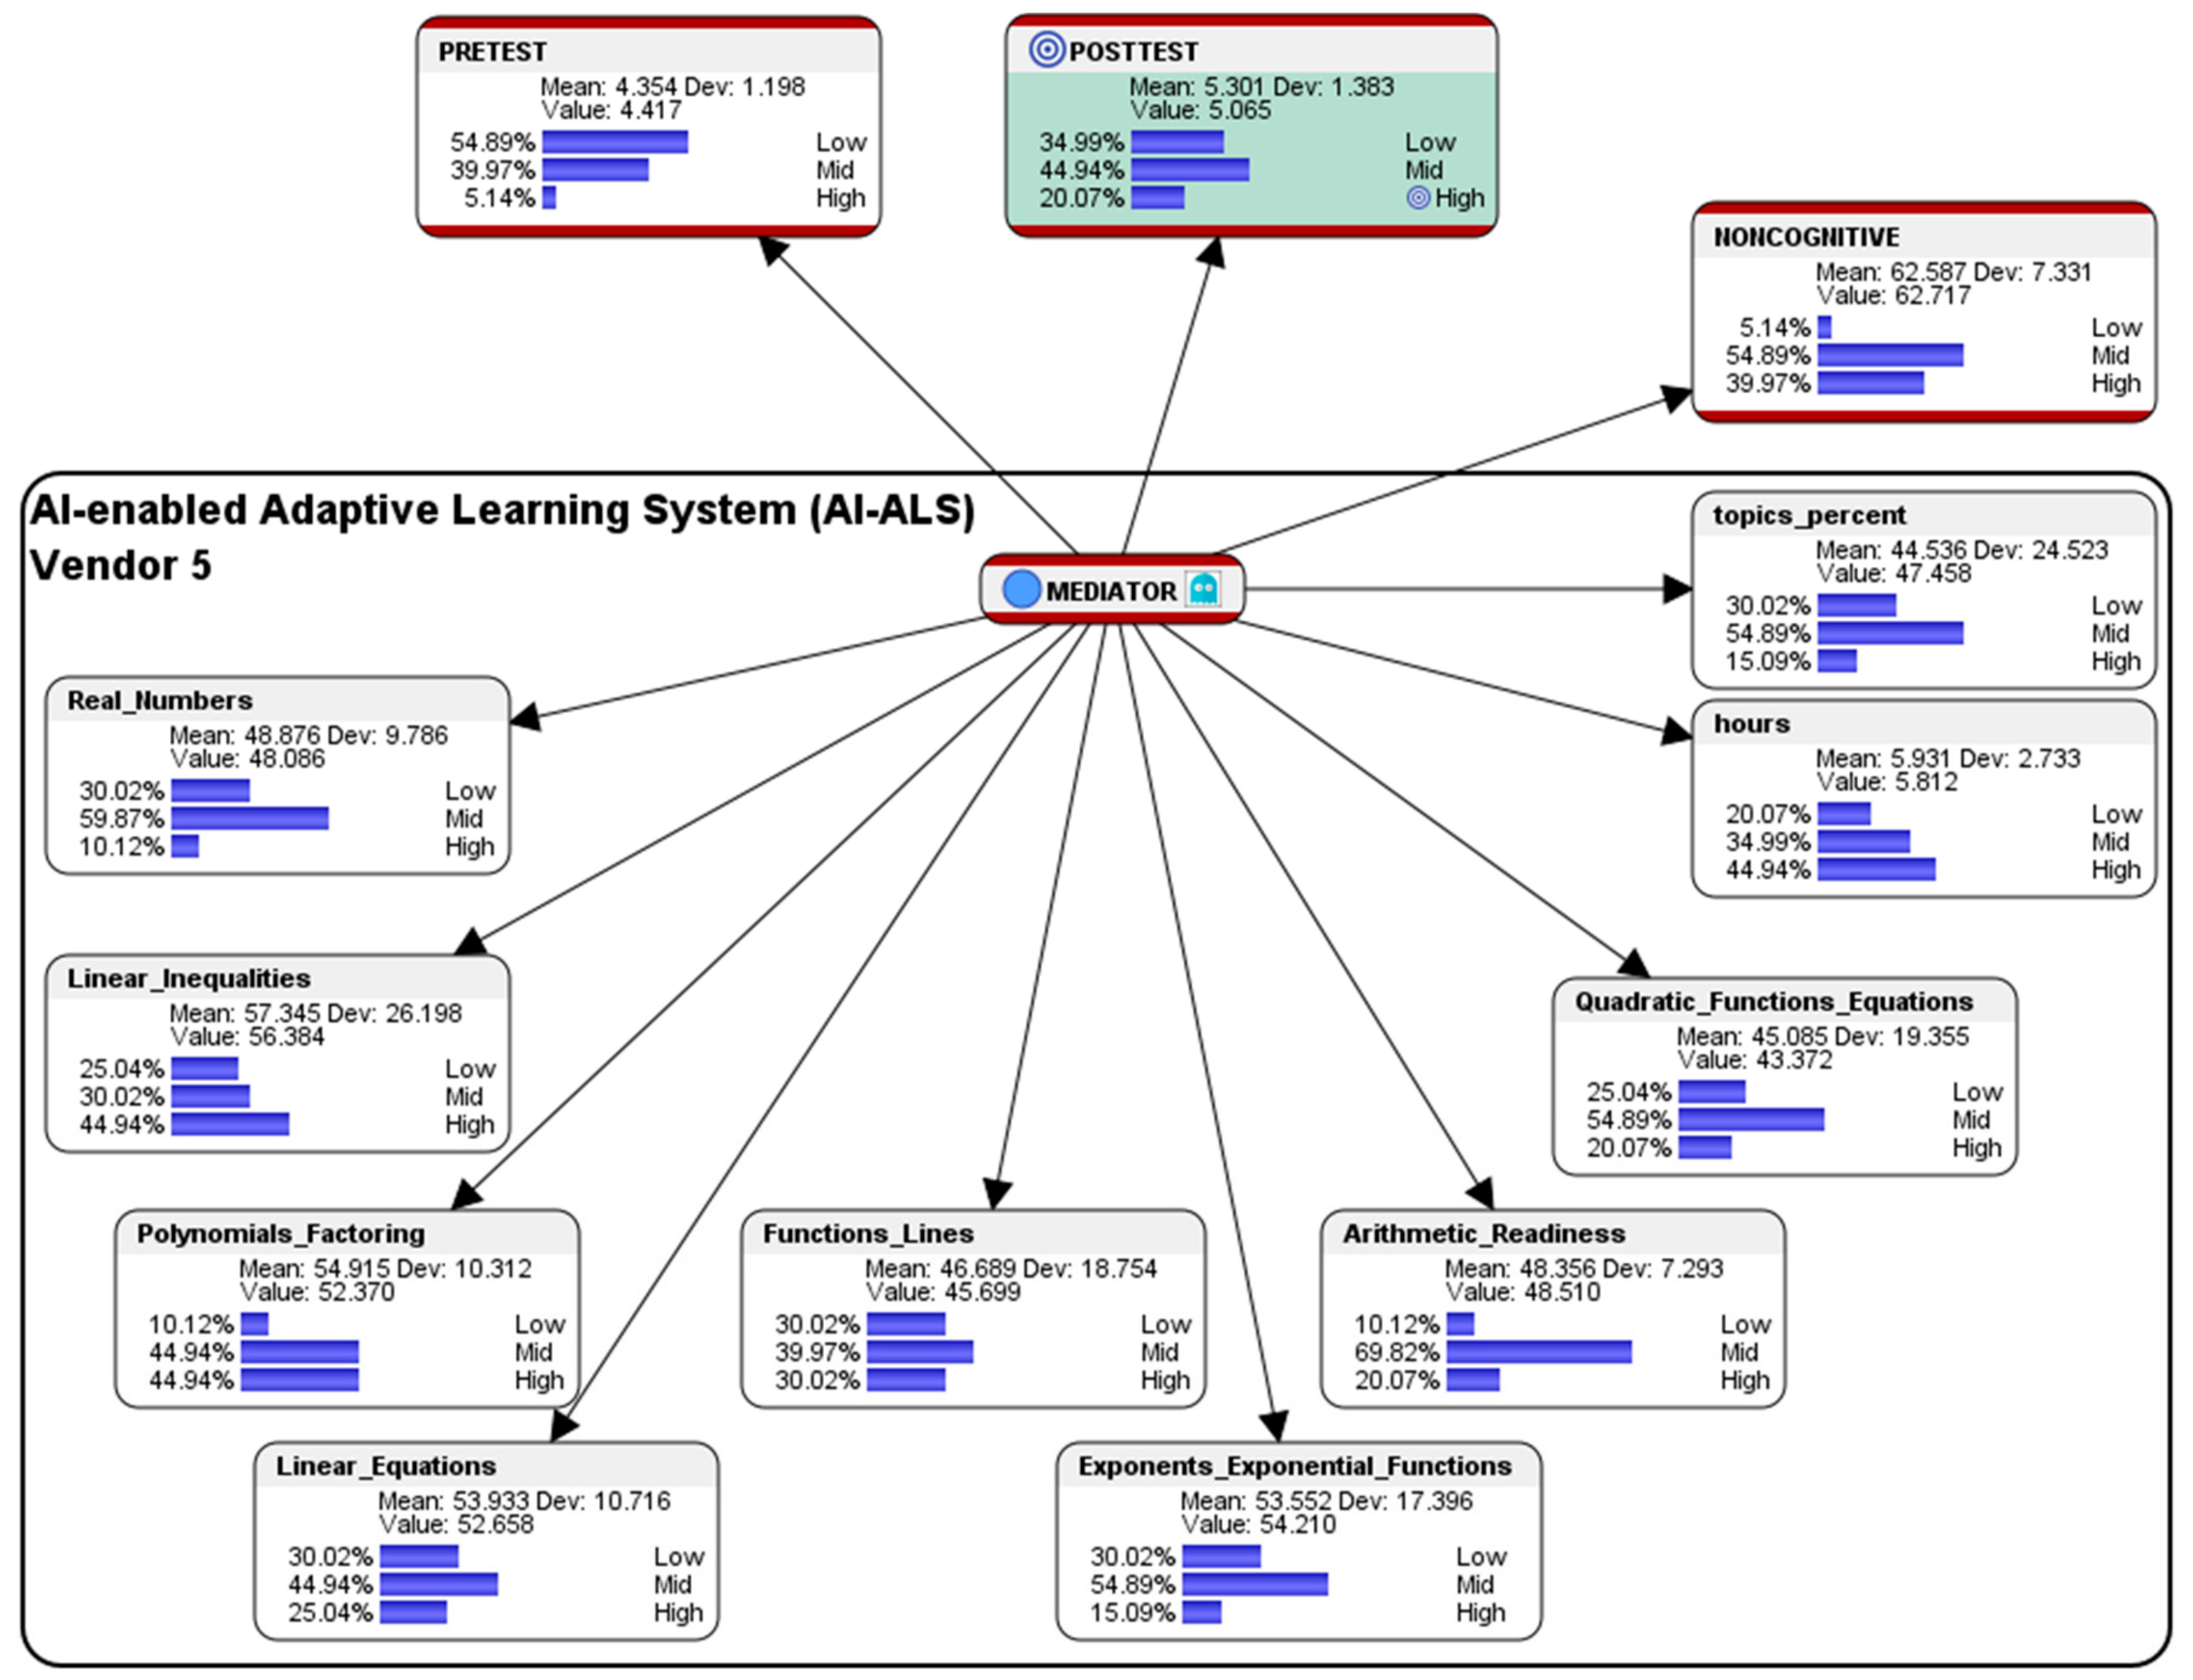
5.5. Simulation of Hypothetical Scenario for Students Who had Used the AI-ALS from Vendor 5
This section presents a sample performance prediction report that could be shared with the educational stakeholders in School 5, so that they could consider having further discussions with their AI-ALS provider to fine-tune the system, e.g., by adjusting the level of difficulty of the questions that are being offered to their students to better correspond to their learning capabilities.
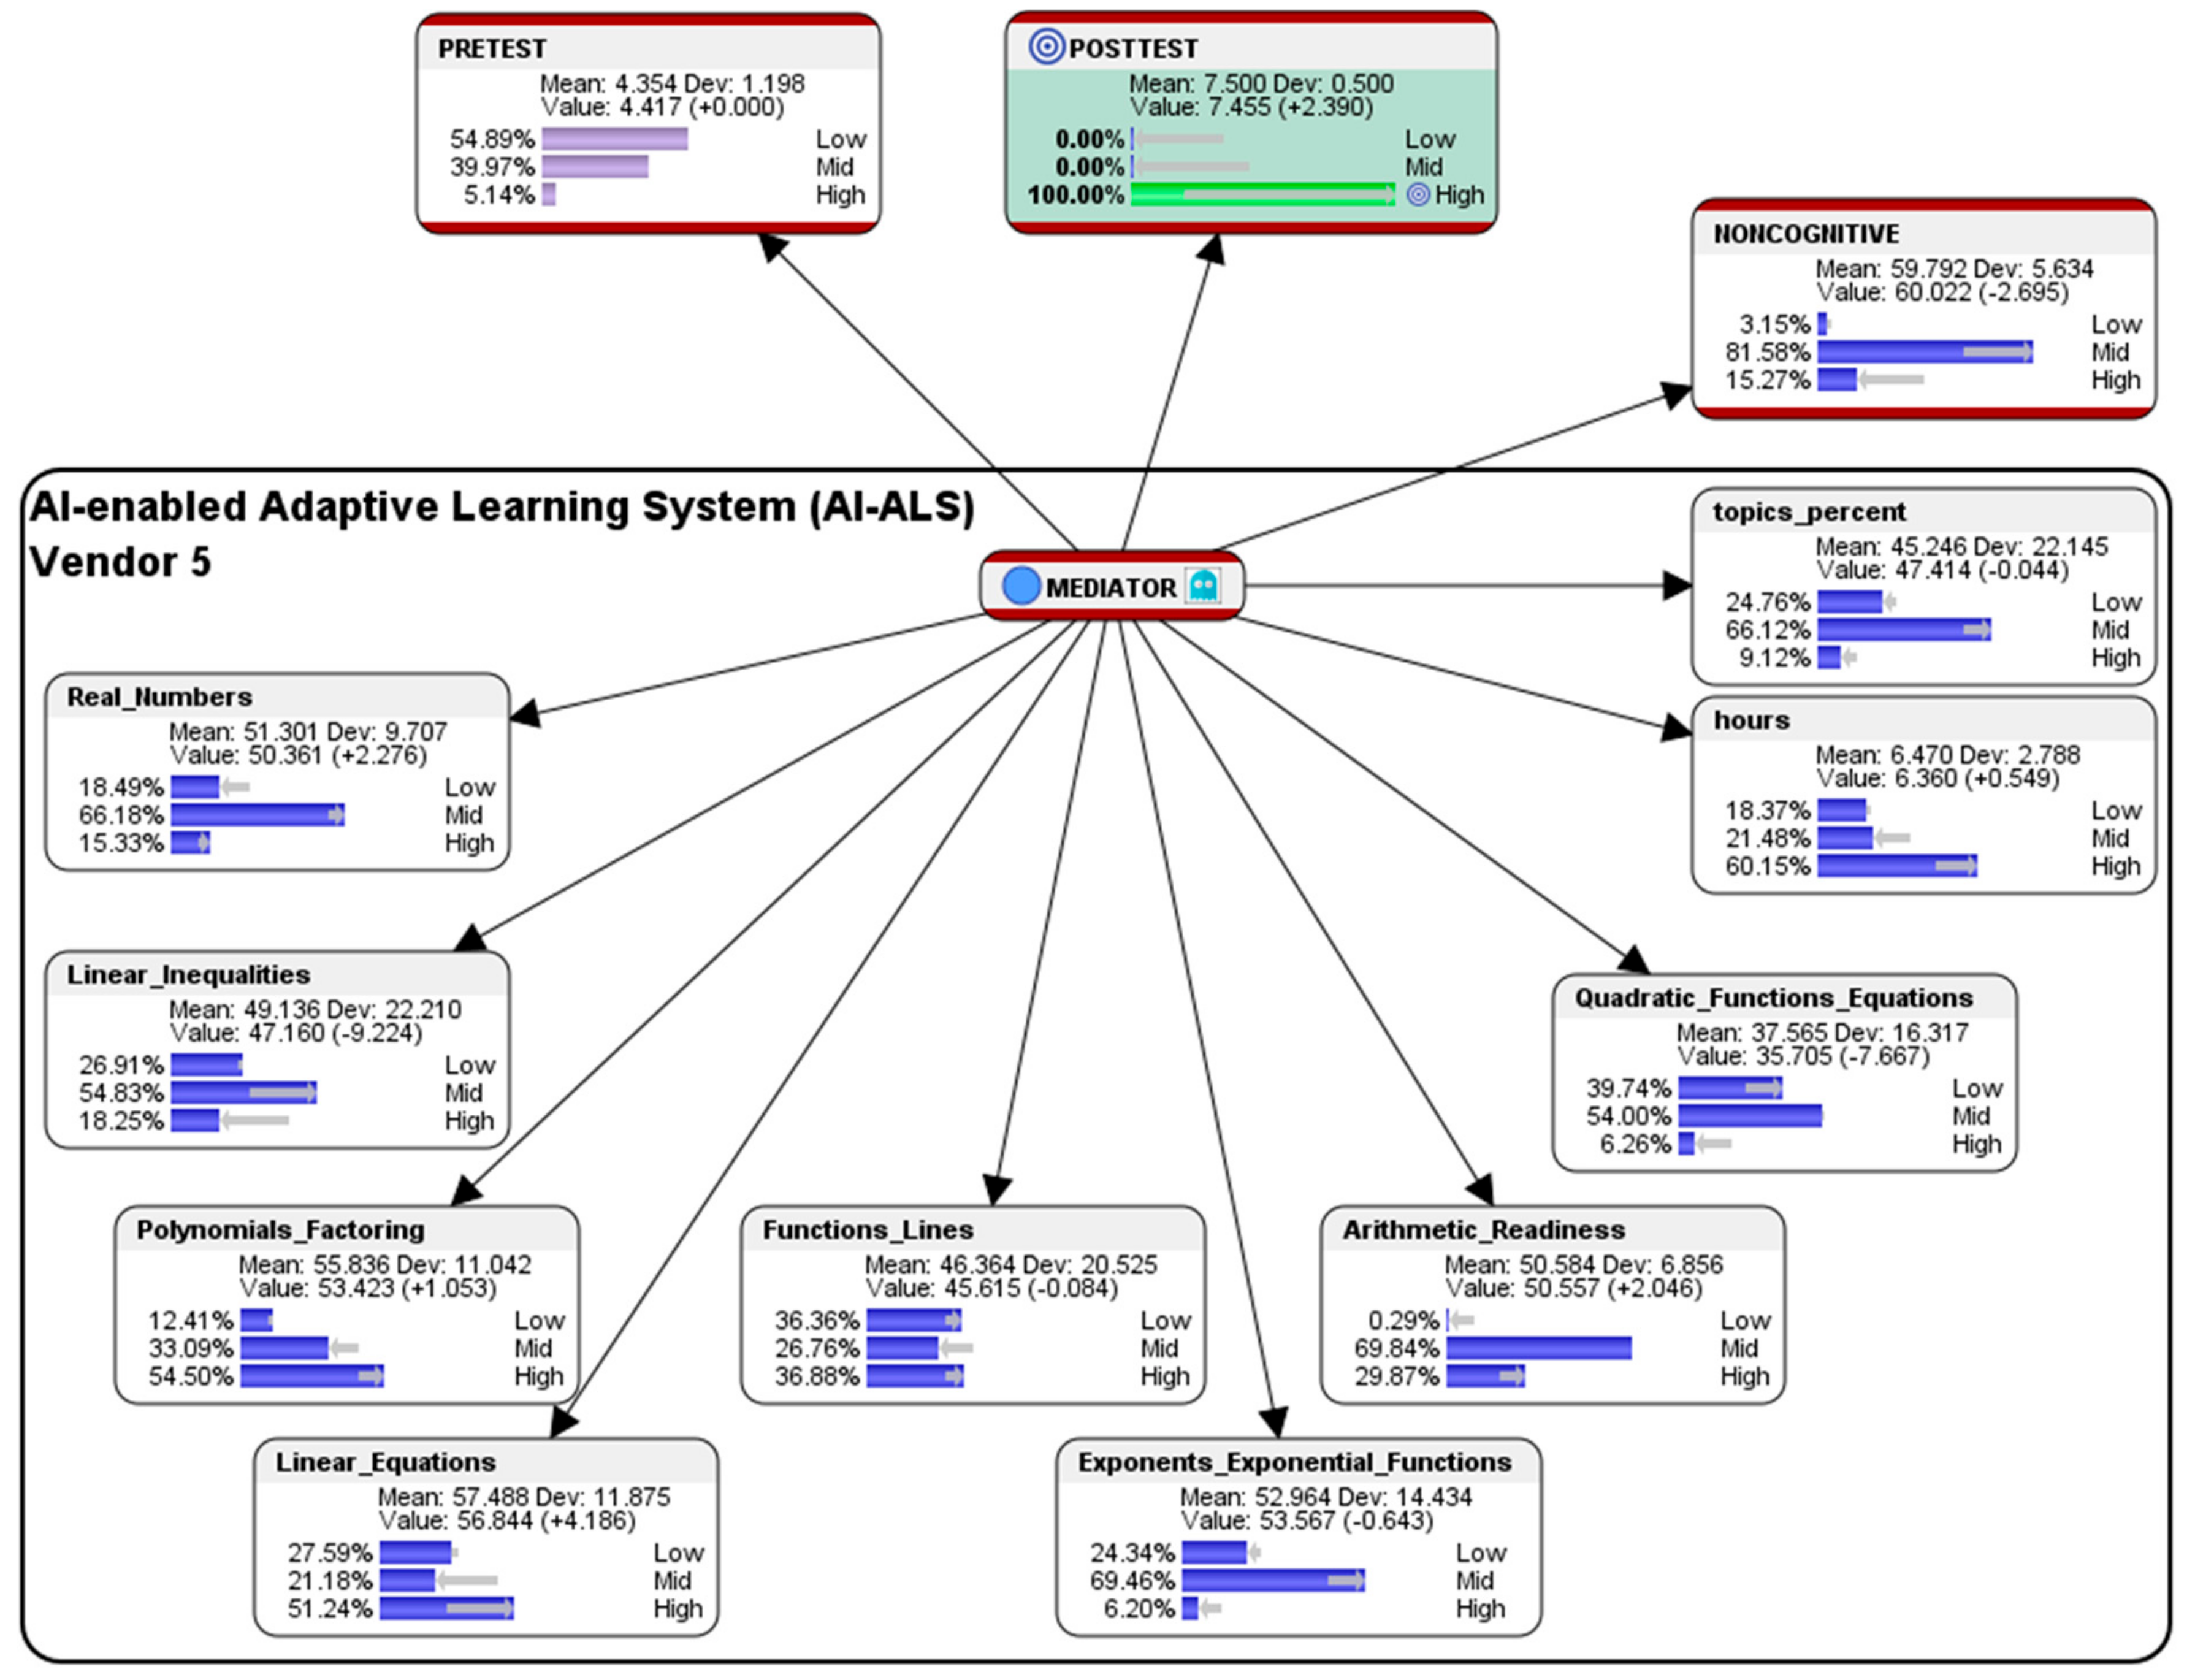
Hypothetical question: what are the conditions that are needed in the AI-ALS from Vendor 5 and in the noncognitive parameter if we wish that 100% of the students could score at the High-level in the Post-test?
Overall, within the AI-ALS from Vendor 5, the simulated counterfactual results suggest that, in order to train them in score at the High-level in the paper-based Post-test, the finer details of the predictions that recommend whether it should be made easier or more difficult for the various mathematics topics could be perused in
Figure 20.


