Article

Measuring Reasoning Quality in LLMs: A Multi-Dimensional Behavioral Framework

1
Department of Computer Engineering, Tarsus University, Takbaş M. Kartaltepe S., Tarsus 33400, Mersin, Türkiye
2
School of Computing and Augmented Intelligence (SCAI), Arizona State University (ASU), Tempe, AZ 85281, USA
3
HumaConn AI Consulting, Queen Creek, AZ 85140, USA
*
Author to whom correspondence should be addressed.
Big Data Cogn. Comput. 2026, 10(9), 300; https://doi.org/10.3390/bdcc10090300
Submission received: 5 June 2026 / Revised: 20 August 2026 / Accepted: 28 August 2026 / Published: 3 September 2026
(This article belongs to the Special Issue Large Language Models and Their Limitations)

Abstract

Despite remarkable progress on reasoning benchmarks, current LLM evaluation practice remains anchored to final-answer correctness. This provides limited insight into how models reason, how reliably they behave under contextual variation, or how efficiently they reach conclusions. This paper proposes RQEval, a unified multi-dimensional framework for measuring LLM reasoning quality from a behavioral perspective. The framework operationalizes six theoretically grounded dimensions rooted in cognitive science: Correctness (CQ), Consistency (CS), Robustness (RS), Local Logical Coherence (LS), Efficiency (ES), and Stability (SS). It also introduces deployment-aware aggregation, enabling context-specific model selection beyond accuracy-based leaderboards. Applying RQEval to seven LLMs across four benchmarks reveals an outcome-level cluster (CQ, CS, RS, and ES) characterized by strong intercorrelations and a trace-level layer in which LS is empirically distinct from the outcome-level metrics, whereas SS retains moderate associations with several of them. Across the 28 model–dataset observations, LS showed no statistically significant correlation with any other dimension. Efficiency-weighted deployment scenarios, nevertheless, produced limited ranking inversions among models that were otherwise ranked consistently across weighting schemes. The resulting pipeline provides a foundation for diagnosing LLM reasoning behavior across deployment contexts, while highlighting domain-specific validation as an important direction for future work.

1. Introduction

LLMs have achieved remarkable success across mathematical, logical, and commonsense reasoning tasks, fueling rapid deployment in high-stakes domains such as clinical decision support, legal analysis, automated scientific reasoning, and domain-specific fraud detection [1]. Yet the dominant evaluation paradigm remains correctness-centric: a model is judged by whether its final answer matches a ground-truth label, with little systematic attention to how it reasoned, how reliably it behaves under contextual variation, or how efficiently it reaches correct conclusions.
This reductionism carries real costs. Cognitive science has established for decades that reasoning quality is inherently multi-dimensional: a reliable reasoner must produce accurate conclusions, maintain coherent inferential chains, remain stable under equivalent re-formulations, and allocate resources efficiently [2,3,4,5]. Collapsing these properties into a single accuracy score, therefore, discards information critical for deployment decisions, particularly in accountability-sensitive settings where the process of reasoning is subject to audit. This concern is not merely theoretical: recent empirical work confirms that LLMs can generate plausible-sounding reasoning chains causally disconnected from their final answers [6,7], produce substantially different outputs under semantically equivalent inputs [8,9], and exhibit systematic cognitive-bias-like deviations that vary by model architecture [10].
We address this gap with three research questions:
  • RQ1: Can a single unified framework simultaneously capture the correctness, coherence, consistency, robustness, efficiency, and stability of LLM reasoning? These six dimensions are motivated by the cognitive science accounts of reasoning quality reviewed in Section 2.
  • RQ2: Are these six dimensions empirically independent, or does accuracy subsume the others?
  • RQ3: Does deployment context materially change model rankings, and can the framework quantify these changes?
To answer these research questions, this paper makes four contributions:
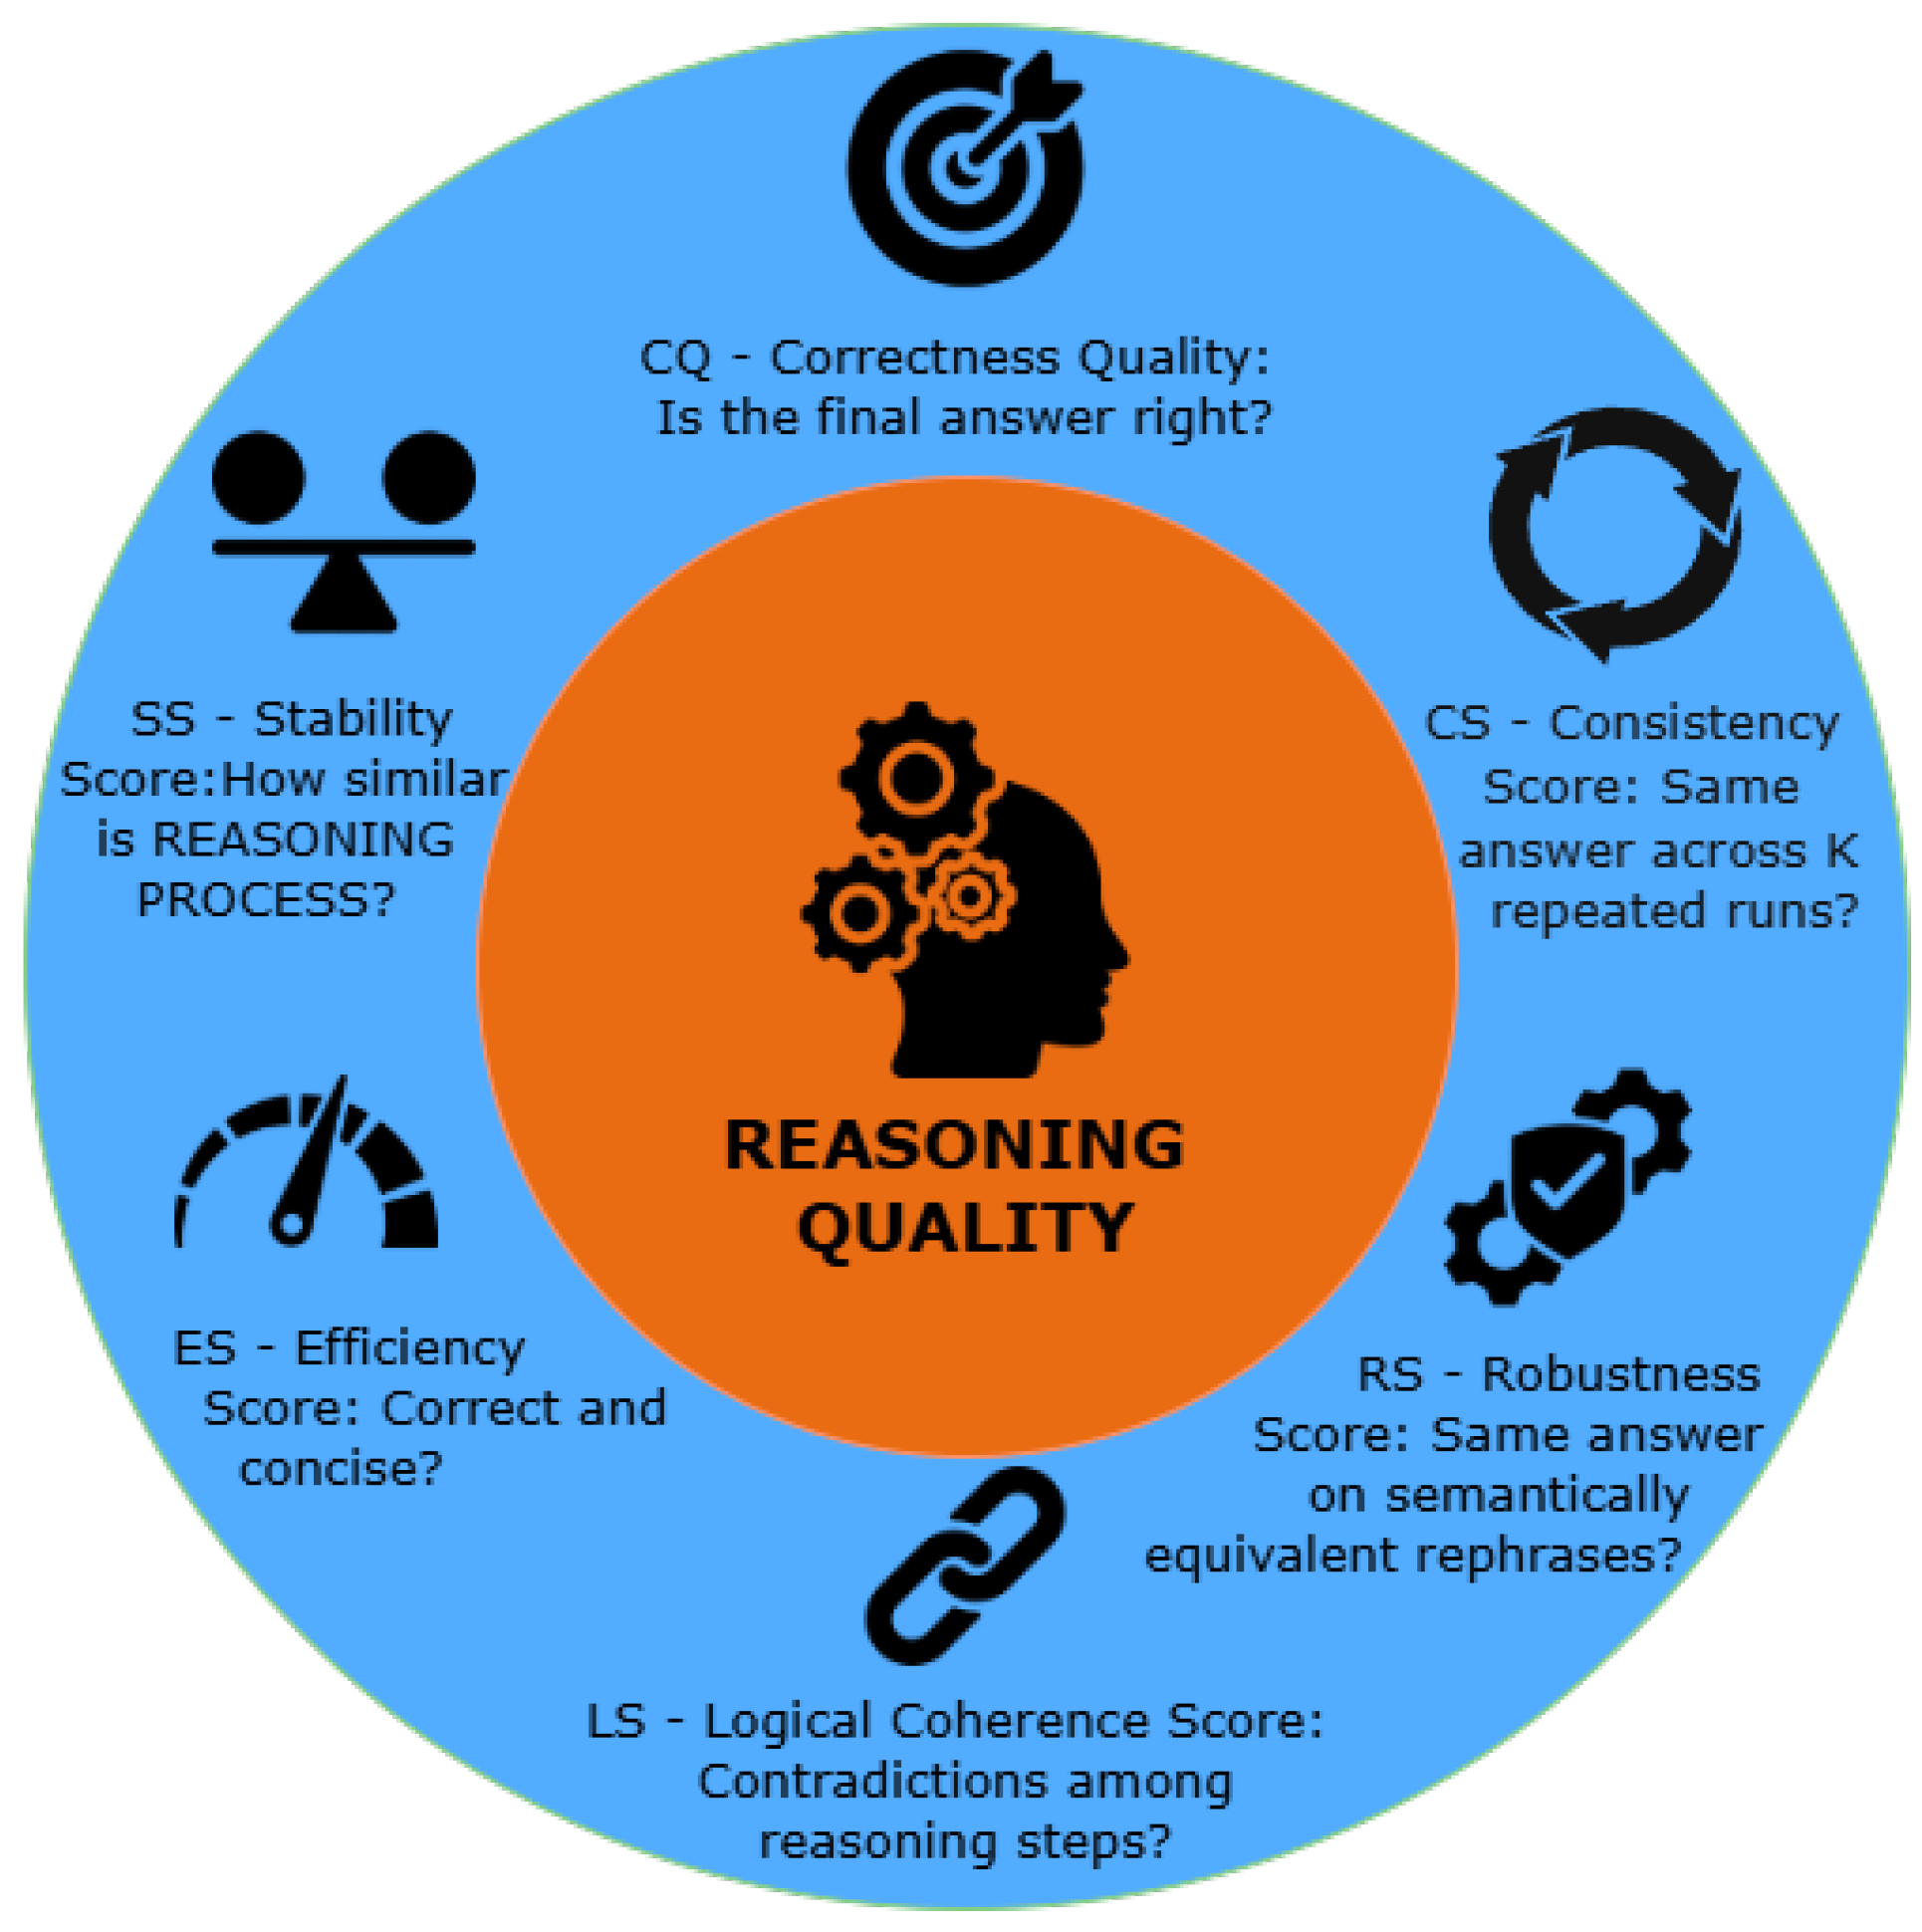
  • A theoretically grounded six-dimensional (see Figure 1) behavioral framework rationalizing cognitive science principles as measurable LLM properties;
  • Discriminant validity evidence showing that the six dimensions organize into two behavioral layers: a strongly intercorrelated outcome-level cluster (CQ, CS, RS, and ES) and a trace-level layer in which LS remains empirically orthogonal while SS is only partially distinct, with local logical coherence emerging as the framework’s strongest orthogonal signal in the evaluated sample (Section 4.5);
  • A systematic demonstration that multi-dimensional reasoning profiles expose deployment-relevant ranking differences invisible to single-metric evaluation, something that is most pronounced among smaller open-weight models;
  • RQEval, a reproducible, model-agnostic evaluation pipeline applicable to any LLM without access to model weights or internal states.
The rest of this paper is organized as follows. Section 2 reviews related work on cognitive science foundations and chain-of-thought faithfulness, highlighting the limitations of current evaluation frameworks. Section 3 details the proposed multi-dimensional framework, including metric definitions, aggregation strategies, and experimental setup. Section 4 presents experimental results across seven LLMs and four benchmarks, with subsections on overall performance, per-dataset analysis, cross-cutting findings, deployment-aware model selection, and discriminant validity. Section 5 discusses the implications of our findings for research and practice, and Section 6 concludes the paper.

2. Related Work

2.1. Cognitive Science Foundations

Cognitive science provides the theoretical grounding for our framework. Simon’s bounded rationality framework [2] established that real reasoning systems operate under finite resources and must balance accuracy with effort, directly motivating our Efficiency (ES) dimension. Building on this foundation, Thagard’s constraint-satisfaction model [4] and Anderson et al. [11] establish that high-quality reasoning additionally requires mutually consistent inferential steps, not merely a correct conclusion, grounding our Local Logical Coherence (LS) dimension. Extending the rationality perspective to behavioral consistency, Stanovich [3] and Evans [12] argue that rational agents should produce consistent judgments across logically equivalent formulations, motivating our Consistency (CS) dimension. Similarly, Kahneman and Tversky [13] and Gigerenzer and Selten [14] demonstrate that high-quality reasoning should remain stable under minor representational changes, underpinning our Robustness (RS) dimension. Lieder and Griffiths [5] further formalized resource-rational cognition, showing that good reasoners optimize the tradeoff between correctness and computational cost. Together, these accounts converge on a picture of reasoning as inherently multi-dimensional, a view reinforced by Binz et al. [15] and Bordalo [16], who show that representational stability and attentional consistency across tasks are essential process-level criteria irreducible to accuracy alone.

2.2. Chain-of-Thought Faithfulness and Robustness

These theoretical criteria establish what high-quality reasoning should exhibit; however, recent research on chain-of-thought prompting raises a separate question of whether observable reasoning traces faithfully reflect the processes that produce model outputs. The introduction of chain-of-thought prompting [17,18] raised expectations that LLM reasoning traces could serve as interpretable records of model inference. These expectations have been substantially qualified by a converging body of evidence. Lanham et al. [6] showed that CoT traces frequently do not reflect the actual decision process; Barez et al. [7] formalize faithfulness in terms of procedural soundness, causal relevance, and completeness, and find that current CoT methods often fail all three. Paul et al. [19] further demonstrate via causal mediation analysis that faithfulness improvements through iterative refinement remain modest and task-dependent. From a data-distribution perspective, Zhao et al. [20] further argue that CoT reasoning functions as a structured inductive bias learned from in-distribution training data; its effectiveness is, therefore, constrained by the degree of distributional divergence between training and test queries. This structural account reinforces the need to evaluate reasoning behaviorally rather than assuming that CoT traces faithfully represent a single underlying reasoning process. Taken together, these findings caution against treating reasoning traces as faithful records of inference, a limitation that directly motivates our LS metric, which evaluates trace reliability through NLI-based step-to-step contradiction detection rather than assuming fidelity.
The same body of work reveals parallel gaps in robustness and consistency evaluation. Kumar and Mishra [21] identify a persistent gap: most evaluations test at most one or two robustness dimensions in isolation, leaving compounded fragilities undetected. Singh et al. [22] confirm this concern, showing significant performance degradation under compounded perturbations even when mild perturbations are individually tolerated. At the deployment level, Bogavelli et al. [23] show that prompt format variations alone cause up to 40% performance fluctuations in enterprise settings. Crucially, Liu et al. [24] distinguish output consistency from process stability, finding that larger models can be unstable at the process level even when output-consistent, a dissociation our framework operationalizes as independent CS and SS dimensions, enabling their separation to be measured directly.

2.3. Limitations of Current Frameworks

Across this body of work, a consistent pattern emerges: existing evaluation practice provides an incomplete and potentially misleading account of LLM reasoning behavior. At the benchmark level, Mondorf and Plank [25] and Wan et al. [26] demonstrate that correctness-based benchmarks fail to distinguish genuine reasoning from pattern recognition. At the level of the reasoning process, Lyu et al. [27] show that intermediate steps may not causally contribute to final predictions, while Yang et al. [28] raise concerns about benchmark contamination, suggesting that strong benchmark performance does not imply reliable reasoning ability. The problem is not merely statistical: Turpin et al. [9] show that LLMs can produce explanations logically coherent yet causally misaligned with their internal decision processes. Most directly relevant to our work, Becerra-Monsalve et al. [29] report only moderate NLI-based correlation with human judgments ( ρ 0.453 ), identifying systematic limitations in detecting higher-level reasoning errors. Collectively, these findings point to the same diagnostic: domain-specific benchmarks [30,31] target correctness in narrow formats, robustness studies examine only a subset of perturbation types, and faithfulness research requires manual intervention, leaving no unified pipeline that systematically assesses all six dimensions identified by cognitive science as constitutive of reasoning quality.
Positioning. Our framework is distinguished along three axes: theory-grounded (each dimension is defined with explicit reference to a cognitive science principle); behavioral (dimensions are measured through perturbation, repetition, and trace-analysis rather than introspective inspection); and deployment-aware (a configurable aggregation mechanism allows practitioners to derive evidence-based model recommendations, a capability absent from all prior frameworks).
The comparison closest in spirit and scale to ours is HELM [32], which, likewise, evaluates multiple LLMs across several “scenarios” along several axes (accuracy, calibration, robustness, fairness, and efficiency, among others) rather than a single leaderboard score. HELM’s robustness axis, however, is operationalized as accuracy under a fixed set of input perturbations (invariance and equivariance tests) rather than as reproducibility of the model’s own answer under semantic-preserving reformulation of the same item, and its efficiency metric is measured in wall-clock/FLOPs terms external to the model’s own output rather than as a correctness-efficiency tradeoff internal to each response. Critically, HELM does not include any measure of intermediate reasoning-trace coherence: its accuracy metrics are computed exclusively from final answers, with no mechanism analogous to LS for detecting step-to-step contradiction within a chain-of-thought trace, and no analogue of CS’s within-item, cross-resampling consistency check. Our framework can be read as narrower in scope than HELM (it targets reasoning behavior specifically, not the full range of LLM capabilities HELM surveys) but deeper along the reasoning axis specifically, and, unlike HELM’s fixed per-scenario scoring, adds a configurable deployment-aware aggregation layer that lets the same six raw scores be recombined for different operational priorities without re-running the underlying evaluation. Table 1 summarizes how RQEval compares with existing evaluation methodologies.

3. Methodology

3.1. Framework Overview

The goal of this framework is to provide a comprehensive characterization of LLM reasoning quality that supports deployment decisions in high-stakes domains. Achieving this goal is inherently a multi-dimensional problem: decades of cognitive science research establish that reasoning quality cannot be reduced to a single property such as correctness, because a reliable reasoner must simultaneously produce accurate conclusions, maintain coherent inferential chains, remain stable under equivalent reformulations, and allocate computational resources efficiently [2,3,4,5]. Collapsing these properties into a single score, therefore, discards information that is critical for deployment decisions.
The choice of six dimensions follows directly from this theoretical account. Correctness (CQ) captures epistemic accuracy [33,34]; Consistency (CS) operationalizes rational invariance [3,12]; Robustness (RS) addresses stability under perturbation [13,14]; Local Logical Coherence (LS) reflects constraint-satisfaction in inferential chains [4,11]; Efficiency (ES) embodies bounded rationality [2,5]; and Stability (SS) captures behavioral reliability across stochastic runs [24]. Together, these six properties constitute a theoretically motivated core set rather than an exhaustive taxonomy of reasoning quality. Other dimensions, such as calibration, uncertainty awareness, causal faithfulness, and self-correction, are plausible extensions, and we make no claim of completeness. The six dimensions are conceptually distinct by design, each motivated independently by the cognitive-science account above; whether they are also empirically independent is a separate question we test rather than assume. The discriminant validity analysis in Section 4.5 finds that they are not uniformly independent: 6 of 15 dimension pairs show acceptable discriminant separation ( | r | < 0.50 ), while the remaining pairs cluster into an outcome-level group (CQ, CS, RS, and ES) that is strongly intercorrelated once computed from a shared canonicalized answer representation.
This two-layer organization is examined empirically in Section 4.
Observation derived from the evaluated models and datasets, not an assumption built into the framework’s design; Local Logical Coherence (LS) is the dimension that empirically remains most clearly orthogonal to the rest.
Reasoning quality is, thus, modeled as follows:
Q = f ( CQ , CS , RS , LS , ES , SS ) .
We refer to this six-dimensional behavioral model as RQEval (Reasoning Quality Evaluation) throughout the remainder of the paper.

3.2. Metric Definitions

We next translate each of these theoretically motivated dimensions into an operational metric.
Table 2 defines all symbols used in the metric formulas below. K = 3 and P = 3 were chosen as a practical compromise between estimation reliability and computational cost: each additional repeated generation multiplies API cost and wall-clock time across seven models, four datasets, and 975 items, and K = 3 is the minimum value that permits pairwise agreement to be computed as a non-degenerate statistic (a single pair at K = 2 provides only a binary match/mismatch signal, with no way to distinguish a model that is occasionally inconsistent from one that is consistently inconsistent). We view K = 3 as sufficient to detect substantial behavioral instability of the magnitude observed in this study (Section 4), but not as a precision instrument for fine-grained consistency estimation; larger K would reduce sampling variance in the CS and SS estimates and is a direct avenue for future work under a larger compute budget.
Correctness (CQ) measures final-answer accuracy: the epistemic goal of reasoning as the production of conclusions that accurately correspond to the underlying problem structure [33,34]. Because LLM outputs are often verbose (“John has 8 apples.” rather than “8”), y ^ i is extracted from the raw generation using a type-aware canonicalization procedure. The matching rule is selected from the gold-answer type before comparison. For numeric answers, the pipeline uses the value following a #### delimiter when present (GSM8K’s standard final-answer marker [30]) and otherwise extracts the final number in the generation; values are compared within a tolerance of 10 3 . Binary answers require an unambiguous yes/no lexical signal. Multiple-choice answers require a structurally anchored option letter A–D, such as a letter following “answer is” or “correct option is”, rather than an arbitrary occurrence of that letter. Other free-text answers use normalized string equality or containment after lowercasing, trailing-punctuation removal, and whitespace collapse. Restricting containment to free-text answers prevents short numeric and categorical labels from matching incidentally inside unrelated tokens. If no applicable canonical answer can be extracted, the response is scored as incorrect. The same canonicalization procedure is used for CQ, CS, and RS. The full implementation is available in the released code (Section 3.4).
CQ = 1 N i = 1 N I y i = y ^ i
Consistency (CS) evaluates output stability across K = 3 independent responses per instance at temperature = 0.7 :
CS = 1 N i = 1 N 2 K ( K 1 ) k = 1 K l = k + 1 K I y ^ i ( k ) = y ^ i ( l )
Robustness (RS) measures performance under P = 3 semantic-preserving perturbations generated via a fixed rule-based pipeline: (i) one WordNet synonym substitution among content words, using the most frequent synset and accepting the best candidate only when its cosine similarity under spaCy en_core_web_md exceeds 0.85 ; (ii) syntactic reordering with the same spaCy dependency parser, either by moving a fronted subordinate clause or by swapping coordinated clauses while preserving logical scope; and (iii) surface paraphrasing through English → French → English back-translation with facebook/nllb-200-distilled-600M. A strategy that cannot produce a distinct perturbation retains its fixed slot and contributes zero to the P = 3 denominator; the original question is never substituted for a failed perturbation. Semantic preservation was assessed in a double-annotated validation sample, yielding Cohen’s κ = 0.91 . RS is computed exclusively over originally correct instances C to prevent trivially high scores for consistently-wrong models [13,14]:
RS = 1 | C | i C 1 P p = 1 P I y ^ i ( p ) = y i
By construction, RS is downstream of CQ: it is undefined for models with zero correctness and structurally correlated with CQ across models. This dependency is by design—robustness is only meaningful given a correct baseline—but practitioners should treat CQ–RS and CQ–ES correlations as structural rather than informative signals. For computational completeness, the implementation returns RS = 0 when C is empty.
Local Logical Coherence (LS) evaluates step-to-step consistency of reasoning traces using the cross-encoder/nli-deberta-v3-small model to classify each consecutive step pair s j , s j + 1 as contradiction, neutral, or entailment [4,11]; ψ is the resulting binary contradiction indicator (top predicted label), not a probability. Reasoning steps are obtained by splitting generated responses at period boundaries; line breaks in locally generated responses are normalized before this split. Consecutive pairs are supplied as premise [SEP] hypothesis, with truncation at 512 tokens and a batch size of 32. If a batched NLI call fails, the implementation assigns a neutral label to the affected pairs; if the NLI model is unavailable, it falls back to a documented lexical-negation heuristic. Models producing single-sentence responses receive LS = 1.0 by convention, since a single atomic step admits no internal contradiction by definition. We acknowledge this is conservative: a single-sentence response may avoid reasoning entirely, and high LS should not be interpreted as evidence of deep reasoning soundness but rather as absence of detected local contradiction.
LS = 1 1 N i = 1 N 1 n i 1 j = 1 n i 1 ψ ( s j , s j + 1 )
Efficiency (ES) measures the tradeoff between correctness and token cost via a harmonic mean, grounding the framework in bounded rationality [2,5]. Let T i be the min–max normalized token count of item i’s output, relative to the minimum and maximum token counts observed across the evaluated set for that model (Table 2):
ES = 1 N i = 1 N 2 · CQ i · ( 1 T i ) CQ i + ( 1 T i )
Stability (SS) measures the semantic similarity of reasoning traces across K = 3 runs via BERTScore F1, operationalizing Liu et al. [24]’s finding that process stability and output consistency are decoupled. For each pair of traces ( r i ( k ) , r i ( l ) ) , the implementation uses BERTScore 0.3.13 with distilbert-base-uncased, English language settings, and no baseline rescaling. The three pairwise comparisons induced by K = 3 are computed in a single batch and averaged. Missing or failed traces remain in the fixed K denominator and contribute zero; Jaccard similarity is used only as a runtime fallback when BERTScore is unavailable:
SS = 1 N i = 1 N 2 K ( K 1 ) k = 1 K l = k + 1 K BERTScore ( r i ( k ) , r i ( l ) )
For each evaluation item, the primary response is used to compute CQ, LS, and ES and also serves as the first of the K = 3 responses used for CS and SS. Two additional independent responses complete the fixed-K sample, and three fixed perturbation slots are evaluated for RS. Final answers are canonicalized using the same type-aware procedure for CQ, CS, and RS, whereas LS and SS operate directly on the generated reasoning traces. Finally, the six dimension scores are aggregated using either equal weights or a deployment-specific weight vector.

3.3. Aggregation Strategies

Dimension scores are aggregated as a weighted average Q w = d w d · d , where d { CQ , CS , RS , LS , ES , SS } . Seven built-in weighting schemes address the common deployment contexts shown in Table 3:
These weight vectors represent theoretically motivated illustrative defaults. Domain practitioners should calibrate them against their specific operational requirements and risk tolerance; the framework supports arbitrary custom weight vectors via the configuration file. Two design choices merit explanation. In Safety Priority, LS (not CS) receives the second-largest weight after CQ and RS: safety-critical review is primarily concerned with whether a reasoning chain is internally free of contradiction (the property LS measures) rather than whether the same surface answer recurs across repeated sampling, which reflects generation-time stochasticity more than audit risk. In Accuracy Priority, CQ is weighted more heavily than CS (0.50 vs. 0.10) rather than comparably: our own discriminant validity analysis (Section 4.5) finds CQ and CS to be strongly correlated ( r = 0.928 ) once both are computed under the same canonicalized-answer protocol, so weighting them near-equally would largely double-count a single underlying signal.

3.4. Experimental Setup

The experimental design was constructed to capture variation along two axes: model access and reasoning-task structure. The model panel includes closed-source API systems, a large open-weight model accessed through an API, and smaller locally executed open-weight models. This selection enables comparisons across model scale, access conditions, and deployment constraints. The benchmark suite covers open-ended arithmetic reasoning, multiple-choice knowledge and reasoning, binary commonsense reasoning, and controlled synthetic stress tests. Accordingly, the model-by-dataset design evaluates whether the proposed dimensions remain informative across heterogeneous answer formats and reasoning demands.
Seven LLMs spanning closed-source API models and open-weight local models were evaluated (Table 4). API models accessed via the ASU CreateAI gateway (GPT-4o-mini, Claude-Haiku-4.5, Gemini-2.5-Flash, LLaMA-3.1-70B) were queried at temperature = 0.7 with max_tokens  = 256 , with the exception of Gemini-2.5-Flash, for which max_tokens was increased to 1024: this model’s internal reasoning consumes tokens against the same budget as the visible response, and at 256 tokens responses were systematically truncated before an answer was produced (verified on held-out probes) and 1024 tokens left ample headroom (observed completions of 200–430 tokens) while imposing no change to the extraction or scoring pipeline. A minimal neutral system prompt (“You are a helpful assistant.”) was supplied to all gateway-routed models to suppress the gateway’s own default template injection, which otherwise prepended several hundred to several thousand tokens of boilerplate context ahead of the query. DeepSeek-V3 was queried directly via the DeepSeek API (temperature = 0.7 , max_tokens  = 256 , and no system prompt required). Local models (Qwen2.5-1.5B, Phi-2) were executed on an NVIDIA GTX 1650 (4 GB VRAM). Phi-2 (2.7B parameters) was loaded in float16 and Qwen2.5-1.5B (1.5B parameters) required 4-bit (NF4) quantization via bitsandbytes to remain within the available VRAM budget alongside the evaluation pipeline’s other memory demands (tokenizer, NLI and BERTScore models loaded for LS/SS computation). Phi-2’s float16 footprint (5.56 GB peak resident memory, measured via torch.cuda.max_memory_allocated() during a diagnostic generation pass) exceeds the GPU’s 4.30 GB dedicated VRAM capacity by approximately 1.3 GB. Execution, nonetheless, completed successfully, which we attribute to Windows’ WDDM driver-level memory virtualization: a corresponding increase in Task Manager’s Shared GPU Memory counter was observed during model loading, consistent with transparent spillover of the excess allocation into system RAM. This execution mode is functionally comparable to, although slower than, native VRAM residency. Nevertheless, because ES is computed from output token counts rather than wall-clock latency, this difference in execution speed does not affect the ES calculation, though it may partly explain the longer wall-clock runtime observed for Phi-2 relative to Qwen2.5-1.5B during evaluation.
Reproducibility note. During reproduction of the original experiments on this gateway, we identified and corrected two methodological issues in the evaluation pipeline, which are detailed here for transparency. First, the multi-strategy answer-extraction pipeline (described under Correctness below) exhibited a short-gold substring leak: for single-character or short numeric gold answers, strategy (ii) (substring containment) could match incidentally inside an unrelated token (e.g., gold “D” matching the d in “drastic”; gold “5” matching inside “25”). This inflated CQ on MMLU and StrategyQA in particular. We replaced the substring strategy, for short categorical golds, with type-aware canonical matching: numeric answers are compared as parsed floating-point values (respecting a ####-delimited final answer when present); yes/no answers require an unambiguous lexical signal (e.g., negation markers) rather than raw substring presence and multiple-choice answers require a structurally anchored option letter (e.g., following “answer is”, “correct option is”, or as the first token of the response) rather than any bare occurrence of the letter. Second, Consistency (CS) was originally computed as full-text equality across the K runs, which collapsed to near-zero for any model that rephrased a correct answer differently across runs (e.g., “The answer is 30.” vs. “5 × 6 = 30” were scored as inconsistent). CS is now computed over the same canonicalized answers used for CQ, so that paraphrases of the same underlying answer are scored as consistent. Both corrections are implemented in the released code and were applied uniformly to all seven models; all CQ, CS, RS, and ES values reported below reflect the corrected protocol. LS and SS, which operate on reasoning traces rather than extracted answers, are unaffected.
We evaluate across 975 items from four benchmarks: GSM8K [30] (250 items; arithmetic word problems; and primarily exercises CQ and ES), MMLU [31] (225 items from 9 reasoning subjects: logical fallacies, formal logic, abstract algebra, elementary/high-school/college mathematics, statistics, conceptual physics, and philosophy; and controlled environment for CS and SS), StrategyQA [35] (250 items; implicit multi-step commonsense reasoning; binary yes/no; and informative for LS), and a Synthetic dataset (250 items constructed by the authors: 100 arithmetic word problems with numerical variation, 75 adversarial instances embedding deliberate logical contradictions into otherwise valid premises, and 75 robustness probes pairing each item with two surface-level paraphrases, all designed to stress-test RS and CS. Items were manually reviewed for semantic validity and absence of overlap with GSM8K training splits). Items were sampled uniformly at random from each benchmark’s designated test split using a fixed random seed (seed = 42 ), with no filtering beyond the subject categories listed above for MMLU.
Table 5 provides representative examples from each Synthetic subset.


4. Results

All six dimension scores range from 0 to 1, with higher values indicating better performance. Unless otherwise stated, overall scores pool the 975 evaluation items across all four datasets. Because several outcome-level metrics share the same canonicalized answer representation or correctness signal, differences across dimensions should be interpreted as behavioral profiles rather than as statistically independent effects.

4.1. Overall Multi-Dimensional Reasoning Quality

Table 6 shows that Claude-Haiku-4.5 achieves the highest performance across all aggregation strategies ( Q bal = 0.808 ), driven by superior CQ ( 0.783 ) and RS ( 0.895 ). The value of multi-dimensional profiling remains apparent even though, under the corrected protocol, aggregate rankings are highly stable across weighting schemes (see Section 4.4): DeepSeek-V3 and Gemini-2.5-Flash show similar balanced scores (0.766 and 0.756) yet reach them through different profiles; DeepSeek is strongest on RS (0.927) and weakest on ES (0.540), while Gemini is comparatively balanced across CQ, CS, and RS but leads on LS (0.782). Equally striking, LLaMA-3.1-70B ( Q bal = 0.723 ), despite being a 70B-parameter model, scores below Claude-Haiku-4.5 and only marginally above GPT-4o-mini ( Q bal = 0.722 ), suggesting that model scale alone does not determine multi-dimensional reasoning quality.
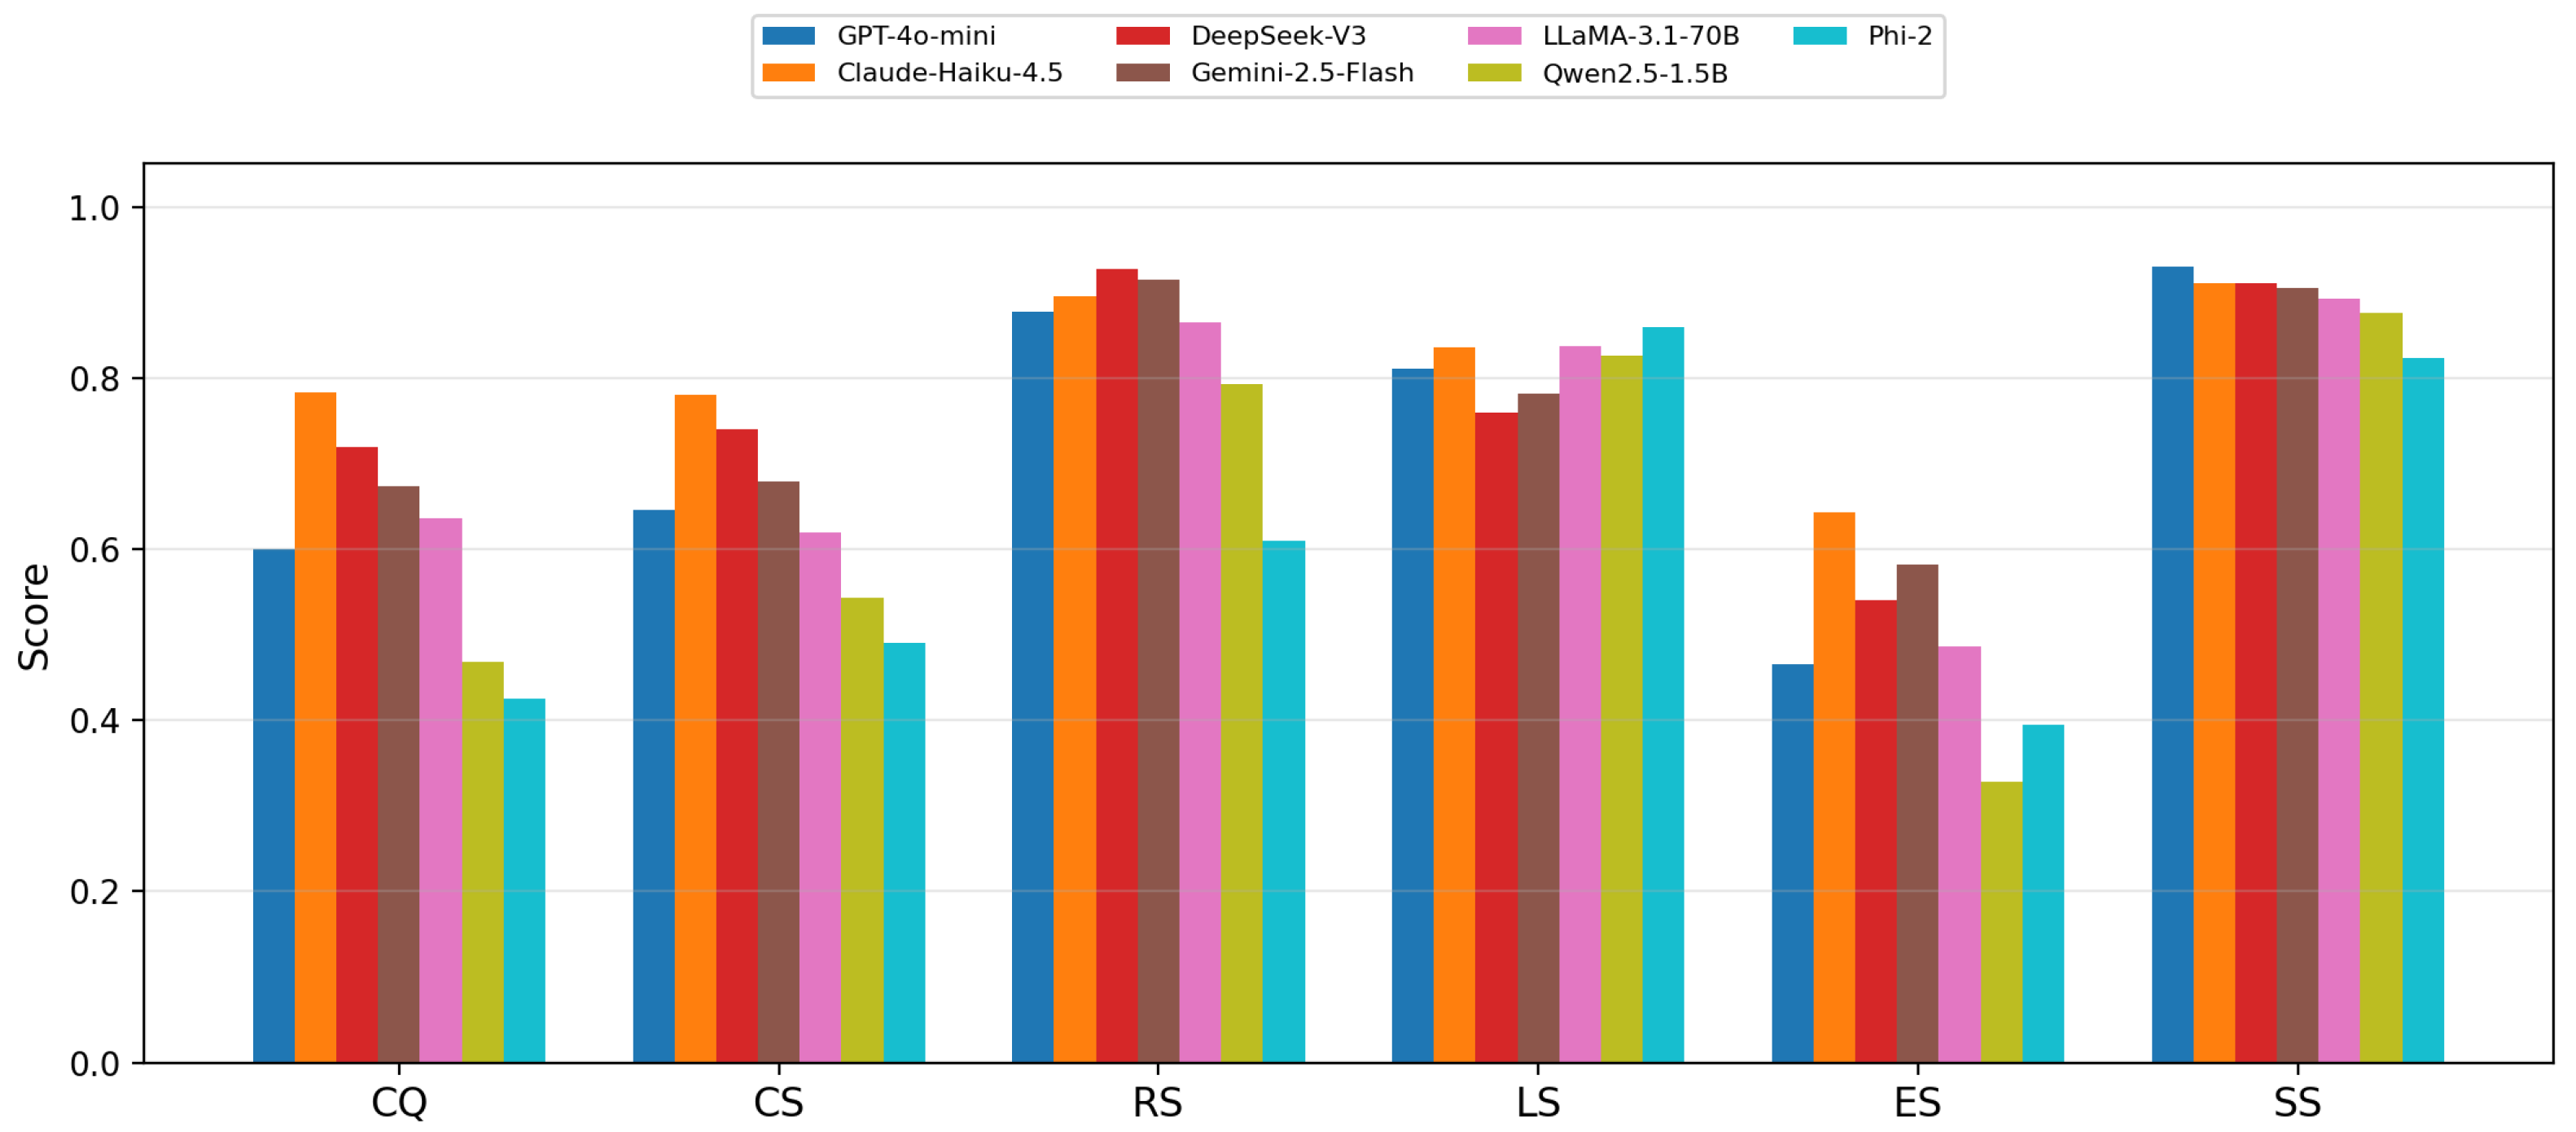
A clear structural pattern emerges at the dimension level. Because CS is computed over the same canonicalized answers as CQ (Section 3.4), the two dimensions track each other closely across models ( r = 0.928 ; Section 4.5) rather than dissociating: models that produce cleanly extractable answers tend to reproduce them across the K = 3 runs. Nevertheless, SS remains uniformly higher than CS for every model (e.g., Claude-Haiku-4.5: SS = 0.910 vs. CS = 0.781 ; Phi-2: SS = 0.823 vs. CS = 0.490 ), indicating that the semantic content of reasoning traces is more stable across runs than the exact extracted answer, a finer-grained dissociation between semantic and surface-level consistency. This pattern extends to small models: Phi-2 achieves the highest LS in the panel (0.860) despite the lowest CQ (0.426). While this is consistent with the interpretation that coherence is partially independent of correctness (LS–CQ: r = 0.083 , ns; Section 4.5), we note that the NLI-based LS metric detects local step-to-step contradiction rather than global reasoning validity; these scores should, therefore, be read as evidence of local inferential consistency rather than deep semantic soundness. Figure 2 visualizes these dimension-level profiles across the seven models.
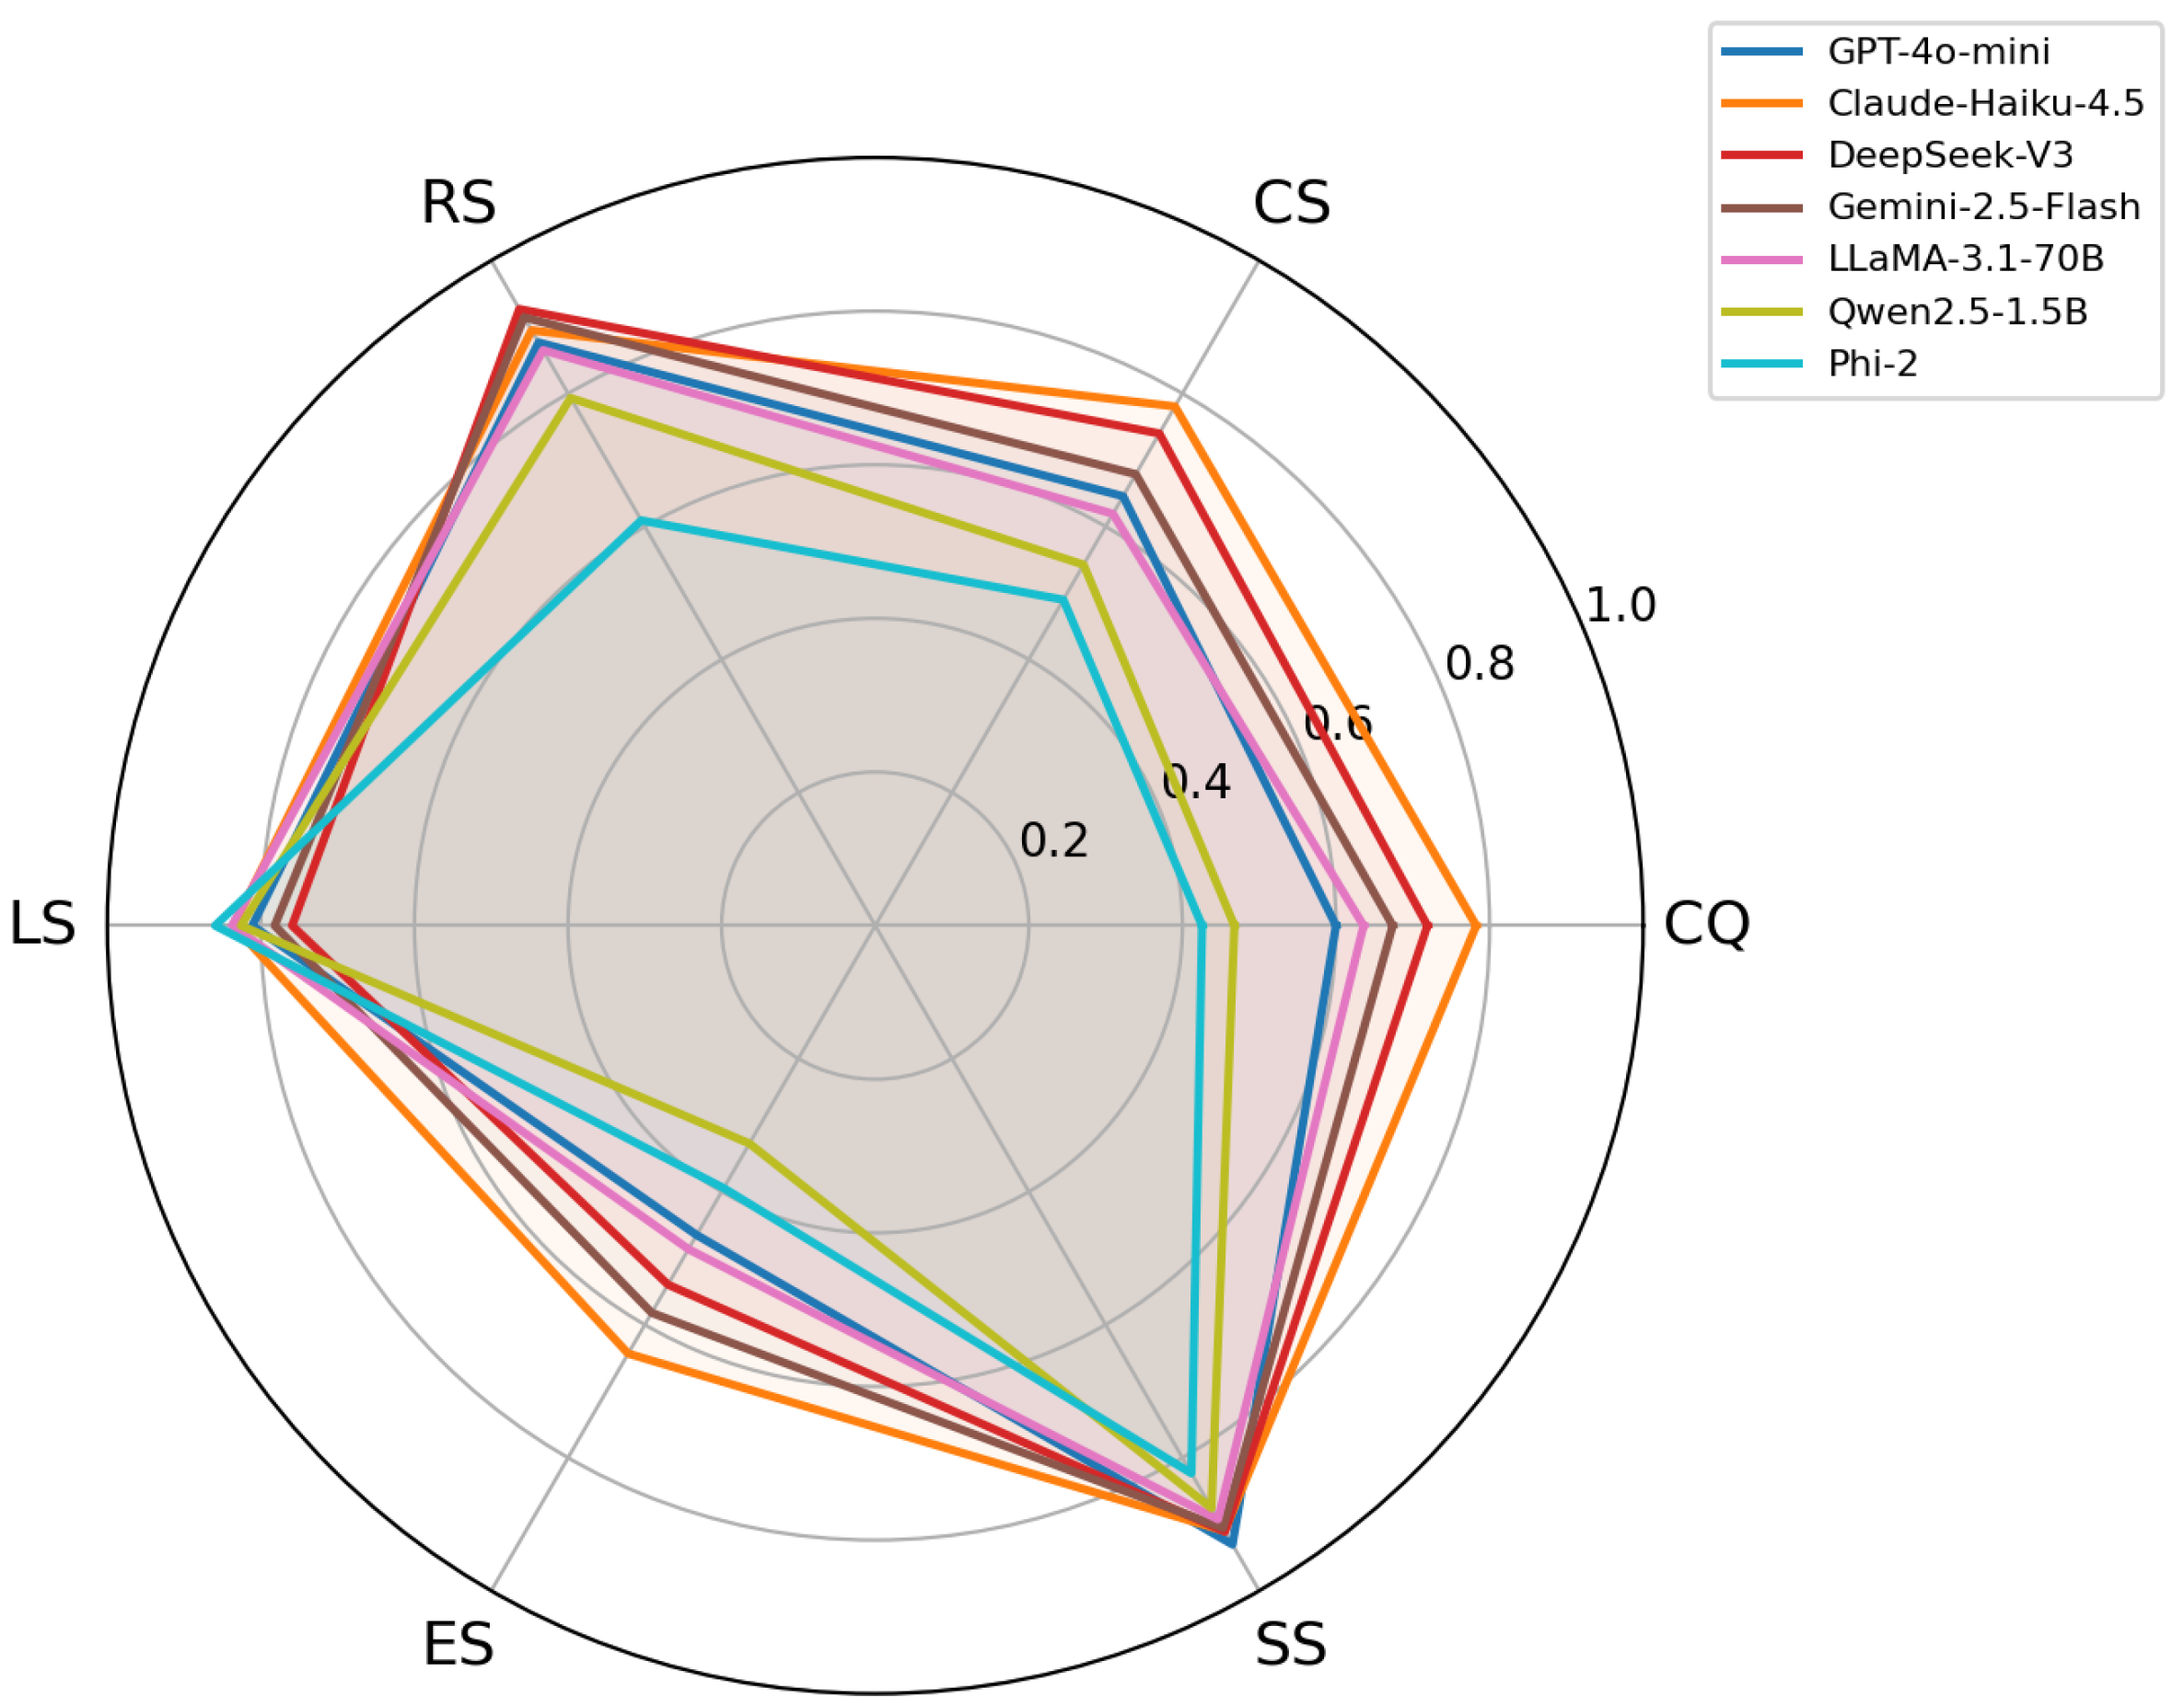
Figure 3 provides the same overall comparison as a radar plot to emphasize cross-dimensional profile shapes.

4.2. Per-Dataset Analysis

Although the pooled results reveal broad model-level patterns, they conceal substantial variation across benchmarks. Table 7, therefore, reports the results separately for each dataset.
GSM8K. CQ ranges widely (0.240–0.904), with DeepSeek-V3 leading (0.904), narrowly ahead of Claude-Haiku-4.5 (0.880); both substantially outperform the remaining API models. Under the corrected extraction protocol, GSM8K CQ is markedly lower for the two smallest models because the numeric-extraction strategy credits only the final number in each response. Both small models maintain relatively high LS given their CQ (Qwen2.5-1.5B: 0.713, Phi-2: 0.762), suggesting that relatively high local coherence can coexist with low final-answer correctness.
MMLU. Correctness is comparatively low for Gemini-2.5-Flash ( CQ = 0.449 ), which records the lowest CQ among the API-based models on this dataset. As discussed in Section 3.4, the corrected extraction pipeline prevents spurious matches between short gold labels and incidental occurrences of single option letters. Claude-Haiku-4.5 remains the strongest ( CQ = 0.924 ). The constrained {A,B,C,D} format still yields comparatively high RS values (0.578–0.946) relative to the open-ended datasets.
StrategyQA. Phi-2 achieves LS = 0.974 , the highest LS across any model–dataset combination, essentially unchanged from the uncorrected run since LS does not depend on answer extraction, while LLaMA-3.1-70B drops to RS = 0.783 and, more strikingly, to CS = 0.287 , the lowest consistency observed for any model on any dataset: LLaMA-3.1-70B frequently produces a different implicit yes/no judgment across the K = 3 resamplings of the same StrategyQA item. ES is notably low for most models (0.220–0.479) but reaches 0.606 for Gemini-2.5-Flash. Because ES is normalized within each model, this value reflects Gemini-2.5-Flash’s observed correctness–token profile and should not be attributed directly to its larger max_tokens setting (Section 3.4). More generally, commonsense questions tend to elicit longer traces without proportional correctness gains.
Synthetic. CS is more narrowly clustered and elevated here than on any other dataset (0.591–0.817 across all seven models), reflecting the dataset’s structured, easily-canonicalized answer format. Most API models maintain RS > 0.85 (GPT-4o-mini 0.868, DeepSeek-V3 0.935, Gemini-2.5-Flash 0.880, LLaMA-3.1-70B 0.868), though Claude-Haiku-4.5 dips to RS = 0.749 on this dataset specifically; local models show greater vulnerability still (Qwen2.5-1.5B RS = 0.767 , Phi-2 RS = 0.618 ).

4.3. Cross-Cutting Findings

Three findings emerge consistently across all datasets. First, CQ and ES are more tightly coupled than most other dimension pairs, although they can still diverge at the model level: Claude-Haiku-4.5 leads on both CQ ( 0.783 ) and ES ( 0.643 ), DeepSeek-V3 achieves comparable CQ ( 0.719 , a 6.4-point gap), yet ES falls to 0.540 , a 10.3-point efficiency gap disproportionate to the correctness difference, and Gemini-2.5-Flash inverts the pattern entirely, which means a lower CQ ( 0.674 ) than DeepSeek-V3 but a higher ES ( 0.582 ). Second, logical coherence shows no statistically significant association with correctness under the corrected protocol: the CQ–LS correlation is r = 0.083 (ns, n = 28 ), consistent with prior findings in the faithfulness literature [6,7], showing that correct answers can arise from incoherent reasoning traces. LS is, in fact, the only dimension for which no statistically significant correlation with any other dimension was observed in the panel (Section 4.5). Third, small models exhibit non-trivial dimensional profiles:Phi-2 achieves the panel’s highest LS ( 0.860 ) and a competitive SS ( 0.823 ) despite the panel’s lowest CQ ( 0.426 ), indicating that coherence and stability are not simply proxies for correctness, even at the 2.7B scale.

4.4. Deployment-Aware Model Selection

These dimension-level differences motivate a practical question: do alternative deployment priorities materially alter model rankings? Standard benchmark evaluation produces a single global ranking; the appropriate model depends on which quality dimensions are most consequential. Table 8 presents model rankings across all seven evaluation scenarios.
Rankings are highly stable across scenarios under the corrected protocol.Unlike the substantial rank inversions observed under the earlier protocol, the corrected results produce the same ordering for the top five models (Claude-Haiku-4.5, DeepSeek-V3, Gemini-2.5-Flash, LLaMA-3.1-70B, and GPT-4o-mini) across all seven weighting schemes. This stability is a direct, expected consequence of the discriminant-validity finding in Section 4.5: because CQ, CS, RS, and ES are now strongly intercorrelated ( r = 0.57 0.93 ) once computed under a shared canonicalization protocol, no weighting scheme built from these four dimensions can substantially reorder models that differ mainly along the correlated axis. Ranking sensitivity is, therefore, most likely to arise in scenarios that assign greater weight to the comparatively independent trace-level dimensions, LS and SS, or that strongly amplify model-level differences in ES.
Key inversion: Gemini-2.5-Flash vs. DeepSeek-V3, and Phi-2 vs. Qwen2.5-1.5B, under Edge Device/IoT. Edge Device/IoT is the only scenario in which the ranking departs from the otherwise-universal ordering, and it produces two simultaneous rank swaps. First, Gemini-2.5-Flash (Edge score 0.662 ) overtakes DeepSeek-V3 ( 0.657 ) to move into second place, despite DeepSeek-V3 leading Gemini on CQ ( 0.719 vs. 0.674 ) and RS ( 0.927 vs. 0.914 ): Gemini’s efficiency advantage (ES = 0.582 vs. 0.540 ) is amplified by the scenario’s 50% ES weight, which is enough to offset its correctness deficit. Second, among the two smallest models, Phi-2 (Edge score 0.460 ) overtakes Qwen2.5-1.5B ( 0.459 ), the only scenario in which Phi-2 outranks Qwen2.5-1.5B, and this is driven by the same mechanism: Phi-2 trails Qwen2.5-1.5B on four of six dimensions (CQ, CS, RS, and SS) but leads on LS and, decisively for this scenario, ES ( 0.395 vs. 0.328 ). Both inversions illustrate the same underlying point: a deployment context that heavily weights efficiency can favor a model that is otherwise weaker on accuracy-adjacent dimensions, and this preference is invisible to any correctness-only benchmark. A practitioner relying on accuracy-only benchmarking would rank DeepSeek-V3 and Qwen2.5-1.5B ahead of their Edge-appropriate alternatives in precisely the deployment context of resource-constrained inference, where that ranking is least appropriate.

4.5. Discriminant Validity

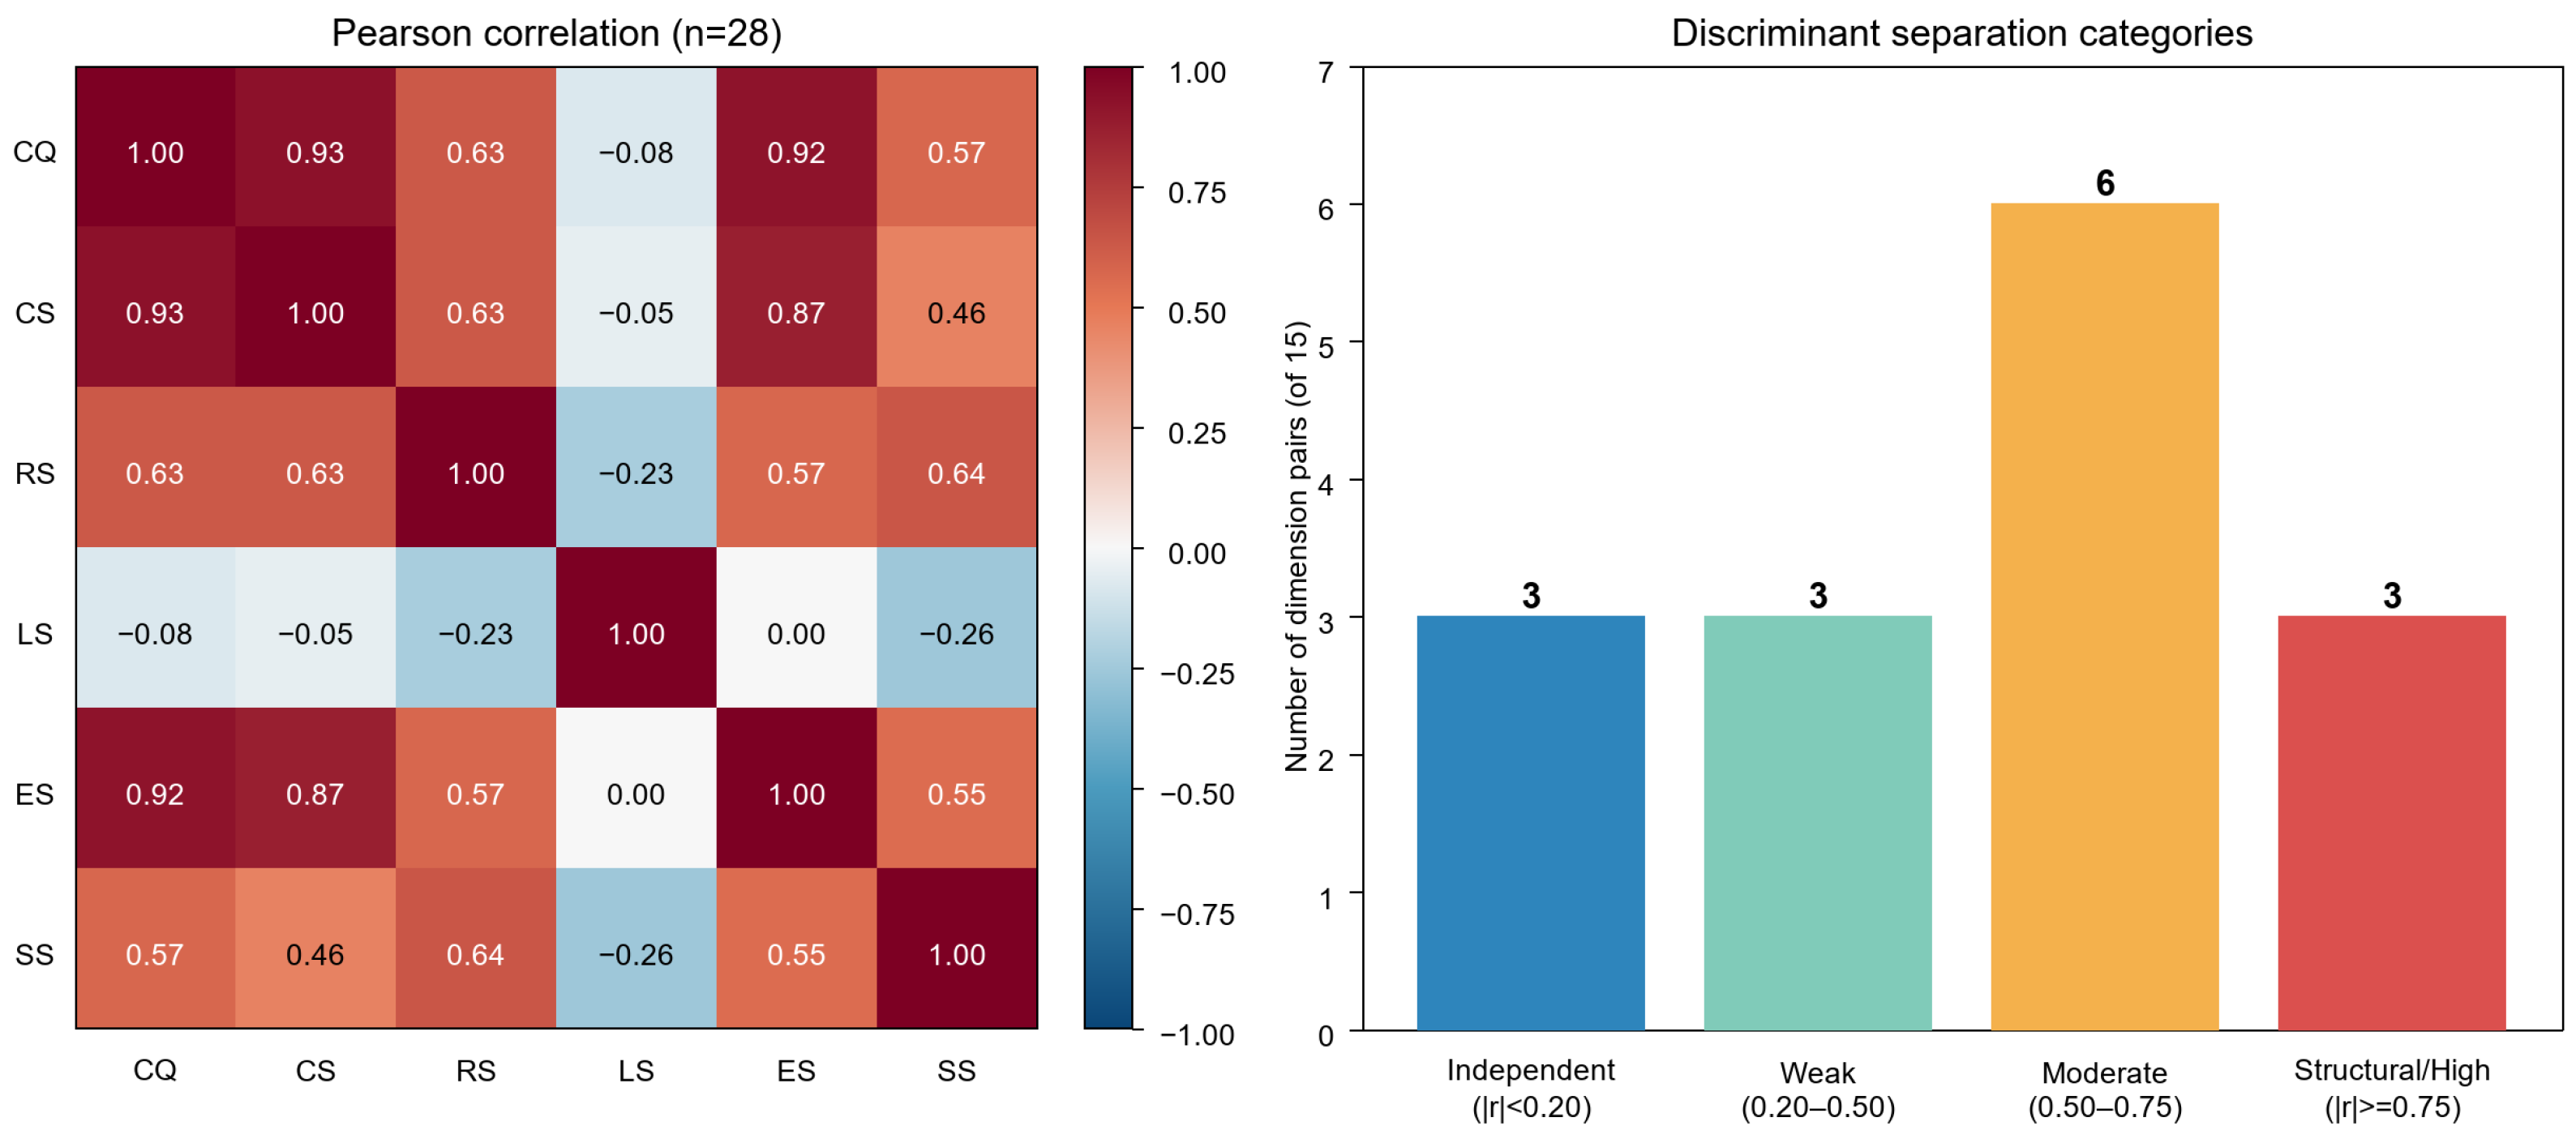
The observed stability of most rankings raises a broader measurement question: to what extent do the six dimensions capture empirically distinct constructs? Discriminant validity (evidence that the proposed dimensions measure non-overlapping constructs) is a necessary condition for any multi-dimensional framework. We report Pearson correlations with 95% bootstrap confidence intervals over n = 28 observations (7 models × 4 datasets). Because these observations reuse the same model families and benchmark domains, they are not fully independent in the psychometric sense, and the results should, therefore, be interpreted as indicative rather than conclusive construct-validity evidence. Figure 4 and Table 9 summarize the results.
Of the 15 dimension pairs, 6 have negligible or weak correlations ( | r | < 0.50 ), whereas the remaining 9 are elevated because CQ, CS, RS, and ES share the same canonicalized answer representation or correctness signal, whether directly or through correctness-conditioning (Section 3.4): a model that produces cleanly extractable, correct answers tends to score well on all four simultaneously. CQ–ES ( r = 0.917 ) and CQ–RS ( r = 0.627 ) remain structural by construction, as in the original design (RS is defined only over correctly-answered items and ES’s harmonic mean embeds C Q i directly). Unlike CQ–ES and CQ–RS, the newly prominent association between CQ–CS ( r = 0.928 ) is not definitionally dependent in the same sense (CS is computed independently, as cross-run agreement among K = 3 samples) but is empirically driven by the shared canonicalization step: once both metrics compare against the same extracted-answer space, a model either reliably lands on the canonical answer (high CQ and CS together) or does not. Partial correlation confirms CQ-mediation across the board: controlling for CQ collapses RS–ES from r = 0.566 to r RS ES CQ = 0.029 , CS–ES from r = 0.874 to r CS ES CQ = 0.153 , and CS–RS from r = 0.634 to r CS RS CQ = 0.179 ; in each case the raw association is almost entirely attributable to a shared dependence on CQ rather than to genuine pairwise redundancy.
Read this way, the six-dimensional framework’s clearest discriminant contribution is concentrated in one dimension: LS shows no statistically significant association with any other dimension in the panel (all | r | 0.229 , none significant), including, notably, with CQ ( r = 0.083 ), which is consistent with prior findings in the faithfulness literature [6,7] that correct answers can arise from incoherent reasoning traces even when CQ, CS, RS, and ES move together. SS retains partial independence, correlating weakly with CS ( r = 0.458 ) and moderately with the CQ-cluster ( r = 0.55 0.64 ) but never approaching the near-unity association seen within that cluster itself, which is consistent with our earlier finding (Section 4) that the semantic content of reasoning traces is more stable across runs than the exact extracted answer.
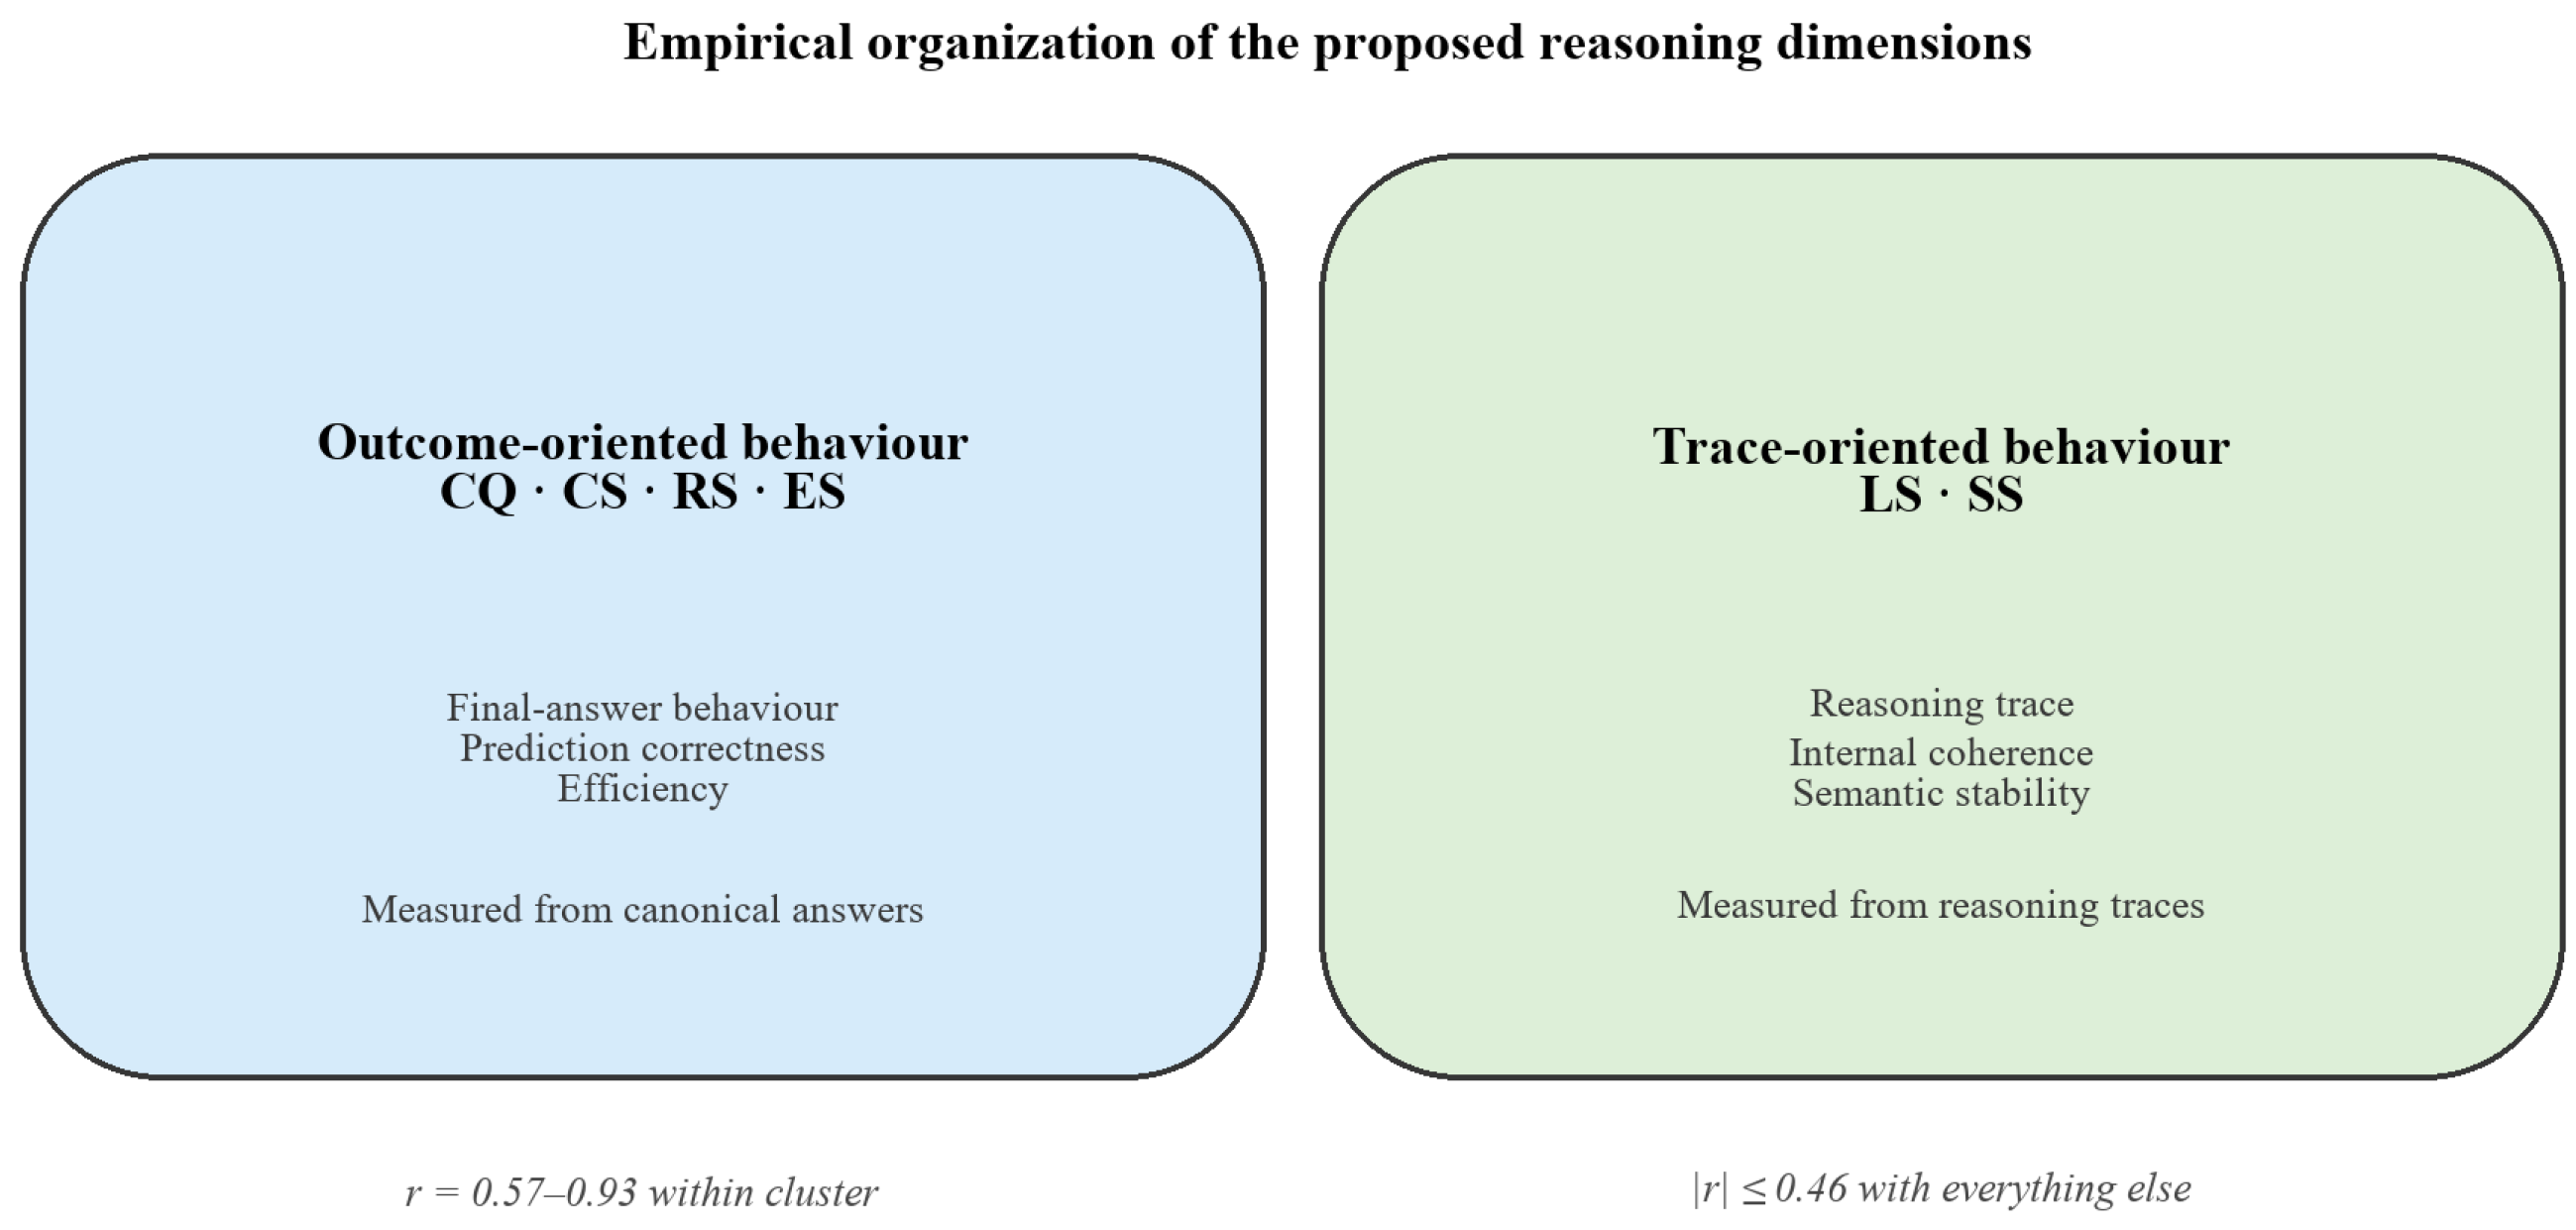
Figure 5 summarizes the principal empirical finding of this study. Although the framework defines six behavioral dimensions on independent theoretical grounds (Section 3.1), their empirical organization across the seven evaluated models reveals two behavioral layers: outcome-level metrics are linked through canonicalized final answers or correctness signals and, therefore, exhibit relatively strong pairwise correlations, whereas trace-level metrics are derived directly from reasoning traces. Within the trace-level layer, LS is the more clearly distinct dimension, while SS retains moderate associations with several outcome-level metrics. This separation explains both the discriminant-validity structure reported above and the deployment behavior reported in Section 4.4.
In summary, the framework’s strongest orthogonal information is carried by LS, while SS provides a partially distinct trace-level signal; this information is not distributed uniformly across all six dimensions. The 95% CIs were confirmed via bootstrap validation ( B = 10,000  resamples).

5. Discussion

5.1. Practical Implications

The discriminant validity results (Section 4.5) point to a single organizing pattern that runs through the findings below: the six dimensions do not behave as six uniformly independent signals but rather as two behavioral layers. An outcome-level cluster (Correctness, Consistency, Robustness, and Efficiency) is strongly intercorrelated ( r = 0.57 0.93 ) because all four share a canonicalized answer representation or correctness signal. At the trace level, Local Logical Coherence shows no statistically significant association with the outcome-level metrics, whereas Stability retains moderate associations with several of them; LS and SS are not significantly correlated with each other. The practical implications below follow from this structure.
Implication 1: Local logical coherence contributes information beyond final-answer correctness. In the evaluated sample, LS showed no statistically significant association with any other dimension, including CQ ( r = 0.083 , ns). It, therefore, captures a property that is not directly represented by a correctness score. Phi-2 on StrategyQA illustrates this diagnostic distinction: CQ = 0.524 and LS = 0.974 show that relatively high local coherence can coexist with moderate final-answer correctness. This pattern does not, by itself, identify the cause of the errors, because LS detects local contradiction rather than knowledge deficiencies, causal faithfulness, or global argument validity. For interpretability-sensitive systems (such as legal assistants and clinical decision support), a reasoning trace should, therefore, be evaluated separately from the correctness of its final answer.
Implication 2: Within the outcome-level cluster, model rankings are largely stable across deployment weightings, with one informative exception. Because CQ, CS, RS, and ES move together, weighting schemes built from these four dimensions rarely disagree (Table 8). The exception is the Edge Device/IoT scenario, which assigns an unusually large weight to efficiency (50%) and thereby amplifies model-level differences within the outcome-oriented cluster: Gemini-2.5-Flash overtakes DeepSeek-V3 despite trailing it on correctness and robustness, and Phi-2 overtakes Qwen2.5-1.5B despite trailing it on four of six dimensions (Section 4.4). A procurement process optimizing for accuracy alone could, therefore, favor a different model in a resource-constrained setting. These reversals are descriptive and based on small score differences, but they illustrate how deployment weights can alter a decision when efficiency is prioritized.
Implication 3: The efficiency–correctness gap remains practically meaningful, even within the correlated cluster. DeepSeek-V3 ( CQ = 0.719 ) reaches ES = 0.540 versus Claude-Haiku-4.5’s ES = 0.643 (a 10.3-point efficiency gap against a 6.4-point correctness difference), and Gemini-2.5-Flash inverts the pattern outright, trailing DeepSeek-V3 on correctness yet leading it on efficiency. A strong aggregate correlation does not imply that the dimensions are redundant for every individual pair of models; it means that, in aggregate, a practitioner who observes CQ can often predict CS, RS, and ES reasonably well, but not always. The exceptions may be particularly relevant to deployment decisions.
Taken together, these implications reframe the framework’s contribution; it is not merely a ranking tool but a pre-deployment diagnostic instrument that is most informative along two axes: whether a model’s reasoning is internally coherent (LS), and whether its accuracy-adjacent behavior (CQ, CS, RS, and ES) diverges from the norm for its evaluated cluster peers, as it does for Gemini-2.5-Flash and Phi-2 under efficiency weighting.

5.2. Limitations

These implications should be interpreted in light of several limitations. First, the discriminant validity analysis is based on n = 28 model–dataset observations that are not fully independent, and significance tests should be interpreted accordingly. Second, model rankings across deployment scenarios are reported as point estimates; between-model score differences are not accompanied by significance tests, and small gaps (e.g., Δ Q < 0.01 ) should not be over-interpreted. Third, the LS metric captures local step-to-step contradiction via NLI and does not assess causal faithfulness or global argument validity. Fourth, all evaluations were conducted at temperature = 0.7 ; consequently, CS partly reflects the selected sampling regime rather than intrinsic model inconsistency alone. Replication at lower temperatures is, therefore, warranted. Future versions of the LS metric may incorporate reasoning-depth normalization to avoid rewarding trivially short responses with perfect scores.
Fifth, specifically in the reproduced analysis, the corrected canonical-answer-extraction protocol (Section 3.4) substantially increased the empirical correlation between CQ, CS, RS, and ES (Section 4.5). This is, in our reading, a more accurate picture of these metrics’ relationships than the one obtained under the original full-text CS computation, but it also means the framework’s discriminant-validity evidence is now concentrated in fewer dimensions (principally LS) than originally claimed; readers should weight the six dimensions accordingly rather than treating each as equally informative. Sixth, one model in our panel (Gemini-2.5-Flash) required a non-default max_tokens setting (1024 vs. 256 for all other API models) to avoid the systematic truncation caused by the gateway’s internal reasoning-token consumption; because ES is computed via min–max normalization over the token counts observed within a given model’s own evaluation run (Table 2), this does not bias Gemini-2.5-Flash’s own ES score, but readers should not interpret the raw token counts underlying ES as directly comparable generation-cost figures across models with different provider-side token-budget behavior. Seventh, we identified and corrected a transcription error in two of the seven built-in aggregation weight vectors (Safety Priority and Accuracy Priority; Table 3) between the originally released configuration file and the manuscript’s reported values; all results in this paper use the corrected weights, which are also the values shipped in the released code. Eighth, CS (and, by the same argument, CQ and RS) is not directly comparable in raw magnitude across datasets with different answer-space cardinalities. A model that reproduces the same answer by chance is far more likely to do so on a binary yes/no item (StrategyQA) than on an open-ended numeric item (GSM8K): under a naive uniform-random-guessing baseline, two independent samples agree with probability 0.50 for a binary answer space but approach 0 for an unconstrained numeric one. The per-dataset CS values reported in Table 7 (e.g., GPT-4o-mini: CS = 0.531 on StrategyQA vs. CS = 0.567 on GSM8K) should, therefore, be read as within-dataset comparisons across models, not as evidence that a model is equally consistent in an absolute sense across answer types; a chance-corrected variant of CS (e.g., Cohen’s κ -style adjustment for expected agreement under the answer space’s cardinality) is a natural refinement for future versions of the framework and would be required before CS scores are compared in magnitude across datasets of differing answer-space size.

6. Conclusions

This paper proposed a multi-dimensional behavioral framework that operationalizes six complementary dimensions of LLM reasoning quality in a unified and reproducible evaluation pipeline. The empirical results indicate that these dimensions form two behavioral layers rather than six equally independent axes. The outcome-oriented dimensions (Correctness, Consistency, Robustness, and Efficiency) are strongly intercorrelated because they share a canonicalized answer representation or correctness signal. Within the trace-level layer, Local Logical Coherence showed no statistically significant association with any other dimension in the evaluated sample, whereas Stability retained moderate associations with several outcome-level metrics. These findings suggest that LS provides information not directly captured by final-answer evaluation. Efficiency-weighted scenarios produced limited ranking changes when model-level efficiency differences received substantial weight.
The framework’s deployment-aware aggregation mechanism translates dimensional profiles into context-specific decision support, enabling practitioners to move beyond generic leaderboard rankings. The discriminant validity analysis provides preliminary evidence that local logical coherence contributes a non-redundant signal in the evaluated sample. The structure of the outcome-level cluster and the extent to which it generalizes across model families remain important questions for validation on domain-specific benchmarks.
RQEval is model-agnostic, requires no access to model weights, and is publicly available to support reproducibility and further development by the research community. Overall, these findings suggest that future reasoning benchmarks should distinguish between outcome-oriented and trace-oriented behavioral properties rather than relying on correctness alone.

Author Contributions

Conceptualization, A.Ş. and H.L.; methodology, A.Ş.; software, A.Ş.; validation, A.Ş., G.A. and H.L.; formal analysis, A.Ş.; investigation, A.Ş.; data curation, A.Ş.; writing—original draft preparation, A.Ş.; writing—review and editing, G.A. and H.L.; visualization, A.Ş.; and supervision, H.L. All authors have read and agreed to the published version of the manuscript.

Funding

This research received no external funding.

Institutional Review Board Statement

Not applicable.

Informed Consent Statement

Not applicable.

Data Availability Statement

The following datasets used in this study are publicly available: GSM8K [30], MMLU [31], and StrategyQA [35]. The Synthetic dataset is distributed with the framework code at https://github.com/senolali/RQEval (accessed on 23 July 2026). The framework is also available as a Python 3.13 package at https://pypi.org/project/RQEval/(accessed on 23 July 2026) and can be installed using pip install rqeval.

Acknowledgments

The authors thank Chengshuai Zhao (Arizona State University) for his valuable feedback on an earlier draft of this manuscript.

Conflicts of Interest

Author Garima Agrawal is employed by HumaConn AI Consulting Company. The remaining authors declare that the research was conducted in the absence of any commercial or financial relationships that could be construed as a potential conflict of interest.

Abbreviations

The following abbreviations are used in this manuscript:
LLMLarge Language Model
CQCorrectness Quality
CSConsistency Score
RSRobustness Score
LSLocal Logical Coherence Score
ESEfficiency Score
SSStability Score
CoTChain-of-Thought
NLINatural Language Inference
MNLIMulti-Genre Natural Language Inference
GSM8KGrade School Math 8K
MMLUMassive Multitask Language Understanding
APIApplication Programming Interface
VRAMVideo Random Access Memory
NLPNatural Language Processing

References

  1. Şenol, A.; Agrawal, G.; Liu, H. Domain Knowledge-Enhanced LLMs for Fraud and Concept Drift Detection. Electronics 2026, 15, 534. [Google Scholar] [CrossRef] [Scilit]
  2. Simon, H.A. Models of Man: Social and Rational. Mathematical Essays on Rational Human Behavior in a Social Setting; Wiley: New York, NY, USA, 1957. [Google Scholar]
  3. Stanovich, K.E. Rationality and the Reflective Mind; Oxford University Press: New York, NY, USA, 2011. [Google Scholar]
  4. Thagard, P. Coherence in Thought and Action; Life and Mind: Philosophical Issues in Biology and Psychology; MIT Press: Cambridge, MA, USA, 2000. [Google Scholar]
  5. Lieder, F.; Griffiths, T.L. Resource-Rational Analysis: Understanding Human Cognition as the Optimal Use of Limited Computational Resources. Behav. Brain Sci. 2020, 43, e1. [Google Scholar] [CrossRef] [Scilit] [PubMed]
  6. Lanham, T.; Chen, A.; Radhakrishnan, A.; Steiner, B.; Denison, C.; Hernandez, D.; Li, D.; Durmus, E.; Hubinger, E.; Kernion, J.; et al. Measuring faithfulness in chain-of-thought reasoning. arXiv 2023, arXiv:2307.13702. [Google Scholar]
  7. Barez, F.; Wu, T.-Y.; Arcuschin, I.; Lan, M.; Wang, V.; Siegel, N.; Collignon, N.; Neo, C.; Lee, I.; Paren, A.; et al. Chain-of-Thought Is Not Explainability. Preprint 2025. Available online: https://fbarez.github.io/assets/pdf/Cot_Is_Not_Explainability.pdf (accessed on 27 August 2026).
  8. Wang, X.; Wei, J.; Schuurmans, D.; Le, Q.; Chi, E.; Narang, S.; Chowdhery, A.; Zhou, D. Self-Consistency Improves Chain of Thought Reasoning in Language Models. arXiv 2023. [Google Scholar] [CrossRef] [Scilit]
  9. Turpin, M.; Michael, J.; Perez, E.; Bowman, S. Language models don’t always say what they think: Unfaithful explanations in chain-of-thought prompting. Adv. Neural Inf. Process. Syst. 2023, 36, 74952–74965. [Google Scholar] [CrossRef] [Scilit]
  10. Malberg, S.; Poletukhin, R.; Schuster, C.; Groh, G.G. A comprehensive evaluation of cognitive biases in LLMs. In Proceedings of the 5th International Conference on Natural Language Processing for Digital Humanities, Albuquerque, NM, USA, 3–4 May 2025; pp. 578–613. [Google Scholar]
  11. Anderson, J.R.; Bothell, D.; Byrne, M.D.; Douglass, S.; Lebiere, C.; Qin, Y. An Integrated Theory of the Mind. Psychol. Rev. 2004, 111, 1036–1060. [Google Scholar] [CrossRef] [Scilit] [PubMed]
  12. Evans, J.S.B.T. Hypothetical Thinking: Dual Processes in Reasoning and Judgement; Essays in Cognitive Psychology; Psychology Press: Hove, UK, 2007. [Google Scholar]
  13. Kahneman, D.; Tversky, A. Prospect Theory: An Analysis of Decision under Risk. Econometrica 1979, 47, 263–292. [Google Scholar] [CrossRef] [Scilit]
  14. Gigerenzer, G.; Selten, R. Bounded Rationality: The Adaptive Toolbox; MIT Press: Cambridge, MA, USA, 2001. [Google Scholar]
  15. Binz, M.; Akata, E.; Bethge, M.; Brändle, F.; Callaway, F.; Coda-Forno, J.; Dayan, P.; Demircan, C.; Eckstein, M.K.; Éltető, N.; et al. A foundation model to predict and capture human cognition. Nature 2025, 644, 1002–1009. [Google Scholar] [CrossRef] [Scilit] [PubMed]
  16. Bordalo, P.; Gennaioli, N.; Lanzani, G.; Shleifer, A. A Cognitive Theory of Reasoning and Choice; Working Paper No. 33466; National Bureau of Economic Research: Cambridge, MA, USA, 2025. [Google Scholar] [CrossRef] [Scilit]
  17. Wei, J.; Wang, X.; Schuurmans, D.; Bosma, M.; Xia, F.; Chi, E.; Le, Q.V.; Zhou, D. Chain-of-thought prompting elicits reasoning in large language models. Adv. Neural Inf. Process. Syst. 2022, 35, 24824–24837. [Google Scholar] [CrossRef] [Scilit]
  18. Kojima, T.; Gu, S.S.; Reid, M.; Matsuo, Y.; Iwasawa, Y. Large language models are zero-shot reasoners. Adv. Neural Inf. Process. Syst. 2022, 35, 22199–22213. [Google Scholar] [CrossRef] [Scilit]
  19. Paul, D.; West, R.; Bosselut, A.; Faltings, B. Making reasoning matter: Measuring and improving faithfulness of chain-of-thought reasoning. arXiv 2024, arXiv:2402.13950. [Google Scholar]
  20. Zhao, C.; Tan, Z.; Ma, P.; Li, D.; Jiang, B.; Wang, Y.; Yang, Y.; Liu, H. Is Chain-of-Thought Reasoning of LLMs a Mirage? A Data Distribution Lens. In Findings of the Association for Computational Linguistics: ACL 2026; Liakata, M., Moreira, V.P., Zhang, J., Jurgens, D., Eds.; Association for Computational Linguistics: San Diego, CA, USA, 2026; pp. 15231–15261. [Google Scholar] [CrossRef] [Scilit]
  21. Kumar, P.; Mishra, S. Robustness in Large Language Models: A Survey of Mitigation Strategies and Evaluation Metrics. arXiv 2025, arXiv:2505.18658. [Google Scholar]
  22. Singh, A.; Singh, N.; Vatsal, S. Robustness of llms to perturbations in text. arXiv 2024, arXiv:2407.08989. [Google Scholar]
  23. Bogavelli, T.; Bamgbose, O.; Melançon, G.G.; Riols, F.; Sharma, R. Evaluating Robustness of Large Language Models in Enterprise Applications: Benchmarks for Perturbation Consistency Across Formats and Languages. arXiv 2026, arXiv:2601.06341. [Google Scholar]
  24. Liu, J.; Liu, H.; Xiao, L.; Wang, Z.; Liu, K.; Gao, S.; Zhang, W.; Zhang, S.; Chen, K. Are Your LLMs Capable of Stable Reasoning? In Findings of the Association for Computational Linguistics: ACL 2025; Association for Computational Linguistics: Vienna, Austria, 2025; pp. 17594–17632. [Google Scholar]
  25. Mondorf, P.; Plank, B. Beyond accuracy: Evaluating the reasoning behavior of large Language models–A survey. arXiv 2024, arXiv:2404.01869. [Google Scholar]
  26. Wan, Y.; Wang, W.; Yang, Y.; Yuan, Y.; Huang, J.T.; He, P.; Jiao, W.; Lyu, M. LogicAsker: Evaluating and Improving the Logical Reasoning Ability of Large Language Models. In Proceedings of the 2024 Conference on Empirical Methods in Natural Language Processing; Al-Onaizan, Y., Bansal, M., Chen, Y.N., Eds.; Association for Computational Linguistics: Miami, FL, USA, 2024; pp. 2124–2155. [Google Scholar] [CrossRef] [Scilit]
  27. Lyu, Q.; Havaldar, S.; Stein, A.; Zhang, L.; Rao, D.; Wong, E.; Apidianaki, M.; Callison-Burch, C. Faithful chain-of-thought reasoning. In Proceedings of the 13th International Joint Conference on Natural Language Processing and the 3rd Conference of the Asia-Pacific Chapter of the Association for Computational Linguistics (Volume 1: Long Papers); Association for Computational Linguistics: San Diego, CA, USA, 2023; pp. 305–329. [Google Scholar]
  28. Yang, S.; Chiang, W.L.; Zheng, L.; Gonzalez, J.E.; Stoica, I. Rethinking benchmark and contamination for language models with rephrased samples. arXiv 2023, arXiv:2311.04850. [Google Scholar]
  29. Becerra-Monsalve, L.F.; Sanchez-Torres, G.; Branch-Bedoya, J.W. Multi-Dimensional Evaluation of Auto-Generated Chain-of-Thought Traces in Reasoning Models. AI 2026, 7, 35. [Google Scholar] [CrossRef] [Scilit]
  30. Cobbe, K.; Kosaraju, V.; Bavarian, M.; Chen, M.; Jun, H.; Kaiser, L.; Plappert, M.; Tworek, J.; Hilton, J.; Nakano, R.; et al. Training Verifiers to Solve Math Word Problems. arXiv 2021. [Google Scholar] [CrossRef] [Scilit]
  31. Hendrycks, D.; Burns, C.; Basart, S.; Zou, A.; Mazeika, M.; Song, D.; Steinhardt, J. Measuring Massive Multitask Language Understanding. In Proceedings of the International Conference on Learning Representations (ICLR), Virtual, 3–7 May 2021. [Google Scholar]
  32. Liang, P.; Bommasani, R.; Lee, T.; Tsipras, D.; Soylu, D.; Yasunaga, M.; Zhang, Y.; Narayanan, D.; Wu, Y.; Kumar, A.; et al. Holistic Evaluation of Language Models. arXiv 2023, arXiv:2211.09110. [Google Scholar]
  33. Anderson, J.R. The Adaptive Character of Thought; Lawrence Erlbaum Associates: Hillsdale, NJ, USA, 1990. [Google Scholar]
  34. Oaksford, M.; Chater, N. Bayesian Rationality: The Probabilistic Approach to Human Reasoning; Oxford Cognitive Science Series; Oxford University Press: Oxford, UK, 2007. [Google Scholar]
  35. Geva, M.; Khashabi, D.; Segal, E.; Khot, T.; Roth, D.; Berant, J. Did Aristotle Use a Laptop? A Question Answering Benchmark with Implicit Reasoning Strategies. Trans. Assoc. Comput. Linguist. 2021, 9, 346–361. [Google Scholar] [CrossRef] [Scilit]
Figure 1. Conceptual overview of the six reasoning-quality dimensions: Correctness (CQ), Consistency (CS), Robustness (RS), Local Logical Coherence (LS), Efficiency (ES), and Stability (SS).
Bdcc 10 00300 g001
Figure 2. Comparative scores for the six reasoning-quality dimensions across seven models, pooled over 975 items from four datasets. All scores range from 0 to 1, with higher values indicating better performance. CQ = Correctness; CS = Consistency; RS = Robustness; LS = Local Logical Coherence; ES = Efficiency; and SS = Stability.
Bdcc 10 00300 g002
Figure 3. Radar plot of overall reasoning quality across the six dimensions. Claude-Haiku-4.5 has the highest balanced aggregate score, whereas DeepSeek-V3’s LS score is comparatively lower than its CQ, CS, and RS scores. All axes range from 0 to 1, with higher values indicating better performance.
Bdcc 10 00300 g003
Figure 4. Discriminant validity visualization. (Left) Pearson correlation heatmap ( n = 28 ). (Right) Categorical classification of dimension pairs. Structural correlations are highlighted separately to distinguish them from problematic metric overlap.
Bdcc 10 00300 g004
Figure 5. Empirical organization of the proposed reasoning dimensions. Outcome-oriented metrics (CQ, CS, RS, and ES) are measured from canonicalized final answers and are, consequently, empirically intercorrelated ( r = 0.57 0.93 ). Trace-oriented metrics (LS and SS) are measured from reasoning traces: LS shows no statistically significant association with the outcome metrics, whereas SS retains moderate associations with several of them; LS and SS are not significantly correlated with each other. The blue panel denotes the outcome-oriented layer, and the green panel denotes the trace-oriented layer. The two panels summarize the empirical organization of the measured reasoning dimensions, not a causal or temporal relationship.
Bdcc 10 00300 g005
Table 1. Comparison of prior work against the proposed framework. ✔ = explicitly measured and × = not addressed.
StudyCQCSRSLSESSS
Wang et al. [8]××××
Kumar & Mishra [21]××××
Singh et al. [22]××××
Bogavelli et al. [23]××××
Liu et al. [24]×××
Mondorf & Plank [25]×××××
Becerra-Monsalve et al. [29]×××××
Lanham et al. [6]××××
Lyu et al. [27]×××××
Liang et al. [32] (HELM)×××
RQEval (This work)
Table 2. Notation used in metric definitions.
SymbolDefinition
NNumber of evaluation items in the dataset
y i Gold (ground-truth) answer for item i
y ^ i Model’s predicted answer for item i, extracted from the raw generation by the multi-strategy matching pipeline
I ( · ) Indicator function: 1 if the condition holds, 0 otherwise
KNumber of independent generations per item ( K = 3 ), sampled at temperature = 0.7
y ^ i ( k ) Model’s answer for item i on the k-th independent run
PNumber of semantic-preserving perturbations per item ( P = 3 )
y ^ i ( p ) Model’s answer to the p-th perturbed version of item i
CSet of items answered correctly on the unperturbed input: C = { i : y ^ i = y i }
s j The j-th reasoning step (sentence) in a generated trace
n i Number of reasoning steps in the trace for item i
ψ ( s j , s j + 1 ) Binary NLI contradiction indicator between consecutive steps s j and s j + 1 (1 if the NLI classifier’s top label is contradiction, 0 otherwise)
t i Number of output tokens generated for item i
T i Min–max normalized token count over the evaluated set, T i = ( t i t min ) / ( t max t min ) , where t min and t max are the minimum and maximum observed token counts in the current evaluation run
r i ( k ) Full reasoning trace for item i on run k
Table 3. Weight vectors for evaluation scenarios. All weights sum to 1.0.
ScenarioCQCSRSLSESSS
Balanced1/61/61/61/61/61/6
Safety Priority0.300.050.300.250.050.05
Accuracy Priority0.500.100.150.150.050.05
Efficiency Priority0.200.150.150.100.300.10
Medical Triage0.400.050.300.200.030.02
Legal/Compliance0.150.250.200.350.030.02
Edge Device/IoT0.300.030.100.050.500.02
Table 4. Evaluated models. Local models were loaded from the Hugging Face Hub.
ModelProviderTypeParamsAccessQuant.Device
GPT-4o-miniOpenAIClosedUndisclosedAPI (ASU CreateAI)N/ARemote
Claude-Haiku-4.5AnthropicClosedUndisclosedAPI (ASU CreateAI)N/ARemote
DeepSeek-V3DeepSeek AIClosedUndisclosedAPI (direct)N/ARemote
Gemini-2.5-FlashGoogleClosedUndisclosedAPI (ASU CreateAI)N/ARemote
LLaMA-3.1-70BMetaOpen70BAPI (ASU CreateAI)N/ARemote
Qwen2.5-1.5BAlibabaOpen1.5BHugging Face4-bit (NF4)Local GPU
Phi-2MicrosoftOpen2.7BHugging Facefloat16Local GPU
Table 5. Representative items from the Synthetic dataset.
TypeExample ItemTarget Dim.
Arithmetic“A train travels 60 km/h for 2.5 h. How far does it travel?”CQ, ES
Adversarial“All mammals are warm-blooded. Whales are fish. Are whales warm-blooded?” (deliberate contradiction in premise)RS, CS
Robustness probe“What is 144 divided by 12?”/“How much is 144 over 12?”/“Divide one hundred and forty-four by twelve.”RS
Table 6. Overall reasoning quality scores across all 975 items, computed under the corrected canonical-answer-extraction protocol (Section 3.4). Q bal = balanced aggregate; Q saf = safety-priority; Q acc = accuracy-priority; and Q eff = efficiency-priority. All scores range from 0 to 1, with higher values indicating better performance. The highest value in each column is shown in bold.
ModelCQCSRSLSESSS Q bal Q saf Q acc Q eff
GPT-4o-mini0.6000.6460.8770.8110.4650.9300.7220.7480.6880.662
Claude-Haiku-4.50.7830.7810.8950.8360.6430.9100.8080.8290.8070.775
DeepSeek-V30.7190.7400.9270.7590.5400.9110.7660.7930.7590.723
Gemini-2.5-Flash0.6740.6790.9140.7820.5820.9060.7560.7800.7340.717
LLaMA-3.1-70B0.6360.6190.8650.8380.4860.8930.7230.7600.7040.669
Qwen2.5-1.5B0.4680.5430.7930.8260.3280.8760.6390.6720.5910.562
Phi-20.4260.4900.6090.8600.3950.8230.6010.6110.5430.537
Table 7. Per-dataset breakdown for all seven evaluated models, computed under the corrected canonical-answer-extraction protocol.
ModelDatasetCQCSRSLSESSS Q bal
GPT-4o-miniGSM8K0.5520.5670.8040.6700.3430.9310.645
GPT-4o-miniMMLU0.5640.6700.9370.7070.4970.9510.721
GPT-4o-miniStrategyQA0.4800.5310.9080.9270.3820.8910.687
GPT-4o-miniSynthetic0.8000.8170.8680.9300.6620.9510.838
Claude-Haiku-4.5GSM8K0.8800.9010.9330.8650.7380.9510.878
Claude-Haiku-4.5MMLU0.9240.9380.9460.7030.7060.9030.854
Claude-Haiku-4.5StrategyQA0.6240.6230.8970.8710.4160.8650.716
Claude-Haiku-4.5Synthetic0.7160.6760.7490.8910.5530.9210.751
DeepSeek-V3GSM8K0.9040.9240.9750.6800.6940.9270.851
DeepSeek-V3MMLU0.6360.6280.9320.6680.5540.9330.725
DeepSeek-V3StrategyQA0.6240.6600.8440.8220.2840.8650.683
DeepSeek-V3Synthetic0.7040.7360.9350.8590.6350.9210.798
Gemini-2.5-FlashGSM8K0.8120.8610.9510.6720.6220.9480.811
Gemini-2.5-FlashMMLU0.4490.4030.8450.7410.3760.8760.615
Gemini-2.5-FlashStrategyQA0.7040.7400.9410.8130.6060.8660.778
Gemini-2.5-FlashSynthetic0.7080.6830.8800.8980.6550.9300.792
LLaMA-3.1-70BGSM8K0.8440.8120.8720.7210.6470.9130.802
LLaMA-3.1-70BMMLU0.6710.6900.9030.8010.5530.8680.748
LLaMA-3.1-70BStrategyQA0.3680.2870.7830.8910.2200.8580.568
LLaMA-3.1-70BSynthetic0.6640.6950.8680.9350.5260.9290.769
Qwen2.5-1.5BGSM8K0.3440.3120.7130.7130.1950.9060.530
Qwen2.5-1.5BMMLU0.3820.5390.8760.8520.3610.8920.651
Qwen2.5-1.5BStrategyQA0.4320.6470.8240.9010.2710.8170.649
Qwen2.5-1.5BSynthetic0.7040.6720.7670.8400.4820.8900.726
Phi-2GSM8K0.2400.2610.5720.7620.2010.8680.484
Phi-2MMLU0.2840.4550.5780.7550.2550.7580.514
Phi-2StrategyQA0.5240.6490.6340.9740.4790.8310.682
Phi-2Synthetic0.6400.5910.6180.9360.5780.8310.699
Table 8. Model rankings under all seven evaluation scenarios. Claude-Haiku-4.5 ranks first and DeepSeek-V3 second in every scenario except Edge Device/IoT. Rankings are descriptive; small score differences should not be interpreted as statistically reliable because formal between-model significance tests were not conducted.
Scenario#1#2#3#4#5#6#7
BalancedClaudeDeepSeekGeminiLLaMAGPTQwenPhi-2
Safety PriorityClaudeDeepSeekGeminiLLaMAGPTQwenPhi-2
Accuracy PriorityClaudeDeepSeekGeminiLLaMAGPTQwenPhi-2
Efficiency PriorityClaudeDeepSeekGeminiLLaMAGPTQwenPhi-2
Medical TriageClaudeDeepSeekGeminiLLaMAGPTQwenPhi-2
Legal/ComplianceClaudeDeepSeekGeminiLLaMAGPTQwenPhi-2
Edge Device/IoTClaudeGeminiDeepSeekLLaMAGPTPhi-2Qwen
Table 9. Pearson correlations between all 15 dimension pairs ( n = 28 ), recomputed under the corrected canonical-answer-extraction protocol. *** p < 0.001, ** p < 0.01, * p < 0.05, and ns = not significant. ✔ = negligible and not statistically significant; ∼ = weak; ! = moderate or higher; and Δ = structural (definitional or shared-pipeline).
PairrpSig.95% CIInterpretation
CQ–CS + 0.928 <0.001 [ + 0.864 , + 0.972 ] Δ Shared extraction pipeline
CQ–RS + 0.627 <0.001 [ + 0.321 , + 0.815 ] Δ Structural (definitional)
CQ–LS 0.083 0.676 ns [ 0.435 , + 0.291 ] ✔ Negligible; no significant association
CQ–ES + 0.917 <0.001 [ + 0.832 , + 0.964 ] Δ Structural (definitional)
CQ–SS + 0.573 0.001 [ + 0.320 , + 0.754 ] ! Moderate
CS–RS + 0.634 <0.001 [ + 0.400 , + 0.805 ] ! Moderate (CQ-mediated)
CS–LS 0.054 0.785 ns [ 0.413 , + 0.324 ] ✔ Negligible; no significant association
CS–ES + 0.874 <0.001 [ + 0.744 , + 0.956 ] ! Moderate–high (CQ-mediated)
CS–SS + 0.458 0.014 * [ + 0.242 , + 0.645 ] ∼ Weak
RS–LS 0.229 0.241 ns [ 0.586 , + 0.157 ] ∼ Weak
RS–ES + 0.566 0.002 [ + 0.269 , + 0.778 ] ! Moderate (CQ-mediated)
RS–SS + 0.637 <0.001 [ + 0.321 , + 0.821 ] ! Moderate
LS–ES + 0.001 0.995 ns [ 0.336 , + 0.360 ] ✔ Negligible; no significant association
LS–SS 0.262 0.178 ns [ 0.638 , + 0.119 ] ∼ Weak
ES–SS + 0.548 0.003 [ + 0.278 , + 0.750 ] ! Moderate
Disclaimer/Publisher’s Note: The statements, opinions and data contained in all publications are solely those of the individual author(s) and contributor(s) and not of MDPI and/or the editor(s). MDPI and/or the editor(s) disclaim responsibility for any injury to people or property resulting from any ideas, methods, instructions or products referred to in the content.