1. Introduction
The service life of today’s turbochargers is limited, among other things, by the mechanical load caused by blade vibrations. The occurrence of blade vibrations in radial turbines leads to limited cycle oscillations, which, in time, increase the risk of component failure due to high cycle fatigue. Consequently, the precise determination of the resonance operating points and the estimation of the vibration magnitudes are crucial for an accurate assessment of the service life of the impeller.
Synchronous blade vibrations are primarily induced by the non-uniform flow field in the circumferential direction, which acts on the blades as a periodic pressure fluctuation. Characterized by their frequency, these vibrations align with integer multiples of the rotational frequency, known as engine orders (EO). The previous studies have identified wake vortices and the potential excitation through the stationary guide vanes [
1,
2,
3,
4], as well as the non-uniformity of the flow field due to the geometry of the spiral housing [
5,
6,
7], as the primary excitation sources.
The primary EO excitation equals the number of vanes. However, low engine order (LEO) excitations can occur due to the asymmetrical spiral volute, as indicated by Netzhammer et al. [
7]. Furthermore, through the superposition of the flow distortions caused by the spiral housing and the inlet guide vane (IGV), additional EOs may occur. Additionally, the effect of a mistuned IGV must be considered. Breard et al. [
8] identified the non-uniform vane spacing, the flow exit angle variations and the axial gap changes between blades and vanes as the most significant excitation sources for the occurrence of LEO. Moreover, Kovachev et al. [
9] demonstrated that manufacturing tolerances result in a non-uniform spacing of the vanes, which can induce a LEO excitation pattern according to the Fourier decomposition of the deviation from the mean throat width.
Synchronous vibrations arise when the periodic excitation frequency
matches the natural frequency of the blades
Equation (
1), the excitation of the blades is phase correct, and the unsteady pressure field acting on the blade surface matches the vibration shape of the vibration mode to be excited [
10].
To determine whether the excitation of the blades is phase correct, the difference between the phase of the blade vibrations must be considered. The difference between the vibration phase of two neighboring blades,
, is called “Inter Blade Phase Angle” (IBPA) and determines the nodal diameter (ND) of a vibration. Equation (
2) depicts this relation, where
is the number of blades.
Considering the relation between the
ND and the IBPA, Wilson and Utengen [
11] summarized this resonance criterion through Equation (
3). Thus, the
ND of a synchronous vibration is determined by the
EO and the number of impeller blades.
The occurring vibrations are influenced by the machine operation. The well-documented effects of “stress stiffening” and “spin softening” [
12,
13,
14] clarify the dependency of the impeller’s natural frequencies on the prevailing operating conditions. Thus, a deviation exists between the natural frequencies measured in standstill tests and during real operation. This deviation can be estimated numerically using finite element models (FEM), which account for the static stress distribution.
The total vibration damping consists of the structural (material damping, rotor bearing damping, friction damping—if present) as well as the aerodynamic damping. In blisk impellers, the structural damping primarily consists of the material damping, as due to the integral design, there is no possibility of using friction effects to dampen blade vibrations. As a result, radial impellers have damping values in the range of
–
[
6], which are at least an order of magnitude lower than in axial impellers.
Another aspect that significantly influences the vibration magnitudes is the impeller mistuning. Mistuning appears due to the structural differences between the blades, which violates the rotational periodicity of the impeller. Manufacturing tolerances, material inhomogeneities and uneven wear of the blades during operation are the main causing factors. Remarkably, mistuning can be increased disproportionately for blisk impellers as a result of the structural coupling of blade and disk [
15]. This rotor asymmetry leads to localized dissipation of the vibration energy and significant amplitude overshoots [
16,
17,
18,
19]. This drastic increase in forced vibrations is accompanied by a reduction in service life.
Since the most heavily stressed part of a component must be considered for an assessment of the service life, it is essential to take into account the effect of mistuning in a vibration analysis. However, as different specimens of the components have different mistuning, a deterministic consideration of a specific state of mistuning is of little practical use. Moreover, the significant computational effort needed for a numerical estimation of the vibration amplitudes makes the consideration of mistuning impractical and extremely time and cost consuming. Therefore, the determination of the exact resonance operating points and the vibration magnitudes can only be performed experimentally. Consequently, an evaluation of the amplitude overshoots can be delivered by probabilistic analyses, which utilize the recorded forced response of an impeller with regard to damping and mistuning.
This manuscript is an extended version of the conference papers GT2023-103037 [
20] & GT2023-102243 [
21] published in the proceedings of the ASME Turbo Expo 2023: Turbomachinery Technical Conference and Exposition.
2. Experimental Setup
2.1. Test Bench
At the Institute for Power Plant Technology, Steam and Gas Turbines, a test bench for exhaust gas turbochargers was built [
22] with a turbine inlet temperature of up to 220 °C. This test bench has been upgraded for higher temperatures. In contrast to the often-used closed-loop design, this test bench is operated in open configuration. The compressor and turbine are not coupled flow-wise. Particularly for vibration measurements, this has the advantage that no oscillating flows interact between compressor and turbine.
To drive the turbocharger turbine, the compressed air is provided by a six-stage radial supply compressor. It can output up to 12 kg/s of air at 30 bara. The supplied air has a temperature between 150 °C and 180 °C. A natural gas-fired heat exchanger allows continuous regulation of inlet temperature of the turbine up to 500 °C without contaminating the air.
The turbine inlet air can be controlled via a series of valves, which are shown in an illustration of the test bench in
Figure 1. First, a portion of the air can be discharged to the ambient through a bypass valve (
BPI) located at the outlet of the supply compressor. A downstream gate valve (
CV1) controls the back pressure of the supply compressor. These two valves determine the operating point of the supply compressor and are not changed during the vibration measurements. Thus, the operating point remains constant and provides stable test conditions.
Two additional valves are available for controlling the turbine of the turbocharger: another bypass valve (BPII), which guides part of the air to the chimney, and a ball valve (CVII) for the regulation of the inlet turbine pressure. BPII has proven to be the most effective for setting the speed ramps for the vibration measurements.
The turbocharger compressor can also be used to influence the operating point of the turbine. A throttle valve (Throttle) downstream from the compressor provides a higher back pressure. Therefore, the mass flow is reduced. Although throttling increases the specific enthalpy of the turbocharger compressor, the impact of mass flow reduction is greater, thus decreasing the power consumption of the compressor. Since the inlet conditions of the turbine do not change, the converted power remains the same. As a result, the turbocharger begins to accelerate until a power equilibrium is achieved. The mass flow of the turbine is measured at the inlet between the BPII and the CVII valve.
At last, the inlet conditions of the compressor can be adjusted. The inlet of the compressor is divided into two sections, both equipped with a gate valve. By completely or partially closing one or both valves, a pressure decrease is generated at the intake of the compressor below the ambient pressure. This can simulate an air filter, which is commonly used in real operation. In both sections the mass flow is measured.
Throughout all measurements, the pressure and temperature at the inlet and outlet planes, as well as the mass flow of the turbine and compressor, are recorded every second. This allows the operating point of the exhaust gas turbocharger to be determined. The static pressure is sampled via three bores distributed symmetrically around the circumference. The three holes are interconnected so that the pressure is averaged over the circumference. For the temperature measurements, three thermocouples symmetrically distributed around the circumference are also placed in each plane. These measure neither the static nor the total temperature and must therefore be converted to a static value via a recovery factor [
23]. A turbulent flow is assumed in all measuring planes. The Mach number is calculated from the measured mass flow, the static temperature and the dimensions of the measuring planes. This can then be used to convert the static values into total values.
2.2. Test Article
The exhaust gas turbocharger utilized in the experiments has been supplied by Kompressorenbau Bannewitz GmbH (KBB) and is commonly employed in marine applications. During operation, the turbine inlet temperature can reach up to 650 °C. In test operation, however, the temperature of the supplied air is constrained to 500 °C. At the maximum speed of approx. 40,000 RPM, around 4.5 kg/s are flowing through the turbine. Conversely, the turbocharger compressor achieves a maximum mass flow of approx. 4 kg/s with a pressure ratio of up to 6. These properties of the turbocharger are presented in
Table 1.
The turbocharger turbine has already been investigated numerically and experimentally in the previous studies [
3,
9,
22,
24,
25]. The turbine impeller has 12 blades and was cast from an Inconel material. The related tolerances lead to asymmetric blade spacing as well as inhomogeneous blade thicknesses, resulting in a natural mistuning. The IGV is manufactured as a ring and inserted into the turbocharger. This allows the investigations of various IGV configurations, which generate different EO excitations. Hence, the impeller modes can be excited at different speeds and nodal diameters. The nominal IGV (SD24) has 24 symmetrically distributed vanes and is derived from the original design of KBB. In this study, the vibration characteristics of two additional IGV configurations, which generate different excitations, are investigated and compared with SD24.
Upstream of the IGV, there is a single channel volute with an inlet duct opening of approx. 165 mm. Finally, the turbocharger’s compressor consists of an impeller with 9 blades and 9 splitter blades, as well as a diffuser with 17 blades.
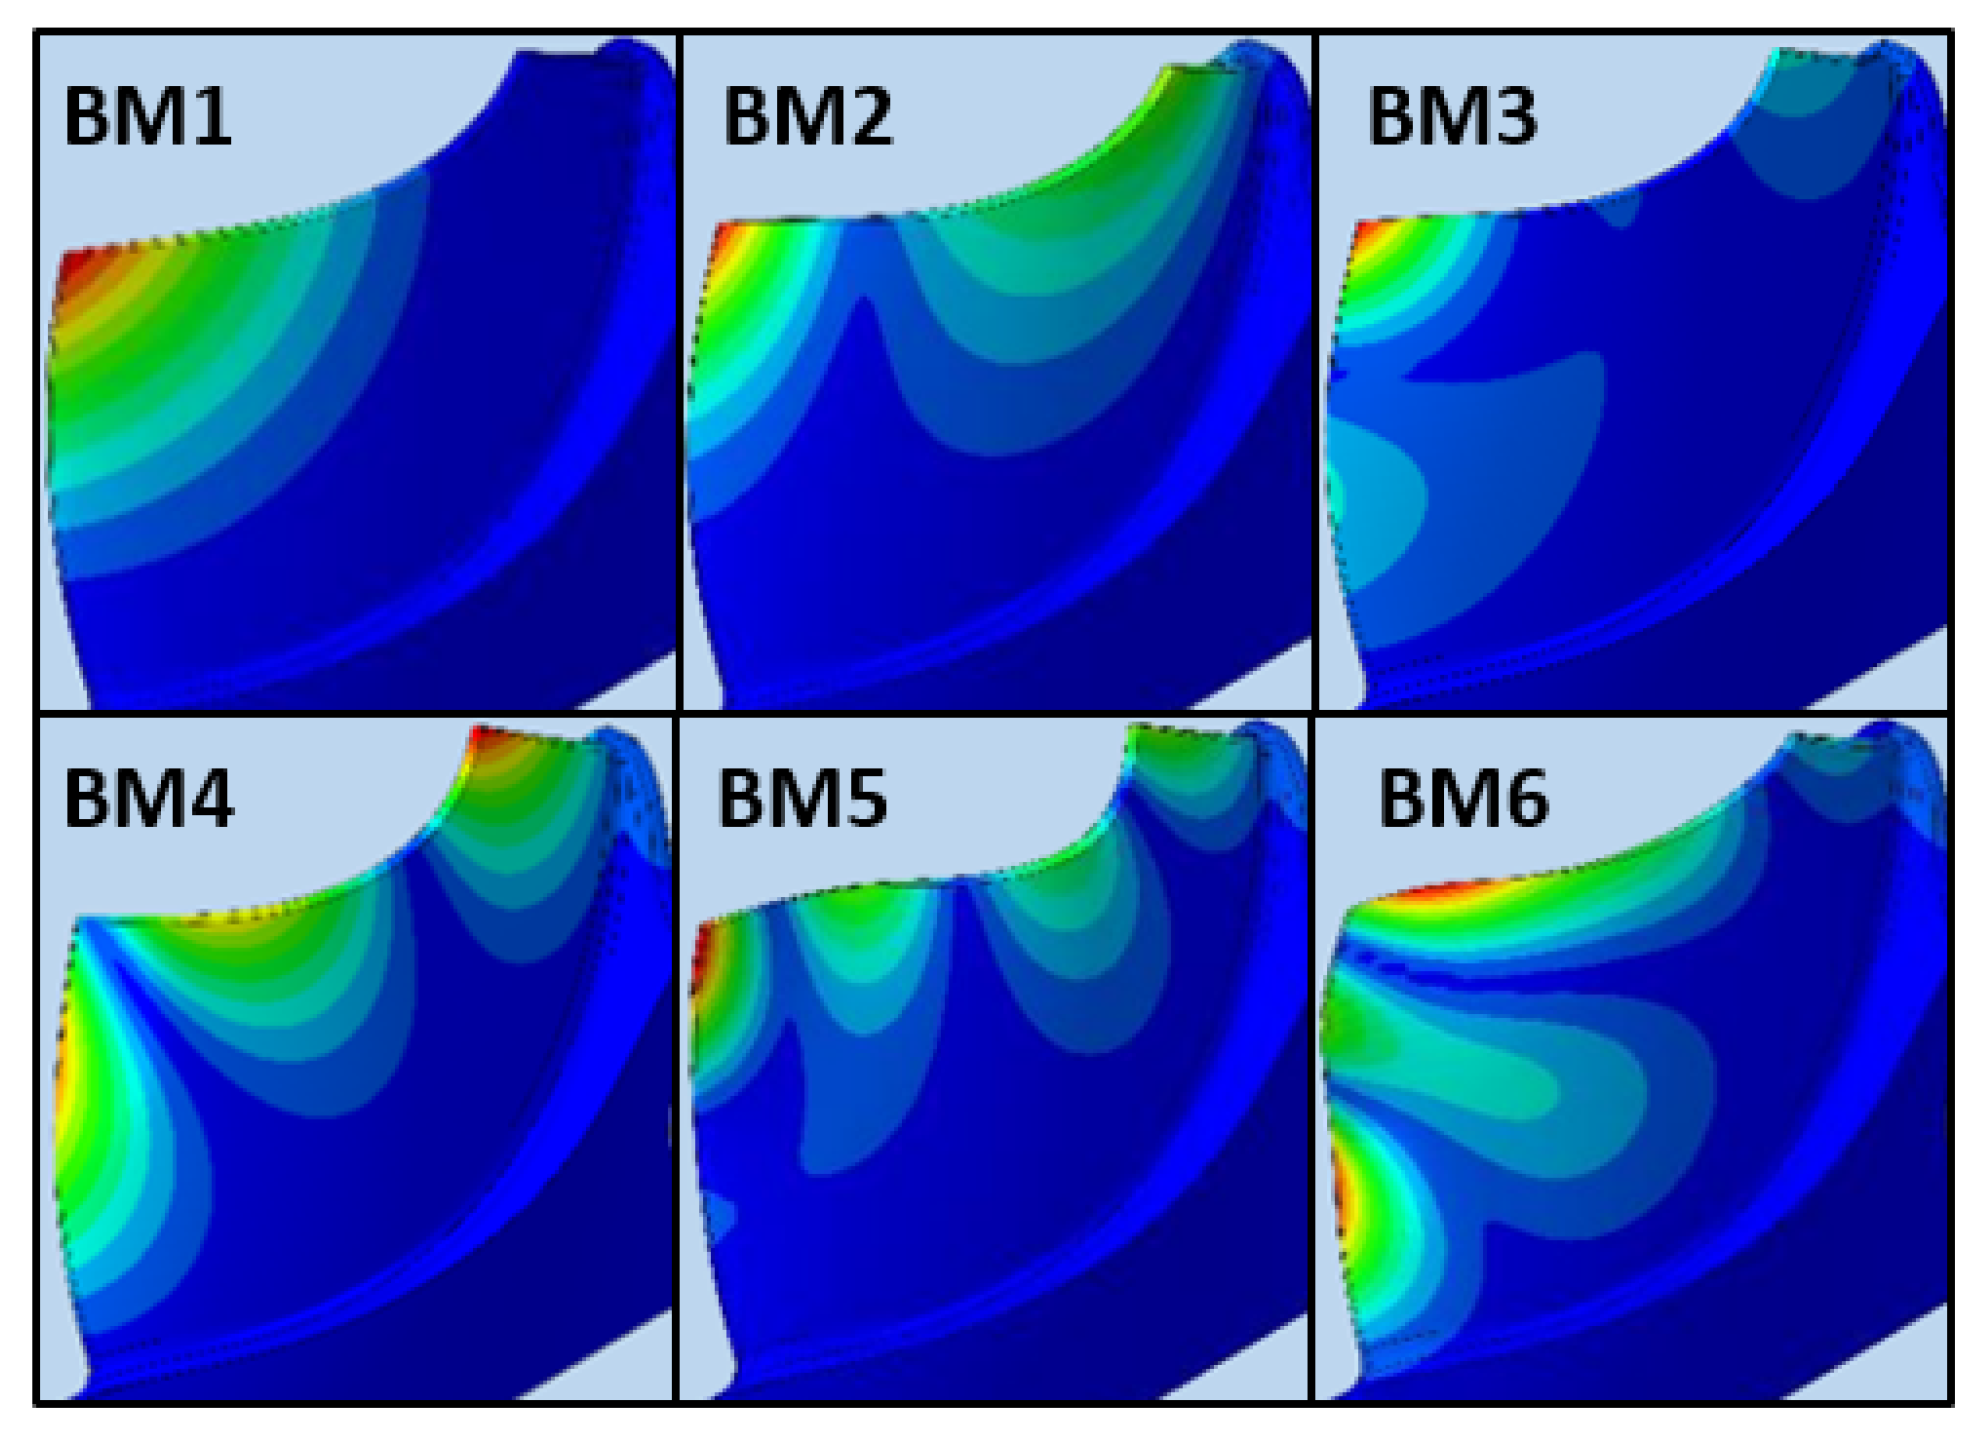
The impeller’s natural frequencies were determined experimentally and numerically. First, a laser vibrometer measured the natural frequencies of the turbine impeller in stand still tests, which were performed at BTU Cottbus. Since the laser vibrometer measures deflection at a single point, a detailed examination of the exact mode shapes was carried out through numerical calculations. These numerical simulations utilized an FEM sector model and were carried out at ITSM Stuttgart [
25]. From the numerically determined vibration shapes, the modes are classified in blade modes (BM), which are primarily expressed on the blades, and mixed modes (MM), whose vibration requires the whole rotor participation including disk, hub and shaft. Moreover, modes of the same vibration shape but different nodal diameter are summed up in a blade mode family (BMF).
When a vibration is primarily expressed at the blade, the vibration energy is predominately dissipated in a relatively small area: the blades and the blade root. Thus, such vibrations induce high stress, which, over time, cause significant fatigue on the impeller. Hence, for the assessment of the impeller service life, the modes, which are primarily expressed on the blades, are the most important to be considered. In this context, BM1-6 are the focus of the present vibration investigation. Additionally, MM11 and MM15 are also observed, as their mode shape exhibits the highest deflections on the blade.
Table 2 provides the experimentally and numerically determined natural frequencies of ND0 for these modes, while
Figure 2 presents the mode shapes of BM1-6.
For an estimation of the natural frequencies during real operation, it is necessary to account the influence of the temperature and the rotational speed. For the temperature, the Young’s modulus was adjusted according to the mean blade temperature of the investigated operating point, which was acquired through steady state CFD calculations. For the centrifugal force caused by the rotational speed, a “prestressed” modal analysis was performed using ANSYS APDL. Due to these effects, differences occur between the experimentally and numerically determined natural frequencies presented in
Table 2. Furthermore, these differences are increased due to the mistuning of the rotor and the reduced FEM model, which is solely composed of the impeller.
2.3. Inlet Guide Vanes
Normally, the IGV consists of two rings in which the vanes are pinned between and then welded together. However, this modular manufacturing method is accompanied with large manufacturing tolerances. To achieve lower tolerances and thus avoid unintended excitation due to a mistuned IGV, the IGV was milled from a solid metal block.
The nominal IGV, SD24, consists of 24 symmetrically distributed vanes. Thus, this IGV primarily generates EO24/ND0 vibrations Equation (
3). BM1 and BM6 cannot be measured with IGV SD24. BM1 is excited at a low speed, where no measurable vibration amplitudes occur. In contrast, the excitation speed of BM6 lies above the operating envelope of the turbine.
To measure BM1 and simultaneously assess the impact of LEO vibrations, an intentionally mistuned IGV was employed. For this purpose, Zobel [
25] designed an IGV that generates an EO10 excitation despite having 24 vanes. By rotating the vanes around the trailing edges and thus reducing or enlarging the area between them without changing the total throat area, an additional harmonic component is added in the pressure field acting on the blades. In this aspect, the mean throat width is superimposed by a sinusoidal oscillation according to Equation (
4) [
25].
Here,
is the mean throat area,
symbolizes the circumferential position, while
d signifies the maximum allowed deviation, which was set to
.
Figure 3 illustrates the change in throat area over the circumferential position according to Equation (
4). Using this curve, the throat area can be determined at the 24 vane positions. These values are depicted with red dots. After production, the IGV was measured to check whether the targets were met. The results of the measurement are marked with green crosses. No considerable deviation between the targeted and manufactured vane positions can be observed.
The mistuned IGV has been numerically validated. By applying the non-linear-harmonic (NLH) method, the pressure acting on the blade was calculated [
25]. By performing a Fourier transformation on the averaged pressure acting on the blade surface for one revolution, the excitation frequencies were determined. Zobel [
25] has shown that the mistuned IGV primarily excites three EOs, an EO24, an EO10 and an EO14. Indeed, at the resonance crossing of BM1/ND2, the EO10 component of the normalized harmonic pressure is
of the EO24 component. Since the mistuned IGV generates LEO excitation of EO10, it is referred as LEO10.
To investigate BM6 and ND6 vibrations, an IGV with 30 vanes named DRH30 was manufactured. This IGV can primarily generate an EO30 excitation that can induce vibrations in ND6 Equation (
3)). To not change the characteristics of the turbine, the total throat area of DHR30 must remain the same as the area of SD24. Hence, the vanes are thinner.
2.4. Determination of Speed Ranges and Speed Ramps
The speed ranges to be measured have been defined from the intersection of the primarily induced EO with the frequencies of the impeller modes. These are given in
Table 2 for each IGV.
To avoid exposing the rotor to high stress for long time periods, the tests are performed by sweeping through the resonance. An additional reason for employing the sweeping method is the mistuning of the impeller. Due to mistuning, a deviation between the natural frequencies of the blades arises. As a result, multiple resonance occurrences are observed in a speed range around the expected excitation speed. Because of mistuning and the reduced FEM model, the natural frequencies deviate in real operation from the numerical estimations. For this reason, the speed ranges are extended at least by ±1000 RPM from the expected resonance speed.
By initial tests, it was determined that the bypass valve in front of the turbine was most suitable for setting the speed ramps. The valve runs a speed ramp automatically after the start and end points, as well as the ramp duration, have been defined. This automation leads to the best possible repeatability. This allows a reliable comparison between the results of each ramp, since major changes in the speed gradient can lead to significant deviations in the amplitude and damping values. The ramps are repeated at least three times for decreasing and increasing speed.
As soon as a maximum speed gradient
is exceeded, a weakening influence on the amplitude and a higher estimation of the damping is observed [
26]. The maximum change in excitation frequency, which does not influence the vibration characteristics, can be determined through Equation (
5). This depends on the resonant frequency
, as well as on the damping ratio
.
To estimate the maximum allowable speed gradient before the experiment, the aerodynamic damping was used. This was calculated numerically for each mode through the method described by Buchwald et al. [
27] at ITSM Stuttgart. For the maximum allowable change in the rotational speed, the vibration
EO must be considered according to Equation (
6).
After the experiments, the measured damping is used to verify the speed gradients. A comparison between the numerically predicted and experimentally determined damping is presented in the results section. Since the numerically determined damping accounts only for the aerodynamic part, the damping is underestimated, which leads to a conservative estimation of the maximum allowable speed gradient.
3. Blade Vibration Measurement Systems
The blade vibrations are measured using two different systems. Strain gauges (SG) are attached on some blades, while blade tip timing (BTT) is used to measure blade tip deflections through optical sensors. SG have been extensively used for vibration measurements [
3,
28,
29,
30]. SG offer a continuous signal, enabling the precise determination of the properties of several vibrations simultaneously through short time Fourier transform (STFT) approaches. However, they can only monitor individual blades, and the number of observed blades is constrained by the available telemetry channels. Moreover, they are characterized by their limited service life, sine they are subjected to centrifugal loads, and their application can alter the vibration characteristics of the blades. In fact, Beirow et al. [
28] showed that SG can lead to increased natural frequencies of the instrumented blades, introducing mistuning to the impeller.
In contrast, BTT uses contactless sensors, which are installed in the housing around the impeller circumference, to measure the blade vibrations. BTT has been used by various pieces of research in recent years for vibration measurements [
31,
32,
33,
34,
35]. BTT measures the time of arrival (TOA) of the blades at the BTT sensors. The tangential deflection of the blade tips at the axial plane of the BTT sensors can be determined though the difference between the expected TOA of the non-vibrating blades and the measured TOA. The calculated deflections can then be used to determine the vibration characteristics.
As the BTT sensors are instrumented in the housing around the impeller, BTT does not affect the vibration properties of the blades. Additionally, the BTT sensors have significantly greater durability since they are not applied on the blades and thus are not subjected to centrifugal loads. A crucial advantage of BTT lies in its ability to measure the vibration properties of all blades simultaneously. This enables the precise determination of mistuning and amplitude magnification.
Nevertheless, BTT offers a non-continuous measurement with few measurement points distributed around the circumference. Hence, the recorded deflection signal is typically under-sampled. Thus, multiple EOs fit to the vibration signal due to the aliasing effect. For this reason, automated identification methods are prone to errors and significant user effort is required to correctly identify the occurring vibrations. In this aspect, the consideration of SG measurements can be very helpful.
Since SG measure the strain at the application position and BTT the blade tip displacement at the axial measurement plane, neither system can provide an estimation of the maximum occurring stress. This can only be implemented numerically under consideration of the measured values for each mode shape. Moreover, a purely experimental comparison of the impeller modes cannot provide meaningful results, as the measured strain and displacement depend on the mode shape.
3.1. Strain Gauges
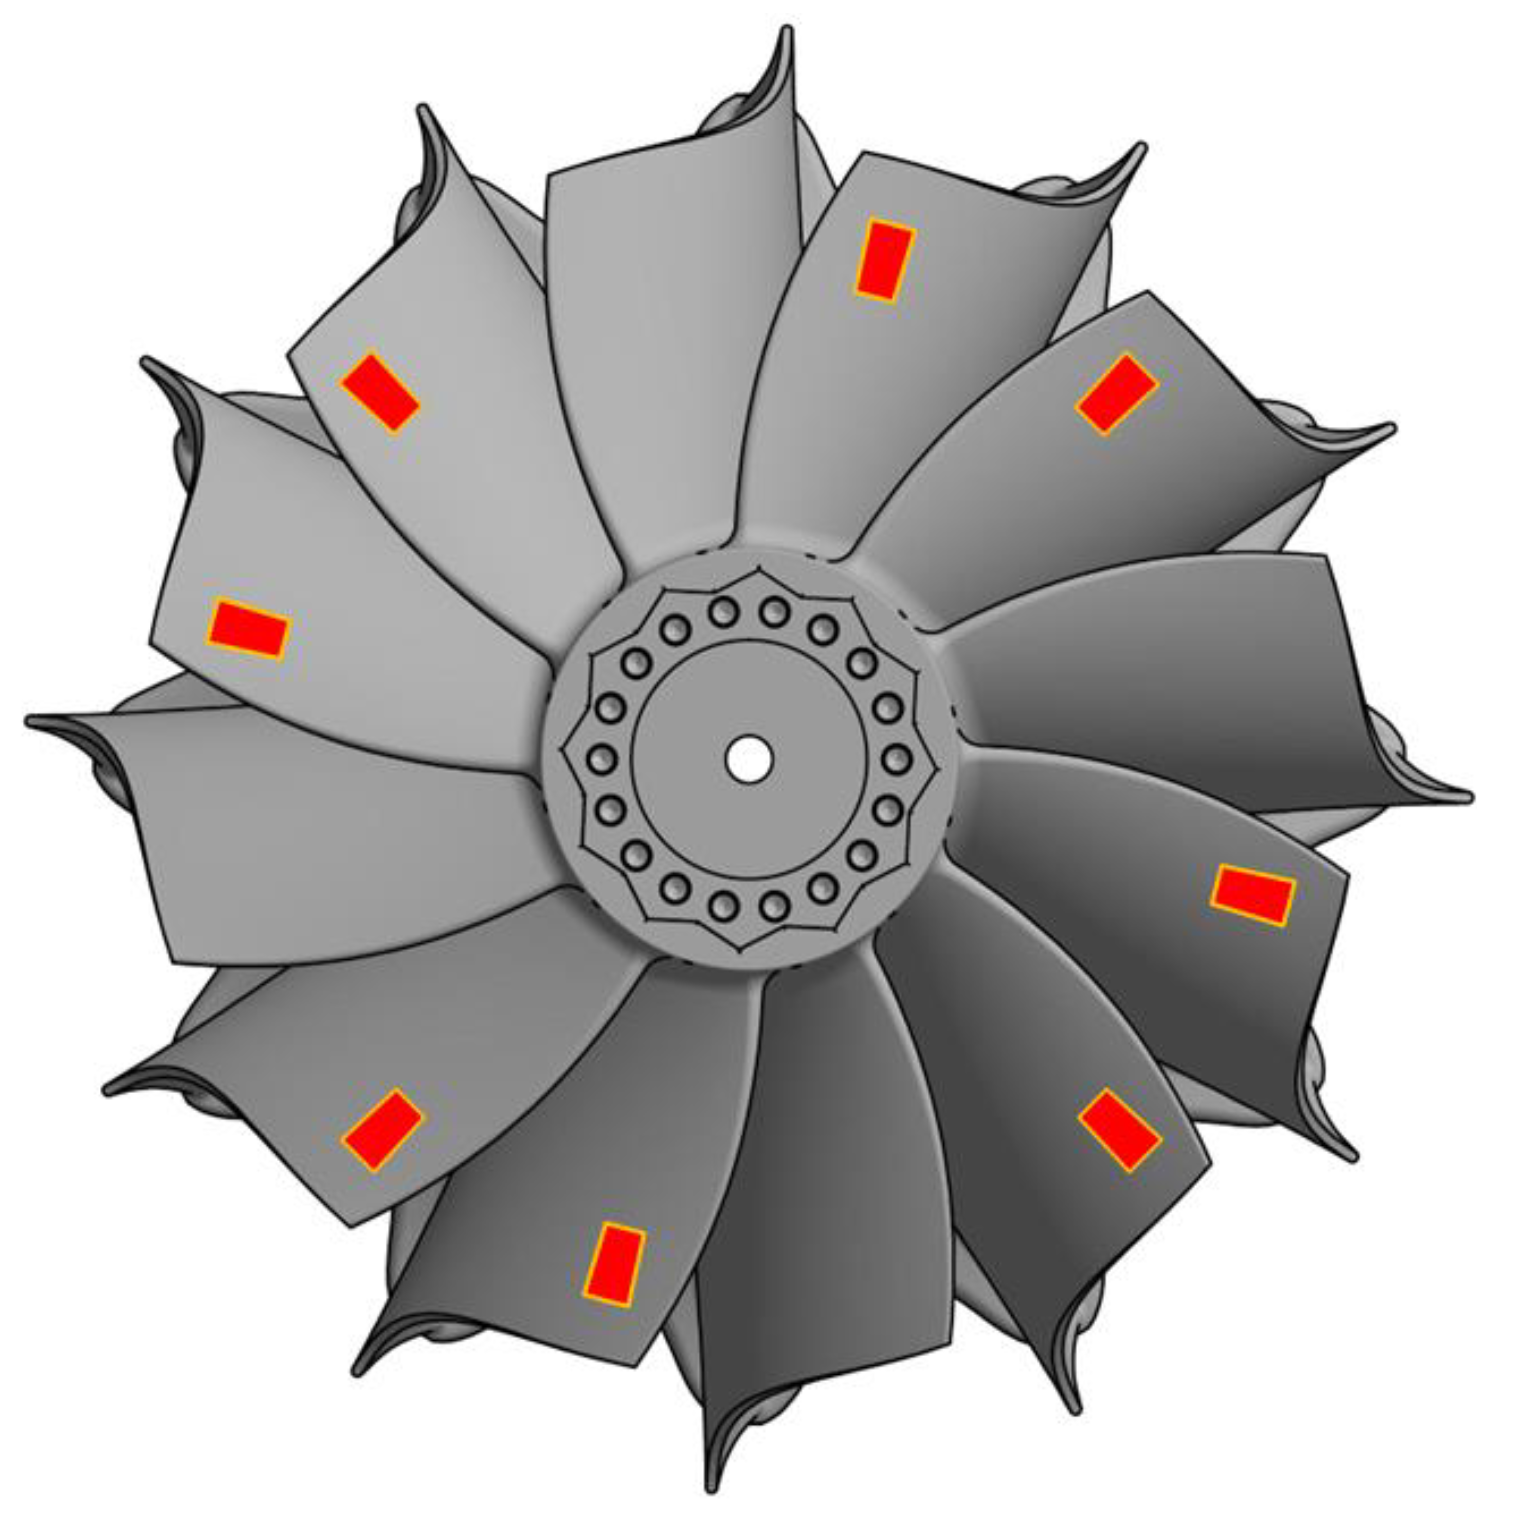
For the acquisition of SG, a telemetry system from the company Telemetrie Elektronik GmbH is used. This allows ten SG to be recorded at high frequency. The sampling rate is 107 kHz. Two of the ten available channels are employed for SG on the shaft. Hereby torsional and bending shaft vibrations can be detected. The remaining eight channels are available for the SG on the blades. Due to the high load caused by the high temperature and the centrifugal forces, the SG cannot be adhesive-bonded. Welding also causes the SG to detach when high vibrations occur. Therefore, application by flame spraying has been chosen. The disadvantage of this method is the accessibility of the surface for the application. The possible SG positions are thus limited to an area with a distance greater than approx. 30 mm from the outer edges of the blade.
The ITSM in Stuttgart calculated the position and orientation of the SG on the blades using a best fit procedure [
36,
37], in which all vibration modes listed in
Table 2 are considered. The SG position is shown in
Figure 4. In order to investigate the IBPA between two neighboring blades, the SG were distributed symmetrically in pairs around the circumference, as shown in
Figure 5. Additionally, the system is not subjected to any further imbalances.
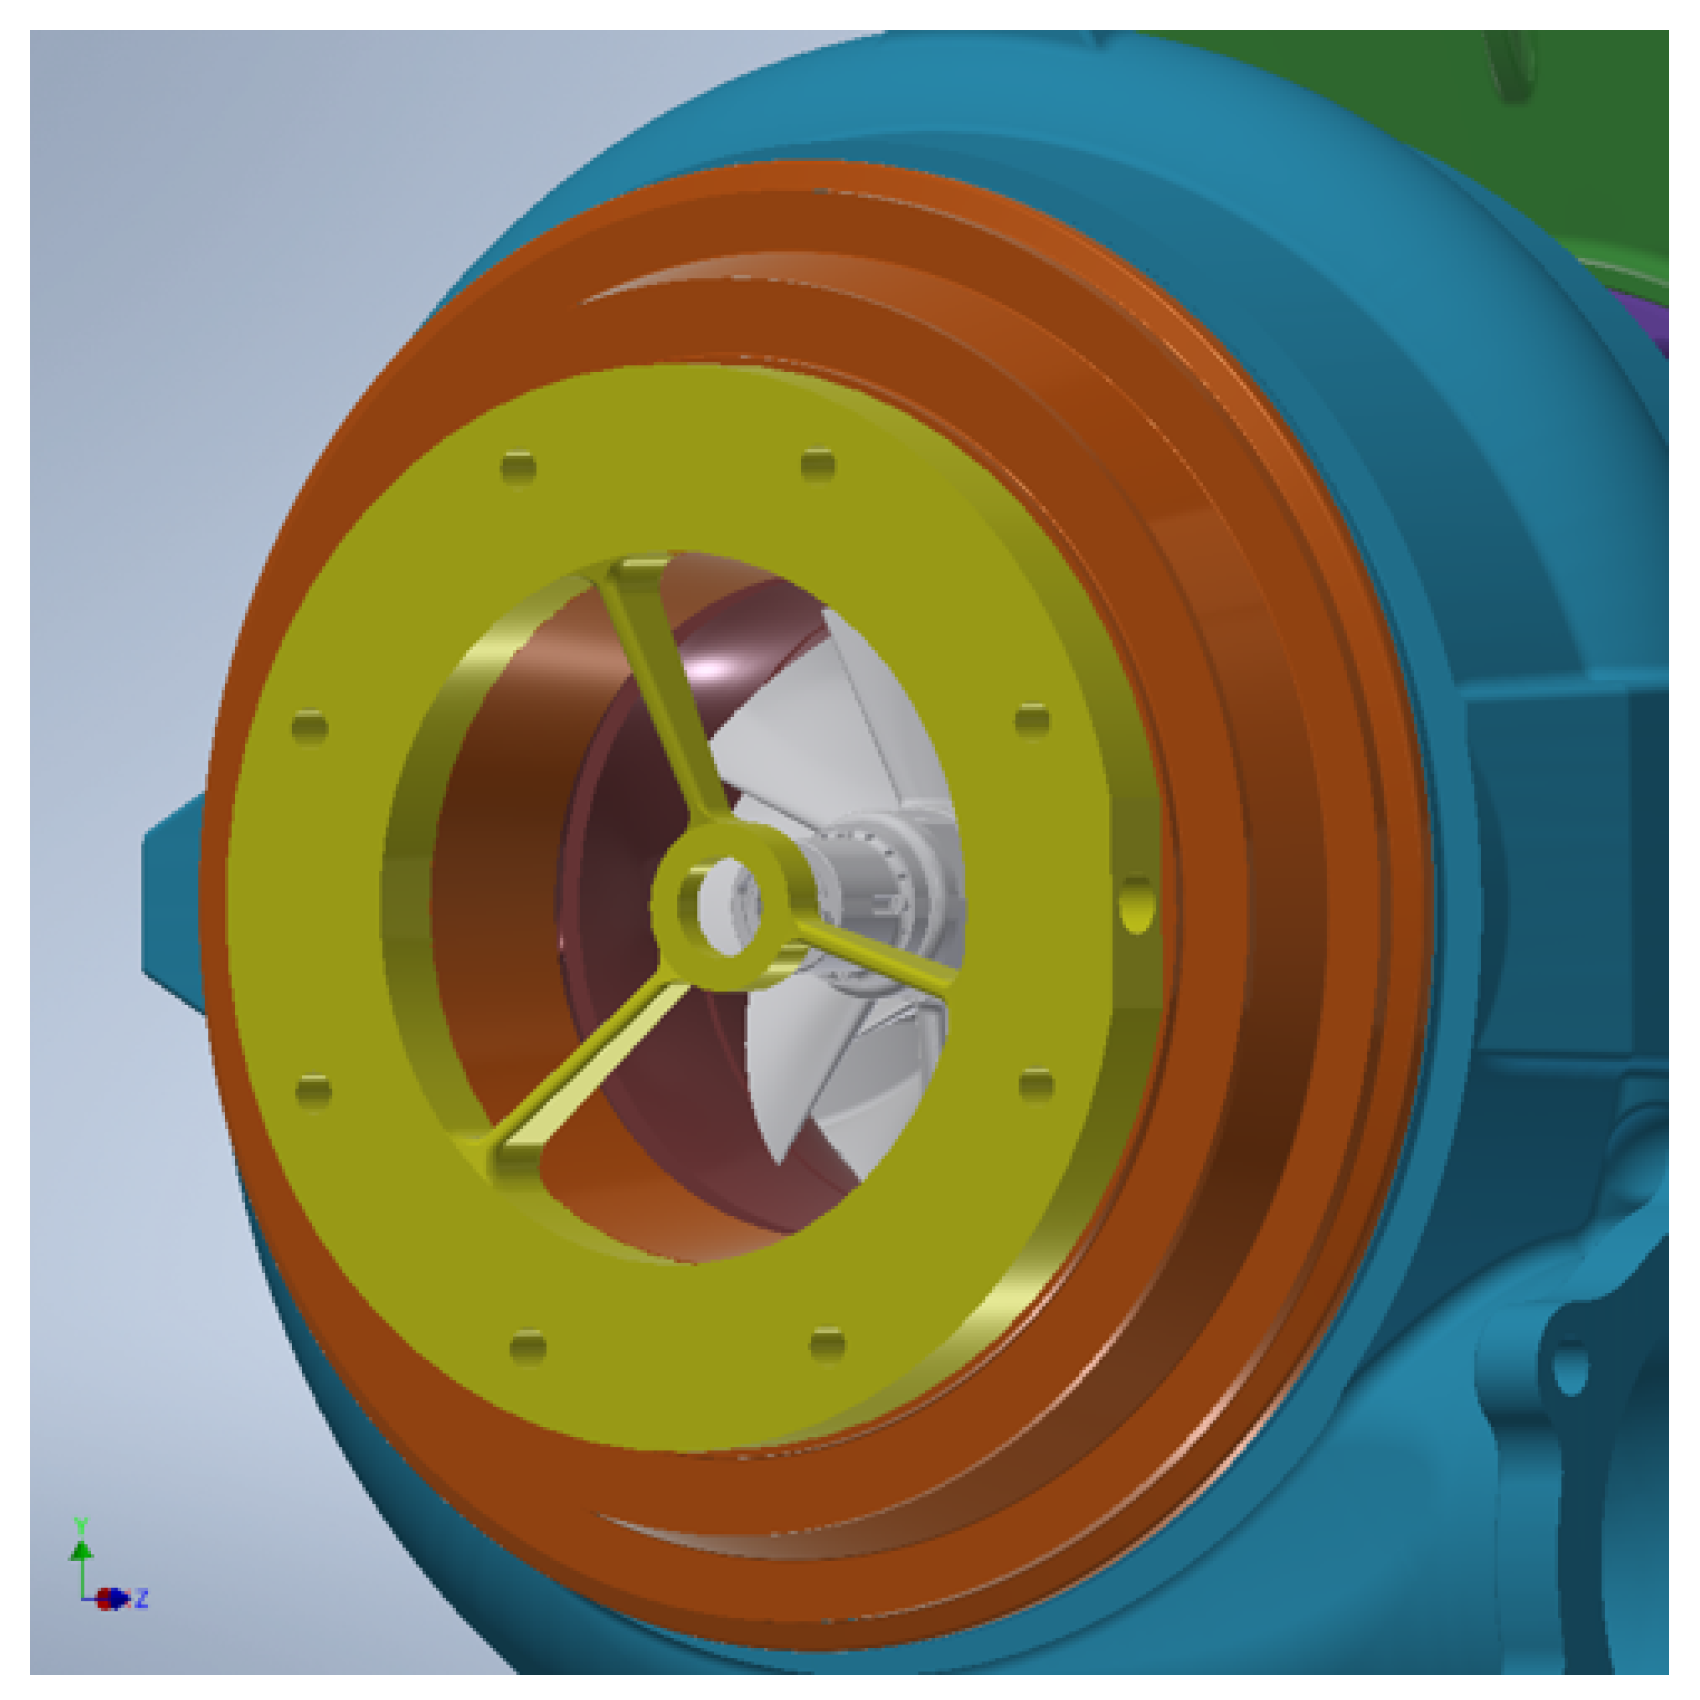
To avoid influencing the vibration characteristics of the turbine impeller, the telemetry transmitter is attached on the compressor wheel. The wires are transmitted through the hollow shaft to the compressor side. Opposite to the telemetry transmitter, the receiver was mounted on a three-stud support. The transmitter and the support of the receiver are illustrated in a CAD model of the turbocharger compressor depicted in
Figure 6. The telemetry support can obviously influence the flow field upstream of the compressor wheel, as it can generate EOs, which are multiples of three. To examine whether the telemetry support has an effect on the vibration behavior of the turbine, a test was performed without the telemetry receiver.
3.2. Blade Tip Timing
For BTT measurements, a commercial system from the company Hood Technology is used. For the laser source and the conversion of the optical to an electrical signal, an in-house developed laser unit is used. Optical sensor probes from Agilis Measurement Systems, Inc. and FiberOptic P. + P. AG are integrated into the turbine. As the probes are built similarly using the same fibers, arrangements and dimensions on the head of the probe, they can be mixed without any implications.
The commercial BTT system offers a resolution of 200 MHz at which the analog signal is converted to a TOA via a falling or rising edge trigger. The post-acquisition analysis is performed through the employment of the commercial Analyze Blade Vibration Software using the circumferential Fourier fit (CFF) approach. CFF tries to fit undamped sine oscillations on the deflection signals through the least square method. A detailed explanation of the CFF method is provided in [
38,
39,
40,
41,
42]. By applying undamped sine oscillations Equation (
7) at each BTT sensor, a linear equation system is formed, according to Equation (
8).
Here, represents the measured deflection at BTT sensor s of circumferential position . A represents the amplitude, the phase and D the static offset of the blade, while S expresses the number of BTT sensors. Vector symbolizes the measured deflections, M is the coefficient matrix, while vector contains the unknowns to be determined.
For the positioning of the sensors, an evaluation of matrix
M must be performed. Particularly, the conditioning of matrix
M is an indicator for how sensitive the sensor positions are for a specific EO vibration. The condition number
is an approximate numerical value for the matrix conditioning [
43,
44]. A condition number of 1 indicates the best possible sensor position for a particular EO. However, this must be investigated for all EOs that are expected. Hence, a best fit method for all EOs must be performed. A detailed description on the optimal probe positioning is provided by the literature [
42,
45,
46].
The number of sensors is decisive in determining how many simultaneous excitations can be identified. Four sensors can determine the vibration characteristics of one vibration and provide an error term that can be used for assessment of the goodness of fit. With every two additional sensors, one more excitation can be detected. In total, eight sensors were positioned around the circumference, which enables the identification of up to three EOs at the same time.
Most modes are expected to have the largest tangential deflections at the blade tip of the trailing edge, as displayed in
Figure 2. Hence, an axial position 2 mm upstream of the blade trailing edge was chosen as the plane for BTT measurements.
For blade identification, most BTT systems require a once per revolution signal. This consists of another optical sensor that is aligned with the shaft end at the compressor side. The shaft was blackened except for a small strip. The reflection of the unblackened shaft area can trigger the sensor. This can be used as the starting point of a revolution.
4. Results
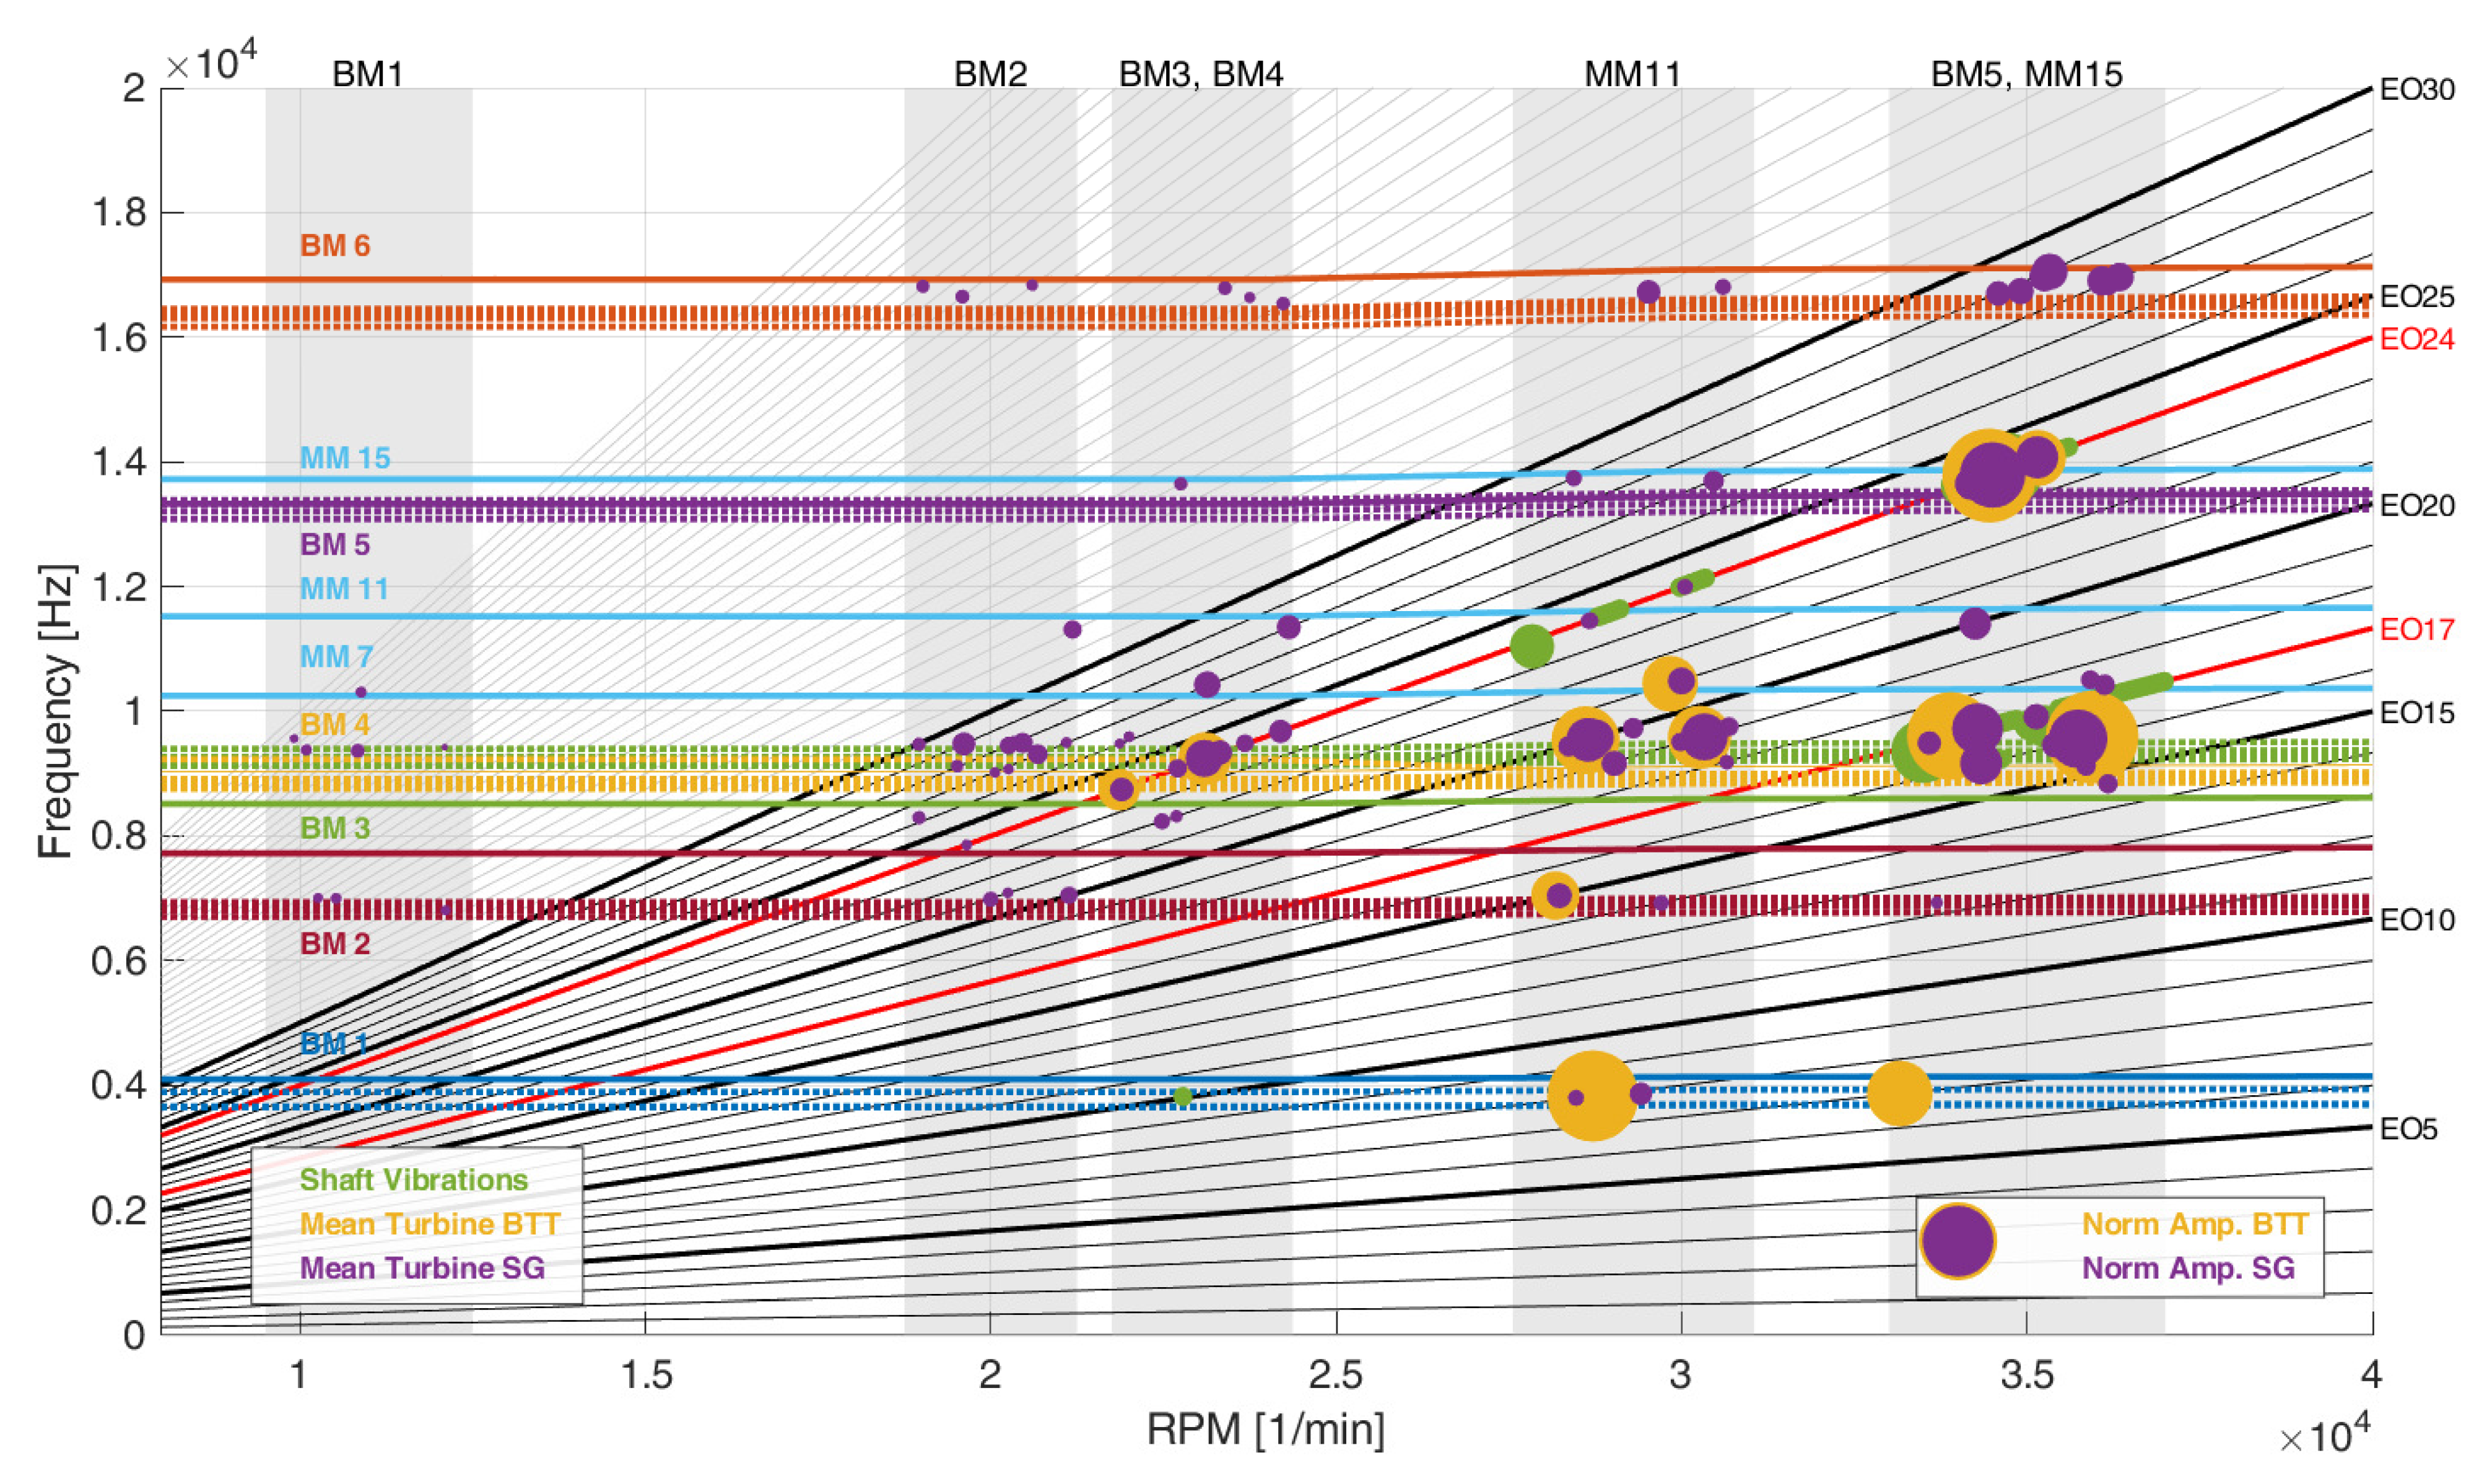
In this section, the vibration measurements are demonstrated and analyzed. An overview of the measured vibrations is presented in the Campbell diagrams,
Figure 7 for SD24,
Figure 8 for LEO10 and
Figure 9 for DRH30. The BMFs are indicated with different colors. The solid line of each BMF indicates the ND0, while the dashed lines signify ND1-6. The EOs are represented by black lines, with the relevant EOs for each IGV highlighted in red bold lines. These are EO24 for SD24, EO10, EO14 and EO24 for LEO10 and EO30 for DRH30. EO17 is also highlighted with a red bold line in every Campbell diagram as it is the primary excitation caused by the compressor diffuser. The orange dots indicate the vibrations measured with BTT, while the purple dots signify the vibrations measured with SG. The location of the dots is determined by the critical speed and resonance frequency. The diameter of the dots indicates the mean vibration magnitude. As the speed ramps are repeated at least six times, these values are the average over all measurements.
The SG measurements on the shaft are also presented on the Campbell diagrams as green dots. The measurements are employed to identify whether vibrations are transmitted through the shaft. According to Klaus [
6], vibrations of ND0 can cause torsional vibration of the shaft while vibrations of ND1 cause bending vibrations. Vibrations with ND higher than 1 cannot influence the shaft, since the forces and moments in the individual sectors of the impeller act against each other and are thus canceled out.
To quantify the mistuning of the modes, the maximum amplitude and frequency mistuning is used. To evaluate amplitude mistuning, the greatest amplitude overshoot is considered, as this is accompanied with the highest stress. Hence, the maximum amplitude mistuning (
AM) is defined as the greatest positive amplitude difference relative to the mean amplitude over all blades in percentage according to Equation (
10). The maximum frequency mistuning (
FM) is analogously defined as the greatest absolute frequency difference relative to the mean frequency over all blades in percentage as presented in Equation (
11).
To ensure a precise mistuning evaluation, it is essential to consider the vibration characteristics of all blades. Therefore, both AM and FM are determined through BTT. As SG only observe the instrumented blades, the assessment of mistuning can only be approximated through a limited number of blades. Moreover, there is always the possibility that the blade with the highest amplitude is not instrumented with SG.
The damping ratio is calculated from the amplitude curve over the excitation frequency through the half-power bandwidth method [
47,
48]. Both the amplitude and damping values are normalized. To ensure comparability between the different vibrations, the same reference amplitude and damping values are used for normalization for all vibrations.
An overview of the properties of the most relevant vibrations determined with BTT is given for SD24 in
Table A1, for LEO10 in
Table A2 and for DRH30 in
Table A3 in
Appendix A. The average values of the frequency
and the normalized amplitude
and damping ratio
are presented. Moreover, the AM and FM are demonstrated.
4.1. Nominal IGV—SD24
In this section, attention is given to the BMs listed in
Table 2, while a comparison between both measurement systems is performed to cross-validate the experimental results. To facilitate this comparison and showcase the impeller mistuning, selected vibrations are presented in box plot diagrams.
As observed in Campbell diagram
Figure 7, significantly more vibrations have been detected with the SG. The continuous and highly sampled signal of the SG allows an analysis of the raw data by STFT. Thus, the number of simultaneously acquired vibrations is practically unlimited. In contrast, the BTT data must be evaluated by defining the expected EOs for the CFF method. Thus, the number of excitations that can be analyzed simultaneously is limited by the number of sensors. Nevertheless, the comparison between BTT and SG shows that the most dominant vibrations are indeed captured by BTT. Only vibrations with minor amplitudes cannot be detected.
Due to the low speed of the turbocharger at the EO24 excitation of BM1 and BM2, no considerable magnitudes have been measured for these vibrations. BTT could not measure any deflections, while SG could barely identify extremely small strain signals. Vibrations with considerable magnitudes have been measured from approx. 20,000 RPM.
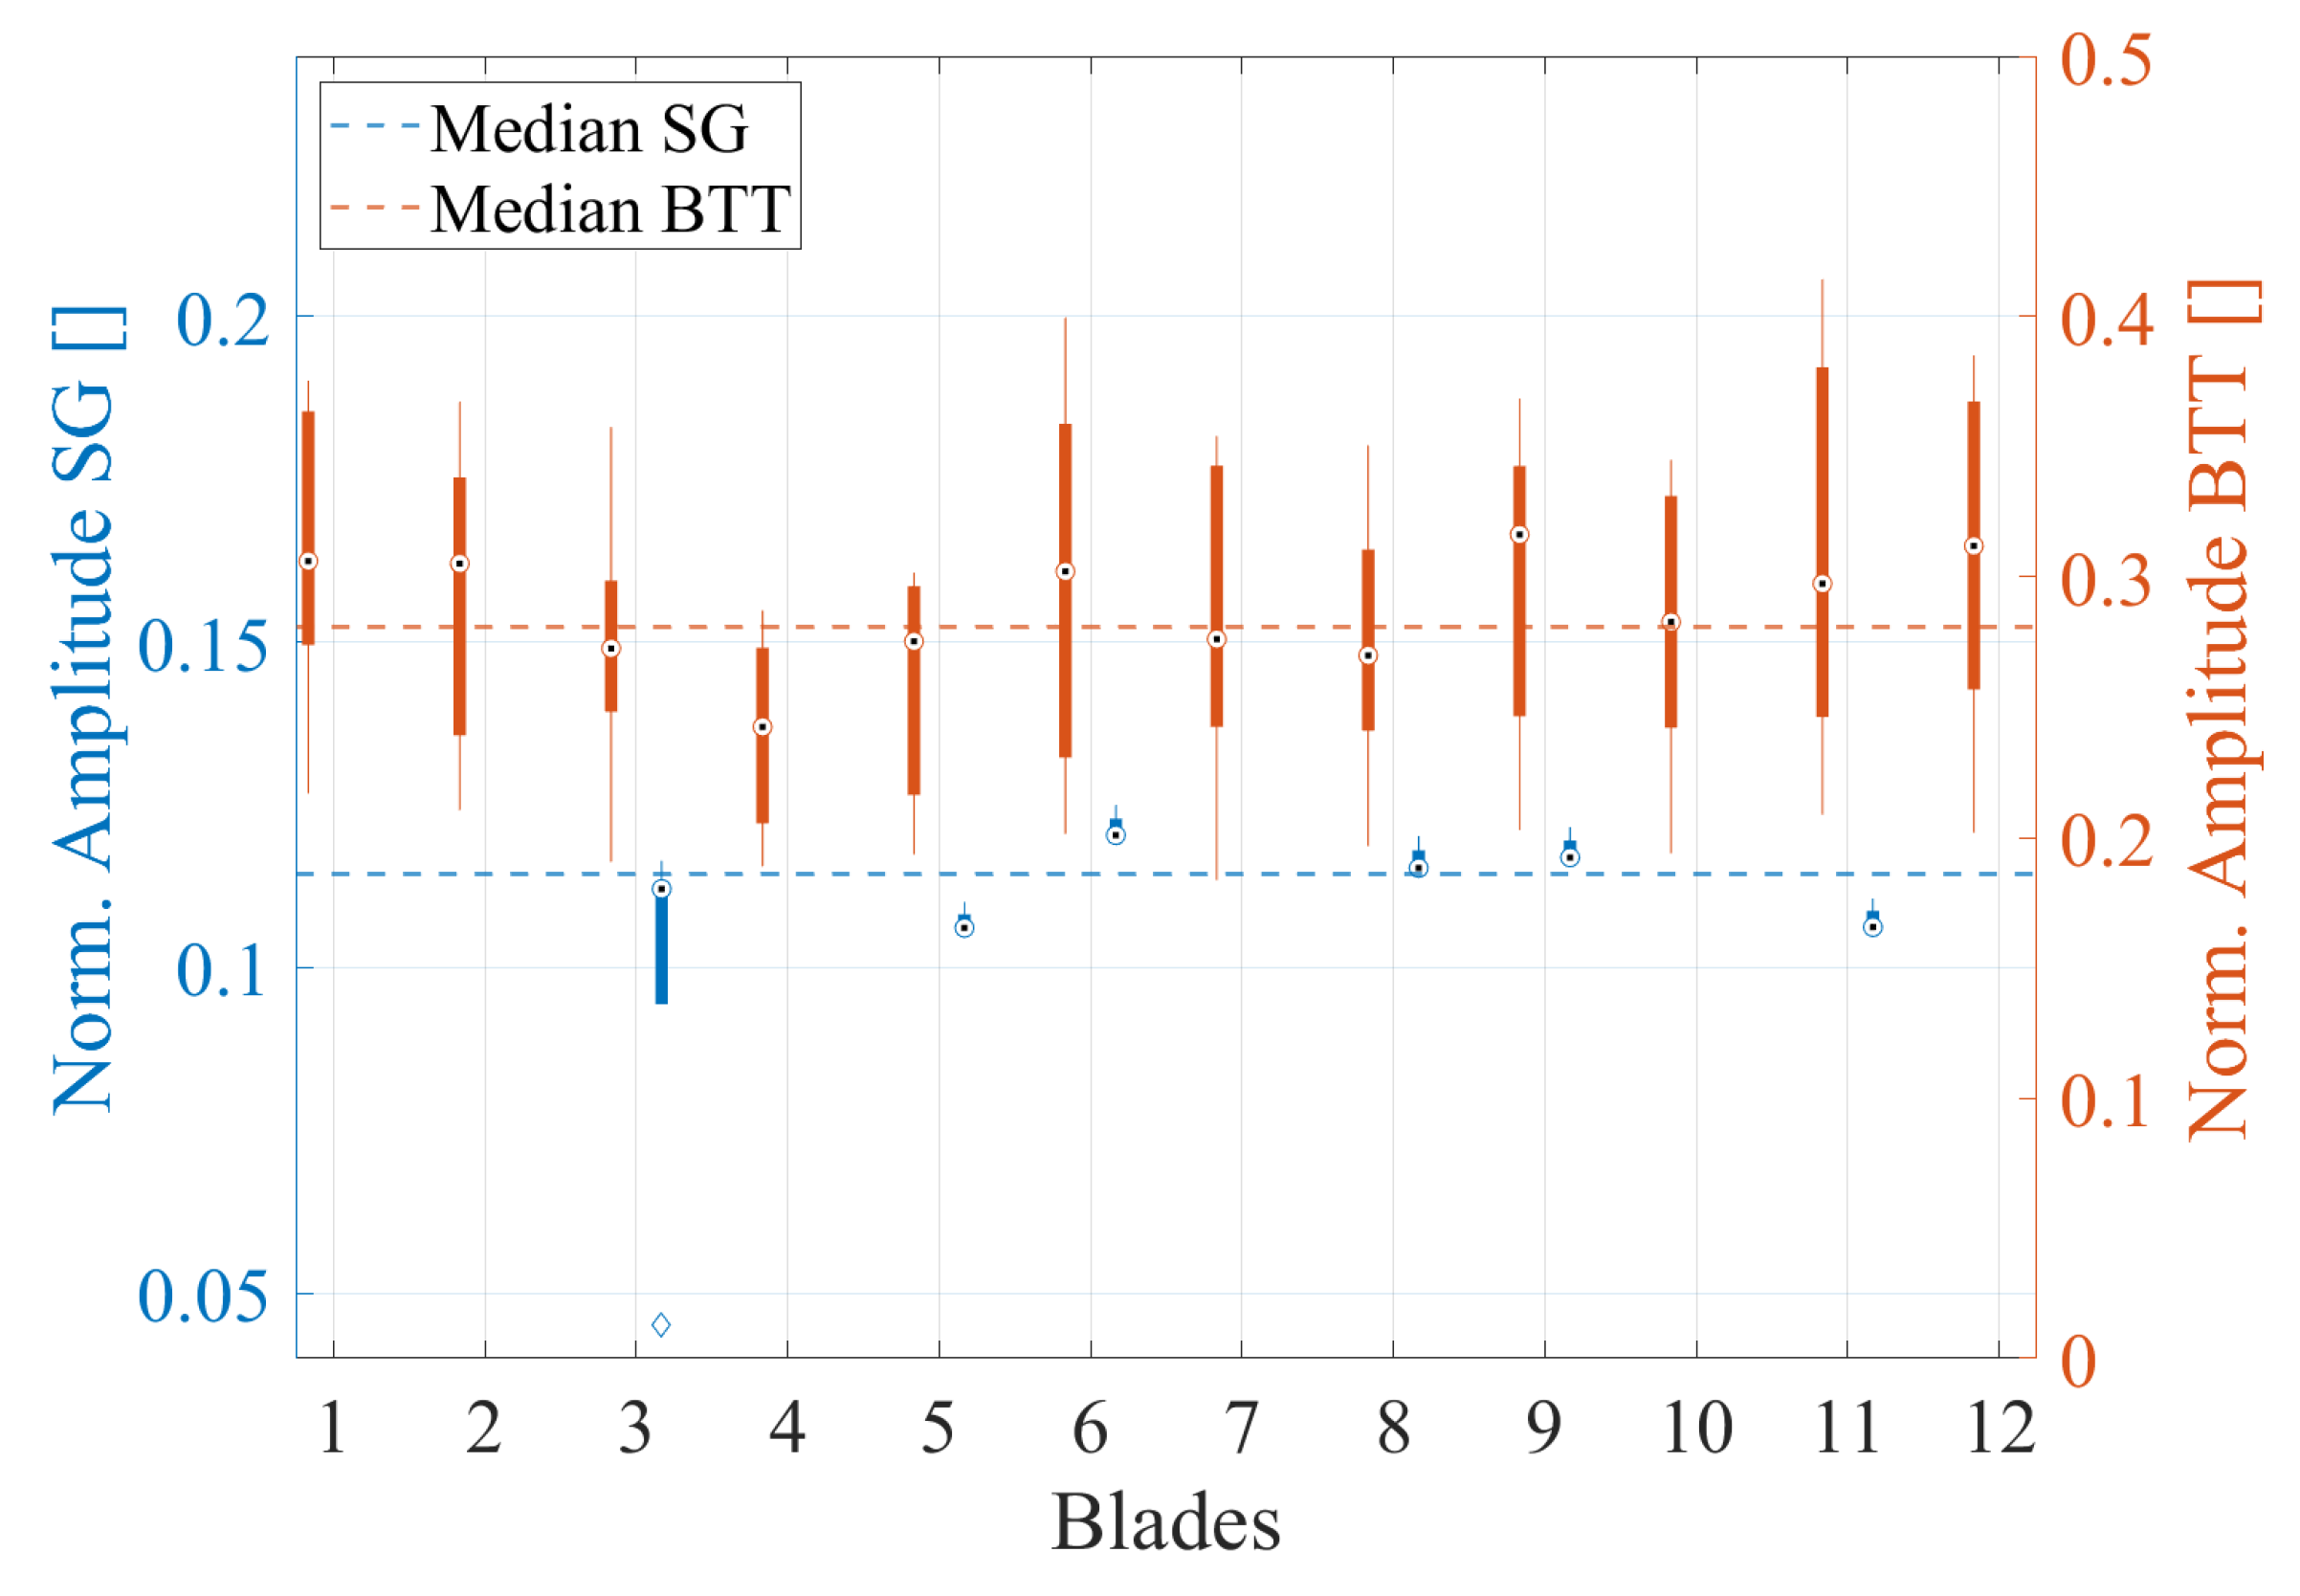
Both EO24/BM3/ND0 and EO24/BM4/ND0 have been measured. The amplitudes (
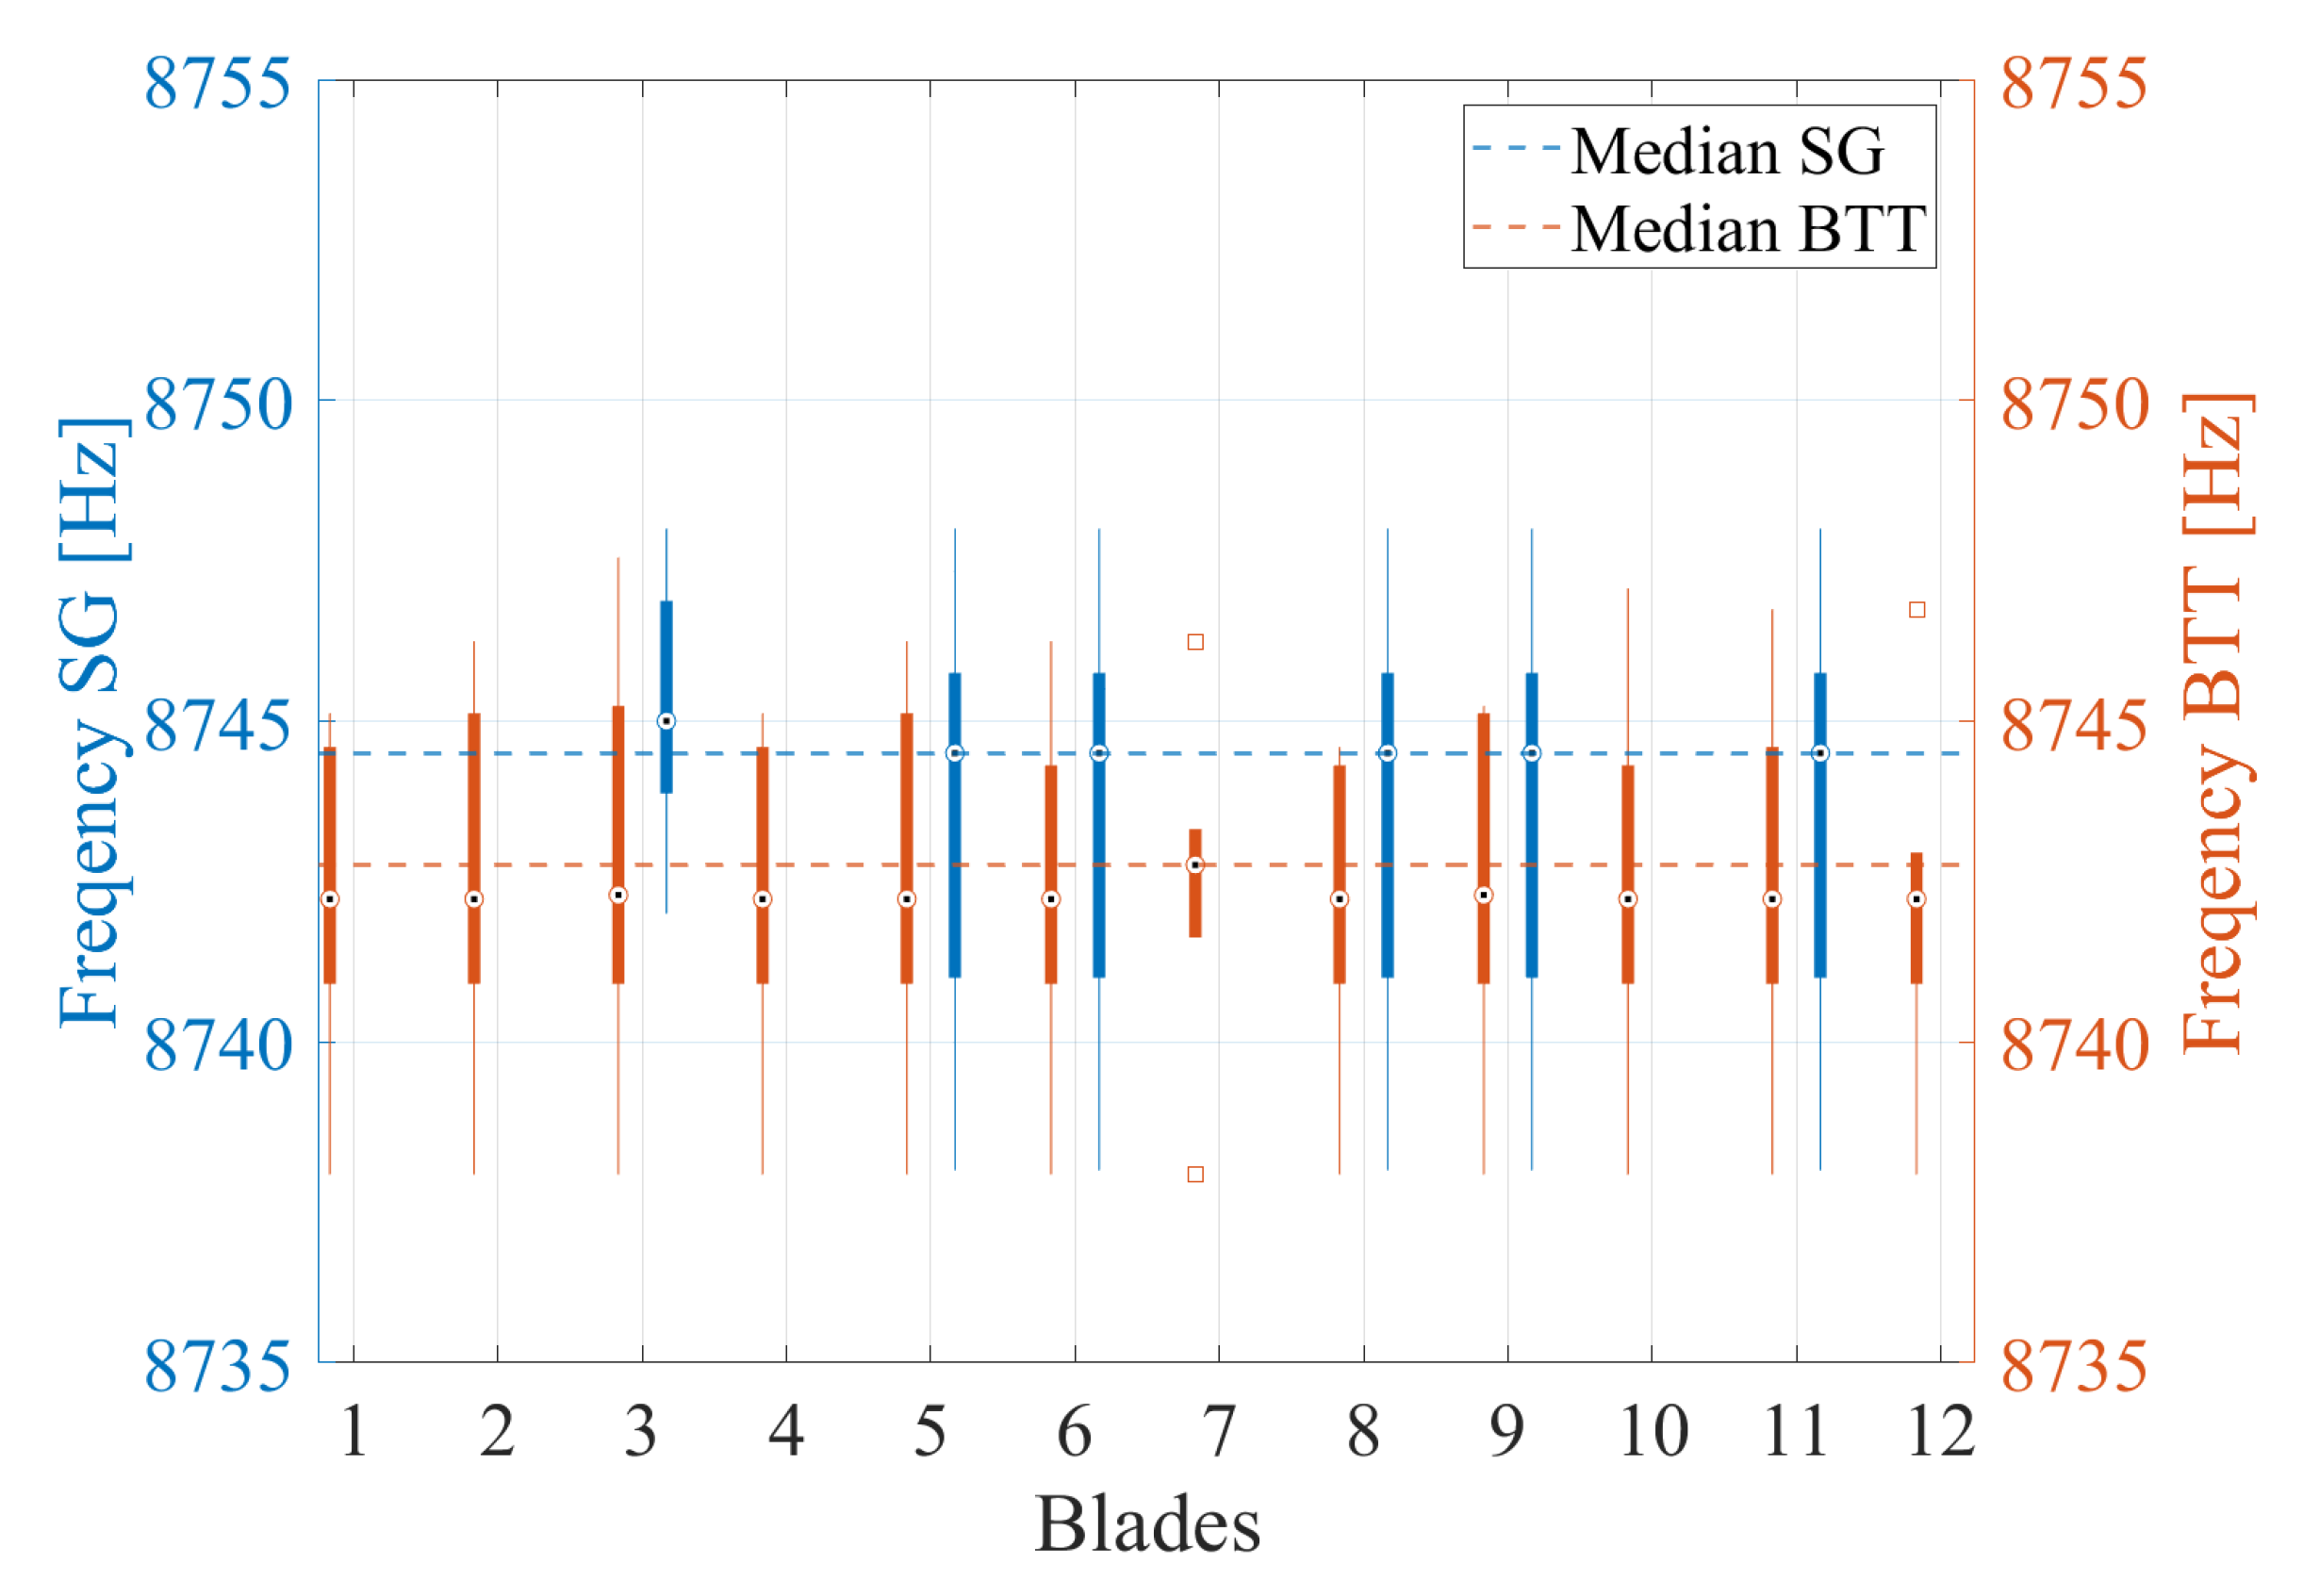
Figure 10) and frequencies (
Figure 11) of EO24/BM3/ND0 are presented in box plot diagrams. In
Figure 11, the median frequency of every blade lies at exactly the same value, resulting at no FM for EO24/BM3/ND0. A small frequency fluctuation of around ±5 Hz at maximum can be observed between different speed ramps. The SG and BTT measurements are consistent as only a slight deviation of 2 Hz between the mean frequencies is observed.
Figure 10 shows a similar behavior for the measured amplitudes. The AM across the blades lies at approx.
, which is exceptionally small compared to other vibrations. As the vibration amplitudes of EO24/BM3/ND0 lie approx. at the detection limit of BTT, a large amplitude fluctuation is observed between the different measurements. Even though BTT and SG cannot be compared directly, the amplitude follows the same trend along the blades. Since the results of EO24/BM4/ND0 do not provide additional insights regarding the differences between SG and BTT, they are not presented in detail.
Contrary to the numerical calculations, EO24/MM11/ND0 could not be measured in the expected speed range. The SG measured negligible strains at the location of MM11, while BTT could not measure a EO24 vibration. Yet, shaft vibrations of EO24 were measured. This indicates that the numerical model needs to be improved, as it appears that damping effects are present, which restrain this vibration. In contrast, numerous vibrations of different EO have been measured with both systems. As these vibrations were also measured with the other IGVs, they are addressed in a separate section.
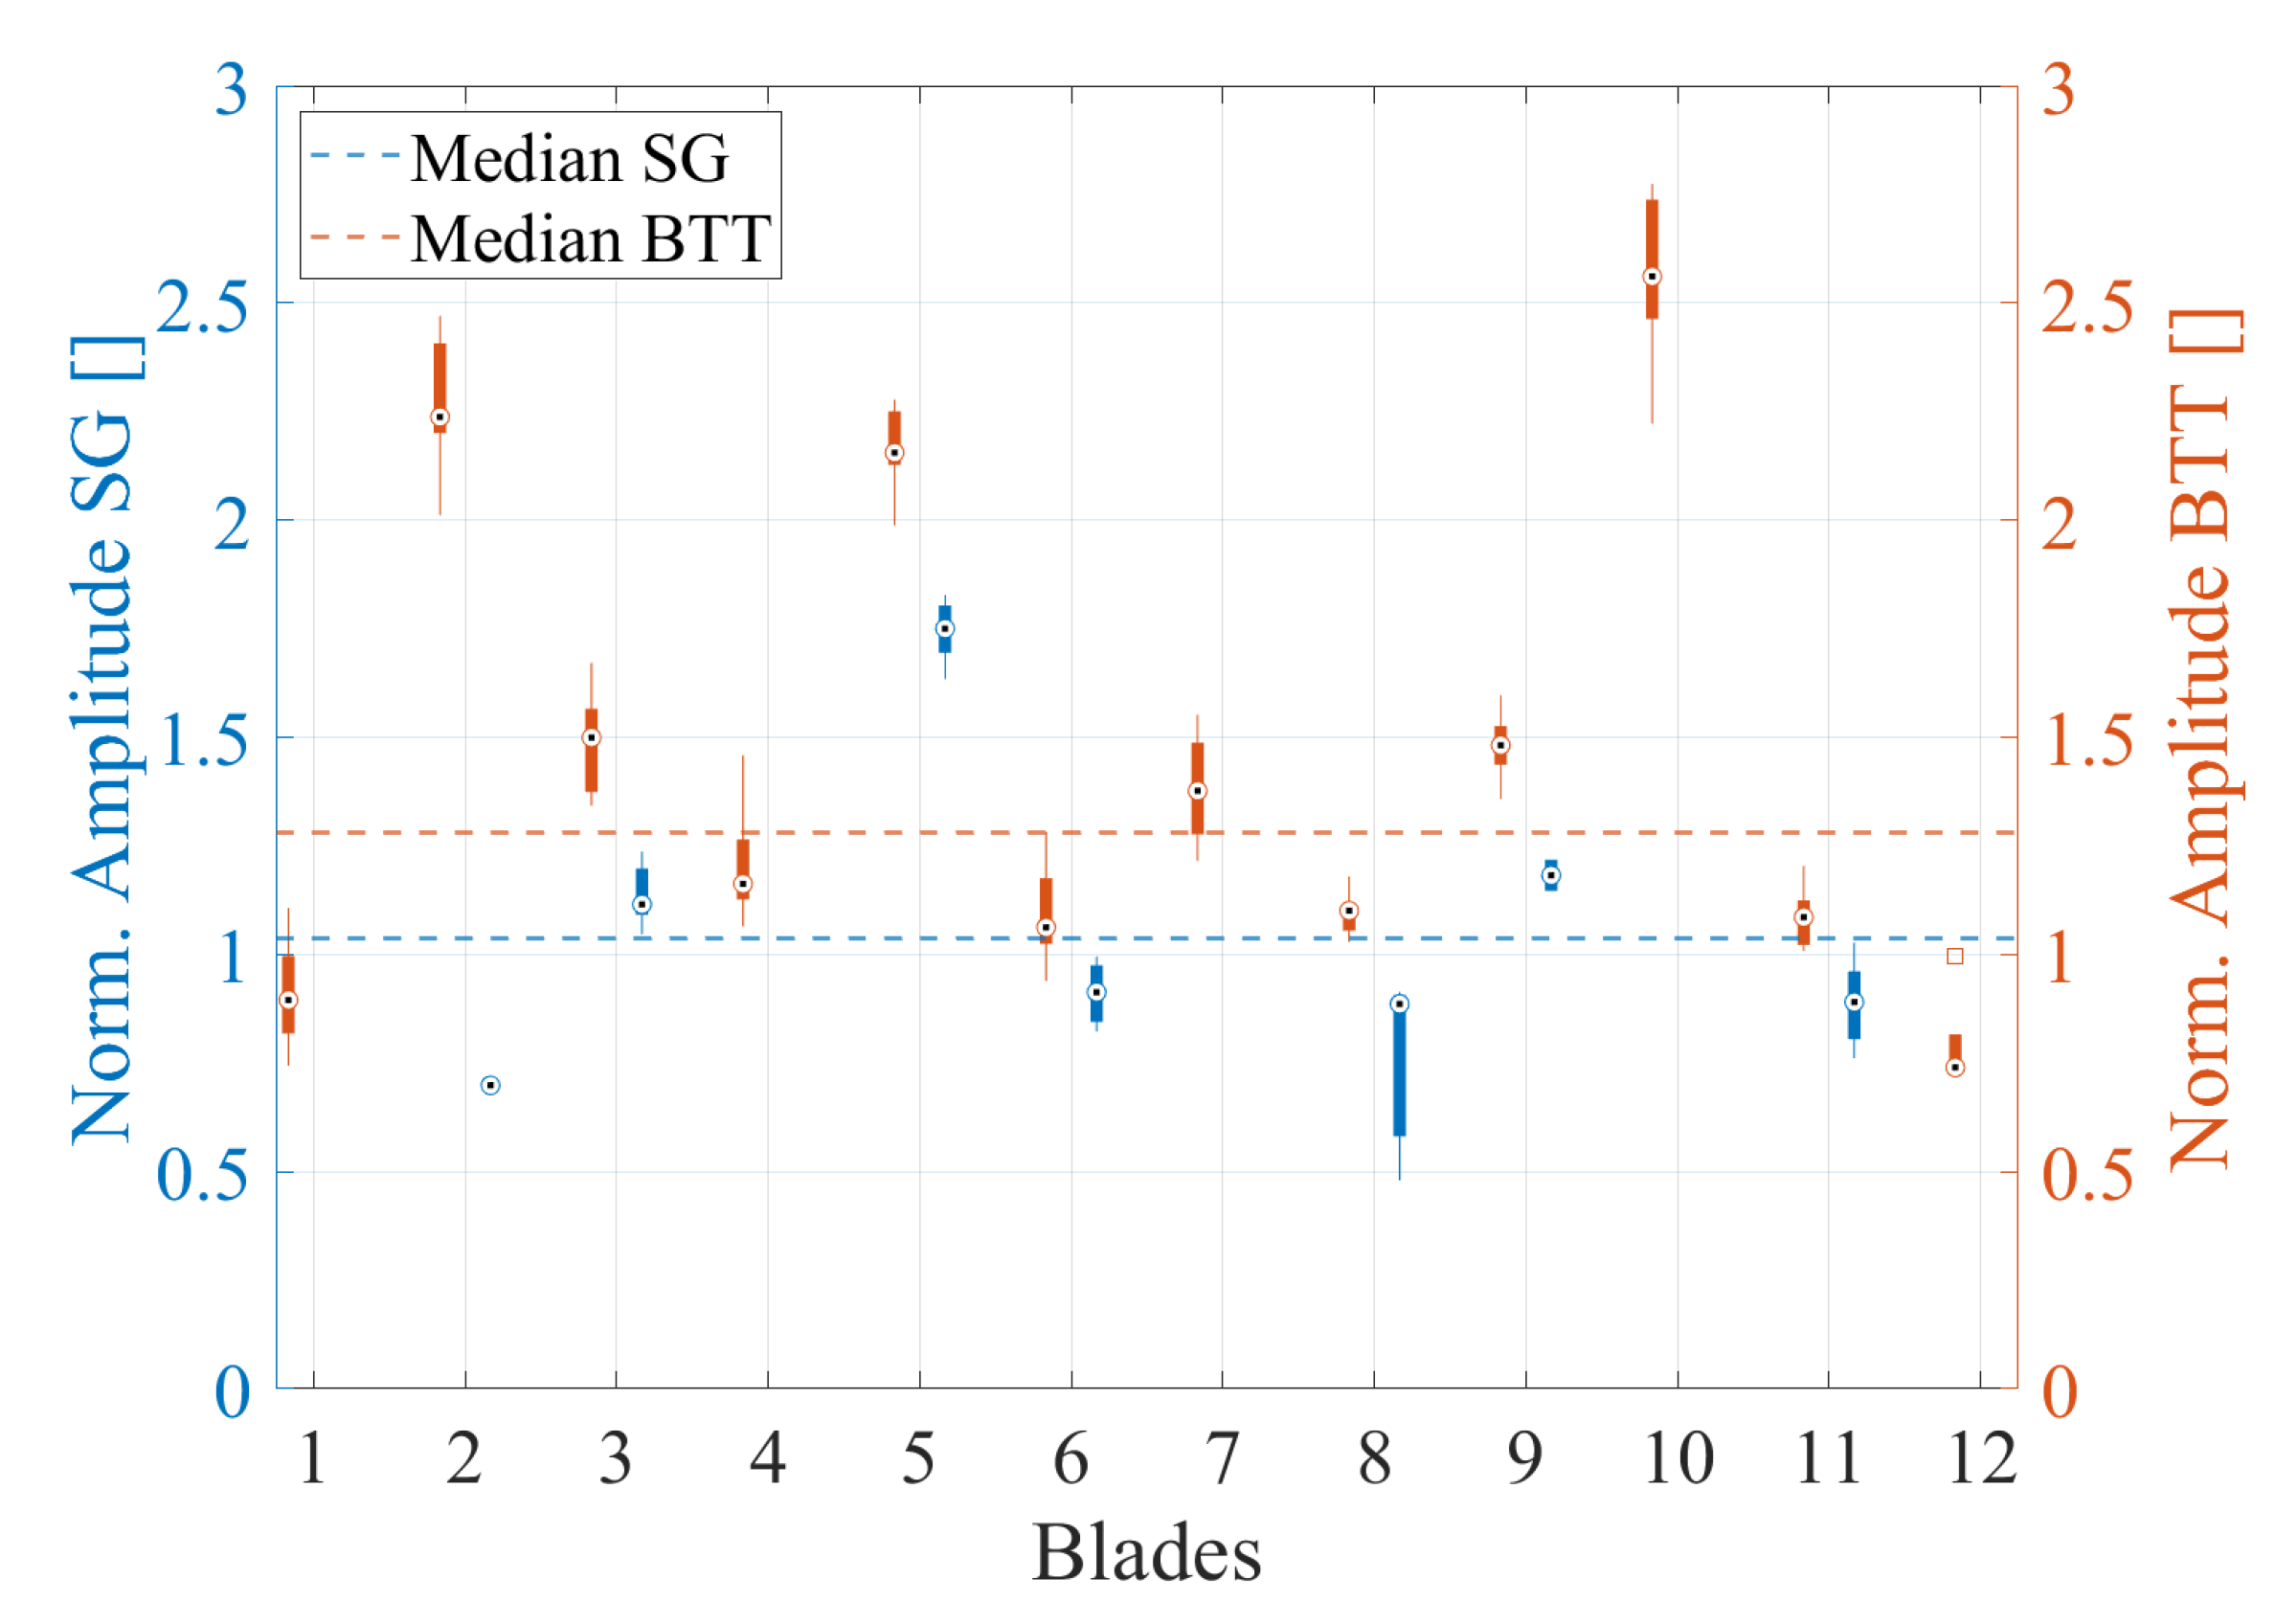
In the high-speed region, a significant vibration of EO24/BM5/ND0 was measured, exhibiting the largest amplitude for both measurement systems. The normalized amplitudes of SG and BTT for EO24/BM5/ND0 are presented in
Figure 12. The substantial differences observed among the amplitudes of the blades contribute to an AM of
, confirming the findings reported by Drozdowski [
15]. Mistuning can be increased disproportionately for blisk impellers, leading to significant amplitude overshoots.
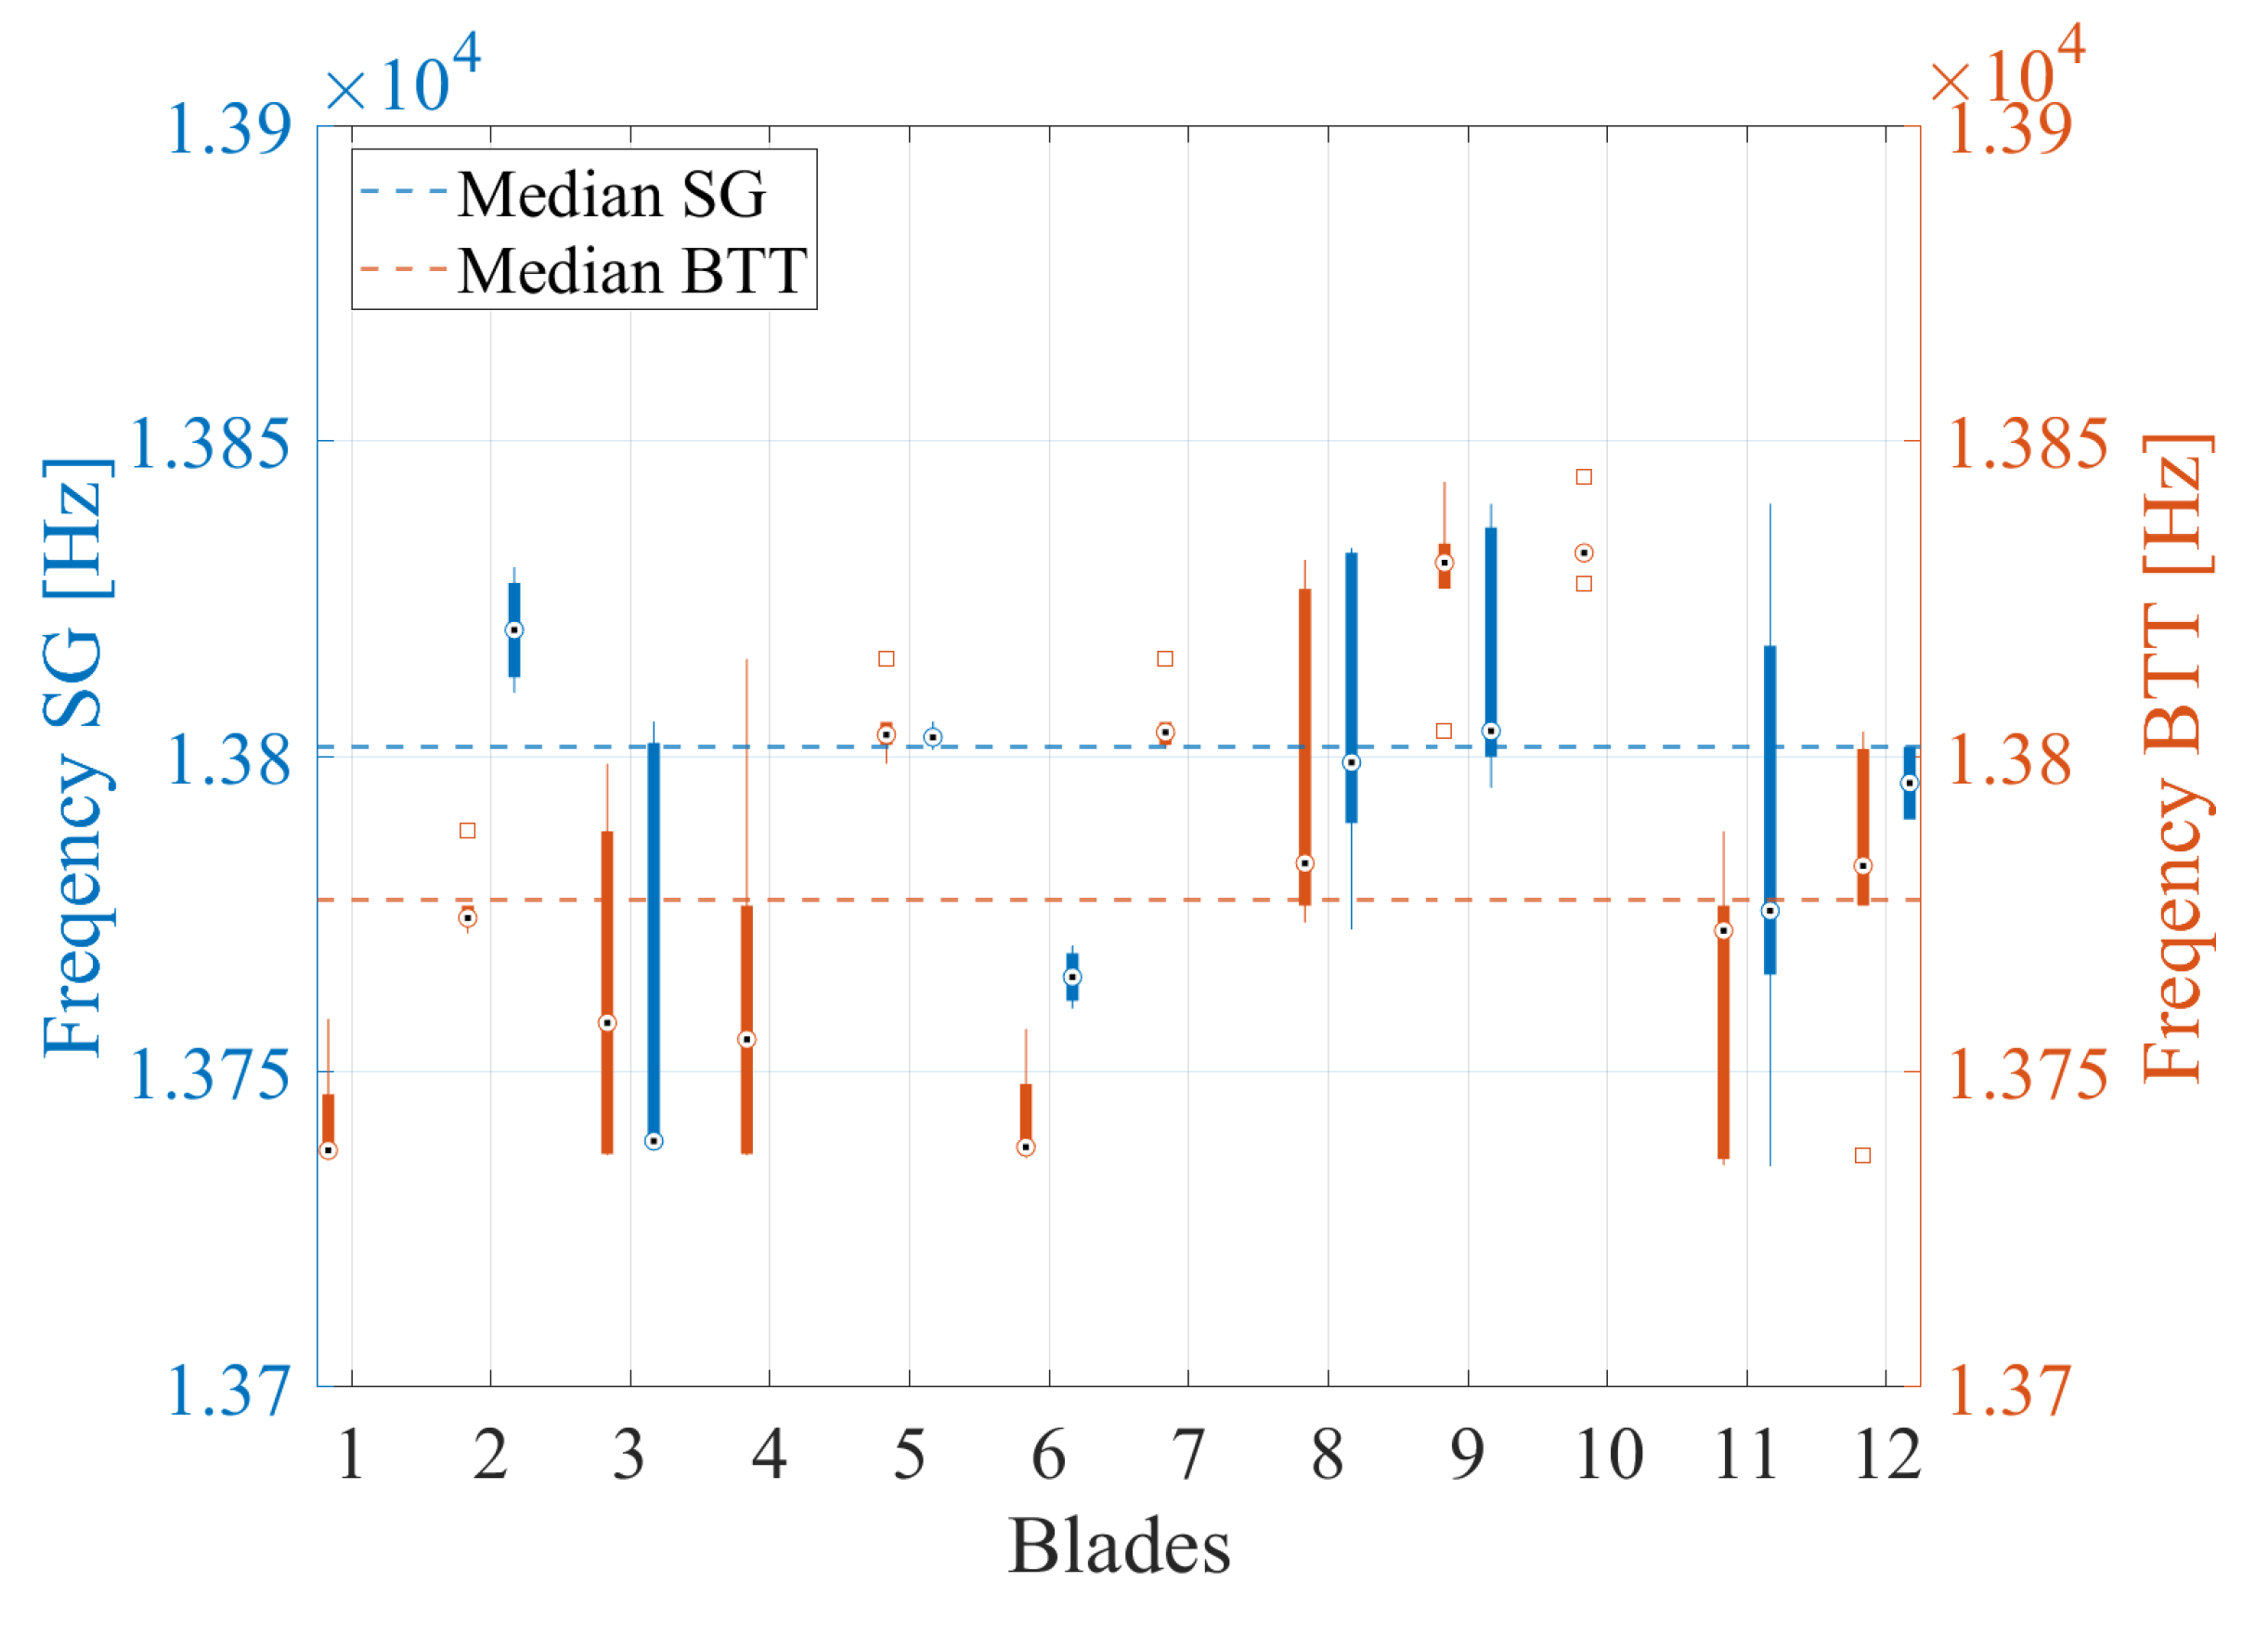
Considering the resonance frequencies of EO24/BM5/ND0, which are presented in
Figure 13, a large frequency fluctuation can be observed for some blades. This can be explained by
Figure 14, where the amplitude evolution of the blades over the speed is presented in a stack plot. Here, the green line depicts the amplitude of EO24/BM5/ND0 measured with BTT, while the error term is indicated by the red line. Multiple amplitude peaks occur over the rotating speed, indicating numerous resonance crossings and frequency splitting phenomena. By various blades, several peaks with an equally high amplitude can be detected. Since the resonance frequency is determined at the point of highest amplitude and there are deviations in which peak is the highest between the speed runs, a fluctuation in the resonance frequency is apparent. These observations can be attributed to the impeller mistuning and were thoroughly documented by several researchers [
16,
17,
18].
Similar to EO24/BM3/ND0, both measurement systems exhibited consistent trends in amplitude and frequency along the blades. However, the importance of assessing all blades for mistuning became evident by the fact that the blade with the highest amplitude, Blade 10, was not instrumented with SG. Additionally, the lower durability of SG is highlighted by the substantial fluctuation in vibration properties observed in Blade 5, indicating potential imminent failure of the SG attached to it. Moreover, the uncertainty of BTT decreases with increasing amplitudes, as evidenced by significantly lower variations in the BTT-determined vibration properties of EO24/BM5/ND0 compared to EO24/BM3/ND0.
At a slightly higher speed, EO24/MM15/ND0 was recorded with significantly lower amplitudes than EO24/BM5/ND0. A remarkably low amplitude variation was observed, yielding an AM of . The small AM was accompanied by a minor FM of . Shaft vibrations of EO24 were recorded simultaneous to EO24/BM5/ND0 and EO24/MM15/ND0, indicating that ND0 vibrations can be transmitted to the shaft. Furthermore, similar to the speed range of MM11, various blade vibrations of different EOs were observed.
4.2. Mistuned IGV—LEO10 IGV
Campbell diagram
Figure 8 demonstrates the vibration measurements for LEO10. The mistuned IGV introduced two additional vibrations, namely, an EO10/BM1/ND2 vibration at 22,700 RPM and an EO14/BM2/ND2 at 29,700 RPM. These measurements align with the findings of Breard et al. [
8] and Kovachev et al. [
9], who identified non-uniform vane spacing as a primary source of LEO excitations. Moreover, the procedure demonstrated by Zobel [
25] for intentionally generating LEO excitations through the variation in the area between the vanes is validated. In addition, similar to SD24 IGV, EO24 vibrations were measured, along with vibrations of several other EOs.
The mean normalized amplitude of EO10/BM1/ND2 is higher than the amplitude of EO24/BM4/ND0 that occurs at the same speed region. Even though a direct comparison between these modes cannot be performed, due to the different deflection shape (
Figure 2), this demonstrates that a mistuned IGV can induce blade vibrations with considerable magnitudes. These findings, underline the importance of tolerances in IGV manufacturing.
In the moderate speed region, the mistuned IGV generates an EO14/BM2/ND2 vibration. Yet, this vibration has a lower magnitude than EO15/BM2/ND3, which occurs at a slightly lower speed and was also measured with SD24. In the high-speed region, two vibrations, EO17/BM3/ND5 and EO24/BM5/ND0, were measured. EO07/BM1/ND5, EO24/MM15/ND0 and EO16/BM3/ND4, which were recorded with SD24, were not measured with LEO10 as they lie outside of the measured speed range.
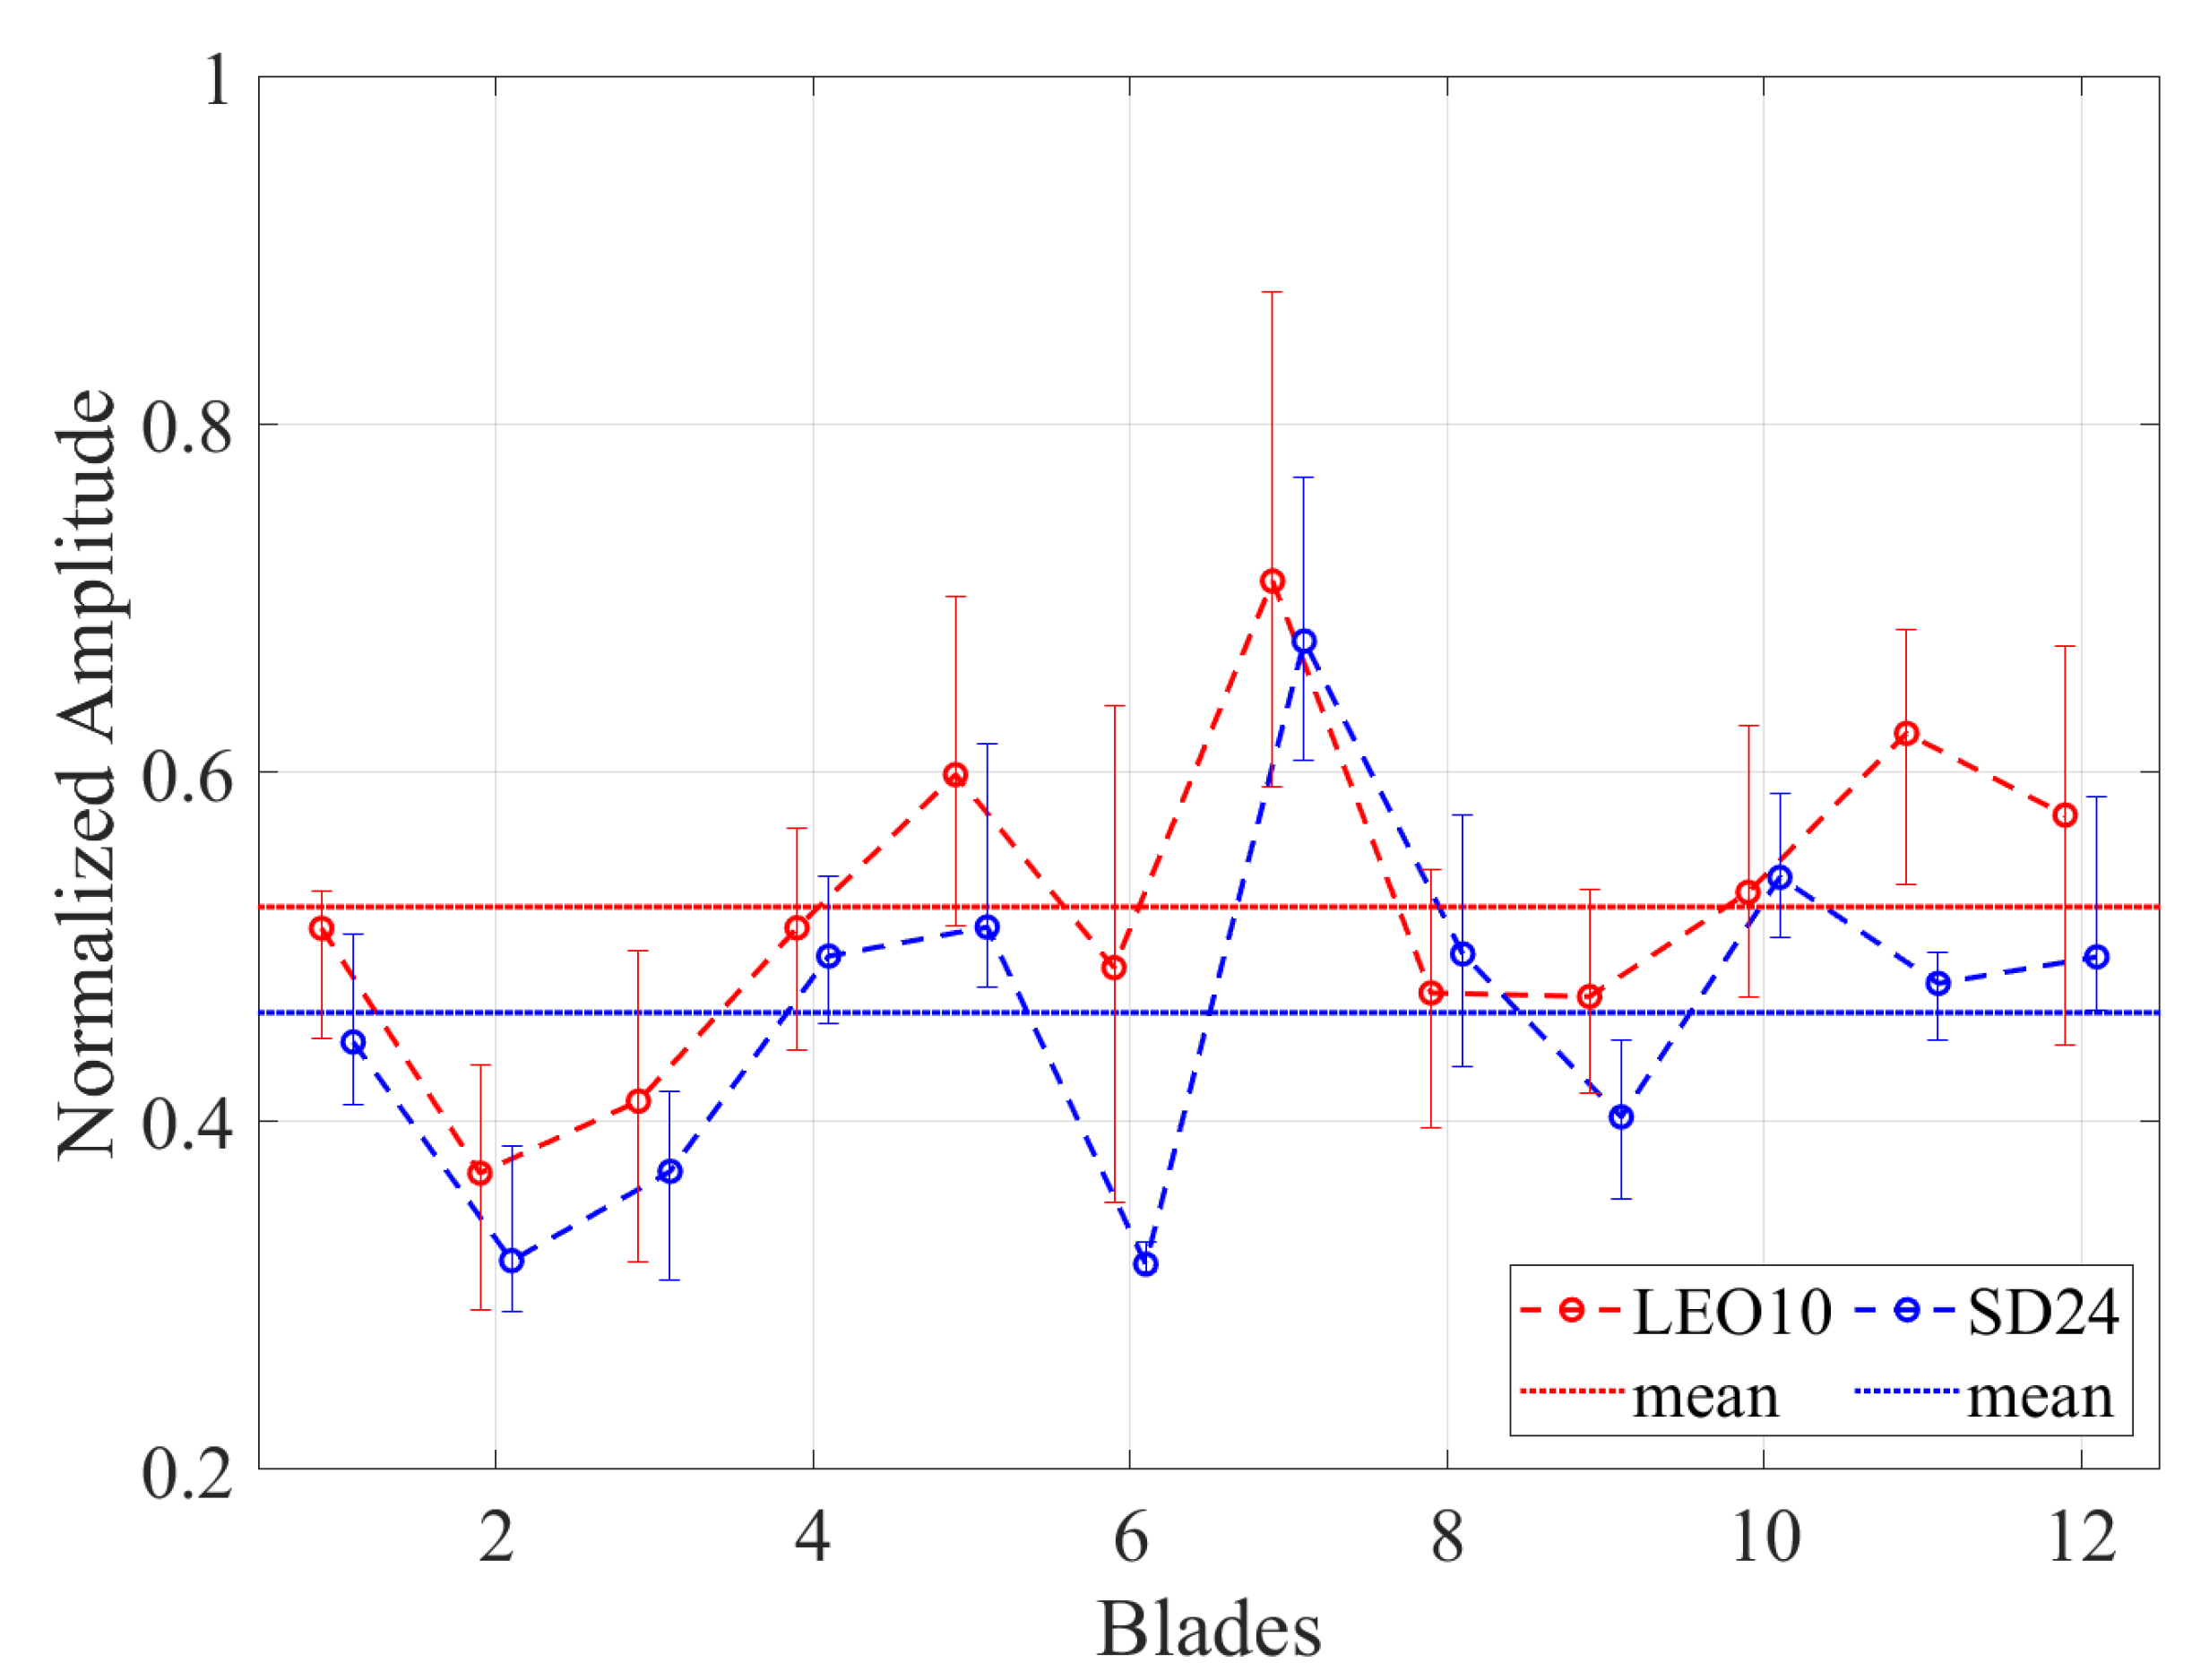
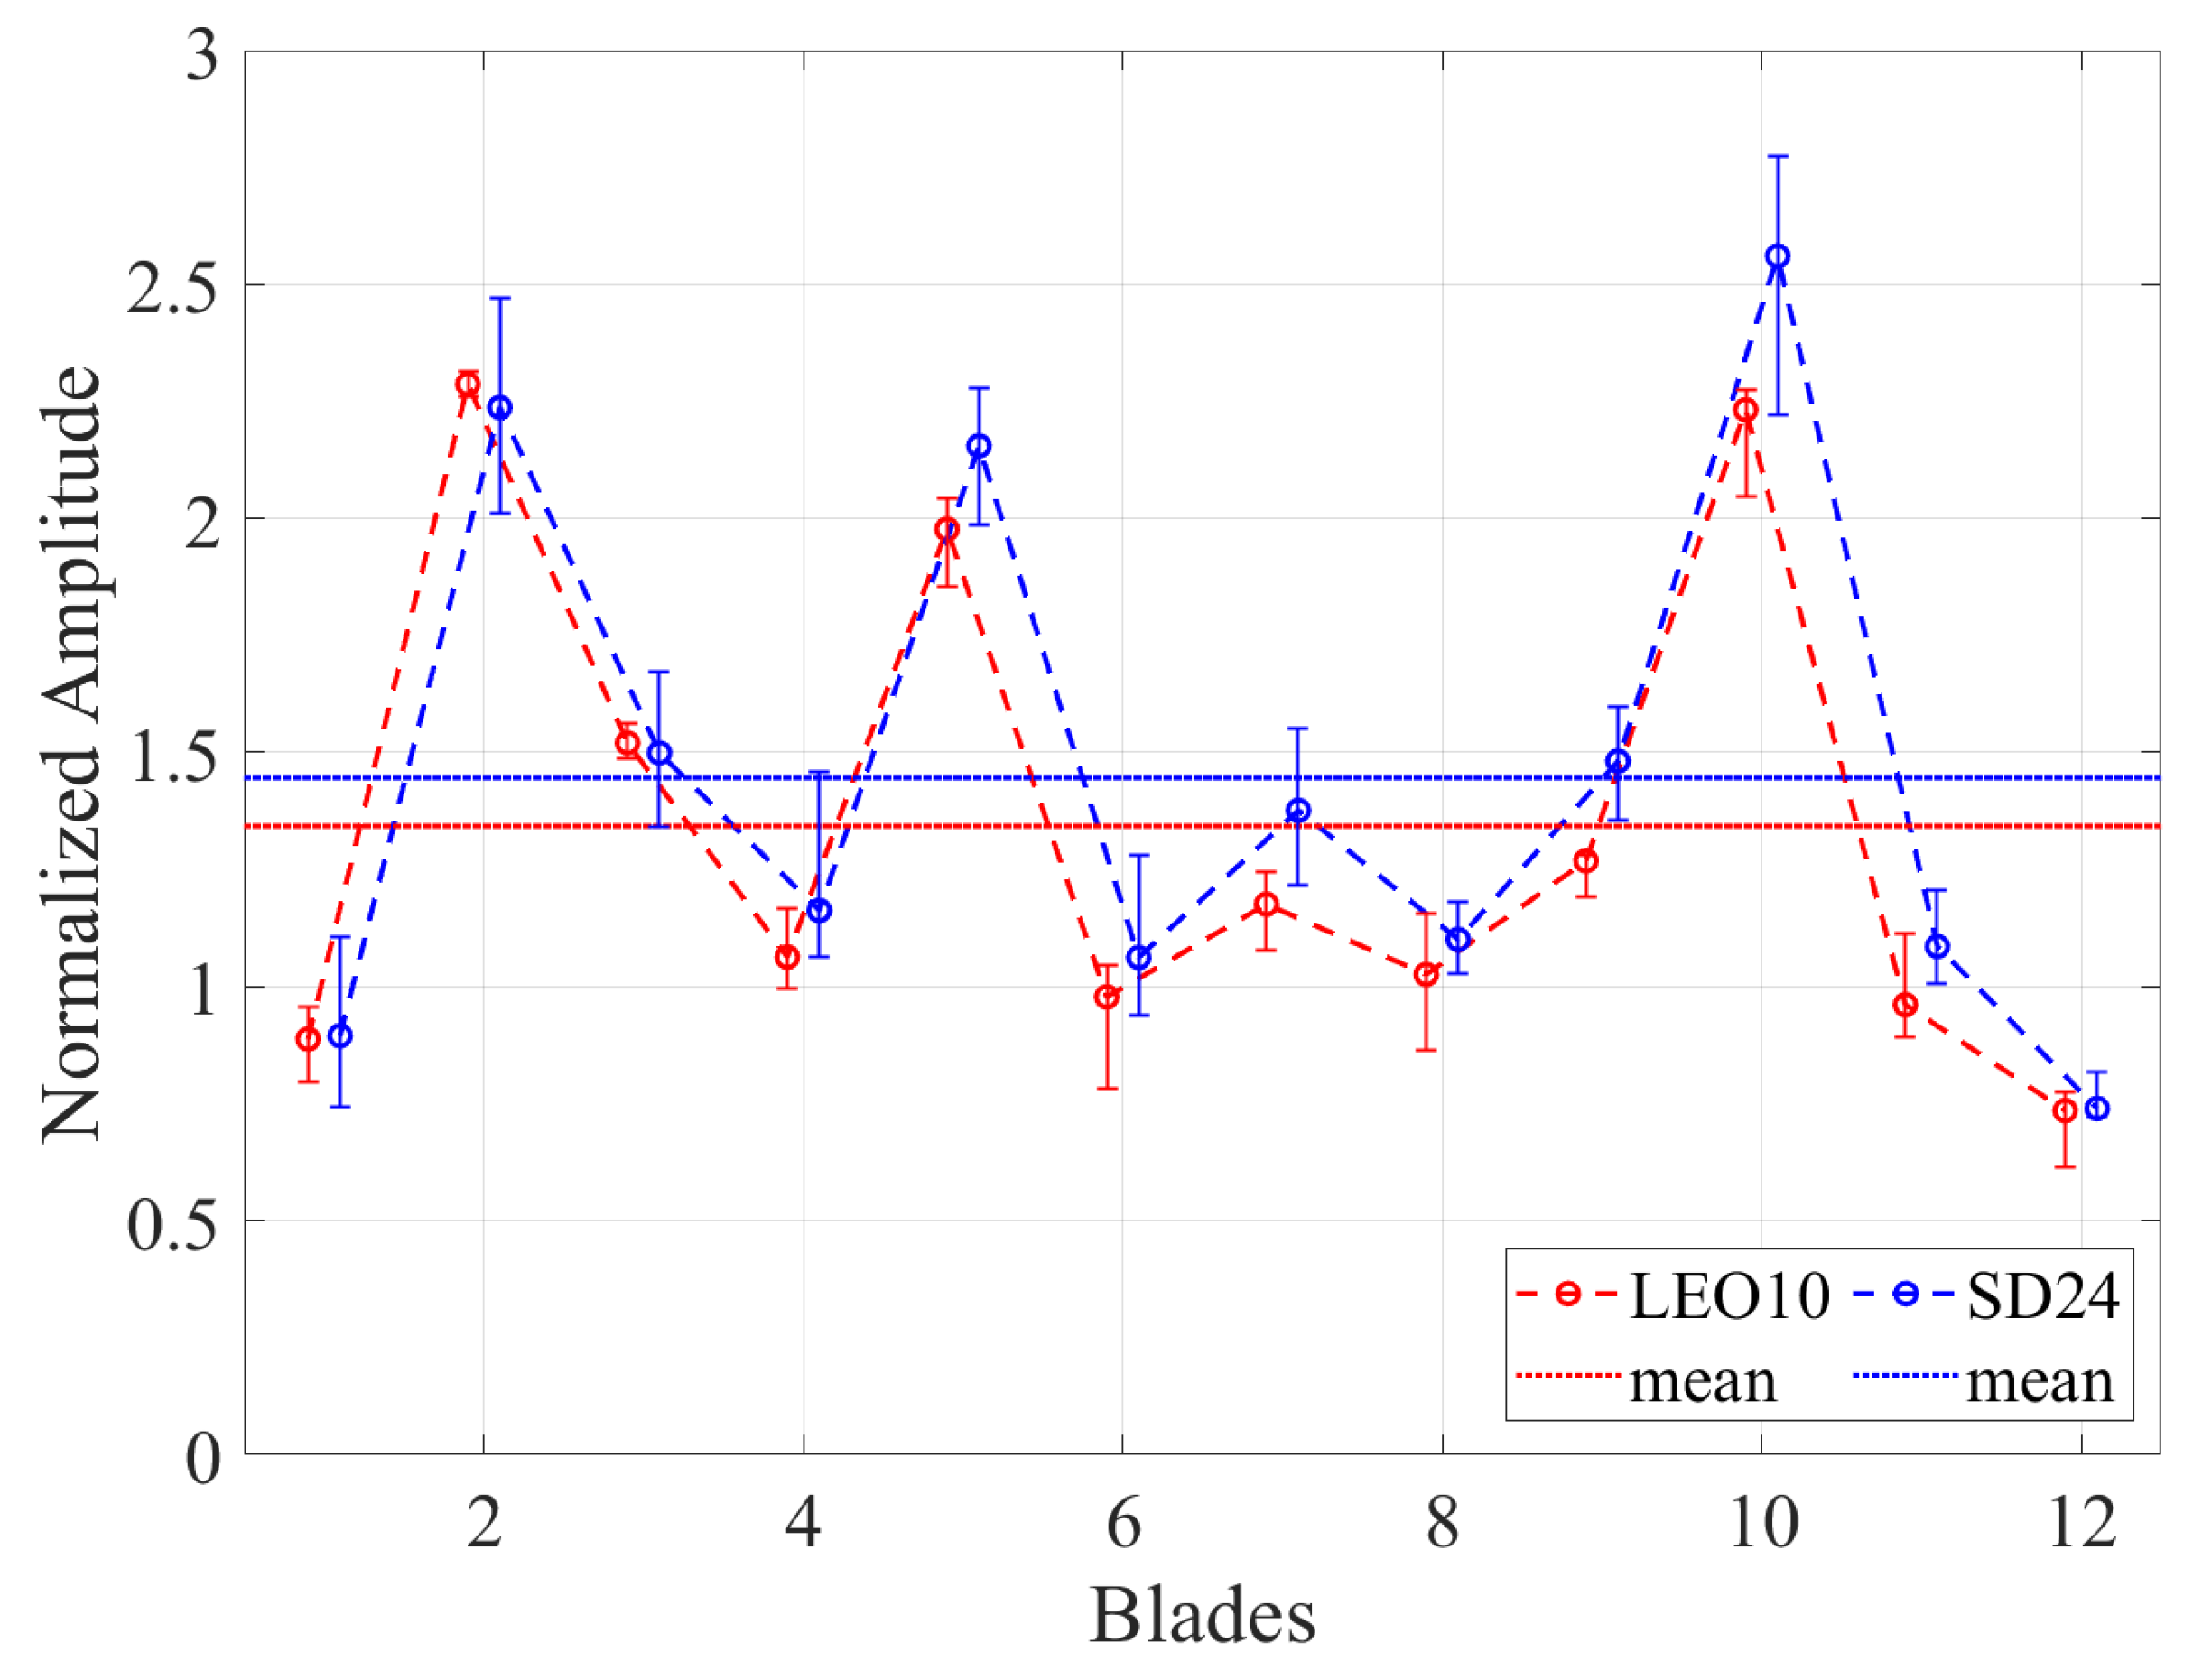
Given that LEO10 is intentionally mistuned to generate additional EOs, one would anticipate a potential weakening of the EO24 excitation, accompanied by lower magnitudes for the primarily induced vibrations. To investigate this assumption,
Figure 15 and
Figure 16 compare the amplitudes of EO24/BM4/ND0 and EO24/BM5/ND0, respectively, between LEO10 and SD24. In these figures, the median amplitude over all measurements is presented for each blade. The dotted lines demonstrate the mean normalized amplitude over all blades, while the variation range of the amplitudes between the different measurements are illustrated with error bars. Interestingly, the mistuned IGV does not appear to have a weakening impact on the EO24 vibrations, as no substantial difference is observed between the IGVs. The minor differences that are observed lie in the uncertainty region of BTT.
4.3. High EO IGV—DRH30 IGV
Campbell diagram
Figure 9 demonstrates the vibration measurements of DRH30. DRH30 induced three EO30 vibrations: EO30/BM3/ND6, EO30/BM5/ND6 and EO30/BM6/ND6. Additional high EO vibrations of EO28, EO29 and EO31 were generated. Yet, these vibrations have lower magnitudes than the primarily induced EO30.
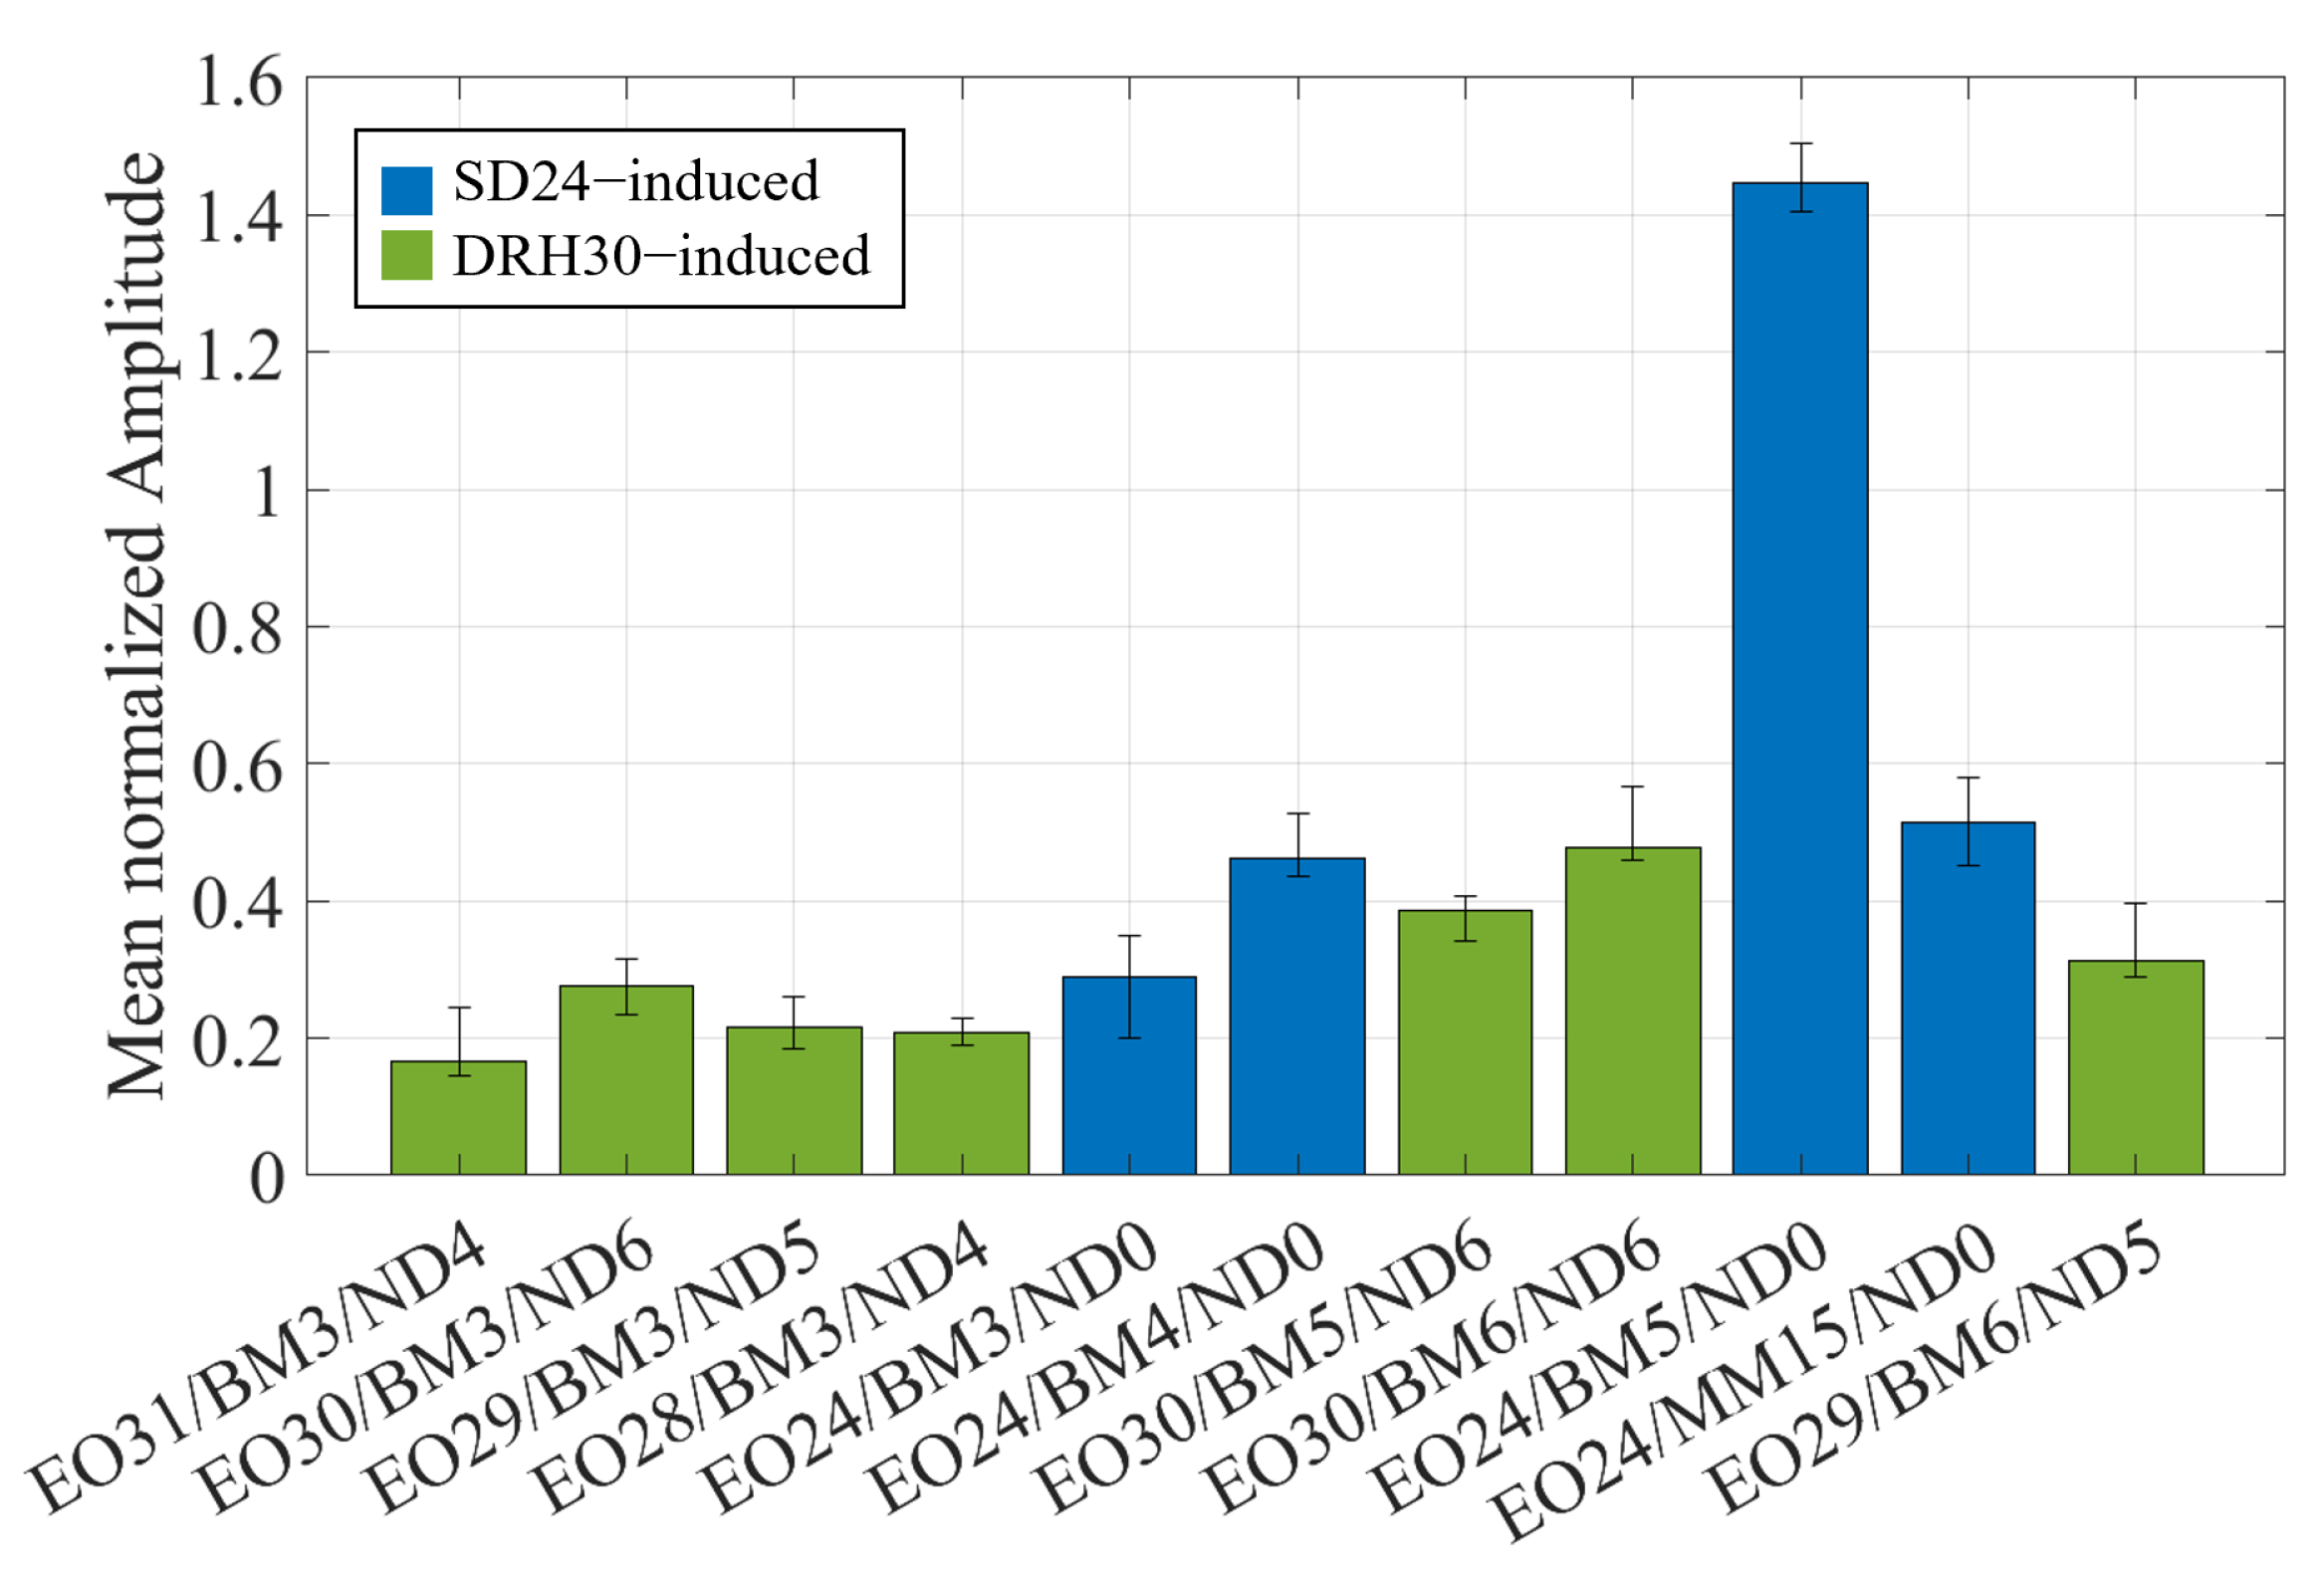
To determine the impact of DRH30 on the vibration behavior of the impeller, a comparison between the IGV-induced vibrations of DRH30 and SD24 is performed. For this reason,
Figure 17 depicts the mean normalized BTT amplitudes of the IGV-induced vibrations for both IGVs. The vibrations that occur exclusively with DRH30 are indicated in green color, with those of SD24 in blue color. Moreover, the vibrations are sorted in ascending speed. The variation range of the mean amplitude between the different measurements is illustrated with error bars. Obviously, the SD24-induced vibrations exhibit drastically higher amplitudes than the DRH30-induced vibrations. Remarkably, the magnitude of the largest SD24-induced vibration, EO24/BM5/ND0, is more than three times higher than the magnitude of the largest DRH30-induced vibration, EO30/BM6/ND6. Although a direct comparison between modes cannot be performed, both modes express their largest deflections at the trailing edge (
Figure 2). Therefore, the conclusion can be made that DRH30 induces vibrations with significantly lower amplitudes compared to SD24.
A direct comparison between ND6 and ND0 can be performed for BM5. The amplitude of EO30/BM5/ND6 is approx.
lower than the amplitude of EO24/BM5/ND0. The amplitude curve of the blades over the speed is presented in a stack plot diagram in
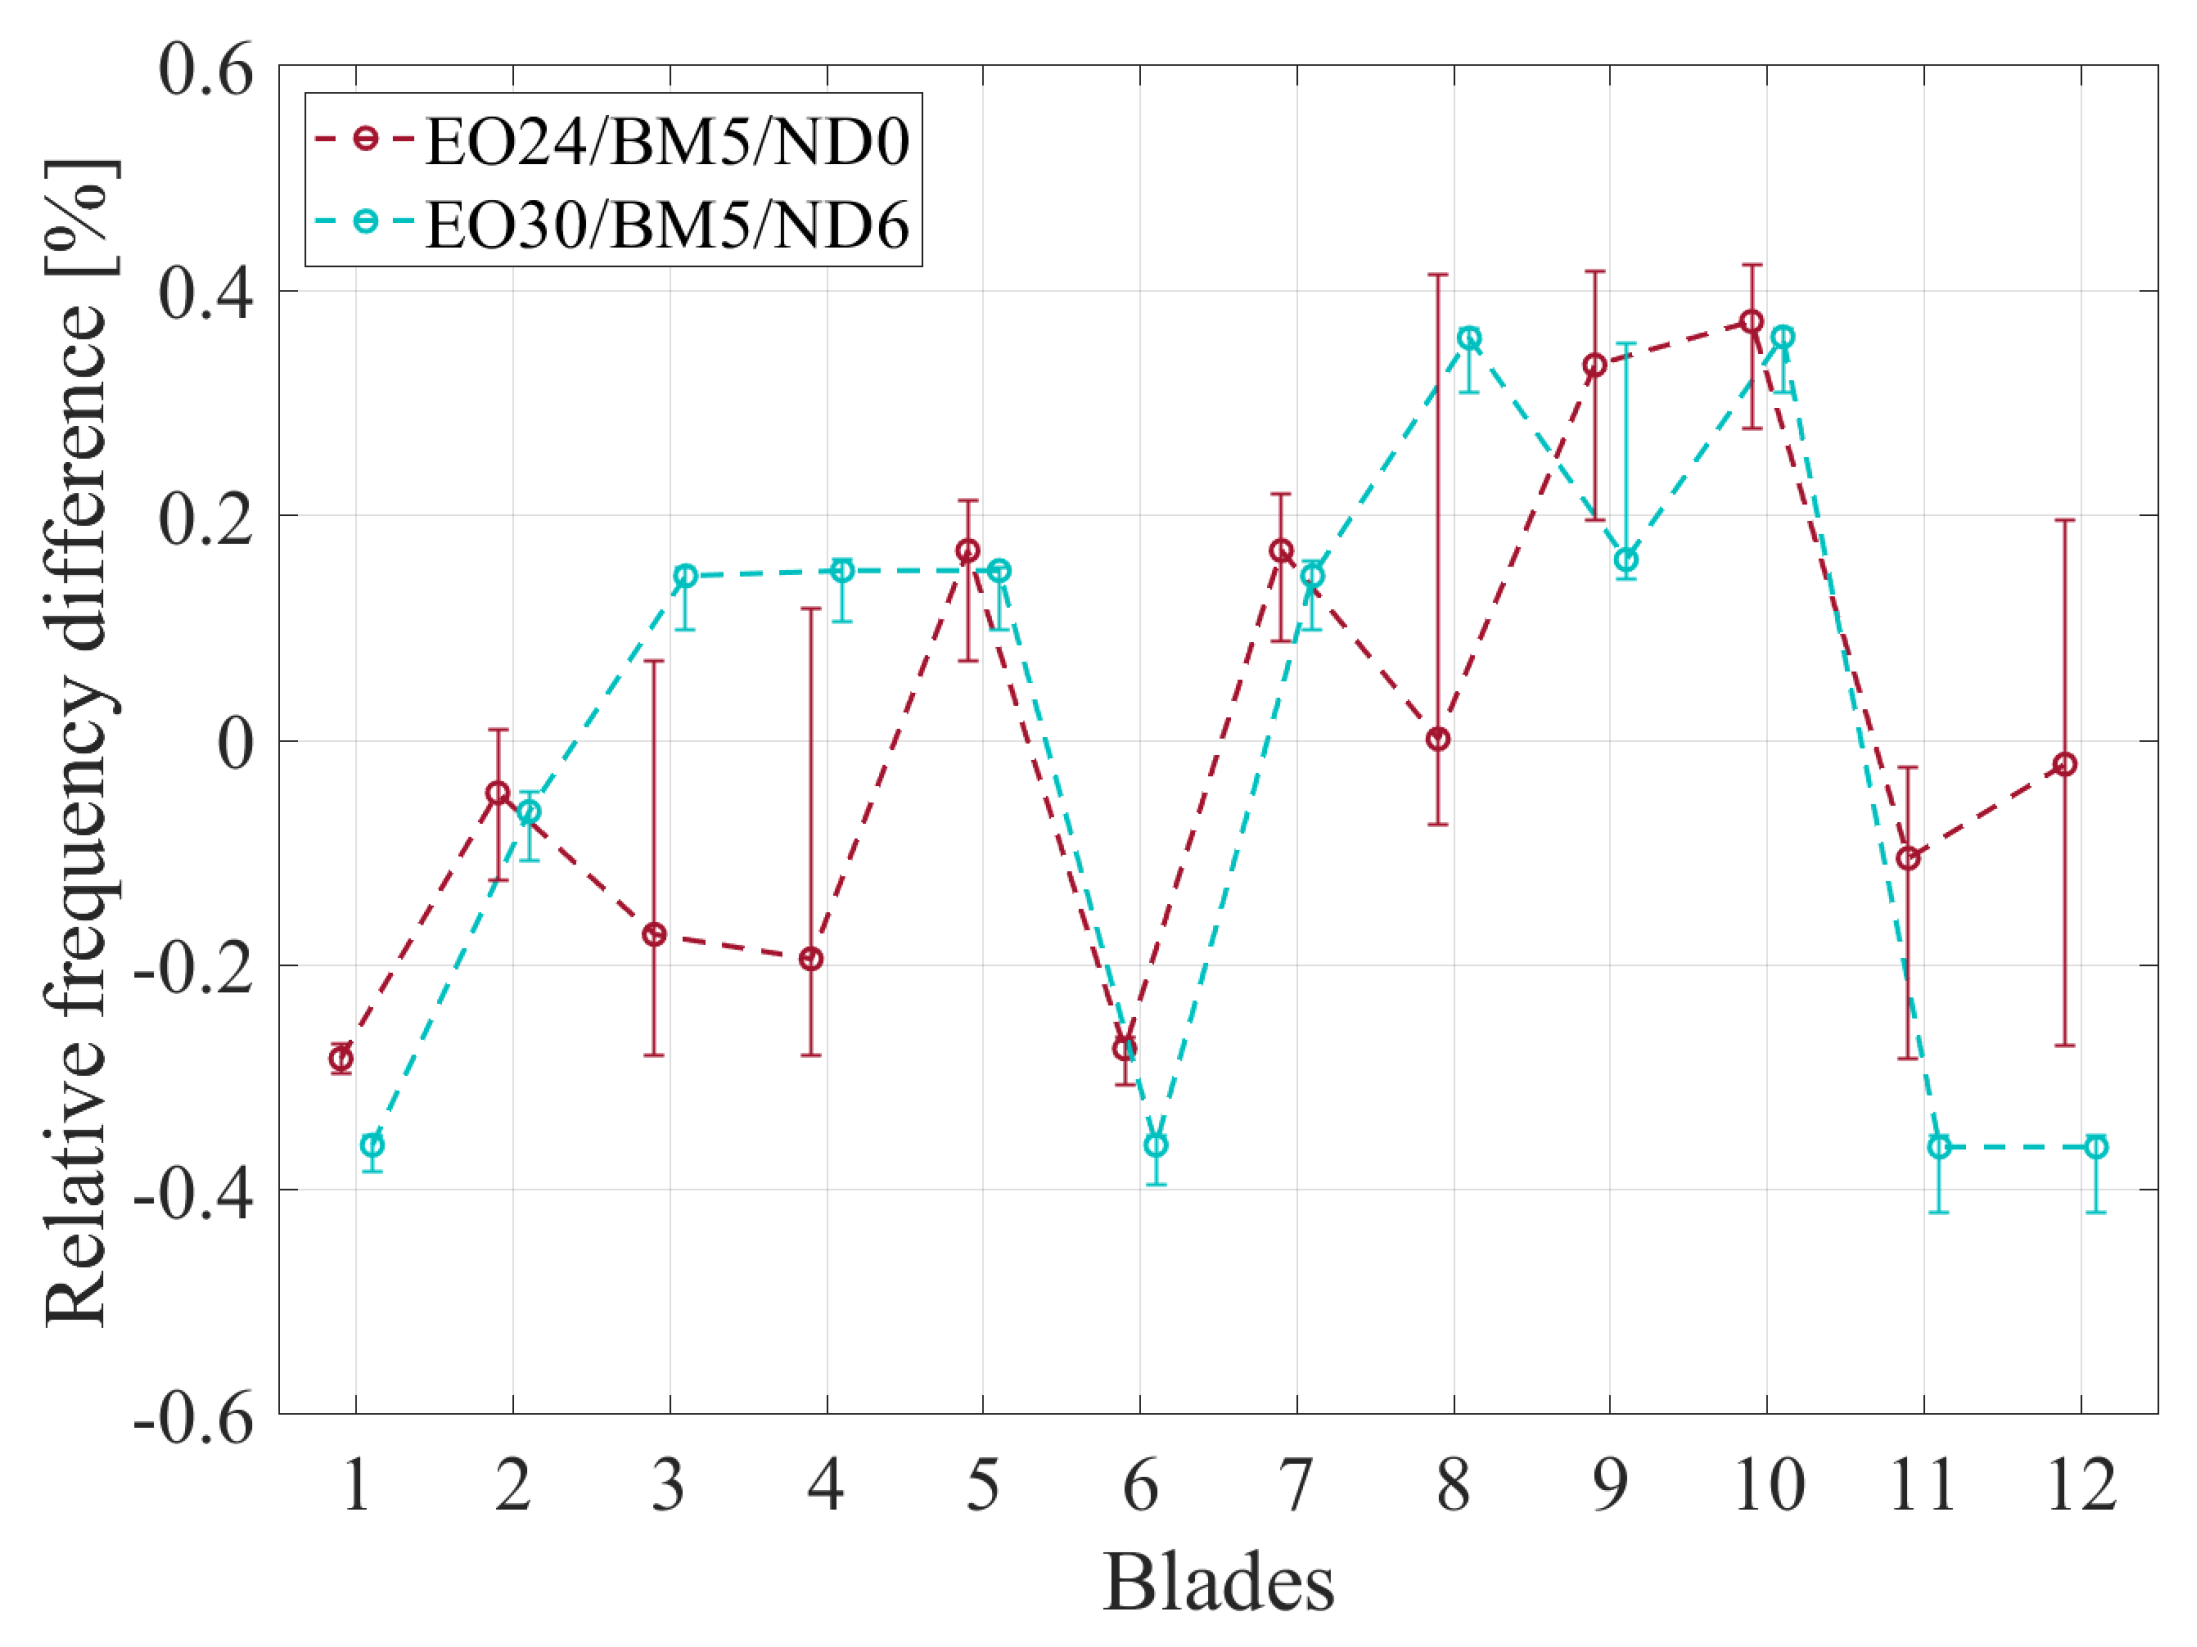
Figure 14. The green line depicts the amplitude of EO24/BM5/ND0, while the yellow line illustrates the amplitude of EO30/BM5/ND6. The error term is indicated by the red line. To ensure comparability between the normalized amplitudes, the scale of each vibration is presented at the bottom of the diagram. Although a significant magnitude difference is observed, both vibrations show a similar trend over the speed. Particularly, multiple amplitude peaks over the rotating speed are apparent in a similar manner for both vibrations, indicating that minor deviations occur between the mistuning of these vibrations. This observation is confirmed through
Figure 18 and
Figure 19, which present the frequency and amplitude deviation in the blades relative to the mean value over all blades for both vibrations, respectively. A strong correlation between the two vibrations is apparent for both the frequency and amplitude difference. Some blades of EO24/BM5/ND0 exhibit high frequency variation, which can be attributed to several peaks of equally high amplitude, as explained in
Section 4.1. Considering the amplitude difference, a similar trend can be observed between both vibrations with substantial deviations only at blade 2 and 12.
Interestingly, similar to SD24 and LEO10, several vibrations of various EOs were recorded. This demonstrates that these synchronous vibrations occur independently from the IGV, signifying an external excitation mechanism. Here, it is important to note that the magnitudes of these IGV-independent vibration are significantly higher than those of the DRH30-induced vibrations. Thus, excitation sources other than the IGV can induce major synchronous vibrations on the impeller. These IGV-independent vibrations are examined in the following section.
4.4. IGV-Independent Synchronous Vibrations
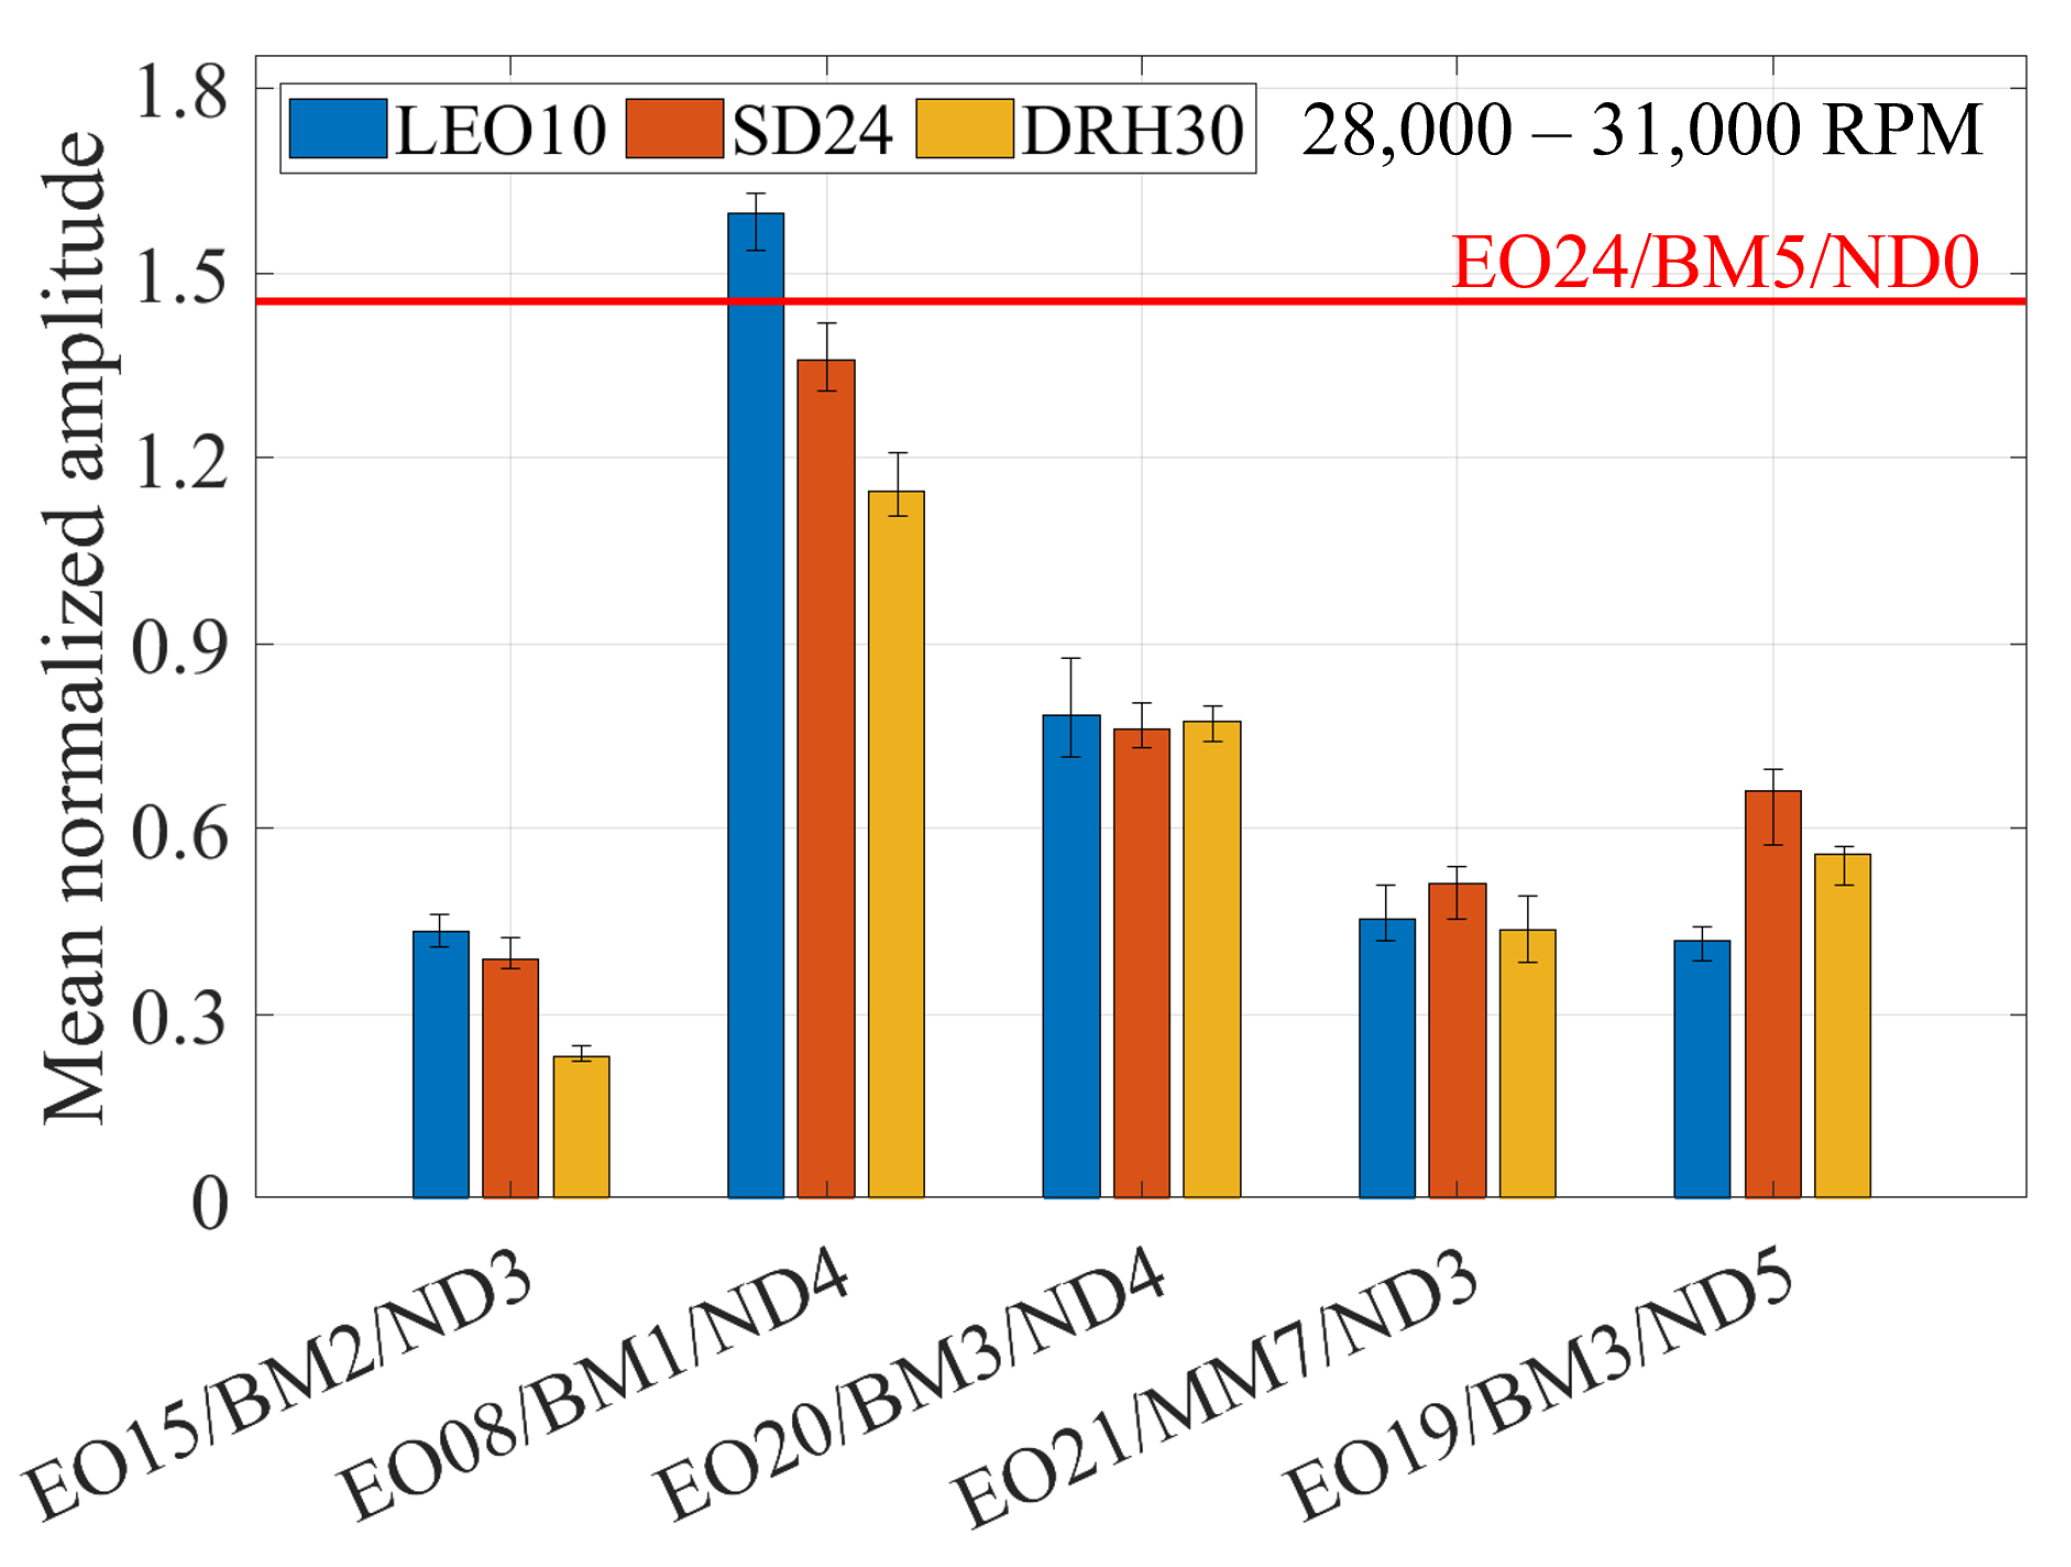
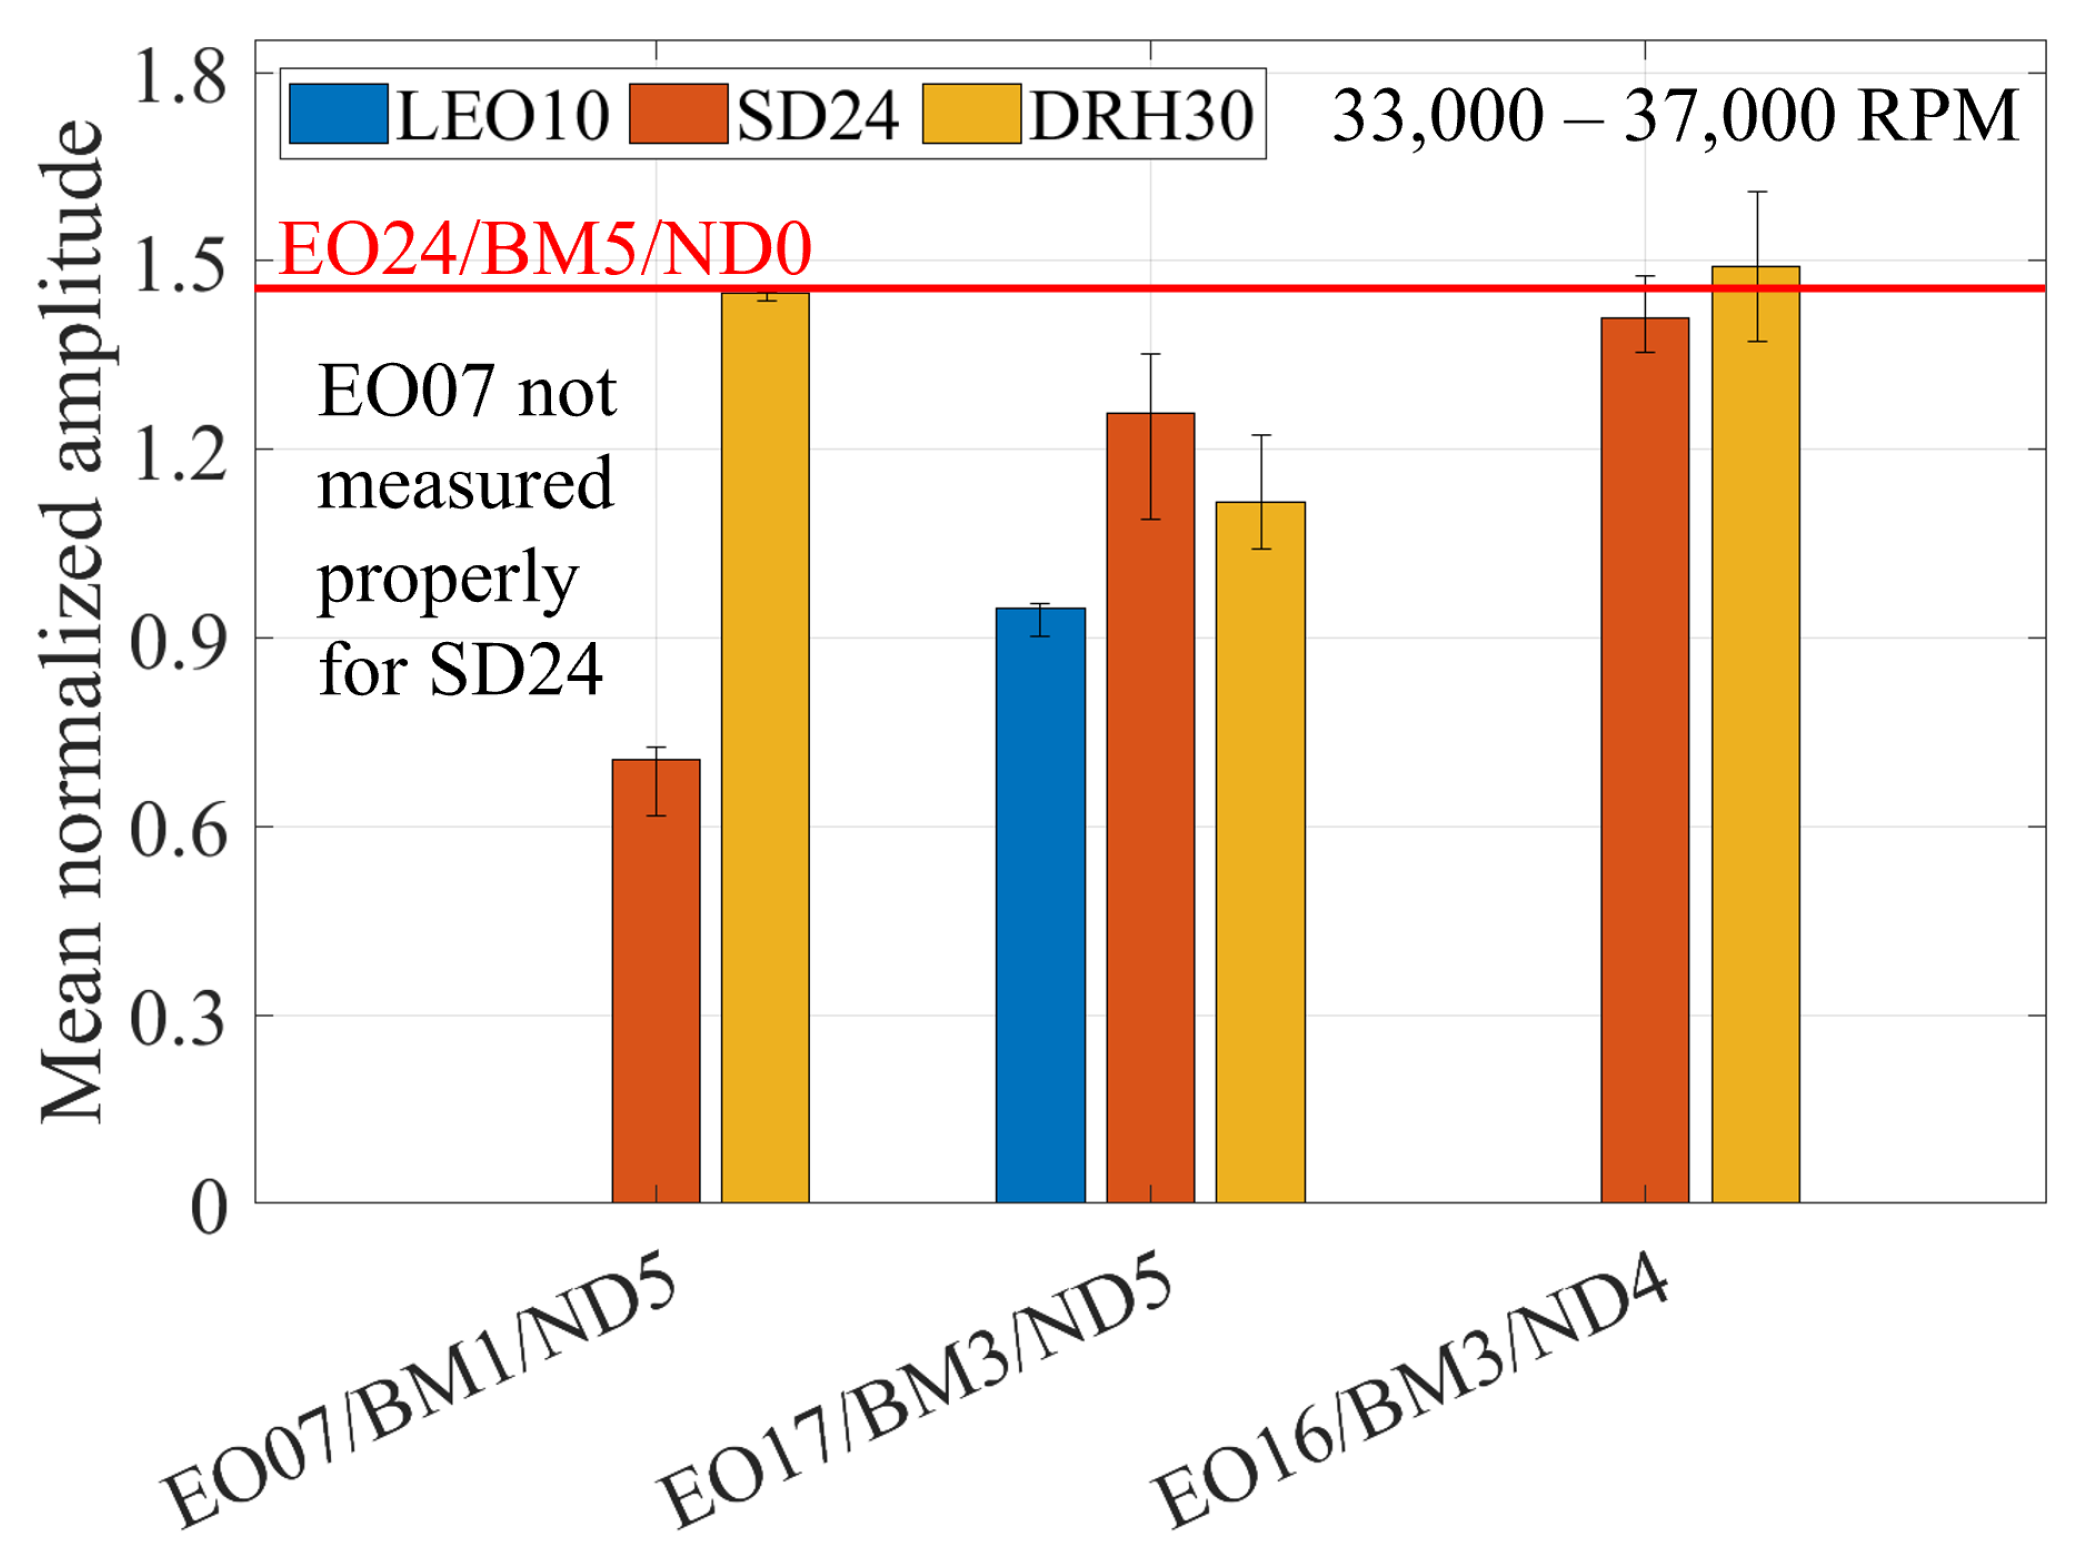
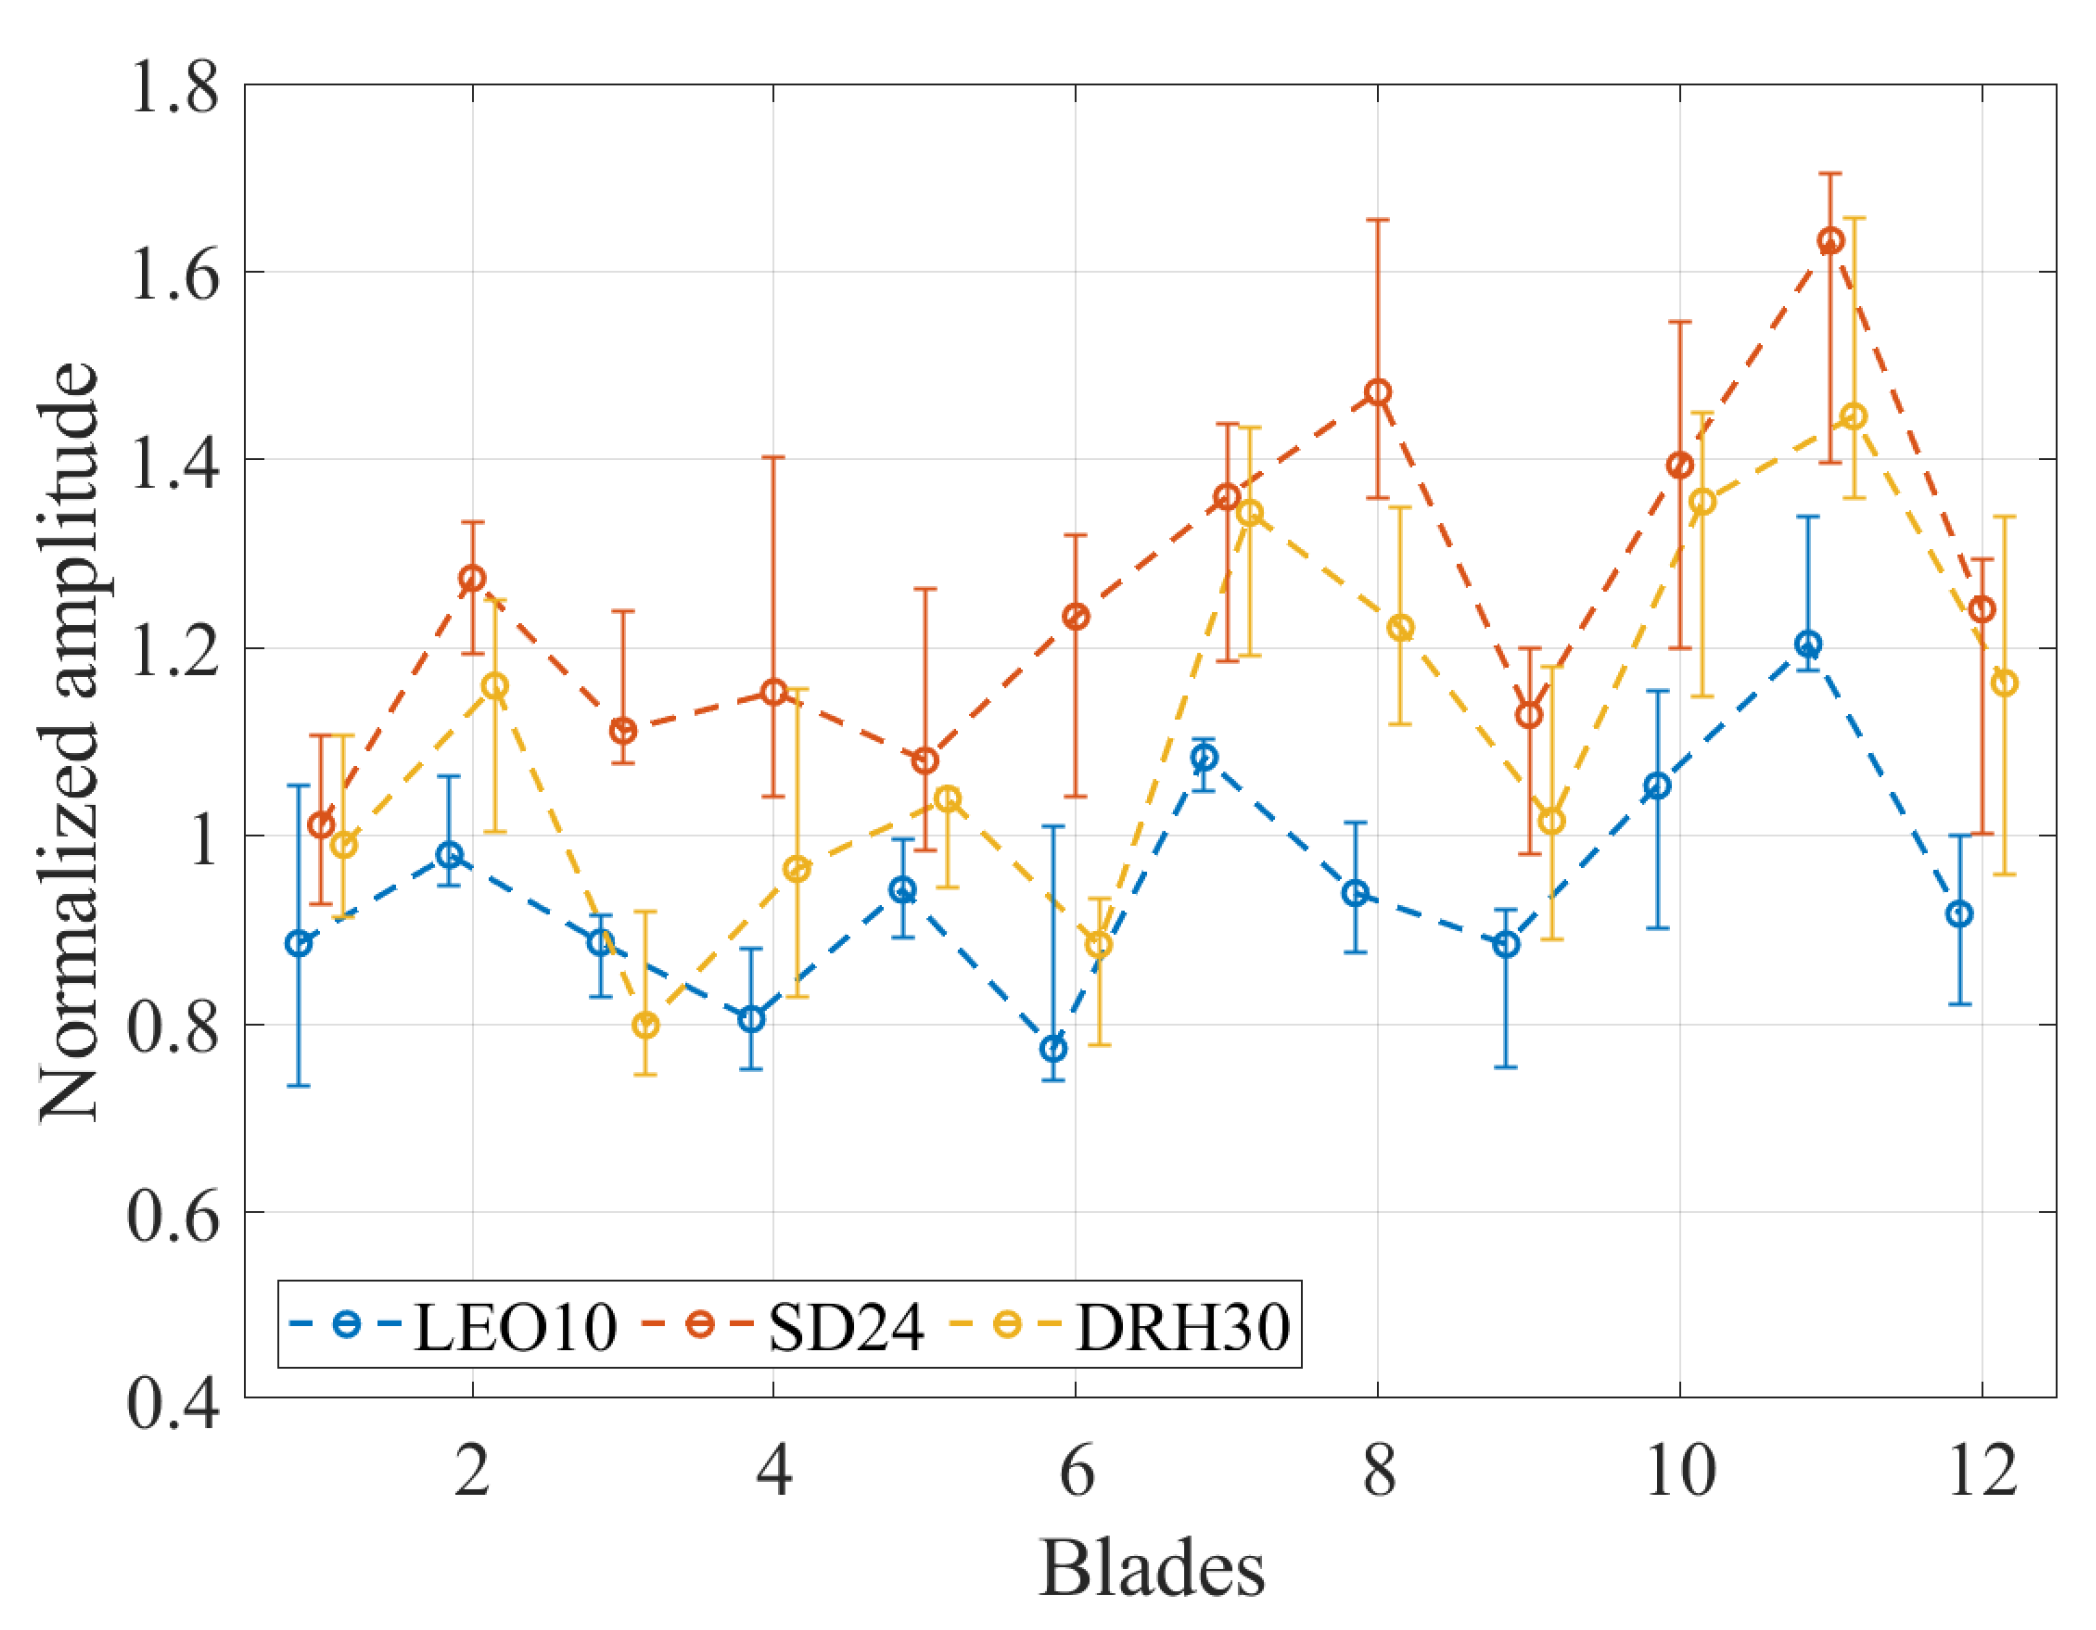
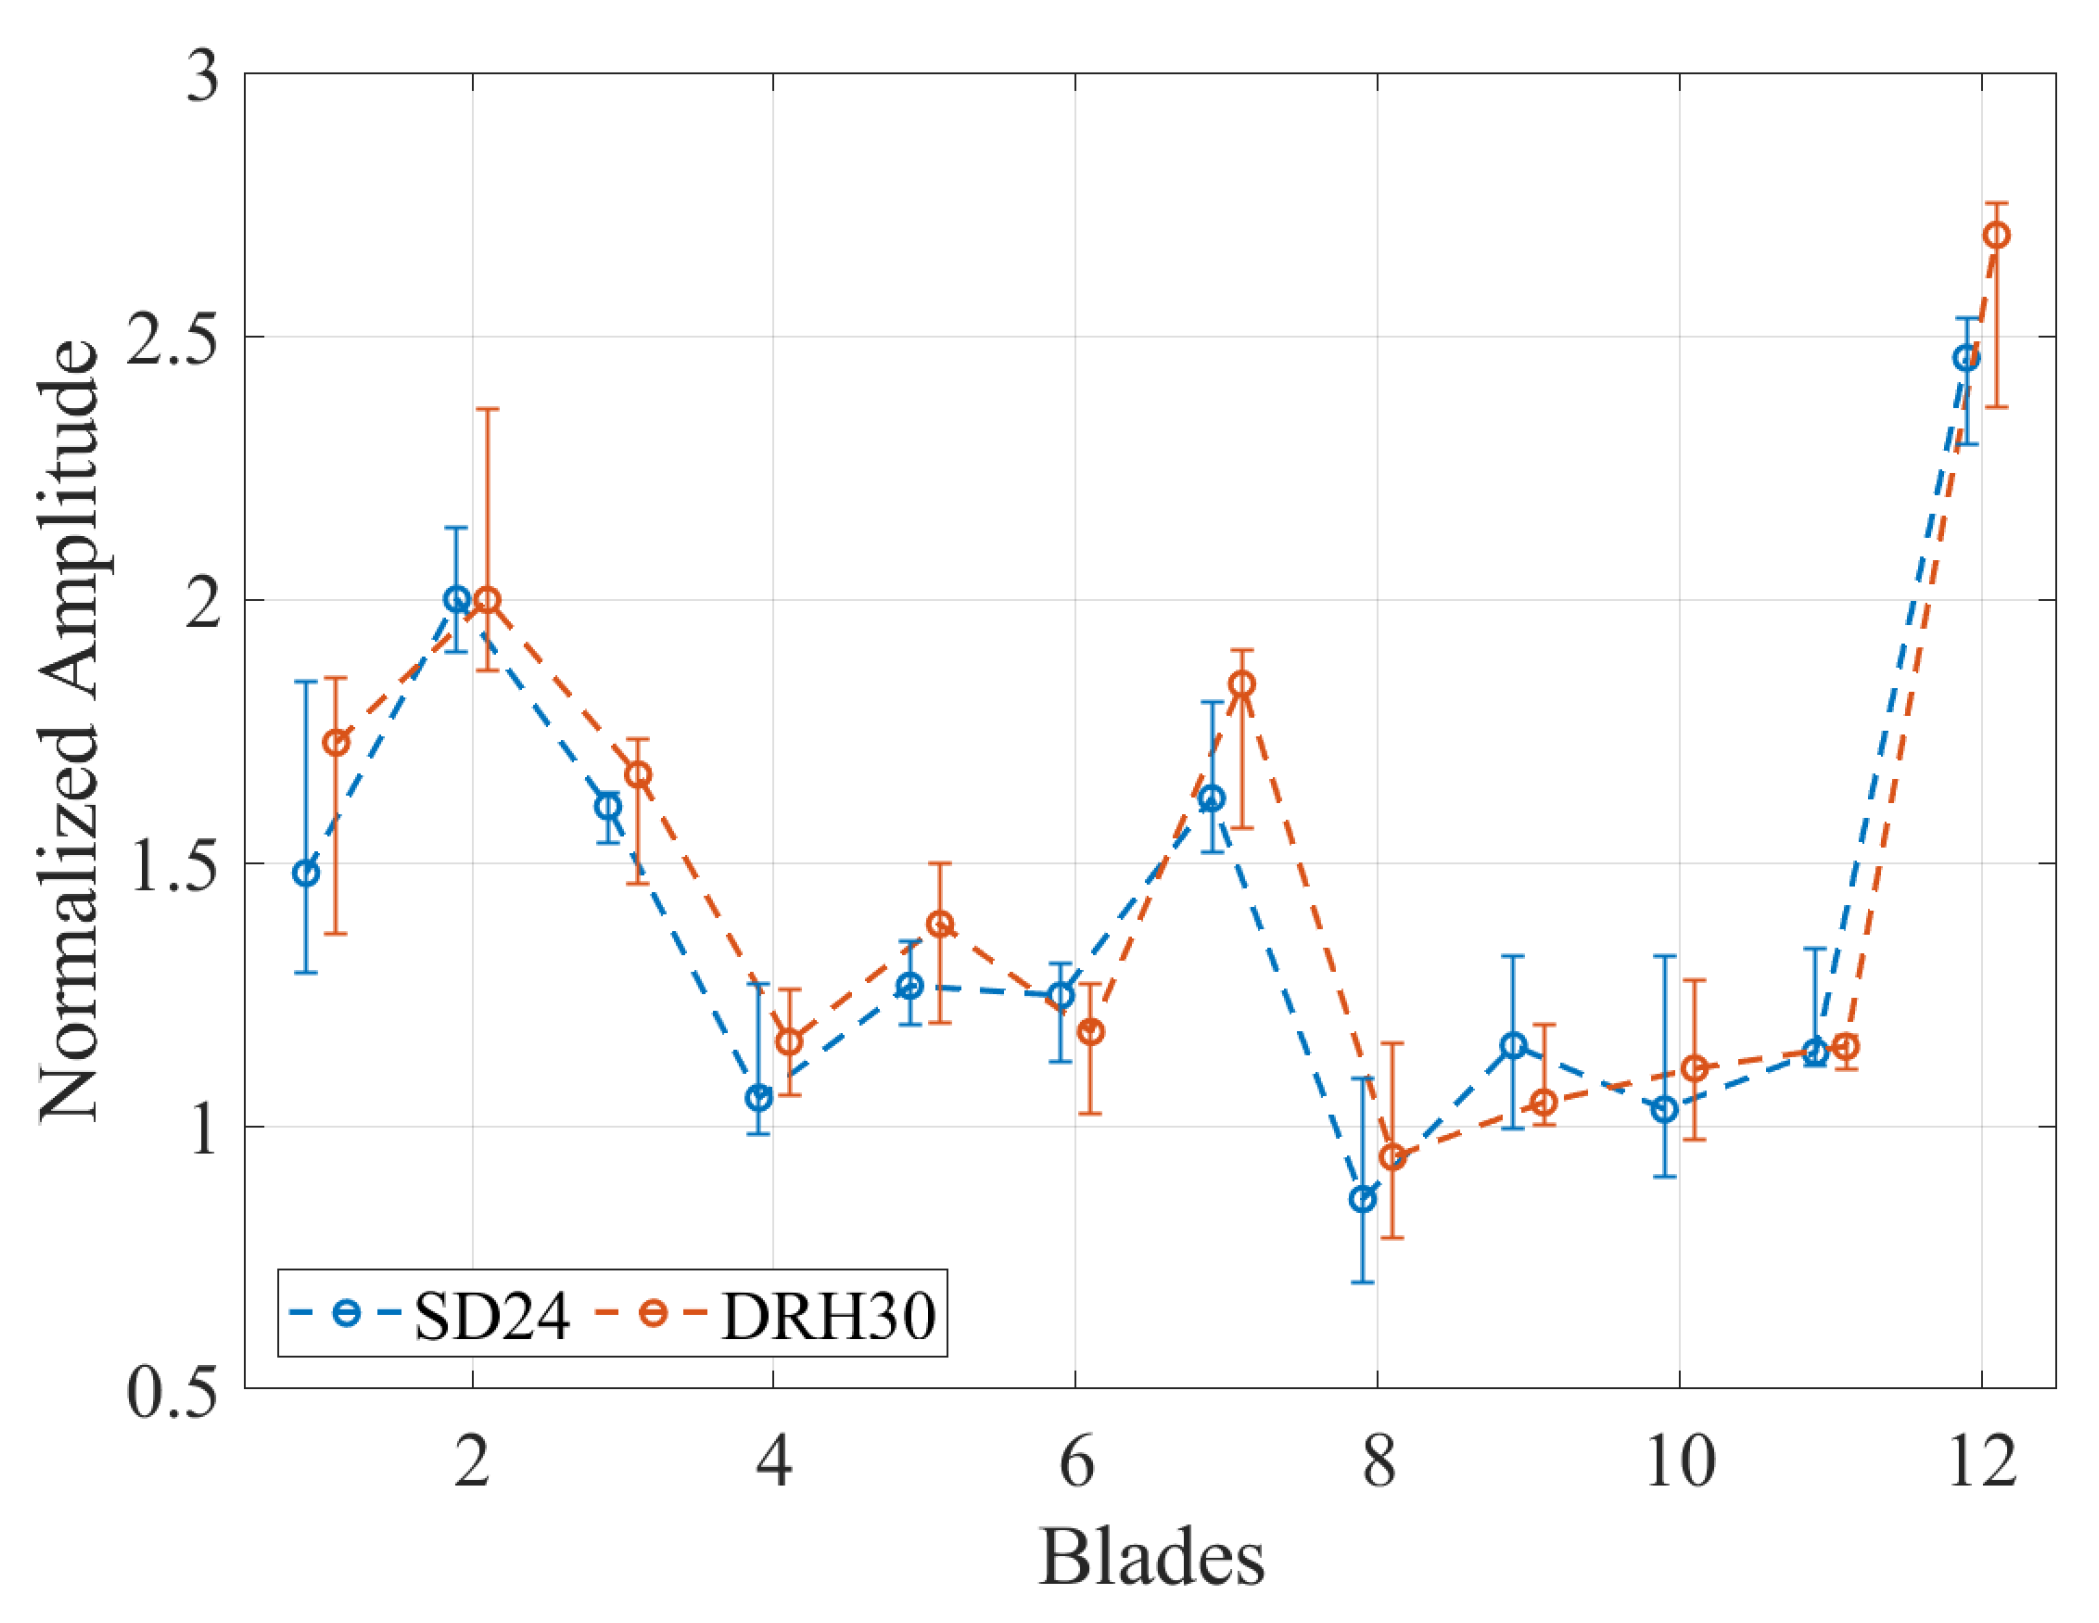
In this section, the IGV-independent vibrations are thoroughly examined in an attempt to evaluate their impact on the vibration behavior of the impeller and subsequently identify their excitation mechanisms. To demonstrate the minor effect of the IGV on these vibrations, a comparison of the IGV-independent vibrations between the IGV configurations is presented. The mean normalized amplitudes of the IGV-independent vibrations are depicted in
Figure 20 and
Figure 21, while
Figure 22 and
Figure 23 present the normalized blade amplitude exemplarily for EO17/BM3/ND5 and EO16/BM3/ND4.
Evidently, the IGV has a limited influence on these vibrations. Small differences between the amplitudes are observed. The differences can be attributed to slight variations in the turbocharger operating conditions and in the speed ramp gradients, since the tests of each IGV were performed on a different day. Moreover, the amplitude trend over the blades is identical for all IGV configurations.
To highlight the influence that these vibration can have on the service life of the impeller, the magnitude of the largest IGV-induced vibration (EO24/BM5/ND0) is depicted on the diagrams through a red line. Remarkably, the BTT magnitude of EO08/BM1/ND4, EO07/BM1/ND5, EO17/BM3/ND5 and EO16/BM3/ND4 is comparable to EO24/BM5/ND0. Additionally, as indicated in
Figure 22 and
Figure 23, the amplitudes of individual blades are dramatically higher than the mean values. Hence, it is crucial to identify the excitation mechanism of these vibrations so that their potential occurrence is considered at the design phase of the impeller.
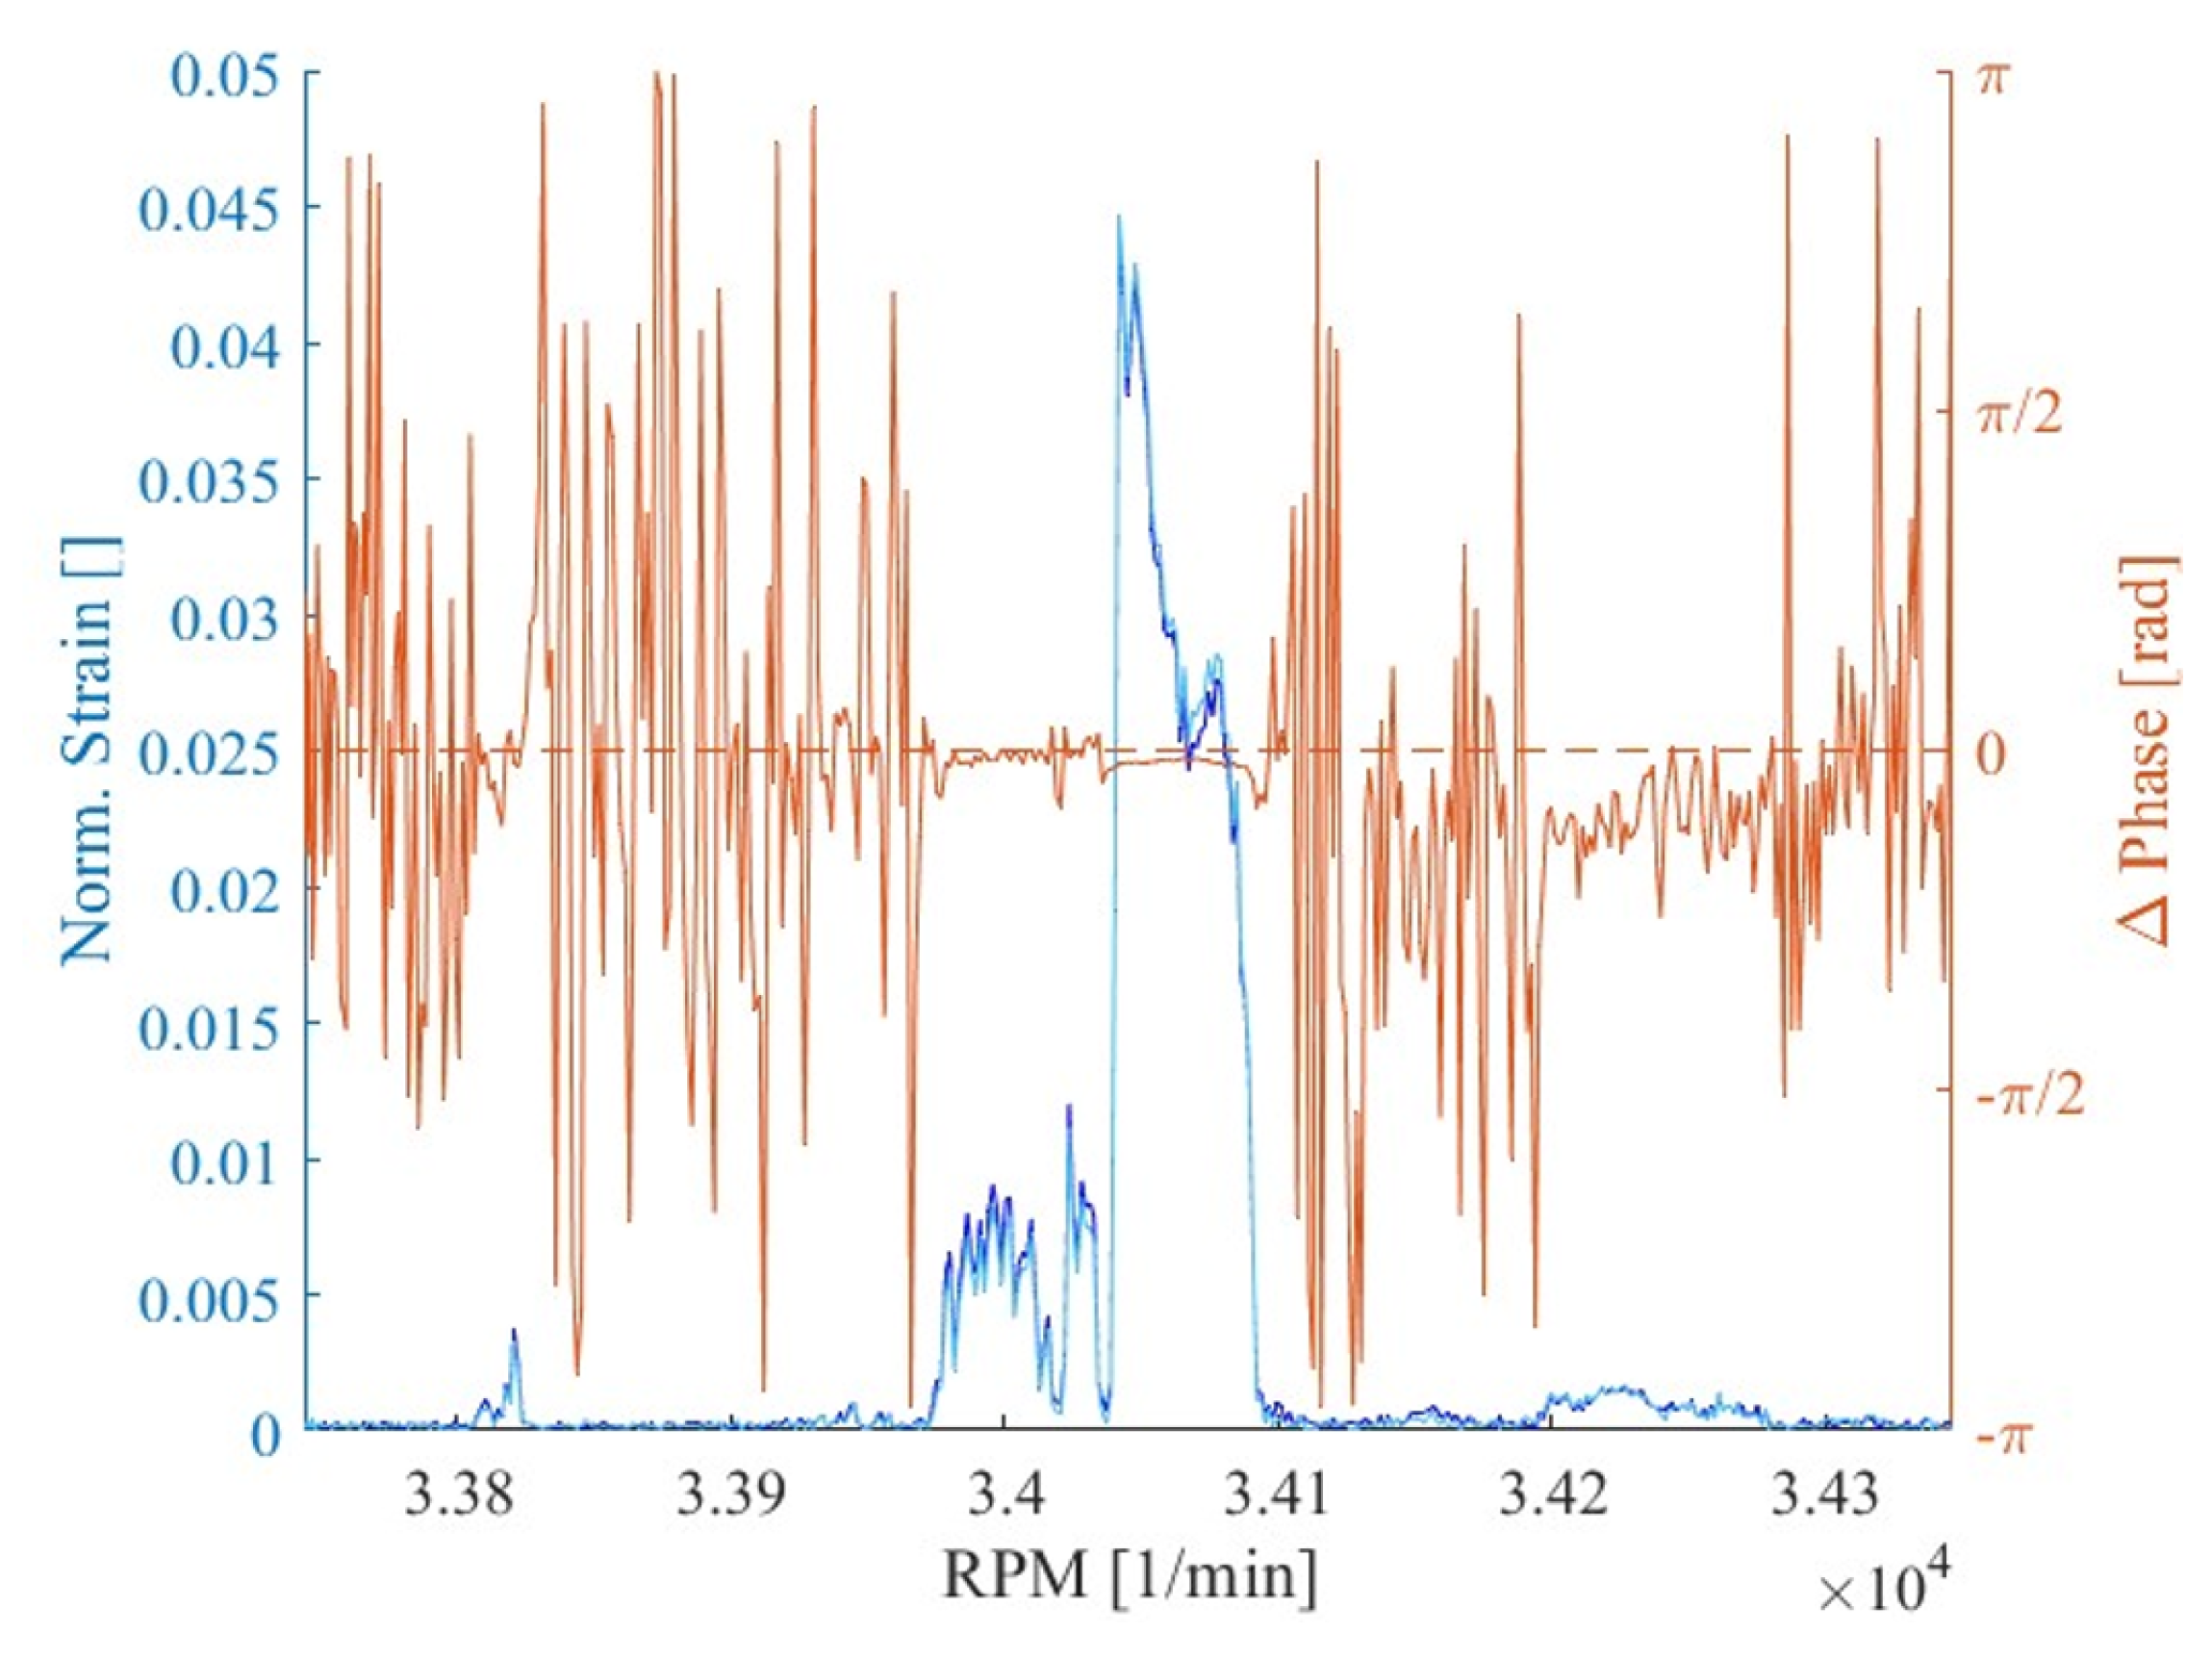
For the recorded EO17 and EO16 vibrations, it is assumed that the non-uniform pressure field of the turbocharger compressor is likely to be the excitation source, as the compressor has a diffuser with 17 vanes. This hypothesis is supported by the SG on the shaft, which have captured vibrations equal to these EOs during the occurrence of EO17/BM3/ND5 and EO16/BM3/ND4. The shaft vibrations of EO17 are exemplarily illustrated in
Figure 24. The measured strain of both shaft SG along with the phase difference between them is presented. Evidently, EO17/BM3/ND5 is accompanied by high strain amplitudes at the shaft. Moreover, the phase difference between the strain signals is equal to zero during the resonance, implying the occurrence of torsional shaft vibrations. These results seem to contradict the statements of Klaus [
6] for mistuned impellers, as vibrations higher than ND1 can be transmitted to the shaft.
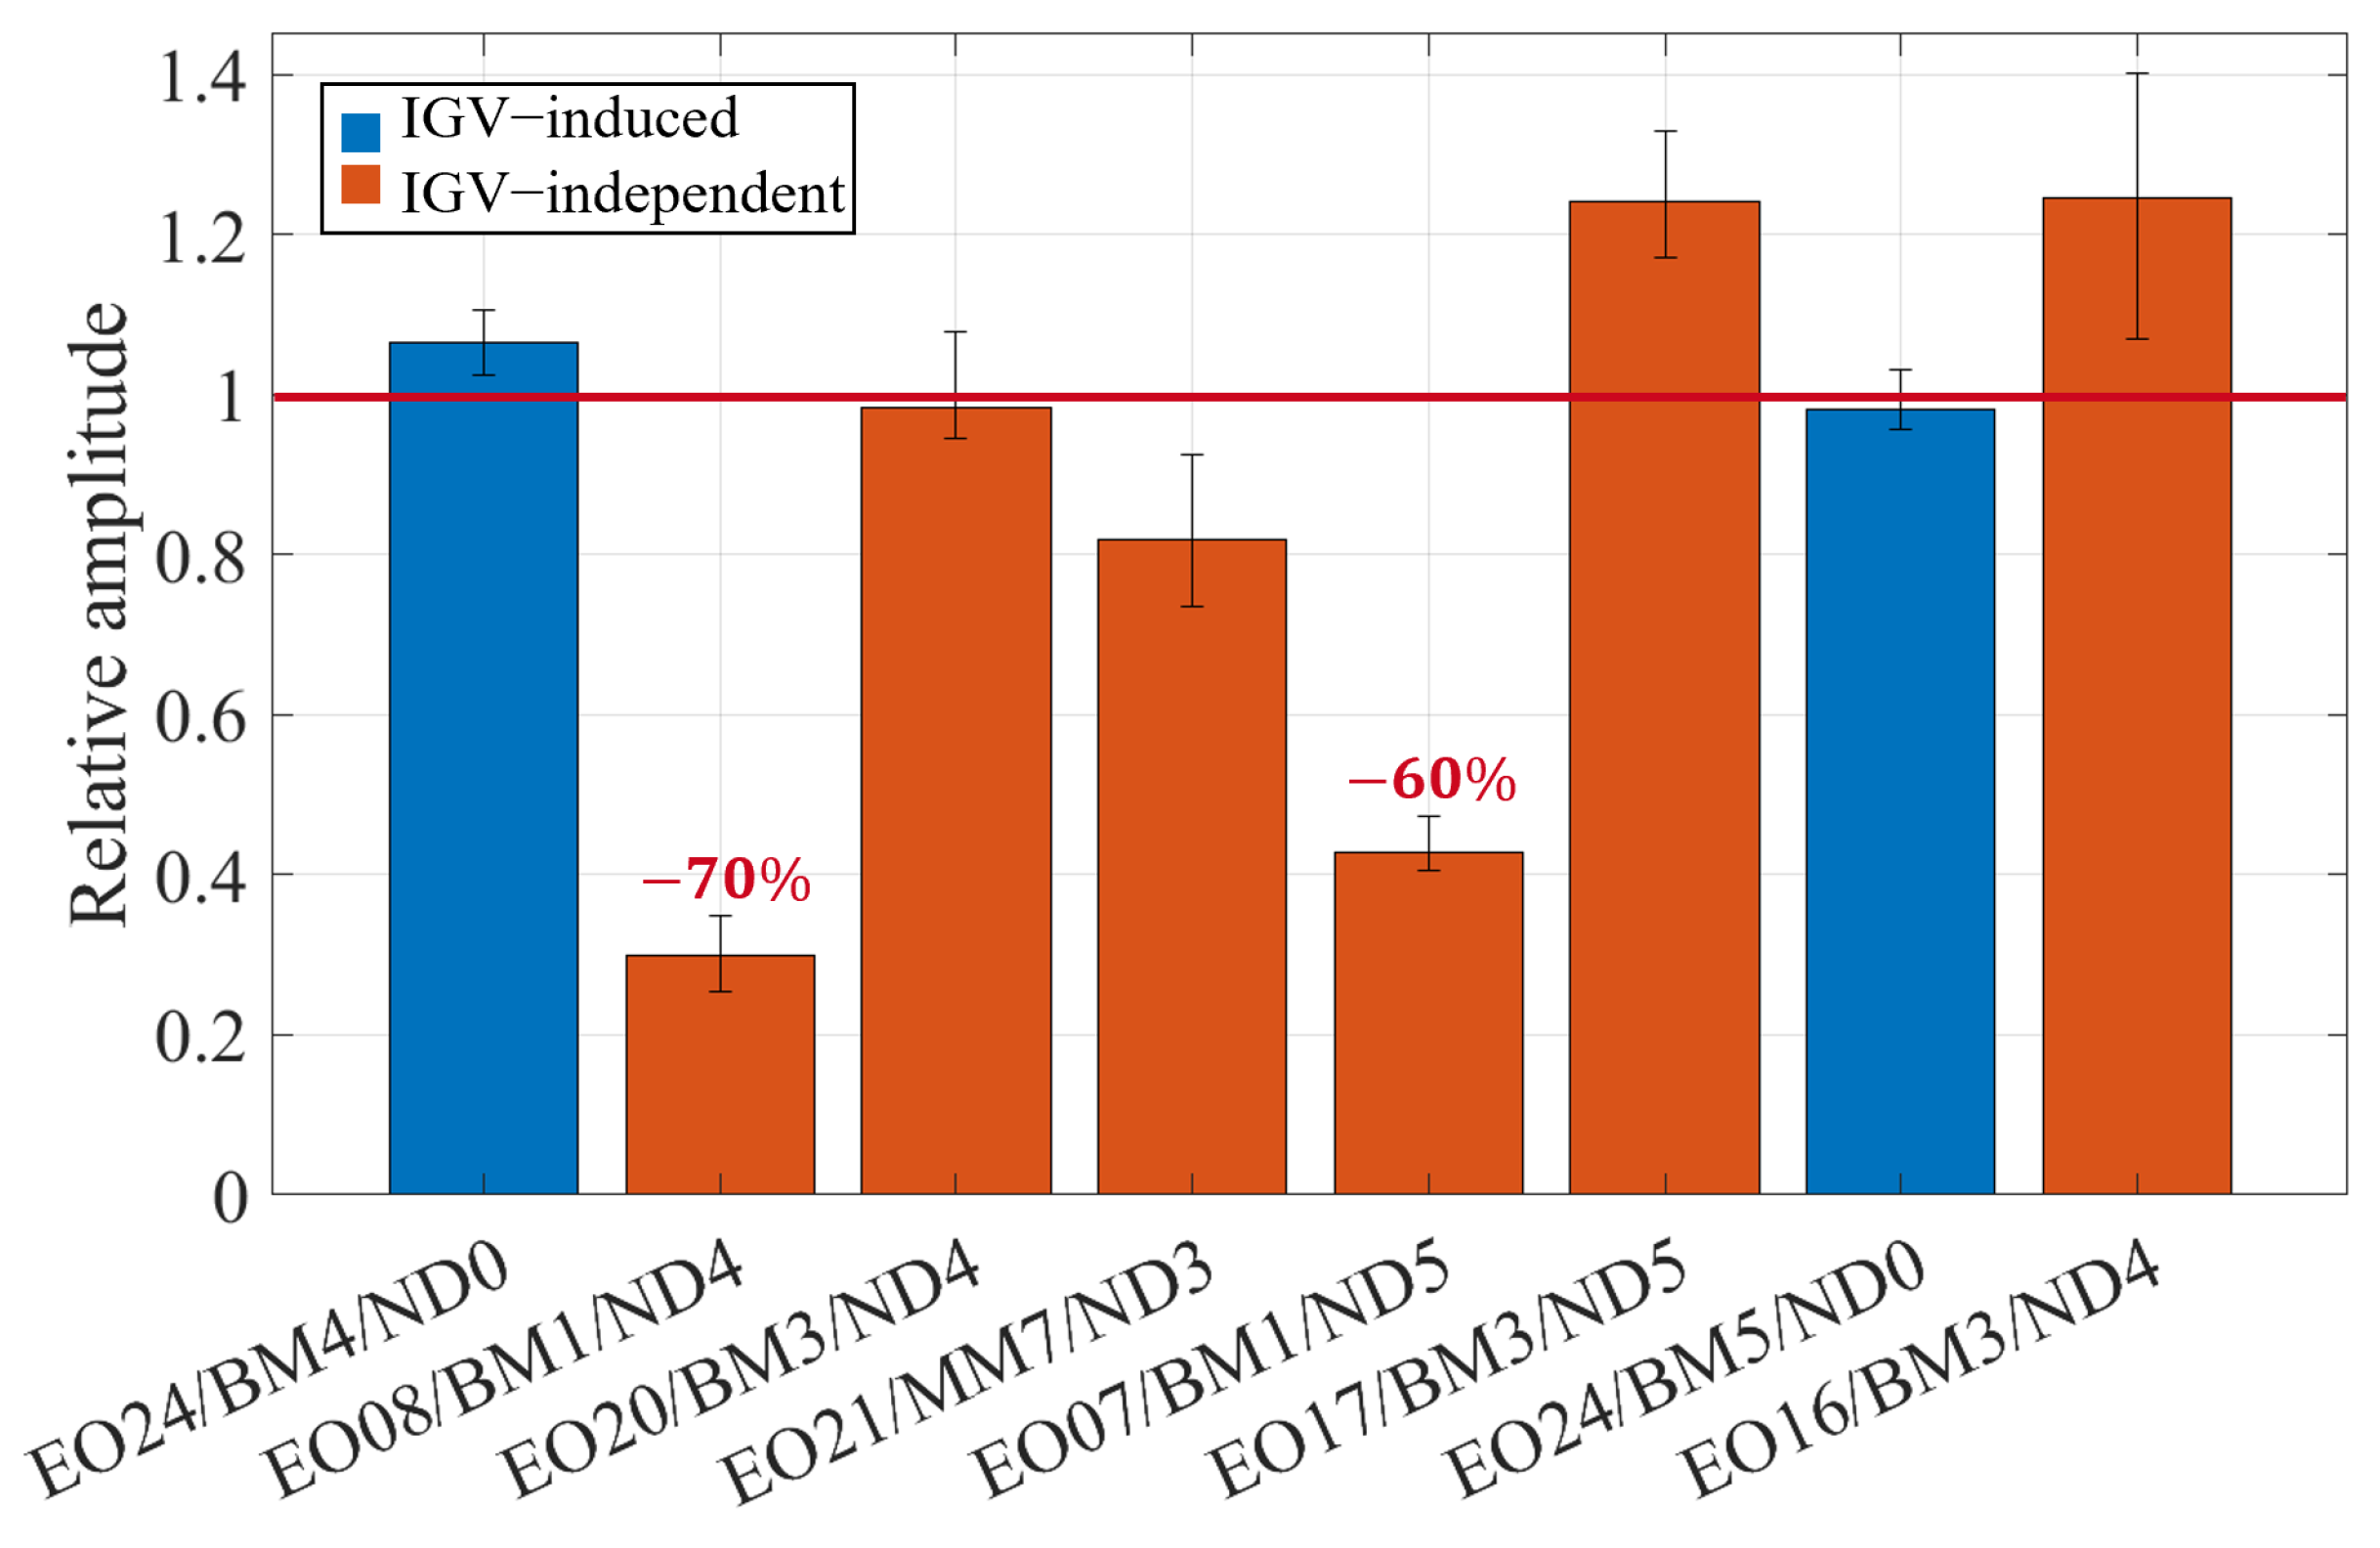
To examine whether the telemetry receiver support, which was mounted at the compressor inlet, has an influence on the IGV-independent vibrations, a test was performed without this component. The effect of the telemetry support is demonstrated in
Figure 25. Here, the mean amplitudes, which were measured without the telemetry support, are presented relative to the mean amplitudes measured with the telemetry support. Interestingly, a severe amplitude reduction of approx.
and
is observed for EO08/BM1/ND4 and EO07/BM1/ND5 when the support is removed. In contrast, slightly higher magnitudes were measured for EO17/BM3/ND5 and EO16 BM3/ND4. In addition, a limited influence is evident on the remaining IGV-independent vibrations, while only minor differences can be observed for the IGV-induced vibrations.
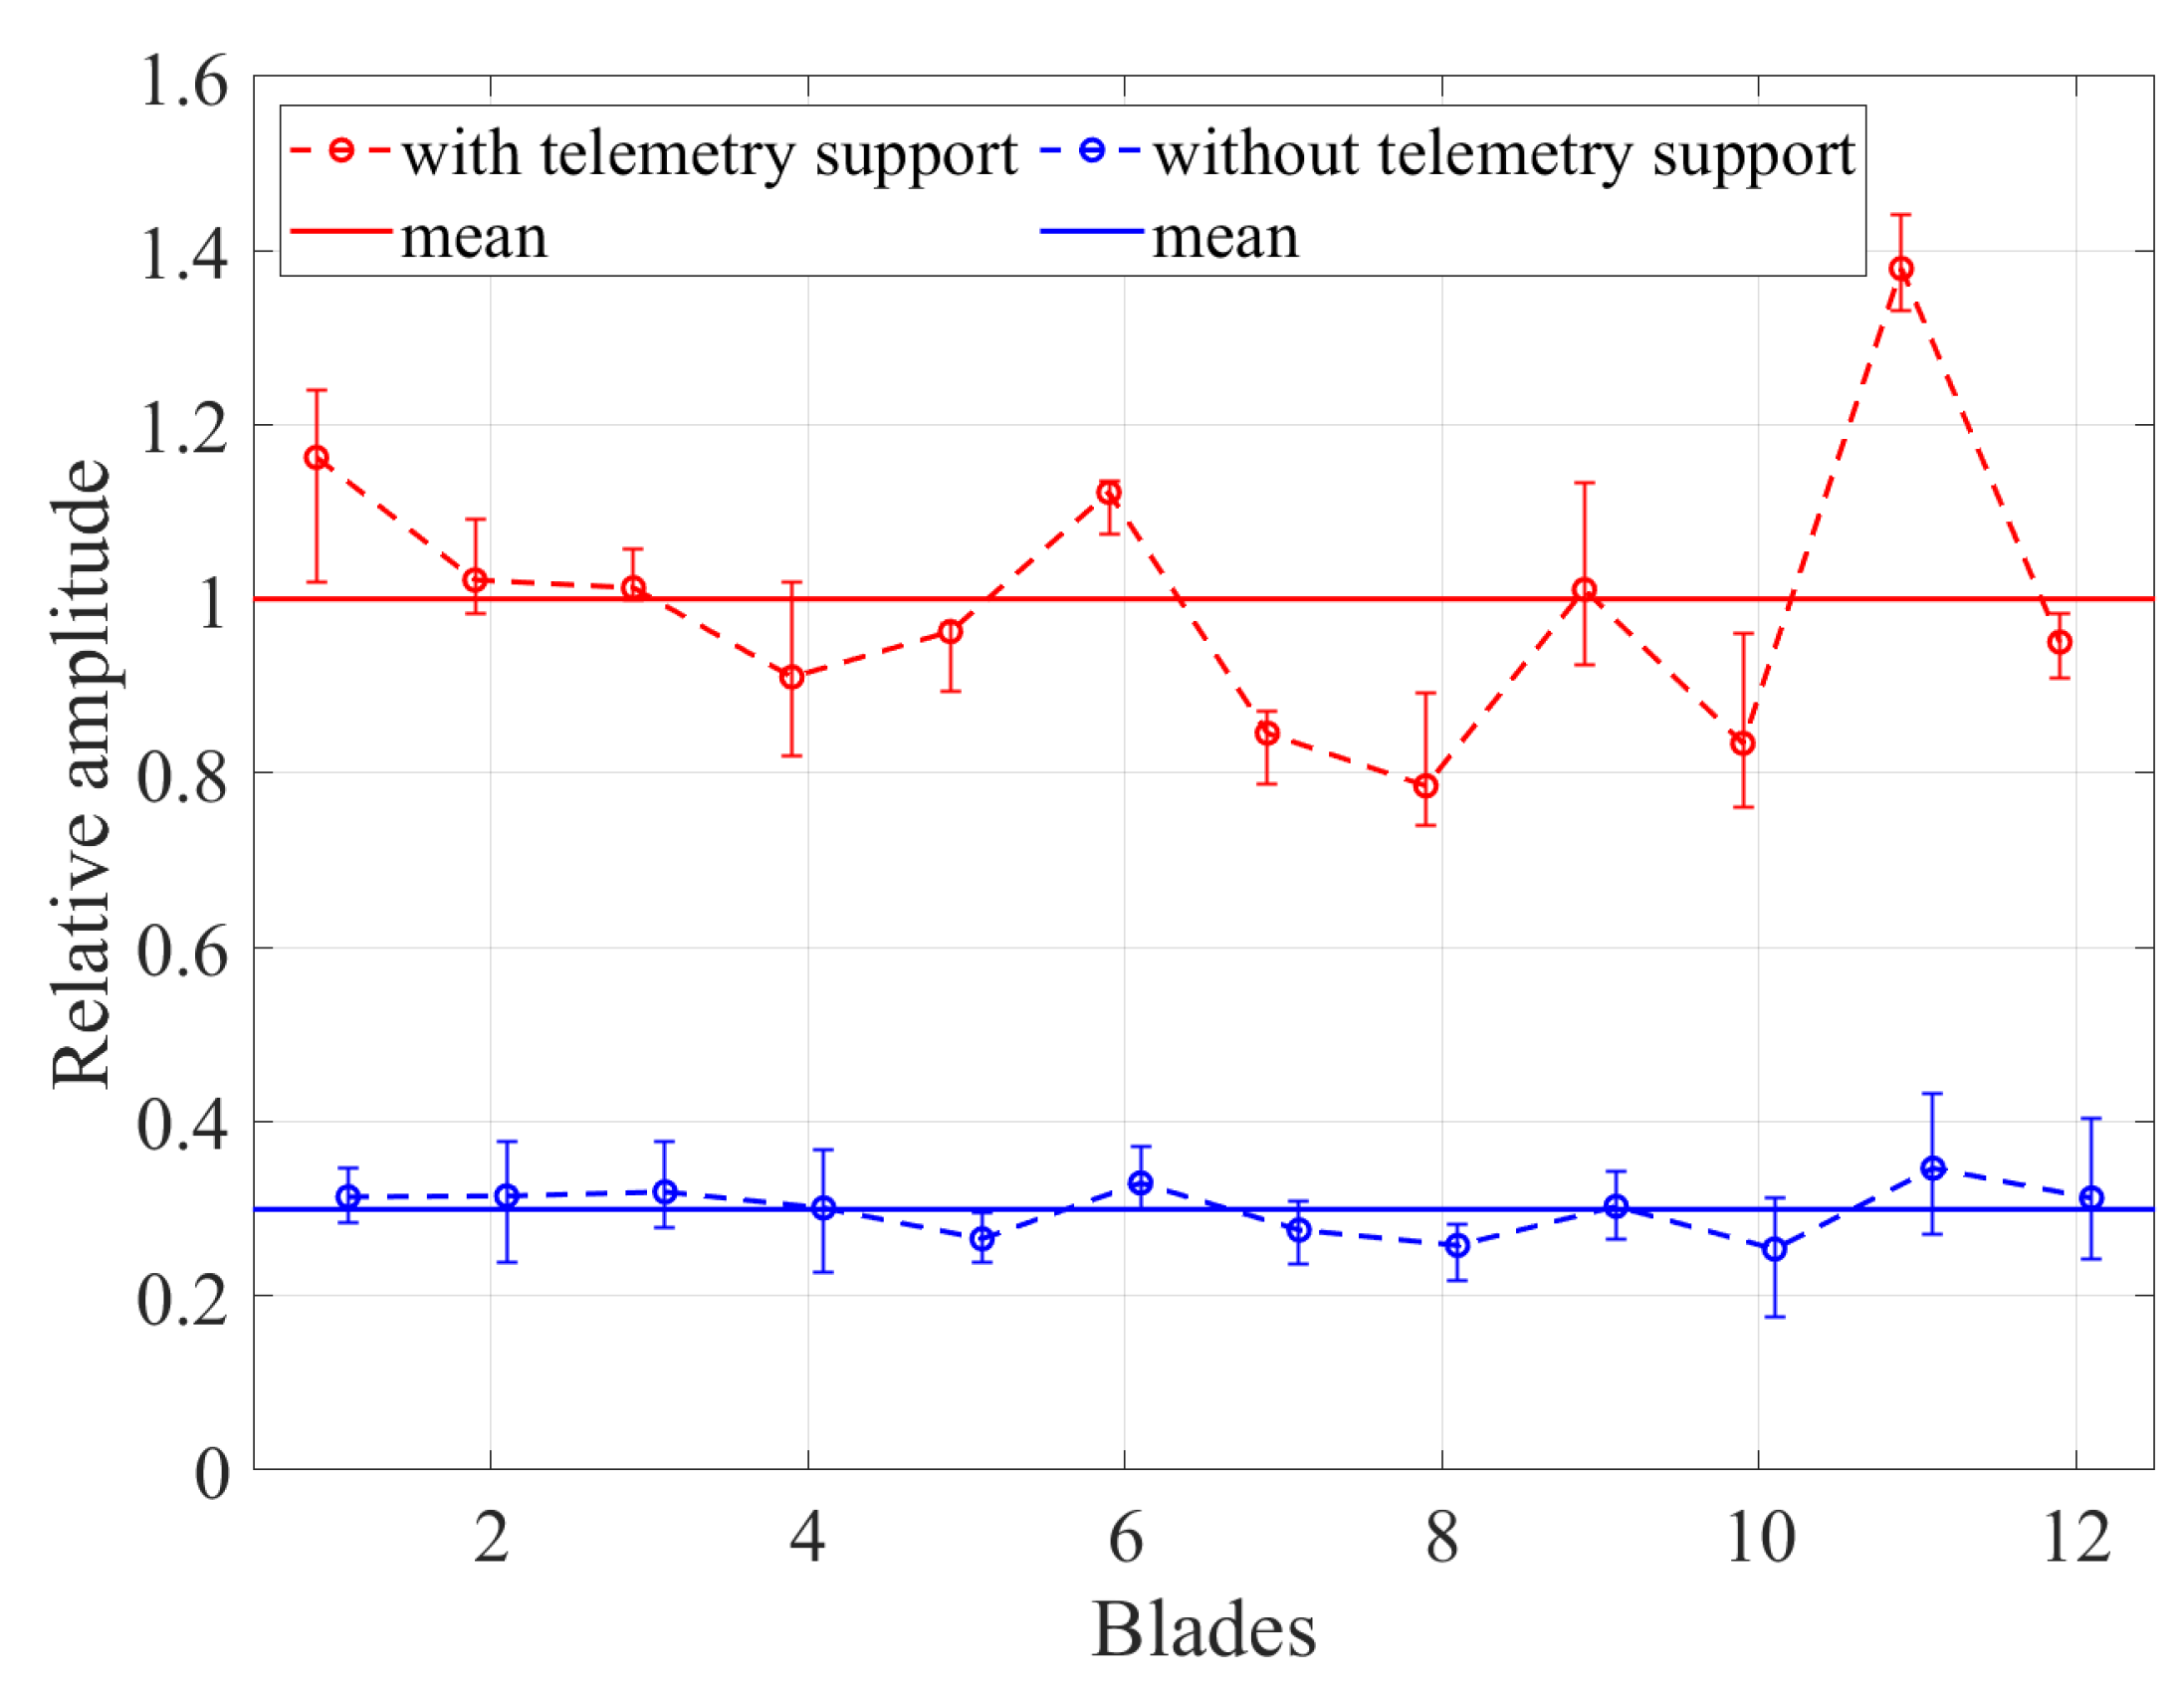
A comparison for EO08/BM1/ND4 and EO07/BM1/ND5 is presented in
Figure 26 and
Figure 27, respectively. The blade amplitudes are presented relative to the mean blade amplitude measured with the telemetry support. The figures reveal the magnification influence that the telemetry support has on this vibration. Nevertheless, the telemetry support is not the excitation source. Surprisingly, even though EO08/BM1/ND4 and EO07/BM1/ND5 are clearly influenced by the non-uniform pressure field of the compressor, no shaft vibrations of EO08 and EO07 could be recorded during the experiments with the telemetry support. This may be attributed to the sensitivity of the applied SG or to their shaft position, which may be unsuitable for the measurement of these vibrations.
The measurements indicate a coupling between the turbocharger compressor and turbine through the shaft, which must be taken into account when examining the resonance states of the turbine impeller. The effect of the telemetry support demonstrates that the non-uniform pressure field of the compressor-side can influence vibrations at the turbine side. Moreover, the occurrence of EO17/BM3/ND5 and EO16/BM3/ND4 suggests that the compressor diffuser can induce vibrations at the turbine impeller.
The excitation mechanism behind the occurrence of the remaining IGV-independent vibrations could not be identified. Further studies, which consider the whole rotor, including the bearings, in numerical as well as experimental investigations, may contribute to the identification of the excitation mechanisms.
4.5. Comparison with Numerical Estimations
The IGV configurations were investigated numerically without accounting for impeller mistuning. Given the constraints of the numerical model to the turbocharger turbine, only the IGV-induced vibrations were numerically examined. The numerical estimations are subsequently compared to the experimentally determined values.
Table 3 displays the deviation for the resonance frequencies, damping, and amplitude. The amplitude is separated to the tangential displacements measured by BTT and the strains recorded by SG. Only the values obtained through BTT were utilized for the damping comparison.
The calculated resonance frequency exhibits a close match with the measured frequency, with deviations falling within the range of −1.25% to . Generally, it can be inferred that the frequencies are slightly underestimated, attributed to limitations in the numerical model. Firstly, the model lacks consideration of thermal stress, leading to an inadequate representation of the stress stiffening effect. Secondly, the FEM model is confined to the turbine impeller, excluding the shaft, compressor impeller, and bearing elements. In addition, the reduced sector model cannot consider the effects of mistuning. Consequently, a minor deviation within this range is anticipated.
The calculation of the aerodynamic damping follows the method outlined by Buchwald [
27]. Notably, the damping deviations are considerably more pronounced compared to those observed for the resonance frequency. Generally, the numerical simulations tend to underestimate damping, a limitation attributed to the model’s constraints. The model is inherently capable of calculating only aerodynamic damping, overlooking the presence of structural damping. Evidently, the influence of structural damping becomes more apparent with increasing rotational speed, as shown by the larger deviations at higher rotational speeds in
Table 3. Despite these deviations, since the numerical results are at the same order as the experimental results, a relatively good estimation is provided.
Utilizing the calculated aerodynamic damping and the pressure field determined through the NLH method [
3,
9,
24,
25], the forced response calculations are performed to predict blade tip displacement and strain. ITSM has conducted the calculations by directly mapping the exported pressure field onto the FEM model and performing a mode-superpositioned forced response analysis.
An intriguing contradiction arises when comparing the measured strains and tangential displacements with the numerically determined values. Notably, the strain is consistently overestimated, while the tangential displacement is consistently underestimated in the numerical simulations. These observations align with the findings of Zobel [
25], who has noted this behavior for EO10/BM1/ND2.
The numerical deviation in BTT is evidently reduced with increasing vibration magnitudes. A substantial divergence is identified for EO24/BM3/ND0 and EO24/BM4/ND0. The measured deflections of these vibrations lie at the detection limit of the BTT, potentially leading to overestimation. Nevertheless, as the tangential displacement increases, the deviation becomes smaller, as observed for EO24/BM5/ND0 and EO30/BM5/ND6.
In addition to the limitations of the numerical model, deviations can also arise from experimental factors. Specifically, the measurement position of the tip deflection can be a potential source of discrepancies for BTT. Differences between the targeted and manufactured positions of BTT sensors, thermal expansion of the turbine housing, occurring shaft vibrations, as well as axial rotor offset during operation, may contribute to deviations. Similarly, deviations in strain measurements could be attributed to the inaccurate positioning of SG. Even slight variations in the placement and alignment of SG can exert a noteworthy influence on the recorded strain values.
The numerical calculations for MMs exhibit a significant overestimation of blade responses. Specifically, the inability to measure EO24/MM11/ND0 and substantial deviations in the calculated deflections and strains of MM15/ND0/EO24 highlight challenges in accurately predicting the response of these vibrations. Given that these modes are not predominantly expressed on the blade but also include the disk, shaft and even the compressor impeller, it is particularly difficult to accurately predict their response. The incorrect calculation of MMs is presumed to be attributed to inadequately modeled components. Notably, an exceptionally high underestimation of damping is observed for EO24/MM15/ND0, suggesting the presence of additional damping contributions not accounted for in the calculations. This implies a need for improvement in the numerical model, as it seems that damping effects, presumably at the bearings and the compressor impeller, restrain the vibration of these MMs.
5. Conclusions and Outlook
This study elucidates the setup of BTT and SG measurements on a radial turbine, for investigation of the vibration behavior. The cross-validation of BTT and SG is provided through consistently similar trends in amplitude and frequency of the recorded vibrations. BTT, capable of determining the vibration properties of all blades, provides an accurate mistuning assessment and identification of amplitude magnification. Nevertheless, BTT has limitations in detecting minor vibrations. In contrast, SG, although confined to the blades of their application, offer comprehensive insights into the vibration spectrum. The study also highlights the vulnerability of SG to rapid failure.
The experiments indicate the effects of mistuning on the vibration behavior of the impeller. Even a small frequency mistuning can lead to significant amplitude overshoots. Additionally, multiple amplitude peaks emerge across the rotational speed range, suggesting numerous resonance crossings and frequency splitting phenomena [
16,
17,
18]. Noteworthy is the observation of mode-dependent mistuning and amplitude magnification.
LEO induced two additional excitations. The measurements confirm the findings of previous studies [
8,
9], emphasizing the non-uniform vane spacing as a primary source of LEO excitations. Moreover, the procedure derived by Zobel [
25] for intentionally generating LEO excitations through a mistuned IGV is validated. Additionally, minor deviations were observed between the EO24 vibrations of LEO10 and SD24, indicating that the mistuned IGV has no weakening influence on the IGV-induced vibrations.
A comparison between the IGV-induced vibrations of DRH30 and SG24 revealed that the DRH30-induced vibrations exhibited significantly lower amplitudes compared to the SD24-induced vibrations. Moreover, the influence of ND on the impeller’s mistuning behavior was investigated. The experiments suggest only minor deviations between the mistuning of ND0 and ND6.
Various EO vibrations occurring independently of the IGV suggest an external excitation mechanism. Remarkably, the removal of the telemetry support on the compressor side led to a substantial reduction in the magnitude of certain IGV-independent vibrations. Furthermore, vibrations with EO matching the number of compressor vanes, along with SG measurements on the shaft, point towards a coupling between the compressor and turbine. The non-uniform pressure field at the compressor side appears to induce and influence vibrations at the turbine impeller. Simultaneous vibration measurements on both sides of the turbocharger are essential for the investigation of these phenomena. Despite these insights, the excitation mechanism of some IGV-independent vibrations remains undetermined. Further studies incorporating the entire rotor system, including the bearings, may contribute to the identification of these excitation mechanisms.
The numerically calculated frequencies exhibit only minor deviations from the experimental values. However, a consistent underestimation of numerically determined damping arises due to the exclusive consideration of aerodynamic damping. In addition, substantial disparities are evident in the measured amplitudes compared to the numerically calculated values. Particularly noteworthy is the consistent overestimation of strain and underestimation of tangential displacement in the numerical simulations. The significant deviation observed for the MMs emphasizes the need for a comprehensive rotor model, as it seems that not all influencing factors are effectively considered.

 ,
, 
