Article

Experimental Investigation of Rotor Tip Film Cooling at an Axial Turbine with Swirling Inflow Using Pressure Sensitive Paint †

by
Manuel Wilhelm
* and
Heinz-Peter Schiffer
Institute of Gas Turbines and Aerospace Propulsion, Technische Universität Darmstadt, Otto-Berndt-Str. 2, 64287 Darmstadt, Germany
*
Author to whom correspondence should be addressed.
This paper is an extended version of our paper published in Proceedings of the European Turbomachinery Conference, ETC13, Lausanne, Switzerland, 8–12 April 2019; Paper No. 236.
Int. J. Turbomach. Propuls. Power 2019, 4(3), 23; https://doi.org/10.3390/ijtpp4030023
Submission received: 10 May 2019 / Revised: 24 July 2019 / Accepted: 25 July 2019 / Published: 1 August 2019

Abstract

:
Rotor tip film cooling is investigated at the Large Scale Turbine Rig, which is a 1.5-stage axial turbine rig operating at low speeds. Using pressure sensitive paint, the film cooling effectiveness η at a squealer-type blade tip with cylindrical pressure-side film cooling holes is obtained. The effect of turbine inlet swirl on η is examined in comparison to an axial inflow baseline case. Coolant-to-mainstream injection ratios are varied between 0.45% and 1.74% for an engine-realistic coolant-to-mainstream density ratio of 1.5. It is shown that inlet swirl causes a reduction in η for low injection ratios by up to 26%, with the trailing edge being especially susceptible to swirl. For injection ratios greater than 0.93%, however, η is increased by up to 11% for swirling inflow, while for axial inflow a further increase in coolant injection does not transfer into a gain in η .

Graphical Abstract

1. Introduction

1.1. Motivation

Being located downstream of the combustion chamber, the first stage of a high pressure turbine operates at hot gas temperatures that exceed the melting point of turbine materials. The rotor blade tip is among the areas that experience the highest heat load due to hot fluid passing through the gap between tip and casing. If the tip is not cooled properly, its lifetime declines and tip oxidation may occur. Consequences include an increase in tip clearance and aerodynamic losses, leading to a reduction in turbine efficiency. By applying film cooling, the coolant acts as a protective layer between the hot gas and tip surface, reducing the thermal load.

1.2. Scope of This Work

New technologies in combustion (lean-premixed-pre-vaporized) aimed at reducing emissions pose a new challenge to turbine cooling design. At the combustor–turbine interface, altered flow characteristics include high inlet swirl and elevated turbulence levels. This work aims at identifying the effects of swirling inflow conditions on the film cooling performance at the blade tip. Rotor tip film cooling is experimentally investigated for the first time for engine-realistic swirl, high turbulence inlet conditions at a rotating rig.

1.3. Effects of Turbulence

Azad et al. [1] have studied the effects of elevated turbulence levels on blade tip heat transfer for uncooled flat and squealer tips in a blow-down cascade rig. They found a slight increase in blade tip heat transfer when mainstream turbulence was increased from 6.1% to 9.7%. Wright et al. [2] investigated flat plate film cooling for turbulence levels from 1.2% to 12.5%. Their results show that, as turbulence increases, film cooling effectiveness decreases due to the increased mixing of the coolant jets with the main flow. The reduction in film cooling effectiveness was especially severe for low injection ratios.

1.4. Effects of Incidence Angle

Rhee et al. [3] studied a flat tip at a rotating rig and varied the rotor incidence angle. They found that positive incidence angles lead to a more uniform and higher heat transfer rate due to an increase in tip leakage flow. Gao et al. [4] studied a cooled squealer tip with a cut-back rim at a blow-down cascade rig. They could show that film cooling effectiveness in the squealer cavity may increase by up to 25% for a positive incidence angle of 5°, while a negative incidence angle could increase or decrease the film cooling effectiveness locally depending on the blowing ratio. Rezasoltani et al. [5] conducted measurements at a rotating rig for different cooled and uncooled blade tips. They concluded that the flow behaviour is strongly affected by the film cooling injection and that the film effectiveness follows the net velocity vector caused by the incidence and over-tip leakage.

2. Experimental Setup

2.1. The Large Scale Turbine Rig
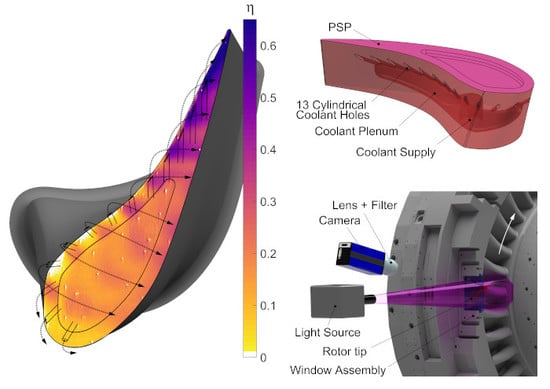
Measurements were taken at the Large Scale Turbine Rig (LSTR) [6], which is a 1.5-stage, low speed test rig operating in closed-loop at cold, near-atmospheric conditions with engine-realistic nozzle guide vane (NGV) exit Reynolds numbers. The blades and vanes are based on an up-scaled high pressure turbine geometry (Designed by Rolls-Royce Deutschland, Dahlewitz, Germany). At the turbine inlet, a full-annular combustion simulator with exchangeable swirlers creates engine-representative flow angles at the combustor–turbine-interface. A realistic cooling configuration is simulated by ejecting secondary air at various positions (Figure 1), including film cooling at the end wall upstream of the NGV, the so-called Rear Inner Discharge Nozzles (RIDN) (1), purge flow between NGV and rotor (2), film cooling at the NGV leading edge (3), slot ejection at the NGV trailing edge (4), and film cooling at the rotor tip (5). The operating point of the rig is summarized in Figure 1. Further details on rig control and stability are provided by Eitenmüller et al. [7].

2.2. Rotor Tips

A squealer geometry was tested with 13 cylindrical, equally spaced coolant holes located at 94% blade span (92.3% relative channel height) for a tip clearance (TC) of 1% blade span (Figure 2). The tip was made of epoxy by sterelithography and the film cooling holes were included in the manufacturing process. A reamer was used to rework the holes for perfect circularity and diameter. The surface tolerances were checked using an optical scanner (ATOS 3 Triple Scan System by GOM, Braunschweig, Germany) and found to be within ±0.3 mm overall except for the trailing edge (TE), which was short by 0.6 mm. The tip clearance was monitored during operation with an optical measurement system consisting of three laser triangulation sensors (LK-H082 by Keyence Deutschland GmbH, Neu-Isenburg, Germany).

2.3. Tip Coolant Supply

The film cooling measurements were conducted at one particular blade tip painted with pressure sensitive paint (Figure 2). A coolant gas mass flow could be supplied to this specific tip via a rotational coupling by a mass flow controller (Bronkhorst F-202AV by Wagner Mess- und Regeltechnik, Offenbach am Main, Germany) with an accuracy of ±0.6%. Inside the tip, the coolant was distributed to the coolant holes by a plenum. The plenum design was optimized via numerical simulations Computational fluid dynamics (CFD) for equal mass flow distribution to all coolant holes within a deviation of ±1% between different holes. The coolant temperature was kept at the same temperature as the main flow to within ±1 K.

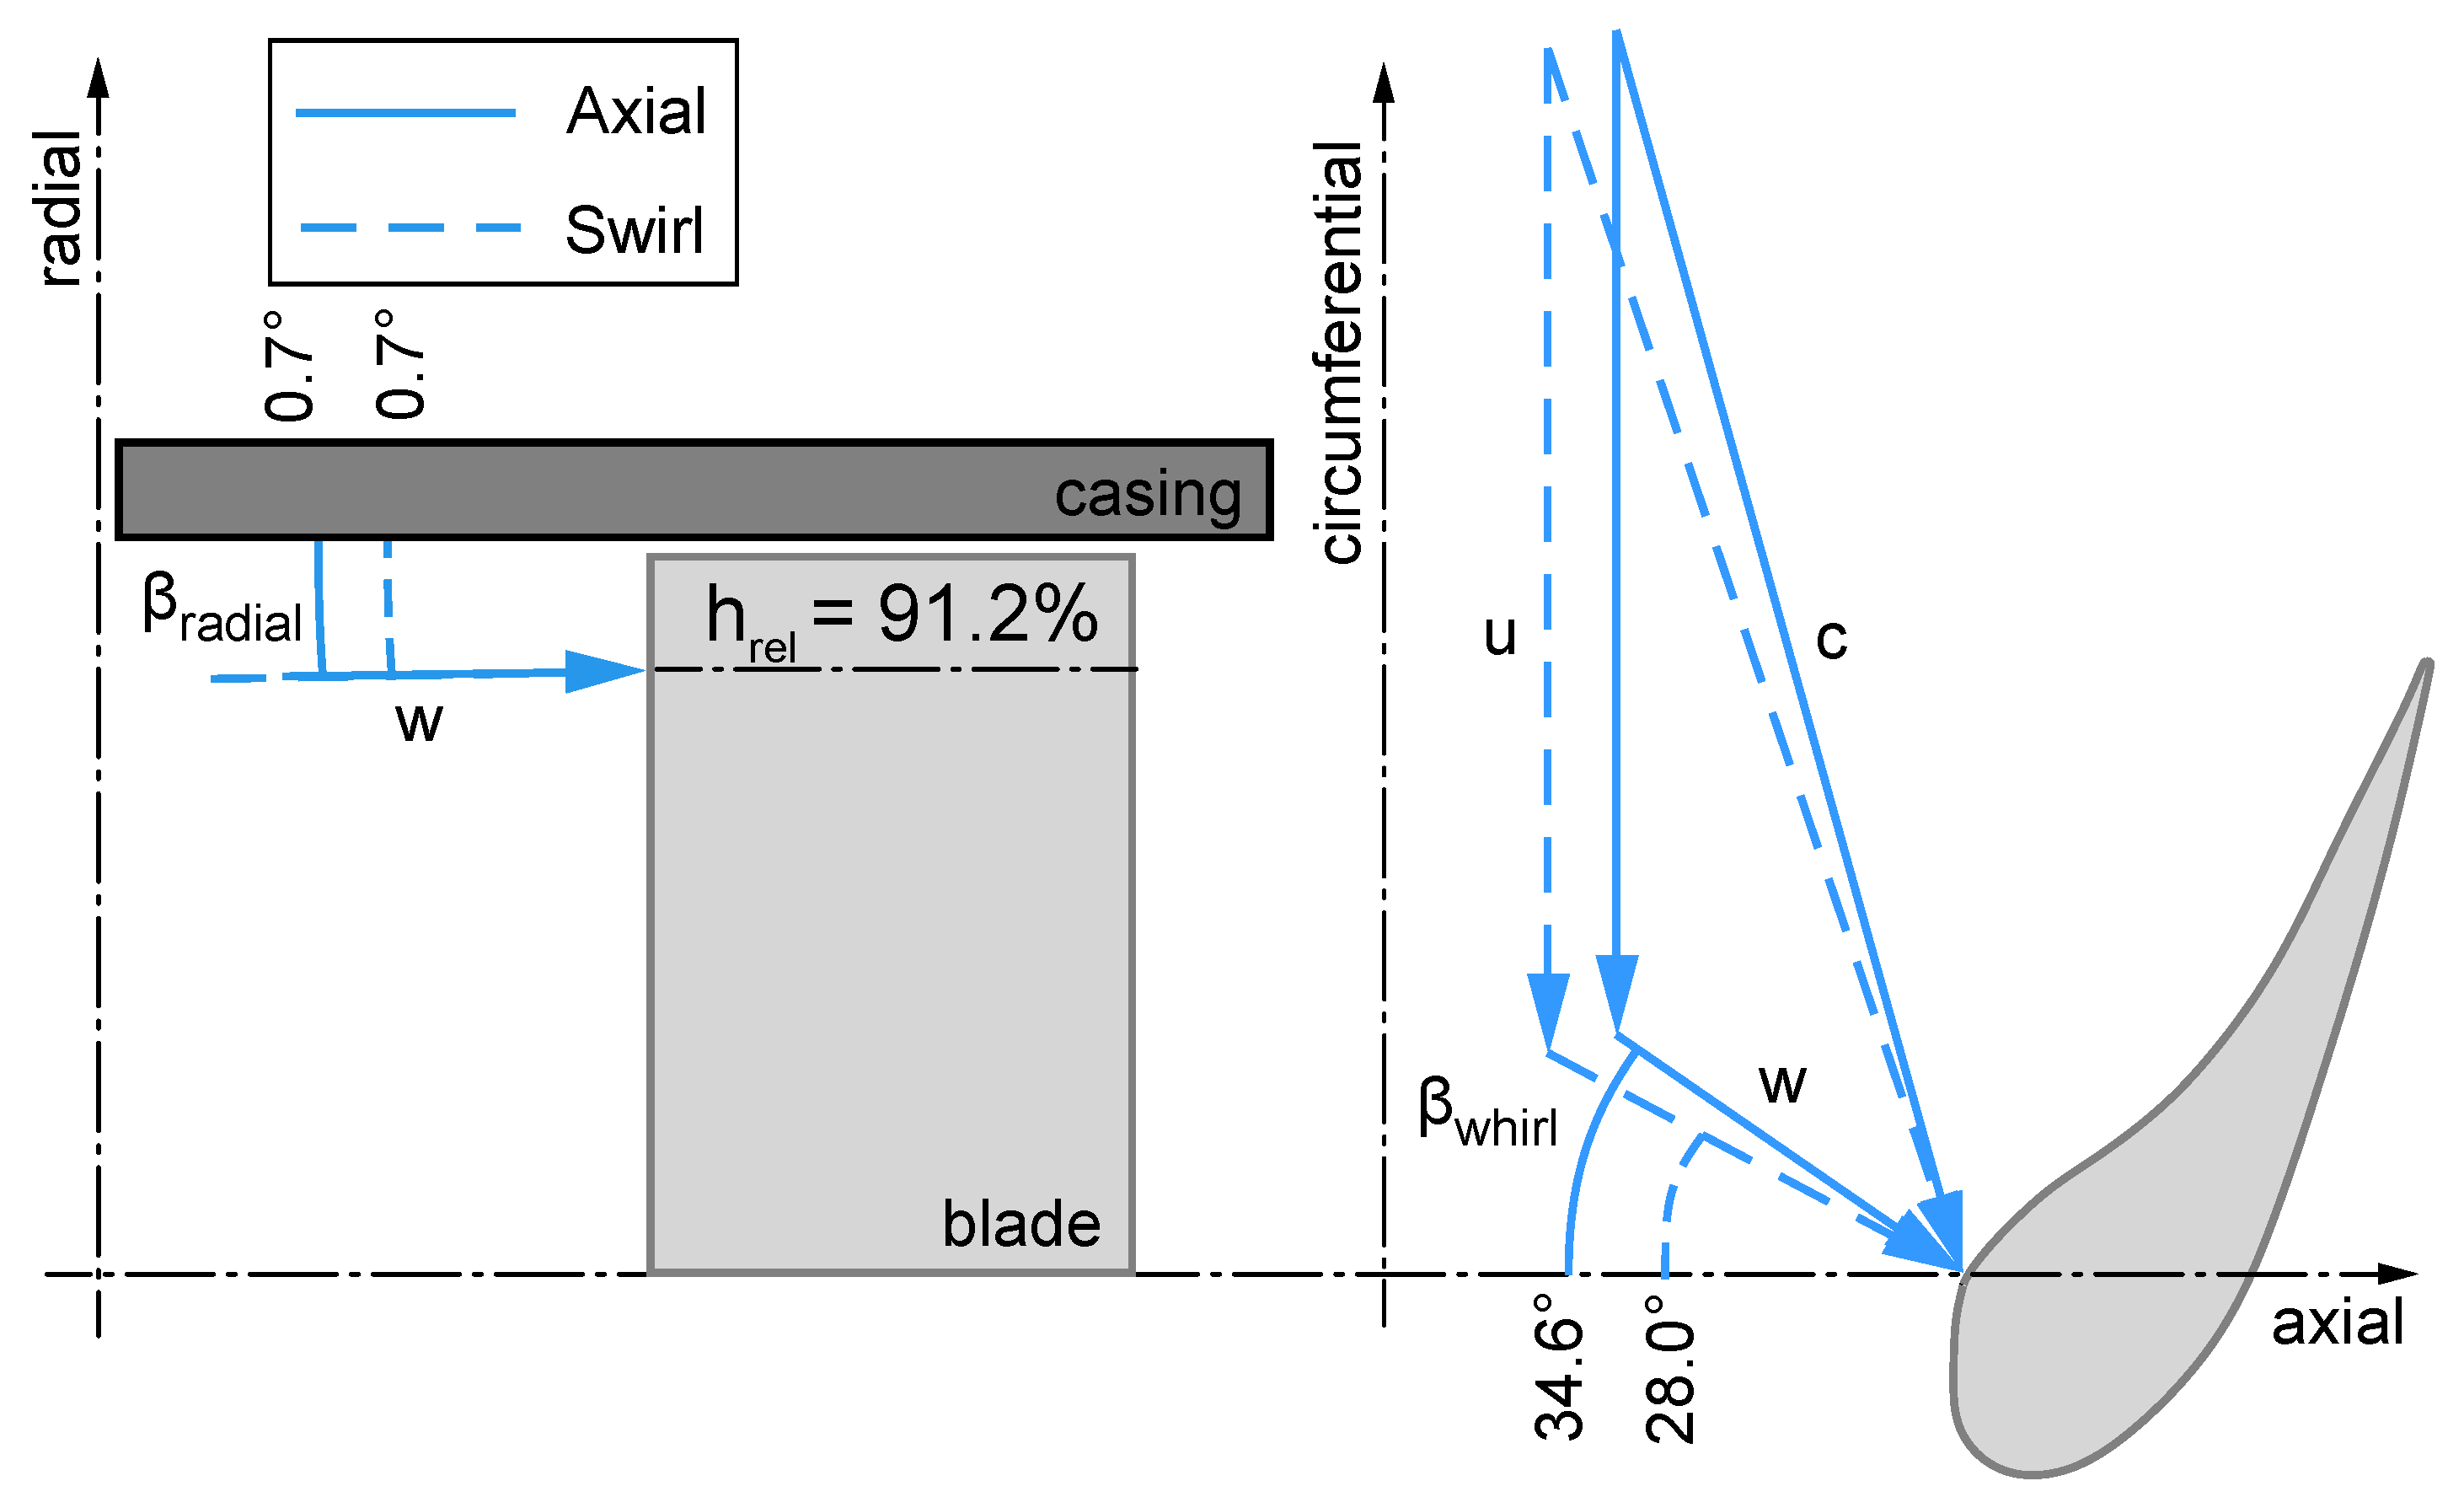
2.4. Effect of Swirl on Rotor Tip Flow Field

In past publications of the research group, the effects of swirl on the NGV outlet/rotor inlet flow and turbulence field have been studied at the LSTR using five-hole and hot-wire-probes as well as CFD [8,9,10]. It has been found that, since the swirl causes large mean whirl angles of up to 30° at the turbine inlet, the flow experiences an under-turning near the NGV hub and casing. To quantify this influence on the inflow to the rotor tip, the velocity triangles are considered based on circumferentially averaged five-hole-probe measurements upstream of the rotor at a relative channel height of h r e l = 91.2% (Figure 3), which is approximately the same channel height where the film coolant holes are located on the blade. It can be seen that the whirl angle β w h i r l is decreased by 6.6° (absolute velocity c, rotor relative velocity w) from axial inflow (solid lines) to swirling inflow (dashed lines) while the rotor-relative radial angle β r a d i a l (projection onto the axial-radial plane) remains unchanged. As will be shown in the discussion of the film cooling results, this change in incidence significantly affects film cooling effectiveness on the rotor tip. In addition, hot-wire measurements have shown that the mean turbulence intensity at the upper 10% of the channel is increased from 3.3% for the axial inflow case to 4.8% for the swirling inflow case. This in turn increases the mixing of the rotor tip coolant jets with the main flow [2].

3. Experimental Method

To measure the film cooling effectiveness on the blade tip surface, pressure sensitive paint (PSP) is used. PSP contains luminescent molecules that emit light of a wavelength higher than an excitation wavelength. By the photophysical process of oxygen quenching, the emission intensity I increases as the partial pressure of oxygen or equivalently the oxygen concentration on the paint surface decreases. Therefore, PSP can be used for pressure or coolant gas concentration measurements. The application of PSP for turbine blade film cooling investigations is reviewed by Han et al. [11] and summarized below:
η = T a w T T C T I C w C C C C I I = C O 2 , f g C O 2 , a i r C O 2 , a i r I I I = 1 1 1 + P O 2 , a i r / P O 2 , r e f P O 2 , f g / P O 2 , r e f 1 W f g W a i r I V .
  • Adiabatic Effectiveness Assuming low conductivity blade materials, the adiabatic film cooling effectiveness η can be defined using the temperatures of the main flow T , the coolant T C , and the adiabatic wall T a w (Equation (1)-I).
  • General Mass Transfer Analogy for Film Cooling The analogy between heat and mass transfer can be applied if the flow is (1) turbulent, so that the ratio of turbulent thermal diffusivity to turbulent mass diffusivity is around unity ( L e T 1 ), and (2) if the flow is low-speed ( M a 1 ), so that the viscous energy dissipation and the influence of pressure gradients can be neglected in the boundary layer energy equation [12]. Both conditions are usually met in a low-speed turbine rig. Appropriately, η can be defined using a tracer element that is present with concentrations C in the mainstream, C C in the coolant, and C w near the wall (Equation (1)-II).
  • PSP Mass Transfer Analogy for Film Cooling To isolate the pressure response of the paint from the concentration response, two separate experiments are carried out.
    • Air injected as coolant: The oxygen concentration of the coolant is the same as in the main stream. In this way, the underlying pressure distribution caused by the main flow and the coolant injection is accounted for. The resulting emission intensity is I a i r and the corresponding oxygen partial pressure and concentration fields are P O 2 , a i r and C O 2 , a i r = C (Equation (1)-III).
    • Foreign gas injected as coolant: The paint responds to the oxygen concentration distribution resulting from the mixing between the oxygen-free coolant and main flow. The resulting emission intensity is I f g and the corresponding oxygen partial pressure and concentration fields are P O 2 , f g and C O 2 , f g = C w . Carbon dioxide was used as foreign gas ( C c = 0 ) to achieve a coolant-to-mainstream density ratio of 1.5.
  • Conversion between Concentration and Pressure As deduced by Charbonnier et al. [13], oxygen concentration is converted to oxygen partial pressure knowing the molecular weight of air W a i r and of the foreign gas W f g (Equation (1)-IV).
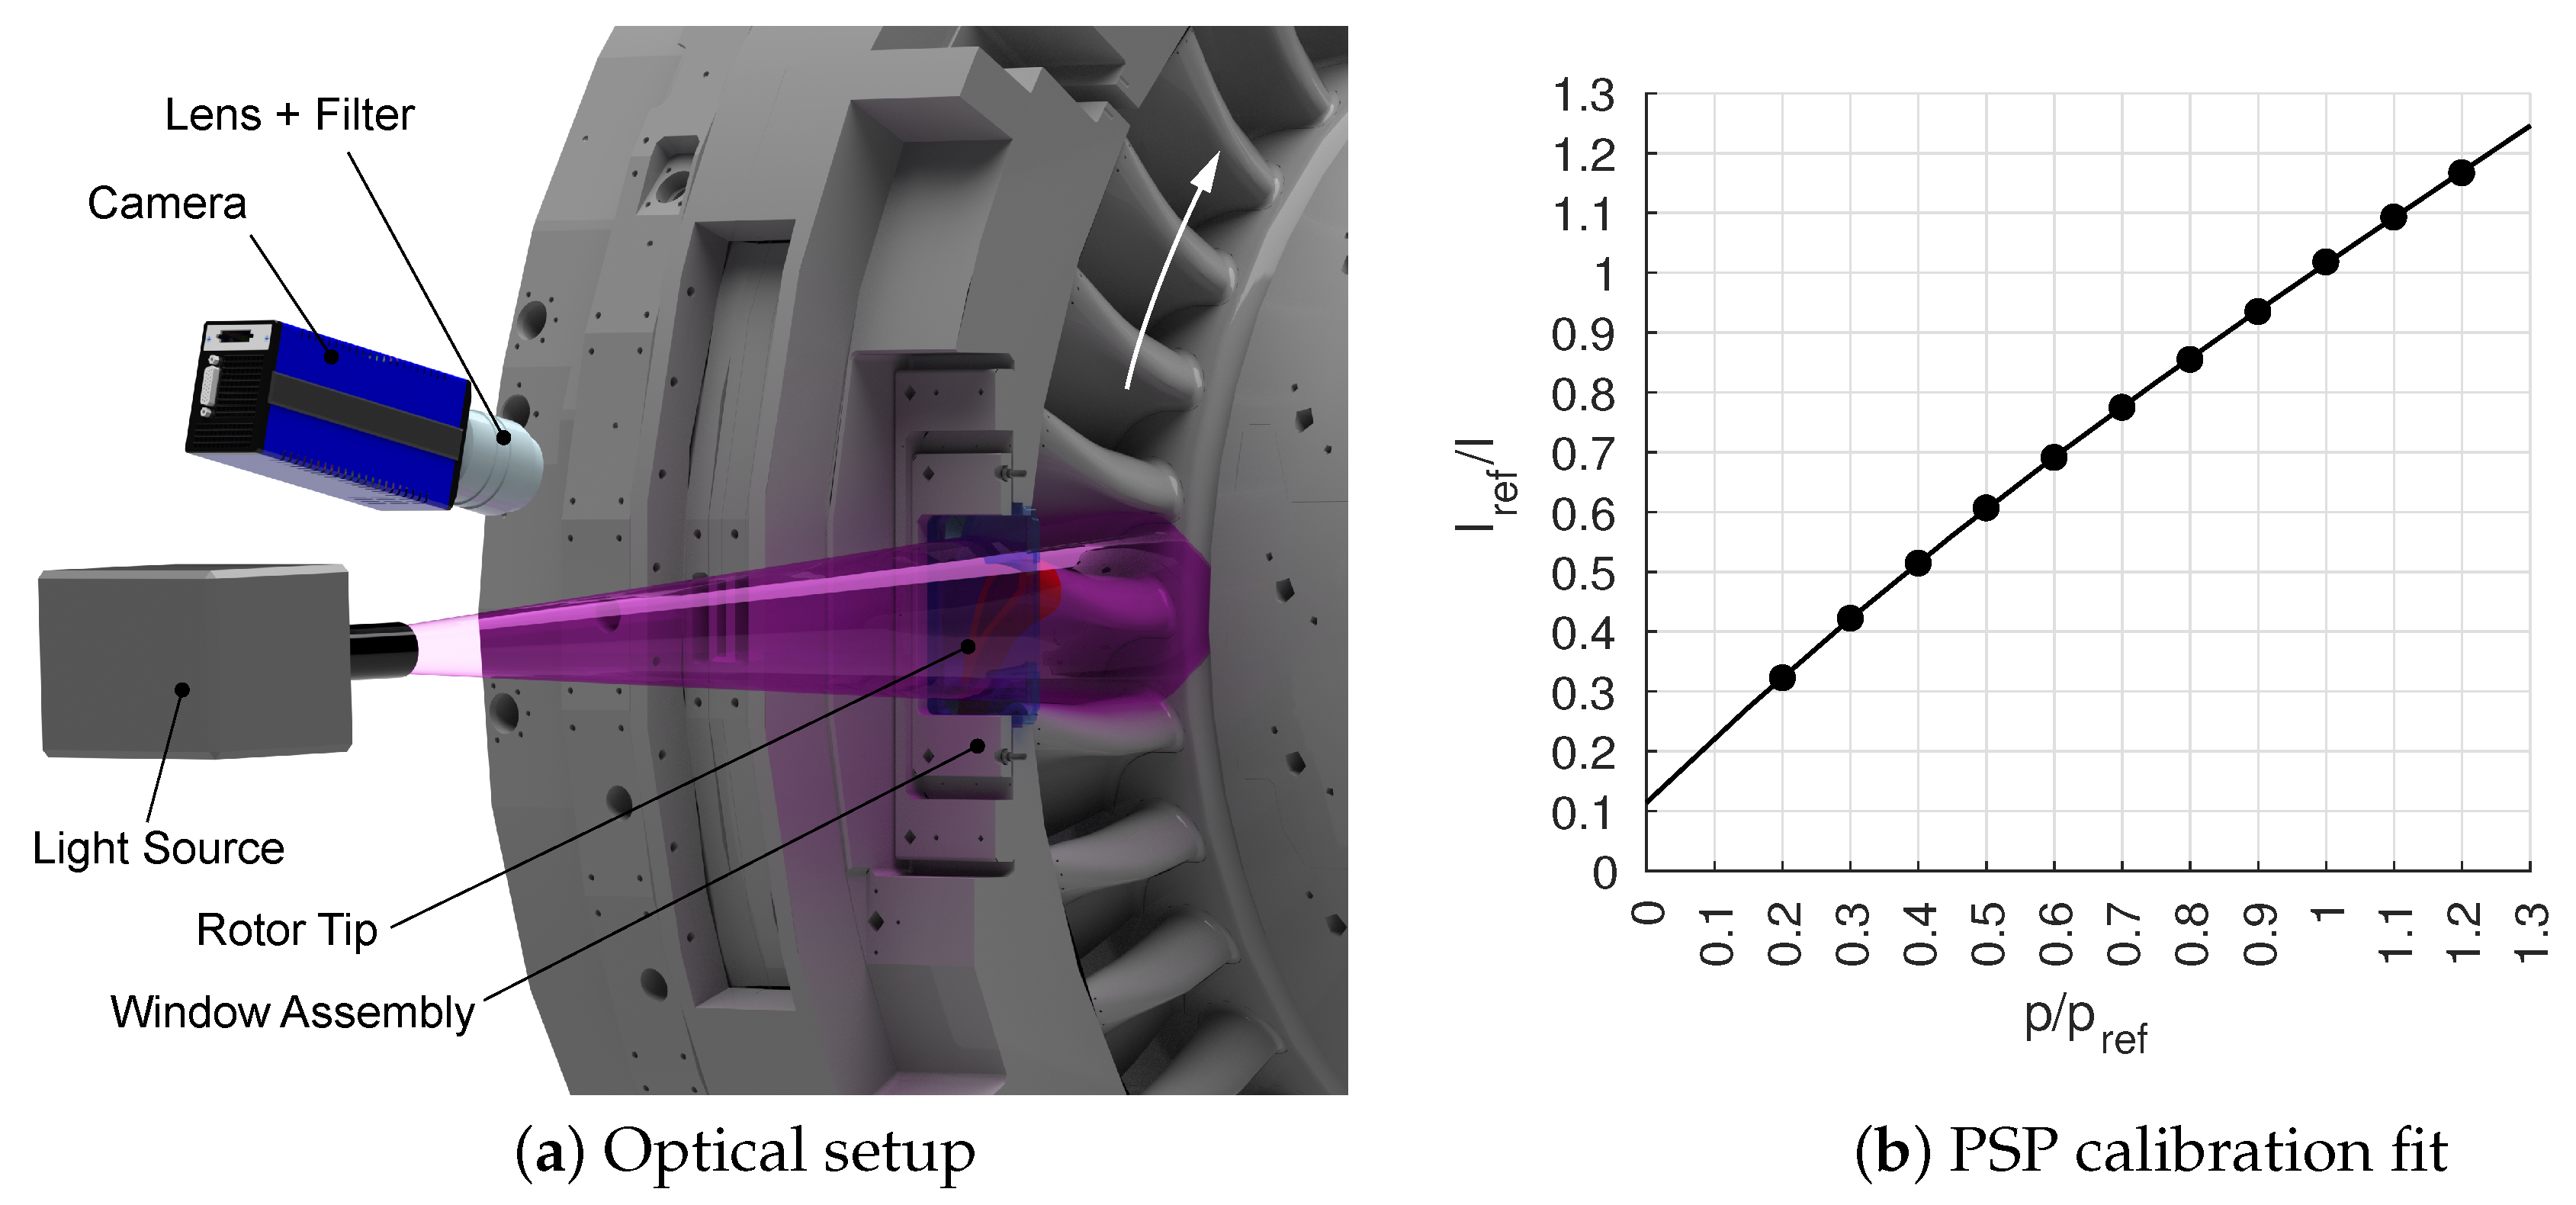
  • Conversion between Pressure and Intensity For this investigation, an intensity-based PSP method is used as described by Liu and Sullivan [14]. During the experiments, the paint emission intensity is recorded by the camera for a fixed exposure time. Afterwards, the relationship between the recorded intensity and pressure is established via a calibration.
    • Experiment: As described in III, two experiments are conducted resulting in the intensities I a i r ( T ) and I f g ( T ) . A reference image I r e f ( T ) is taken right after the experiments when the rig is turned off. The temperature change between experiment and reference image is monitored and taken into account during calibration. In addition, a dark image I d a r k is taken to account for the dark noise of the camera.
    • Calibration: A specimen that has been painted simultaneously to the blade tip is placed in a calibration chamber based on a design by Bitter [15]. The chamber pressure is controlled by a pressure controller (PPC4 A160KS by Fluke Calibration, Everett, WA, USA) to within ±1 Pa. The specimen temperature is kept constant using a Peltier-heater to within ±0.1 K. A reference image is taken at the same conditions as the reference image for the rig experiment. The chamber pressure is then varied and images are taken at the same temperatures as during the rig experiment. A polynomial curve fit is applied (Equation (2), A = 0.1143 , B = 1.0993 , C = 0.2716 , D = 0.0733 ) relating the measured intensities to pressures (Figure 4b):
      I r e f ( T ) I d a r k I a i r / f g ( T ) I d a r k = A ( T ) + B ( T ) y + C ( T ) y 2 + D ( T ) y 3 , y = P O 2 , a i r / f g P O 2 , r e f .

4. Data Acquisition

4.1. PSP Measurements on Rotating Blades

One challenge posed by the application of PSP on rotating blades is the trade-off between maximizing the signal-to-noise ratio (SNR) while minimizing the effects of blade movement. Different approaches have been used in the past to address this:
  • Phase-Locked Methods based on Paint Lifetime or Intensity: A strobe light synchronized with the rotor is used to excite the paint [16,17]. The once-per revolution signal is collected on the image sensor with an open camera shutter over several hundred revolutions to improve SNR. This method requires high cycle-to-cycle stability and is susceptible to image blur.
  • A specific Phase-Locked Method based on Intensity: Here, a synchronized strobe light is used as well [5,18]. However, the image sensor is read out every revolution, thus limiting the collected signal. Several hundred images are captured and averaged, accounting for cycle-to-cycle instabilities in blade movement and excitation intensity.
  • Single-Shot Methods based on PSP Lifetime: A laser is used as a high-energy excitation source leading to a high SNR [19,20,21,22]. A double shutter particle image velocimetry (PIV) camera records a set of images with very short exposure times, minimizing the effects of cycle-to-cycle instabilities and blade movement.
While methods (i) and (iii) have been applied for pressure measurements, only method (ii) has been applied to film cooling effectiveness measurements. Method (iii) seems very promising for rotating applications; however, it could not be applied at the LSTR since no appropriate laser/paint combination was available. Method (ii) was tested but discarded due to the low SNR. It was therefore decided to use method (i) and minimize its drawbacks by a tailored experimental design and appropriate image processing.

4.2. Optical Setup

PSP (UniFIB by ISSI, Dayton, OH, USA)) was applied evenly to the rotor tips with a spray gun. The luminescent molecules within the paint were excited by a high-power LED (IL-106UV390 by HardSoft, Krakow, Poland) at 390 nm wavelength (Figure 4a). After excitation, the paint emitted light in the range of 620-750 nm. The emission intensity was recorded using a CCD camera (Imager Pro X 2M by LaVision, Göttingen, Germany with a ZF2-Makro-Planar T*50/2 objective lens by Zeiss, Oberkochen, Germany) through a silicia glass window (HPFS 7980 by Corning, Corning, NY, USA). An optical filter (610 nm by Heliopan, Gräfelfing, Germany) was used to block any excitation light.

4.3. Recording Sequence

The excitation light source was used in strobe mode so that the blade seemed stationary. As a trigger, a light barrier sensor at the rotor shaft was used. Each flash had a duration of 5 μ s resulting in a rotational blur of 0.3 mm. The camera exposure time was chosen to exploit the full-well capacity of the 14-bit camera and was chosen between 25–35 s. At a rotational frequency of 16.67 Hz, this resulted in 416 to 583 revolutions being captured on a single image. Typical values for the SNR were around 40.

4.4. Image Transformation

The raw images are available in pixel coordinates (PC) which are distorted compared to real world coordinates (RWC). To map all images to the same RWC system, circular markers were applied as reference positions using a permanent marker mounted in a milling machine. Resulting marker sizes were around 10 pixels. Twelve dots were applied both at the rim and inside the squealer cavity, constituting a compromise between image registration accuracy and preparation time. To locate the exact marker positions, Bitter et al. [15] suggested cross-correlating an artificial marker with a segmented image. This method was implemented and robustly detects the marker position with an accuracy of ±0.4 pixels. Knowing the marker position in RWC and the position of the markers’ projections in the image in PC, the mathematical relationship between the 3D and 2D frame of reference can be established using a pin hole camera model via direct linear transformation [23]. Using a mesh deduced from the tip CAD model, the recorded intensities are then interpolated without loss in resolution onto a real world coordinate, 3D working grid. The images shown in this publication are the projections of the blade tips from the 3D working grid onto a flat surface tangential to the tip surface and normal to the radial direction.

5. Measurement Uncertainty

5.1. Absolute Uncertainty

A detailed uncertainty calculation was conducted as proposed by Liu and Sullivan [14] for PSP measurements relying on the intensity-ratio method. The uncertainty calculation takes into account the systematic and random uncertainties in calibration and rig measurements for both air ( u P O 2 , a i r ) and foreign gas ( u P O 2 , f g ) pressure maps (Equation (3)):
u η = η P O 2 , a i r 2 · u P O 2 , a i r 2 + η P O 2 , f g 2 · u P O 2 , f g 2 .
The resulting uncertainty u η is the mean absolute uncertainty across all pixels and can be expressed as a function of the cooling effectiveness η (Figure 5a, solid line).

5.2. Contributors in Calibration

There are several main contributors to the measurement uncertainty that are considered in this context (Figure 5b). First, calibration uncertainties can be expressed as the uncertainty in the calibration coefficients using a Taylor Series Method [24]. For reasons of simplicity, the uncertainty was calculated as if a linear relationship was used for calibration. Thus, Equation (2) becomes the Stern–Volmer relation with calibration coefficients A (Intercept) and B (Slope). Uncertainties in calibration arise mainly from the photodetector noise of the CCD camera and the temporal variation in illumination (20–40 counts), but also from the sensor nonlinearity (16–18 counts), and to a small extent from the pressure and temperature measurement.

5.3. Contributors in Measurement

The elemental uncertainties taken into account for the rig measurements include temperature non-uniformity, reference pressure measurement, photodetector noise, pressure mapping on the 3D-surface and blade motion. Uncertainties during measurement stem mainly from the temperature gradient on the blade surface that is estimated using CFD to ±1 K, but again also from photodetector noise. A source of uncertainty that has not been included in this study is the blur due to fluorescent decay as described by Gregory et al. [25]. This blur is expected to affect the areas on the blade and squealer pressure side edge the most, since here are large gradients on the image while at the same time the direction of blade movement is towards the area of interest. This uncertainty is estimated to be around twice the uncertainty caused by blade motion alone.

5.4. Repeatability

The absolute uncertainty is useful when comparing the acquired data to CFD results or measurements taken with different setups by other researchers. However, the uncertainty when comparing results obtained with the same measurement setup to one another is often much smaller and can be referred to as repeatability (Figure 5a, dotted line). To asses the repeatability, several calibration re-runs were conducted at the calibration chamber. This was done with various exposure times and at various temperature levels similar to those used in the previously conducted rig experiments to simulate typical experiment-to-experiment variations. It was found that the uncertainty between repeated measurements is generally about three to four times smaller than the absolute uncertainty.

5.5. Resolution

The minimum measurement resolution Δ η m i n for a single cooling effectiveness measurement was calculated to Δ η m i n = 0.013 0.017 . This high resolution in η combined with the high spatial resolution makes it possible to resolve even small local changes in η .

6. Results

6.1. Measurement Matrix

For a given cooling hole configuration, hole geometry and airfoil geometry, the film-cooling performance depends both on global parameters, i.e. the injection ratio I R = m c ˙ / m ˙ r o t o r , i n and the main stream turbulence, as well as local parameters, i.e. the blowing ratio (BR) and the momentum flux ratio (MR) [26]. The film cooling effectiveness distribution η for a range of coolant mass flows (IR 0.45–0.58–0.70–0.93–1.16–1.40–1.7% rotor inlet mass flow) is presented. While IR values of 0.93% and lower are typically found in an engine for the rotor tip coolant mass flow, higher values can indicate trends and show limitations. First, an axial inflow case (AX) is considered, which is then compared to a high-turbulence swirling inflow case (SW), for which the swirler modules at the turbine inlet were installed. An engine-realistic coolant-to-mainstream density ratio (DR) of 1.5 was achieved using carbon dioxide as a coolant.

6.2. Axial Inflow Baseline Case

For the investigated film cooling configuration, the distribution of η exhibits several characteristics. These are identified exemplarily for a baseline case of IR = 0.93% (Figure 6a). The outlines of the 13 cooling holes and the squealer cavity are plotted as solid lines, while a dash-dotted line near the leading edge (LE) symbolizes the stagnation line.
Along the blade chord, η is increasing with maximum values close to 0.70 at the TE. Locally, clear patterns are visible in the film cooling distribution. To identify individual coolant jets, the film cooling effectiveness is plotted along coordinate s, starting near the LE and then running along the center of the pressure side (PS) rim until the TE (Top of Figure 6a). Jet trajectories are deduced from this information and shown as dotted arrows. Even though there are 13 cooling holes, there are only eight distinct local maxima in η , seven of which can be directly ascribed to the coolant jets from holes 4 to 10, as visible from the trajectories. The findings are presented for four areas of interest:
i
Leading Edge: Looking towards the LE, cooling holes 1 to 3 are located towards the suction side (SS) and do not directly contribute to the cooling in the measurement area in the case of IR = 0.93% and lower.
ii
Pressure Side Rim: Along the PS rim, a pattern can be identified with local maxima and minima in η that stems from the discrete coolant jets.
iii
Squealer Cavity and Suction Side Rim: Inside the cavity close to the PS, the coolant coverage is quite low. In the region of the camberline, the highest values for η inside the cavity are found. Further towards the SS rim, the pattern is extenuated.
iv
Trailing Edge: At the TE, no clear pattern is visible in the case of IR = 0.93%. Since the angles of cooling holes 11 to 13 are steep at the TE, the areas of effect of the coolant jets overlap at the tip, resulting in a more uniform distribution of elevated η .
To further explain these findings, results from steady CFD simulations published by Hilgert et al. [10] are evaluated. Even though these simulations were done without tip coolant injection, they provide useful insight into the flow structure in the tip region (Figure 6b). The flow over the blade tip can generally be separated into two regions that are separated by the streamline over the stagnation point (red). Fluid that enters the tip gap upstream of that line does not directly contribute to the tip leakage flow (black), but is instead turned at the leading edge and sucked into the cavity and feeds the developing vortices. These vortices have also been described by Mischo et al. [27], and are most importantly the rim boundary rollup vortex (blue), the casing vortex (green), and the cavity corner vortex (cyan). The casing vortex as well as the incidence tip leakage (orange) are fed by the SS casing boundary layer and not by the PS tip leakage. Consequently, along the SS of the tip, there is a region of fluid entry into the cavity ( x / c a x < 0.2) and a region of fluid exiting the cavity ( x / c a x > 0.4). Most of the fluid is expected to leave the cavity downstream of x / c a x 0.65 where the tip leakage vortex starts forming.
The streamlines of the tip leakage flow are in good agreement with the estimated jet trajectories from the coolant pattern for jets 4 to 13. It is therefore concluded that the coolant jets follow the tip leakage flow in the tip gap region. Coolant jets 1 to 3 cannot reach the tip surface since no fluid is carried towards the tip gap at the LE towards the SS. The vortices severely impact the leakage flow and therefore the coolant distribution inside the cavity region. Especially the rim boundary layer rollup vortex prevents coolant from reaching the tip surface directly and carries some of the coolant further downstream, leading to a slight bending of the maximum in η in the cavity. As can be seen from the cross sectional representation (Figure 6b, A-A), the casing vortex pushes the leakage flow onto the cavity surface, and thus also the coolant, explaining the increased coolant coverage in the middle section of the cavity. At the position where the casing vortex leaves the squealer cavity at the SS rim and feeds into the tip leakage vortex, it influences the coolant trajectories by pushing jets 7 and 8 apart, as identified from the cooling effectiveness distribution.

6.3. Effect of Swirl in Comparison to Axial Baseline

The effect of inlet swirl on the tip cooling is at first investigated exemplarily by comparison to the axial inflow baseline case with IR = 0.93% (Figure 7a). The changes in film cooling effectiveness Δ η = η S W η A X are in the range of Δ η = ± 0.15 and vary spatially. In the four areas of interest, the following observations can be made:
i
Leading Edge: Due to the change in whirl angle, the stagnation point is shifted towards the SS, resulting in an increasing MR of coolant jet 4. Additionally, the flow vector becomes more axial, pushing coolant jet 3 towards the tip surface, and increasing η in this area.
ii
Pressure Side Rim: The coolant jets along the PS rim are pushed further downstream, which can be seen by a shift in the characteristic pattern on the surface. Coolant jet 8 does not experience the same shift, but stays almost in the same position as before.
iii
Squealer Cavity and Suction Side Rim: Similar to the PS rim, the coolant jet pattern is shifted downstream. Overall, the film cooling effectiveness in the squealer area is increased.
iv
Trailing Edge: Coolant jets 9 to 13 are shifted upstream towards the center of the blade tip and coolant coverage at the TE is decreased drastically for SW resulting in a decrease in η by up to 0.15.
To explain these changes, the dependency of the film cooling distribution on the tip leakage flow is now investigated in detail. As summarized in the section Experimental Setup, inlet swirl decreases the rotor relative inlet whirl angle at the rotor tip (Figure 3) by 6.6° at h r e l = 91.2%. As a result, the direction of the leakage flow over the rotor tip becomes more axial and the stagnation line (dashed-dotted) shifts towards the SS. For an uncooled flat tip, Azad et al. [28] could show that the heat transfer is dependent on the tip leakage flow. They found that heat transfer is increased with increasing tip gap, with the regions of highest heat transfer corresponding to the regions of high tip leakage. They argue that the static pressure difference between PS and SS is the main driver for the leakage flow.
To assess this effect, the pressure coefficient c p as obtained from the steady, uncooled CFD, is plotted along the airfoil at a relative channel height of h r e l = 97.8% (Figure 7b) both for AX (blue) and SW (cyan). To fairly compare AX to SW, c p is defined using the circumferentially averaged static pressure on the casing at the rotor inlet p ¯ s , r o t o r , i n as a reference (Equation (4)):
c p = p s p ¯ s , r o t o r , i n p ¯ t , s t a t o r , i n p ¯ s , r o t o r , i n .
In this way, the mass flow redistribution towards the casing for SW that locally changes the tip aerodynamics is taken into account. As for the total pressure, the area averaged pressure at the stator inlet p ¯ t , s t a t o r , i n is used, since this is the position where there are also total pressure rakes for comparison.
Following the reasoning by Azad et al., an increase in Δ c p between PS and SS can be interpreted as an increase in leakage flow and vice versa. When comparing c p between AX and SW, the c p distribution along the PS is only slightly affected. Near the stagnation point, the maximum c p is somewhat increased, while, along the PS, c p is marginally decreased corresponding to a slight increase in fluid velocity due to the incidence shift. More significant changes are seen along the SS, thus dominating the change in Δ c p between AX and SW. As identified for the Axial Inflow Baseline Case (Figure 6b), along the SS rim, there is a region of fluid entry and a region of fluid exit. At the region of fluid entry, c p is increased by SW (Figure 7b), while at the region of fluid exit, c p is decreased until x / c a x 0.65 where the tip leakage vortex is formed. Further downstream at the TE, c p again is increased.
It can be concluded that, for SW, less fluid enters the squealer cavity at the SS near the TE and more fluids exits the cavity upstream of the tip leakage vortex. Consequently, the tip leakage in the squealer cavity region is increased, while, at the same time, the leakage at the TE region is reduced. This corresponds to the increase in film cooling effectiveness in the squealer cavity region and the corresponding decrease at the TE. Similar to the Axial Inflow Baseline Case, where it has been shown that jet trajectories are primarily influenced by the tip leakage flow, also for SW the coolant distribution is mainly driven by the tip leakage flow.

6.4. Effect of Injection Ratio Variation for Axial Inflow

To explain trends when varying IR, it is useful to look at the local blowing ratio B R = u c ρ c / u g ρ g and momentum flux ratio M R = u c 2 ρ c / u g 2 ρ g of each coolant jet. While local BR is a measure of the amount of coolant supplied at a certain area relative to the amount of main flow, the MR is a measure of the momentum with which the coolant jet penetrates the main flow. If MR is too small, the coolant jet will not reach the tip surface, since it will be carried away by the main flow. If it is too large, the jets will detach and will therefore not contribute to the surface cooling either. Locally, BR and MR will vary for each coolant hole depending on the local main gas velocity u g . To obtain u g , the local isentropic Mach-number M a w , i s is calculated based on the static pressure at each cooling hole which is obtained from CFD for the uncooled case (Equation (5)):
M a w , i s = p t , r p s γ 1 γ 1 2 γ 1 u g = M a w , i s γ R T i s .
With known DR and coolant mass flow, the local BR and MR distribution can be plotted for each IR (Figure 8a).
For varying IR, the spatial distribution of η (Figure 9) is shown along with the laterally averaged values plotted over the non-dimensional axial chord length x / c a x (Figure 10a). Again, the four areas of interest are discussed:
i
Leading Edge: At the LE, near the stagnation point, η decreases with increasing IR. Near the stagnation point, high values of BR and MR are found. This is due to u g approaching zero here. For increasing IR, especially MR becomes very large since u c factors into MR quadratically. At IR = 1.74%, there are no distinct jet traces at the LE. It is concluded that coolant jets 4 and 5 are not attached to the blade surface for this high IR. In contrast, for IR equal to and greater than 0.93%, the SS of the LE is starting to be cooled better. This corresponds to the area affected by jet 3 that gains momentum for higher IR, thus now reaching the rotor tip surface. The traces of jet 1 and 2 cannot be seen on the tip surface for any IR. Considering their MR remains low in all cases, they do not reach the tip surface, thus not contributing to cooling in this area.
ii
Pressure Side Rim: The characteristic coolant jet traces along the PS rim become narrower for increasing IR. Two possible reasons are (1) that the jets are less mixed out and (2) that they are not pushed towards the tip surface as much as for low IR. Both correspond to the increase in MR that is visible for increasing IR for jets 6 to 8.
iii
Squealer Cavity and Suction Side Rim: Inside the cavity, the characteristic coolant jet pattern starts to disappear for higher IR. This can be explained by the jets lifting off for higher IR, so that the coolant does not reach the blade surface directly, but after mixing with the surrounding flow. This leads to a more uniform coverage, while overall relatively little coolant reaches the blade surface in comparison to the high coolant injection.
iv
Trailing Edge: The coolant coverage at the TE increases with increasing IR. For very low IR, coolant jets 9 to 13 have very little momentum and the coolant stays near the PS without being able to cool the TE effectively. As IR is increased and so is MR, the jets have enough momentum to cover the entire TE. Since velocities u g are higher at the TE, the MR does not increase as much as along the PS rim. This corresponds to the cooling performance being not negatively affected in this area, which can be explained by coolant jets still being attached to the surface.

6.5. Effect of Swirl for Varying Injection Ratios

By the decrease in rotor inlet whirl angle due to added swirl, the flow velocity u g along the profile is changed, which in turn alters the local film cooling parameters (Figure 8b). Adding swirl also increases the main flow turbulence intensity by 1.5 percentage points in the upper 10% of the channel leading to increased mixing between the coolant jets and the main flow. Because of that, the coolant jets are more diluted and the local maxima in η are less distinct for SW, especially for small IR (Figure 10b). When comparing SW to AX for varying IR (Figure 9 and Figure 11), the trends are similar to those discussed for AX. However, quantitatively there are considerable differences, as can be seen in the laterally average plots (Figure 10).
By area averaging η across the whole tip surface (Figure 12), it can be seen that SW decreases η by up to 0.05 (26%) for IR smaller than 0.93%, while for larger IR η increases by up to 0.03 (11%). In both cases, a saturation occurs at which an increase in IR does not further increase η . For AX, this happens at IR = 1.16%, while for SW an increase in η can be seen until IR = 1.40%. Gao et al. [4] also found a decrease in η for BR below 2 as incidence was decreased, which is the case for SW, however the DR was around 1 in their study. As Wright et al. [29] show, an increased mixing caused by higher Tu affects the coolant jets, generally leading to a decrease in η . However, as the BR is increased, this effect becomes smaller, which matches the steeper slope in η for SW (Figure 12). To explain why η can be increased further for higher IR in the SW case, the local effects of the swirl on the film coolant jets need further consideration which will be part of future work. From preliminary CFD studies for a cooled tip (not shown), it can already be seen that the coolant jets impinge on the casing wall for high IR. Upon impingement, the jets are split so that part of the coolant is not carried over the tip surface together with the leakage flow, but instead towards the SS of the following blade, hence not contributing to the tip cooling. This effect occurs only at higher IR for SW, leading to an increase in the maximum in η .

7. Conclusions

i
Using pressure sensitive paint, the spatial film cooling distribution at a squealer tip with cylindrical cooling holes was obtained under rotating conditions. Both axial turbine inflow as well as engine-realistic swirling inflow, resulting in a reduced whirl angle and higher turbulence level at the tip, were investigated.
ii
The coolant trajectories are influenced by the whirl angle, the tip leakage flow, and the secondary flow structure around the rotor tip. Due to the swirl, this flow structure changes and in turn affects the local film cooling distribution.
iii
For both inlet conditions, film cooling effectiveness increases when the coolant mass flow is increased, however the absolute value of film cooling effectiveness is dependent both on the inlet condition as well as the coolant mass flow. For low injection ratios, film cooling effectiveness is decreased by turbine inlet swirl by up to 26%, while for high injections rates it is increased by up to 11%.
iv
For an engine-realistic injection ratio of 0.93%, swirling inflow decreases the film cooling effectiveness by about 0.15 at the trailing edge, even though the total area averaged film cooling effectiveness is the same as for axial inflow for this injection ratio. Assuming a hot gas temperature of 1700 K and a coolant temperature of 900 K, a decrease of 0.15 in film cooling effectiveness corresponds to a significant increase in adiabatic wall temperature by 120 K, which needs to be considered during the design process.
v
Beyond a certain point, increasing the coolant mass flow does not further increase cooling effectiveness. This saturation occurs at lower injection ratios for axial inflow and at higher injection ratios for swirling inflow.

Author Contributions

M.W. was responsible for the project administration, conceptualization, methodology, investigation, data curation, visualization, and original draft preparation. H.-P.S. was responsible for review and editing, supervision, and funding acquisition.

Funding

The work reported was partly funded within the framework of the “AG Turbo” by the Federal Republic of Germany, Ministry for Economic Affairs and Energy, according to a decision of the German Bundestag (FKZ: 03ET7021K) as well as by Rolls-Royce Deutschland GmbH and Ansaldo Energia Switzerland AG. Their technical and financial support is appreciated. The APC was funded by the Euroturbo Association.

Acknowledgments

Many thanks to Leonhard Gresser for the support with CFD as well as to everybody else from the LSTR-team, namely Tom Ostrowski, Johannes Eitenmüller, and Sebastian Leichtfuß, for all the direct and indirect contributions. Thank you to my students Jens Langguth, Felix Kaiser, Pejman Bahrampour, and Patrick Bachmann for the great support. Special thanks to Thomas König for the inspiring discussions and to Martin Bitter for all the practical tips on PSP.

Conflicts of Interest

The authors declare no conflict of interest. Rolls-Royce Deutschland and Ansaldo Energia as funding sponsors provided input for the general scope of interest of the study as well as the decision to publish the results. They had no direct role in data collection, analysis, or interpretation.

Abbreviations

Latin
A , B Stern–Volmer coefficients ( )
B R blowing ratio ( )
Cconcentration, mass fraction ( )
cchord length (mm)
cabsolute velocity (m/s)
c p specific heat capacity (J/(kg·K)
c p pressure coefficient ( )
D x blade motion (mm)
D R density ratio ( )
h r e l relative channel height (%)
Iintensity (counts)
I R injection ratio ( % )
L e T turbulent Lewis number ( )
m ˙ mass flow (kg/s)
M a Mach number ( )
M R momentum flux ratio ( )
P , p pressure (Pa)
Rgas constant air (J/mol)
R e Reynolds number ( )
S N R signal-to-noise ratio ( )
Ttemperature (K)
T C tip clearance (%)
uvelocity, circumferential velocity (m/s)
ucombined standard uncertainty (according to input)
wrotor relative velocity (m/s)
Wmolecular weight (kg/kmol)
xaxial coordinate (mm)
Greek
β rotor relative angle (°)
γ heat capacity ratio ( )
Δ difference ( )
η film cooling effectiveness ( )
ρ density (kg/m 3 )
Subscripts
a i r air injection
a w adiabatic wall
a x axial
ccoolant
d a r k dark image
f g foreign gas
ggas, main flow
i n inlet
i s isentropic
m e a n averaged
m i n minimum
o u t outlet
O 2 oxygen
p r i m primary
r a d i a l in radial direction
r e f reference
r e l relative
r o t o r at the rotor
sstatic
s e c secondary
s t a t o r at the stator
ttotal, stagnation
w h i r l in circumferential direction
main flow
Abbreviations
A X axial turbine inflow
C A D computer aided design
C C D charge-coupled device
C F D computational fluid cynamics
L E leading edge
L E D light emitting diode
L S T R Large Scale Turbine Rig
N G V nozzle guide vane
P C pixel coordinates
P I V particle image velocimetry
P S pressure side
P S P pressure sensitive paint
R I D N rear inner discharge nozzle
R W C real world coordinates
S S suction side
S W swirling turbine inflow
T E trailing edge

References

  1. Azad, G.S.; Han, J.C.; Boyle, R.J. Heat Transfer and Flow on the Squealer Tip of a Gas Turbine Blade. J. Turbomach. 2000, 122, 725–732. [Google Scholar] [CrossRef] [Green Version]
  2. Wright, L.M.; McClain, S.T.; Clemenson, M.D. Effect of Freestream Turbulence Intensity on Film Cooling Jet Structure and Surface Effectiveness Using PIV and PSP. J. Turbomach. 2011, 133, 041023. [Google Scholar] [CrossRef]
  3. Rhee, D.H.; Cho, H.H. Local Heat/Mass Transfer Characteristics on a Rotating Blade with Flat Tip in a Low Speed Annular Cascade: Part 2-Tip and Shroud. In Proceedings of the ASME Turbo Expo, Reno, NV, USA, 6–9 June 2005. [Google Scholar]
  4. Gao, Z.; Narzary, D.; Mhetras, S.; Han, J.C. Effect of Inlet Flow Angle on Gas Turbine Blade Tip Film Cooling. J. Turbomach. 2009, 131, 031005. [Google Scholar] [CrossRef]
  5. Rezasoltani, M.; Lu, K.; Schobeiri, M.T.; Han, J.C. A Combined Experimental and Numerical Study of the Turbine Blade Tip Film Cooling Effectiveness Under Rotation Condition. J. Turbomach. 2015, 137, 051009. [Google Scholar] [CrossRef]
  6. Krichbaum, A.; Werschnik, H.; Wilhelm, M.; Schiffer, H.P. A Large Scale Turbine Test Rig for the Investigation of High Pressure Turbine Aerodynamics and Heat Transfer with Variable Inflow Conditions. In Proceedings of the ASME Turbo Expo, Montreal, QC, Canada, 15–19 June 2015. [Google Scholar]
  7. Eitenmüller, J.; Wilhelm, M.; Gresser, L.; Ostrowski, T.; Leichtfuß, S.; Schiffer, H.-P. Highly Accurate Delta Efficiency Measurements at the Large Scale Turbine Rig. In Proceedings of the ASME Turbo Expo, Phoenix, AZ, USA, 17–21 June 2019. [Google Scholar]
  8. Werschnik, H.; Hilgert, J.; Wilhelm, M.; Bruschewski, M.; Schiffer, H.-P. Influence of Combustor Swirl on Endwall Heat Transfer and Film Cooling Effectiveness at the Large Scale Turbine Rig. J. Turbomach. 2017, 139, 081007. [Google Scholar] [CrossRef]
  9. Wilhelm, M.; Schmidt, M.; Goertz, F.; Schiffer, H.-P. Influence of Combustor Swirl on Turbulence at the Large Scale Turbine Rig (LSTR). In Proceedings of the ISABE, Manchester, UK, 3–8 September 2017. [Google Scholar]
  10. Hilgert, J.; Bruschewski, M.; Werschnik, H.; Schiffer, H.-P. Numerical Studies on Combustor-Turbine Interaction at the Large Scale Turbine Rig (LSTR). In Proceedings of the ASME Turbo Expo, Charlotte, NC, USA, 26–30 June 2017. [Google Scholar]
  11. Han, J.C.; Rallabandi, A.P. Turbine Blade Tilm Cooling using PSP Technique. Front. Heat Mass Transf. 2010, 1, 013001. [Google Scholar] [CrossRef]
  12. Kays, M.W.; Crawford, M.E. Convective Heat and Mass Transfer, 3rd ed.; McGraw-Hill: New York, NY, USA, 1993. [Google Scholar]
  13. Charbonnier, D.; Ott, P.; Jonsson, M.; Cottier, F.; Köbke, T. Experimental and Numerical Study of the Thermal Performance of a Film Cooled Turbine Platform. In Proceedings of the ASME Turbo Expo, Orlando, FL, USA, 8–12 June 2009. [Google Scholar]
  14. Liu, T.; Sullivan, J.P. Pressure and Temperature Sensitive Paints; Experimental Fluid Mechanics; Springer: Berlin/Heidelberg, Germany, 2005. [Google Scholar]
  15. Bitter, M. Characterization of a Turbulent Separating/Reattaching Flow Using Optical Pressure and Velocity Measurements. Ph.D. Thesis, Universität der Bundeswehr, München, Germany, 2013. [Google Scholar]
  16. Wong, O.D.; Watkins, N.A.; Ingram, J.L. Pressure Sensitive Paint Measurements on 15% Scale Rotor Blades in Hover. In Proceedings of the AIAA Dynamics Conference and Exhibition, Toronto, ON, Canada, 6–9 June 2005; Volume 6, p. 13. [Google Scholar]
  17. Watkins, N.A.; Leighty, B.D.; Lipford, W.E.; Wong, O.D.; Oglesby, D.M.; Ingram, J.L. Development of a Pressure Sensitive Paint System for Measuring Global Surface Pressure on Rotorcraft Blades. In Proceedings of the International Congress on Instrumentation in Aerospace Simulation Facilities, Pacific Grove, CA, USA, 10–14 June 2007; Volume 22. [Google Scholar]
  18. Suryanarayanan, A.; Ozturk, B.; Schobeiri, M.T.; Han, J.C. Film-Cooling Effectiveness on a Rotating Turbine Platform using Pressure Sensitive Paint Technique. J. Turbomach. 2010, 132, 041001. [Google Scholar] [CrossRef]
  19. Juliano, T.J.; Kumar, P.; Peng, D.; Gregory, J.W.; Crafton, J.; Fonov, S. Single-shot, lifetime-based pressure-sensitive paint for rotating blades. Meas. Sci. Technol. 2011, 22, 085403. [Google Scholar] [CrossRef]
  20. Wong, O.D.; Watkins, N.A.; Goodman, K.Z.; Crafton, J.; Forliness, A.; Goss, L.; Gregory, J.W.; Thomas, J.J. Blade Tip Pressure Measurements using Pressure Sensitive Paint. In Proceedings of the American Helicopter Society Annual Forum, Fort Worth, TX, USA, 1–3 May 2012; Volume 68. [Google Scholar]
  21. Disotell, K.J.; Peng, D.; Juliano, T.J.; Gregory, J.W.; Crafton, J.W.; Komerath, N.M. Single-shot temperature- and pressure-sensitive paint measurements on an unsteady helicopter blade. Exp. Fluids 2014, 55, 78. [Google Scholar] [CrossRef]
  22. Weiss, A.; Geisler, R.; Schwermer, T.; Yorita, D.; Henne, U.; Klein, C.; Raffel, M. Single-shot pressure-sensitive paint lifetime measurements on fast rotating blades using an optimized double-shutter technique. Exp. Fluids 2017, 58, 155. [Google Scholar] [CrossRef]
  23. Azad, P.; Gockel, T.; Dillmann, R. Computer Vision: Das Praxisbuch, 1st ed.; Elektor-Verlag: Aachen, Germany, 2007. [Google Scholar]
  24. Coleman, H.W.; Steele, W.G. Experimentation, Validation, and Uncertainty Analysis for Engineers, 4th ed.; John Wiley & Sons, Inc.: Hoboken, NJ, USA, 2018. [Google Scholar]
  25. Gregory, J.W.; Disotell, K.J.; Peng, D.; Juliano, T.J.; Crafton, J.; Komerath, N.M. Inverse Methods for Deblurring Pressure-Sensitive Paint Images of Rotating Surfaces. AIAA J. 2014, 52, 2045–2061. [Google Scholar] [CrossRef]
  26. Bogard, D.G.; Thole, K.A. Gas Turbine Film Cooling. J. Propuls. Power 2006, 22, 249–270. [Google Scholar] [CrossRef] [Green Version]
  27. Mischo, B.; Behr, T.; Abhari, R.S. Flow Physics and Profiling of Recessed Blade Tips: Impact on Performance and Heat Load. J. Turbomach. 2008, 130, 021008. [Google Scholar] [CrossRef]
  28. Azad, G.S.; Han, J.C.; Teng, S.; Boyle, R.J. Heat Transfer and Pressure Distribution on a Gas Turbine Blade Tip. J. Turbomach. 2000, 122, 717–724. [Google Scholar] [CrossRef]
  29. Wright, L.M.; McClain, S.T.; Clemenson, M.D. Effect of Density Ratio on Flat Plate Film Cooling With Shaped Holes Using PSP. J. Turbomach. 2011, 133, 041011. [Google Scholar] [CrossRef]
Figure 1. Large Scale Turbine Rig test section and operating point.
Ijtpp 04 00023 g001
Figure 2. Squealer tip with coolant configuration.
Ijtpp 04 00023 g002
Figure 3. Velocity triangles with rotor relative angles β r a d i a l and β w h i r l at the rotor tip for axial inflow (solid lines) and swirling inflow (dashed lines) at a relative channel height of h r e l = 91.2%.
Ijtpp 04 00023 g003
Figure 4. Pressure sensitive paint setup.
Ijtpp 04 00023 g004
Figure 5. Measurement uncertainty u η .
Ijtpp 04 00023 g005
Figure 6. Axial inflow baseline.
Ijtpp 04 00023 g006
Figure 7. Comparison between swirling inflow and axial inflow.
Ijtpp 04 00023 g007
Figure 8. Blowing ratio BR (dashed lines) and momentum flux ratio MR (solid lines) for different injection ratios IR (in %) at each coolant hole (1 to 13).
Ijtpp 04 00023 g008
Figure 9. Cooling effectiveness η for axial inflow.
Ijtpp 04 00023 g009
Figure 10. Laterally averaged film cooling effectiveness η for different injection ratios IR along the normalized axial chord x / c a x .
Ijtpp 04 00023 g010
Figure 11. Difference in cooling effectiveness between swirling and axial inflow Δ η = η S W η A X .
Ijtpp 04 00023 g011
Figure 12. Area averaged film cooling effectiveness η for axial inflow AX (blue ∘) and swirling inflow SW (green *).
Ijtpp 04 00023 g012

