Article

Associations Between Food Access and Frailty Among Community-Dwelling Older Adults

1
Center for Nutritional Epidemiology and Policy Research, National Institute of Health and Nutrition, 3-17 Senrioka Shimmachi, Settsu 566-0002, Osaka, Japan
2
Research Institute for Nutrition Sciences, Mukogawa Women’s University, 6-46 Ikebiraki-cho, Nishinomiya 663-8558, Hyogo, Japan
3
Department of Food Sciences and Nutrition, School of Food Sciences and Nutrition, Mukogawa Women’s University, 6-46 Ikebiraki-cho, Nishinomiya 663-8558, Hyogo, Japan
4
Department of Innovative Food Sciences, School of Food Sciences and Nutrition, Mukogawa Women’s University, 6-46 Ikebiraki-cho, Nishinomiya 663-8558, Hyogo, Japan
*
Author to whom correspondence should be addressed.
J. Gerontol. Geriatr. 2026, 74(3), 18; https://doi.org/10.3390/jgg74030018
Submission received: 10 June 2026 / Revised: 3 July 2026 / Accepted: 8 July 2026 / Published: 13 July 2026

Abstract

The study examined how multiple dimensions of food access relate to frailty among community-dwelling older adults. A mail-based questionnaire was sent in August 2020 to 5000 residents aged 65 years or older in City N, Prefecture H, yielding 2151 valid responses. Food access was evaluated using time to the nearest grocery store, frequency of grocery shopping, and perceived shopping convenience, while frailty was assessed with the five-item Frailty Screening Index. Overall, 15.9% of respondents were classified as frail. Travel time to the nearest store showed no significant association with frailty. In contrast, shopping fewer than three times per week was independently associated with higher odds of frailty, although the magnitude of this association was smaller than that observed for perceived shopping difficulty. Perceived shopping difficulty demonstrated the strongest association with frailty, with participants reporting shopping difficulty having markedly higher odds of frailty after adjustment for potential confounders. These findings suggest that subjective shopping convenience may be a useful indicator associated with frailty, potentially reflecting the physical and psychological burden of grocery shopping in addition to food access.

1. Introduction

In an era of rapid population aging, maintaining the health and independence of community-dwelling older adults in Japan has become a critical public health priority [1]. Based on a narrative review, frailty is defined as a state of increased vulnerability to stressors resulting from an age-related decline in physiological reserves [2]. Frailty is associated with adverse health outcomes, including functional decline, disability, long-term care needs, and mortality [3,4]. Identifying modifiable factors associated with frailty is therefore an important public health challenge.
The food environment has been recognized as an important determinant of healthy aging [5,6]. Food access is a multidimensional concept that includes objective factors, such as distance to food stores and transportation availability, as well as subjective factors, including perceived shopping convenience [7]. Previous studies have reported associations between poor food access, reduced dietary quality, malnutrition, and frailty among older adults [8,9,10,11,12,13,14,15,16]. However, evidence regarding which dimensions of food access are most strongly associated with frailty remains limited and inconsistent.
Objective indicators, such as geographic distance to grocery stores, may not fully capture individuals’ actual shopping experiences. Older adults may perceive grocery shopping as difficult because of environmental barriers, transportation availability, physical burden, or other contextual factors, even when food stores are geographically accessible [10,11,17]. Therefore, subjective assessments of shopping convenience may provide complementary information beyond objective measures of food access.
Although several studies have examined food access in relation to nutritional status or frailty, few have simultaneously evaluated objective, behavioral, and subjective dimensions of food access within the same population [14,15,18,19]. Clarifying which dimension is most strongly associated with frailty may improve our understanding of food access among community-dwelling older adults.
Therefore, this study aimed to examine the associations between three dimensions of food access—travel time to the nearest grocery store, grocery shopping frequency, and perceived shopping convenience—and frailty among community-dwelling older adults. We hypothesized that perceived shopping convenience, representing a subjective evaluation of food access, would show a stronger association with frailty than objective (travel time) or behavioral (shopping frequency) indicators.

2. Materials and Methods

2.1. Study Population and Procedure

In August 2020, a self-administered, mail-based questionnaire survey was conducted among older adults aged ≥65 years residing in City N, Prefecture H. A total of 5000 individuals were randomly selected from the municipal resident registry, and responses were obtained from 2667 individuals (response rate: 53.3%). City N is located in southeastern H and had a population of approximately 486,000 and an aging rate of 24.4% in 2020. The city is a predominantly urban municipality with relatively good access to public transportation and retail facilities, although accessibility to grocery stores may vary depending on neighborhood characteristics and individual mobility.

2.2. Measures

The self-administered questionnaire assessed sociodemographic characteristics, frailty, dietary diversity, and food access.

2.2.1. Sociodemographic Characteristics

Participants reported their sex, age, height, weight, living arrangements (living alone or not), and current economic status. Body mass index (BMI) was calculated as weight (kg) divided by height squared (m2). Economic status was assessed using a five-point scale, where 1 = very comfortable and 5 = very difficult. The Dietary Variety Score developed by Kumagai et al. [20] was used to evaluate dietary diversity. Participants reported the frequency of consumption of ten food groups: meat, fish and shellfish, eggs, soybean products, milk, seaweed, green and yellow vegetables, fruits, potatoes, and fats/oils. Responses were rated on a four-point scale, where 1 = every day and 4 = rarely. “Every day” was scored as 1 point, and all other responses were scored as 0 points; the total score ranged from 0 to 10.

2.2.2. Frailty

The five-item Frailty Screening Index (FSI) developed by Yamada and Arai [19] was used to assess frailty. The FSI consists of five yes/no items evaluating recent weight loss, reduced physical function (walking speed), decreased physical activity, cognitive function (memory), and exhaustion. Participants scoring three or more points were classified as frail, whereas those scoring fewer than three points were classified as non-frail.

2.2.3. Food Access

Food access was assessed using three dimensions:
  • Time to the nearest grocery store:
Participants were asked, “How long does it take to reach the store where you usually purchase groceries?”
Response options included: “approx. 5 min,” “approx. 10 min,” “approx. 15 min,” “approx. 20 min,” and “30 min or more.” For analysis, “approx. 5 min” and “approx. 10 min” were combined and categorized as ≤10 min, whereas all other responses were categorized as >10 min.
  • Frequency of grocery shopping:
Participants were asked, “How often do you go shopping for groceries at supermarkets, shopping streets, or convenience stores?”
Response options included: “every day,” “5–6 days per week,” “3–4 days per week,” “1–2 days per week,” and “rarely.” For analysis, “every day,” “5–6 days per week,” and “3–4 days per week” were combined and categorized as ≥3 times per week, whereas the remaining categories were categorized as <3 times per week.
  • Perceived shopping convenience (subjective food access):
Participants were asked, “Is grocery shopping (or obtaining food) easy for you?”
Response options included: “very easy,” “fairly easy,” “somewhat difficult,” and “very difficult.” For analysis, “very easy” and “fairly easy” were combined and categorized as easy, whereas “somewhat difficult” and “very difficult” were categorized as difficult. This question was intended to assess participants’ overall subjective perception of shopping convenience rather than objective geographic accessibility alone. The perceived difficulty may reflect multiple dimensions of food acquisition, including physical accessibility, transportation availability, environmental barriers, and the overall burden associated with grocery shopping. However, this single-item measure was not designed to distinguish specific sources of difficulty, such as physical, financial, or cognitive barriers.

2.3. Analytical Approach

2.3.1. Analytical Sample

Participants who reported that they did not purchase groceries (n = 62) were excluded. Additionally, individuals with missing data for the FSI, dietary variety score, any of the three food access variables, sex, age, height, weight, living arrangement, or economic status (n = 454) were excluded. The final sample comprised 2151 participants (932 men and 1219 women).

2.3.2. Statistical Analysis

First, we examined the associations between food access and frailty using univariate analyses. Chi-square tests were used to assess the associations between food access and frailty, and t-tests were used to examine the associations between food access and FSI scores.
Next, we performed multivariable logistic regression and multiple logistic regression analyses with frailty (non-frail = 0, frail = 1) as the dependent variable, respectively. Multiple linear regression analyses were also conducted using the Frailty Screening Index (FSI) score as the dependent variable. In both models, the three food access variables were included as independent variables, and sociodemographic characteristics were included as covariates (age ≥75 years, sex, BMI group [<18.5, 18.5–24.9, and ≥25.0 kg/m2], living alone, economic status, and dietary variety score). DVS was included to evaluate whether the associations between food access and frailty were independent of dietary quality, which has been consistently associated with frailty in previous studies.
Analyses were conducted for the total sample and stratified by sex. The sex-stratified analyses were conducted as exploratory analyses to describe potential differences between men and women. Formal interaction testing between sex and food access variables was not performed. All statistical analyses were performed using R version 4.3.1, with a two-sided significance level of 5%.

3. Results

The mean age (standard deviation [SD]) was 74.2 (6.0) years overall, 74.3 (6.2) years for men, and 74.0 (5.9) years for women (Table 1). A total of 343 participants (15.9%) were classified as frail, including 124 men (13.3%) and 219 women (18.0%). The mean dietary variety score was 4.19 (2.18) points overall, 3.69 (2.18) points among men, and 4.58 (2.09) points among women.
The mean FSI score was significantly higher among participants who reported spending more than 10 min reaching grocery stores (p = 0.008), shopping fewer than three times per week (p = 0.002), and perceiving grocery shopping as less convenient (p < 0.001) (Table 2). Regarding grocery shopping frequency, the proportion of frail individuals was higher among those who reported shopping fewer than three times per week (p = 0.040). Perceived shopping convenience was significantly associated with frailty in the overall sample and among both men and women, with a higher prevalence of frailty among participants who perceived shopping as less convenient (p < 0.001).
In the total sample, shopping fewer than three times per week was significantly associated with higher odds of frailty in both crude and multivariable-adjusted models (multivariable-adjusted model: OR = 1.36, 95% CI: 1.07–1.73) (Table 3). Perceived shopping difficulty displayed the strongest association with frailty, with participants reporting shopping difficulty having markedly higher odds of frailty in both models (multivariable-adjusted model: OR = 2.81, 95% CI: 1.88–4.20). In sex-stratified analyses, shopping fewer than three times per week showed a significant association with frailty among men, whereas this association was not statistically significant among women. Perceived shopping difficulty was associated with frailty in both sexes, with larger effect estimates observed among men. Because formal interaction testing was not conducted, these sex-specific findings should be interpreted descriptively rather than as evidence of true sex differences.
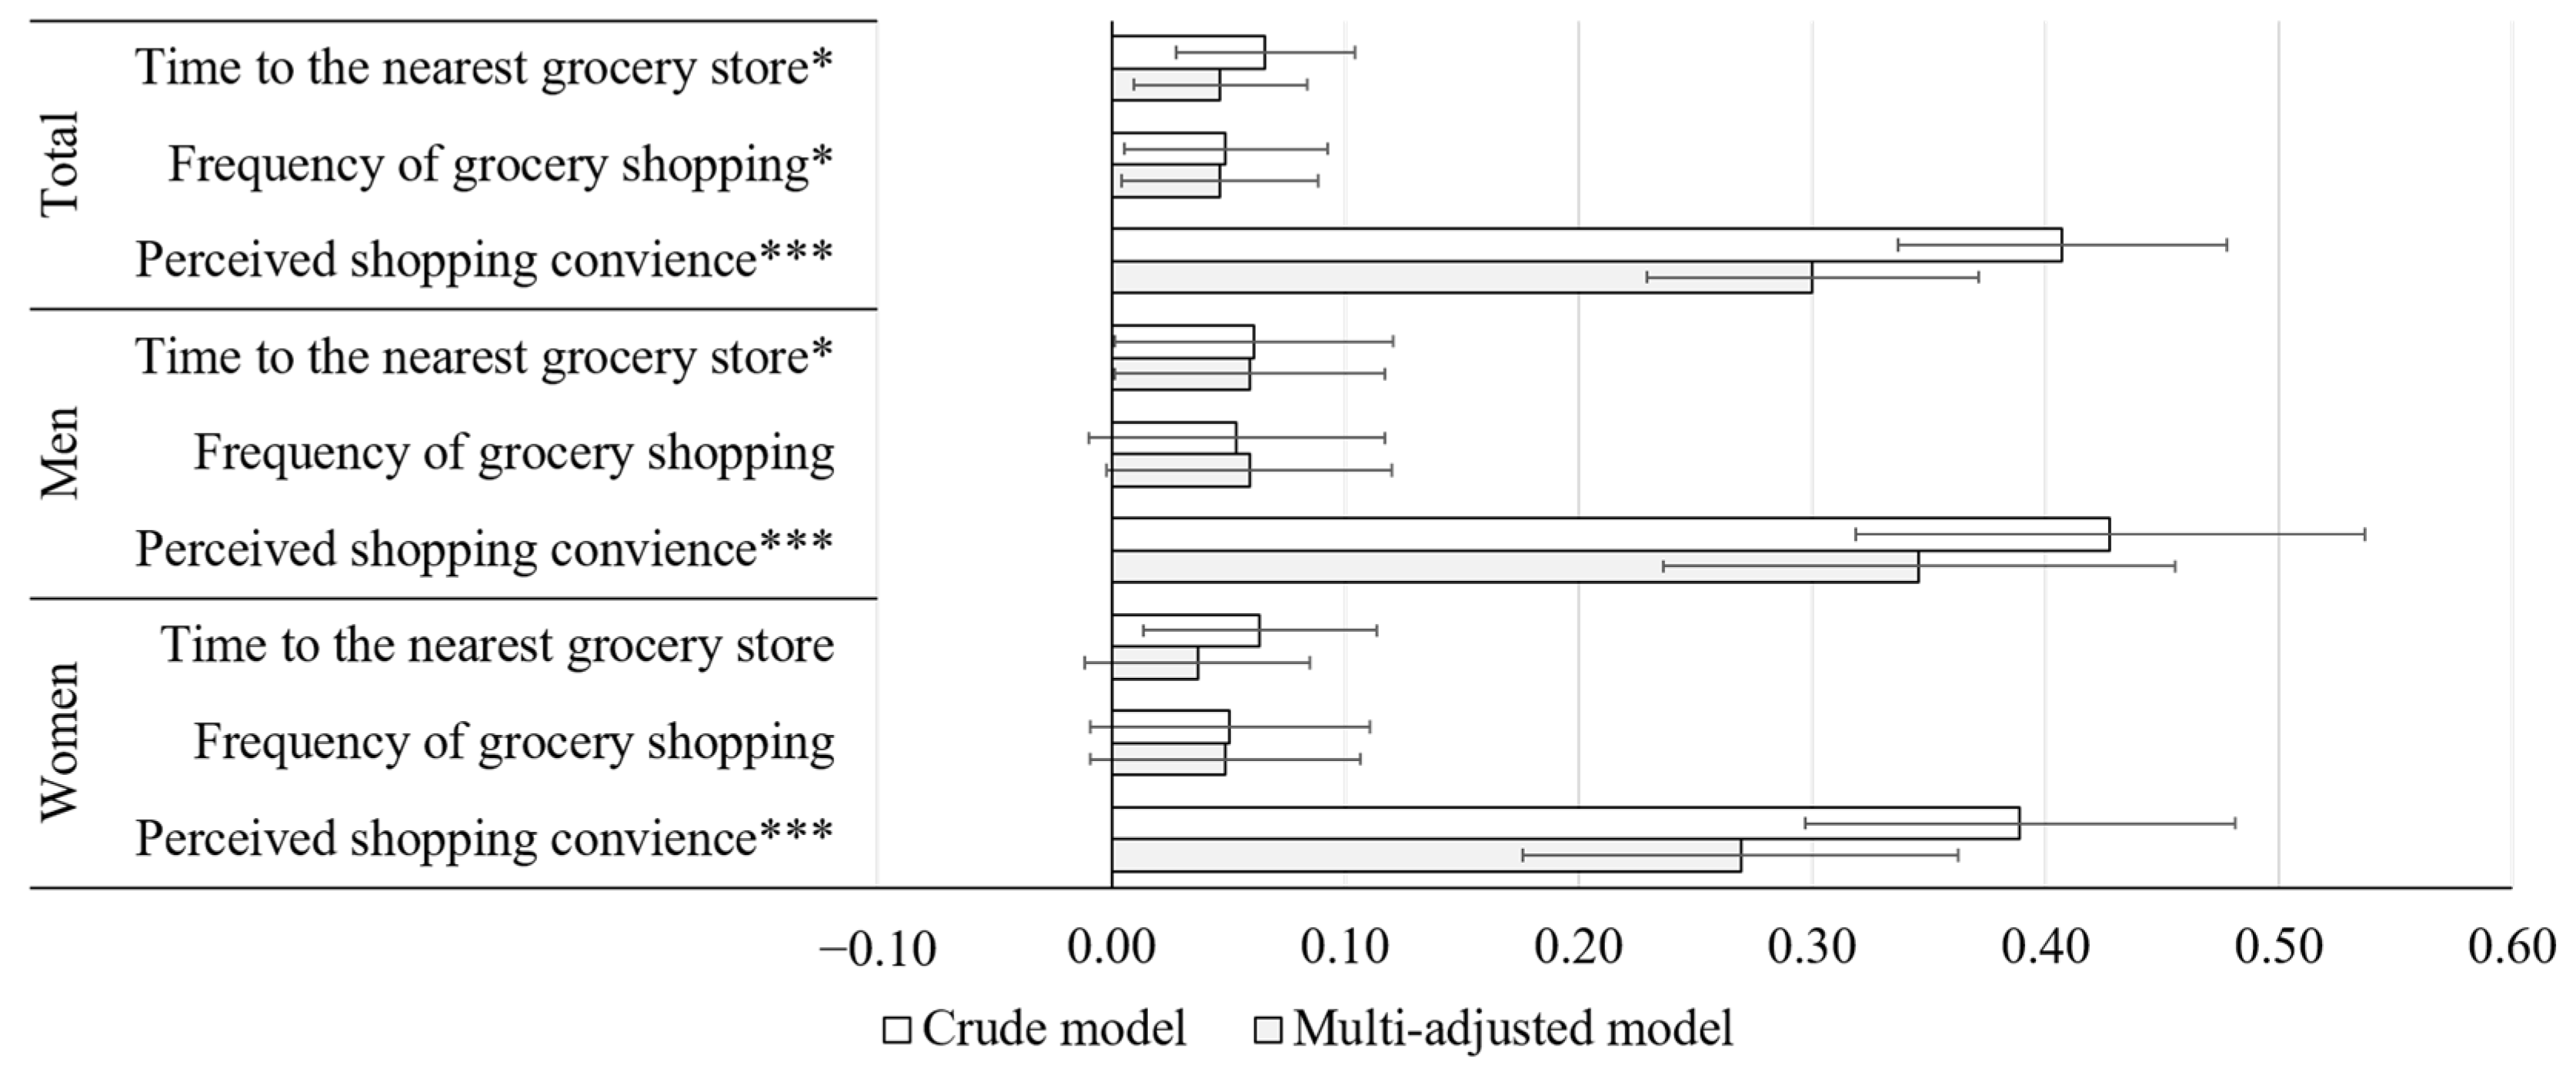
In the crude models, all three food access indicators were positively associated with FSI. Among the total sample, the partial regression coefficients were 0.07 (95% CI: 0.03–0.10), 0.05 (95% CI: 0.01–0.09), and 0.41 (95% CI: 0.34–0.48) for time to the nearest grocery store, frequency of grocery shopping, and perceived shopping convenience, respectively (Figure 1). Similar magnitudes were observed among men (0.06, 0.05, and 0.43, respectively) and women (0.06, 0.05, and 0.39, respectively). In the crude models, longer travel time, lower shopping frequency, and lower perceived shopping convenience were each associated with higher FSI, with coefficients ranging from 0.05 to 0.41. After adjusting for covariates, these associations remained positive, with coefficients of 0.05–0.30 in the total sample. Similar positive coefficients were observed among men (0.06–0.35) and women (0.04–0.27), further indicating that poorer food access consistently corresponded to higher FSI scores across sexes. These sex-stratified results describe similar directional associations across sexes; however, because no formal interaction tests were performed, they should be interpreted as descriptive patterns rather than definitive sex-specific differences.

4. Discussion

This study examined the associations between food access and frailty among community-dwelling older adults. Perceived shopping difficulty showed the strongest association with frailty after adjustment for potential confounders, whereas shopping fewer than three times per week was also independently associated with frailty. In contrast, travel time to the nearest grocery store was not significantly associated with frailty. These findings suggest that subjective shopping convenience may capture aspects of food acquisition that are more closely associated with frailty than objective geographic accessibility.
Food access has been associated with frailty and nutritional status among older adults in previous studies [14,21,22]. Our findings extend this evidence by demonstrating that different dimensions of food access are not equally associated with frailty. Although shopping frequency remained independently associated with frailty, perceived shopping difficulty showed a substantially stronger association, suggesting that subjective assessments may capture additional aspects of the shopping experience that are not reflected by objective or behavioral indicators alone.
Perceived shopping difficulty is likely to represent a multidimensional construct rather than geographic food access alone. Older adults may perceive grocery shopping as difficult because of reduced walking ability, difficulty carrying groceries, limited transportation, environmental barriers such as slopes or heavy traffic, or psychological burden associated with shopping [10,11,23,24,25]. Consequently, this subjective measure may reflect both characteristics of the food environment and an individual’s physical and psychological functioning [4,23].
Therefore, the stronger association observed for perceived shopping difficulty should not be interpreted as evidence that poor food access causes frailty. An alternative explanation is that individuals who are already frail are more likely to perceive grocery shopping as difficult because of existing functional limitations [4,23]. Thus, reverse causation and conceptual overlap between perceived shopping difficulty and frailty should be carefully considered when interpreting the present findings.
Second, subjective evaluations of food access may capture individual living environments more comprehensively than objective indicators. Even among participants living similar distances from grocery stores, shopping experiences may differ depending on transportation availability, neighborhood walkability, traffic conditions, store characteristics, and social support [10,11]. These contextual factors may explain why subjective shopping convenience demonstrated stronger associations with frailty than travel time alone [10,17]. However, because the present study was cross-sectional, the temporal relationship between perceived shopping difficulty and frailty remains unclear, and longitudinal studies are needed to clarify the direction of these associations [14,15,16].
Consistent with this interpretation, perceived environmental barriers have been associated with health behaviors and health-related outcomes in previous studies. Perceived walkability has been associated with walking behavior and health-related quality of life, while perceived food availability has been associated with dietary behaviors and nutritional status [26,27,28]. Our findings suggest that subjective shopping convenience may serve as a useful indicator for identifying older adults who experience greater difficulty obtaining food. However, whether improving shopping convenience leads to improvements in frailty cannot be determined from the present cross-sectional data, and this hypothesis should be examined in longitudinal and intervention studies [14,21].
Sex-stratified analyses suggested differences in the magnitude of the observed associations. However, because formal interaction analyses were not performed, these findings should be interpreted as descriptive rather than indicating true sex differences. Future studies should formally evaluate potential interactions between sex and food access.
Our study has several limitations. First, because this study employed a cross-sectional design, causal relationships between food access and frailty cannot be established. Reverse causation is possible, whereby frailty itself may increase perceived shopping difficulty [4]. Second, objective measures of food access were not included, thereby preventing direct comparison with subjective assessments. Third, although previous studies have suggested that limited food access may precede declines in physical function, our cross-sectional design did not allow for definitive causal inference. Accordingly, longitudinal research is required to establish the directionality of these relationships more clearly. Fourth, the use of a self-administered questionnaire may have introduced subjective or recall bias. Fifth, we did not collect information such as multimorbidity, polypharmacy, functional status, psychological well-being, and other health-related characteristics in the present study. We further explained that these variables may confound the association between food access and frailty and therefore should be incorporated into future studies. Sixth, the response rate of 53.3% suggests that the sample may not have fully represented all eligible residents, and the extent to which this may have influenced the findings remains uncertain. Finally, because this study was conducted in an urban area, the findings may not be generalizable to rural settings with different food environments.

5. Conclusions

This study demonstrated that perceived shopping difficulty showed the strongest association with frailty among community-dwelling older adults, whereas shopping fewer than three times per week was also independently associated with frailty. In contrast, travel time to the nearest grocery store was not significantly associated with frailty. These findings suggest that subjective shopping convenience may serve as a useful indicator associated with frailty, potentially reflecting both environmental characteristics related to food acquisition and individual physical and psychological functioning. Because this study was cross-sectional, causal relationships cannot be inferred, and the possibility of reverse causation should be considered when interpreting the findings. Future longitudinal studies incorporating objective measures of food access, physical function, and health status are needed to clarify the direction and mechanisms underlying these associations.

Author Contributions

N.O., N.T., and K.F. designed the study. N.O., T.I., and N.T. participated in the data collection. T.K. analyzed and interpreted the data and prepared the draft manuscript. N.O., T.I., N.T., and K.F. revised the manuscript for important intellectual content. All authors have read and agreed to the published version of the manuscript.

Funding

This research was supported by the Department of Planning and Prefectural Citizens, Hyogo Prefecture, under Grant No. 10 and JSPS KAKENHI Grant Nos. 20K19730 and 21K11435.

Institutional Review Board Statement

The study was conducted in accordance with the Declaration of Helsinki, and the study protocol was approved by the Ethics Committee of Mukogawa Women’s University (Approval Number: 20–53, date of approval: 1 August 2020).

Informed Consent Statement

Prior to completing the questionnaire, all participants were informed about the purpose of the study, the voluntary nature of their participation, the handling and confidentiality of their data, and their right to withdraw at any time without penalty. Returning the completed questionnaire was considered to indicate informed consent, in accordance with the ethical approval.

Data Availability Statement

The data presented in this study are available on request from the corresponding author due to ethical reasons (public posting of data into a repository was not specified a priori within informed consent for participants).

Acknowledgments

We thank the employees of the Nishinomiya City Office for their assistance in distributing the survey questionnaires.

Conflicts of Interest

The authors declare no conflicts of interest.

Abbreviations

The following abbreviations are used in this manuscript:
BMIBody mass index
FSIFrailty Screening Index
SDStandard deviation
OROdds ratio
CIConfidence interval

References

  1. Annual Report on the Ageing Society. 2025. Available online: https://www8.cao.go.jp/kourei/english/annualreport/2025/pdf/2025.pdf (accessed on 10 June 2026).
  2. Clegg, A.; Young, J.; Iliffe, S.; Rikkert, M.O.; Rockwood, K. Frailty in elderly people. Lancet 2013, 381, 752–762. [Google Scholar] [CrossRef] [Scilit] [PubMed]
  3. Chen, X.; Mao, G.; Leng, S.X. Frailty syndrome: An overview. Clin. Interv. Aging 2014, 9, 433–441. [Google Scholar] [CrossRef] [Scilit] [PubMed]
  4. Fried, L.P.; Tangen, C.M.; Walston, J.; Newman, A.B.; Hirsch, C.; Gottdiener, J. Frailty in older adults: Evidence for a phenotype. J. Gerontol. A Biol. Sci. Med. Sci. 2001, 56, M146–M156. [Google Scholar] [CrossRef] [Scilit] [PubMed]
  5. Kheirouri, S.; Alizadeh, H. Dietary diversity and cognitive performance in older adults: A systematic review. BMC Neurol. 2025, 25, 144. [Google Scholar] [CrossRef] [Scilit] [PubMed]
  6. Molani-Gol, R.; Rafraf, M.; Alipour, B. Association between dietary diversity and healthy aging: A systematic review. BMC Nutr. 2025, 11, 102. [Google Scholar] [CrossRef] [Scilit] [PubMed]
  7. Caspi, C.E.; Sorensen, G.; Subramanian, S.V.; Kawachi, I. The local food environment and diet: A systematic review. Health Place 2012, 18, 1172–1187. [Google Scholar] [CrossRef] [Scilit] [PubMed]
  8. Choi, Y.J.; Crimmins, E.M.; Kim, J.K.; Ailshire, J.A. Food and nutrient intake and diet quality among older Americans. Public Health Nutr. 2021, 24, 1638–1647. [Google Scholar] [CrossRef] [Scilit] [PubMed]
  9. Yakushiji, T.; Asakawa, T.; Iwama, N.; Takahashi, K.; Tanaka, K. Difficulties in Accessing Grocery Stores in a Super-Aged Society; Harvest-Sha: Tokyo, Japan, 2015. [Google Scholar]
  10. Diez Roux, A.V. Investigating neighborhood and area effects on health. Am. J. Public Health 2001, 91, 1783–1789. [Google Scholar] [CrossRef] [Scilit] [PubMed]
  11. Kawachi, I.; Berkman, L.F. Neighborhoods and Health; Oxford University Press: Oxford, UK, 2003. [Google Scholar]
  12. Walker, R.E.; Keane, C.R.; Burke, J.G. Disparities and access to healthy food in the United States: A review of food deserts literature. Health Place 2010, 16, 876–884. [Google Scholar] [CrossRef] [Scilit] [PubMed]
  13. Norman, K.; Haß, U.; Pirlich, M. Malnutrition in older adults-recent advances and remaining challenges. Nutrients 2021, 13, 2764. [Google Scholar] [CrossRef] [Scilit] [PubMed]
  14. Kim, Y.M.; Yang, N.; Kim, K. Effects of perceived food store environment on malnutrition and frailty among the food-insecure elderly in a metropolitan city. Nutrients 2021, 13, 2392. [Google Scholar] [CrossRef] [Scilit] [PubMed]
  15. Kosaka, S.; Nakao, R.; Goto, C.; Umezaki, M.; Ohnishi, M. Food store accessibility affects nutritional intake through shopping frequency and food intake in middle-aged to older adults in rural Nagasaki, Japan. Am. J. Hum. Biol. 2022, 34, e23725. [Google Scholar] [CrossRef] [Scilit] [PubMed]
  16. Zhang, M.; Debarchana, G. Spatial supermarket redlining and neighborhood vulnerability: A case study of Hartford, Connecticut. Trans. GIS 2016, 20, 79–100. [Google Scholar] [PubMed]
  17. Inagami, S.; Cohen, D.A.; Finch, B.K.; Asch, S.M. You are where you shop: Grocery store locations, weight, and neighborhoods. Am. J. Prev. Med. 2006, 31, 10–17. [Google Scholar] [CrossRef] [Scilit] [PubMed]
  18. Shinkai, S.; Yoshida, H.; Taniguchi, Y.; Murayama, H.; Nishi, M.; Amano, H. Public health approach to preventing frailty in the community and its effect on healthy aging in Japan. Geriatr. Gerontol. Int. 2016, 16, 87–97. [Google Scholar] [CrossRef] [Scilit] [PubMed]
  19. Yamada, M.; Arai, H. Predictive value of frailty scores for healthy life expectancy in community-dwelling older Japanese adults. J. Am. Med. Dir. Assoc. 2015, 16, 1002.e7–1002.e11. [Google Scholar] [CrossRef] [Scilit] [PubMed]
  20. Kumagai, S.; Watanabe, S.; Shibata, H.; Amano, H.; Fujiwara, Y.; Shinkai, S. Effects of dietary variety on declines in high-level functional capacity in elderly people living in a community. Jpn. J. Pub Health 2003, 50, 1117–1124. [Google Scholar]
  21. Fowler, M.E.; Harmon, C.; Sharafeldin, N.; Baker, E.; Oates, G.; Nassel, A. The association between food access and frailty among older adults with gastrointestinal malignancies-The CARE Registry. Cancer 2024, 130, 1083–1091. [Google Scholar] [CrossRef] [Scilit] [PubMed]
  22. Fulay, A.P.; Farsijani, S.; Freeland, K.; Roberts, J.; Rosso, A.L.; Houston, D.K. Development of an older adult Nutrition Equity Index (NEI) and association with the Healthy Eating Index (HEI) in older Black and White U.S. adults. J. Nutr. Health Aging 2024, 28, 100343. [Google Scholar] [CrossRef] [Scilit] [PubMed]
  23. Asao, A.; Sone, T.; Fujita, T.; Hayashi, H.; Kurasawa, S.; Sumigawa, K. Association between shopping assistance and functional decline in older residents with support levels under the long-term care insurance system in Japan: A retrospective, cross-sectional study. Geriatrics 2024, 9, 162. [Google Scholar] [CrossRef] [Scilit] [PubMed]
  24. Okada, F.; Toyokawa, S.; Kaneko, T.; Furuhata, T. Loss of access to daily necessities and locomotive syndrome: Nationwide cross-sectional survey on dietary environment in relation to difficulty of shopping for elderly living at home. Bull. Soc. Med. 2018, 35, 19–28. [Google Scholar]
  25. Tani, Y.; Kondo, N.; Takagi, D.; Saito, M.; Hikichi, H.; Ojima, T. Combined effects of eating alone and living alone on unhealthy dietary behaviors, obesity and underweight in older Japanese adults: Results of the JAGES. Appetite 2015, 95, 1–8. [Google Scholar] [CrossRef] [Scilit] [PubMed]
  26. Sugiyama, T.; Leslie, E.; Giles-Corti, B.; Owen, N. Associations of neighbourhood greenness with physical and mental health: Do walking, social coherence and local social interaction explain the relationships? J. Epidemiol. Commun. Health 2008, 62, e9. [Google Scholar] [CrossRef] [Scilit]
  27. Dean, W.R.; Sharkey, J.R. Food insecurity, social capital and perceived personal disparity in a predominantly rural region of Texas: An individual-level analysis. Soc. Sci. Med. 2011, 72, 1454–1462. [Google Scholar] [CrossRef] [Scilit] [PubMed]
  28. Nakamura, H.; Nakamura, M.; Okada, E.; Ojima, T.; Kondo, K. Association of food access and neighbor relationships with diet and underweight among community-dwelling older Japanese. J. Epidemiol. 2017, 27, 546–551. [Google Scholar] [CrossRef] [Scilit] [PubMed]
Figure 1. Partial regression coefficients and 95% confidence intervals for the associations between food access and the frailty screening index (multiple regression analysis). Multivariable models were adjusted for sex, age (<75 or ≥75 years), body mass index (<18.5, 18.5–24.9, or ≥25.0 kg/m2), living alone, current economic status, and food diversity score (* p < 0.05, *** p < 0.001).
Jgg 74 00018 g001
Table 1. Participant characteristics.
TotalMenWomenp-Value
n = 2151n = 932n = 1219
Age (years), mean ± SD74.2(6.0)74.3(6.2)74.0(5.9)0.258
Height (cm), mean ± SD159.4(8.5)166.8(5.8)153.8(5.5)<0.001
Weight (kg), mean ± SD57.5(10.6)64.9(9.1)51.8(7.8)<0.001
Body mass index (kg/m2), mean ± SD22.5(3.1)23.3(2.8)21.9(3.1)<0.001
Living alone, n (%)408(19.0)117(12.6)291(23.9)<0.001
Current economic status, n (%) 0.465
 Very comfortable154(7.2)57(6.1)97(8.0)
 Somewhat comfortable603(28.0)256(27.5)347(28.5)
 Not comfortable but not in financial difficulty1222(56.8)543(58.3)679(55.7)
 Somewhat difficult132(6.1)57(6.1)75(6.2)
 Very difficult40(1.9)19(2.0)21(1.7)
Frailty, n (%)343(15.9)124(13.3)219(18.0)0.004
 Frailty components, n (%)
 Weight loss309(14.4)152(16.3)157(12.9)0.029
 Low physical function1201(55.8)540(57.9)661(54.2)0.094
 Low physical activity888(41.3)331(35.5)557(45.7)<0.001
 Cognition119(5.5)54(5.8)65(5.3)0.712
 Exhaustion511(23.8)178(19.1)333(27.3)<0.001
Dietary variety
 Food items consumed every day, n (%)
 Meat923(42.9)345(37.0)578(47.4)<0.001
 Fish and shellfish367(17.1)146(15.7)221(18.1)0.148
 Eggs1005(46.7)410(44.0)595(48.8)0.030
 Soybean products954(44.4)373(40.0)581(47.7)<0.001
 Milk1660(77.2)651(69.8)1009(82.8)<0.001
 Seaweed323(15.0)125(13.4)198(16.2)0.078
 Green and yellow vegetables1390(64.6)482(51.7)908(74.5)<0.001
 Fruits1256(58.4)470(50.4)786(64.5)<0.001
 Potatoes178(8.3)59(6.3)119(9.8)0.005
 Fats/oils964(44.8)378(40.6)586(48.1)0.001
SD: standard deviation.
Table 2. Associations between food access and frailty.
FrailtyNon-Frailty Frailty Score
nn%n%p-ValueMeanSDp-Value
TotalTime to the nearest grocery store10 min or less1273197(15.5)1076(84.5)0.5101.36(1.09)0.008
More than 10 min878146(16.6)732(83.4) 1.48(1.06)
Frequency of grocery shopping3 or more days a week1332195(14.6)1137(85.4)0.0401.35(1.06)0.002
Less than 3 days a week819148(18.1)671(81.9) 1.50(1.11)
Perceived shopping convenienceEasy2029297(14.6)1732(85.4)<0.0011.36(1.06)<0.001
Difficult12246(37.7)76(62.3) 2.20(1.09)
MenTime to the nearest grocery store10 min or less59179(13.4)512(86.6)1.0001.33(1.06)0.486
More than 10 min34145(13.2)296(86.8) 1.38(1.05)
Frequency of grocery shopping3 or more days a week53859(11.0)479(89.0)0.0181.26(1.02)0.004
Less than 3 days a week39465(16.5)329(83.5) 1.46(1.10)
Perceived shopping convenienceEasy888104(11.7)784(88.3)<0.0011.30(1.03)<0.001
Difficult4420(45.5)24(54.5) 2.20(1.21)
WomenTime to the nearest grocery store10 min or less682118(17.3)564(82.7)0.5451.38(1.11)0.008
More than 10 min537101(18.8)436(81.2) 1.55(1.07)
Frequency of grocery shopping3 or more days a week794136(17.1)658(82.9)0.3361.41(1.08)0.059
Less than 3 days a week42583(19.5)342(80.5) 1.54(1.12)
Perceived shopping convenienceEasy1141193(16.9)948(83.1)<0.0011.40(1.08)<0.001
Difficult7826(33.3)52(66.7) 2.19(1.02)
SD: standard deviation.
Table 3. Associations between food access and frailty (logistic regression analysis).
Frailty
Crude ModelMultivariable-Adjusted Model
OR95% CIp-ValueOR95% CIp-Value
TotalTime to the nearest grocery store10 min or less1.00(Reference)-1.00(Reference)-
More than 10 min1.09(0.86, 1.38)0.4731.00(0.79, 1.27)0.995
Frequency of grocery shopping3 or more days a week1.00(Reference)-1.00(Reference)-
Less than 3 days a week1.29(1.02, 1.63)0.0351.36(1.07, 1.73)0.012
Perceived shopping convenienceEasy1.00(Reference) 1.00(Reference)
Difficult3.53(2.40, 5.19)<0.0012.81(1.88, 4.20)<0.001
MenTime to the nearest grocery store10 min or less1.00(Reference)-1.00(Reference)-
More than 10 min0.99(0.67, 1.46)0.9410.97(0.65, 1.45)0.885
Frequency of grocery shopping3 or more days a week1.00(Reference)-1.00(Reference)-
Less than 3 days a week1.60(1.10, 2.34)0.0151.83(1.23, 2.71)0.003
Perceived shopping convenienceEasy1.00(Reference) 1.00(Reference)
Difficult6.28(3.35, 11.80)<0.0015.89(3.06, 11.30)<0.001
WomenTime to the nearest grocery store10 min or less1.00(Reference)-1.00(Reference)-
More than 10 min1.11(0.83, 1.49)0.4971.01(0.74, 1.37)0.957
Frequency of grocery shopping3 or more days a week1.00(Reference)-1.00(Reference)-
Less than 3 days a week1.17(0.87, 1.59)0.2981.21(0.89, 1.66)0.229
Perceived shopping convenienceEasy1.00(Reference) 1.00(Reference)
Difficult2.46(1.50, 4.03)<0.0011.90(1.13, 3.20)0.015
CI: confidential interval; OR: odds ratio. Multivariable-adjusted models were adjusted for sex, age (<75 and ≥75 years), body mass index (<18.5, 18.5–24.9, and ≥25.0 kg/m2), living alone, current economic status, and dietary variety score.
Disclaimer/Publisher’s Note: The statements, opinions and data contained in all publications are solely those of the individual author(s) and contributor(s) and not of MDPI and/or the editor(s). MDPI and/or the editor(s) disclaim responsibility for any injury to people or property resulting from any ideas, methods, instructions or products referred to in the content.