

Burden in Colombia of COVID-19 in Adults and the Associated Clinical Characteristics: A Retrospective Database Analysis

 , , , , , , , , and
Abstract
1. Introduction
2. Materials and Methods
2.1. Study Design and Population
- unvaccinated: without any COVID-19 vaccination record
- partially vaccinated: a single dose of the messenger ribonucleic acid (mRNA) or adenoviral vector vaccines
- fully vaccinated: two doses of the mRNA or adenoviral vector vaccines, or a single dose of the Johnson & Johnson vaccine
- fully vaccinated + booster: fully vaccinated and some additional COVID-19 vaccine dose
2.2. Statistical Analysis
3. Results
3.1. Demographic and Clinical Characteristics
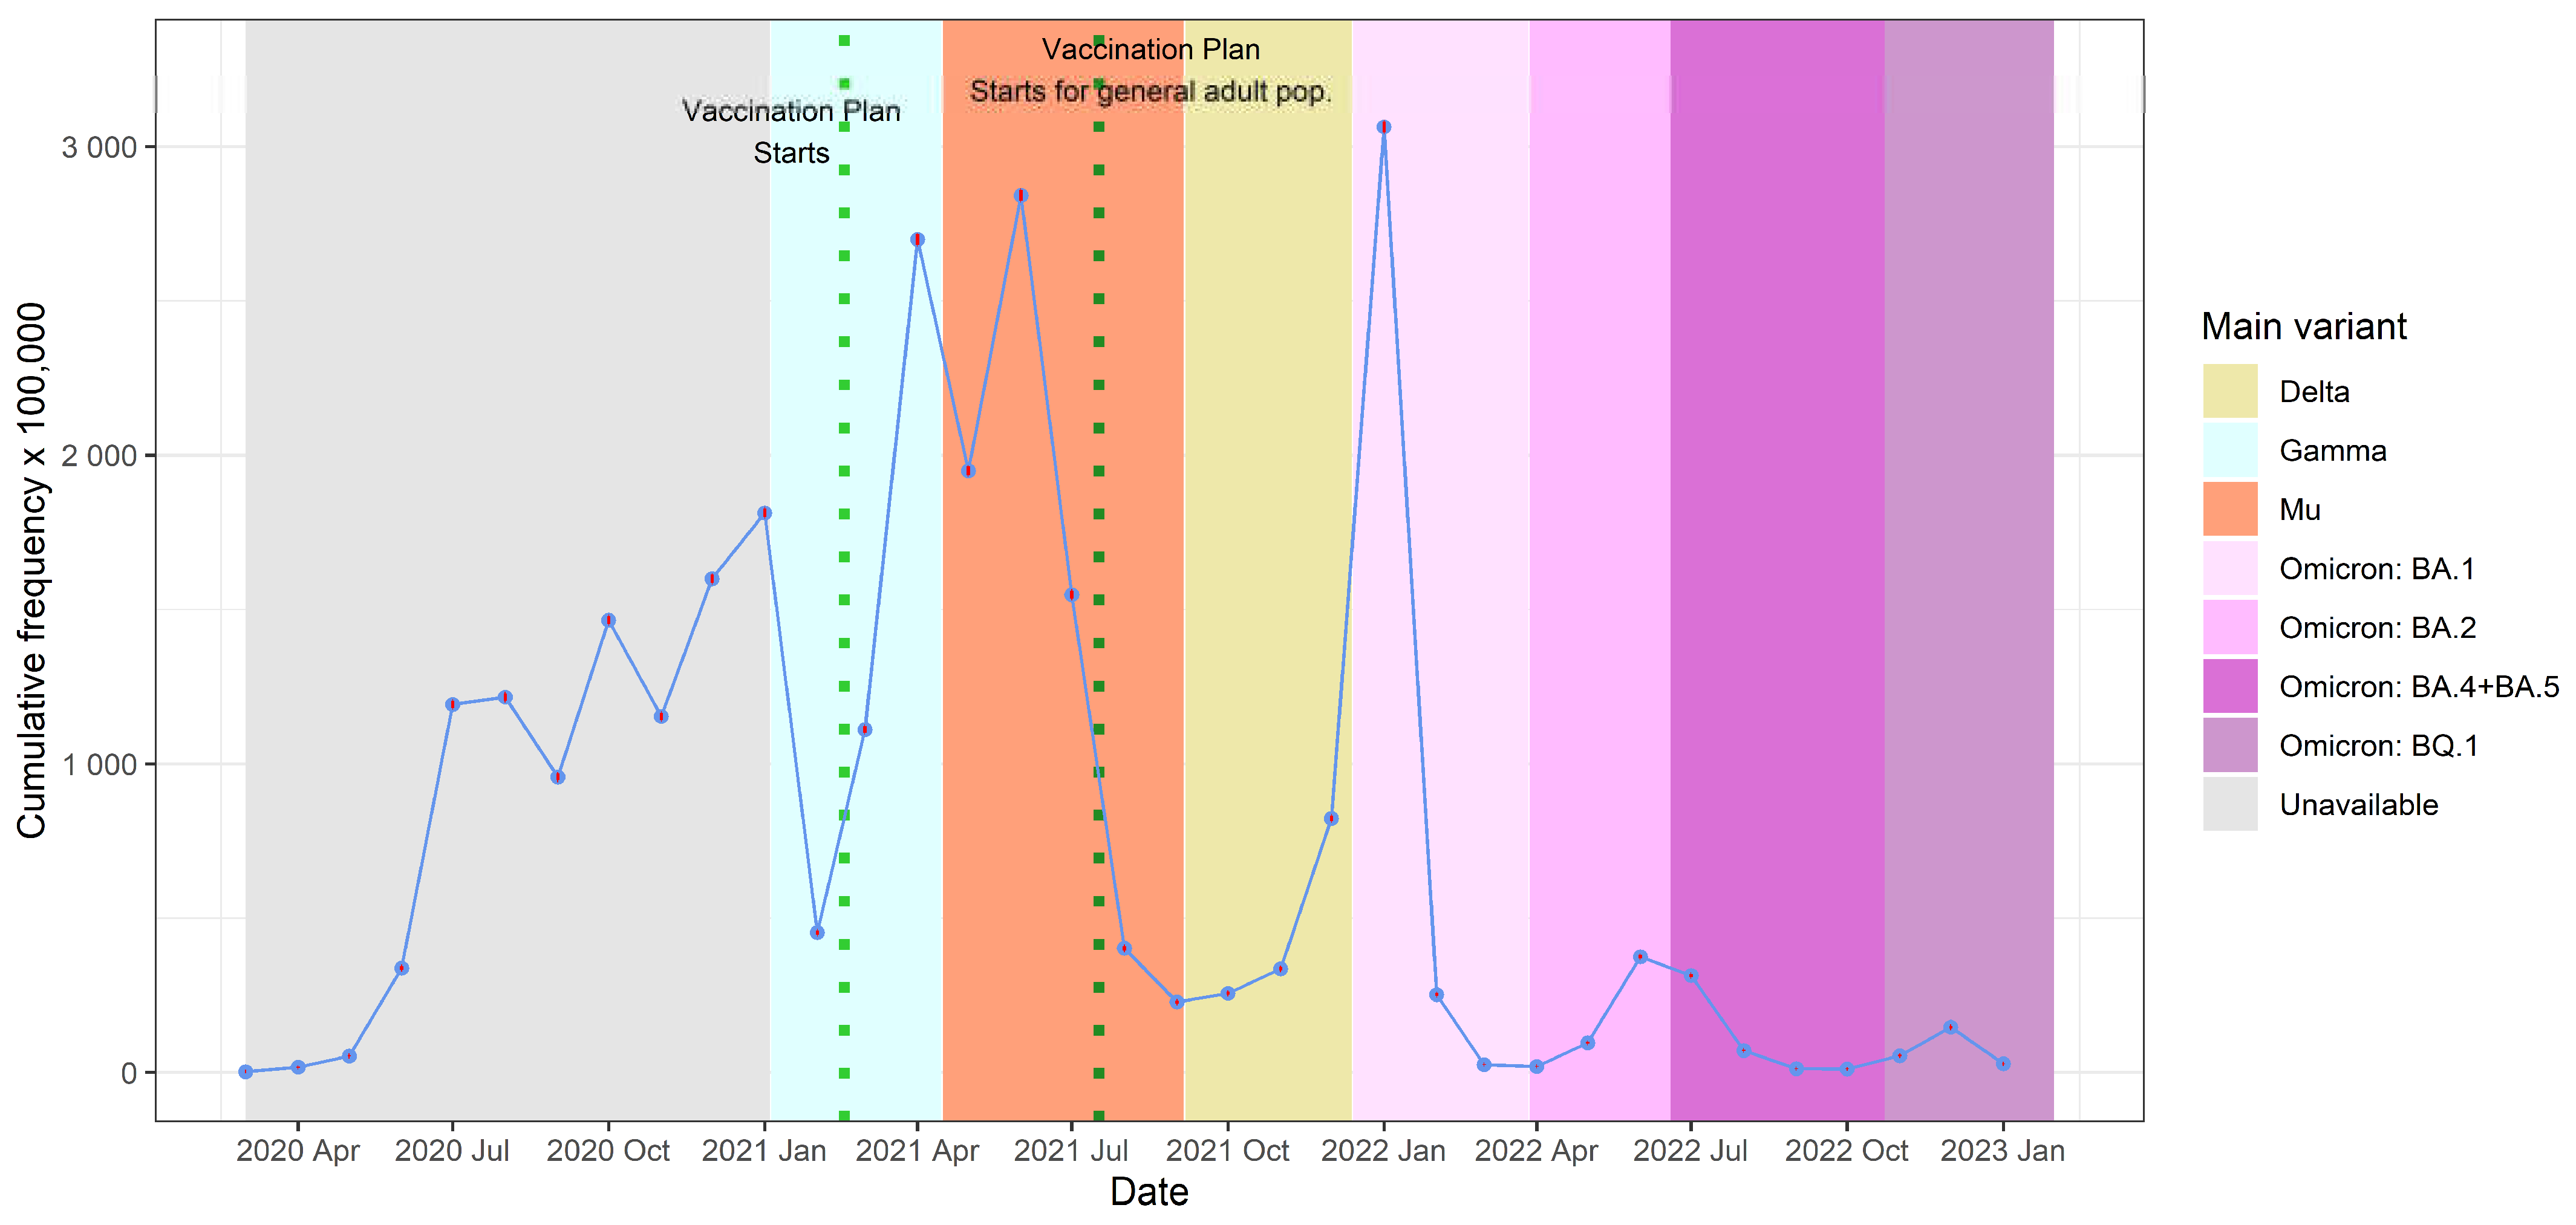
3.2. Frequency of Cases by Year and Age Group
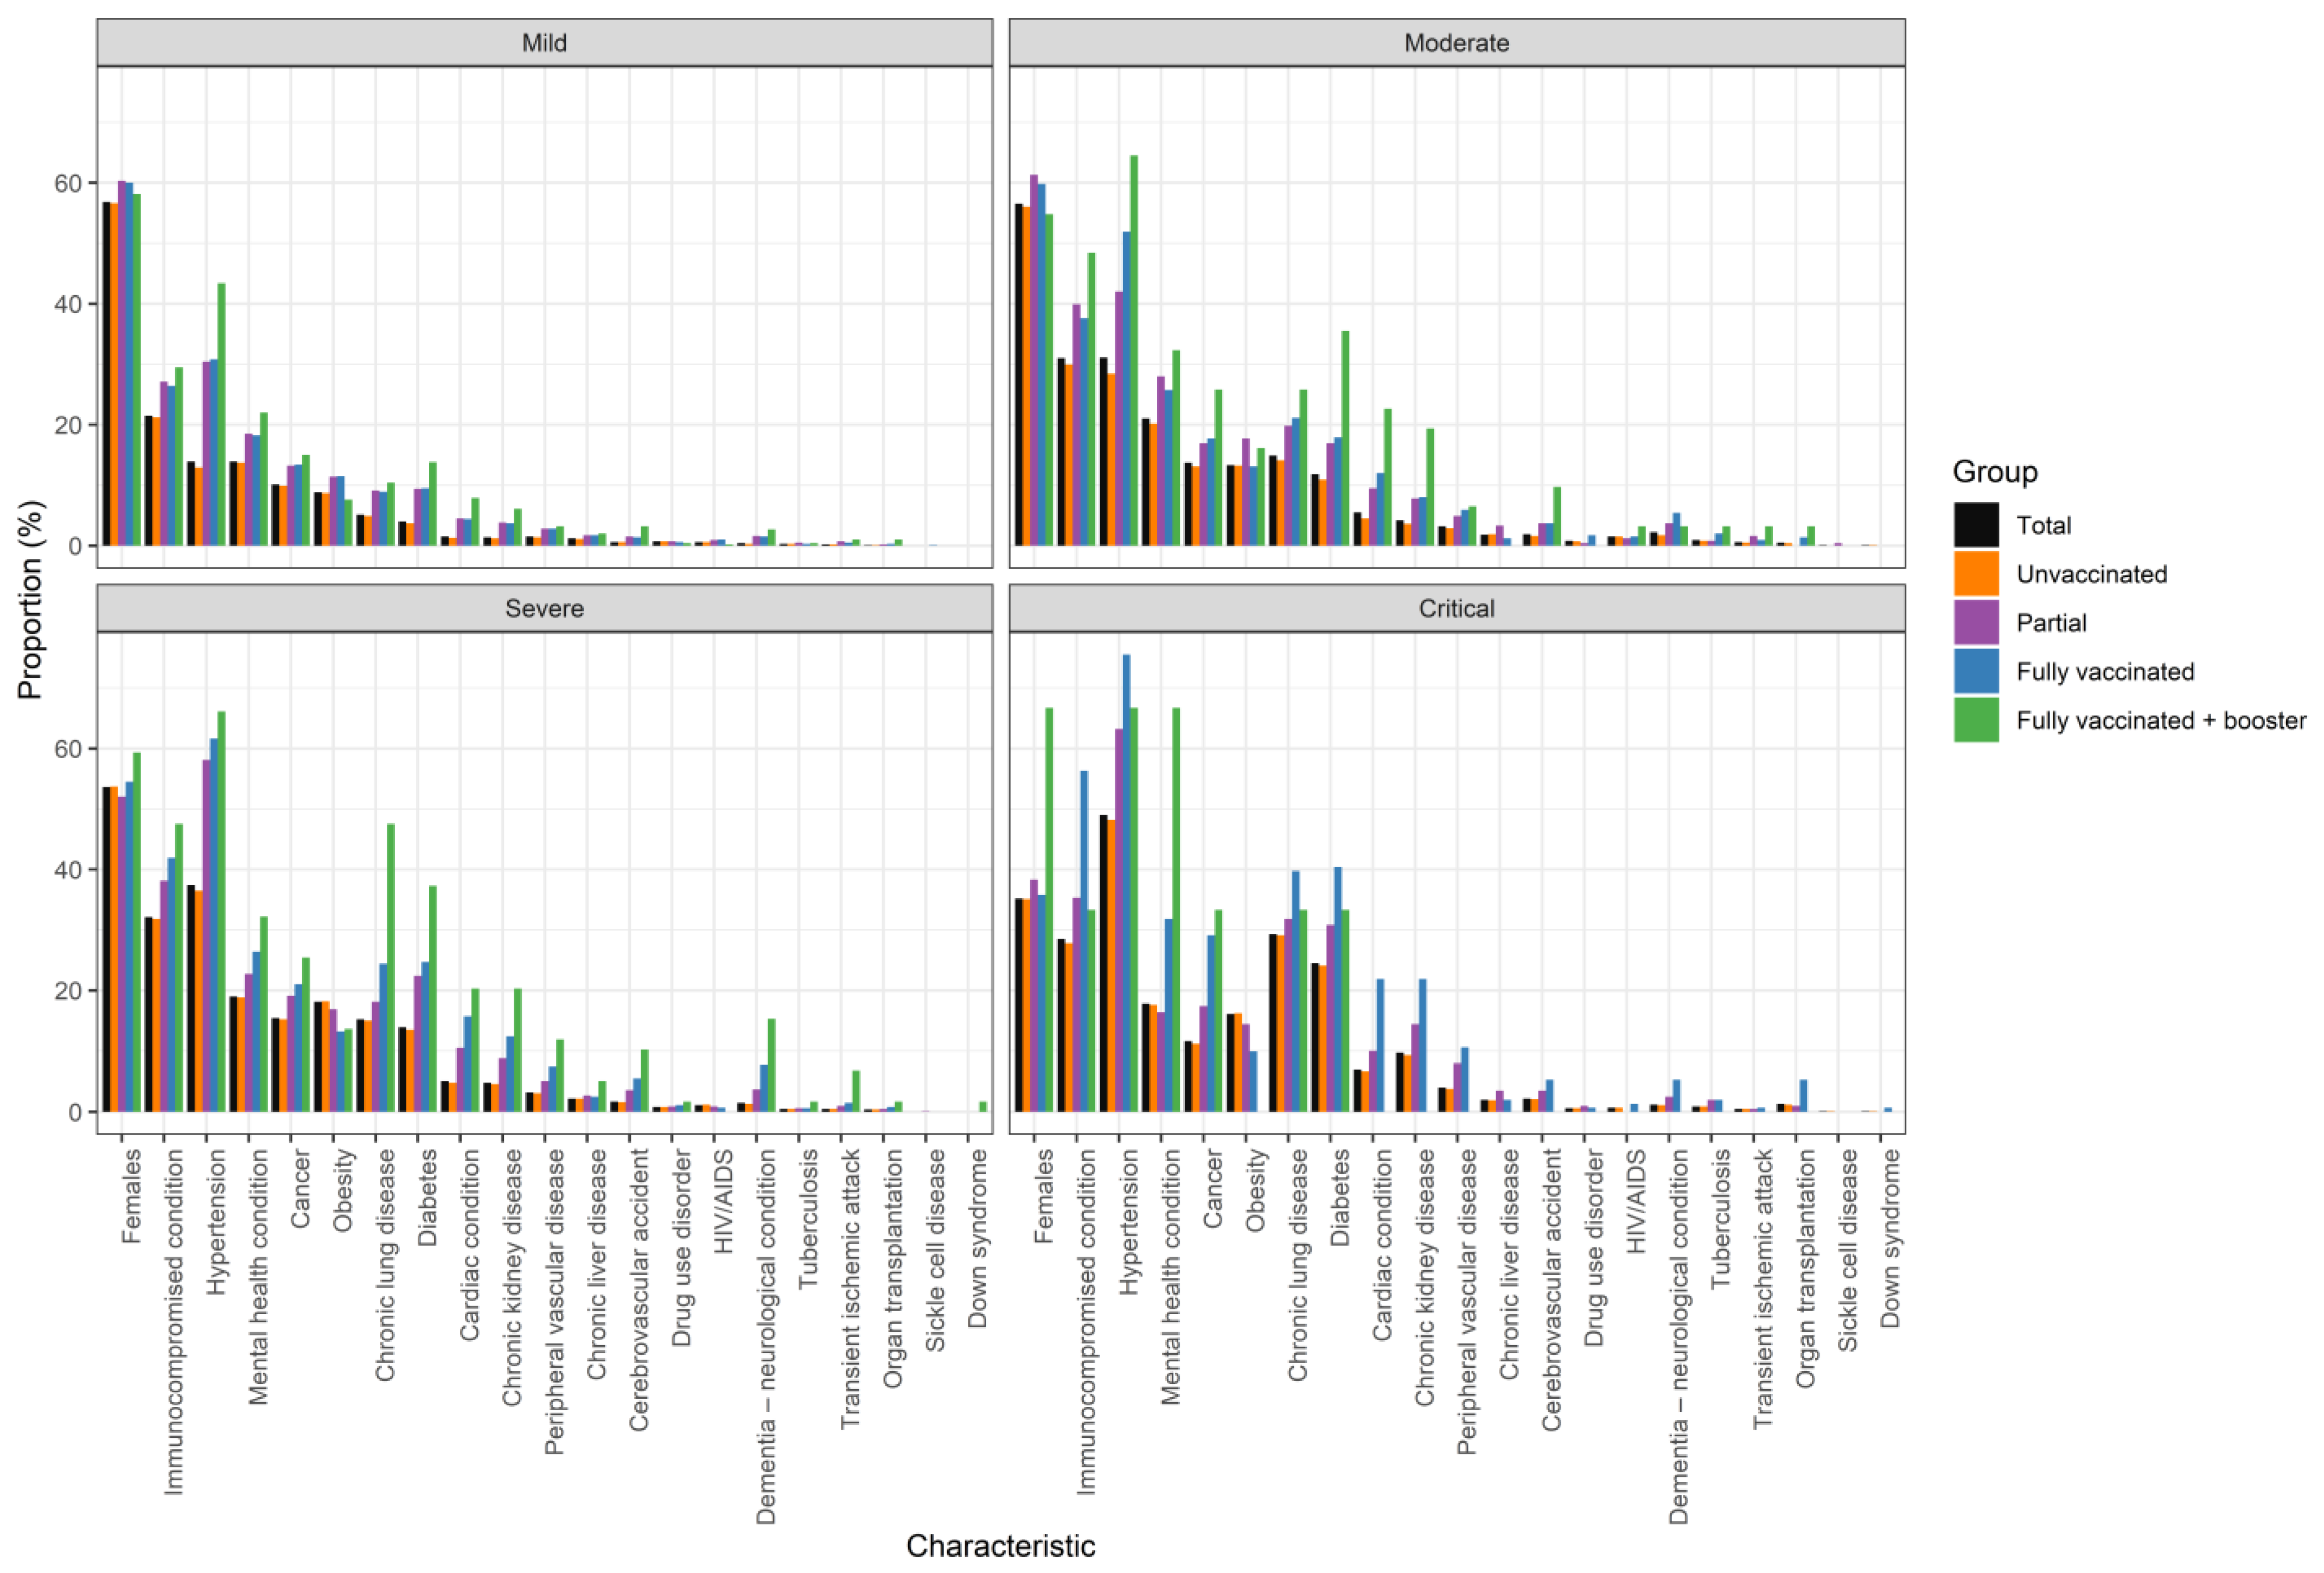
3.3. Severity and Vaccination Status
3.4. Trends by Risk Factor
3.5. Mortality and Case Fatality Rate
4. Discussion
Author Contributions
Funding
Institutional Review Board Statement
Informed Consent Statement
Data Availability Statement
Conflicts of Interest
Appendix A. COVID-19 Severity in Relation to Vaccination Status, Age, Gender, and the Presence of Comorbidities
| Total | Unvaccinated | Partial | Fully Vaccinated | Fully + Booster | |||
| Mild, n (%) | 746,408 (100) | 703,237 (94.2) | 13,458 (1.8) | 28,907 (3.9) | 806 (0.1) | ||
| Age, mean (SD) | 40.2 (±13.8) | 39.6 (±13.3) | 50.1 (±17.8) | 50.1 (±16.7) | 60.4 (±17.1) | ||
| Female, n (%) | 424,148 (56.8) | 398,218 (56.6) | 8121 (60.3) | 17,341 (60) | 468 (58.1) | ||
| Comorbidities, n (%) | Immunocompromised condition | 160,426 (21.5) | 148,899 (21.2) | 3652 (27.1) | 7637 (26.4) | 238 (29.5) | |
| Hypertension | 103,813 (13.9) | 90,457 (12.9) | 4096 (30.4) | 8910 (30.8) | 350 (43.4) | ||
| Mental health condition | 103,943 (13.9) | 96,010 (13.7) | 2488 (18.5) | 5268 (18.2) | 177 (22) | ||
| Cancer | 75,321 (10.1) | 69,552 (9.9) | 1773 (13.2) | 3875 (13.4) | 121 (15) | ||
| Obesity | 65,886 (8.8) | 60,980 (8.7) | 1532 (11.4) | 3313 (11.5) | 61 (7.6) | ||
| Chronic lung disease | 38,191 (5.1) | 34,325 (4.9) | 1222 (9.1) | 2560 (8.9) | 84 (10.4) | ||
| Diabetes | 30,074 (4) | 25,947 (3.7) | 1268 (9.4) | 2748 (9.5) | 111 (13.8) | ||
| Cardiac condition | 11,063 (1.5) | 9113 (1.3) | 602 (4.5) | 1284 (4.4) | 64 (7.9) | ||
| Chronic kidney disease | 10,306 (1.4) | 8683 (1.2) | 508 (3.8) | 1066 (3.7) | 49 (6.1) | ||
| Peripheral vascular disease | 11,020 (1.5) | 9800 (1.4) | 373 (2.8) | 821 (2.8) | 26 (3.2) | ||
| Chronic liver disease | 8599 (1.2) | 7862 (1.1) | 230 (1.7) | 491 (1.7) | 16 (2) | ||
| Cerebrovascular accident | 4492 (0.6) | 3871 (0.6) | 198 (1.5) | 397 (1.4) | 26 (3.2) | ||
| Drug use disorder | 5333 (0.7) | 5067 (0.7) | 99 (0.7) | 164 (0.6) | 3 (0.4) | ||
| HIV/AIDS | 4353 (0.6) | 3944 (0.6) | 121 (0.9) | 286 (1) | 2 (0.2) | ||
| Dementia—neurological condition | 3121 (0.4) | 2452 (0.3) | 211 (1.6) | 436 (1.5) | 22 (2.7) | ||
| Tuberculosis | 2100 (0.3) | 1948 (0.3) | 63 (0.5) | 86 (0.3) | 3 (0.4) | ||
| Transient ischemic attack | 1647 (0.2) | 1412 (0.2) | 88 (0.7) | 139 (0.5) | 8 (1) | ||
| Organ transplantation | 980 (0.1) | 845 (0.1) | 31 (0.2) | 96 (0.3) | 8 (1) | ||
| Sickle cell disease | 345 (0) | 325 (0) | 5 (0) | 15 (0.1) | - | ||
| Down syndrome | 85 (0) | 75 (0) | 3 (0) | 7 (0) | - | ||
| Moderate, n (%) | 7152 (100) | 6229 (87.1) | 243 (3.4) | 649 (9.1) | 31 (0.4) | ||
| Age, mean (SD) | 47.7 (17.6) | 46.2 (16.9) | 55. (20.2) | 57.7 (19.3) | 62.9 (18.7) | ||
| Female, n (%) | 4044 (56.5) | 3490 (56) | 149 (61.3) | 388 (59.8) | 17 (54.8) | ||
| Comorbidities, n (%) | Immunocompromised condition | 2220 (31) | 1864 (29.9) | 97 (39.9) | 244 (37.6) | 15 (48.4) | |
| Hypertension | 2226 (31.1) | 1767 (28.4) | 102 (42) | 337 (51.9) | 20 (64.5) | ||
| Mental health condition | 1504 (21) | 1259 (20.2) | 68 (28) | 167 (25.7) | 10 (32.3) | ||
| Cancer | 979 (13.7) | 815 (13.1) | 41 (16.9) | 115 (17.7) | 8 (25.8) | ||
| Obesity | 953 (13.3) | 820 (13.2) | 43 (17.7) | 85 (13.1) | 5 (16.1) | ||
| Chronic lung disease | 1069 (14.9) | 876 (14.1) | 48 (19.8) | 137 (21.1) | 8 (25.8) | ||
| Diabetes | 844 (11.8) | 676 (10.9) | 41 (16.9) | 116 (17.9) | 11 (35.5) | ||
| Cardiac condition | 390 (5.5) | 282 (4.5) | 23 (9.5) | 78 (12) | 7 (22.6) | ||
| Chronic kidney disease | 302 (4.2) | 225 (3.6) | 19 (7.8) | 52 (8) | 6 (19.4) | ||
| Peripheral vascular disease | 230 (3.2) | 178 (2.9) | 12 (4.9) | 38 (5.9) | 2 (6.5) | ||
| Chronic liver disease | 132 (1.8) | 116 (1.9) | 8 (3.3) | 8 (1.2) | - | ||
| Cerebrovascular accident | 137 (1.9) | 101 (1.6) | 9 (3.7) | 24 (3.7) | 3 (9.7) | ||
| Drug use disorder | 58 (0.8) | 46 (0.7) | 1 (0.4) | 11 (1.7) | - | ||
| HIV/AIDS | 106 (1.5) | 92 (1.5) | 3 (1.2) | 10 (1.5) | 1 (3.2) | ||
| Dementia—neurological condition | 154 (2.2) | 109 (1.7) | 9 (3.7) | 35 (5.4) | 1 (3.2) | ||
| Tuberculosis | 63 (0.9) | 47 (0.8) | 2 (0.8) | 13 (2) | 1 (3.2) | ||
| Transient ischemic attack | 43 (0.6) | 32 (0.5) | 4 (1.6) | 6 (0.9) | 1 (3.2) | ||
| Organ transplantation | 34 (0.5) | 24 (0.4) | - | 9 (1.4) | 1 (3.2) | ||
| Sickle cell disease | 4 (0.1) | 3 (0) | 1 (0.4) | - | - | ||
| Down syndrome | 4 (0.1) | 4 (0.1) | - | - | - | ||
| Severe, n (%) | 191,260 (100) | 184,014 (96.2) | 4071 (2.1) | 3116 (1.6) | 59 (0) | ||
| Age, mean (SD) | 49.6 (16.4) | 49.0 (16.2) | 62.2 (15.2) | 66.1 (17.9) | 72.3 (18) | ||
| Female, n (%) | 102,594 (53.6) | 98,744 (53.7) | 2116 (52) | 1699 (54.5) | 35 (59.3) | ||
| Comorbidities, n (%) | Immunocompromised condition | 61,460 (32.1) | 58,577 (31.8) | 1550 (38.1) | 1305 (41.9) | 28 (47.5) | |
| Hypertension | 71,514 (37.4) | 67,190 (36.5) | 2367 (58.1) | 1918 (61.6) | 39 (66.1) | ||
| Mental health conditions | 36,318 (19) | 34,553 (18.8) | 924 (22.7) | 822 (26.4) | 19 (32.2) | ||
| Cancer | 29,403 (15.4) | 27,958 (15.2) | 776 (19.1) | 654 (21) | 15 (25.4) | ||
| Obesity | 34,683 (18.1) | 33,577 (18.2) | 688 (16.9) | 410 (13.2) | 8 (13.6) | ||
| Chronic lung disease | 29,106 (15.2) | 27,581 (15) | 738 (18.1) | 759 (24.4) | 28 (47.5) | ||
| Diabetes | 26,622 (13.9) | 24,921 (13.5) | 910 (22.4) | 769 (24.7) | 22 (37.3) | ||
| Cardiac condition | 9717 (5.1) | 8790 (4.8) | 426 (10.5) | 489 (15.7) | 12 (20.3) | ||
| Chronic kidney disease | 9250 (4.8) | 8492 (4.6) | 360 (8.8) | 386 (12.4) | 12 (20.3) | ||
| Peripheral vascular disease | 6134 (3.2) | 5686 (3.1) | 207 (5.1) | 234 (7.5) | 7 (11.9) | ||
| Chronic liver disease | 4282 (2.2) | 4092 (2.2) | 108 (2.7) | 79 (2.5) | 3 (5.1) | ||
| Cerebrovascular accident | 3341 (1.7) | 3016 (1.6) | 147 (3.6) | 172 (5.5) | 6 (10.2) | ||
| Drug use disorder | 1519 (0.8) | 1450 (0.8) | 35 (0.9) | 33 (1.1) | 1 (1.7) | ||
| HIV/AIDS | 2199 (1.1) | 2139 (1.2) | 37 (0.9) | 23 (0.7) | - | ||
| Dementia—neurological condition | 2871 (1.5) | 2467 (1.3) | 151 (3.7) | 244 (7.8) | 9 (15.3) | ||
| Tuberculosis | 900 (0.5) | 854 (0.5) | 25 (0.6) | 20 (0.6) | 1 (1.7) | ||
| Transient ischemic attack | 1014 (0.5) | 922 (0.5) | 41 (1) | 47 (1.5) | 4 (6.8) | ||
| Organ transplantation | 786 (0.4) | 740 (0.4) | 19 (0.5) | 26 (0.8) | 1 (1.7) | ||
| Sickle cell disease | 95 (0) | 90 (0) | 4 (0.1) | 1 (0) | - | ||
| Down syndrome | 35 (0) | 33 (0) | 1 (0) | - | 1 (1.7) | ||
| Critical, n (%) | 8841 (100) | 8486 (96) | 201 (2.3) | 151 (1.7) | 3 (0) | ||
| Age, mean (SD) | 58.8 (14.6) | 58.3 (14.4) | 67.7 (13.1) | 73.9 (12.3) | 77.3 (6.4) | ||
| Female, n (%) | 3109 (35.2) | 2976 (35.1) | 77 (38.3) | 54 (35.8) | 2 (66.7) | ||
| Comorbidities, n (%) | Immunocompromised condition | 2517 (28.5) | 2360 (27.8) | 71 (35.3) | 85 (56.3) | 1 (33.3) | |
| Hypertension | 4330 (49) | 4087 (48.2) | 127 (63.2) | 114 (75.5) | 2 (66.7) | ||
| Mental health condition | 1576 (17.8) | 1493 (17.6) | 33 (16.4) | 48 (31.8) | 2 (66.7) | ||
| Cancer | 1027 (11.6) | 947 (11.2) | 35 (17.4) | 44 (29.1) | 1 (33.3) | ||
| Obesity | 1419 (16.1) | 1375 (16.2) | 29 (14.4) | 15 (9.9) | (0) | ||
| Chronic lung disease | 2593 (29.3) | 2468 (29.1) | 64 (31.8) | 60 (39.7) | 1 (33.3) | ||
| Diabetes | 2167 (24.5) | 2043 (24.1) | 62 (30.8) | 61 (40.4) | 1 (33.3) | ||
| Cardiac condition | 622 (7) | 569 (6.7) | 20 (10) | 33 (21.9) | - | ||
| Chronic kidney disease | 855 (9.7) | 793 (9.3) | 29 (14.4) | 33 (21.9) | - | ||
| Peripheral vascular disease | 357 (4) | 325 (3.8) | 16 (8) | 16 (10.6) | - | ||
| Chronic liver disease | 175 (2) | 165 (1.9) | 7 (3.5) | 3 (2) | - | ||
| Cerebrovascular accident | 196 (2.2) | 181 (2.1) | 7 (3.5) | 8 (5.3) | - | ||
| Drug use disorder | 54 (0.6) | 51 (0.6) | 2 (1) | 1 (0.7) | - | ||
| HIV/AIDS | 62 (0.7) | 60 (0.7) | - | 2 (1.3) | - | ||
| Dementia—neurological condition | 103 (1.2) | 90 (1.1) | 5 (2.5) | 8 (5.3) | - | ||
| Tuberculosis | 80 (0.9) | 73 (0.9) | 4 (2) | 3 (2) | - | ||
| Transient ischemic attack | 41 (0.5) | 39 (0.5) | 1 (0.5) | 1 (0.7) | - | ||
| Organ transplantation | 113 (1.3) | 103 (1.2) | 2 (1) | 8 (5.3) | - | ||
| Sickle cell disease | 7 (0.1) | 7 (0.1) | - | - | - | ||
| Down syndrome | 8 (0.1) | 7 (0.1) | - | 1 (0.7) | - |
Appendix B. Additional Data Focused on 2022
| Proportion of high risk comorbidities | |
| Age group “18–29” | 30.1% |
| Age group “30–49” | 39.4% |
| Age group “50–64” | 60.2% |
| Age group “65–74” | 78.3% |
| Age group “75+” | 90.8% |
| Probability infection being symptomatic (%) in 2022 | |
| Age group “18–29” | 3.1% |
| Age group “30–49” | 4.9% |
| Age group “50–64” | 3.9% |
| Age group “65–74” | 4.3% |
| Age group “75+” | 6.0% |
| Hospitalization rate among symptomatic patients (%) in 2022 | |
| Age group “18–29” | 0.3% |
| Age group “30–49” | 0.6% |
| Age group “50–64” | 1.6% |
| Age group “65–74” | 3.5% |
| Age group “75+” | 1.0% |
| Risk for hospitalization of with comorbidities patient group | 2.6% |
| Risk for hospitalization of NON comorbidities patient group | 0.5% |
| Critical care/ICU admission rate among hospitalized patients (%) in 2022 | |
| Age group “18–29” | 12.1% |
| Age group “30–49” | 13.7% |
| Age group “50–64” | 21.8% |
| Age group “65–74” | 25.1% |
| Age group “75+” | 15.1% |
| Risk for ICU of with comorbidities patient group | 0.4% |
| Risk for ICU of with NON comorbidities patient group | 0.1% |
| Probability of death among patients on normal ward (%) in 2022 | |
| Age group “18–29” | 1.2% |
| Age group “30–49” | 1.1% |
| Age group “50–64” | 5.7% |
| Age group “65–74” | 12.0% |
| Age group “75+” | 22.4% |
| Risk for death in GW of with comorbidities patient group | 10.4% |
| Risk for death in GW of NON comorbidities patient group | 4.6% |
| Probability of death among patients on critical care (%) in 2022 | |
| Age group “18–29” | 9.1% |
| Age group “30–49” | 14.7% |
| Age group “50–64” | 25.4% |
| Age group “65–74” | 55.2% |
| Age group “75+” | 52.1% |
| Risk for death in ICU of with comorbidities patient group | 35.3% |
| Risk for death in ICU of NON comorbidities patient group | 41.0% |
| Probability of death among patients on outpatient care (%) in 2022 | |
| Age group “18–29” | 0.0% |
| Age group “30–49” | 0.0% |
| Age group “50–64” | 0.2% |
| Age group “65–74” | 0.7% |
| Age group “75+” | 3.7% |
| Risk for death outpatient of with comorbidities patient group | 0.5% |
| Risk for death outpatient of NON comorbidities patient group | 0.0% |
References
- Decerf, B.; Friedman, J.; Mendes, A.; Pennings, S.; Yonzan, N. Lives, Livelihoods, and Learning: A Global Perspective on the Well-Being Impacts of the COVID-19 Pandemic; World Bank: Washington, DC, USA, 2024. [Google Scholar]
- Espinola, N.; Loudet, C.I.; Luxardo, R.; Moreno, C.; Kyaw, M.H.; Spinardi, J.; Mendoza, C.F.; Carballo, C.M.; Dantas, A.C.; Abalos, M.G.; et al. COVID-19 Disease and Economic Burden to Healthcare Systems in Adults in Six Latin American Countries Before Nationwide Vaccination Program: Ministry of Health Database Assessment and Literature Review. Int. J. Environ. Res. Public Health 2025, 22, 669. [Google Scholar] [CrossRef]
- Umakanthan, S.; Sahu, P.; Ranade, A.V.; Bukelo, M.M.; Rao, J.S.; Abrahao-Machado, L.F.; Dahal, S.; Kumar, H.; Kv, D. Origin, transmission, diagnosis and management of coronavirus disease 2019 (COVID-19). Postgrad. Med. J. 2020, 96, 753–758. [Google Scholar] [CrossRef]
- Brodin, P. Immune determinants of COVID-19 disease presentation and severity. Nat. Med. 2021, 27, 28–33. [Google Scholar] [CrossRef] [PubMed]
- Salzberger, B.; Buder, F.; Lampl, B.; Ehrenstein, B.; Hitzenbichler, F.; Holzmann, T.; Schmidt, B.; Hanses, F. Epidemiology of SARS-CoV-2. Infection 2021, 49, 233–239. [Google Scholar] [CrossRef]
- Kim, L.; Garg, S.; O’Halloran, A.; Whitaker, M.; Pham, H.; Anderson, E.J.; Armistead, I.; Bennett, N.M.; Billing, L.; Como-Sabetti, K.; et al. Risk Factors for Intensive Care Unit Admission and In-hospital Mortality Among Hospitalized Adults Identified through the US Coronavirus Disease 2019 (COVID-19)-Associated Hospitalization Surveillance Network (COVID-NET). Clin. Infect. Dis. 2021, 72, e206–e214. [Google Scholar] [CrossRef]
- MSPS CORONAVIRUS (COVID-19) 2023. Available online: https://www.minsalud.gov.co/salud/publica/PET/Paginas/Covid.aspx (accessed on 2 April 2024).
- MSPS; DNP; MHCP; IETS. Plan Nacional de Vacunación Contra el COVID-19; Ministerio de Salud y Protección Social: Bogotá, Colombia, 2021. [Google Scholar]
- MSPS. Resolución 2367 de 2023; MSPS: Bogotá, Colombia, 2023. [Google Scholar]
- Ramos Valencia, O.A.; Buitrón Gonzalez, Y.; Sotelo Daza, J.S.; Villaquiran, A.F. Factores asociados a la intención de vacunación contra el COVID-19 en Popayán, Cauca, Colombia. Vacunas 2023, 24, 174–181. [Google Scholar] [CrossRef]
- LaRotta, J.; Escobar, O.; Ávila-Aguero, M.L.; Torres, J.P.; Sini de Almeida, R.; Morales, G.d.C.; Srivastava, A. COVID-19 in Latin America: A Snapshot in Time and the Road Ahead. Infect. Dis. Ther. 2023, 12, 389–410. [Google Scholar] [CrossRef]
- Ospina, J.; Hincapié- Palacio, D.; Ochoa, J.; Velásquez, C.; Almanza Payares, R. Monitoring COVID-19 in Colombia during the first year of the pandemic. J. Public Health Res. 2022, 11, 227990362211157. [Google Scholar] [CrossRef] [PubMed]
- Laajaj, R.; De Los Rios, C.; Sarmiento-Barbieri, I.; Aristizabal, D.; Behrentz, E.; Bernal, R.; Buitrago, G.; Cucunubá, Z.; De La Hoz, F.; Gaviria, A.; et al. COVID-19 spread, detection, and dynamics in Bogota, Colombia. Nat. Commun. 2021, 12, 4726. [Google Scholar] [CrossRef]
- Rojas-Botero, M.L.; Fernández-Niño, J.A.; Arregocés-Castillo, L.; Palacios-Clavijo, A.; Pinto-Álvarez, M.; Ruiz-Gómez, F. Real-world effectiveness of COVID-19 vaccines among Colombian adults: A retrospective, population-based study of the ESPERANZA cohort. PLoS Glob. Public Health 2023, 3, e0001845. [Google Scholar] [CrossRef]
- Arias-Murillo, Y.R.; Benavides-V, C.A.; Salinas-N, M.A.; Osorio-Arango, K.; Plazas-Sierra, C.; Cortés, J.A. SARS-CoV2/COVID-19 Infection in Transplant Recipients and in Patients on the Organ Transplant Waiting List in Colombia. Transplant. Proc. 2021, 53, 1237–1244. [Google Scholar] [CrossRef] [PubMed]
- Machado-Alba, J.E.; Valladales-Restrepo, L.F.; Machado-Duque, M.E.; Gaviria-Mendoza, A.; Sánchez-Ramírez, N.; Usma-Valencia, A.F.; Rodríguez-Martínez, E.; Rengifo-Franco, E.; Forero-Supelano, V.H.; Gómez-Ramirez, D.M.; et al. Factors associated with admission to the intensive care unit and mortality in patients with COVID-19, Colombia. PLoS ONE 2021, 16, e0260169. [Google Scholar] [CrossRef]
- Rebellón-Sánchez, D.E.; Guzmán, T.M.; Rodriguez, S.; Llanos-Torres, J.; Vinueza, D.; Tafurt, E.; Beltrán, E.; Martínez, Á.; Rosso, F. Navigating the waves in Colombia: A cohort study of inpatient care during four COVID-19 waves. Braz. J. Infect. Dis. 2024, 28, 103737. [Google Scholar] [CrossRef]
- MSPS Cifras de Aseguramiento en Salud-junio 2023. 2023. Available online: https://www.minsalud.gov.co/proteccionsocial/Paginas/cifras-aseguramiento-salud.aspx (accessed on 2 August 2023).
- WHO. Clinical Management of COVID-19: Living Guideline; WHO: Geneva, Switzerland, 2023. [Google Scholar]
- Amariles, P.; Granados, J.; Ceballos, M.; Montoya, C.J. COVID-19 in Colombia endpoints. Are we different, like Europe? Res. Soc. Adm. Pharm. 2021, 17, 2036–2039. [Google Scholar] [CrossRef] [PubMed]
- CDC. Underlying Medical Conditions Associated with Higher Risk for Severe COVID-19: Information for Healthcare Professionals. Cent. Dis. Control. Prev. 2020. Available online: https://www.cdc.gov/covid/hcp/clinical-care/underlying-conditions.html?CDC_AAref_Val=https://www.cdc.gov/coronavirus/2019-ncov/hcp/clinical-care/underlyingconditions.html (accessed on 2 July 2023).
- Rodriguez-Morales, A.J.; Cardona-Ospina, J.A.; Villamil-Gómez, W.E. Should we concern about reinfection in COVID-19? Infectio 2020, 25, 77. [Google Scholar] [CrossRef]
- Stein, C.; Nassereldine, H.; Sorensen, R.J.D.; Amlag, J.O.; Bisignano, C.; Byrne, S.; Castro, E.; Coberly, K.; Collins, J.K.; Dalos, J.; et al. Past SARS-CoV-2 infection protection against re-infection: A systematic review and meta-analysis. Lancet 2023, 401, 833–842. [Google Scholar] [CrossRef]
- Toro-Huamanchumo, C.J.; Hilario-Gomez, M.M.; Pinedo-Castillo, L.; Zumarán-Nuñez, C.J.; Espinoza-Gonzales, F.; Caballero-Alvarado, J.; Rodriguez-Morales, A.J.; Barboza, J.J. Clinical and epidemiological features of patients with COVID-19 reinfection: A systematic review. New Microbes New Infect. 2022, 48, 101021. [Google Scholar] [CrossRef]
- R Core Team R. A Language and Environment for Statistical Computing 2023; R Foundation for Statistical Computing: Vienna, Austria, 2023. [Google Scholar]
- INS COVID-19 en Colombia. Corte 07-06-2023: Genoma. COVID-19 En Colomb n.d. Available online: https://www.ins.gov.co/Noticias/Paginas/coronavirus-genoma.aspx (accessed on 20 February 2024).
- Holdcroft, E.; Aksamentov, I.; Neher, R.; Bedford, T.; Hadfield, J.; Zuber, M.; Scott-Brown, J.; Sanderson, T.; Bloom, J.; Roemer, C.; et al. Overview of Variants in Countries: Colombia. CoVariants n.d. Available online: https://covariants.org/per-country?country=Colombia (accessed on 20 February 2024).
- Mathieu, E.; Ritchie, H.; Rodés-Guirao, L.; Appel, C.; Giattino, C.; Hasell, J.; Macdonald, B.; Dattani, S.; Beltekian, D.; Ortiz-Ospina, E.; et al. Coronavirus Pandemic (COVID-19); Our World Data 2020. Available online: https://ourworldindata.org/coronavirus (accessed on 16 May 2025).
- INS Históricos de Casos por Fecha de Inicio de Síntomas. COVID-19 En Colomb Corte 07-06-2023 2023. Available online: https://www.ins.gov.co/Noticias/Paginas/coronavirus-casos.aspx (accessed on 20 March 2024).
- Reyes, L.F.; Bastidas, A.; Narváez, P.O.; Parra-Tanoux, D.; Fuentes, Y.V.; Serrano-Mayorga, C.C.; Ortíz, V.; Caceres, E.L.; Ospina-Tascon, G.; Díaz, A.M.; et al. Clinical characteristics, systemic complications, and in-hospital outcomes for patients with COVID-19 in Latin America. LIVEN-Covid-19 study: A prospective, multicenter, multinational, cohort study. PLoS ONE 2022, 17, e0265529. [Google Scholar] [CrossRef]
- Bouziotis, J.; Arvanitakis, M.; Preiser, J.-C. Association of body mass index with COVID-19 related in-hospital death. Clin. Nutr. 2022, 41, 2924–2926. [Google Scholar] [CrossRef]
- Guntur, V.P.; Modena, B.D.; Manka, L.A.; Eddy, J.J.; Liao, S.-Y.; Goldstein, N.M.; Zelarney, P.; Horn, C.A.; Keith, R.C.; Make, B.J.; et al. Characteristics and outcomes of ambulatory patients with suspected COVID-19 at a respiratory referral center. Respir. Med. 2022, 197, 106832. [Google Scholar] [CrossRef]
- Arregocés-Castillo, L.; Fernández-Niño, J.; Rojas-Botero, M.; Palacios-Clavijo, A.; Galvis-Pedraza, M.; Rincón-Medrano, L.; Pinto-Álvarez, M.; Ruiz-Gómez, F.; Trejo-Valdivia, B. Effectiveness of COVID-19 vaccines in older adults in Colombia: A retrospective, population-based study of the ESPERANZA cohort. Lancet Healthy Longev. 2022, 3, e242–e252. [Google Scholar] [CrossRef] [PubMed]
- Nomoto, H.; Suzuki, S.; Asai, Y.; Hayakawa, K.; Gatanaga, H.; Terada, M.; Suzuki, K.; Ohtsu, H.; Toyoda, A.; Ohmagari, N. Clinical characteristics and prognosis of immunosuppressed inpatients with COVID-19 in Japan. J. Infect. Chemother. 2022, 28, 224–231. [Google Scholar] [CrossRef] [PubMed]
- WHO. COVID-19 Cases, Country Level Trends. WHO COVID-19 Dashboard 2025. Available online: https://data.who.int/dashboards/covid19/cases?n=c (accessed on 29 April 2025).
- Ulrichs, T.; Rolland, M.; Wu, J.; Nunes, M.C.; El, C.; Chit, A. Changing epidemiology of COVID-19: Potential future impact on vaccines and vaccination strategies. Expert Rev. Vaccines 2024, 23, 510–522. [Google Scholar] [CrossRef] [PubMed]
- Mantilla-Morrón, M.; Suárez-Palacio, D.; Urina-Triana, M.A. The Level of Knowledge, Attitudes, and Practices in a Caribbean Colombian Population That Recovered from COVID-19 during the Pandemic. Healthcare 2023, 11, 3119. [Google Scholar] [CrossRef] [PubMed]
- Hasell, J.; Mathieu, E.; Beltekian, D.; Macdonald, B.; Giattino, C.; Ortiz-Ospina, E.; Roser, M.; Ritchie, H. A cross-country database of COVID-19 testing. Sci. Data 2020, 7, 345. [Google Scholar] [CrossRef]
- Our World in Data Testing for COVID-19. Test COVID-19 Colomb n.d. Available online: https://ourworldindata.org/coronavirus-testing (accessed on 22 May 2024).
- INS. Datos Abiertos Pruebas PCR procesadas de COVID-19 en Colombia. 2024. Available online: https://www.datos.gov.co/Salud-y-Protecci-n-Social/Pruebas-PCR-procesadas-de-COVID-19-en-Colombia-Dep/8835-5baf/about_data (accessed on 24 April 2024).
- John, J.N.; Gorman, S.; Scales, D. Understanding Interventions to Address Infodemics Through Epidemiological, Socioecological, and Environmental Health Models: Framework Analysis. JMIR Infodemiology 2025, 5, e67119. [Google Scholar] [CrossRef]
- Azevedo, N.H.; Massi, L.; Lima, G.S. Thematic trends in fact-checking in Brazil’s COVID-19 infodemic: The first year in focus. An. Acad. Bras. Ciênc. 2025, 97, e20240316. [Google Scholar] [CrossRef]
- Longcoy, J.; Patwari, R.; Hasler, S.; Johnson, T.; Avery, E.; Stefanini, K.; Suzuki, S.; Ansell, D.; Lynch, E. Racial and Ethnic Differences in Hospital Admissions of Emergency Department COVID-19 Patients. Med. Care 2022, 60, 415–422. [Google Scholar] [CrossRef]
- Shortreed, S.M.; Gray, R.; Akosile, M.A.; Walker, R.L.; Fuller, S.; Temposky, L.; Fortmann, S.P.; Albertson-Junkans, L.; Floyd, J.S.; Bayliss, E.A.; et al. Increased COVID-19 Infection Risk Drives Racial and Ethnic Disparities in Severe COVID-19 Outcomes. J. Racial Ethn. Health Disparities 2023, 10, 149–159. [Google Scholar] [CrossRef]
- Ribeiro, K.B.; Ribeiro, A.F.; Veras, M.A.D.S.M.; De Castro, M.C. Social inequalities and COVID-19 mortality in the city of São Paulo, Brazil. Int. J. Epidemiol. 2021, 50, 732–742. [Google Scholar] [CrossRef]


| Total, n (%) | Unvaccinated, n (%) | Partial, n (%) | Fully Vaccinated ♣, n (%) | Fully + Booster ♣ | |
|---|---|---|---|---|---|
| 953,661 (100) | 901,966 (94.6) | 17,973 (1.9) | 32,823 (3.4) | 899 (0.1) | |
| Demographic data | |||||
| Age, mean (SD) | 42.3 (15) | 41.8 (14.6) | 53.1 (18.1) | 51.9 (17.6) | 61.3 (17.4) |
| Age groups, n (%) | |||||
| 18 to 49 years | 678,559 (71.2) | 654,137 (72.5) | 7853 (43.7) | 16,327 (49.7) | 242 (26.9) |
| 50 to 64 years | 196,367 (20.6) | 182,395 (20.2) | 5159 (28.7) | 8589 (26.2) | 224 (24.9) |
| Over 65 years | 78,735 (8.3) | 65,434 (7.3) | 4961 (27.6) | 7907 (24.1) | 433 (48.2) |
| Female, n (%) | 533,895 (56) | 503,428 (55.8) | 10,463 (58.2) | 19,482 (59.4) | 522 (58.1) |
| Area of residence, n (%) | |||||
| Urban | 947,945 (99.4) | 896,424 (99.4) | 17,907 (99.6) | 32,716 (99.7) | 898 (99.9) |
| Rural | 5442 (0.6) | 5272 (0.6) | 66 (0.4) | 103 (0.3) | 1 (0.1) |
| Unknown | 274 (0) | 270 (0) | - | 4 (0) | - |
| Region of residence, n (%) | |||||
| Antioquia | 544,911 (57.1) | 513,348 (56.9) | 10,016 (55.7) | 21,032 (64.1) | 515 (57.3) |
| Atlántico | 102,152 (10.7) | 95,115 (10.5) | 2590 (14.4) | 4397 (13.4) | 50 (5.6) |
| Bogotá, Capital City | 104,404 (10.9) | 101,739 (11.3) | 1179 (6.6) | 1439 (4.4) | 47 (5.2) |
| Caldas | 24,567 (2.6) | 22,978 (2.5) | 1075 (6) | 511 (1.6) | 3 (0.3) |
| Santander | 26,153 (2.7) | 25,810 (2.9) | 289 (1.6) | 54 (0.2) | - |
| Valle del Cauca | 88,430 (9.3) | 80,653 (8.9) | 2478 (13.8) | 5021 (15.3) | 278 (30.9) |
| Other | 63,044 (6.6) | 62,323 (6.9) | 346 (1.9) | 369 (1.1) | 6 (0.7) |
| Race, n (%) | |||||
| Afro-Colombian | 7000 (0.7) | 6479 (0.7) | 172 (1) | 343 (1) | 6 (0.7) |
| Mulato | 1070 (0.1) | 1016 (0.1) | 25 (0.1) | 28 (0.1) | 1 (0.1) |
| Zambo | 437 (0) | 408 (0) | 10 (0.1) | 18 (0.1) | 1 (0.1) |
| Indigenous | 148 (0) | 134 (0) | 9 (0.1) | 5 (0) | - |
| White-Hispanic | 68,764 (7.2) | 63,218 (7) | 1925 (10.7) | 3505 (10.7) | 116 (12.9) |
| Mixed | 232,454 (24.4) | 215,921 (23.9) | 5709 (31.8) | 10,558 (32.2) | 266 (29.6) |
| Unknown | 643,788 (67.5) | 614,790 (68.2) | 10,123 (56.3) | 18,366 (56) | 509 (56.6) |
| Household income, n (%) | |||||
| <2 times the minimum wage | 588,063 (61.7) | 560,839 (62.2) | 10,090 (56.1) | 16,728 (51) | 406 (45.2) |
| 2–5 times the minimum wage | 221,304 (23.2) | 207,781 (23) | 4487 (25) | 8781 (26.8) | 255 (28.4) |
| >5 times the minimum wage | 88,900 (9.3) | 79,413 (8.8) | 2755 (15.3) | 6504 (19.8) | 228 (25.4) |
| Unknown | 55,394 (5.8) | 53,933 (6) | 641 (3.6) | 810 (2.5) | 10 (1.1) |
| Clinical data | |||||
| Weight, kg (SD) | 69 (22.2) | 69 (22.2) | 69 (21.3) | 68 (22.3) | 66 (23.7) |
| Height, cm (SD) | 151 (45.5) | 151 (45.2) | 150 (45.3) | 146 (51.7) | 138 (59.6) |
| Pregnant, n (%) | 5235 (0.5) | 4783 (0.5) | 152 (0.8) | 290 (0.9) | 10 (1.1) |
| Number of comorbidities, mean (SD) | 1 (1.4) | 1 (1.4) | 2 (1.7) | 2 (1.7) | 2 (1.9) |
| Comorbidities, n (%) | |||||
| Immunocompromised condition | 226,623 (23.8) | 211,700 (23.5) | 5370 (29.9) | 9271 (28.2) | 282 (31.4) |
| Hypertension | 181,883 (19.1) | 163,501 (18.1) | 6692 (37.2) | 11,279 (34.4) | 411 (45.7) |
| Mental health condition | 143,341 (15) | 133,315 (14.8) | 3513 (19.5) | 6305 (19.2) | 208 (23.1) |
| Cancer | 106,730 (11.2) | 99,272 (11) | 2625 (14.6) | 4688 (14.3) | 145 (16.1) |
| Obesity | 102,941 (10.8) | 96,752 (10.7) | 2292 (12.8) | 3823 (11.6) | 74 (8.2) |
| Chronic lung disease | 70,959 (7.4) | 65,250 (7.2) | 2072 (11.5) | 3516 (10.7) | 121 (13.5) |
| Diabetes | 59,707 (6.3) | 53,587 (5.9) | 2281 (12.7) | 3694 (11.3) | 145 (16.1) |
| Cardiac disorder | 21,792 (2.3) | 18,754 (2.1) | 1071 (6) | 1884 (5.7) | 83 (9.2) |
| Chronic kidney disease | 20,713 (2.2) | 18,193 (2) | 916 (5.1) | 1537 (4.7) | 67 (7.5) |
| Peripheral vascular disease | 17,741 (1.9) | 15,989 (1.8) | 608 (3.4) | 1109 (3.4) | 35 (3.9) |
| Chronic liver disease | 13,188 (1.4) | 12,235 (1.4) | 353 (2) | 581 (1.8) | 19 (2.1) |
| Cerebrovascular accident | 8166 (0.9) | 7169 (0.8) | 361 (2) | 601 (1.8) | 35 (3.9) |
| Drug use disorder | 6964 (0.7) | 6614 (0.7) | 137 (0.8) | 209 (0.6) | 4 (0.4) |
| HIV/AIDS | 6720 (0.7) | 6235 (0.7) | 161 (0.9) | 321 (1) | 3 (0.3) |
| Dementia—neurological condition | 6249 (0.7) | 5118 (0.6) | 376 (2.1) | 723 (2.2) | 32 (3.6) |
| Tuberculosis | 3143 (0.3) | 2922 (0.3) | 94 (0.5) | 122 (0.4) | 5 (0.6) |
| Transient ischemic attack | 2745 (0.3) | 2405 (0.3) | 134 (0.7) | 193 (0.6) | 13 (1.4) |
| Organ transplantation | 1913 (0.2) | 1712 (0.2) | 52 (0.3) | 139 (0.4) | 10 (1.1) |
| Sickle cell disease | 451 (0) | 425 (0) | 10 (0.1) | 16 (0) | - |
| Down syndrome | 132 (0) | 119 (0) | 4 (0) | 8 (0) | 1 (0.1) |
| Risk factors for severe COVID-19, n (%) | |||||
| Age and a comorbidity | 86,990 (9.1) | 72,812 (8.1) | 5284 (29.4) | 8427 (25.7) | 467 (51.9) |
| Age only | 14,994 (1.6) | 12,591 (1.4) | 847 (4.7) | 1456 (4.4) | 100 (11.1) |
| Severity, n (%) | |||||
| Mild | 746,408 (78.3) | 703,237 (78) | 13,458 (74.9) | 28,907 (88.1) | 806 (89.7) |
| Moderate | 7152 (0.7) | 6229 (0.7) | 243 (1.4) | 649 (2) | 31 (3.4) |
| Severe | 191,260 (20.1) | 184,014 (20.4) | 4071 (22.7) | 3116 (9.5) | 59 (6.6) |
| Critical | 8841 (0.9) | 8486 (0.9) | 201 (1.1) | 151 (0.5) | 3 (0.3) |
| Reinfected, n (%) | 58,785 (6.2) | 57,143 (6.3) | 648 (3.6) | 975 (3) | 19 (2.1) |
| Number of reinfections, n (%) | |||||
| 1 | 52,099 (5.5) | 50,622 (5.6) | 578 (3.2) | 881 (2.7) | 18 (2) |
| 2 | 2559 (0.3) | 2491 (0.3) | 39 (0.2) | 29 (0.1) | - |
| 3 | 125 (0) | 123 (0) | 2 (0) | - | - |
| 4 | 4 (0) | 4 (0) | - | - | - |
| Chronic Medication Usage, n (%) | |||||
| 1 Medication | 327,463 (34.3) | 311,172 (34.5) | 5884 (32.7) | 10,217 (31.1) | 190 (21.1) |
| 2 Medications | 63,887 (6.7) | 57,952 (6.4) | 2198 (12.2) | 3588 (10.9) | 149 (16.6) |
| 3 Medications | 31,593 (3.3) | 27,702 (3.1) | 1470 (8.2) | 2338 (7.1) | 83 (9.2) |
| 4 Medications | 10,430 (1.1) | 8981 (1) | 570 (3.2) | 841 (2.6) | 38 (4.2) |
| 5 Medications | 434 (0) | 351 (0) | 29 (0.2) | 53 (0.2) | 1 (0.1) |
| None | 519,854 (54.5) | 495,808 (55) | 7822 (43.5) | 15,786 (48.1) | 438 (48.7) |
| Model 1: Severity ♣ | Model 2: Death ♣ | |
|---|---|---|
| OR [CI 95%] (p-value) | OR [CI 95%] (p-value) | |
| (Intercept) | 0.015 *** | 0.000 *** |
| [0.015, 0.016] (<0.001) | [0.000, 0.000] (<0.001) | |
| Age | 1.041 *** | 1.091 *** |
| [1.040, 1.041] (<0.001) | [1.089, 1.093] (<0.001) | |
| Male | 1.043 *** | 1.775 *** |
| [1.031, 1.055] (<0.001) | [1.685, 1.870] (<0.001) | |
| Weight (kg) | 1.017 *** | 0.989 *** |
| [1.016, 1.017] (<0.001) | [0.988, 0.990] (<0.001) | |
| Height (cm) | 1.000 * | |
| [1.000, 1.000] (0.012) | ||
| Between two and five legal minimum wages | 0.954 *** | 0.859 *** |
| [0.942, 0.967] (<0.001) | [0.804, 0.916] (<0.001) | |
| Income: Missing | 0.908 *** | 0.721 *** |
| [0.886, 0.929] (<0.001) | [0.635, 0.816] (<0.001) | |
| More than five legal minimum wages | 0.713 *** | 0.716 *** |
| [0.698, 0.729] (<0.001) | [0.642, 0.797] (<0.001) | |
| Fully vaccinated | 0.471 *** | 0.665 *** |
| [0.452, 0.491] (<0.001) | [0.585, 0.753] (<0.001) | |
| Fully vaccinated + booster | 0.354 *** | 0.656 |
| [0.265, 0.464] (<0.001) | [0.331, 1.164] (0.185) | |
| Partially vaccinated | 1.036+ | 0.826 ** |
| [0.995, 1.078] (0.090) | [0.723, 0.941] (0.005) | |
| Reinfected | 2.938 *** | 0.651 *** |
| [2.868, 3.008] (<0.001) | [0.550, 0.765] (<0.001) | |
| Number of commorbidities | 1.304 *** | 1.140 *** |
| [1.298, 1.309] (<0.001) | [1.113, 1.168] (<0.001) | |
| Year: 2021 | 0.661 *** | 1.509 *** |
| [0.654, 0.669] (<0.001) | [1.421, 1.605] (<0.001) | |
| Year: 2022 | 0.103 *** | 0.967 |
| [0.101, 0.106] (<0.001) | [0.877, 1.067] (0.510) | |
| Year: 2023 | 0.119 *** | 1.952 ** |
| [0.098, 0.144] (<0.001) | [1.238, 2.951] (0.002) | |
| Critical | 851.564 *** | |
| [766.605, 946.666] (<0.001) | ||
| Moderate | 3.412 *** | |
| [2.389, 4.770] (<0.001) | ||
| Severe | 3.473 *** | |
| [3.158, 3.821] (<0.001) | ||
| Number of commorbidities × Critical | 0.512 *** | |
| [0.494, 0.531] (<0.001) | ||
| Number of commorbidities × Moderate | 0.870 ** | |
| [0.787, 0.960] (0.006) | ||
| Number of commorbidities × Severe | 0.847 *** | |
| [0.823, 0.873] (<0.001) | ||
| Num. Obs. | 953,408 | 953,414 |
| AIC | 820,221 | 54,654 |
| BIC | 820,409 | 54,901 |
| Log. Lik. | −410,094 | −27,306 |
| F | 7778 | 1571 |
| RMSE | 0.37 | 0.08 |
| Previous to Vaccination Plan | Subsequent to Vaccination Plan ♣ | ||||
|---|---|---|---|---|---|
| <65, n (%) | ≥65, n (%) | <65, n (%) | ≥65, n (%) | ||
| 615,608 (100) | 55,287 (100) | 195,802 (100) | 28,179 (100) | ||
| Without Comorbidities | 328,983 (53.4) | 8411 (15.2) | 104,499 (53.4) | 4630 (16.4) * | |
| Comorbidities | |||||
| Total | 286,625 (46.6) | 46,876 (84.8) | 91,303 (46.6) * | 23,549 (83.6) * | |
| Immunocompromised state | 134,145 (21.8) | 21,032 (38) | 43,291 (22.1) * | 10,898 (38.7) | |
| Hypertension | 85,169 (13.8) | 37,888 (68.5) | 28,227 (14.4) * | 19,108 (67.8) * | |
| Mental health conditions | 85,303 (13.9) | 12,101 (21.9) | 28,162 (14.4) * | 6900 (24.5) * | |
| Cancer | 62,758 (10.2) | 10,355 (18.7) | 20,364 (10.4) * | 5536 (19.6) * | |
| Obesity | 66,772 (10.8) | 5262 (9.5) | 20,482 (10.5) * | 2322 (8.2) * | |
| Chronic lung disease | 35,078 (5.7) | 12,746 (23.1) | 11,417 (5.8) * | 5939 (21.1) * | |
| Diabetes | 25,472 (4.1) | 15,620 (28.3) | 7790 (4) * | 7225 (25.6) * | |
| Cardiac conditions | 7240 (1.2) | 6926 (12.5) | 2480 (1.3) * | 3800 (13.5) * | |
| Chronic kidney disease | 7264 (1.2) | 6514 (11.8) | 2365 (1.2) | 3351 (11.9) | |
| Peripheral vascular disease | 8000 (1.3) | 3716 (6.7) | 2759 (1.4) * | 2080 (7.4) * | |
| Chronic liver disease | 7659 (1.2) | 1200 (2.2) | 2588 (1.3) * | 609 (2.2) | |
| Cerebrovascular accident | 2893 (0.5) | 2329 (4.2) | 910 (0.5) | 1462 (5.2) * | |
| HIV/AIDS | 4329 (0.7) | 163 (0.3) | 1493 (0.8) * | 81 (0.3) | |
| Dementia—Neurological conditions | 659 (0.1) | 2892 (5.2) | 239 (0.1) | 2142 (7.6) * | |
| Tuberculosis | 1855 (0.3) | 272 (0.5) | 615 (0.3) | 159 (0.6) | |
| Transient ischemic attack | 1068 (0.2) | 700 (1.3) | 376 (0.2) | 427 (1.5) * | |
| Organ transplantation | 911 (0.1) | 249 (0.5) | 418 (0.2) * | 164 (0.6) * | |
| Sickle cell disease | 270 (0) | 20 (0) | 120 (0.1) * | 8 (0) | |
| Down syndrome | 92 (0) | (0) | 35 (0) | 2 (0) | |
Disclaimer/Publisher’s Note: The statements, opinions and data contained in all publications are solely those of the individual author(s) and contributor(s) and not of MDPI and/or the editor(s). MDPI and/or the editor(s) disclaim responsibility for any injury to people or property resulting from any ideas, methods, instructions or products referred to in the content. |
© 2025 by the authors. Licensee MDPI, Basel, Switzerland. This article is an open access article distributed under the terms and conditions of the Creative Commons Attribution (CC BY) license (https://creativecommons.org/licenses/by/4.0/).
Share and Cite
Arciniegas, J.; Reyes, J.M.; Bolaños-López, J.; Spinardi, J.R.; Yang, J.; Maleki, F.; Gonzalez, F.J.; Bello, C.J.; Herrera-Díaz, A.C.; Escobar, O.; et al. Burden in Colombia of COVID-19 in Adults and the Associated Clinical Characteristics: A Retrospective Database Analysis. Trop. Med. Infect. Dis. 2025, 10, 146. https://doi.org/10.3390/tropicalmed10060146
Arciniegas J, Reyes JM, Bolaños-López J, Spinardi JR, Yang J, Maleki F, Gonzalez FJ, Bello CJ, Herrera-Díaz AC, Escobar O, et al. Burden in Colombia of COVID-19 in Adults and the Associated Clinical Characteristics: A Retrospective Database Analysis. Tropical Medicine and Infectious Disease. 2025; 10(6):146. https://doi.org/10.3390/tropicalmed10060146
Chicago/Turabian StyleArciniegas, Jair, Juan Manuel Reyes, Jhon Bolaños-López, Julia Regazzini Spinardi, Jingyan Yang, Farzaneh Maleki, Farley Johanna Gonzalez, Carlos Jose Bello, Ana Catalina Herrera-Díaz, Omar Escobar, and et al. 2025. "Burden in Colombia of COVID-19 in Adults and the Associated Clinical Characteristics: A Retrospective Database Analysis" Tropical Medicine and Infectious Disease 10, no. 6: 146. https://doi.org/10.3390/tropicalmed10060146
APA StyleArciniegas, J., Reyes, J. M., Bolaños-López, J., Spinardi, J. R., Yang, J., Maleki, F., Gonzalez, F. J., Bello, C. J., Herrera-Díaz, A. C., Escobar, O., Rubio, A., Garcia, M., Pérez Jaramillo, L. E., La Rotta, J., Kyaw, M. H., & Mendoza, C. F. (2025). Burden in Colombia of COVID-19 in Adults and the Associated Clinical Characteristics: A Retrospective Database Analysis. Tropical Medicine and Infectious Disease, 10(6), 146. https://doi.org/10.3390/tropicalmed10060146