Abstract
Due to the perishable nature of tourist products, which impacts supply and demand, the possibility of analysing the relationship between customers’ satisfaction and service quality can contribute to increased revenues. Machine learning techniques allow the analysis of how these services can be improved or developed and how to reach new markets, and look for the emergence of ideas to innovate and improve interaction with the customer. This paper presents a decision-support system for analysing consumer satisfaction, based on consumer feedback from the customer’s experience when transported by a transfer company, in the present case working in the Algarve region, Portugal. The results show how tourists perceive the service and which factors influence their level of satisfaction and sentiment. One of the results revealed that the first impression associated with good news is what creates the most value in the experience, i.e., “first impressions matter”.
1. Introduction
To overcome the challenges posed by today’s society, business intelligence (BI) tools, coupled with the use of data mining (DM) techniques, can increase our understanding of business operations. These tools and techniques can make companies more competitive. They can also ensure the survival and profitability of organisations by discovering new customer insights and innovating to meet actual or desired customer needs [1].
Multimodal technologies refer to all technologies, combining features extracted from different modalities (text, audio, image, etc.). They can be applied and explored in several fields, including transportation or trip planning, involving the analysis of customer behaviour and satisfaction [2]. They can be (are) directly related to the concept of big data, which includes collecting data automatically, together with the application of DM techniques that are associated with the evaluation of services provided by a tourism company, which will help to increase a company’s knowledge. They will also help companies to look for the emergence of ideas to innovate in their interaction with the customer, allowing them to improve or develop the services provided to the customer and reach new markets [3].
One of the sectors that is directly associated with tourism is the transport (of tourists) and, in particular, transfer companies that transport tourists and managers. The relationship between these customers’ satisfaction and revenues in this sector has recently received worldwide attention. Many tourism transport companies aim to identify ways to increase the number of customers and consequently the associated revenue [4,5].
This paper seeks to understand one of the topics that has not been addressed in the literature (see Section 2.3—discussion); it aims to analyse the tourist (consumers) satisfaction associated with a tourism transport organisation, namely transfer transportation (of tourist). With this purpose in mind, it used consumer feedback (to investigate the customer’s experience, and consequently, tourist satisfaction) from a tourism transport (transfer) company, which operates mainly in the south of Portugal in the tourist region of the Algarve, which has an area of ~5000 km2, a resident population of ~460.000 habitats, and receives an average of 7 million foreigners each year. In total, including national visitors, around 10 million people visit the Algarve annually. The main contribution of this paper is a decision-support system (DSS) for the analysis of consumer satisfaction, which identifies the factors that contribute to a (very) positive evaluation of the tourist experience associated with the transport service, where variables are considered that allow identifying what influenced the assigned score, including parameters that are defined by the company and do not depend on the lived moment, such as the driver selected to carry out the activity. The DSS will provide, for instance, knowledge for the transport company to deliver quality services to their travellers. Other contributions include determining the factors that have the most significant impact on the company and the region’s image because transport companies are often the customer’s first and last point of contact with the region.
The decision-support system is divided into three main modules: (a) the knowledge database that contains the information collected in real-time acquired from different sources, such as the customers (tourists), vehicles, and motorists; (b) the software system that includes a model management system, which creates simulations and predictions associated with the business to understand how the transport service can be improved; and (c) a user interface, also known as a dashboard (explanation is out of the focus of the present paper), and report management to evaluate the effectiveness of services for the managers. The three modules of the DSS are no different from the others; however, the whole functionality and the application are both different; they provide knowledge for the transport company to deliver quality services to their travellers as a way to increase tourism satisfaction.
This paper is structured into four sections. Following this introduction, Section 2 addresses the concepts and the state-of-the art associated with Business Intelligence and data mining techniques and their applications and contribution to the travel industry. The methodology to develop the decision-support system is established in Section 3. In Section 4, the results are analysed and discussed. In Section 5, the conclusions and some recommendations for future work are presented.
2. Literature Review
The Internet is an excellent means of communication among individuals. It can also be an adequate tool for the tourism marketer who wishes to market travel products [6]: (i) the Internet allows one-to-one marketing; (ii) permits two-way interaction between marketeer and consumer; (iii) is accessible in any place, 24 h a day and 365 days in a year; (iv) it is possible to change tourism products components at the last minute; (v) it provides several real testimonies that help in tourist decision making; and (vi) it reduces costs in marketing campaigns and in handling reservations [7].
Many tourists rely on innovative electronic tourism applications to find information about the destination they intend to visit and support their decision-making process [8]. Furthermore, the tourism industry increasingly has access to user-generated content (UGC), which allows them to analyse their consumers’ behaviour while enabling them to predict the consumer’s travel decisions [9]. UGC on Internet platforms can be analysed using tools with analytical capabilities, such as ML techniques [10,11,12].
This will allow the definition of growth strategies, increase competitiveness, calculate the attractiveness of the destination, help their survival in times of crisis and improve the sustainable management of tourist destinations, and increase customer satisfaction [1]. According to behaviour and tourist preferences, to increase satisfaction it is necessary to apply a combination of multimodal technologies that allow offers to be disseminated to the target client, whose characteristics have been identified through ML techniques [10,13].
2.1. Customer Experience
Customer satisfaction in the travel industry has been investigated by several researchers. For example, Gorter, Nijkampand, and Vork [14] concluded that longer travel times result in lower levels of satisfaction. In accord with the work of Bassi and Guido [15] (pp. 83), customer satisfaction “depends not on products performance, but also on many other aspects involved in the consumption experience, important in all stages preceding and the following purchase”. Guiver et al. [16] determined that high satisfaction levels are related to service dimensions, such as comfort and cleanliness. Other factors influencing satisfaction include word-of-mouth communication, purchase intention, and complaining behaviour [17].
For a service business in a very competitive atmosphere, the management of customer experience is very important [18,19]. Customer experience consolidates service quality, which is parallel to the goal of clarifying the static estimation of service quality [20].
Good experience mixes feelings and sentiments [21] and has a positive influence on the customer’s satisfaction, loyalty, and word-of-mouth advertising or recommendation. For these authors, the customer’s experience is the main driver of consumer behaviour and is a relevant dimension to include in the strategic objective for service companies [21]. In addition, Gitto and Mancuso [22] used sentiment analysis to evaluate the feedback associated with an airport’s performance in terms of the quality of the service.
Mogaji and Erkan [23] found that customer experience is rapidly changing the train transportation service context, motivated by the electronic word-of-mouth expressed in social media, where the customer communicates their opinions, which has been analysed by sentiment analysis applied to the travel component of the tourism product. Park [24] and Park et al. [25] refer to customer satisfaction as a key determinant of success in the tourism industry. The affective dimension associated with the customer experience can be analysed by applying sentiment-analysis approaches to the opinions and customer feedback and can be used to gain recommendations or to improve services [26]. A good decision-support environment that is based on the most recent AI techniques and which can extract the customer experience can contribute to the analysis of customer satisfaction [1,27]. This allows an investigation of the strengths and gaps identified in the opinions of customers. It can also help to define strategies to take advantage of the opportunities that arise and to be able to overcome the threats that may arise to the tourism organisation [28].
2.2. Business Intelligence and Data Mining in the Travel Industry
BI in the tourism industry is a set of tools, technologies, and operations which enable a company to collect and then present valuable data and insightful information about a tourism organisation in dashboards or reports [13]. In the BI decision environment, online analytical processing (OLAP) enables a complex analysis of historical data, such as the number of tourists who booked transport services on their last holiday. Meanwhile, DM and ML methods allow the generation of hypotheses about the future, such as finding the factors that most influence customer satisfaction associated with a service [29]. For simplicity, for the remainder of the paper, ML techniques are most of the time included inside DM.
In terms of the tourism and BI applications, the OLAP analysis and DM techniques can contribute to developing new strategic business models in several tourism activities. Examples exist (but are not limited to) in accommodation (hospitality reputation, competitive set, etc.) [10,29]; OLAP applications include average price per district and stars, number of hotels by district and stars average price, and DM methods including the prediction of the expected sale of rooms in the next holidays, and human resource management considering forecasts. In Marketing, OLAP applications include customer analysis and product analysis, and DM methods include the classification of tourists in segments to discover the characteristics that allow grouping them (segments) [30,31].
The application of methods associated with BI and DM will increase the decision-making capacities of the organisational managers of tourists companies because the information considered (i) is relevant to the company’s business, (ii) allows the real reasons for choosing the destination services and products to be identified, (iii) allows the booking trends to be discovered, (iv) allows a perception of the expectations associated with services and products, (v) provides added value by customer segment, and (vi) assesses the quality of the experience associated with the service [10,32].
The application of AI techniques in the travel industry, and in tourism transportation, has been considered over the last two decades in several studies, e.g., [33]. One of the problems investigated was which factors contribute to the increase of productivity and profitability in the activity, such as airline revenue and yield management [34], the prediction of cancellation of flights [35], no-show behaviour [36], tourism feedback and satisfaction about transportation [26,37], predicted tourism demand [38], on-time performance analysis [39], visualization of tourism arrivals depending on dimension (travel type, origin, time, or season) [40], tourist’s feedback and generated content [40], tourism performance indicators (arrival, tourists, or overnight stays) [20], tourist sentiment mining [41,42], customer experience and sentiment analysis [22,23,43], tourist arrival prediction [44], and the passenger demand as a result of the pandemic crisis [45].
In the tourism travel sector, it is relevant to define the future through AI techniques, considering adequate tools to produce smart decisions and consequently contribute to the building of smart destinations. As Amadeus [46] describes, BI and DM techniques have “become the strategy of choice for organisations of any size looking to secure competitive differentiation and seek out new revenue opportunities”, as they could create new business opportunities and product and service innovations.
2.3. Discussion
In summary, for the tourism industry, the Internet allows product differentiation, increases customer loyalty, and reduces production costs, especially considering implementing marketing strategies with a one-to-one focus. Two main focuses can be addressed to achieve product differentiation in this very competitive industry: (a) customer experience and satisfaction and (b) the use of the most recent artificial intelligence (AI) techniques [33]. This is a big umbrella that includes the use of BI, DM, and ML techniques.
Measuring customer satisfaction helps us to understand how much of the customer’s expectations have been fulfilled, and what aspects create positive or negative emotions associated with the travel customer experience and helps to analyse the “health” of the tourism industry for strategic planning purposes [47,48]. Furthermore, the role of emotions is a crucial aspect and an important variable in the customer experience [49], in all areas in general and specifically in the tourism product component related to the transport and travel industry.
This study focuses on one of the topics that has not been addressed in the literature and is fundamental for a segment of the travel industry. It aims to analyse the tourism satisfaction associated with a tourism transport organisation, namely transfer transportation (of tourists), in two strands: (a) identify the dimension that can contribute to tourist satisfaction and (b) study the sentiment analysis associated with the tourism experience in a way that will consider the results to improve the quality of service and achieve insights about the transport business.
In this context, the following research question was posed: How can we provide better quality services to (transfer) travel consumers in a way to improve consumer satisfaction?
3. Methodology
This study aims to analyse the tourism experience associated with the tourism transport manager, identify the dimensions that can contribute to tourist satisfaction, and explore the sentiment analysis associated with the tourism experience. With this purpose in mind, a decision-support system to analyse consumer satisfaction (DSS2ACS) was developed, combining BI and business analytics benefits.
The research methodology has three main steps, as follows: (i) data gathering, transformation, and database storage; this step includes tasks to collect, transform, and store data in a data warehouse, which is structured to support the decision-making process and enable the intended analyses [50,51,52,53]; (ii) building the decision-support system, subdivided into two main tasks: (ii.1) the variables/dimensions to be considered in the study and the data analysis with [52], (ii.2) OLAP, and (ii.3) DM techniques [51,52]; and (iii) analysis and discussion of the results [50,51,53].
3.1. Data Gathering, Transformation, and Database Storage
This initial step is associated with the process of obtaining the data in a big data environment, where the “5 Vs” define this environment [50], as follows: data volume, the velocity of data collection, data variety, data veracity, and data value. The data gathering was subdivided into three phases, as follows:
- (i)
- Data collection: The data was collected from the company’s (YellowFish Transfers, https://www.yellowfishtransfers.com/, accessed on 23 November 2022) information system, which is characterised by 90,691 anonymized rows, corresponding to the operational data from 2012 to 2017. Each row is made up of all the available information (items/attributes) about a traveller or group associated with that traveller.
- (ii)
- Data Transformation: To answer the research question, filters were applied to the dataset to only consider: (a) arrivals to the Faro Airport (in Algarve, Portugal) and (b) rows with customer feedback comments. This resulted in 29,339 rows available.
- (iii)
- Upload to the Data Warehouse: From the available attributes, only the variables relevant to the present study were considered, which are detailed with the respective description and units in Table 1 and Table 2, and in Section 3.2.1.
 Table 1. Numeric variables considered in the study.
Table 2. Text variables considered in the study.
Table 1. Numeric variables considered in the study.
Table 2. Text variables considered in the study.
It is important to stress at this point that the data collection mentioned in (i) was extracted automatically from three different sources: inquiry (text) presented to the tourists and processed by OCR (optical character recognition), the kilometres information directly extracted from the car, and the number of passengers, inserted manually in a graphical user interface (GUI) by the transfer company.
3.2. Decision-support System to Analyse Consumer Satisfaction
While OLAP analysis can be used to create cubes and characterise the sample by showing the results through management reports or in a dashboard format, DM techniques can help to find any relationships, patterns, or models that are implicit in the data [51]. In terms of DM techniques, two types of data can be considered, namely: numerical and text data.
Having the above in mind, the DSS2ACS was divided into three main modules: (a) the definition of the variables considered in the study, creating the data warehouse, to support the decision-making process; (b) the OLAP techniques; and (c) the DM techniques. The latter is subdivided into (c.1) DM techniques that explore the numeric values (namely, Linear Multivariable Regression and Decision Trees) and (c.2) text mining techniques to evaluate the consumer’s satisfaction (namely, a cloud of words and sentiment-analysis methods [54]).
3.2.1. Variables Considered in the Study
The OLAP module analysis intends to predict the customer experience measured by the FeedbackExperience variable. Therefore, it was set as the target variable (i.e., dependent variable) to FeedbackExperience to measure the customer’s experience with the travel service, in such a way as to have a perception of customer satisfaction. In addition to the dependent variable, the independent variables that can contribute to measuring the customer experience are presented in Table 1. This table also presents the variables used for DM when using numeric values.
The DM evaluates the sentiment associated with the service, which corresponds to the customer experience measured by FeedbackComments. The variables that have text content are presented in Table 2.
The combination of OLAP and DM techniques enhances the creation of a decision-support environment that helps to obtain insights into the decision’s business. While OLAP techniques allow a complex, dynamic analysis in terms of the data levels, DM allows the generation of hypotheses about the data [55]. With this combination, a decision-support system emerges that combines the benefits of BI and business analytics and enhances the achievement of insights about the business.
3.2.2. OLAP Techniques
Based on the number of services considered (29,339; see Section 3.1), a filter was applied to withhold the countries with less than five accumulated services, which resulted in a total of 29,308 rows, grouped in Table 3. The same table also presents the average number of people transported and the average number of kilometres per service. The remaining countries, whose number of services is less than five, represent 186 services which correspond to 0.63% of the total number of services considered in this study. All OLAP techniques were implemented using the Power BI Microsoft Software [56].
Table 3.
Service characterisation by country and by customer experience evaluation.
This study has the following characterisation (see also Table 3):
- (i)
- Number of countries of origin: 23, with the United Kingdom standing out with the highest number of services (21,066), followed by Ireland (7168) and Portugal (308). The countries with the lowest number of services, equivalent to the minimum considered (5), are the Czech Republic, Estonia, and Italy.
- (ii)
- Average number of passengers transported per trip: Estonia is the country with the highest value (4.2 passengers), followed by Ireland (3.37) and Poland (3.22). The countries with the lowest average number are Portugal (2.20), followed by North America (USA and Canada) (2.35), and Spain and Austria (2.44).
- (iii)
- Average number of kilometres travelled per service: Switzerland is the country with the highest value (70.48 km), followed by Sweden (63.81 km) and Australia (61.22 km), and very close is Germany (61.21 km). The countries with the lowest average km travelled per service is Italy (33.00 km), followed by Luxembourg (36.32 km), Romania (43.00 km), and very close is Estonia (43.80 km).
- (iv)
- Regarding the average attributed to experience (evaluated by the FeedbackExperience variable), the three countries that appear with the highest value (5.0 out of 5.0) are Estonia, Italy, and Romania, whose number of services is five for the first two countries and six for the third, meaning that all customers in these countries rated the experience with five values (standard deviation of 0.0). For the countries with the lowest value, Sweden has the lowest value (4.6), followed by France (4.72), and Luxembourg is tied with the Netherlands (4.74).
- (v)
- Concerning the difference in opinions within the same country (measured by the standard deviation of the sample applied to the FeedbackExperience variable), Austria has a higher variability value (0.63), followed by France (0.57) and Portugal (0.56).
In global terms, this study focuses on 29,308 services associated with tourist transport, where the average number of passengers was 3.23 tourists, an average value of 48.31 km travelled, and the average of the feedback associated with the experience was 4.88 (with a standard deviation of opinions of 0.45 points). This represents a very good evaluation of the customer experience, which reveals the quality of the service provided by the company.
Shortening the number of countries for the next steps, in the top 10 in the number of services (29,153 of 29,339) were the United Kingdom (71.80%), Ireland (24.43%), Portugal (1.05%), the Netherlands (0.61%), North America (0.52%), Germany (0.31%), France (0.22%), Belgium (0.17%), Norway (0.13%), and Sweden (0.12%). These 10 countries will be considered in the exploratory data phase to determine if there is any visible relationship between customer experience evaluation and the average distance travelled or the average number of passengers for each country (Table 4).
Table 4.
Characterisation of the top ten countries in the number of services.
Figure 1 illustrates a comparison between the average of FeedbackExperience with the average kilometres travelled, number of services, and average number of passengers transported. According to the exploratory analysis carried out in this figure, no relationship is detected in the behaviour between the average of the FeedbackExperience associated with the experience and the average of kilometres travelled, neither with the average number of passengers transported nor with the number of services per country.
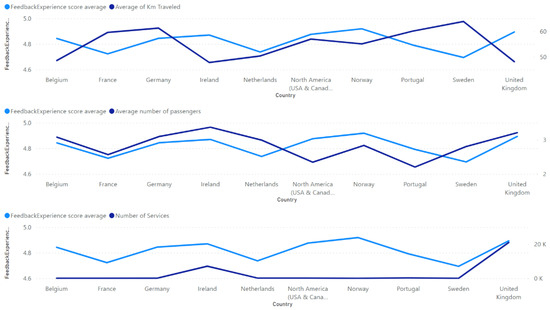
Figure 1.
Comparison between the average of FeedbackExperience with the average kilometres travelled, number of services, and average number of passengers transported.
Figure 2 compares the average of FeedbackExperience with the average of FeedbackPunctualArrival, FeedbackWelcome, FeedbackCurteousArrival, and FeedbackDrivingArrival. To complement the exploratory analysis, in this figure, there is no variable with identical behaviour to the FeedbackExperience (i.e., a variable that helps to explain the FeedbackExperience values). However, it appears that certain countries may have similar behaviours, which will be analysed by the correlation between the variables using Pearson’s correlation coefficient.
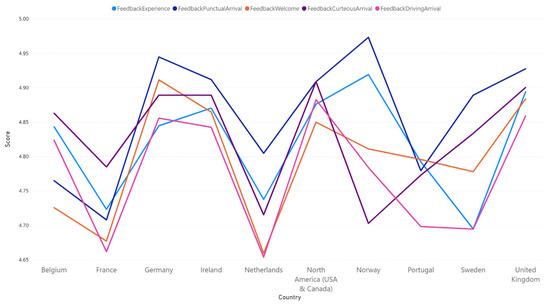
Figure 2.
Comparison between the average of FeedbackExperience with the average of FeedbackPunctualArrival, FeedbackWelcome, FeedbackCurteousArrival, and FeedbackDrivingArrival.
Pearson’s correlation coefficient measures the degree of linear correlation between two quantitative variables. Table 5 presents the correlations between the dependent and the independent variables considered in this study. According to the results, the FeedbackExperience seems not to be correlated with the distance (Km variable) and the number of travellers (Npax variable). However, FeedbackExperience seems to be correlated with the way the welcome is given (FeedbackWelcome), possibly a “good welcome” can influence a “good experience”. It is important to stress at this point that the data does not present multicollinearity.
Table 5.
Pearson’s correlation values between the FeedbackWelcome, FeedbackDrivingArrival, FeedbackCourteousArrival, FeedbackPunctualArrival, FeedbackWebsite, Npax, Km variables, and FeedbackExperience.
3.2.3. Data-Mining Techniques
Consumer satisfaction will be evaluated over two aspects using: (a) linear multivariable regression and decision tree methods with the FeedbackExperience dependent variable, and (b) cloud of words and sentiment-analysis methods to evaluate the FeedbackComments variable. It is important to stress that the data mining (and machine learning) studies were elaborated using the Orange DM software [57] (Orange, 2021).
Linear multivariate regression models use multiple (independent) variables to predict the outcome of a response variable. In our case, it is intended to find the optimum approximation, in the mean squared error (MSE) sense, in the form of Equation (1):
FeedbackExperience = β0+ β1 FeedbackWelcome + β2 FeedbackDrivingArrival + β3 FeedbackCurteousArrival + β4 FeedbackWebsite + β5 FeedbackPunctualArrival + β6 Km + β7 Npax +ε
Equation (1) allows us to identify the relationship between the independent variables and the dependent variable. After the estimation, the estimated model was obtained, which is expressed in Equation (2):
FeedbackExperience = 0.928 + 0.332 FeedbackWelcome + 0.195 FeedbackDrivingArrival + 0.108 FeedbackCurteousArrival + 0.092 FeedbackWebsite + 0.089 FeedbackPunctualArrival +ε
Similarly, decision tree analysis allows a model to be created in the form of a tree that predicts the value of a dependent variable. The model is created by breaking down the dataset into smaller and smaller subsets, while the associated decision tree is developed at the same time. Figure 3 shows the decision tree results, where the tree presented shows a depth of level three, which presents a binary tree, which places at least two instances in each leaf.
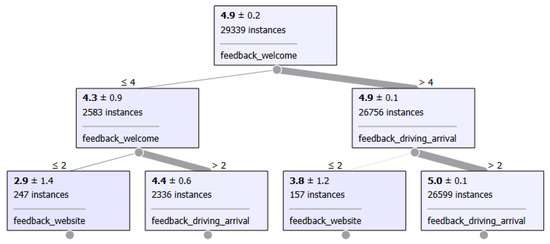
Figure 3.
Decision tree results.
To numerically measure the quality of the approximation, the coefficient of determination—R Square (R2)—allows us to assess the goodness of fit by measuring the proportion of variance explained by the model. Other measures to estimate the quality of the model are the MSE, the root mean square error (RMSE), and the mean absolute error (MAE) (Pardoe, 2020). The results for these metrics are presented in Table 6.
Table 6.
Model test and results.
It can be concluded that the model obtained through the decision trees is the most adjusted because it explains 58.20% (Table 6) of the variance and presents lower error values, considering the three types of errors. Based also on the results presented in Table 6 and assessing the impact of the decision tree methods, it can be concluded that how tourists are welcomed affects the value they place on the experience and, consequently, their satisfaction.
Text mining techniques are the next step to evaluate the consumer’s satisfaction with the DSS2ACS. The reason for this is that the linear regressions are sometimes too simple to capture complex relationships between the variables, and decision trees are sometimes not powerful enough to predict complex data. Consequently, it is necessary to conjugate those methods with other methods, such as text mining, which is applied to the travellers’ reviews associated with the same services.
As already mentioned, two methods were used:
- (a)
- Cloud of words, shown in Figure 4, considers the FeedbackComments to study customer satisfaction with tourism transport services. The text mining analysis was performed on 29,339 comments. Given that the size of the words represents the frequency of the words in the services’ commentaries, it is possible to see that some of the words with higher frequency were: “service”, “excellent”, “recommend”, “friendly”, and “great”, among others.
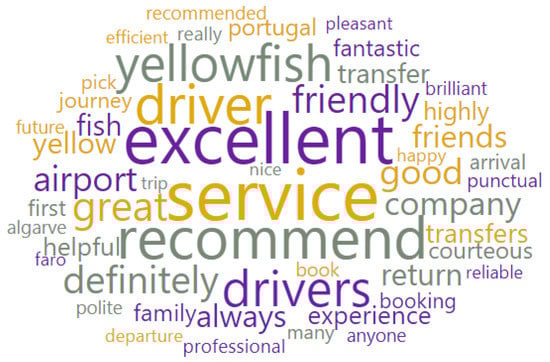 Figure 4. Word cloud results.
 - (b)
- Sentiment Analysis evaluates the sentiment associated with service comments. The VADER algorithm was used for this analysis [58], which produces a result between −1 (most negative sentiment) and +1 (most positive sentiment). Consequently, the results present a “sentiment value” for each comment, which is within the range of values described, where the most positive comment had a sentiment value (compound) of 0.9981, which has an associated value of 5.0 in the FeedbackExperience variable and which corresponds to the text shown in Figure 5. The most negative sentiment was the value of −0.9867, which is associated with a FeedbackExperience of 3.0, whose comment is also represented in Figure 5.
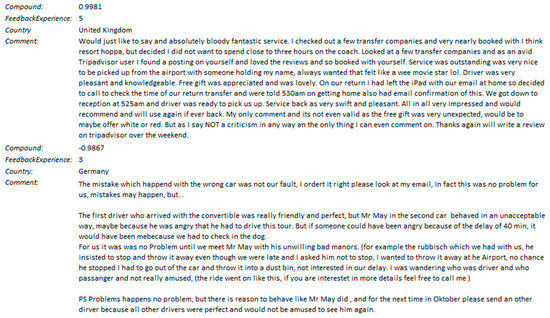 Figure 5. The most positive and negative sentiments associated with a service.
4. Analysis, Discussion, and Implications of the Results
OLAP techniques can help to find new and interesting facts from data stored in data warehouses, especially when the data analyst already knows or suspects the behaviour of the phenomenon that they want to analyse, allowing them to make assumptions. In the case of DM, the data analyst needs to learn what can influence the phenomenon that is to be observed. So, while using DM algorithms, the data analyst tries to find which factors influence behaviours the most because no assumptions are made. They also intend to discover relationships and patterns hidden in the data that are not obvious [55].
For instance, the results of sentiment analysis algorithms are usually expressed from −1 to +1. This makes it possible to compare the values of consumers’ opinions expressed in the various variables related to feedback (scored between 1 and 5). To make the comparison, sentiment normalisation was performed on a scale between 1 and 5. Considering only the countries with at least ten services, Figure 6 relates the sentiment obtained from the tourists’ comments with the feedback attributed to the experience and the number of services requested by consumers in each country.
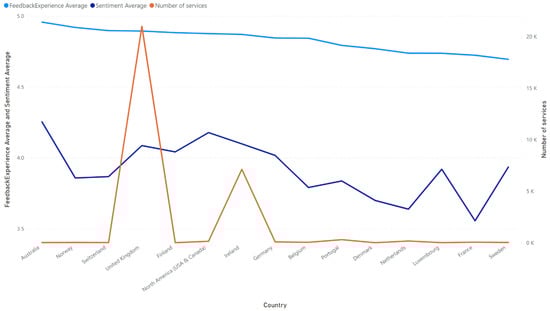
Figure 6.
The sentiment expressed in reviews, experience feedback, and the number of services performed for countries that account for a number greater than or equal to 10 services.
By analysing Figure 6, we can conclude that the sentiment is not related to the feedback attributed to the experience. In addition, the number of services available to the United Kingdom and Ireland justifies a study focused only on these two outbound markets. This raises the suggestion of analysing the other outbound markets while excluding these two countries.
This analysis was carried out by considering only feedback from services related to countries of origin whose number of services is at least 10. Australia is the country that most values the experience and has the highest positive sentiment. At the same time, France expresses sentiment with the lowest score, followed by the Netherlands.
Considering destinations with at least fifty services, the analysis presented in Figure 7 compares the average assessment of the sentiment analysis and the feedback of the experience grouped by country. In the same figure, it is possible to see that the number of passengers is not correlated with experience or sentiment. There is no difference from destination to destination because values are close.
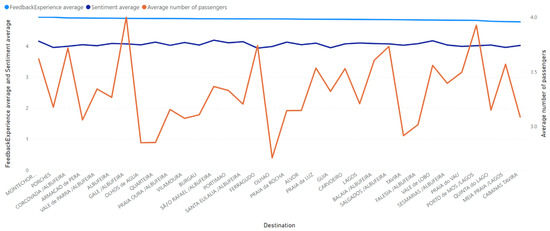
Figure 7.
The normalised sentiment expressed in reviews, experience feedback, and the average number of passengers performed for destinations that account for at least 50 services.
The distance covered can also be an analysis factor for a tourist transport company. Therefore, Figure 8 compares the average sentiment with the average associated with the feedback of the experience with the kilometres travelled, without ignoring the number of services performed for each distance. Only the services performed in the Algarve (up to 100 km away) were considered. It can be concluded that distance does not affect the appreciation of experience or feeling, nor is it related to the number of services performed. In this analysis, it is also possible to conclude that there are distances covered where the associated sentiment has lower values, such as happens at kilometres 32, 43, and 58. Therefore, the tourist transport company should investigate the reasons that lead to these feelings.
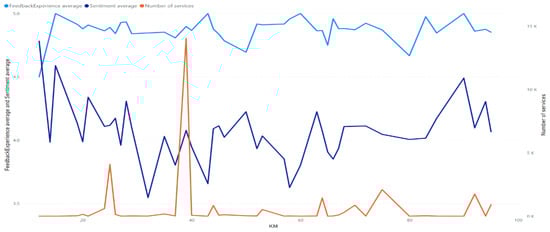
Figure 8.
The normalised sentiment expressed in reviews, experience feedback, and the number of km per trip for services with at most 100 kilometres.
A deeper analysis of the comments is necessary to find the factors that can influence customer satisfaction through the scores assigned to different aspects (e.g., considering the different aspects of the business). In the context of transport, the comments can attest to other factors that lead to satisfaction, such as the type or brand of vehicles used, the service provided by the drivers, and the cultural characteristics of each country, which may be reflected in the personalities of its citizens, mainly in terms of requirements.
Another factor that may be of interest is the various outbound markets, where the United Kingdom and Ireland, as representatives of international tourism, can be compared with domestic tourism (Portuguese customers), which is the country that occupies the third place in terms of services. Whether for tourism, which can help to discover unknown aspects associated with the business or in scientific terms, these analyses have implications that can lead to the emergence of new algorithms and methods applied to tourism management, which was one of the sectors that were most harmed by the pandemic caused by the SARSCOV-19 virus.
For transfer companies, related to the transport of tourists and concerning demand, they should consider that although the distance does not affect the evaluation attributed to the experiences and the feeling associated with it, there are places where the feeling presents very low values; therefore, what happens in the services to certain locations, the nationality of the passengers, flight times, or other variables that affect the emotions associated with these destinations should be considered and analysed, which should be considered specific strategies and promotions for travellers (consumers) from the UK and Ireland. It is also important to analyse the supply side, and from this perspective it is important to sensitize entrepreneurs to qualify their human resources, because the first impression is one of the factors that are most correlated with the evaluation attributed to the experience associated with the trip. In this context, it matters how travellers are received, from verbal language, through body language and even the driver’s clothing, in other words, all the factors that allow for creating the first impression.
Finally, considering the research question (i.e., How to provide better quality services to (transfer) travel consumers in a way to improve consumers’ satisfaction.), BI tools should be combined with analytical methods, such as DM algorithms, to analyse the feedback produced by customers (either on the numerical form of scores or in the form of textual testimonies). These methods allow us to ascertain the different dimensions associated with the development of tourist activity, whatever its nature. To do so, data analysts should choose a variable that helps to measure or perceive the evaluation of the quality of service by the customer, to be considered a proxy to ascertain the level of customer satisfaction. The component of the analysis of feelings applied to the data is increasingly relevant because it allows us to deepen the analysis of the data, enabling the segmentation of different assessments.
5. Conclusions
Technological innovations, including big data and advances in machine learning, are revolutionising business opportunities [59], mainly for those who wish to establish effective communication with their target customers [36,60]. Data analytics, enabled by big data and information systems, can contribute to extracting relevant data and discovering business insights. Conjugated with an accurate assessment of marketing performance, this should be a priority in tourism activity and can help businesses to assist the right customer, at the right place, and at the right time!
BI and business analytics tools can contribute to leveraging the discovery of knowledge about how tourism companies can improve their business, at a time when profit margins are small and the sector is experiencing an economic crisis following the recent pandemic. In concrete terms, this investigation was applied to a tourist transport (transfer) company and concluded that this decision-support system allows us to assess the customer experience, detecting what contributes most to its enhancement. It was discovered that the first impression associated with good news is what creates the most value in the experience; that is, the first impression made by the company is very important. In addition, each service aspect produces a feeling in the customer that is not always identical to the value attributed to the experience. Therefore, there is a need for more focused investigations on segments, countries, or destinations to find what conditions the tourists feel.
This study also concluded (for the Algarve region) that the distance, the number of kilometres travelled, or the number of passengers transported does not affect the value attributed to the experience or the feeling associated with customer satisfaction. In addition, the proposed decision system will allow the development of knowledge transfer paths relevant to academia and industry, including the development of digital twins [61]. These paths allow us to conclude that tourist satisfaction depends on several factors, as already mentioned. Here, the first image attributed to a service should be investigated, from the dimension associated with the human resource that provides the service to the characteristics and appearance of the equipment considered in the service, in this case, the vehicle, as well as the verbal, behavioural, and environmental communication skills, which influence the tourist’s cognitive, affective, and total component, contributing to the enhancement of the experience.
In resume, organizations associated with tourist transport should value and capacitate human resources, through the frequency of training actions associated with public relations and body verbal communication skills, including notions of protocol, to improve the first impression associated with their services, as well as consider an information system of this nature to monitor the aspects that can be improved in terms of the services they provide.
It is important to stress that, in this study, the DSS2ACS used data from a transport-transfer company in the south of Portugal in the touristic region of the Algarve. However, the DSS2ACS can be used to extract relevant information for any company when using data with similar variables from any region of the world. Finally, it is important to reinforce the importance of multimodal technologies and using different types of sensors and GUIs. At the time of gathering the data for this study, optical character recognition was used to convert the inquiry presented to the tourist to the database, in addition to information gathered directly from the vehicle and GUI by the transfer company to insert complementary information. At present, the information from the tourist is being/can be acquired using a tablet and a chatbot, and the information extracted directly from the vehicle and the information inserted by the transfer company by a GUI is still “valid”, but all the above sources can/are being complemented by other sources (sensors), such as cameras, which can increase the inputs for a final decision (nevertheless, the use of cameras can present some limitations due to the General Data Protection Regulation). The same happens to the outputs of the DSS; initially (in this study), a dashboard and a report, at present is/can be complemented, for instance, with direct information to the driver by his/her smartwatch, allowing him/her to change behaviours, conversations, etc. The contributions of this work, which will lead to future research, are as follows: develop the concept of the image associated with the tourist service and to identify the dimensions that the tourist assesses it with; identify the elements that characterize each of these dimensions, such as in terms of human resources, and evaluate body image, language, clothing, friendliness, and knowledge of the region; develop a scale to assess the service image and then integrate it with sentiment analysis to develop an indicator of the service image provided, which will allow each organization to combine it with performance evaluations of its employees.
Our future work will also focus on the analysis of the two markets with the highest number of services performed: the United Kingdom and Ireland. They will then be compared with Portugal to carry out an analysis of international tourism and domestic tourism. We also aim to find if other dimensions of the service affect the experience, especially the characteristics of the human resources that provide the service (e.g., their qualifications).
In a DSS2ACS2.0 version, new methods will be integrated into the decision framework; for example, a deeper analysis of traveller comments, which can return even more information for the company or companies that use this decision-support system.
Author Contributions
Conceptualization, C.M.Q.R., P.J.S.C., H.C.L.F. and J.M.F.R.; methodology, C.M.Q.R. and P.J.S.C.; validation, C.M.Q.R., P.J.S.C. and J.M.F.R.; resources, H.C.L.F.; writing—original draft preparation, C.M.Q.R. and H.C.L.F.; writing—review and editing, P.J.S.C. and J.M.F.R. All authors have read and agreed to the published version of the manuscript.
Funding
This research was funded by Foundation for Science and Technology (FCT) through CinTurs—FCT Project UIDB/04020/2020 and LARSyS—FCT Project UIDB/50009/2020.
Institutional Review Board Statement
Not applicable.
Informed Consent Statement
Not applicable.
Data Availability Statement
The data presented in this study are available on request from the corresponding author. The data are not publicly available due to Yellowfish Transfers privacy policies restrictions.
Acknowledgments
The authors would like to thank Yellowfish Transfers (https://www.yellowfishtransfers.com/, accessed on 23 November 2022) and the investigation centres CinTurs and LARSyS.
Conflicts of Interest
The authors declare no conflict of interest.
References
- Xu, X.; Wang, X.; Li, Y.; Haghighi, M. Business intelligence in online customer textual reviews: Understanding consumer perceptions and influential factors. Int. J. Inf. Manag. 2017, 37, 673–683. [Google Scholar] [CrossRef]
- Altay, B.C.; Okumuş, A. User adoption of integrated mobility technologies: The case of multimodal trip-planning apps in Turkey. Res. Transp. Bus. Manag. 2022, 43, 100706. [Google Scholar] [CrossRef]
- Nyanga, C.; Pansiri, J.; Chatibura, D. Enhancing competitiveness in the tourism industry through the use of business intelligence: A literature review. J. Tour. Futures 2019, 6, 139–151. [Google Scholar] [CrossRef]
- van Lierop, D.; El-Geneidy, A. Enjoying loyalty: The relationship between service quality, customer satisfaction, and behavioral intentions in public transit. Res. Transp. Econ. 2016, 59, 50–59. [Google Scholar] [CrossRef]
- Moldabekova, A.; Philipp, R.; Reimers, H.E.; Alikozhayev, B. Digital technologies for improving logistics performance of countries. Transp. Telecommun. 2021, 22, 207–216. [Google Scholar] [CrossRef]
- Le, H.T.; Carrel, A.L.; Shah, H. Impacts of online shopping on travel demand: A systematic review. Transp. Rev. 2022, 42, 273–295. [Google Scholar] [CrossRef]
- Olmeda, I.; Sheldon, P.J. Data mining techniques and applications for tourism internet marketing. J. Travel Tour. Mark. 2002, 11, 1–20. [Google Scholar] [CrossRef]
- Sharma, M.P.; Sharma, N. Performance Impact of Changing ICT Environment: A Case Study of Indian Hospitality and Tourism Sector. In Proceedings of the International Conference on Smart Trends for Information Technology and Computer Communications, Jaipur, India, 6–7 August 2016; Springer: Singapore; pp. 119–127. [Google Scholar]
- Jin, S.V.; Phua, J. Making reservations online: The impact of consumer-written and system-aggregated user-generated content (UGC) in travel booking websites on consumers’ behavioral intentions. J. Travel Tour. Mark. 2016, 33, 101–117. [Google Scholar] [CrossRef]
- Fuchs, M.; Höpken, W.; Lexhagen, M. Business intelligence for destinations: Creating knowledge from social media. In Advances in Social Media for Travel, Tourism and Hospitality; Routledge: Abingdon, UK, 2017; pp. 290–310. [Google Scholar]
- Liang, T.P.; Liu, Y.H. Research landscape of business intelligence and big data analytics: A bibliometrics study. Expert Syst. Appl. 2018, 111, 2–10. [Google Scholar] [CrossRef]
- Santos, Z.R.; Cheung, C.M.; Coelho, P.S.; Rita, P. Consumer engagement in social media brand communities: A literature review. Int. J. Inf. Manag. 2022, 63, 102457. [Google Scholar] [CrossRef]
- Mariani, M.; Baggio, R.; Fuchs, M.; Höepken, W. Business intelligence and big data in hospitality and tourism: A systematic literature review. Int. J. Contemp. Hosp. Manag. 2018, 30, 3514–3554. [Google Scholar] [CrossRef]
- Gorter, C.; Nijkamp, P.; Vork, R. Analysis of travellers’ satisfaction with transport chains. Transp. Plan. Technol. 2000, 23, 237–258. [Google Scholar] [CrossRef]
- Bassi, F.; Guido, G. Measuring customer satisfaction: From product performance to consumption experience. J. Consum. Satisf. Dissatisfaction Complain. Behav. 2006, 19, 76–88. [Google Scholar]
- Guiver, J.; Lumsdon, L.; Weston, R.; Ferguson, M. Do buses help meet tourism objectives? The contribution and potential of scheduled buses in rural destination areas. Transp. Policy 2007, 14, 275–282. [Google Scholar] [CrossRef]
- Kim, Y.K.; Lee, H.R. Customer satisfaction using low cost carriers. Tour. Manag. 2011, 32, 235–243. [Google Scholar] [CrossRef]
- Garg, R.; Rahman, Z.; Qureshi, M.N.; Kumar, I. Identifying and ranking critical success factors of customer experience in banks: An analytic hierarchy process (AHP) approach. J. Model. Manag. 2012, 7, 201–220. [Google Scholar] [CrossRef]
- Pecorari, P.M.; Lima, C.R.C. Correlation of customer experience with the acceptance of product-service systems and circular economy. J. Clean. Prod. 2021, 281, 125275. [Google Scholar] [CrossRef]
- Khan, I.; Garg, R.J.; Rahman, Z. Customer service experience in hotel operations: An empirical analysis. Procedia Soc. Behav. Sci. 2015, 189, 266–274. [Google Scholar] [CrossRef]
- Klaus, P.P.; Maklan, S. Towards a better measure of customer experience. Int. J. Mark. Res. 2013, 55, 227–246. [Google Scholar] [CrossRef]
- Gitto, S.; Mancuso, P. Improving airport services using sentiment analysis of the websites. Tour. Manag. Perspect. 2017, 22, 132–136. [Google Scholar] [CrossRef]
- Mogaji, E.; Erkan, I. Insight into consumer experience on UK train transportation services. Travel Behav. Soc. 2019, 14, 21–33. [Google Scholar] [CrossRef]
- Park, E. The role of satisfaction on customer reuse to airline services: An application of Big Data approaches. J. Retail. Consum. Serv. 2019, 47, 370–374. [Google Scholar] [CrossRef]
- Park, E.; Jang, Y.; Kim, J.; Jeong, N.J.; Bae, K.; Del Pobil, A.P. Determinants of customer satisfaction with airline services: An analysis of customer feedback big data. J. Retail. Consum. Serv. 2019, 51, 186–190. [Google Scholar] [CrossRef]
- Thelwall, M. Sentiment Analysis for Tourism. In Big Data and Innovation in Tourism, Travel, and Hospitality; Sigala, M., Rahimi, R., Thelwall, M., Eds.; Springer: Singapore, 2019; pp. 87–104. [Google Scholar]
- Lee, M.; Lee, S.A.; Koh, Y. Multisensory experience for enhancing hotel guest experience: Empirical evidence from big data analytics. Int. J. Contemp. Hosp. Manag. 2019, 31, 4313–4337. [Google Scholar] [CrossRef]
- Cheng, L.C.; Chen, K.; Lee, M.C.; Li, K.M. User-Defined SWOT analysis–A change mining perspective on user-generated content. Inf. Process. Manag. 2021, 58, 102613. [Google Scholar] [CrossRef]
- Moro, S.; Esmerado, J.; Ramos, P.; Alturas, B. Evaluating a guest satisfaction model through data mining. Int. J. Contemp. Hosp. Manag. 2020, 32, 1523–1538. [Google Scholar] [CrossRef]
- Li, Q.; Li, S.; Zhang, S.; Hu, J.; Hu, J. A review of text corpus-based tourism big data mining. Appl. Sci. 2019, 9, 3300. [Google Scholar] [CrossRef]
- Khalilinezhad, S.; Fazlollahtabar, H.; Minaei-Bidgoli, B.; Eslami Nosratabadi, H. Detecting Valuable Customers Using the Trade Patterns of Financial Transactions Applying Integrated RFM and OLAP. Int. J. Ind. Eng. Prod. Res. 2021, 32, 1–15. [Google Scholar]
- Larson, D.; Chang, V. A review and future direction of agile, business intelligence, analytics and data science. Int. J. Inf. Manag. 2016, 36, 700–710. [Google Scholar] [CrossRef]
- Vinod, B. Artificial Intelligence in travel. J. Revenue Pricing Manag. 2021, 20, 368–375. [Google Scholar] [CrossRef]
- McGill, J.I.; van Ryzin, G.J. Foreword to the Focused Issue on Yield Management in Transportation. Transp. Sci. 1999, 33, 135. [Google Scholar]
- Morales, D.R.; Wang, J. Forecasting cancellation rates for services booking revenue management using data mining. Eur. J. Oper. Res. 2010, 202, 554–562. [Google Scholar] [CrossRef]
- Lawrence, R.D.; Hong, S.J.; Cherrier, J. Passenger-based predictive modeling of airline no-show rates. In Proceedings of the ninth ACM SIGKDD International Conference on Knowledge Discovery and Data Mining, Washington, DC, USA, 24–27 August 2003; pp. 397–406. [Google Scholar]
- Gorzałczany, M.B.; Rudziński, F.; Piekoszewski, J. Business Intelligence in Airline Passenger Satisfaction Study—A Fuzzy-Genetic Approach with Optimized Interpretability-Accuracy Trade-Off. Appl. Sci. 2021, 11, 5098. [Google Scholar] [CrossRef]
- Vlahogianni, E.I.; Karlaftis, M.G. Advanced computational approaches for predicting tourist arrivals: The case of charter air-travel. In Nonlinear Dynamics; Evans, T., Ed.; IntechOpen: London, UK, 2010; pp. 309–324. [Google Scholar]
- Chow, C.K.W. Customer satisfaction and service quality in the Chinese airline industry. J. Air Transp. Manag. 2014, 35, 102–107. [Google Scholar] [CrossRef]
- Fuchs, M.; Höpken, W.; Lexhagen, M. Big data analytics for knowledge generation in tourism destinations–A case from Sweden. J. Destin. Mark. Manag. 2014, 3, 198–209. [Google Scholar] [CrossRef]
- Kim, K.; Park, O.J.; Yun, S.; Yun, H. What makes tourists feel negatively about tourism destinations? Application of hybrid text mining methodology to smart destination management. Technol. Forecast. Soc. Change 2017, 123, 362–369. [Google Scholar] [CrossRef]
- Sari, E.Y.; Wierfi, A.D.; Setyanto, A. Sentiment Analysis of Customer Satisfaction on Transportation Network Company Using Naive Bayes Classifier. In Proceedings of the 2019 International Conference on Computer Engineering, Network, and Intelligent Multimedia (CENIM), Surabaya, Indonesia, 19–20 November 2019; pp. 1–6. [Google Scholar]
- Hou, Z.; Cui, F.; Meng, Y.; Lian, T.; Yu, C. Opinion mining from online travel reviews: A comparative analysis of Chinese major OTAs using semantic association analysis. Tour. Manag. 2019, 74, 276–289. [Google Scholar] [CrossRef]
- Höpken, W.; Eberle, T.; Fuchs, M.; Lexhagen, M. Improving tourist arrival prediction: A big data and artificial neural network approach. J. Travel Res. 2021, 60, 998–1017. [Google Scholar] [CrossRef]
- Gallego, I.; Font, X. Changes in air passenger demand as a result of the COVID-19 crisis: Using Big Data to inform tourism policy. J. Sustain. Tour. 2021, 29, 1470–1489. [Google Scholar] [CrossRef]
- Amadeus. Defining the Future of Travel through Intelligence; Amadeus IT Group: Madrid, Spain, 2017. [Google Scholar]
- Foster, D. Measuring customer satisfaction in the tourism industry. Qual. Mag. 1999, 8, 23–29. [Google Scholar]
- Volo, S. The experience of emotion: Directions for tourism design. Ann. Tour. Res. 2021, 86, 103097. [Google Scholar] [CrossRef]
- Godovykh, M.; Tasci, A. Customer Experience in Tourism. In Encyclopedia of Tourism Management and Marketing; Edward Elgar Publishing: Cheltenham, UK, 2022; pp. 1–3. [Google Scholar]
- Di Tria, F.; Lefons, E.; Tangorra, F. A Proposal of Methodology for Designing Big Data Warehouses. Preprints 2018, 2018, 2018060219. [Google Scholar]
- Ramos, C.M.Q.; Casado-Molina, A.M.; Ignácio-Peláez, J. An Innovative Management Perspective for Organizations through a Reputation Intelligence Management Model. Int. J. Inf. Syst. Serv. Sect. (IJISSS) 2019, 11, 1–20. [Google Scholar] [CrossRef]
- Ramos, C.M.; Casado-Molina, A.M. Online corporate reputation: A panel data approach and a reputation index proposal applied to the banking sector. J. Bus. Res. 2021, 122, 121–130. [Google Scholar] [CrossRef]
- Erevelles, S.; Fukawa, N.; Swayne, L. Big Data consumer analytics and the transformation of marketing. J. Bus. Res. 2016, 69, 897–904. [Google Scholar] [CrossRef]
- Ayyadevara, V.K. Pro Machine Learning Algorithms; Apress: Berkeley, CA, USA, 2018. [Google Scholar]
- Santos, M.; Azevedo, C. Data Mining; FCA Editora: Lisboa, Portugal, 2005. [Google Scholar]
- Powell, B. Mastering Microsoft Power BI: Expert Techniques for Effective Data Analytics and Business Intelligence; Packt Publishing Ltd.: Birmingham, UK, 2018. [Google Scholar]
- Orange. Orange: Data Mining Fruitful and Fun. 2021. Available online: https://orangedatamining.com/ (accessed on 30 December 2021).
- Hutto, C.; Gilbert, E. Vader: A parsimonious rule-based model for sentiment analysis of social media text. In Proceedings of the International AAAI Conference on Web and Social Media, Ann Arbor, MI, USA, 1–4 June 2014; Volume 8, pp. 216–225. [Google Scholar]
- Buhalis, D.; Volchek, K. Bridging marketing theory and big data analytics: The taxonomy of marketing attribution. Int. J. Inf. Manag. 2021, 56, 102253. [Google Scholar] [CrossRef]
- Senyo, P.K.; Liu, K.; Effah, J. Digital business ecosystem: Literature review and a framework for future research. Int. J. Inf. Manag. 2019, 47, 52–64. [Google Scholar] [CrossRef]
- Alexandru, M.; Dragoș, C.; Bălă-Constantin, Z. Digital Twin for automated guided vehicles fleet management. Procedia Comput. Sci. 2022, 199, 1363–1369. [Google Scholar] [CrossRef]
Disclaimer/Publisher’s Note: The statements, opinions and data contained in all publications are solely those of the individual author(s) and contributor(s) and not of MDPI and/or the editor(s). MDPI and/or the editor(s) disclaim responsibility for any injury to people or property resulting from any ideas, methods, instructions or products referred to in the content. |
© 2022 by the authors. Licensee MDPI, Basel, Switzerland. This article is an open access article distributed under the terms and conditions of the Creative Commons Attribution (CC BY) license (https://creativecommons.org/licenses/by/4.0/).