Article

UUX Evaluation of a Digitally Advanced Human–Machine Interface for Excavators

1
Industrial Design Engineering, Technische Universität Dresden, 01069 Dresden, Germany
2
Engineering Psychology and Applied Cognitive Research, Technische Universität Dresden, 01069 Dresden, Germany
3
Independent Researcher, Görlitzer Straße 42, 01099 Dresden, Germany
*
Author to whom correspondence should be addressed.
Multimodal Technol. Interact. 2020, 4(3), 57; https://doi.org/10.3390/mti4030057
Submission received: 15 April 2020 / Revised: 15 July 2020 / Accepted: 29 July 2020 / Published: 20 August 2020
(This article belongs to the Special Issue Understanding UX through Implicit and Explicit Feedback)

Abstract

:
With the evaluation of a next-generation human–machine interface (HMI) concept for excavators, this study aims to discuss the HMI quality measurement based on usability and user experience (UUX) metrics. Regarding the digital transformation of construction sites, future work environments will have to be capable of presenting various complex visual data and enabling efficient and safe interactivity while working. The evaluated HMI focused on introducing a touch display-based interface, providing advanced operation functions and different interaction modalities. The assessment of UUX should show whether the novel HMI can be utilised to perform typical tasks (usability) and how it is accepted and assessed in terms of non-instrumental qualities (user experience, UX). Using the collected data, this article also aims to contribute to the general discussion about the role of UX beyond usability in industrial applications and deepen the understanding of non-instrumental qualities when it comes to user-oriented process and machine design. The exploratory study examines insights into the application of elaborated UUX measuring tools like the User Experience Questionnaire (UEQ) on the interaction with industrial goods accompanied by their rating with other tools, namely System Usability Scale (SUS), Intuitive Interaction Questionnaire (INTUI) and the National Aeronautics and Space Administration (NASA) Task Load Index (NASA-TLX). Four goals are pursued in this study. The first goal is to compare in-depth two different ways of interaction with the novel HMI—namely one by a control pad on the right joystick and one by touch. Therefore, a sample of 17 subjects in total was split into two groups and differences in UUX measures were tested. Secondly, the performances of both groups were tested over the course of trials to investigate possible differences in detail. The third goal is to interpret measures of usability and user experience against existing benchmark values. Fourth and finally, we use the data gathered to analyse correlations between measures of UUX. The results of our study show that the different ways of interaction did not impact any of the measures taken. In terms of detailed performance analysis, both groups yielded differences in terms of time per action, but not between the groups. The comparison of UUX measures with benchmark values yielded mixed results. The UUX measures show some relevant significant correlations. The participants mostly reported enjoying the use of the HMI concept, but several practical issues (e.g., efficiency) still need to be overcome. Once again, the study confirms the urge of user inclusion in product development. Especially in the course of digitalisation, as big scale advancements of systems and user interfaces bring uncertainty for many manufacturers regarding whether or how a feature should be integrated.

1. Introduction

1.1. Challenges on the Digital Construction Site

Established concepts of machine operation are challenged by the increasing digital penetration of modern systems which is accompanied by increased complexity of production processes and the connection of several machines and information systems. New assistive technologies will be available for the operators of modern construction machinery, aiming for a continuous increase in production efficiency and operation safety. This will change the way machines are operated [1]. Among others, Gorecky and colleagues describe the impact on future human–machine interaction in digitalised and automated applications by a rising range of functionalities and information which will result in increased human–machine interface (HMI) complexity. New adaptive and assistive functions of HMIs will be introduced in order to enable the operators to manage this information and to reduce operating complexity [2].
Excavators are considered among the most complex and sophisticated machines on the construction sites, and therefore can potentially benefit highly from information technologies [3]. Their conventional operation is primarily based on the use of joysticks and other physical control elements like levers and switches. These require a high degree of coordination and spatial imagination, making it also one of the most psychologically demanding machine operations on a construction site [4]. The operation of a conventional excavator, therefore, is not very intuitive and the operators need years to master it [4,5]. However, current HMIs in excavators also lack possibilities for the proper implementation of new digital functionalities, as they overlook interactive elements, capable of presenting various complex visual data and efficient and safe interactivity while working.

1.2. Chances and Challenges of Novel Concepts of Machine Operation

There is high potential in using display-based interfaces, although these often come at the cost of usability and the need for relearning certain aspects of machine operation [6,7,8]. Other production branches like agriculture or logistics that went further in terms of digital transformation already use display-based interfaces on a large scale. These offer visual and interactive access to complex information and allow adaptive content.
Current display-based interfaces are often accompanied by layout and interaction optimisations for touch control, aiming for natural and gesture-based interaction. While this direct manipulation of objects eases the interaction, there are critical aspects of machine operation. For example, most of the current displays are missing adequate haptic feedback and the interaction reliability becomes weak when vibrations occur. Physical operating elements, such as levers or joysticks in excavators, are optimised to enable precise and blind operation, even in harsh conditions. Eventually, operation safety as well as a smooth and predictable operation are key factors in this field, which makes high system usability a central quality aspect. Statements of operators revealed, that interventions, which potentially endanger these objectives, tend to be rejected. This is also because the novel, more complex features, such as virtual walls (a kind of workspace limitation) or quick coupler functions are currently implemented in rather complicated ways.
Introducing a display-based interface to the operators will also mean a major change due to new content and the unavoidable break with familiar operating procedures and interfaces. Unknown interaction schemes as well as poorly transitioned operating workflows can lead to interaction errors. In particular, catching errors or mode errors can occur when a new device offers complex interaction and fails in addressing existing interaction paradigms or experiences in the right way [9].
Also, uncertainty due to too many new or unknown operation functions can lead to unintended interactions. We argue that all issues mentioned above will impact on the efficiency and effectiveness of the system as well as user satisfaction and therefore consider usability as a key performance and quality indicator.
Introducing the mentioned intelligent functionalities might also lead to socio-technical questions such as those relating to the psychological need for autonomy and decision-making powers [2], since it harbours the risk of non-transparency and loss of deeper process understanding. The shift of work profiles from direct machine control to activities that are increasingly characterised by assisted manoeuvring and process monitoring requires relearning and adaption on the machine operators’ side. Therefore, we are also interested in whether the user experience is addressed positively or not.

1.3. Subject of Research

In this context, a display-based HMI concept for excavators has been developed, to investigate the potential of adaptive graphical interfaces in the joystick-centred working space of an excavator. It provides access to several advanced assistive features and redundantly combines touch interaction and physical operation elements to increase operation safety during operation. This development marks a first step in advancing conventional operation environments in these vehicles. To evaluate the potential of the system in an early stage of development, it was set up as an interactive prototype and tested regarding its usability and user experience (UUX).

2. Related Work

There is research around the topic of operation quality in excavators, which still seems to be rather scattered. Chacko et al. provide a recent overview of technological trends for excavators. Referring to Sakaida et al. as well as Werfel et al. they point out the role of automation to ease work in hazardous environments and its role in the shift of work tasks towards high-level tasks such as planning and ensuring optimal operating parameters [1,10,11]. They also refer to the role of human operators and giving insights into the complexity of their tasks. Akyeampong et al. presented a HMI concept for excavators using different types of head-up displays (HUD) and also measured the operators’ workload using the National Aeronautics and Space Administration Task Load Index (NASA-TLX) [12]. Although there was no comparison with traditional operation environments, they found differences in workload regarding the HUD configurations. They also stressed the need for testing new HMI concepts with real operators, in the early stages of development. Sitompul and Wallmyr reported about the impact of digitalisation on heavy machinery and its operation as a reasoning for the introduction of augmented reality visualisations to reduce the stress level of the operators while increasing environmental awareness [13]. They emphasize that the human–machine operation will become a designed interaction, meaning that it has to regard the users’ needs and capabilities instead of resulting from the technological principles of the machines. Their work also focused on negative effects regarding divided attention, information overload, and operator’s stress and their implied negative effects on usability.

2.1. Usability and User Experience (UUX)

Usability is a widely accepted quality of interactive systems and is examined for example in DIN EN ISO 9241–11 1998 [14], a standard developed under the direction of the German Committee of Standards considering usability in the context of Ergonomic requirements for office activities with display screen. It considers efficiency, effectivity and user satisfaction [15] and its central role for work applications has been underpinned by many studies [16,17].
User experience design (UXD) as a holistic approach to create valuable products aims at complementing instrumental qualities (directly task-related, covered by usability) with non-instrumental qualities of human–technology interaction [5,18]. While traditional approaches to human-centred design consider the what and how, i.e., function, safety and ergonomics, UXD also considers the why, pleasure and joy or personal significance [19,20,21]. It is state of the art in software development and is also gaining momentum in consumer product development. Accordingly, approaches, theories and methods of UXD focus on software interfaces and/or consumer products and services, while a transfer to the development of industrial goods, industrial vehicles or cyber-physical production systems is a more recent phenomenon. Corresponding research is just in its beginning, delivering initial findings on how user experience is special with industrial goods [22], in work contexts [23] or other multi-stakeholder domains. There are some efforts to integrate established UXD approaches and models for cyber-physical systems in professional domains [24]. In contrast to consumer markets, the task plays a different role and various stakeholders need to be considered. However, such models of UX in professional domains are either not comprehensive or not yet underpinned with broad empirical research.
However, user experience is not just a holistic construct, where instrumental and non-instrumental qualities influence each other [25]. Good (positive) user experience has the potential to increase motivation, concentration and resilience, and the general quality of work, which in turn can reduce employee leave and sickness rates [26]. Both are becoming crucial to counter the looming shortage of skilled workers. It is also fair to assume that the addressed persons experience well-designed applications in their off-work time, like web services or consumer products, and transfer these expectations into their work environments, especially when these become more and more digital and also use display-based graphical interfaces. This can be observed for example when personal smartphones are used in professional contexts for functionalities that are basically provided by the professional equipment but usability or user experience are too poor for acceptance or convenience.

2.2. UUX Measurement

Performance measures provide interesting measures of usability. In order to assess usability and user experience, established instruments were employed. NASA-TLX is a tool to measure the perceived workload of a task in various human–machine environments [27]. It is divided into mental demand, physical demand, temporal demand, user performance and effort as well as frustration.
There are some widely recognized, standardised questionnaires for the evaluation that are in line with the understanding of UUX described above. Some of these questionnaires cannot be applied to first-time use or cannot be applied in professional domains. Accordingly, despite their conceptual and methodical fit, questionnaires such as meCUE [28] or AttrakDiff [29] could not be applied. Among the established questionnaires, the System Usability Scale (SUS) and the User Experience Questionnaire (UEQ) have been chosen to evaluate UUX of the novel HMI. The SUS allows not only for measuring and comparing relevant dimensions of usability, but also provides general benchmarking [30]. It is a standardised questionnaire to establish the individual’s perceived usability of a user interface. The final score can range between 0 and 100, with higher scores indicating more usable products. The Intuitive Interaction Questionnaire (INTUI) is utilised to evaluate the cognitive ergonomics of the HMI, which is an intersection of instrumental and non-instrumental qualities [31]. It was developed to detect components of intuitive interaction with a system, namely intuitiveness, effortlessness, gut feeling, magical experience and verbalisability.
The UEQ has been developed for the evaluation of user experience of interfaces in professional domains and can be easily transferred to physical and cyber-physical products [32,33]. It is employed to evaluate the non-instrumental qualities of the HMI. It also allows not only for quantitative analysis of the evaluation but also for further assessment against benchmarks. Within the UEQ, user experience is evaluated on six scales, i.e., attractiveness, perspicuity, efficiency, dependability, stimulation and novelty. These aspects can be grouped into the three factors: Pragmatic quality (perspicuity, efficiency, and dependability) referring to task-orientated (i.e., instrumental) quality, and hedonic quality (stimulation and novelty) and attractiveness, the latter two being considered essential non-instrumental qualities.

3. Aims of the Study

The overall aim of the study is the evaluation of the HMI quality in general based on UUX metrics. The assessment of UUX should show whether the HMI based on a novel excavator operation approach can be utilised to perform typical tasks (usability) and how it is accepted and assessed in terms of non-instrumental qualities (user experience).
The following four goals are pursued:
  • The first goal is an in-depth comparison of two different ways of using the novel HMI. Therefore, the sample will be split into two groups and differences in UUX measures will be tested.
  • Secondly, the performances of both groups will be tested over the course of trials to investigate possible differences in detail.
  • The third goal is to interpret measures of UUX against existing benchmark values.
  • Fourth and finally, we will use the gathered data to analyse correlations between measures of UUX.

4. Methods

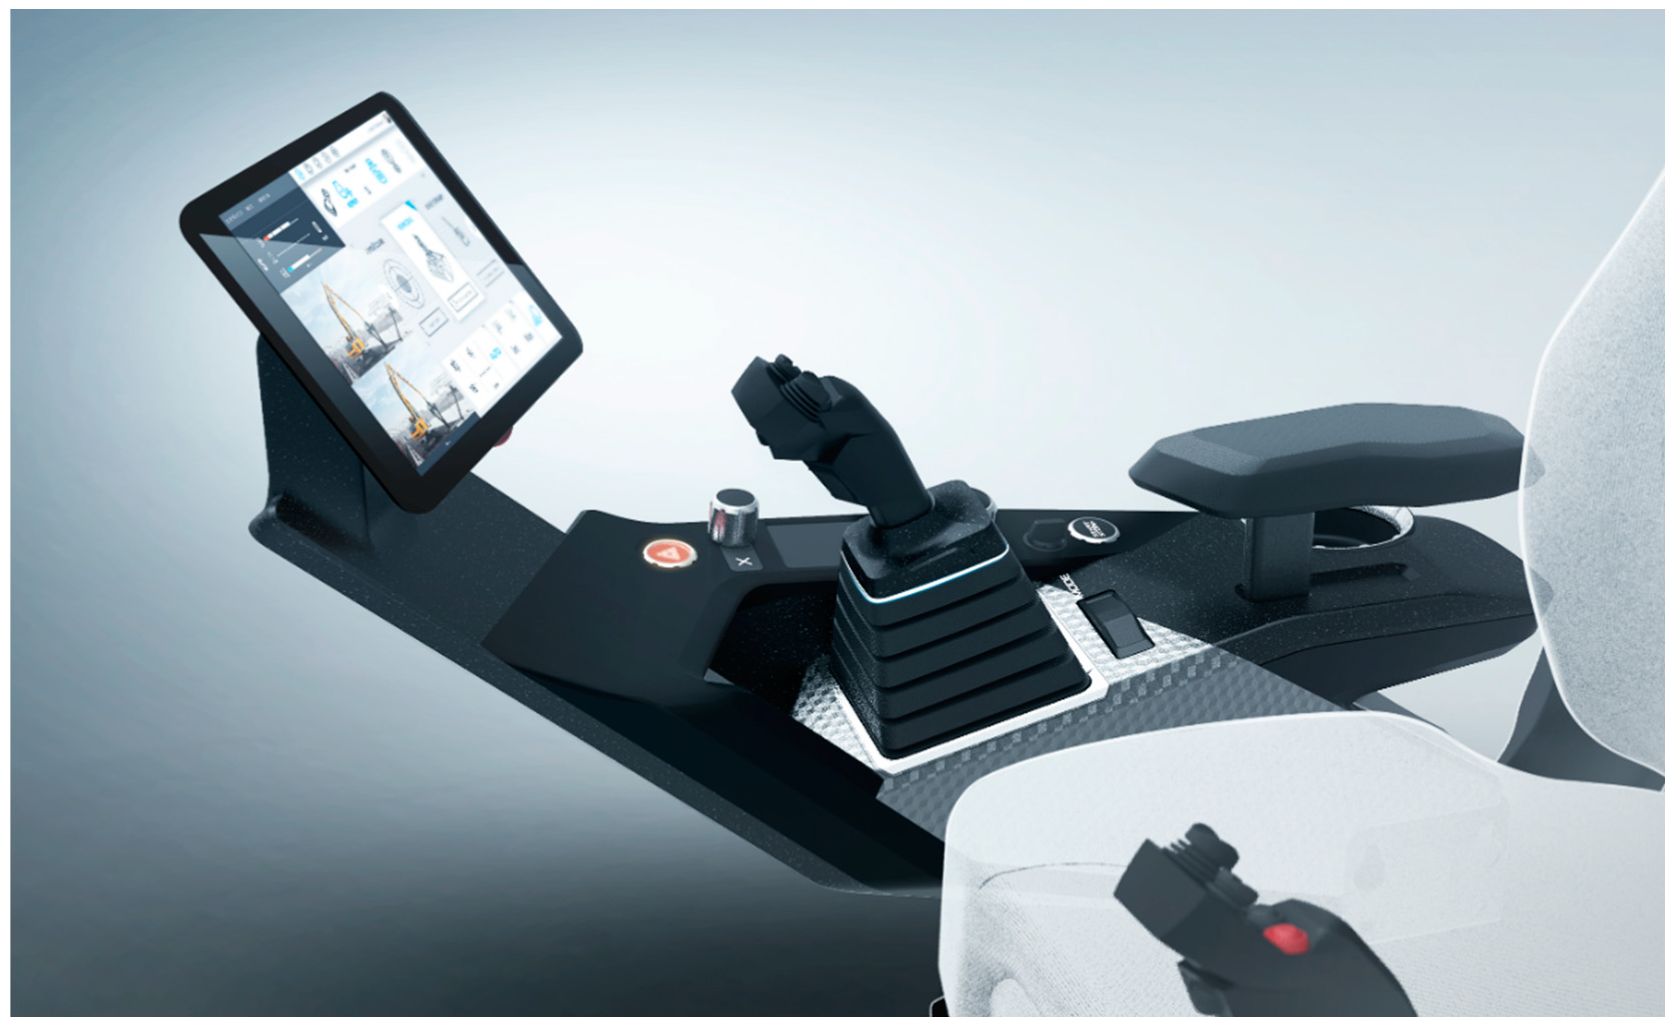
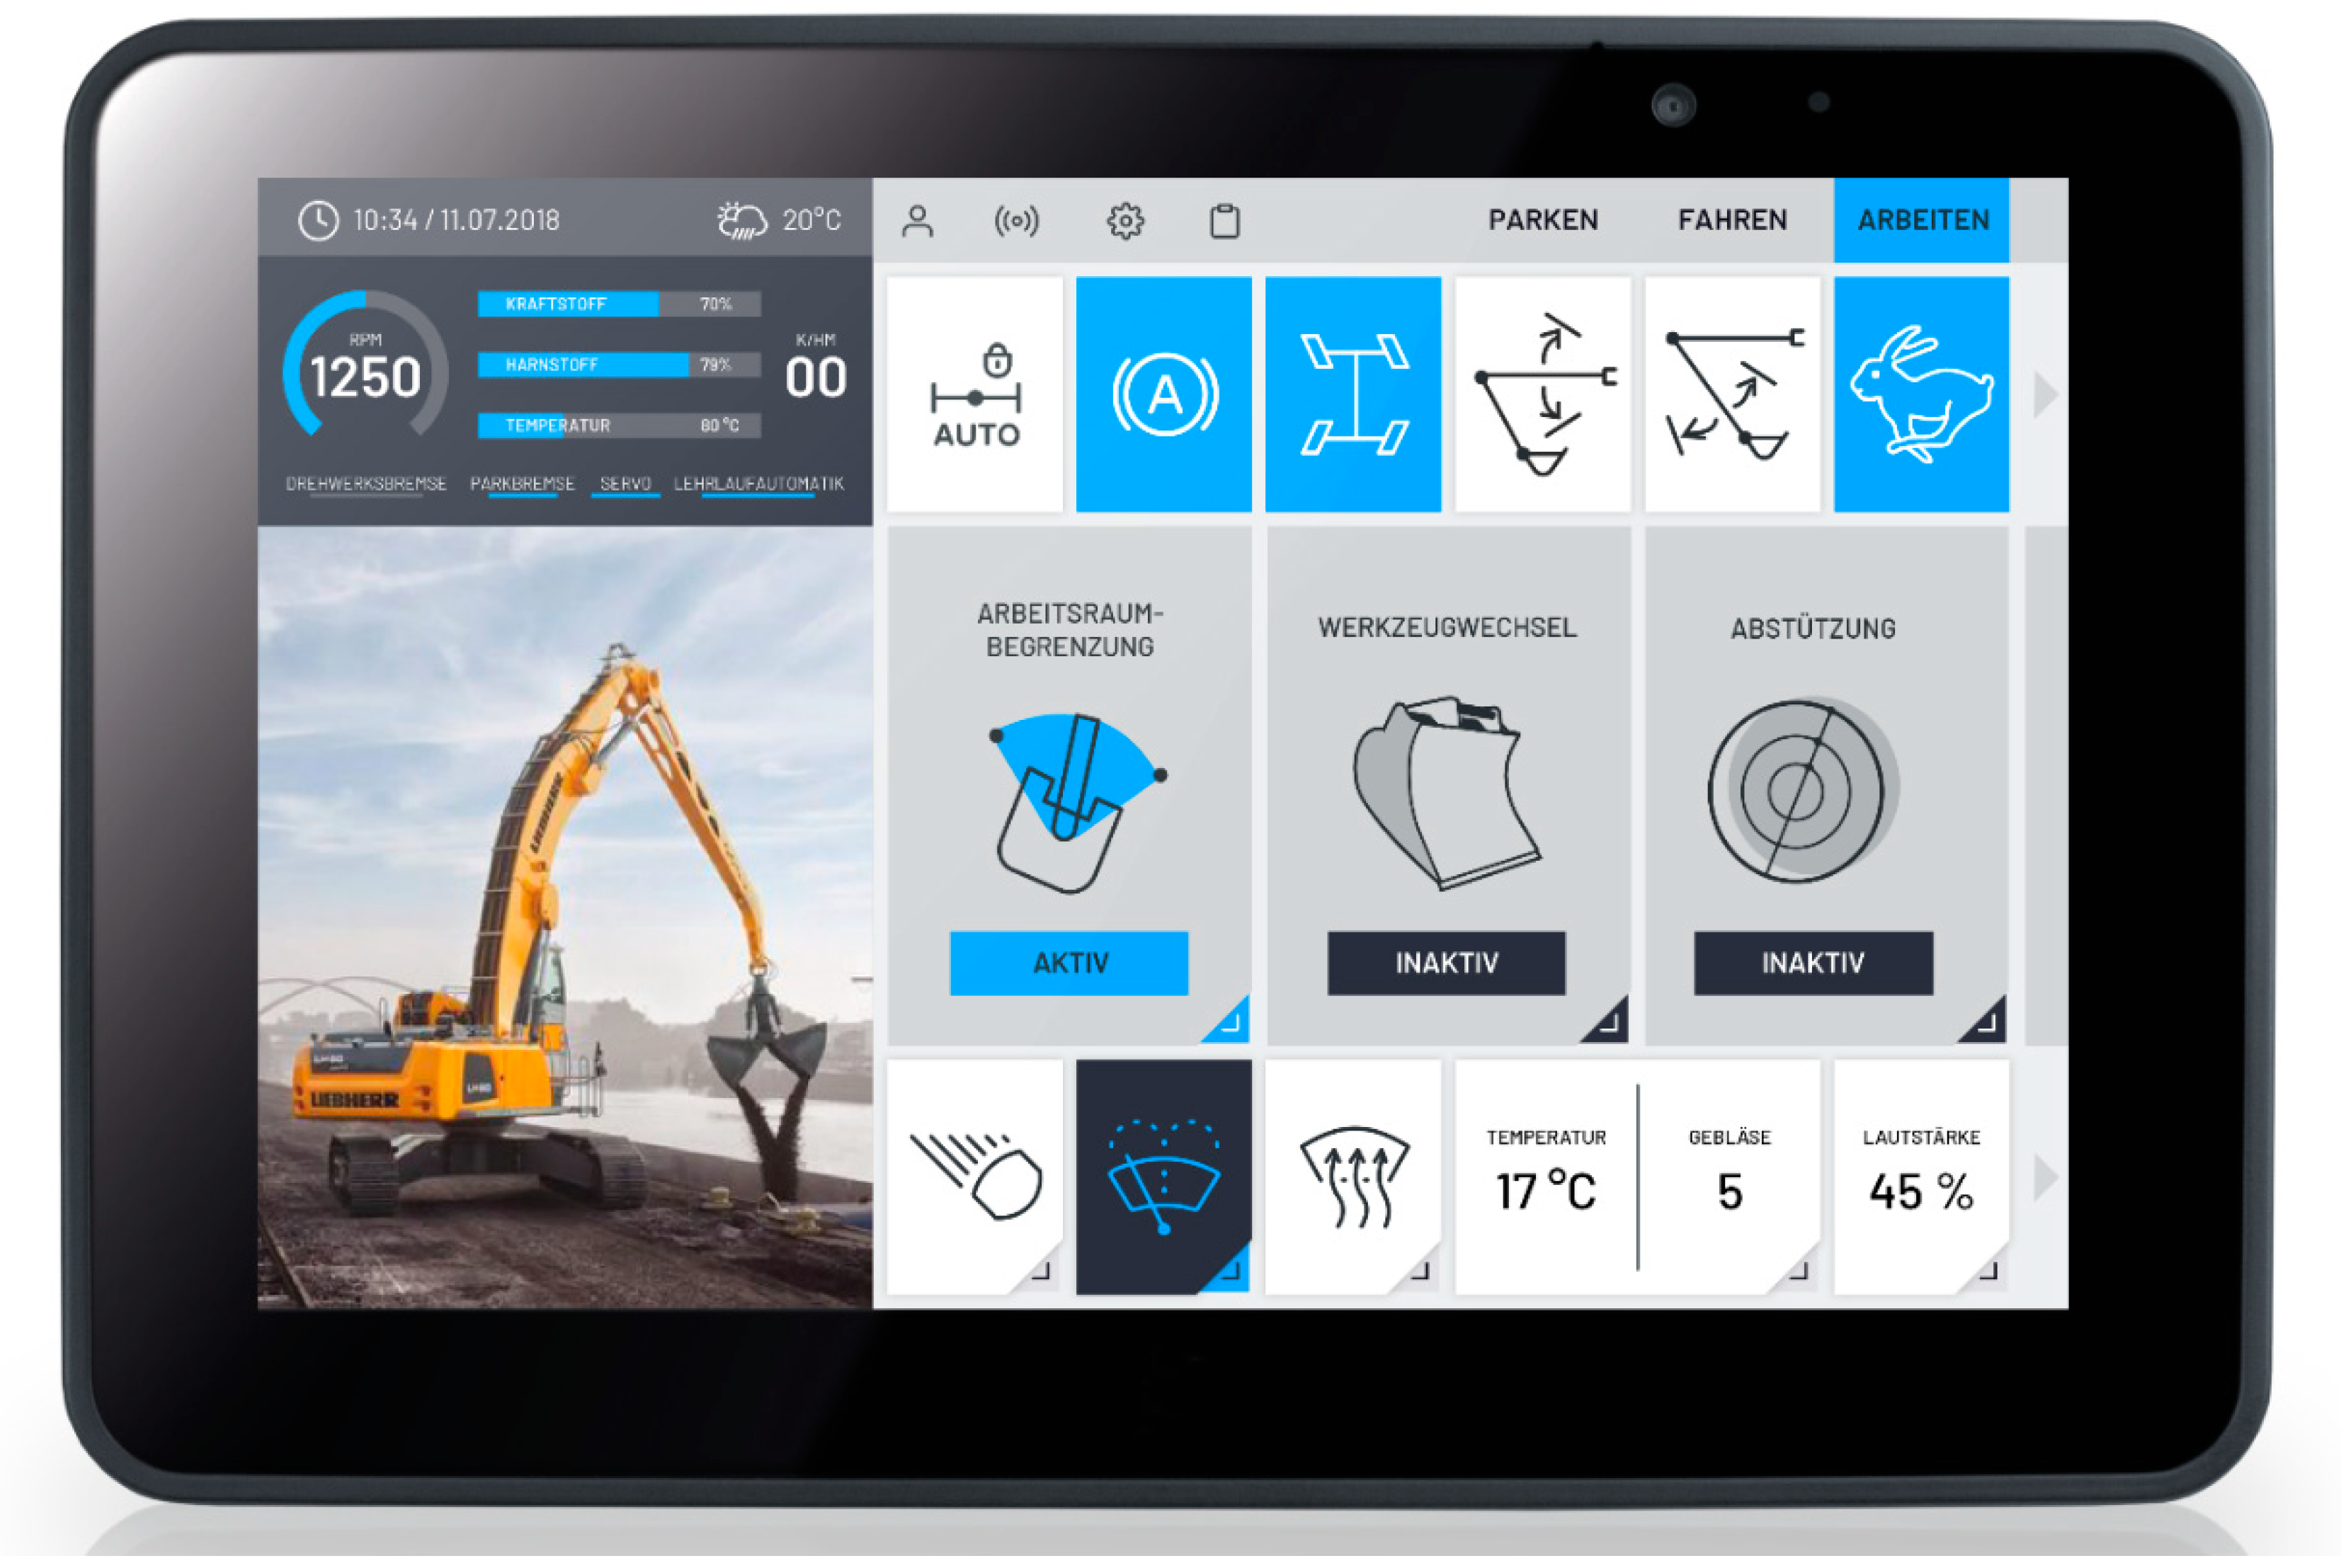
4.1. A Novel Human–Machine Interface (HMI) Concept for Excavator Operation

As shown in Figure 1, the HMI concept comprises a 10” touch screen, attached to the right control console easily within reach. The joysticks are in the same position as operators are used to. Most of the modular physical switches, which can be found in conventional excavator cabins are gone and are replaced by digital buttons on the display interface. Physical control elements, crucial for the systems operating safety, such as the parking brake or engine control remained.
The touch display interface provides different user profiles and work modes. This allows for smaller numbers of functionalities assigned to different task profiles. All modes use the same layout principles and a distinct placement for information and control functionalities. The touch display interface almost entirely replaces the numerous buttons found on today’s excavator armrests. To further reduce complexity, most machine functions are accessible via quick-access areas, which are customisable to adapt the interface to individual operating requirements and tasks. More complex functionalities, such as tool coupling and tool management assistants or semi-automated load cycle assistants, are represented in widgets. The widgets guide the operator step-by-step through setup processes and combine different operations, to facilitate and speed up the operation. Figure 2 shows the interface in “Work” mode.
Vibrations are among the critical interferences when operating an excavator. Accordingly, touch operation might not guarantee good usability in specific situations. Despite the advancing technologies around touch interaction [7,8] the HMI concept, therefore, offers several operation modalities to the operator. In addition to touch inputs, the operator can use a control pad on the joystick to interact with the display interface. While touch inputs offer the advantage of swift action and allow free navigation through buttons, sliders and subpages, inputs from physical controls ensure greater operating safety and precision but demand clear paths. Since the operating paradigms differ between these two modalities, the interface architecture considers both. Also, navigation distance or steps as well as the risk of getting lost due to difficulties detecting the position of the cursor have to be taken into account. The HMI provides a flat interface architecture of only one subpage layer and shortened operating paths. Enabling operators to perform at the same level using the control pad compared to using touch interaction is of central interest here. As this HMI concept introduces several new approaches (complex display interface, new interaction modalities, less physical switches, adaptive content), there is only little knowledge from previous products. To reduce uncertainty regarding the fit to expectations and operation paradigms of the users, we follow the recommendations of a user testing starting early in the development [34].
This is also of interest since a smooth and successful implementation of such a system requires a positive evaluation from the actual operators.
Therefore, this study aims to gain insights regarding the perceived UUX of the developed operation concept in an early stage of development. Our investigation considers the measurement of UUX within the two major and new interaction modalities, namely touch and control pad interaction. As described above, we consider the systems perceived UUX as useful indicators whether or not the introduced HMI solution fits the needs and expectations of the operators as well as the demands of the work application.
For measuring UUX of the HMI concept, we deployed a hybrid seat box setup, shown in Figure 3. It maps the display interface as well as both operating modalities fully functional, provides real-time interaction and feedback and a look and feel very close to serial products. According to the approach of Fiorineschi and Rotini [35], the fidelity of this setup is rated as high, considering the eight dimensions, data, form/visualisation, functionality, interactivity, prototyping technique, material and performance being rated ‘high’, and the dimension environment being rated ‘mixed’. The fidelity of both interaction modalities can also be equally rated as high since industrial standard components were used and the presented quality of behaviour matches this as well. The display interface allows free navigation and interaction and shows accurate and dynamic machine data. Executed commands affect a visual virtual reality (VR) simulation of the machine and a basic environment accurately. This enables basic tasks and environmental influences (light, orientation in space) and provides the necessary vehicle feedback. Still, the investigated prototype of the HMI concept is an experimental setup. For safety reasons, it is not installed in a real excavator.

4.2. Sample

In total, 17 male subjects participated in the experiment (mean age 18.71 years, standard deviation (SD) = 2.02). The study was implemented with young trainees, i.e., digital natives with supposedly little to no prejudice against the use of all kinds of interaction forms. Additionally, they have the advantage of relatively little experience with operating an excavator in traditional ways.
At the time of the data collection, all participants were in the second year of vocational training for qualified civil engineering workers. Two experimental groups were established in a random order fashion: nine subjects comprised experimental group 1 (henceforth control pad group), who were to solve all tasks in the simulator using a control pad. Group 2 (henceforth touch group) was instructed to solve the tasks using solely the touch display of the device. Participants were unaware of the purpose of the study. Written informed consent was obtained prior to the study. Subjects were compensated for participation with €7. The experimental procedure was approved by the responsible ethics committee of the Technische Universität Dresden, Germany (EK 394082019, 8 August 2019).

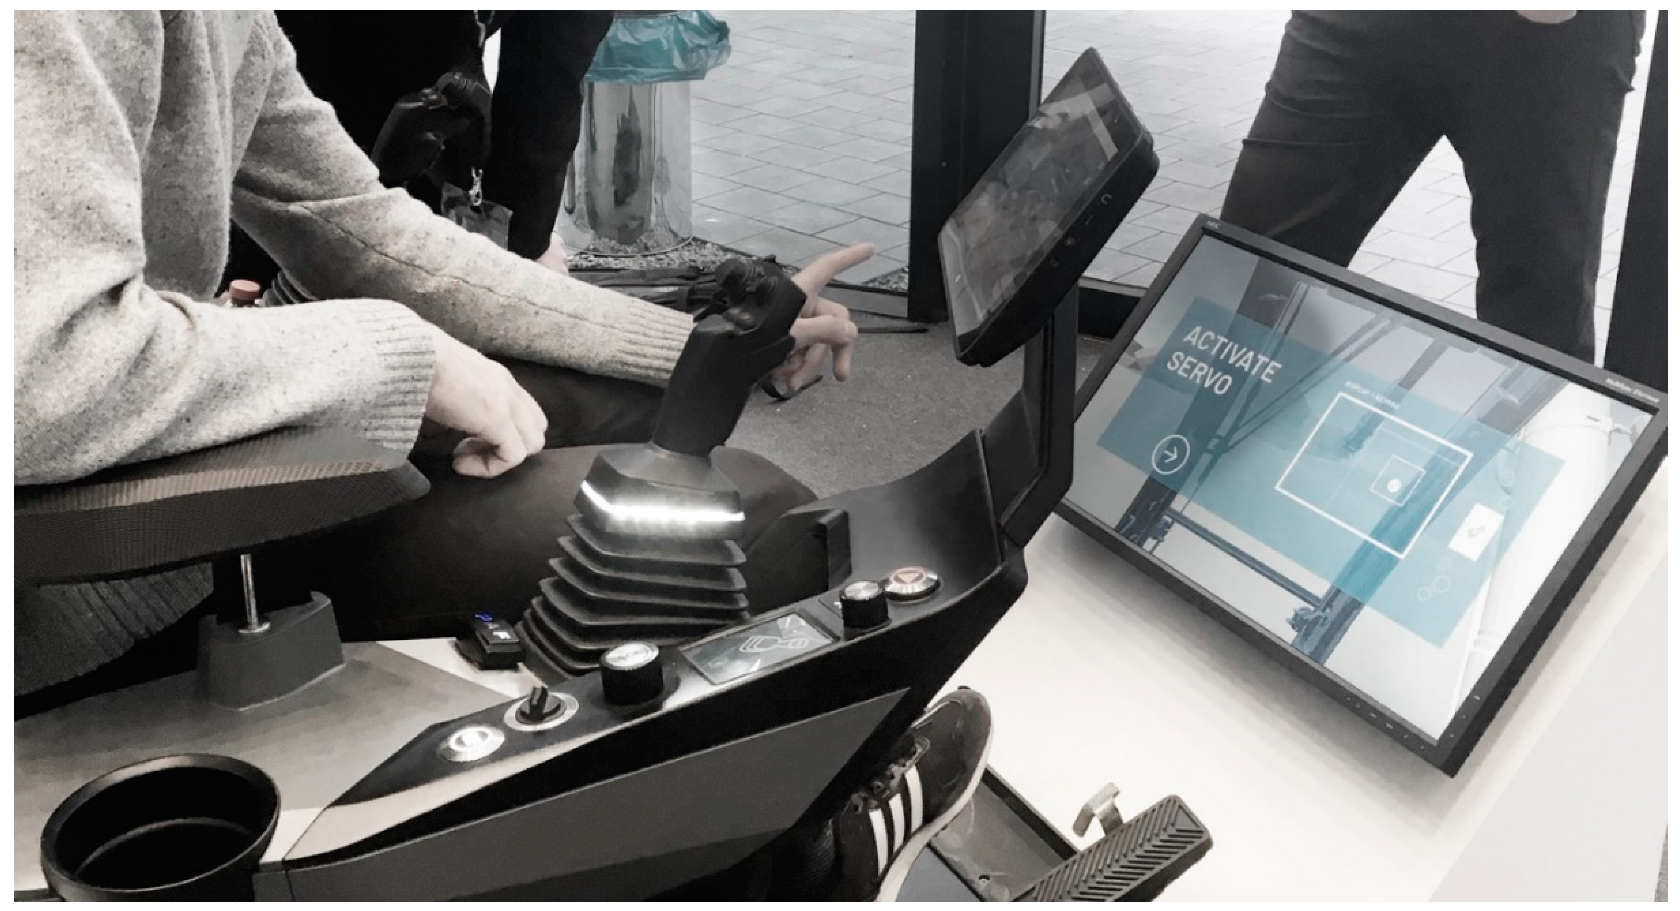
4.3. Experimental Setup

Subjects were tested in a mock-up virtual environment mimicking the cockpit of an excavator equipped with the novel HMI. A joystick control unit and a touch display were integrated into the right arm-rest. The setup provides a fully functional VR test scenario, simulating machine data and providing a visual environment including the visible parts of the excavator itself. The work environment was presented on a 50” TV set with 4K resolution set to 1920 × 1200 pixels, placed in a distance of approximately 180 centimetres from the eyes of the subjects (compare Figure 3).
The subjects completed a short tutorial, showing them where to find certain functionalities e.g., light and climate control, the different operating modes, and how to deal with the widgets. Then they had to activate certain functions to follow the instructions given within the VR. Finally, their task in the experiment consisted of repetitions of picking up a tool from different positions within the virtual environment.

4.4. Procedure

Subjects were tested individually, with only the experimenter being present in the room. After arrival in the experimental setup, subjects were informed about the aims of the study, gave their written consent and then filled in a demographic questionnaire, including the Affinity for Technology interaction questionnaire (ATI). The subject was then seated in the mock-up virtual environment and went through a training session in order to gain a minimum proficiency in handling the interface. After successful completion, subjects were instructed for the tool picking task. Eight subjects were randomly assigned to the control pad group, and the other nine to the touch display group. Every trial consisted of different subtasks: find the tool (a standard bucket was used) in the environment, rotate the cabin to point straight at the tool, align the boom close to the tool, and finally to pick it up by selecting the respective command in the interface. The positions of the tool in the environment were far left, left, right, centrally behind, far right. This order of tasks was presented twice, resulting in 10 trials. The order of positions was fixed, and the same for all participants. After completion of the 10 trials, subjects filled out NASA-TLX (without weighting of the subscales), SUS, UEQ, and INTUI, respectively.

4.5. Data Analysis

All data were analysed using SPSS version 25 with the exception of the benchmark analysis for the UEQ, which was performed using the Excel tool provided on the UEQ website (ueq-online.org).
Analyses aimed at answering the research questions formulated above by (1) comparing the two groups in all measures, (2) checking performance for both groups over the course of ten trials, (3) benchmarking UUX of the tested HMI against the evaluation of other products and (4) correlating measures of UUX.
Group comparisons were conducted using either Student’s t-tests for independent samples or a 10 (task number) by 2 (group) mixed analysis of variance (ANOVA). Corrections for violations of preconditions were reported where appropriate. For the correlations, preliminary analysis revealed outliers in the relationships. Therefore, due to its relative resistance to outliers [36], Spearman’s rank-order coefficient was used in the calculations.

5. Results

5.1. Group Differences

Data obtained in the experiment comprise three interest clusters: (1) demographic measures, (2) usability measured objectively in performance (time for task completion, the required number of actions, time per action), and subjectively by means of load assessment (NASA-TLX) and the System Usability Scale questionnaire (SUS), and (3) the user experience evaluation it was based on with UEQ and INTUI, respectively. Table 1 presents the t-test based group comparisons in all three clusters. None of the tests yielded significant differences between the control pad and the touch display condition.

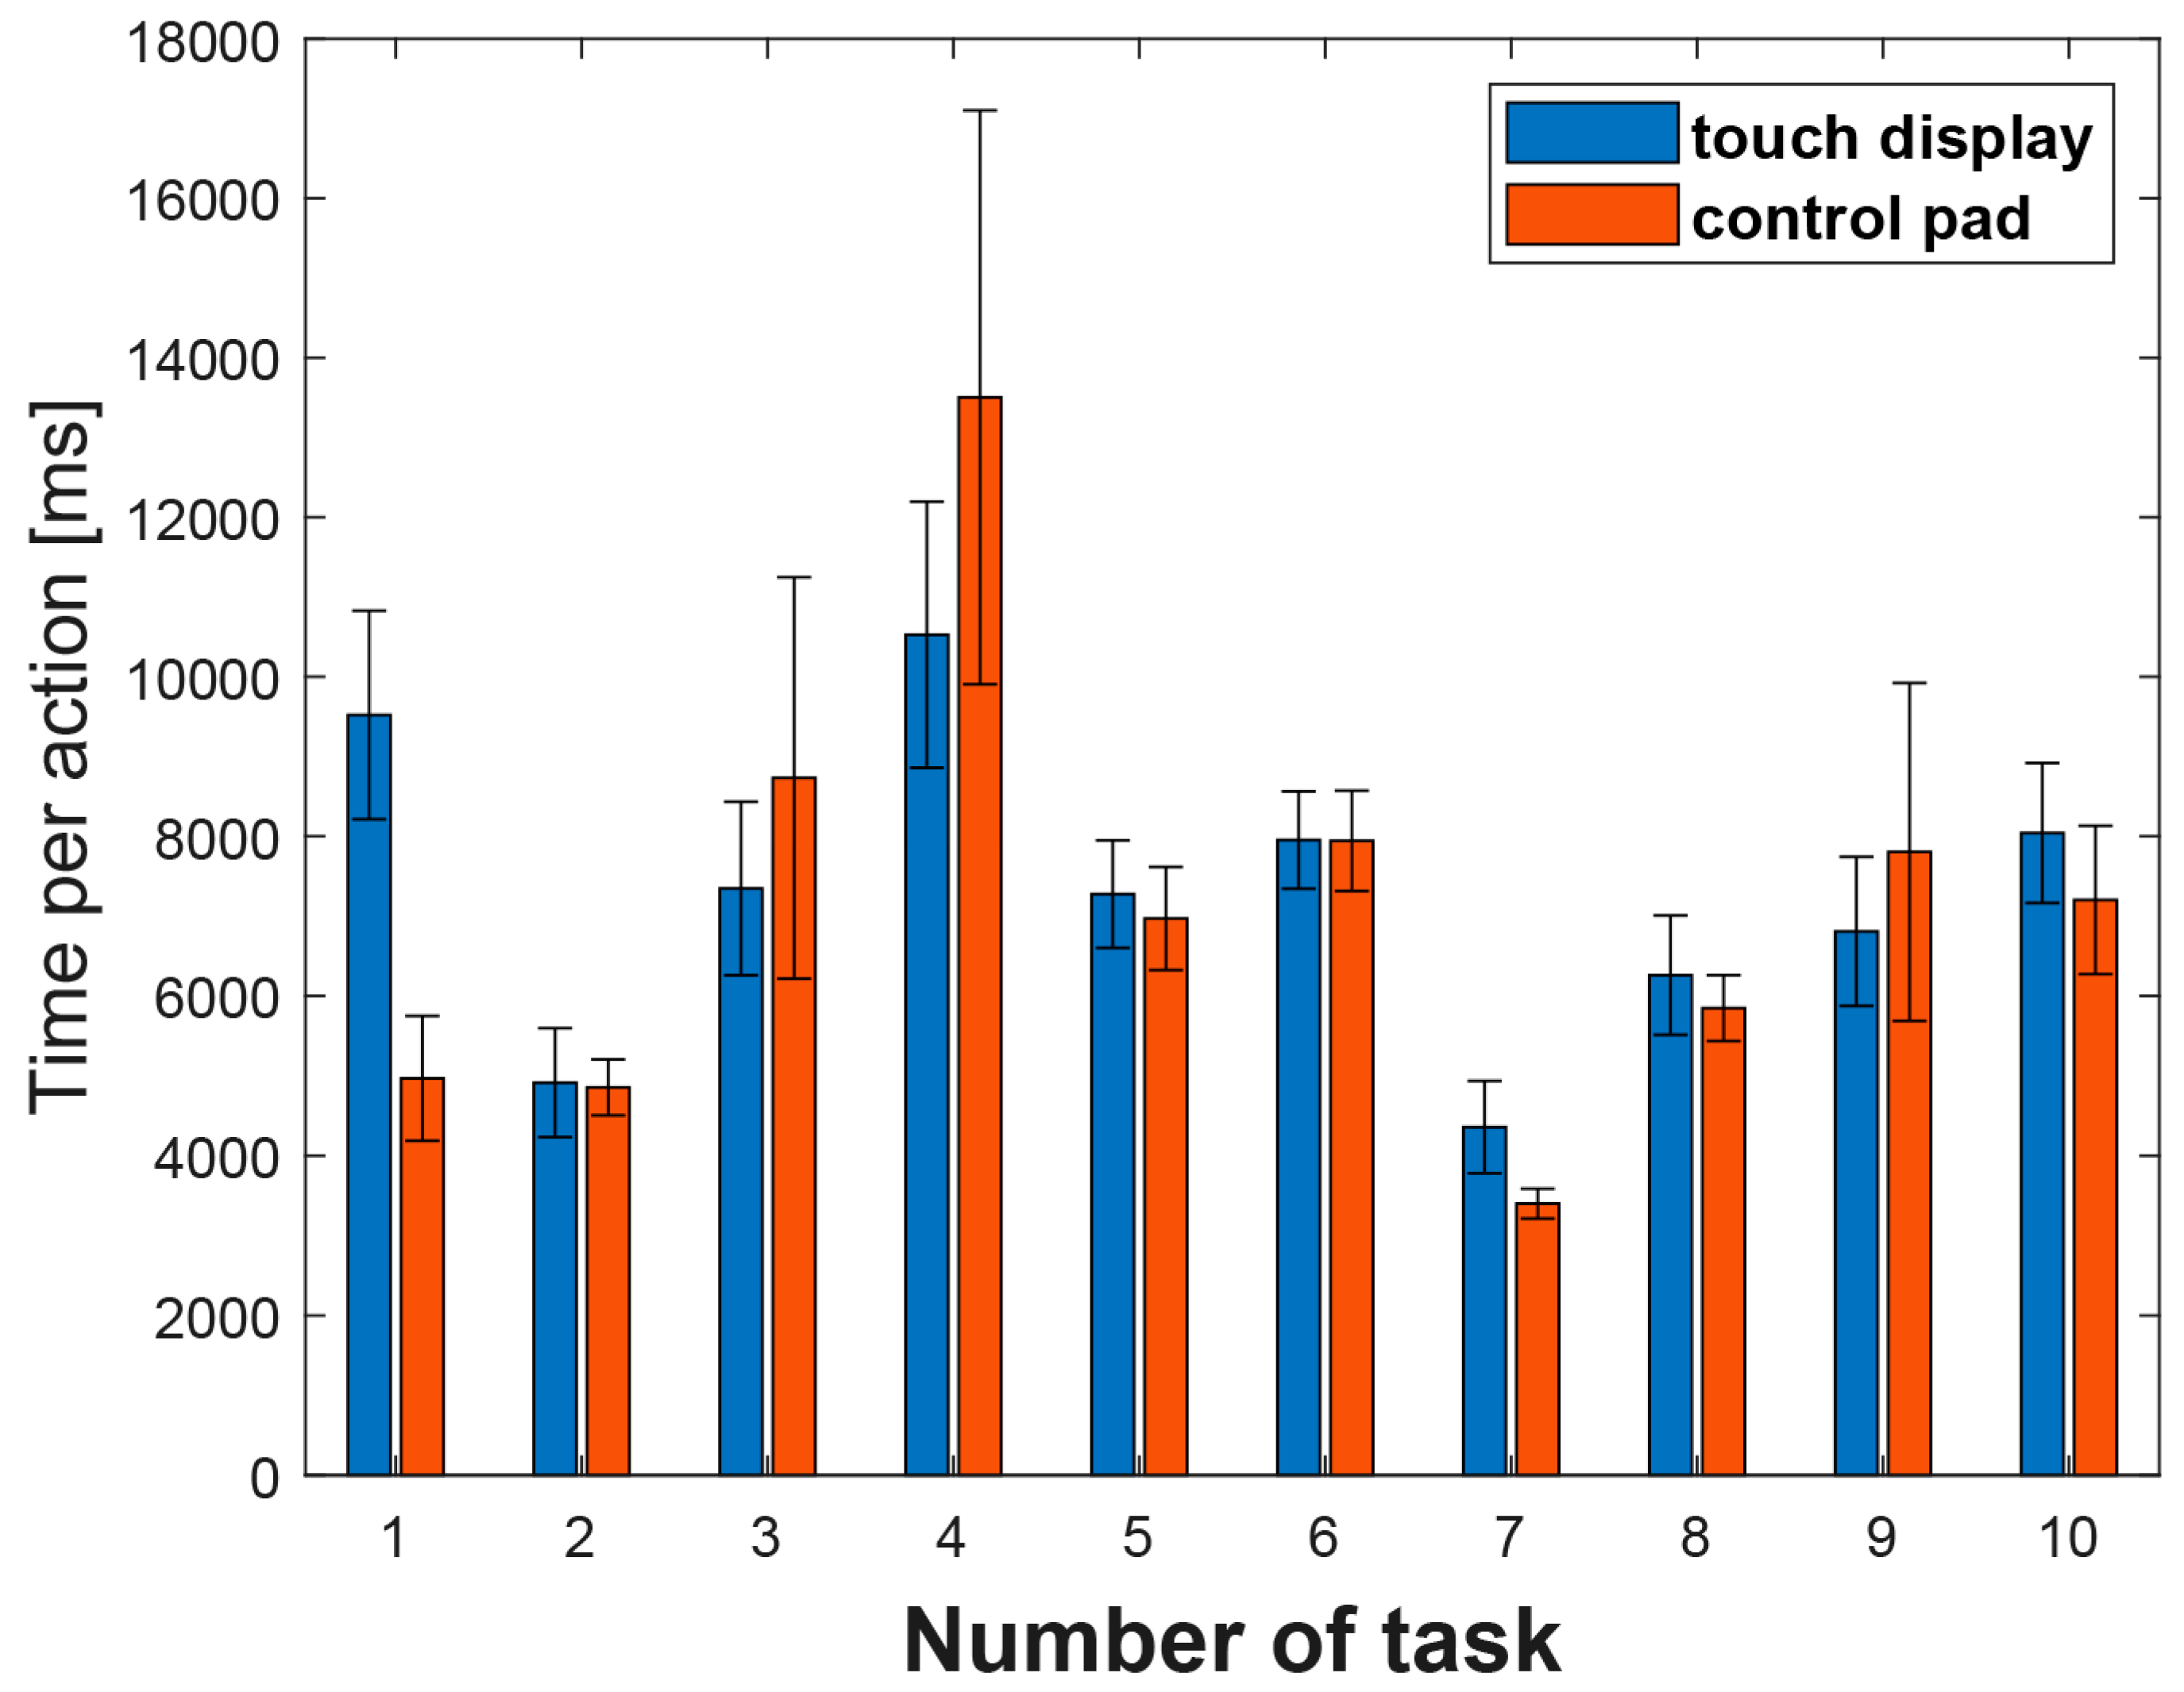
5.2. Performance over Trials

In order to analyse performance over the course of trials, time on task and actions per task were combined into time per action by dividing the time on task by number of actions. The 10 (number of trials) by 2 (group) mixed ANOVA yielded a significant main effect for trials, F(9, 135) = 6.175, p = 0.001, ηp = 0.292, ε = 0.375, but not for group, F(1, 15) < 1, p = 0.830, ηp = 0.003, meaning that the time participants needed per action differed significantly for the tasks, but not for the groups. The interaction of both factors is non-significant, too, F(9, 135) = 1.242, p = 0.305, ηp = 0.076. This indicates that the patterns found in both groups were similar over the course of trials, as illustrated in Figure 4.
For the following analyses, i.e., benchmark comparisons and correlations, the data of both groups were collapsed in order to gain higher statistical power, although this might result in higher variability of the data. A critical discussion of this can be found below in the limitations section.

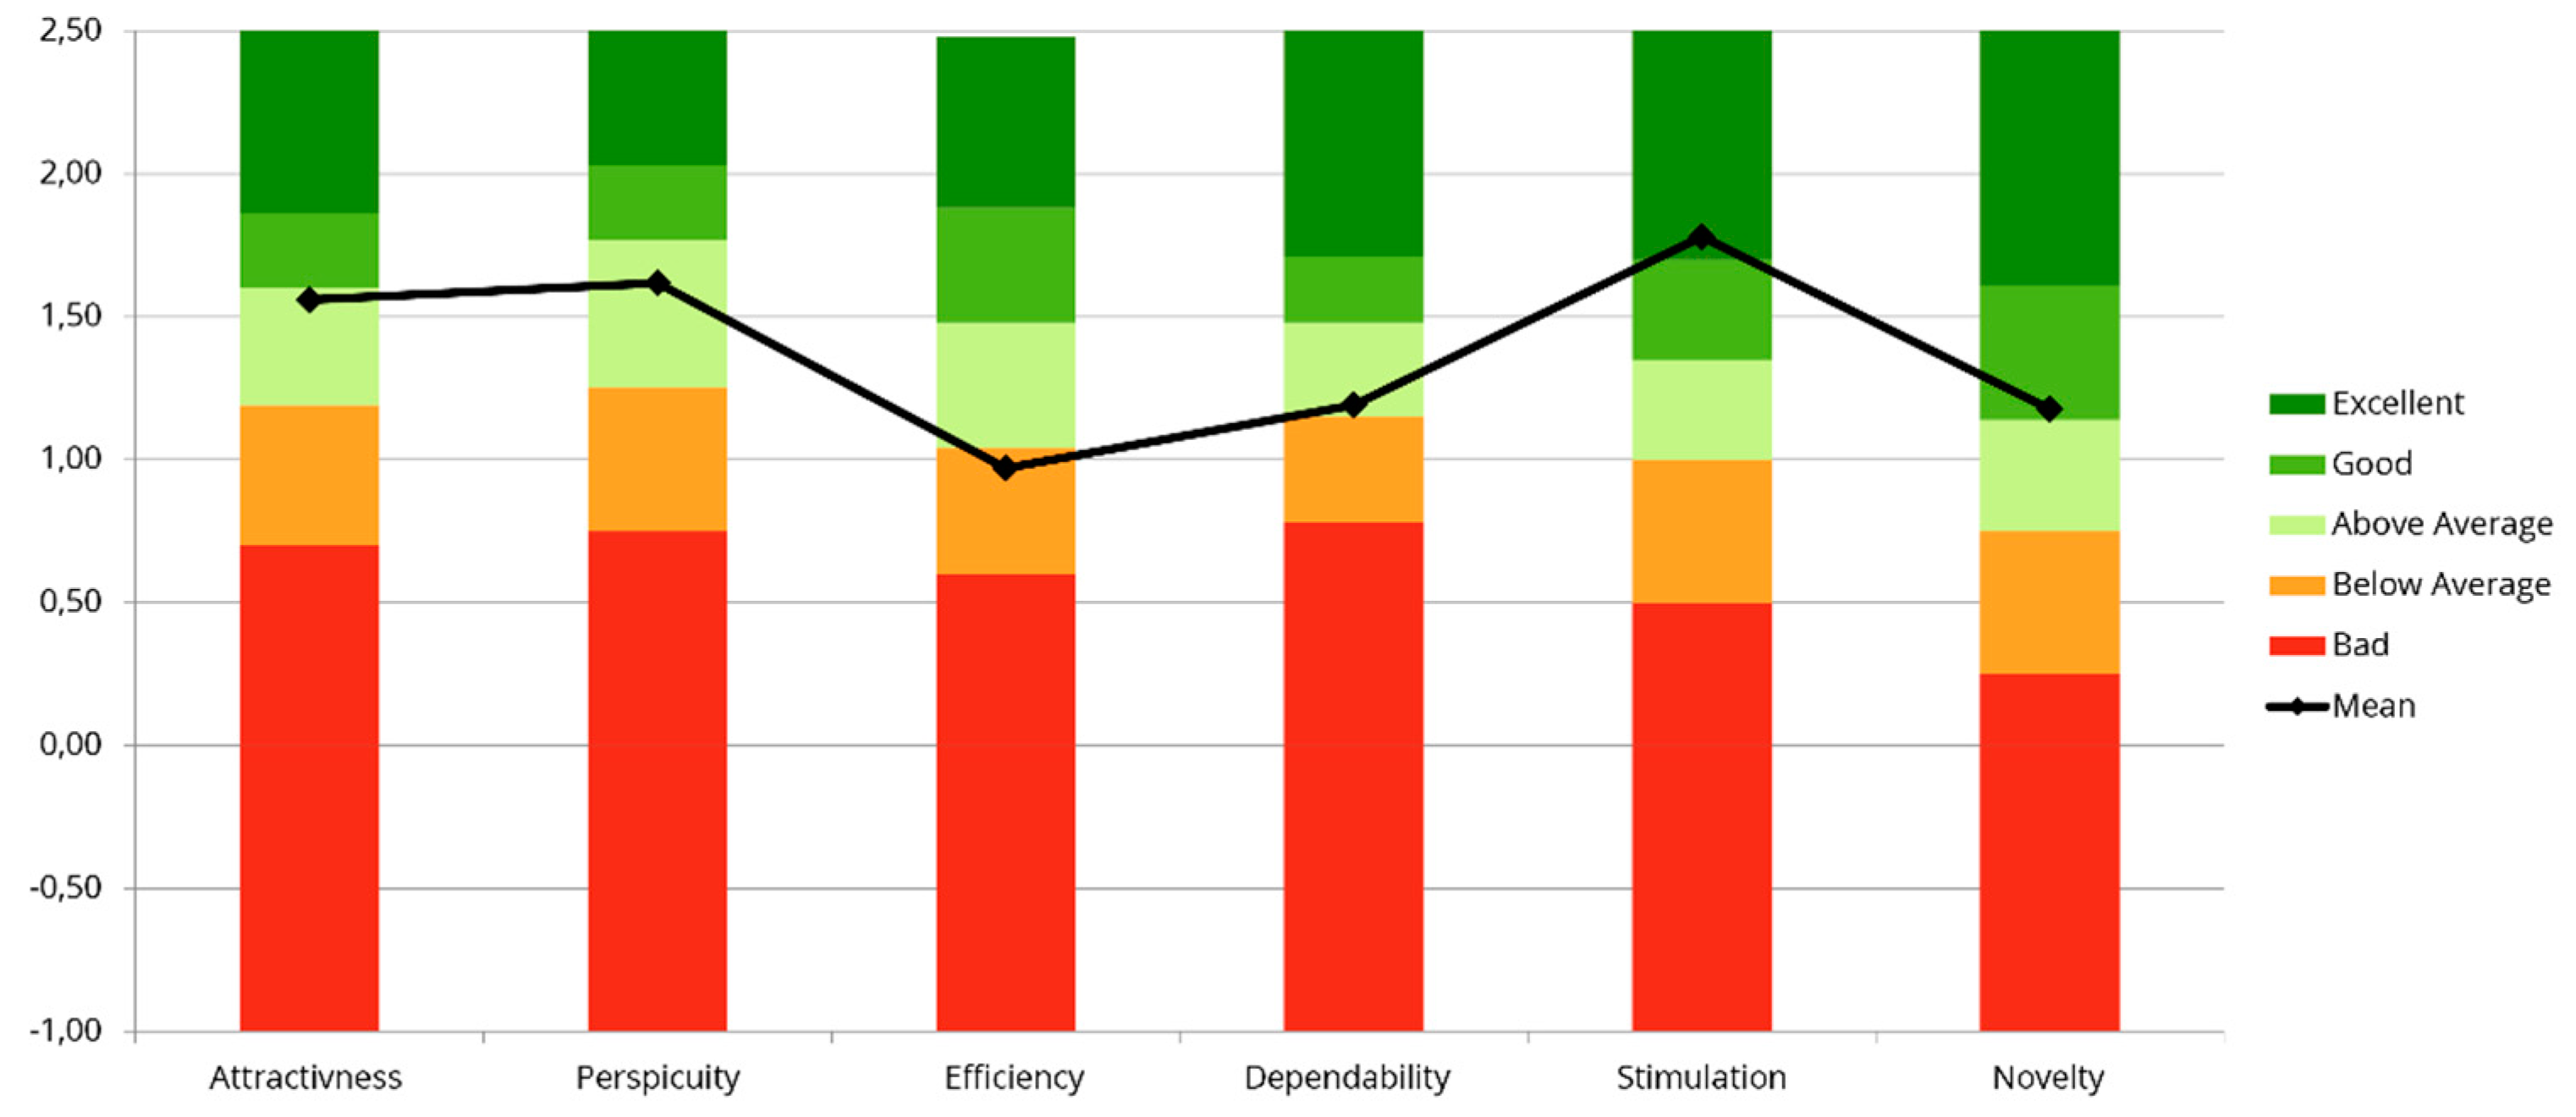
5.3. Benchmark Comparisons

To evaluate the overall UUX of the HMI, the scores of the NASA-TLX, SUS and UEQ questionnaires were further compared to existing benchmarks.
In their meta-analysis, Grier [37] gathered results from over 200 studies reporting the NASA-TLX global workload score and described the distribution of the score for different task types. Compared to the studies examining mechanical tasks (N = 22), the HMI (M = 29.2, SD = 12.8) had a higher reported workload than 50% of the group.
The SUS score was assessed using two global benchmarks (each consisting of N > 200 studies), an absolute grading scale [38] and a curved grading scale assigning grades based on percentile ranges [39]. The overall SUS score for the HMI (M = 73.5, SD = 12.34) is equivalent to a C grade on the absolute grading scale and B- (corresponding percentile range: 65–69) on the curved grading scale, resulting in an evaluation slightly above average.
To gain a more detailed overview of the specific usability aspects, analysis on item level was performed, based on a study providing regression equations to calculate benchmarks for each item [40]. As it is becoming a common industrial goal to achieve a SUS score of at least 80 (a B grade on absolute, A- on a curved grading scale) (ibid), item benchmarks were computed for this target score. While the means of the items 1 (“I think that I would like to use this system frequently”) and 3 (“I thought the system was easy to use”) passed the criteria, the other item means scored lower than the benchmarks; especially item 4 (“I think that I would need the support of a technical person to be able to use this system”), 6 (“I thought there was too much inconsistency in this system”) and 9 (“I felt very confident using the system”).
Finally, the UEQ scores were compared to the scores of 246 product evaluations of software and other products such as phone or tablet applications [41] (s. Figure 5). Considering that most of the benchmark evaluations stem from established products and general UX expectations have increased over time, Schrepp et al. recommend new products to at least reach the “good” category. While the HMI performed below average in Efficiency and above average in Attractiveness, Perspicuity and Dependability, participants evaluated the device good in Novelty and excellent in Stimulation.

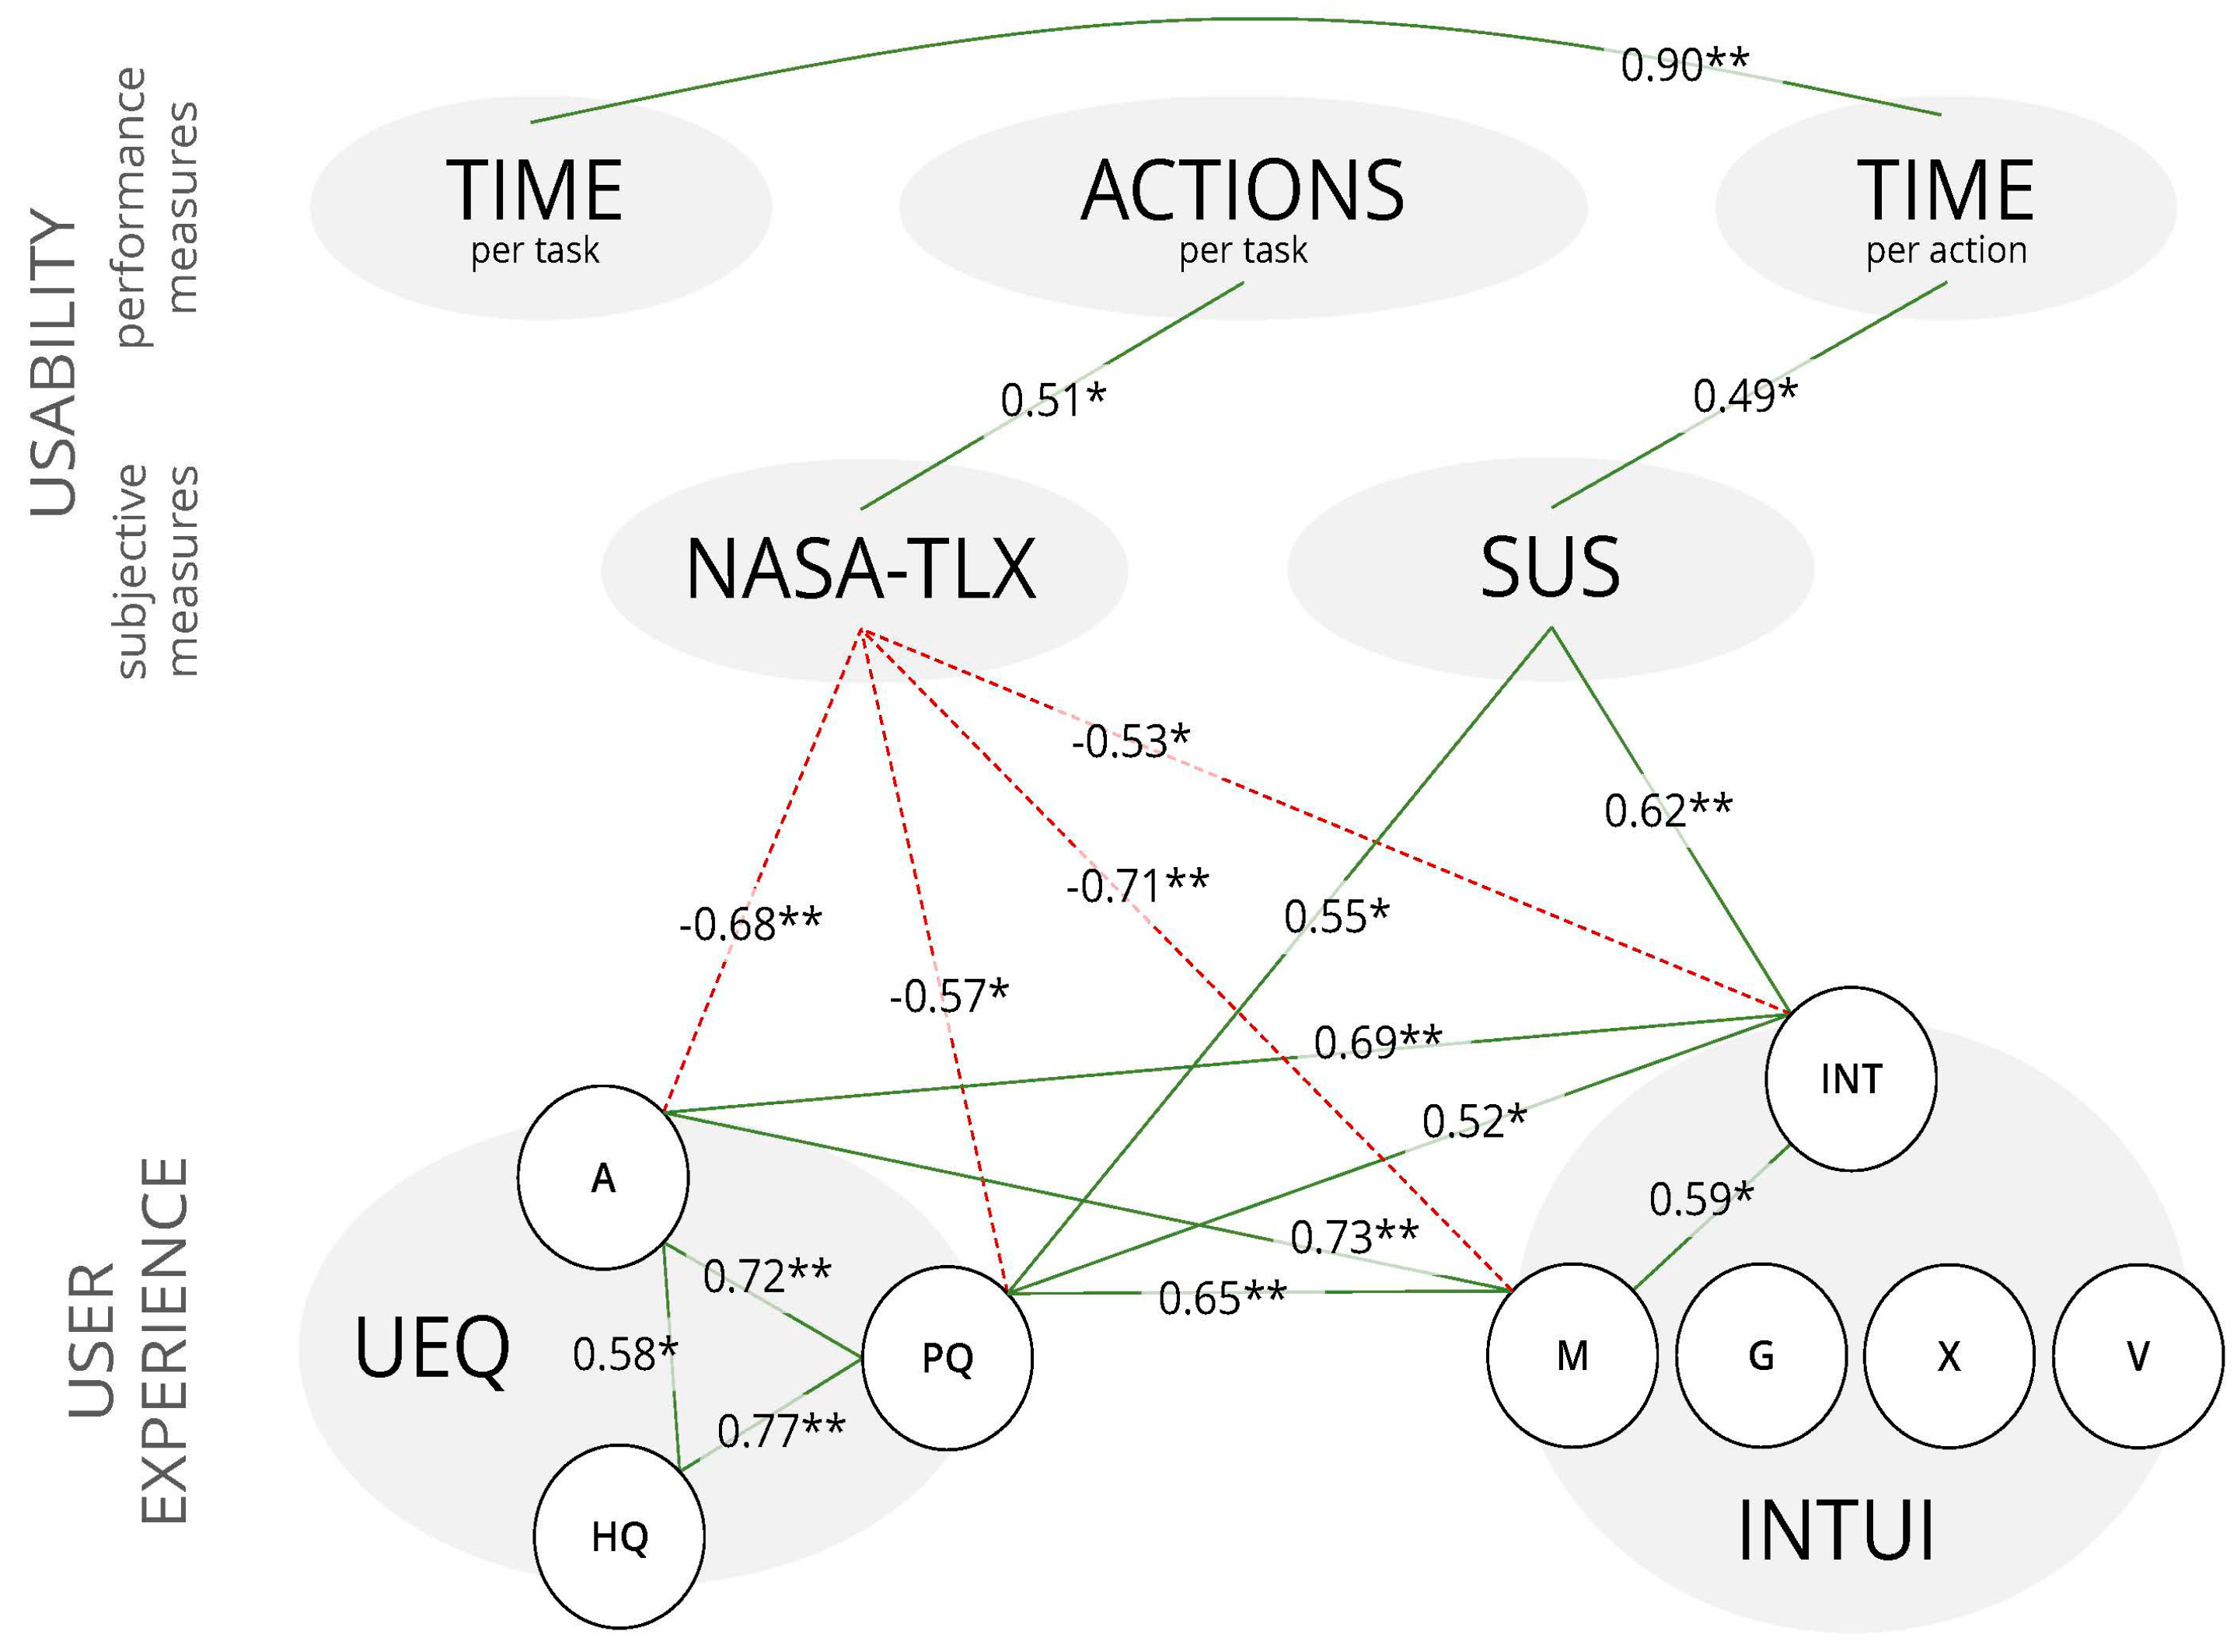
5.4. Correlations between UUX Measures

Correlations were analysed utilising Spearman’s ranked correlation coefficient. The detailed results are reported in the Appendix A. Figure 6 illustrates the correlations:
Time per task was highly associated with time per action (rs = 0.90), meaning that participants who required more time for tasks also took longer for each action. Participants who needed more actions to fulfil the task (i.e., actions per task) reported higher workload (rs = 0.51), as assessed by the NASA-TLX.
The higher workload was further associated with less experienced attractiveness of the device (UEQ A; rs = −0.68) and less pragmatic quality (UEQ PQ; rs = −0.57) as well as lower scores of intuitiveness (INTUI INT; rs = −0.53) and effortlessness (INTUI M; rs = −0.71).
Time per action correlated positively with general usability (rs = 0.49), as assessed by the SUS questionnaire, and participants rating the device as more usable also reported higher intuitiveness (rs = 0.62) and pragmatic quality (rs = 0.55).
Finally, several interconnections within and between the user experience measures (UEQ and INTUI) were revealed. Attractiveness, pragmatic quality (both measured by the UEQ), intuitiveness and effortlessness (both measured by the INTUI) all showed moderate to strong positive correlations among each other (UEQ A - UEQ PQ, rs = 0.72; UEQ A - INTUI INT, rs = 0.69; UEQ A—INTUI M, rs = 0.73; UEQ PQ—INTUI INT, rs = 0.52; UEQ PQ—INTUI M, rs = 0.65; INTUI INT—INTUI M, rs = 0.59).
For the UEQ, the third factor hedonic quality (UEQ HQ) was also positively related to the other two factors attractiveness (rs = 0.58) and pragmatic quality (rs = 0.77). The detailed results of all correlations are reported in the Appendix A.

6. Discussion

The results of our study show that the different ways of interaction—namely by control pad and by touch—did not impact any of the measures taken. In terms of detailed performance analysis over the course of trials, both groups yielded differences in terms of time per action, but not between the groups. The comparison of UUX measures with benchmark values yielded mixed results. UUX measures showed some relevant significant correlations. The implications of these results will be discussed in detail below.

6.1. Group Differences and Interaction Modalities

The fact that performance measurement and subjective usability of the control pad group is not worse than the touch display group suggests that the adjustment of the operating and navigation processes work for a control pad-based interaction.
That the usability and UX of the touch display group are not worse than the control pad group suggests that the new input modality “Touch” with the HMI is not a major obstacle for the operators, who are otherwise only used to inputs with physical controls and joysticks at their workplace.
The few differences in performance measures between the two groups can also be explained by the fact that the tasks employed here only cover a small and easily comparable part of the operating tasks. The workflow for changing the tool also has been optimised for a control pad interaction as it utilises one of the widgets. The widget guides the operator through a simple dialogue of several confirmations to run the necessary operations. Therefore, showing no differences, the results match our expectations. However, this also means that they cannot be generalised for the overall use of a control pad. Certain tasks, like those which demand many entering and exiting navigations at different places on the interface most likely, will benefit from touch interaction. Nevertheless, the results show that the control pad optimisation of this certain workflow was successful. Also, we expected the control pad group to show lower values in time per action than the touch group, as the control pad group does not have to move the hand from the joystick for the necessary interactions. The measurements do not show such an effect. We suspect that this advantage was too small to be detected in the setup we choose. After all, we rate the results positively, in the sense that the developed interface enables operation by touch as well as by a control pad, without having to accept negative usability and operating experience for one of them. This makes this HMI a good starting point for a multimodal operating concept in which the user can freely choose whether they want to operate the system by touch or with the haptic control pad, depending on the situation.
The tasks employed in this experiment were variations of the same basic set of actions to be performed: positioning of boom and bucket and initiating the attachment of the tool. However, our detailed results showed that the performance largely differed between the single tasks, most probably due to different distances between the pick-up positions. We could not show a learning curve in the form of a downward slope of time per action over time. More trials would most likely be necessary to detect systematic learning. Under normal work conditions, it is quite unrealistic to do the same task again and again. Instead, purposeful work situations usually consist of sequences of subtasks building on the results of the previous ones.
Benchmark comparisons were available for the NASA-TLX, SUS and UEQ, respectively. Concerning NASA-TLX, the result was slightly negative with a global workload being higher than 50% of the benchmark studies analysing mechanical tasks. This has to be taken as an indication of a need to further improve this HMI concept. However, three aspects have to be considered in order to correctly interpret this benchmark. First, it has to be noted that the NASA-TLX global workload score employed here is a raw sum score without subjective weights by the participants (also referred to as Raw TLX; [42]), which might be a fundamental difference to the studies forming the comparison group. Second, the tasks employed were repetitions of the same basic set of subtasks, without any inherent goal state or target, which might deviate from settings in real work scenarios. Third, since the operation of an excavator is more complex than most of the tasks described for the benchmark group, it is no surprise that the evaluated HMI scored comparably high. The benchmark of the SUS questionnaire raises claims for improvements of the interface, too. Grades C and B-, respectively, are certainly not the goal line for setting up a new HMI interface. The item specific analysis is of special importance towards possible improvements of the novel HMI interface. Items 1 (frequent use) and 3 (ease of use) are directly linked to the inherent features of the interface. However, weaknesses of the other items (need for technical support, inconsistencies, low confidence) may be explained by the complexity of the system and could, therefore, be overcome by sophisticated training, including an overview of the system’s functionalities, and exercises dedicated to reach proficiency in all available areas of interaction.
A missing internal benchmark is a comparison to task completion using a conventional interface. However, such comparison data can only be gained in further studies, as it could not be implemented in the current study.
The benchmarks of UEQ revealed satisfying results for novelty, and especially for stimulation. Need for improvement is indicated for attractiveness, perspicuity and dependability (all above average), but especially for efficiency (below average). But again, these results must be interpreted considering the higher complexity of the interface, little previous experience in dealing with such interfaces and the large differences compared to conventional operation. Therefore, we rate the results as positive and the implementation of the interface as a good starting point for the integration of display interfaces in the excavator control system.
We interpret the inferior values for efficiency, dependability and novelty as follows:
  • Efficiency—the new complex functions (intelligent tools, automated sub-functions) and their more extensive operation contrast with the usual direct and clear operation of conventional excavators. We expect better values for the perceived efficiency when operators build up some knowledge about the systems architecture. But clearly, there is open potential in reducing the perceived complexity of the system.
  • Dependability—the evaluated prototype had a noticeable latency which may play a role here. Scepticism about digital systems and interfaces that seems quite complex at first sight may strengthen the doubt in dependability. This effect will shrink through long-term learning and the growing experience with the systems.
  • Novelty—the display interface is used to associate comparable solutions from the consumer sector (tablets, smartphones, navigation systems in private health insurance) which, on the one hand, generally have a higher level of development and, on the other hand, need to map less complex tasks.
Generally, switching to display-based operating environments and using assistive functions in the excavator requires adaption and learning. This HMI concept provides a starting point that at least shows no unnecessarily bad results which provide the basis for successive further development and a baseline for further investigations.
Taken together, the benchmarks for the UUX measure present a highly valuable tool for further improving early versions of interfaces. Further studies will have to integrate these detailed analyses with user feedback directly extracted from interviews, observations, etc.
The role of user experience in work domains is still to be investigated, as the traditional aspects of usability, namely effectiveness, efficiency and satisfaction, seem to exhaustively reflect the requirements for good design. With the correlations between UUX measures, the study provides some insights into more general aspects of basic research. First of all, the positive correlation between NASA-TLX and number of actions per trial supports the idea that higher work demand is related to higher scores in the NASA-TLX. Moreover, NASA-TLX is negatively correlated with UEQ-Pragmatic-Quality and UEQ-Attractiveness, showing that again demands are reflected in pragmatic aspects, but also in aspects of appearance. The same is true for the negative correlations between the NASA-TLX and INTUI-Intuitiveness, and especially the NASA-TLX and INTUI-effortlessness. Not only work demands, as reflected in NASA-TLX but also the dedicated measure of usability, SUS, showed a significant correlation with UEQ-Pragmatic-Quality and INTUI-Intuitiveness. Finally, significant correlations between the two user experience measures INTUI and UEQ were obtained, reflecting overlapping aspects of both concepts. However, it is also interesting that none of the implicit usability measures are related to UX which, therefore, covers other aspects. The results obtained here emphasize the importance of user experience in the context of work domains as it includes aspects beyond usability.
Correlations between UX and usability measures should show up independently from the actual method of interaction. If more data were available, even a meta-analysis would be justified, in order to gain deeper insights into the relationship between different UX and usability concepts. However, in order to make sure that the mode of interaction does not influence the correlations, we calculated a regression for every significant correlation. The mode of interaction was herewith included as an additional factor. In none of the tests, the mode of interaction explained any additional variance.

6.2. Limitations and Future Work

As described before, product development projects need fast evaluation tools, especially in the early stages. Therefore, the presented evaluation setup also took economic aspects into account, resulting in compromises regarding the detail of environmental influences, such as dispensing with vibrations or a relatively small sample size. Despite these limitations, the findings helped us to understand the strengths and weaknesses of the design proposal for further improvement in the product development process. Regarding the generalisation of the findings, several aspects of our research could be improved in future work. First, it has to be kept in mind, that due to the specificity of the sample, the size was relatively small and analyses were lacking statistical power to add certainty to the results, e.g., for detecting differences among the groups. Second, we collapsed the groups for benchmark and correlation analyses. We did so for the following reasons: (a) using solely control pad or touch display, respectively, mark the extreme variants of interacting with the excavator. Therefore, we decided to include both modes in the benchmark tests. To validate the results, subsequent research should include a group where participants can choose the interaction freely. This would also clarify how people organise their work when allowed to make such choices. (b) Correlations between UX and usability measures should show up independently from the actual way of interaction, as usability is considered to be a part of UX [18]. If more data were available, even a meta-analysis would be justified, thus including different setups, different tasks, and differing HMI concepts, in order to gain deeper insights into the relationship between the UX and usability measures. Finally, we tested the device with the execution of singular tasks. Future studies will have to embed tasks in overarching goals reflecting the rich demands operators are facing when working on a construction site. Besides more diverse tasks, the performance of other interface functionalities has to be researched in detail, also covering interaction errors for further insights into the quality of the interface architecture [9].
Supporting the further development of the HMI, additional studies have to concern more complex and diverse tasks to achieve more generalisable evidence regarding the UUX of different interaction modalities. Such tasks should not only cover certain work-related operations but also the switching of modes and the setup of the advanced assistive functionalities (e.g., virtual walls). Also, crucial environmental effects like vibrations have to be simulated in this course and interaction errors should receive more attention.
However, since the tools used and the evaluation setup only allowed a general measurement of UUX of the whole system, the data gathered is missing detailed relations between UUX and aspects of the interface and interaction design. We emphasize further research on relations between certain design features (e.g., interface layout, style of navigation, feedback, design of dialogue-based interaction (the system just asks for permission to perform certain functions, instead of single selection by the operator) and specific measures of UUX.

6.3. Conclusions and Hints for Adjusting the HMI Concept

The evaluated interface is designed to allow users to choose their way of interaction with the machine that best fits their needs. The means of interaction utilising the control pad offers the same functionality as the touch display. However, in different situations, one or the other might be of greater ease. In the excavator work situations, there are often heavy vibrations that have the potential to make reaching movements to touch the display jerky and imprecise. Then, using the control pad on the joystick might work more precisely than the touch displays. In other situations without intensive vibrotactile forces, e.g., a work preparation phase, the touch display offers more direct access to the functionality of the system. Therefore, we interpret the non-significant differences between the groups in our study as a positive outcome. In normal working conditions, both modes can be freely selected by the user based on the current conditions. It can be expected that users with increasing experience develop individual routines and preferences, blending joystick and touch display interactions according to their needs. Performance, usability and user experience measures in our study, therefore, represent a rather conservative estimation of the HMIs potential in actual work situations. Regarding the aforementioned shift in work profiles [2], the evaluated concept introduces a worthy approach to cover complex tasks.
In summary, the results of the current exploratory study on UUX evaluation for the novel interface gained insights on different levels of consideration. Concerning the further development, the concurrent evaluation of usability and user experience allows for systematic improvements. Our results suggest that perceived attractiveness, pragmatic quality and intuitiveness can also be improved by reducing overall workload. With (partially) automated machines and the expansion of assisted operating, necessary operating actions can be reduced. The introduced widget-based complex functionalities are capable of further reducing necessary actions per task, e.g., by clustering certain interaction chains and function wise linked operations. Its effects have to be underpinned with empirical data but we expect these functions to positively address the challenges of introducing new assistive features, in terms of complexity, transparency and uncertainty [2].
The correlations between time per action and usability and usability with perceived intuitiveness and pragmatic quality support the claim that the system will promptly respond to inputs and that the acceleration of goal achievement can have a positive impact on usability and UX. Shortening the operating tasks (e.g., through preselected actions or combined functions according to common workflows) and direct feedback on the success of an interaction can help to improve the system. Due to the hardware, the current state of development of the novel HMI confronts the user with short waiting times (up to approx. 0.5 s) before the system reacts. Reducing this latency should have a positive impact on UUX.
Besides professional training, which is always part of enabling workers to operate sophisticated machines, the implementation of adaptive control assistance and tips as well as paying increased attention to self-explanatory methods of introducing new operation functionalities, where possible, can help facilitate adaptation to new ways of operation. As automation will decrease or at least shift workload, aspects that create meaningful stimulation will become more important [11]. Even though the results show potential for increasing the interaction quality, considering the extent of changes regarding workflows and new functionalities operators face when using this HMI, the findings are encouraging.
On the level of theoretical considerations, we could confirm that pragmatic aspects of user experience are strongly related to usability, which by now has not yet been shown in the context of an industrial application. However, it needs to be kept in mind that the study’s results stem from a relatively small sample and the repeated execution of singular tasks. Future studies will have to expand in both directions: larger sample sizes and tasks embedded in overarching goals reflecting the rich demands operators are facing when working on a construction site.
The participants mostly reported enjoying the use of the HMI concept, but several practical issues (e.g., efficiency) still need to be overcome. Once more, the study confirms the urge of user inclusion in product development. In particular, during the course of digitising, the big scale advancements of systems and user interfaces present uncertainty for many manufacturers in regard to whether a feature could be integrated. This also hinders the targeted implementation of new digital functionalities and technological potential. The evaluation setup and tools used in this study have proved a worthy starting point for quality checking new concepts during development.

Author Contributions

Conceptualization, S.L., C.W., J.R.H. and J.K.; methodology, J.R.H.; formal analysis, J.R.H., R.A.; investigation, S.L.; resources, S.L.; data curation, J.R.H.; writing—original draft preparation, writing, review and editing, S.L., C.W., J.R.H., R.A.; visualization, R.A., S.L., J.R.H. and J.K.; supervision, J.R.H., J.K.; All authors have read and agree to the published version of the manuscript.

Funding

This research received no external funding.

Acknowledgments

We thank Madita Brandhorst and Melanie Sorce, both students at the Chair of Engineering Psychology and Applied Cognition Science at the Technische Universität Dresden for the conceptualization and execution of the evaluation; Jan Wojdziak and Lukas Büschel of the Gesellschaft für Technische Visualistik mbH for the technical support and the Liebherr-Hydraulikbagger AG for providing the prototype.

Conflicts of Interest

The authors declare no conflict of interest.

Appendix A. Correlations

Table A1. Spearman’s correlation coefficients (rs) for performance, usability, and UX measures. Note: * p ≤ 0.05, ** p ≤ 0.01, all N = 17.
Time Per TaskActions Per TaskTime Per ActionNASA-TLX
(Global Workload)
SUSUEQINTUI
AttractivenessPragmatic QualityHedonic QualityIntuitivenessEffortlessnessGut FeelingMagical Experience
Actions per task0.328
Time per action0.895 **0.047
NASA-TLX0.2380.506 *−0.017
SUS0.3670.1400.493 *−0.412
UEQAttractive-ness−0.037−0.293−0.177−0.681 **0.443
Pragmatic Quality−0.183−0.118−0.060−0.571 *0.550 *0.716 **
Hedonic Quality−0.3540.070−0.248−0.2800.2590.581 *0.774 **
INTUIIntuitive-ness0.207−0.0590.334−0.526 *0.619 **0.69 1 **0.523 *0.349
Effortless-ness−0.245−0.219−0.122−0.709 **0.2590.729 **0.646 **0.4070.592 *
Gut Feeling−0.062−0.2930.0050.0220.0200.0260.043−0.101−0.2400.033
Magical Experience−0.047−0.0330.020−0.0840.0700.2220.1400.3320.1070.0470.333
Verbalization0.2350.1880.250−0.1230.2210.1730.3610.3650.2470.363−0.288−0.007

References

  1. Chacko, V.; Yu, H.; Cang, S.; Vladareanu, L. State of the art in excavators. In Proceedings of the 2014 International Conference on Advanced Mechatronic Systems, Kumamoto, Japan, 10–12 August 2014; pp. 481–488. [Google Scholar]
  2. Gorecky, D.; Schmitt, M.; Loskyll, M. Mensch-Maschine-Interaktion im Industrie 4.0-Zeitalter. In Industrie 4.0 in Produktion, Automatisierung Und Logistik; Bauernhansl, T., ten Hompel, M., Vogel-Heuser, B., Eds.; Springer: Wiesbaden, Germany, 2014. [Google Scholar]
  3. Persson, D. Surveying in the Construction Industry-A study of Surveying and Machine Guidance Systems in Excavators on Ground Construction Projects. Master’s Thesis, Chalmers University of Technology, Göteborg, Sweden, 2018. [Google Scholar]
  4. Dunston, P.S.; Proctor, R.W.; Wang, X. Challenges in evaluating skill transfer from construction equipment simulators. Theor. Issues Ergon. Sci. 2011, 15, 354–375. [Google Scholar] [CrossRef]
  5. Wallmyr, M.; Sitompul, T.A.; Holstein, T.; Lindell, R. Evaluating Mixed Reality Notifications to Support Excavator Operator Awareness. In IFIP Conference on Human-Computer Interaction; Springer Science and Business Media: Berlin, Germany, 2019; pp. 743–762. [Google Scholar]
  6. Kontogiannis, T.; Embrey, D. A user-centred design approach for introducing computer-based process information systems. Appl. Ergon. 1997, 28, 109–119. [Google Scholar] [CrossRef]
  7. Härter, H. Touch-Display: Bedienelemente Auf Dem Display Blind Auffinden. Available online: https://www.elektronikpraxis.vogel.de/touch-display-bedienelemente-auf-dem-display-blind-auffinden-a-807732/ (accessed on 13 August 2020).
  8. Costes, A.; Danieau, F.; Argelaguet, F.; Guillotel, P.; Lecuyer, A. Towards Haptic Images: A Survey on Touchscreen-Based Surface Haptics. IEEE Trans. Haptics 2020, 1. [Google Scholar] [CrossRef] [PubMed]
  9. Butz, A.; Kruger, A. Mensch-Maschine-Interaktion; Walter de Gruyter GmbH: Berlin, Germany, 2017. [Google Scholar]
  10. Sakaida, Y.; Chugo, D.; Yamamoto, H.; Asama, H. The analysis of excavator operation by skillful operator-extraction of common skills. In Proceedings of the 2008 SICE Annual Conference, Tokyo, Japan, 20–22 August 2008; pp. 538–542. [Google Scholar]
  11. Werfel, J.; Petersen, K.; Nagpal, R. Designing Collective Behavior in a Termite-Inspired Robot Construction Team. Science 2014, 343, 754–758. [Google Scholar] [PubMed]
  12. Akyeampong, J.; Udoka, S.; Caruso, G.; Bordegoni, M. Evaluation of hydraulic excavator Human–Machine Interface concepts using NASA TLX. Int. J. Ind. Ergon. 2014, 44, 374–382. [Google Scholar] [CrossRef]
  13. Sitompul, T.A.; Wallmyr, M. Using Augmented Reality to Improve Productivity and Safety for Heavy Machinery Operators: State of the Art. In Proceedings of the 17th International Conference on Virtual-Reality Continuum and Its Applications in Industry, Brisbane, Australia, 14–16 November 2019; pp. 1–9. [Google Scholar] [CrossRef] [Green Version]
  14. DIN, E. Ergonomische Anforderungen für Bürotätigkeiten mit Bildschirmgeräten–Teil 11: Anforderungen an die Gebrauchstauglichkeit; Leitsätze; ISO 9241-11: 1998; Beuth: Berlin, Germany, 1998. [Google Scholar]
  15. Richter, M.; Flückiger, M.D. Usability Engineering Kompakt: Benutzbare Produkte Gezielt Entwickeln; Springer: Berlin, Germany, 2013. [Google Scholar]
  16. Jordan, P.W.; Thomas, B.; McClelland, I.L. Issues for Usability Evaluation in Industry: Seminar Discussions; Informa UK Limited: London, UK, 1996; pp. 255–262. [Google Scholar]
  17. François, M.; Crave, P.; Osiurak, F.; Fort, A.; Navarro, J. Digital, analogue, or redundant speedometers for truck driving: Impact on visual distraction, efficiency and usability. Appl. Ergon. 2017, 65, 12–22. [Google Scholar] [CrossRef] [PubMed] [Green Version]
  18. Hassenzahl, M. The Interplay of Beauty, Goodness, and Usability in Interactive Products. Hum. Comput. Interact. 2004, 19, 319–349. [Google Scholar] [CrossRef]
  19. Hassenzahl, M.; Diefenbach, S.; Göritz, A. Needs, affect, and interactive products—Facets of user experience. Interact. Comput. 2010, 22, 353–362. [Google Scholar] [CrossRef]
  20. Anderson, S.P. Creating Pleasurable Interfaces. Getting from Tasks to Experiences 2006. Available online: http://poetpainter.com/thoughts/file_download/7 (accessed on 8 January 2019).
  21. Woelfel, C.; Krzywinski, J.; Drechsel, F. Knowing, reasoning and visualizing in industrial design. Knowl. Eng. Rev. 2013, 28, 287–302. [Google Scholar] [CrossRef]
  22. Rissanen, M.J.; Rönkkö, K.; Tripathi, S. Understanding Industrial User Experience. An Excerpt from 1st International Workshop on Industrial User Experience. In 3rd International Conference on Human Computer Interaction 2011; Tripathi, S., Ed.; ACM: New York, NY, USA, 2011; pp. 75–78. [Google Scholar]
  23. Zeiner, K.M.; Burmester, M.; Haasler, K.; Henschel, J.; Laib, M.; Schippert, K. Designing for Positive User Experience in Work Contexts: Experience Categories and their Applications. Hum. Technol. 2018, 14, 140–175. [Google Scholar] [CrossRef]
  24. Wölfel, C.; Krzywinski, J. Human Needs as the Crux of the Matter in Product-Service Systems Development. In Human Behaviour in Design: Proceedings of the 2nd SIG conference; Institut für Technische Produktentwicklung, Universität der Bundeswehr München: Neubiberg, Germany, April 2019; pp. 47–62. [Google Scholar]
  25. Kun, C.T.; Sahari, N. Utilitarian or Experiential? An Analysis of Usability Questionnaires. Int. J. Comput. Theory Eng. 2015, 7, 167–171. [Google Scholar]
  26. Wölfel, C.; Krzywinski, J. Ansatz und Modell der User Experience cyber-physischer Systeme in professionellen Kontexten und dessen Kommunikation in Industriegüterunternehmen. In Arbeit interdisziplinär: Analysieren-bewerten-gestalten; Dokumentation des 65; Arbeitswissenschaftlichen Kongresses vom 27.02. bis 01.03.2019: Dortmund, Germany, 2019. [Google Scholar]
  27. Hart, S.G.; Staveland, L.E. Development of NASA-TLX (Task Load Index): Results of Empirical and Theoretical Research. In Advances in Psychology; Elsevier: Amsterdam, The Netherlands, 1988; Volume 52, pp. 139–183. [Google Scholar]
  28. Minge, M.; Riedel, L. meCUE—Ein modularer Fragebogen zur Erfassung des Nutzungserlebens. In Mensch & Computer; Boll, S., Maaß, S., Malaka, R., Eds.; Interaktive Vielfalt; Oldenbourg Verlag: München, Germany, 2013; pp. 89–98. [Google Scholar]
  29. Hassenzahl, M.; Burmester, M.; Koller, F. AttrakDiff: Ein Fragebogen zur Messung wahrgenommener hedonischer und pragmatischer Qualität. In Mensch & Computer; Szwillus, G., Ziegler, J., Eds.; Berichte des German Chapter of the ACM; Vieweg+Teubner Verlag: Wiesbaden, Germany, 2003; Volume 57. [Google Scholar] [CrossRef]
  30. Brooke, J. SUS: A Quick and Dirty Usability Scale. Usability in Industry Evaluation; Taylor & Francis: London, UK, 1996; pp. 207–212. [Google Scholar]
  31. Ullrich, D.; Diefenbach, S. Intui. Exploring the Facets of Intuitive Interaction. In Mensch & Computer 2010: Interaktive Kulturen 2010; Oldenbourg Verlag: Munich, Germany, 2010. [Google Scholar]
  32. Laugwitz, B.; Held, T.; Schrepp, M. Construction and Evaluation of a User Experience Questionnaire. In Symposium of the Austrian HCI and Usability Engineering Group; Springer: Berlin/Heidelberg, Germany, 2008; pp. 63–76. [Google Scholar]
  33. Alberola, C.; Brau, H.; Walter, G. Die Kürzung des User Experience Questionnaire UEQ. In Mensch Und Computer 2017-Tagungsband; Spielend Einfach Interagieren: Norderstedt, Germany, 2018; Volume 17, p. 37. [Google Scholar]
  34. Sanders, E.B.-N.; Stappers, P.J. Probes, toolkits and prototypes: Three approaches to making in codesigning. CoDesign 2014, 10, 5–14. [Google Scholar] [CrossRef]
  35. Fiorineschi, L.; Rotini, F. Unveiling the Multiple and Complex Faces of Fidelity. In The Design Society: International Conference on Engineering Design; Cambridge University Press: Cambridge, UK, 2019; Volume 1, pp. 1723–1732. [Google Scholar]
  36. De Winter, J.C.; Gosling, S.D.; Potter, J. Comparing the Pearson and Spearman correlation coefficients across distributions and sample sizes: A tutorial using simulations and empirical data. Psychol. Methods 2016, 21, 273–290. [Google Scholar] [CrossRef]
  37. Grier, R.A. How High is High? A Meta-Analysis of NASA-TLX Global Workload Scores. Proc. Hum. Factors Ergon. Soc. Annu. Meet. 2015, 59, 1727–1731. [Google Scholar] [CrossRef]
  38. Bangor, A.; Kortum, P.; Miller, J. Determining what individual SUS scores mean: Adding an adjective rating scale. J. Usability Stud. 2009, 4, 114–123. [Google Scholar]
  39. Sampaio, A. Quantifying the user experience: Practical statistics for user research. ACM Sigsoft Softw. Eng. Notes 2013, 38, 57–58. [Google Scholar] [CrossRef]
  40. Lewis, J.R.; Sauro, J. Item benchmarks for the system usability scale. J. Usability Stud. 2018, 13, 158–167. [Google Scholar]
  41. Schrepp, M.; Hinderks, A.; Thomaschewski, J. Construction of a Benchmark for the User Experience Questionnaire (UEQ). Int. J. Interact. Multimed. Artif. Intell. 2017, 4, 40. [Google Scholar]
  42. Hart, S.G. NASA-task load index (NASA-TLX); 20 years later. Proc. Hum. Factors Ergon. Soc. Annu. Meet. 2006, 50, 904–908. [Google Scholar] [CrossRef] [Green Version]
Figure 1. Right control console of the introduced human–machine interface (HMI) concept, with a 10” touch display and reduced to the necessary physical controls.
Mti 04 00057 g001
Figure 2. Touch display interface of the HMI concept. The screen shows the view in the “Work” mode. The left side is used for visualisation purposes exclusively. The ride side presents a customisable button bar of up to six functions for work-related machine functions (top), a scrollable (left-right) bar of widgets (middle) which allow direct activate/deactivate interaction or entering a setup level and another customisable area for comfort and sight-related functions (down).
Mti 04 00057 g002
Figure 3. Evaluation setup using a machine simulation and a virtual reality (VR) environment shown on a 50” 4K screen in front of the participant.
Mti 04 00057 g003
Figure 4. Time per action over course of trials. Error bars indicate standard error of the mean (SEM).
Mti 04 00057 g004
Figure 5. Visualisation of the User Experience Questionnaire (UEQ) benchmarks. The line represents the results for the HMI.
Mti 04 00057 g005
Figure 6. Overview of correlations between performance and usability and user experience (UUX) measures. Note: red dashed lines mark significant negative correlations, green straight lines mark significant positive correlations; * p ≤ 0.05, ** p ≤ 0.01, all N = 17. For the UEQ: A = Attractiveness, PQ = Pragmatic Quality, HQ = Hedonic Quality; for the Intuitive Interaction Questionnaire (INTUI): INT = Intuitiveness, M = Effortlessness, G = Gut Feeling, X = Magical Experience, V = Verbalisation.
Mti 04 00057 g006
Table 1. Results of comparisons between the control pad and the touch display group. Note: Values in the 2nd and 3rd column represent mean, with standard deviation in brackets.
MeasureControl PadTouch Displayt-Value t (15)p
(1) Demographics
Age18.5 (1.07)18.9 (2.67)0.3850.706
ATI4.6 (0.35)4.6 (0.31)0.0190.985
(2) Usability
Time per task17.2 s (4.96 s)17.1 s (5.33 s)0.0490.962
Actions per task2.4 (0.30)2.7 (0.77)1.2440.233
Time per action7122 (1924)7300 (1414)0.2190.830
SUS75.3 (8.18)71.9 (15.50)0.5490.591
NASA-TLX30.8 (13.30)27.8 (13.00)0.4620.651
Mental8.3 (3.73)6.1 (3.06)1.300.214
Physical4.9 (5.36)6.0 (4.66)0.4630.650
Temporal4.9 (2.59)4.3 (2.74)0.4180.682
Performance8.5 (5.86)7.4 (4.59)0.4160.683
Effort6.8 (3.11)5.8 (4.60)0.5030.622
Frustration3.6 (4.93)3.7 (3.80)0.0200.985
(3) User Experience
INTUI
Effortlessness5.2 (0.55)5.1 (1.27)0.1970.847
Gut Feeling2.8 (0.51)3.1 (1.04)0.8820.392
Magical Experience4.5 (0.53)5.0 (0.48)1.8190.089
Verbalisation5.4 (0.35)5.6 (1.04)0.3780.714
Intuitiveness5.0 (0.76)4.6 (1.13)0.9390.362
UEQ
Attractiveness1.7 (0.54)1.4 (0.93)0.6490.526
Pragmatic Quality
(mean of Perspicuity, Efficiency, and Dependability)
1.4 (0.56)1.1 (1.00)0.7400.471
Perspicuity1.7 (0.43)1.5 (1.02)0.5100.620
Efficiency1.2 (0.69)0.8 (1.12)1.0240.322
Dependability1.3 (0.84)1.1 (0.99)0.5100.618
Hedonic Quality
(mean of Stimulation and Originality)
1.6 (0.48)1.3 (0.64)1.1040.287
Stimulation1.8 (0.51)1.8 (0.72)0.2040.841
Originality1.5 (0.56)0.9 (0.71)1.7700.097

