Article

Comparing Interaction Techniques to Help Blind People Explore Maps on Small Tactile Devices

1
IMT Atlantique, LEGO, 29238 Brest, France
2
ENAC, Université Toulouse, 31055 Toulouse, France
3
Inria Bordeaux, 33405 Talence, France
4
CNRS, IRIT, 31062 Toulouse CEDEX 9, France
5
Université de Toulouse 3, 31062 Toulouse CEDEX 9, France
6
CNRS, IPAL, UMI5925, 138632 Singapore, Singapore
*
Author to whom correspondence should be addressed.
Multimodal Technol. Interact. 2019, 3(2), 27; https://doi.org/10.3390/mti3020027
Submission received: 28 February 2019 / Revised: 27 March 2019 / Accepted: 17 April 2019 / Published: 20 April 2019
(This article belongs to the Special Issue Interactive Assistive Technology)

Abstract

:
Exploring geographic maps on touchscreens is a difficult task in the absence of vision as those devices miss tactile cues. Prior research has therefore introduced non-visual interaction techniques designed to allow visually impaired people to explore spatial configurations on tactile devices. In this paper, we present a study in which six blind and six blindfolded sighted participants evaluated three of those interaction techniques compared to a screen reader condition. We observed that techniques providing guidance result in a higher user satisfaction and more efficient exploration. Adding a grid-like structure improved the estimation of distances. None of the interaction techniques improved the reconstruction of the spatial configurations. The results of this study allow improving the design of non-visual interaction techniques that support a better exploration and memorization of maps in the absence of vision.

1. Introduction

Geographic maps are widespread in our environment. They are used in many educational, professional or personal contexts to convey different types of spatial knowledge (e.g., road maps of a city used for orientation, thematic maps highlighting the spatial distribution of demographic data used for political education, etc.). Most people use maps in their daily lives that are visual and therefore inaccessible for people with visual impairment. Not being able to access geographic information has important consequences on education, social inclusion and quality of life of people with visual impairment who represent approximately 3% of the world population [1]. Indeed, “Accessible Maps and Applications” has been identified as one of the Grand Challenges in Accessible Mapping [2].
Although raised line maps are long and expensive to produce [3], they are the most frequently used accessible maps for the blind [4]. On those maps, elements are presented in relief using different lines, symbols and textures that can be explored manually, and textual information is represented with braille. In several studies with people with visual impairment, raised-line maps have proved to be an effective tool for acquiring spatial knowledge (see, for instance, [5]).
To find the map elements and the spatial relations between them, haptic perception depends on complex individual strategies based on the integration of cutaneous, proprioceptive and motor cues related to exploratory finger movements. Indeed, Hampson and Daly [6] identified strategies as a major potential source of individual variation in tactile map reading skills. Different fundamental exploratory patterns have been identified in previous studies: The “gridline” strategy is a systematic horizontal and then vertical exploration path that has the purpose to find all elements of a configuration [7]. The “cyclic” strategy corresponds to sequentially touching each element of a spatial configuration, and then coming back to the first element (thus forming a loop). This strategy allows building relations between the elements of the configuration [8]. The “Back-and-Forth” strategy relies on a repeated movement between two elements to specify their relative location [8]. This strategy can be extended to more than two elements. It is then called the “objects-to-objects” strategy identified by Hill and Rieser [7] and Golledge et al. [9]. The “point of reference” strategy uses a star-shaped pattern highlighting a particular interest for the location of one element. It also aims to identify the relative location of specific elements but in relation to one central or strategic element [10]. Similar strategies have also been identified by Guerreiro et al. in a more recent study on tabletop exploration by people with visual impairment [11]. Given the importance of exploration strategies for spatial exploration in the absence of vision, we suggest that interaction techniques for visually impaired people should be designed taking into account this knowledge.
Interactive maps have more recently emerged as a solution to enhance the accessibility of geographical data for visually impaired users. As suggested by Ducasse et al. [12], accessible interactive maps can be divided in two families: Hybrid Interactive Maps (HIMs) that include both a digital and a physical representation, and Digital Interactive Maps (DIMs) that are maps displayed on a flat surface such as a screen. Many prototypes of DIMs and HIMs have proven to be efficient for the acquisition of spatial knowledge in blind people [13,14,15], but, in comparison to HIMs, DIMs clearly miss tactile cues that ease non-visual exploration. However, they also present advantages. For instance, they can be implemented using standard devices (such as tablet computers) and thus do not require additional—and potentially expensive—devices (such as actuated pins [16] or raised lines overlays [13]). Hence, they are the easiest solution to adopt when designing accessible interactive maps for off-the-shelf tablets or smartphones.
In the context of research on interactive maps, two questions arise concerning the design of interaction techniques for non-visual exploration of spatial information on a tablet computer. The first question is whether some interaction techniques are more usable to access spatial information without vision. The second question is whether some interaction techniques allow the user to build more accurate mental spatial representations and support mental rotations.
The goals of this study were to implement different interaction techniques and to evaluate the impact of these techniques on the exploration and the learning of spatial information on tablet computers. Based on the literature, we evaluated three different one-finger interaction techniques for DIMs displayed on a tablet. We compared them with a standard screen reader to assess the relative usability of these techniques as well as the quality of the mental representations built from using these techniques.

2. Materials and Methods

Three non-visual interaction techniques were compared to an implementation similar to Apple’s VoiceOver or Android’s TalkBack screen reader. The goal of the study was to assess the usability of each of the techniques: efficiency to explore the maps, effectiveness to create and use a mental configuration of the map, and satisfaction of using it.

2.1. Prototype

We implemented the interaction techniques with Android and used an ASUS Transformer Pad Infinity TF700T 10” with Android 4.3 exploitation system. The screen edges were covered with cardboard to avoid unexpected presses on the buttons of the tablet (see Figure 1). In addition, the cardboard served as a physical landmark that delimitated the usable screen, as the tablet itself does not provide any cutaneous cues to distinguish the interactive zone of the tablet from the surrounding inactive zone [12]. To provide non-visual feedback to the users, we used the Google native text-to-speech synthesis (TTS) and embedded vibrations of the tablet.

2.2. Maps

We created “maps” with six points of interest (POIs), but without any routes. Using those maps (or spatial configurations), users can acquire configurational or survey knowledge, which is one of the components of spatial cognition [17]. Because our procedure included several tests (see Section “Procedure”), we had to produce a great number of maps and consequently a great number of names for POIs. The POIs were pseudo-randomly placed on the map. Then, we used the same spatial configuration for each map but rotations of thirty degrees were applied to the initial configuration to produce new maps and avoid any learning effect (see Figure 2).
The POIs used during the familiarization phase were named A–F. For the different online tasks, the six POIs were numbers with two digits (i.e., 11–16 for Map #1, and 21–26 for Map #2). For the offline tasks, the names of the POIs were real names, but not names that can typically be found on maps (see Table 1). We picked these names from six categories: flowers, fruits, vegetables, mammals, water animals, and birds. On each map, there was one item from each category. We verified the lexical equivalence between maps by making use of the French “Lexique” database [18] as in our prior study [13]. We considered two criteria for inclusion of equivalent text: the frequency of oral usage (number of occurrences per million words in subtitles of a movie database) and the number of syllables of each word. Both criteria were important because more frequent or shorter words are easier to memorize. For the flowers, fruits, vegetables, birds and water animals categories, we selected words of two syllables and a rare or very rare frequency of use (<8.5 occurrences per million). For the mammals category, we selected one-syllable words that were more frequent (between 3 and 15). Another constraint was that the names chosen for each map should not sound too similar when pronounced by a text-to-speech synthesis, so they could be easily distinguished by the user. The list of final map elements is displayed in Table 1.

2.3. Interaction Techniques

In addition to a Screen-Reader-like technique, we implemented three different interaction techniques called “Direct guidance,” “Edge projection”, and “Grid Layout”. They are based on the literature and described in detail in the following sections. Multitouch was enabled, thus it was possible to touch with multiple fingers.

2.3.1. Direct Guidance (DIG)

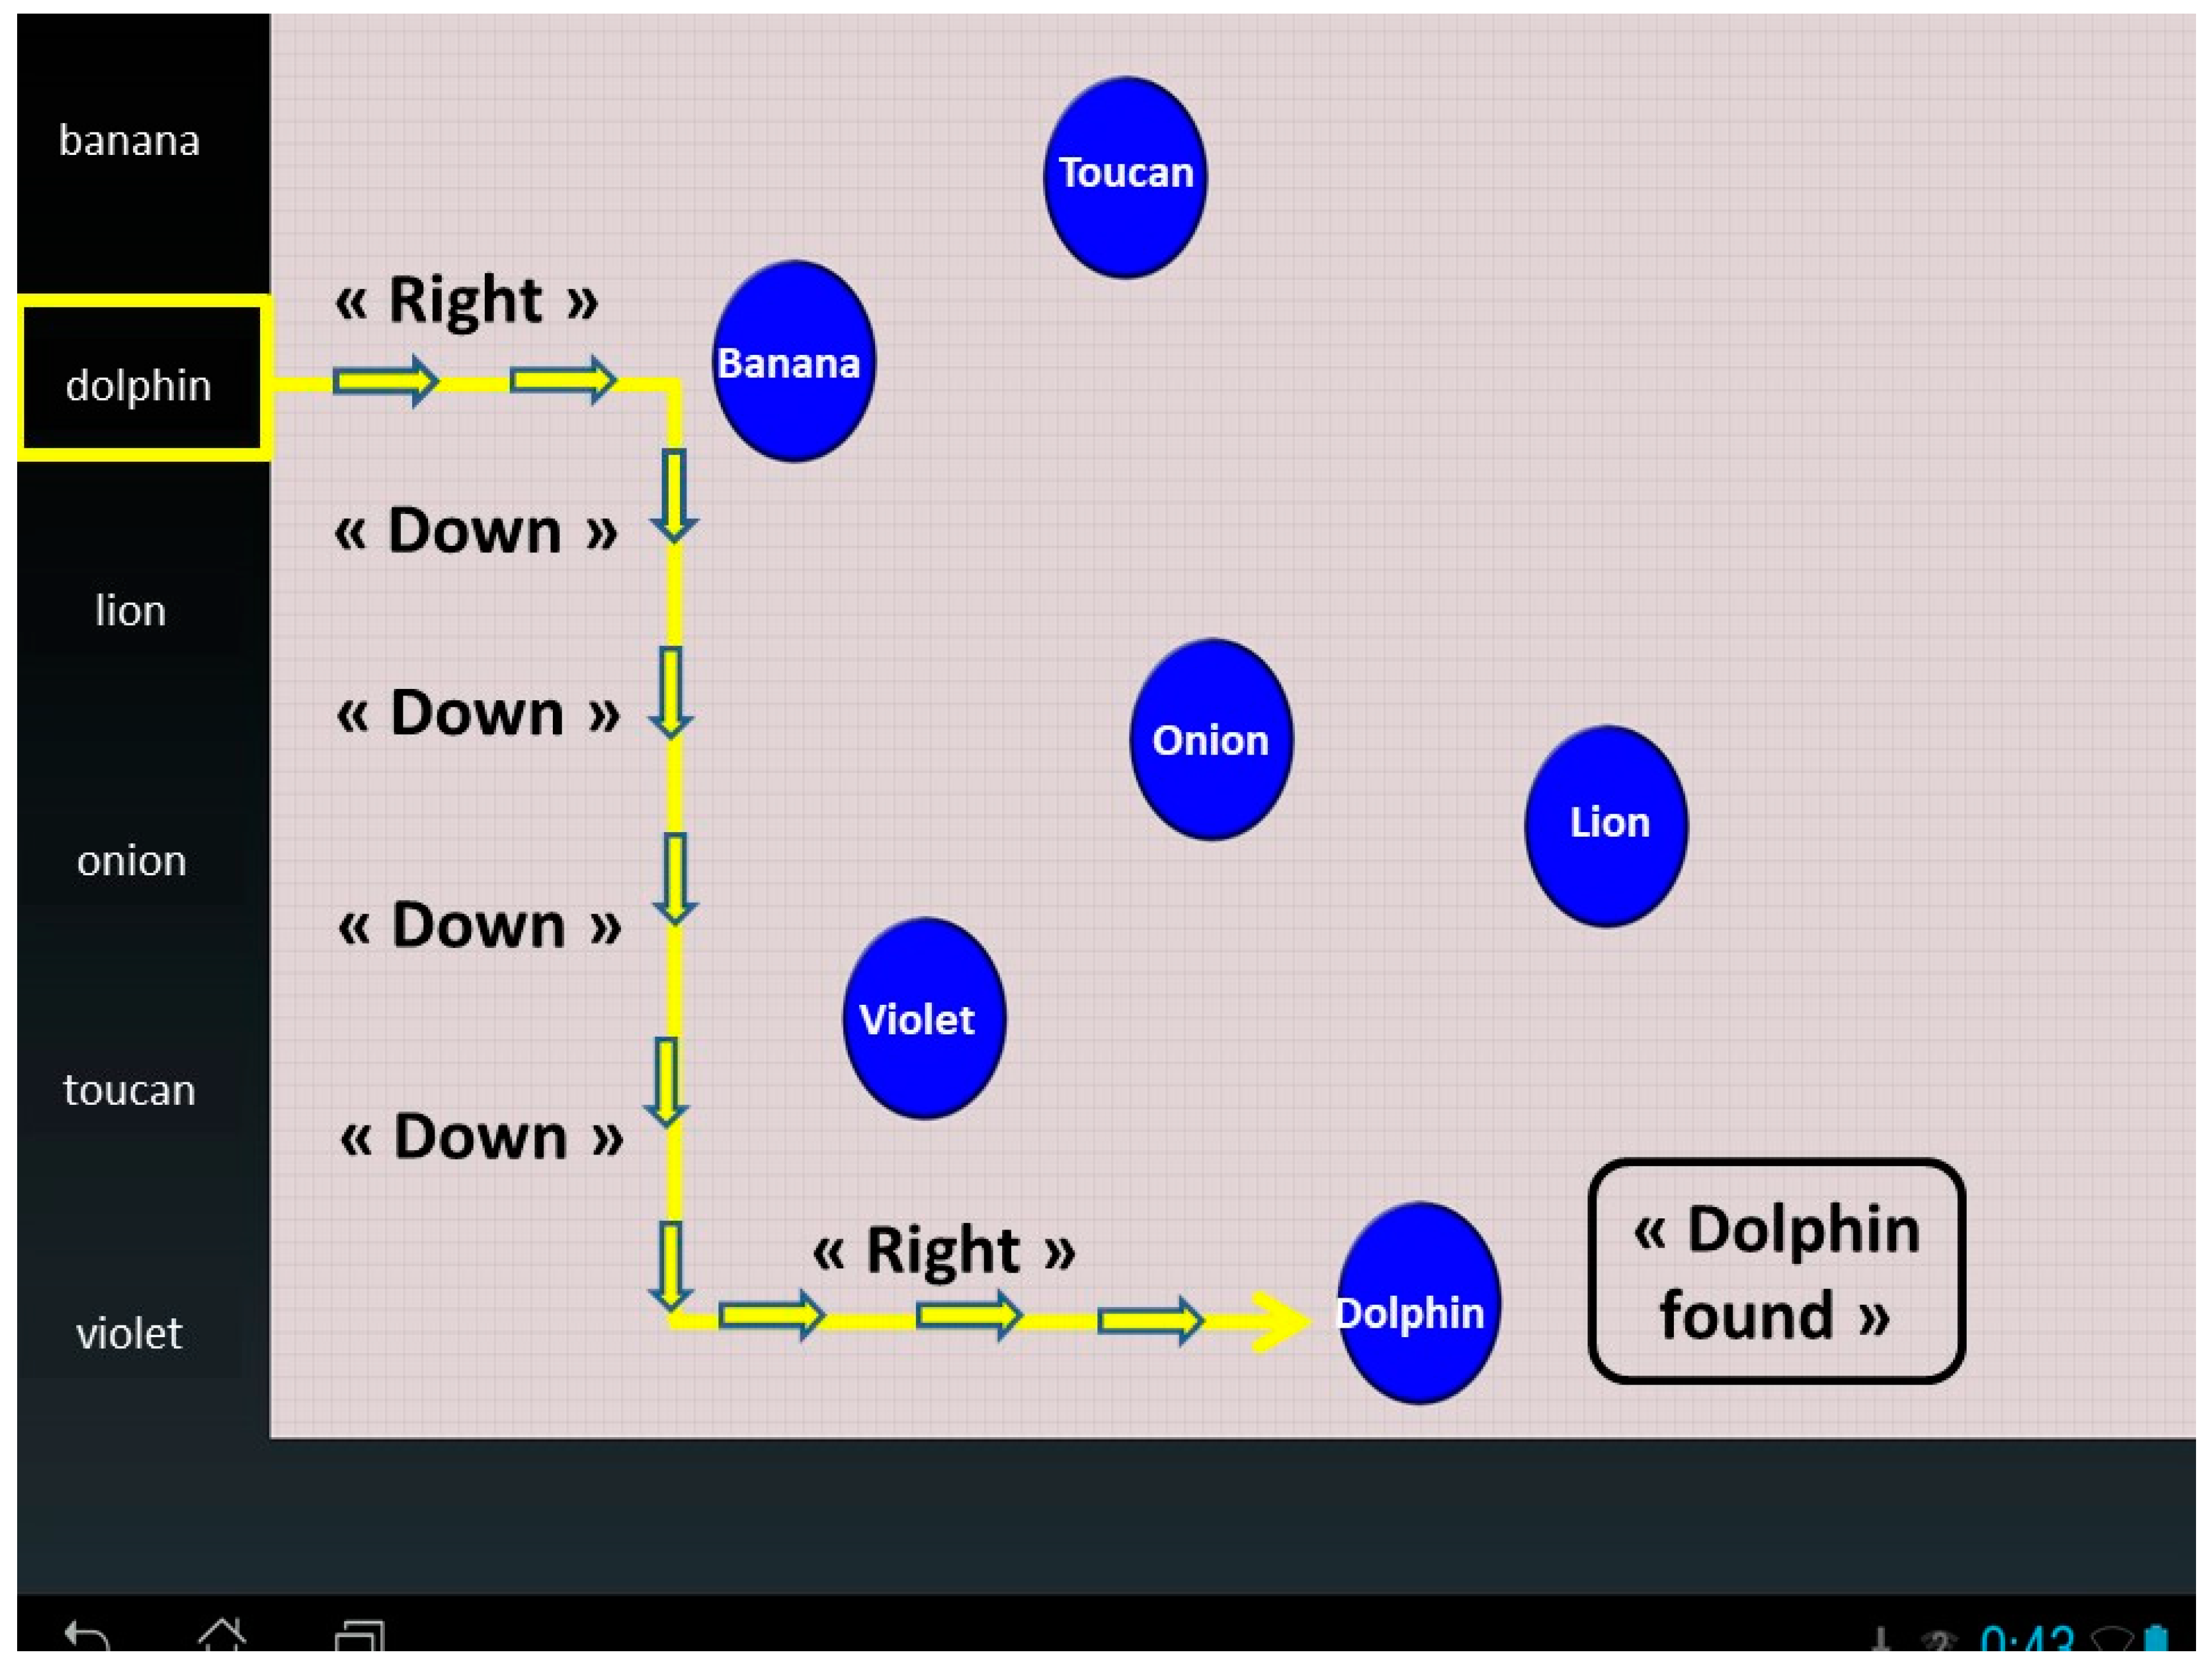
A list containing all map elements, which we refer to as points of interest (POIs), is situated along the left edge of the screen (see Figure 3) with the items listed in alphabetical order. The user activates an element on the left menu by touching it. Then, when the user moves his finger on the map zone (right side of the tablet), he is guided to the selected point by verbal indications “up”, “right”, “left”, “down” issued repetitively by the TTS. To change the selected point, he can return to the list on the left and select another point. When the participant passes over a point, he feels a vibration and the name of the element is announced by the TTS. When the participant reaches the destination, he feels a vibration and hears a message indicating “Selected point found” as well as the name of that point. A similar technique was previously proposed by Kane et al. [19] for non-visual interaction with a tabletop.

2.3.2. Edge Projection (EDP)

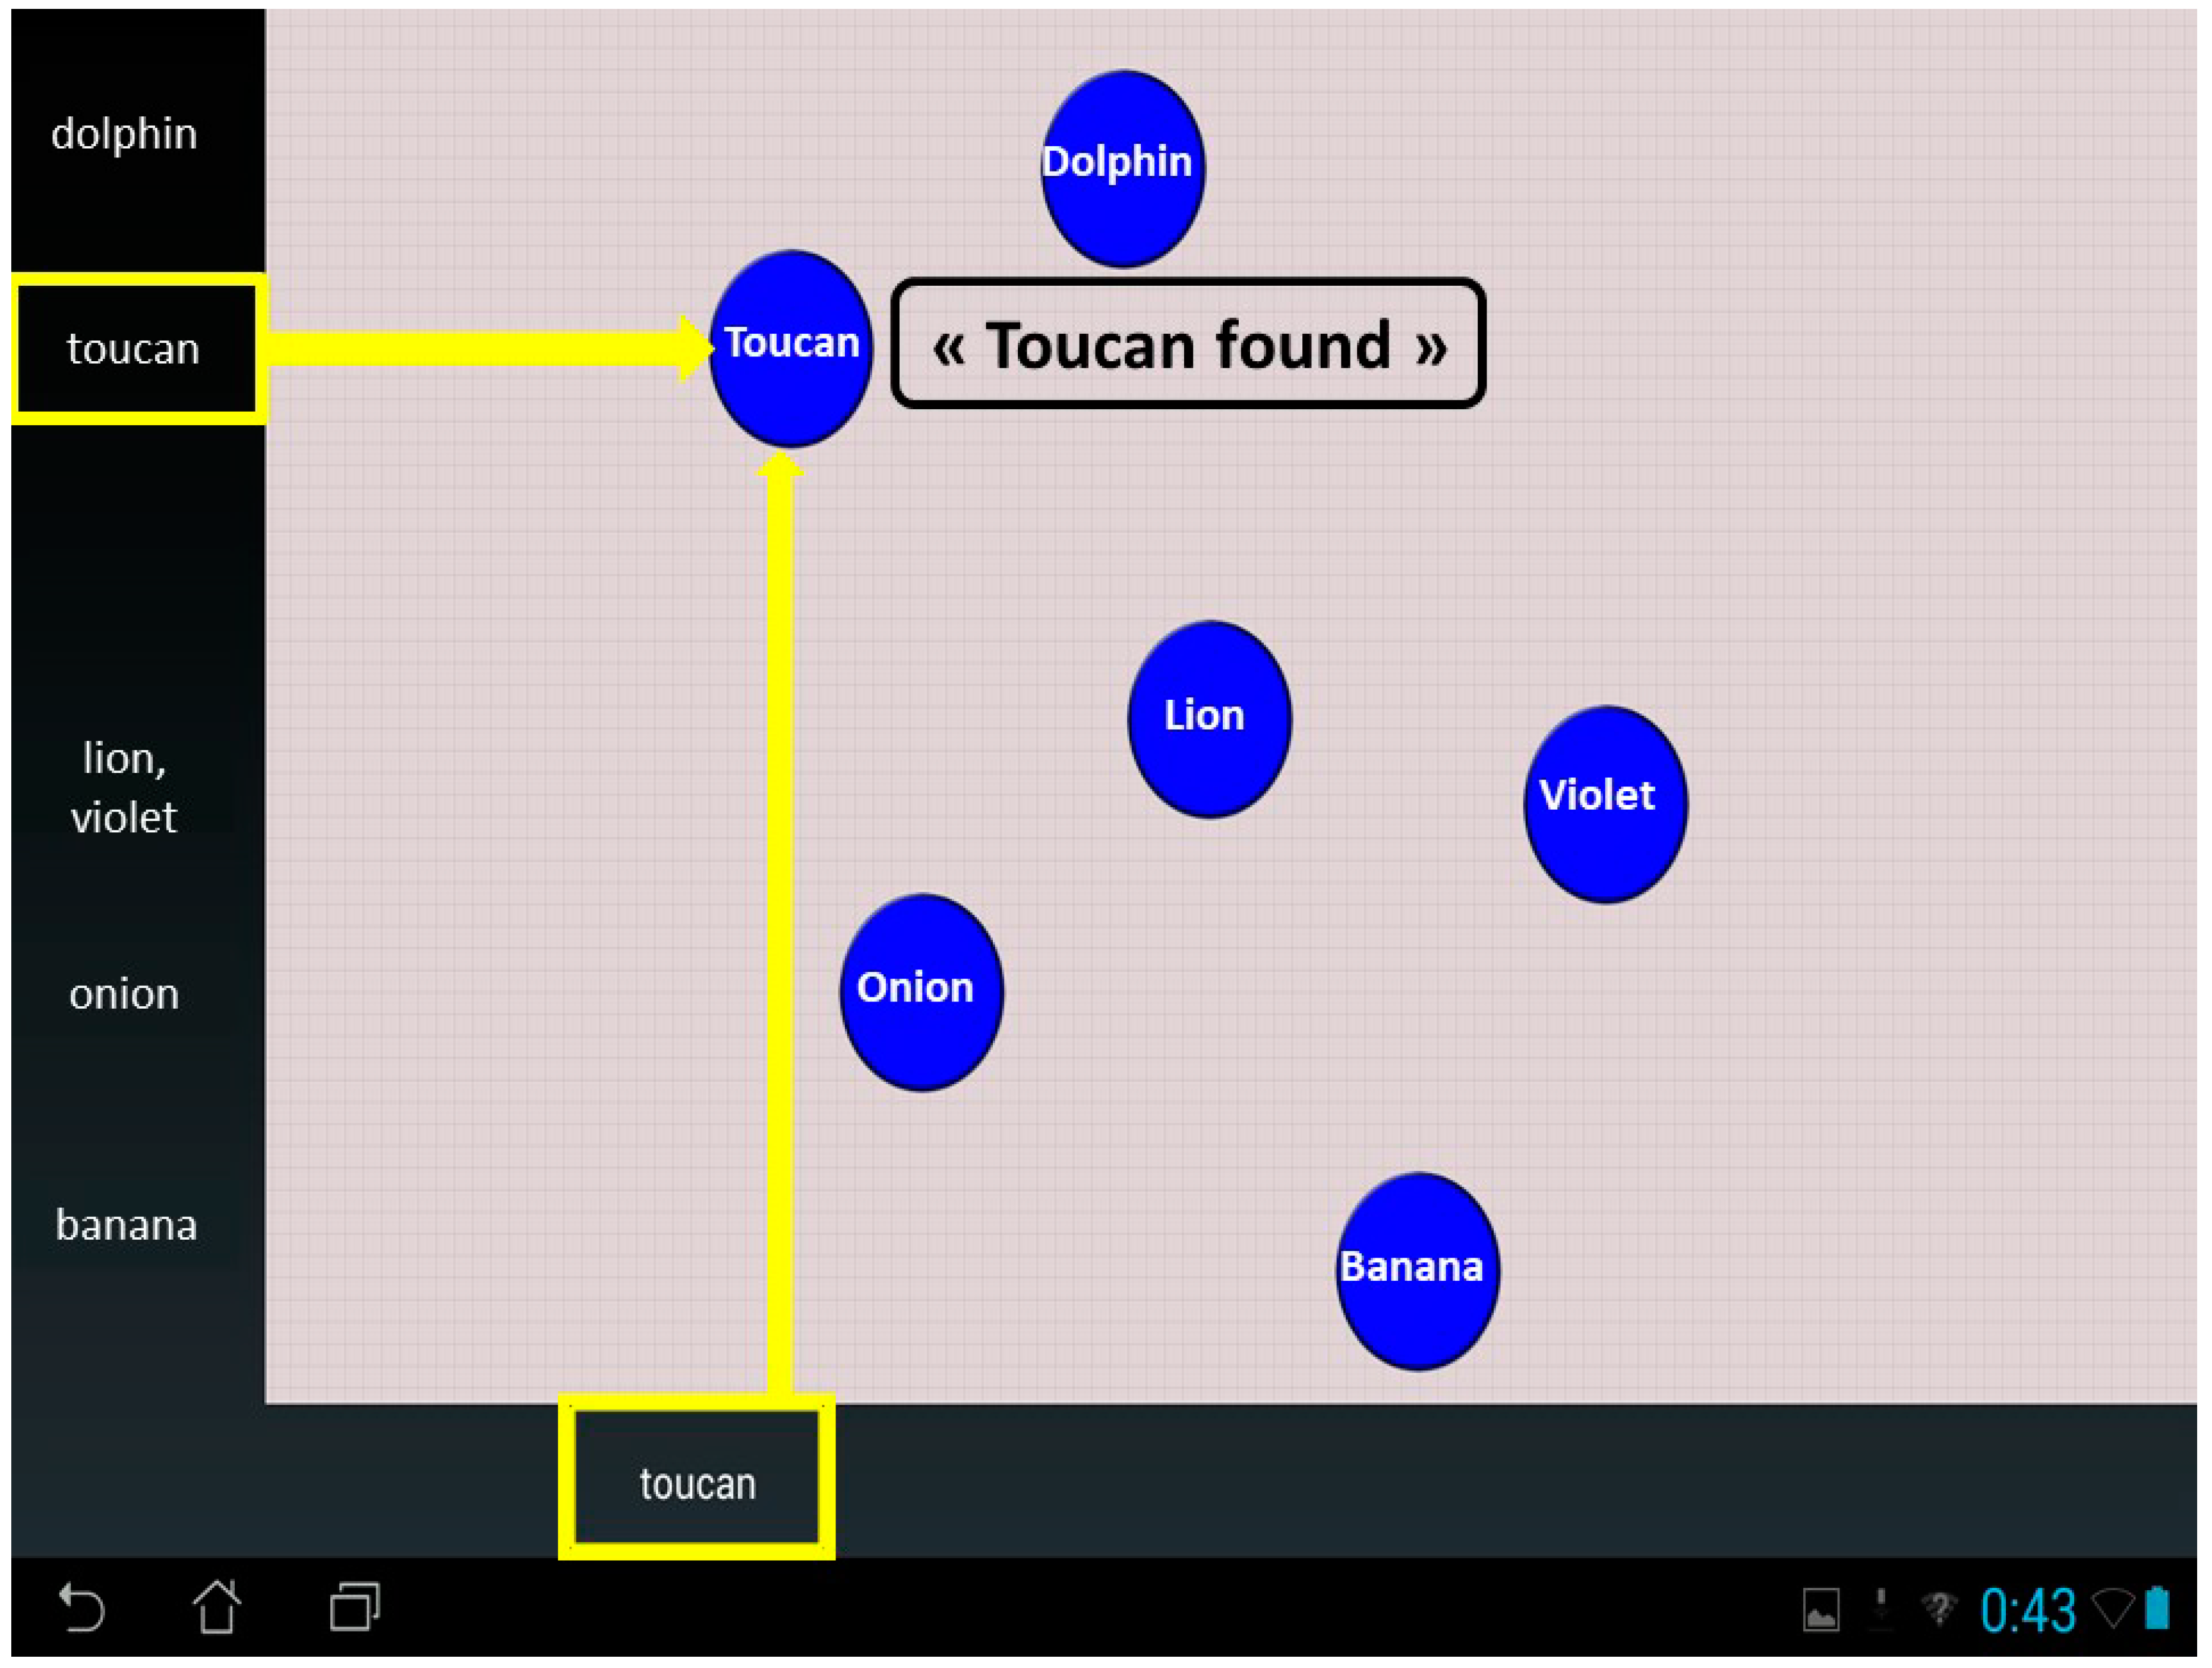
The list of POIs on the map is situated along the left edge of the screen (see Figure 4). Contrary to the DIG technique, the list is not in alphabetical order, but the position corresponds to the Y-coordinate of the POI on the map. The user can browse this list. The last point that he or she touched before removing his or her finger from the screen is remembered. This point’s X-coordinate will be displayed along the bottom edge of the tablet. The participant then explores the bottom edge of the tablet with the other hand to find it. The point can then be found at the intersection of the X and Y coordinates, which the user can identify by connecting both hands (moving one hand up and the other to the right). When the user reaches the destination, he or she feels a vibration and hears a message indicating “Selected point found” as well as the name of that point. This technique was previously proposed by Kane et al. [19] for non-visual interaction with a tabletop.

2.3.3. Grid Layout (LAY)

For this technique, the user freely explores the map with his finger without previously selecting a target point (contrary to DIG and EDP techniques). The map is divided into nine uniform zones arranged similar to a T9 phone keypad (see Figure 5). Here, left and bottom edges of the screen are inactive but remain present to maintain a homogeneous exploration space size with the other interaction techniques. When the participant moves from one zone to another by exploring the map with his finger, the zone number and the amount of POIs contained in this zone are announced by the TTS. If the participant wants to explore the zone in more detail, he can do that by making small exploratory movements within the zone without removing his finger. When the participant passes over a point, he feels a vibration and the name of the element is announced by the TTS. The subject also feels a long vibration when he is crossing the limit between two zones. We designed this interaction technique inspired by the familiar T9 keyboard, because in previous studies with blind people it has proved useful to reproduce well-known spatial layouts when possible [20]. This technique was previously used in a study by Bardot et al. [21].

2.3.4. Control (Screen-Reader like Implementation)

We implemented a screen-reader-like technique. A screen reader provides verbal feedback for elements on the screen which the user touches, but no active guidance. Therefore, the user must randomly explore the screen to find the elements. When he passes over a point, he feels a vibration and the name of the element is announced by the TTS. For this technique, as in the case of LAY technique, left and bottom edges of the screen are inactive but remain present to maintain a homogeneous exploration space size with other techniques.

2.4. Participants

We recruited six sighted blindfolded users (six male) and six legally blind users (four female, two male). Table 2 provides details about blind participants. All blind participants were screen reader users. Blind participants were recruited among students and employees of the local foundation for the blinds (CESDV-IJA, Toulouse). None of the participants had a neurological or motor dysfunction in association with the visual impairment. We verified that all participants were familiar with using the clock face for orientation (i.e., indicating straight ahead as noon, to the right as 3 o’clock, etc.)
Because this study focused on exploration and learning of spatial configurations, we evaluated participants’ mobility and orientation skills with the Santa Barbara Sense Of Direction Scale (SBSOD) [22] translated into French. In line with previous work [13], we adapted the SBSOD to the context of visual impairment. Question 5 (“I tend to think of my environment in terms of cardinal directions”) was extended to “I tend to think of my environment in terms of cardinal directions (N, S, E, W) or in terms of a clock face.” This modification was proposed because the clock face method is a popular method for orientation among the population of people with visual impairment. Question 10 (“I don’t remember routes very well while riding as a passenger in a car”) was changed to “I do not remember routes very well when I am accompanied”.
The mean score to the Santa Barbara Sense of Direction Scale was 3.97 (SD = 1.3). When looking separately at the two user groups, sighted users obtained a mean of 3.4 (SD = 1.12), and visually impaired users a mean of 4.5 (SD = 1.4). It is interesting to note that the blind subjects evaluated themselves as being above average concerning mobility and orientation and better than the sighted participants. A possible explanation is that the people with visual impairment that we selected are well-trained and rather autonomous.
All participants gave informed consent to participate in the experiment. None of the participants had seen or felt the experimental setup or been informed about the experimental purposes before the experiment. Users received a gift voucher after completion of the study.

2.5. Procedure

To facilitate transport for people with visual impairment, we met them either at the school for blind people (IJA-CESDV) or at their homes (the choice was made by the participants).
Each participant tested all four techniques (four blocks) in one session. The order of blocks was counterbalanced between subjects. Each block took approximately 20 min. Between the blocks, we asked questionnaires to avoid fatigue.
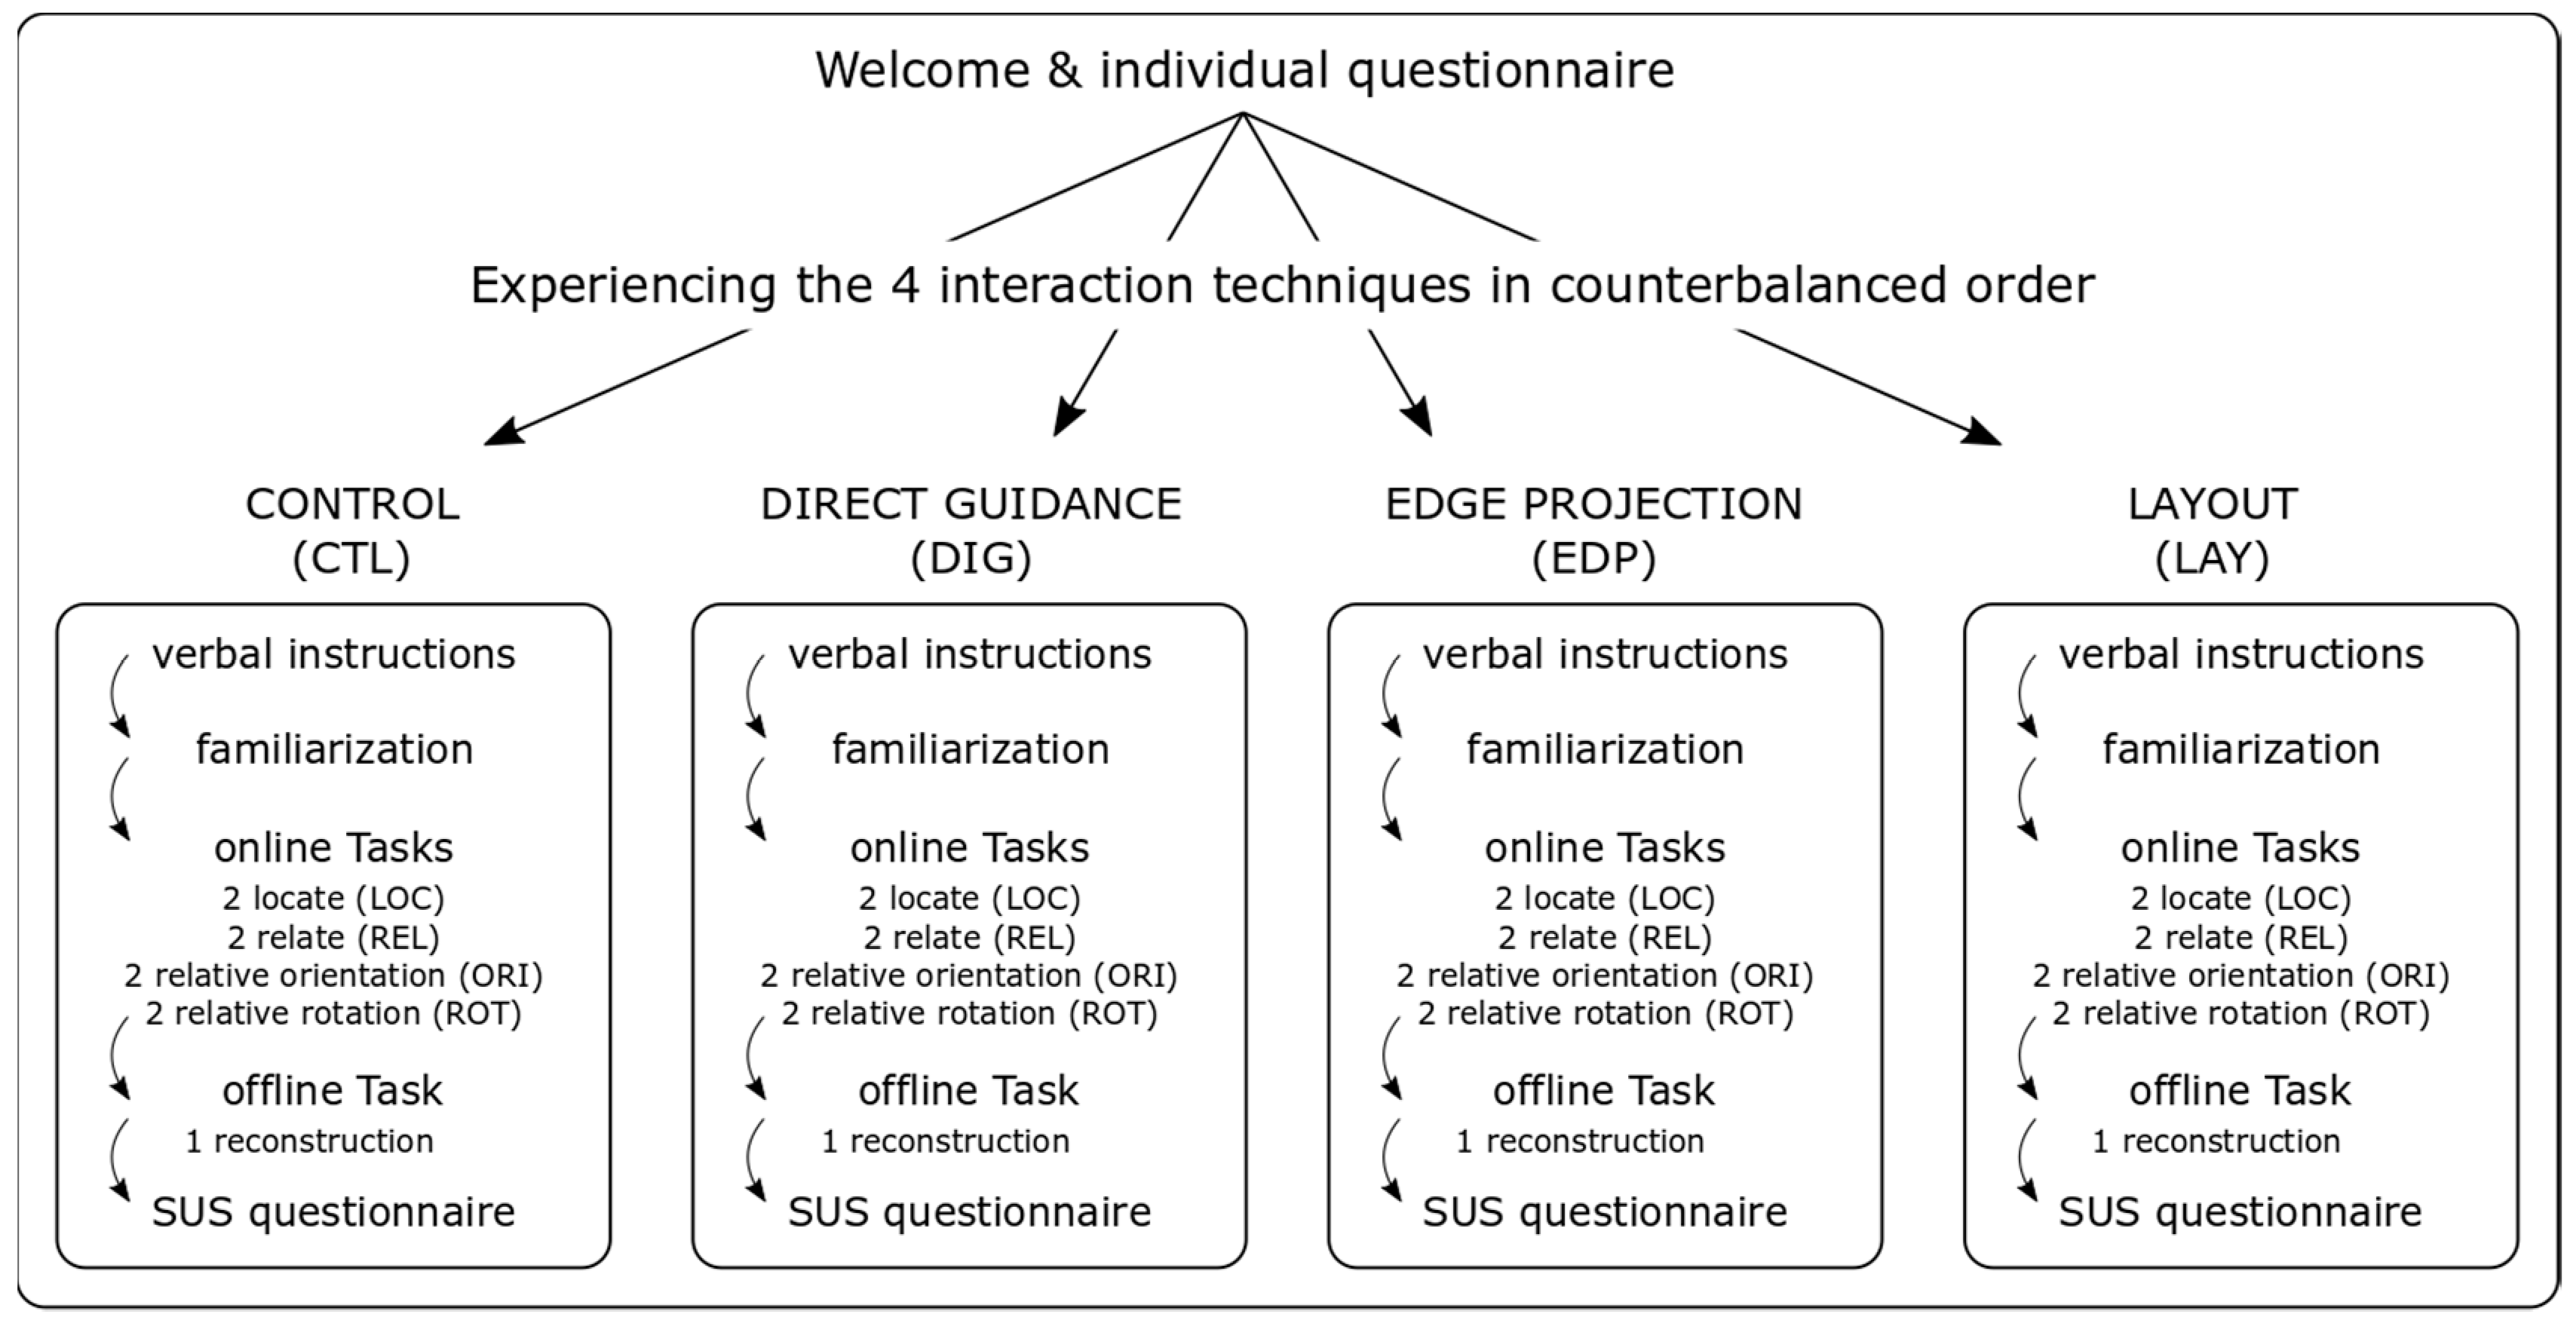
For each technique, we first gave verbal instructions on how to use it. Then, as none of the techniques except the screen reader condition was familiar, participants were free to use the technique and ask questions during the familiarization phase. After the familiarization phase, subjects had to complete two sets of tasks that were either performed online (while exploring the map) or offline (after the map exploration), similar as in [23] (see Figure 6).

2.5.1. Online Tasks

The four online tasks were:
  • Locate (LOC). The subject was required to locate a target as quickly as possible. This task was also used by Kane et al. [19]. The task was considered as complete when the participant found the target element. Response time and finger path were collected.
  • Relate (REL). The experimenter indicated the names of three targets (e.g., A, B, and C). After exploration, the participant had to indicate whether the distance between A and B was longer/smaller than the distance between A and C. Response time, correctness of the answers and finger path were collected.
  • Relative orientation (ORI). Using the clock face system, the participants had to determine the direction towards a target when being at the center of the screen, facing the North. The clock face system is a metaphor used to indicate directions, and consists of virtually placing the user in the middle of an analogue clock. The user is always facing 12:00. He would indicate 15:00 for a direction to the right side. This task has also been used by Giraud et al. [15]. Here, response time, precision (error in direction), and finger path were collected.
  • Relative orientation with a rotation (ROT). This task was similar to the previous one, except that the user had to mentally imagine that he was facing another direction than North. Consequently, he had to do a mental rotation to find the answer. This task is interesting as people with visual impairments commonly face problems performing mental rotations [24]. As with the previous task, response time, precision (error in direction), and finger path were collected.
Each online task was performed twice, leading to a total of eight online trials.

2.5.2. Offline Tasks

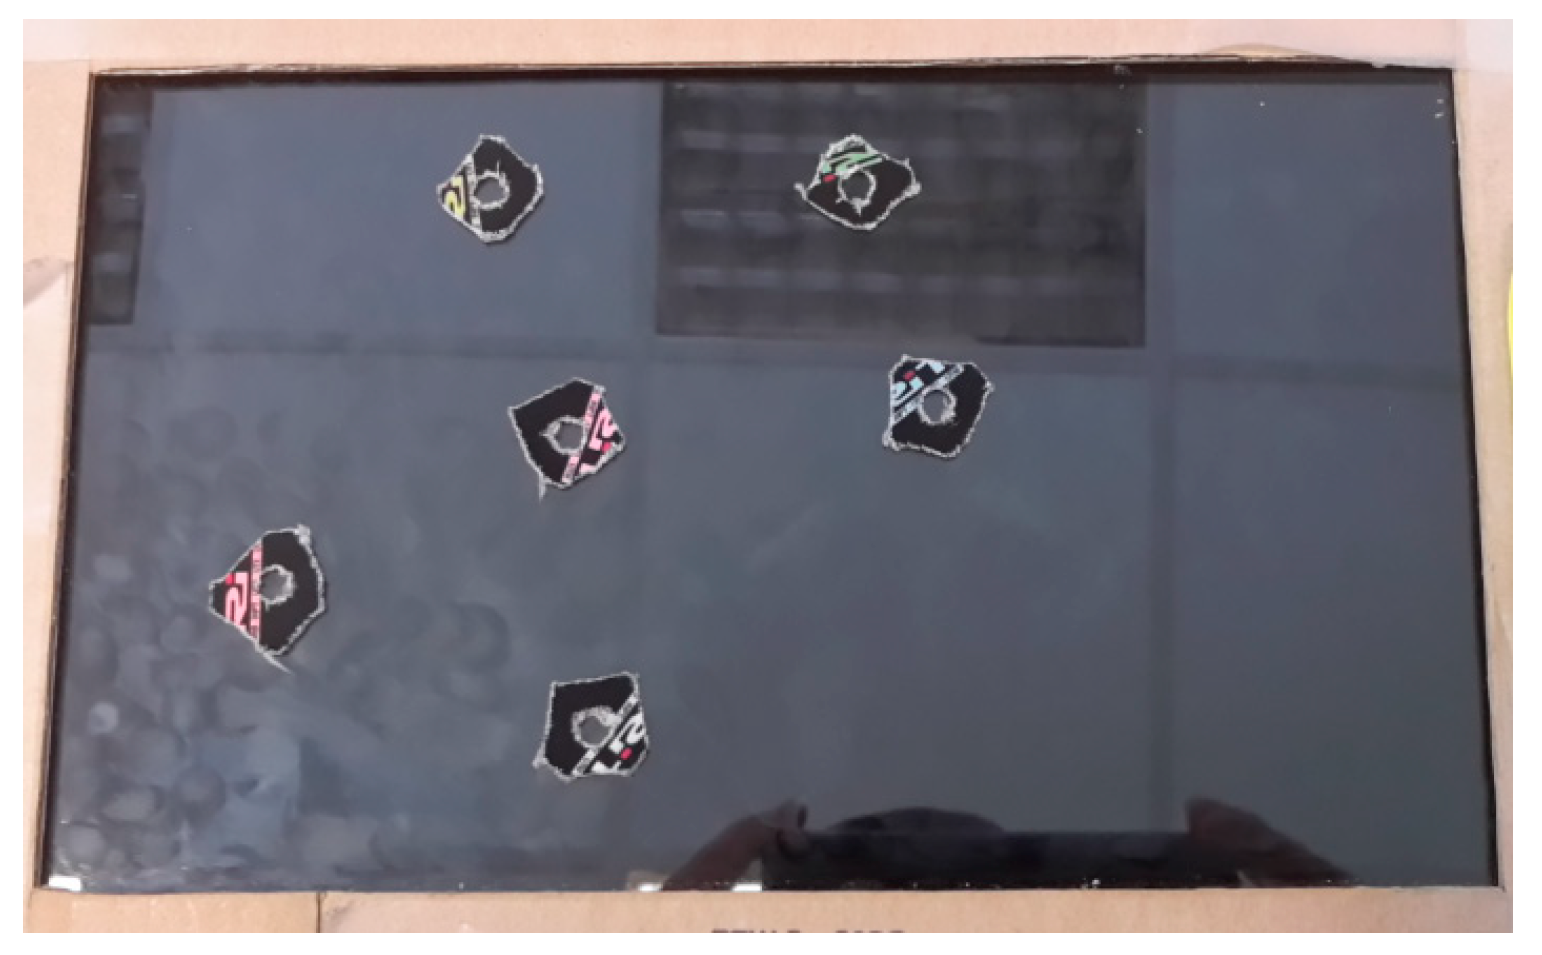
The offline task consisted in the exploration, and then reconstruction of a map. The subject had to explore an unknown map during a maximum of 15 min. He was free to stop before the end of the 15 min, and we measured exploration time. After exploration, the map was withdrawn, and the subject had to cite the name of the six POIs, and then put a sticker on the tablet (which was in sleep mode in order not to provide any verbal or tactile feedback) at the location where he believed the POIs were situated. The whole reconstruction session was recorded, and the location of the stickers was logged using the tablet as well as a photo (see Figure 7).
As mentioned above, a new map was provided before each trial, which means that the location of the POIs was different for each trial.

2.6. Variables and Statistics

After each block, participants rated the technique using a five-point Likert scale and answered the System Usability Scale [25]. As proposed by Bangor et al. [26], we replaced the word “cumbersome” with “awkward” to make Question 8 of the SUS easier to understand. As in our previous work [13], we changed the wording of Question 7 to “I think that most people with visual impairment would learn to use this product very quickly”. Questionnaires were asked verbally, and the experimenter recorded the answers in a text file.
For each condition, the manual exploration was logged. This log file contained the X- and Y- coordinates of the fingers on the screen with the corresponding time stamps. The log also contained the “events” that were triggered. With “events” we refer to a touch contact with a POI followed by a verbal announcement of the name of the POI. In the “Layout” condition, the log also gathered the number of zones that were touched by the participant. We were interested in these logs for analyzing the participants’ exploration strategies.
After all techniques had been tested, each subject provided general feedback during an open discussion. The experiments lasted between 2.5 and 4 h per subject.
The principal independent variable in our study was the interaction technique (DIG, EDP, LAY and CTL). Because the order of presentation of the four techniques was counterbalanced among participants, we did not expect the block order to have any effect on the results. Nevertheless, to assure correctness of the results, we carefully designed maps that were based on the same spatial configurations but involved different rotations of these configurations. We also carefully chose the names of the POIs as described above.
We measured usability through three factors: effectiveness, efficiency and satisfaction. Efficiency was measured as time needed for exploring the map (online and offline tasks), answering the questions (online task), and reconstructing the map (offline task). Subjective satisfaction was evaluated with the SUS questionnaire [25] as well as qualitative questions. Effectiveness of online tasks was measured as error and success rate for REL, and as precision of answers (i.e., direction errors) for ORI and ROT. Subjects could obtain a maximum of eight correct answers. More specifically, we wanted to assess landmark and survey knowledge [17]. Similar to Kane et al. [19], we used different tasks for the online condition, however we modified the tasks proposed in their study to improve the measures of spatial cognition (direction, distances and mental rotations), as described above. For the offline task, we measured the similarity between the initial and the reconstructed maps [27].

3. Results

3.1. Online Tasks

Each of the 12 participants performed location (LOC), relate (REL), orientation (ORI) and orientation with rotation (ROT) tasks twice for each of the four interaction techniques. Thus, we analyzed a sample of 12 × 4 × 2 × 4 = 384 response times.

3.1.1. Location Task (LOC) Efficiency

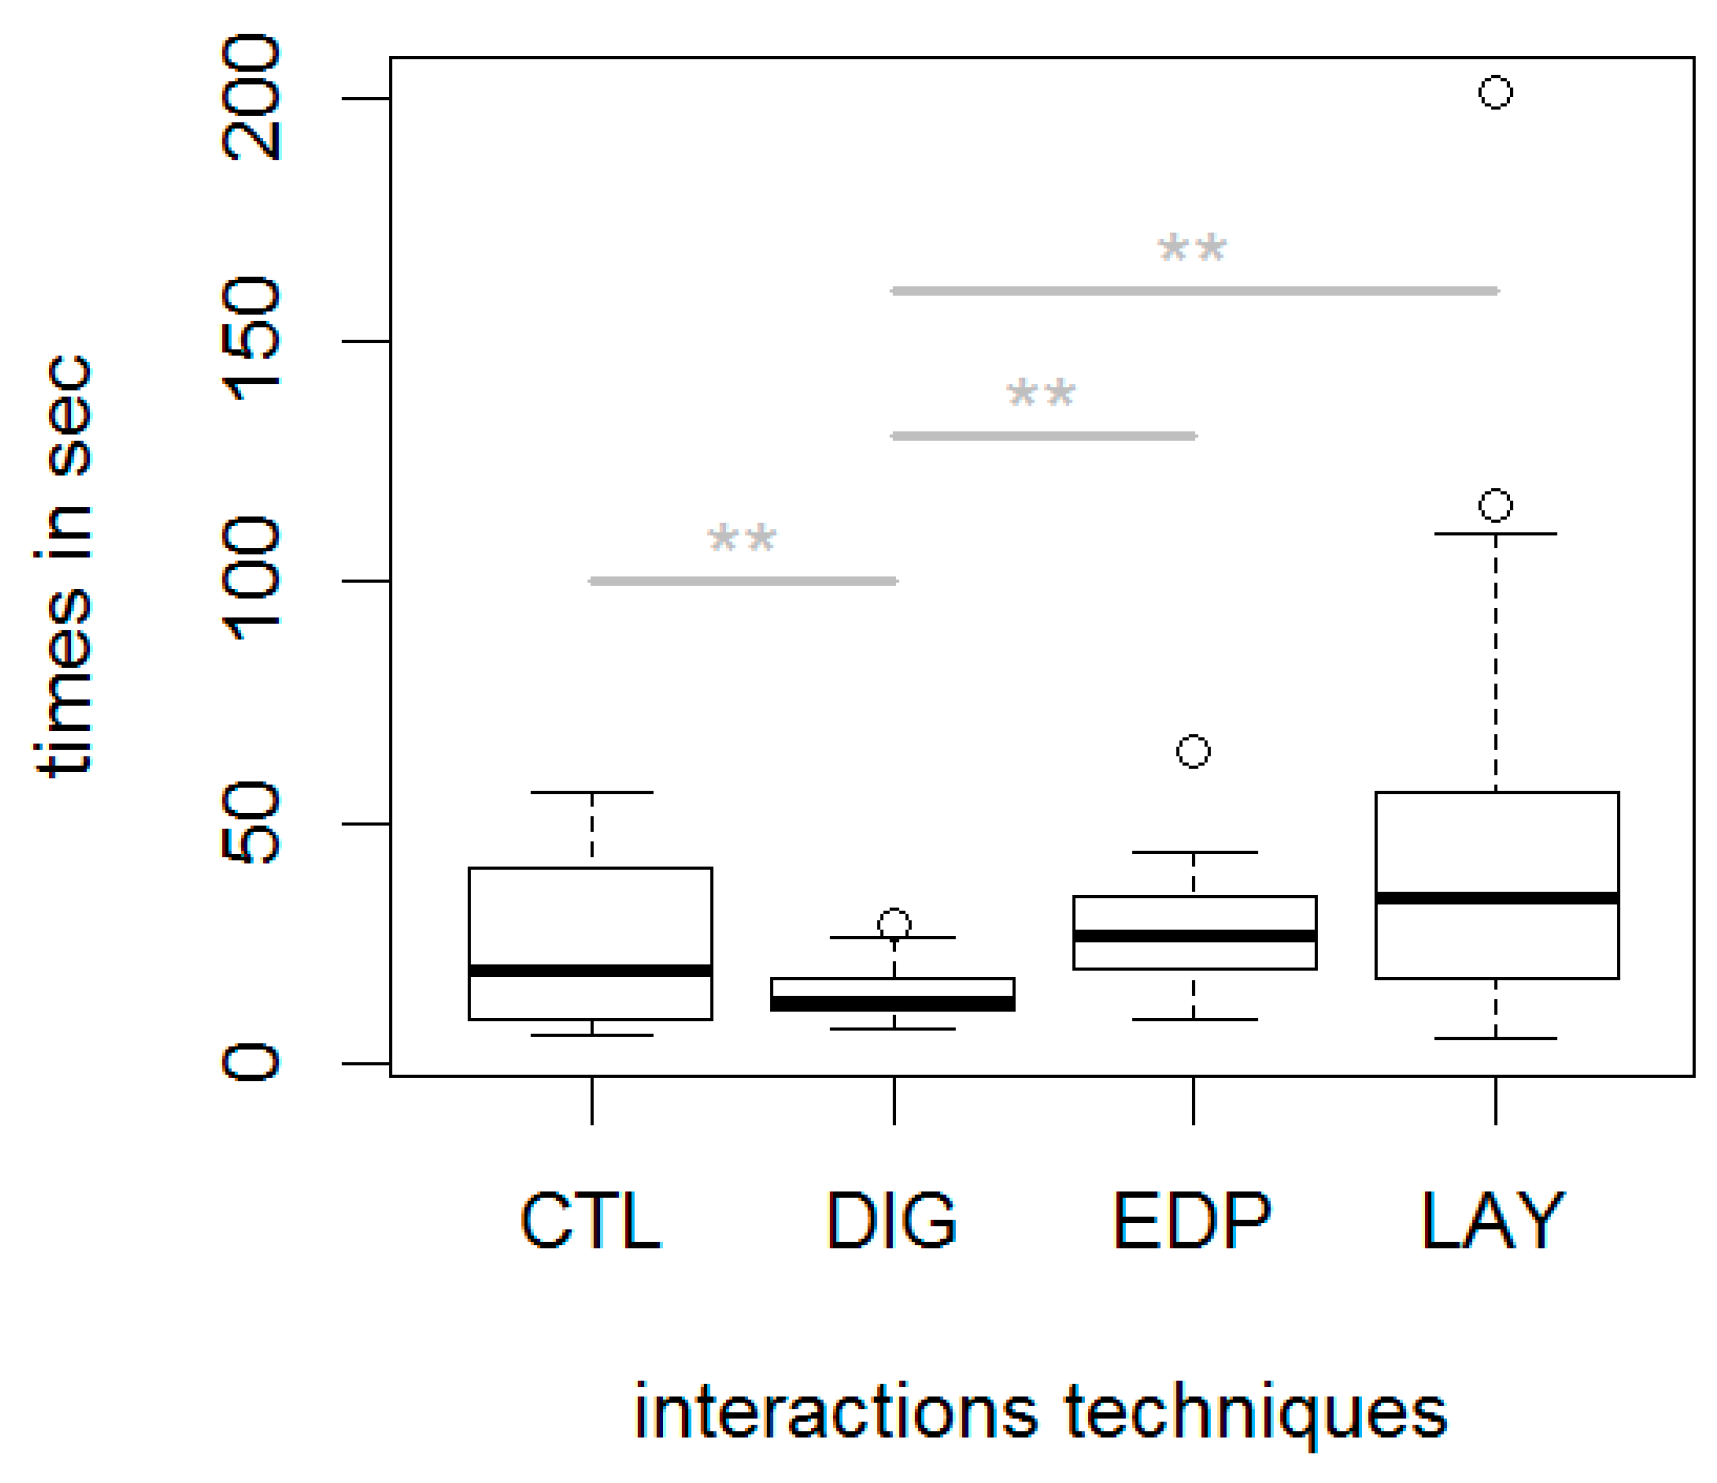
Focusing on the location task, the distribution of the 96 response times to find the target element was not normal (Shapiro–Wilk, W = 0.67, p < 0.01). Thus, the two-by-two Wilcoxon paired analysis showed the following results: DIG (Median (Me) = 13 s) was significantly quicker (V(23) = 223, p < 0.01) than CTL (Me = 19 s); significantly quicker (V(23) = 19.5, p < 0.01) than EDP (Me = 26 s); and significantly quicker (V(23) = 26, p < 0.01) than LAY (Me = 34 s). No other significant difference was found (see Figure 8).

3.1.2. Relate Task (REL) Efficiency

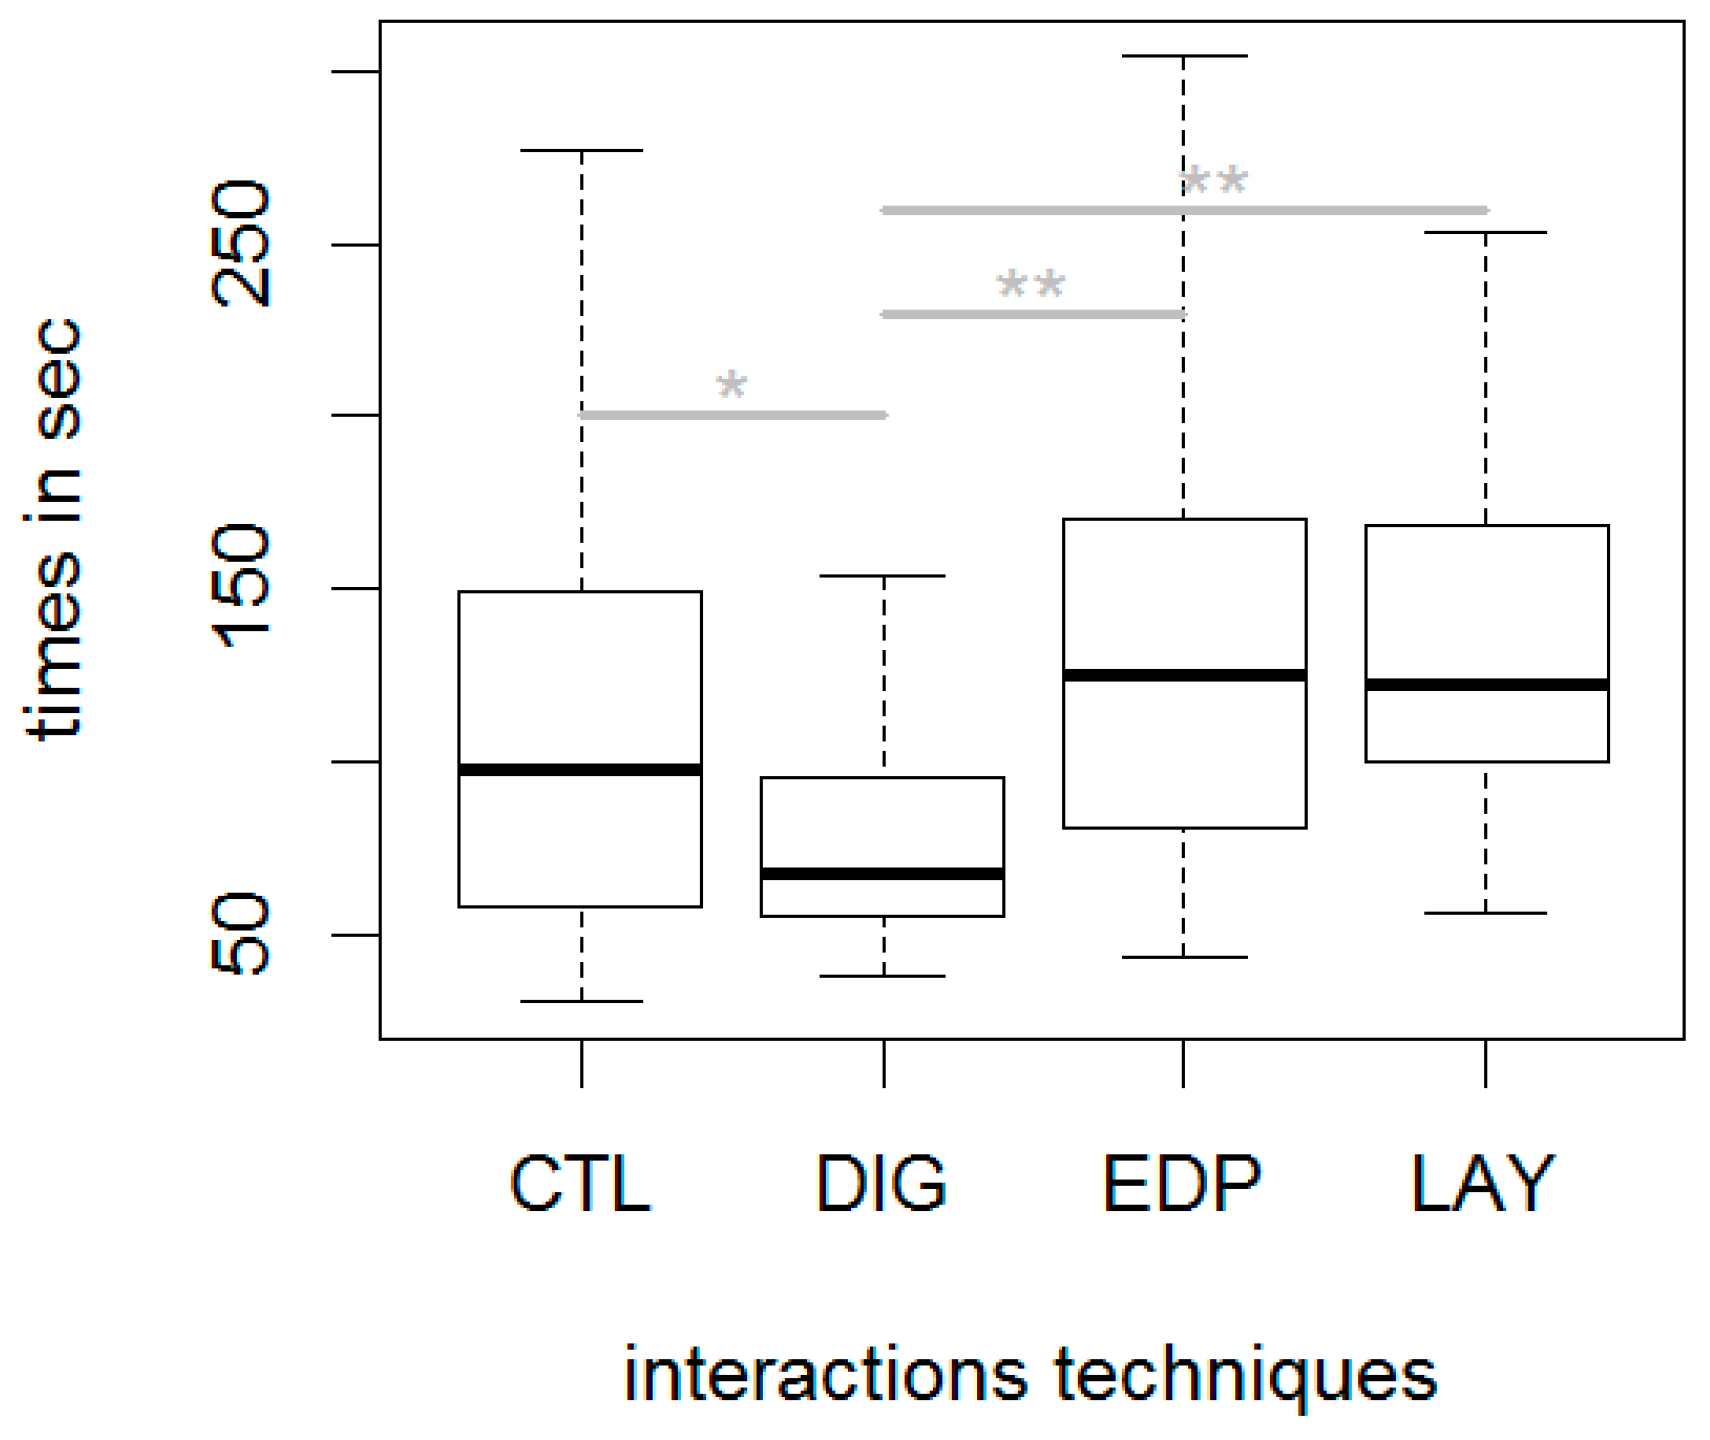
The distribution of the 96 response times to evaluate the distance relationship between two target elements was not normal (Shapiro–Wilk, W = 0.93, p < 0.01). The two-by-two Wilcoxon paired analysis showed the following results (see Figure 9): DIG (Me = 67 s) was significantly quicker (V(23) = 166, p < 0.05) than CTL (Me = 98 s). DIG was significantly quicker (V(23) = 6, p < 0.01) than EDP (125 s). DIG was also significantly quicker (V(23) = 5.5, p < 0.01) than LAY (Me = 121 s).

3.1.3. Relative Orientation Task (ORI) Efficiency

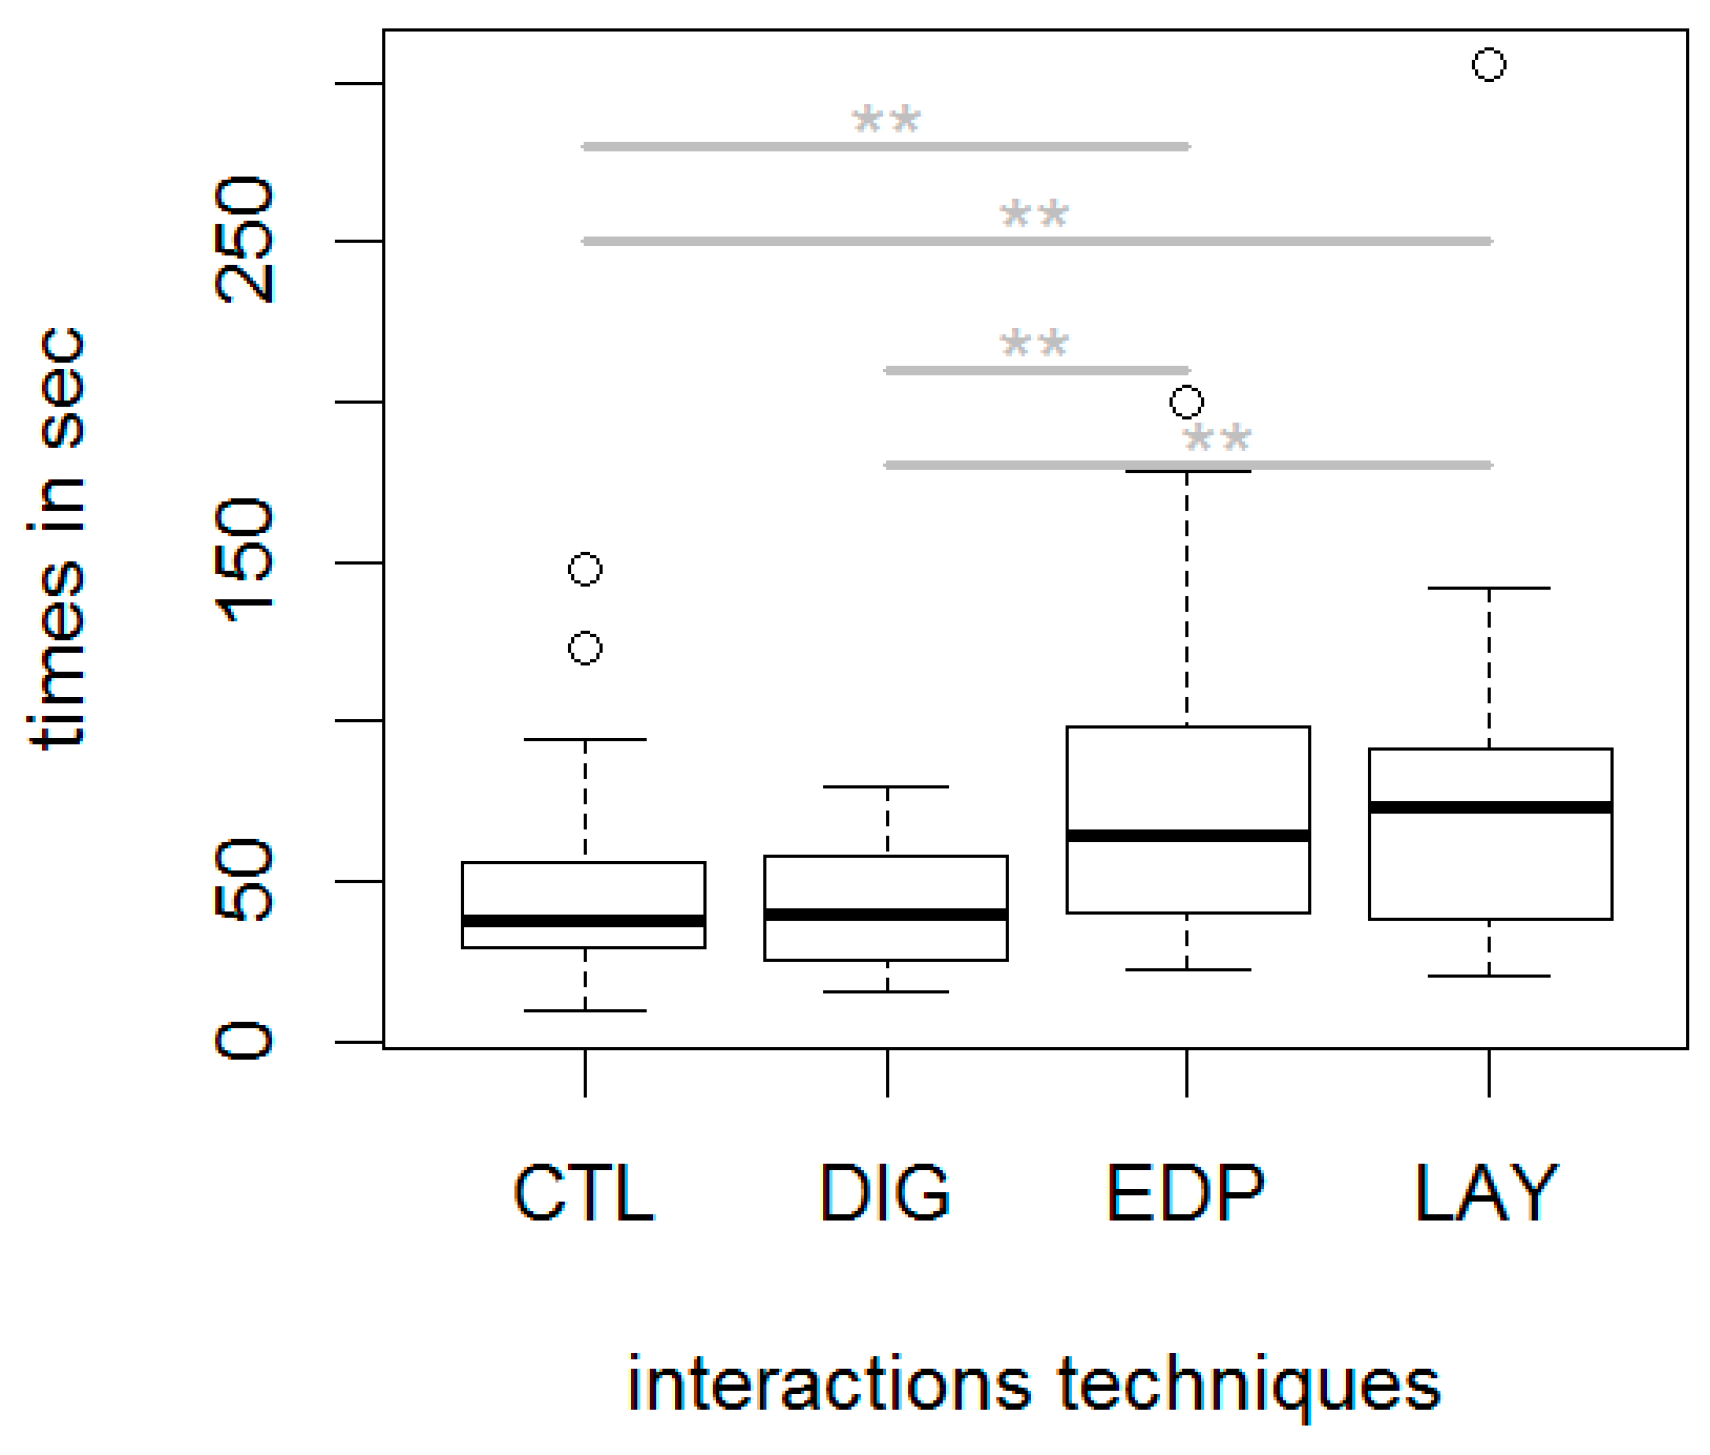
The distribution of the 96 response times to evaluate the relative orientation task when facing north was not normal (Shapiro–Wilk W = 0.78, p < 0.01). The two-by-two Wilcoxon paired analysis showed the following results: CTL (Me = 37 s) was significantly quicker (V(23) = 48, p < 0.01) than EDP (Me = 64 s) and significantly quicker (V(23) = 6, p < 0.05) than LAY (73 s). DIG (Me = 39 s) was significantly quicker (V(23) = 24.5, p < 0.01) than EDP and significantly quicker (V(23) = 51, p < 0.01) than LAY. There was no significant difference between CTL and DIG (see Figure 10).

3.1.4. Relative Orientation Task with Mental Rotation (ROT) Efficiency

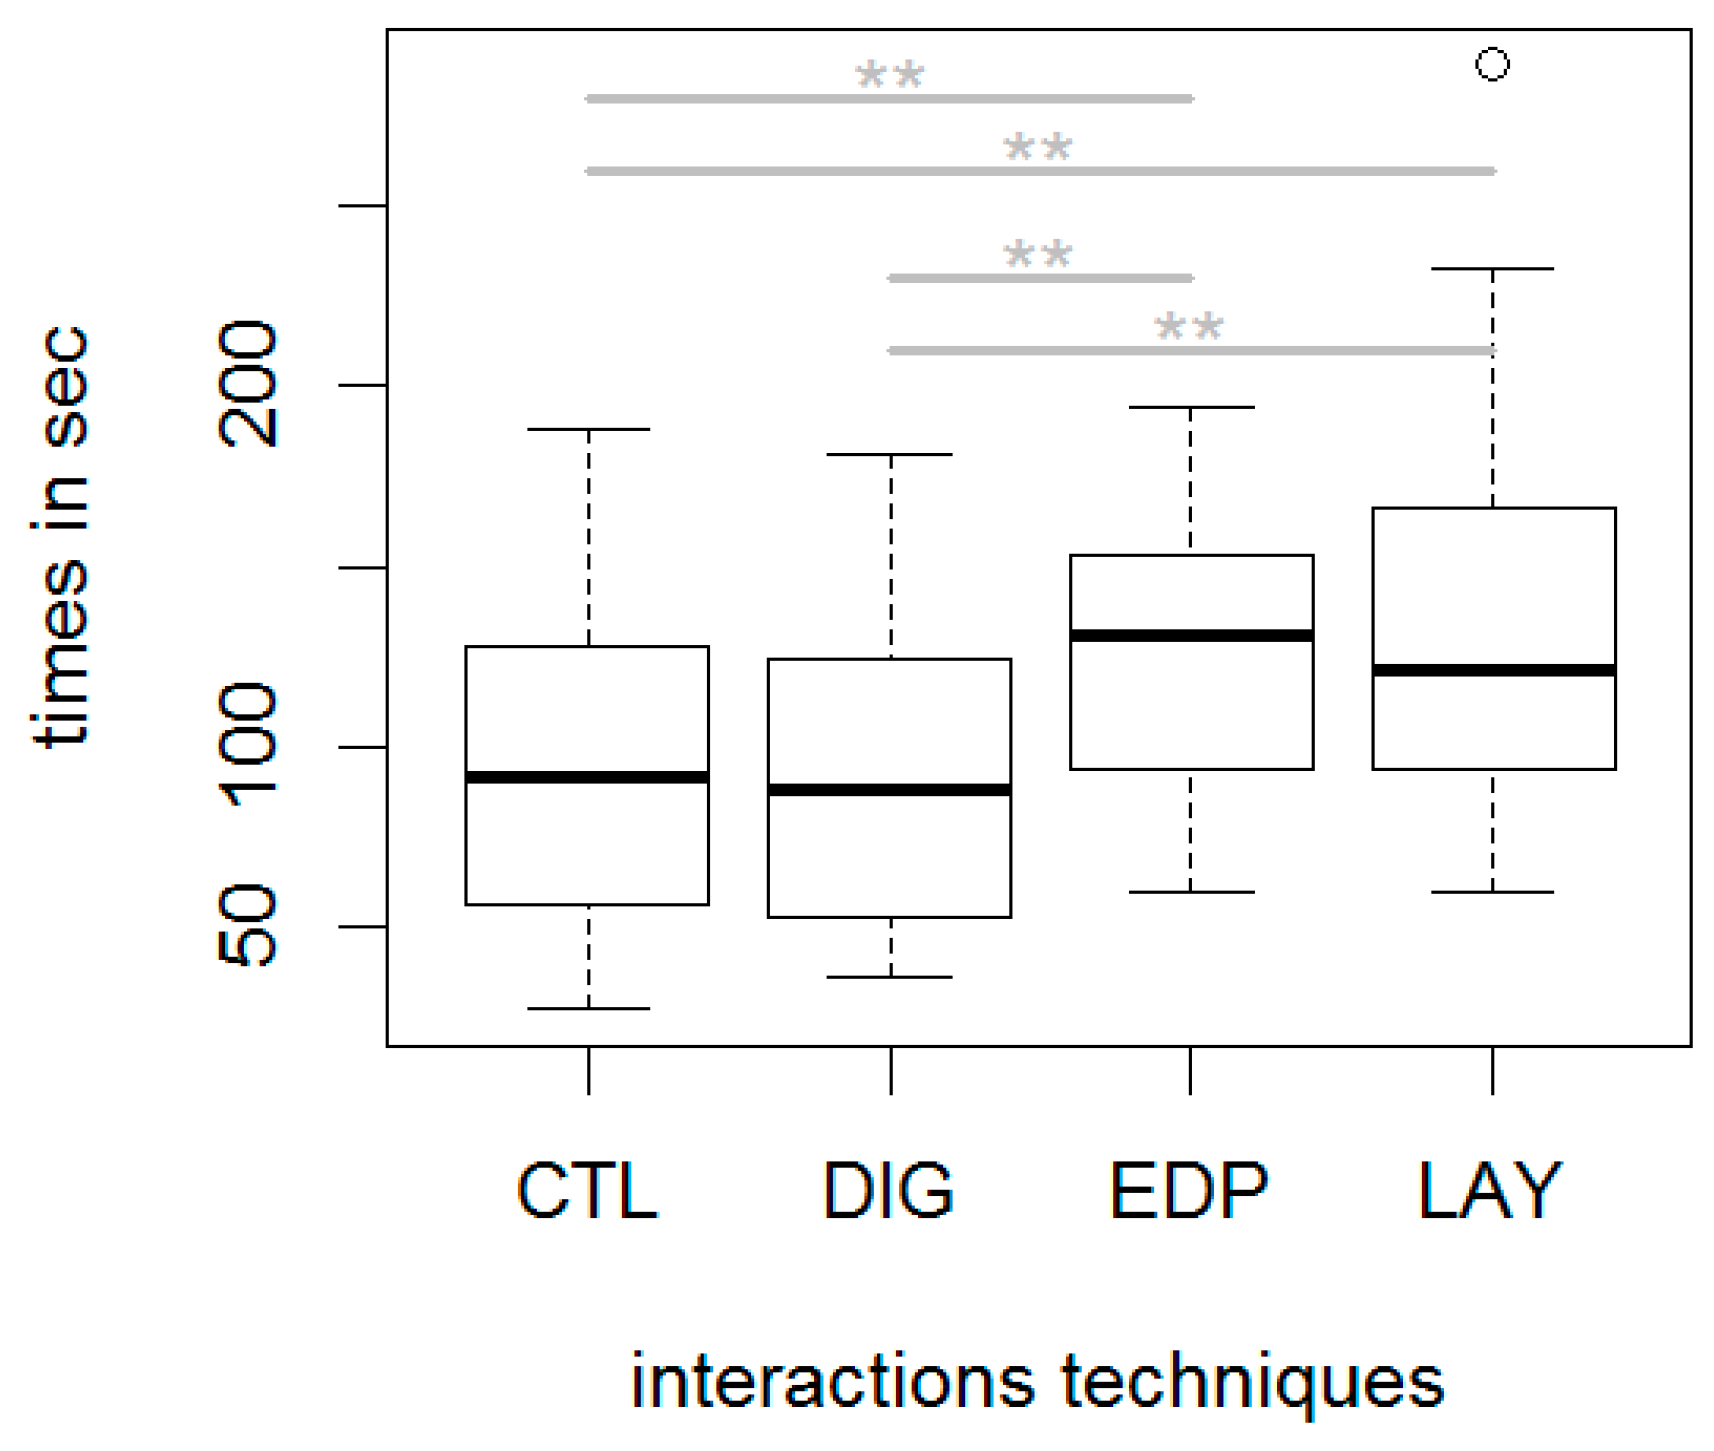
The distribution of the 96 response times to evaluate the orientation relationship between two targeted elements after a mental rotation was not normal (Shapiro–Wilk, W = 0.96, p < 0.05). The two-by-two Wilcoxon paired analysis was conducted and showed the following results: CTL (Me = 92 s) was significantly quicker (V(23) = 54.5, p < 0.01) than EDP (Me = 131 s) and significantly quicker (V(23) = 58.5, p < 0.05) than LAY (121 s). DIG (Me = 88 s) was significantly quicker (V(23) = 56, p < 0.01) than EDP and significantly quicker (V(23) = 39, p < 0.01) than LAY (see Figure 11).
Altogether, the previous results on the response times lead to concluding that direct guidance technique (DIG) is quicker than all other techniques.

3.1.5. Effectiveness of the Different Tasks

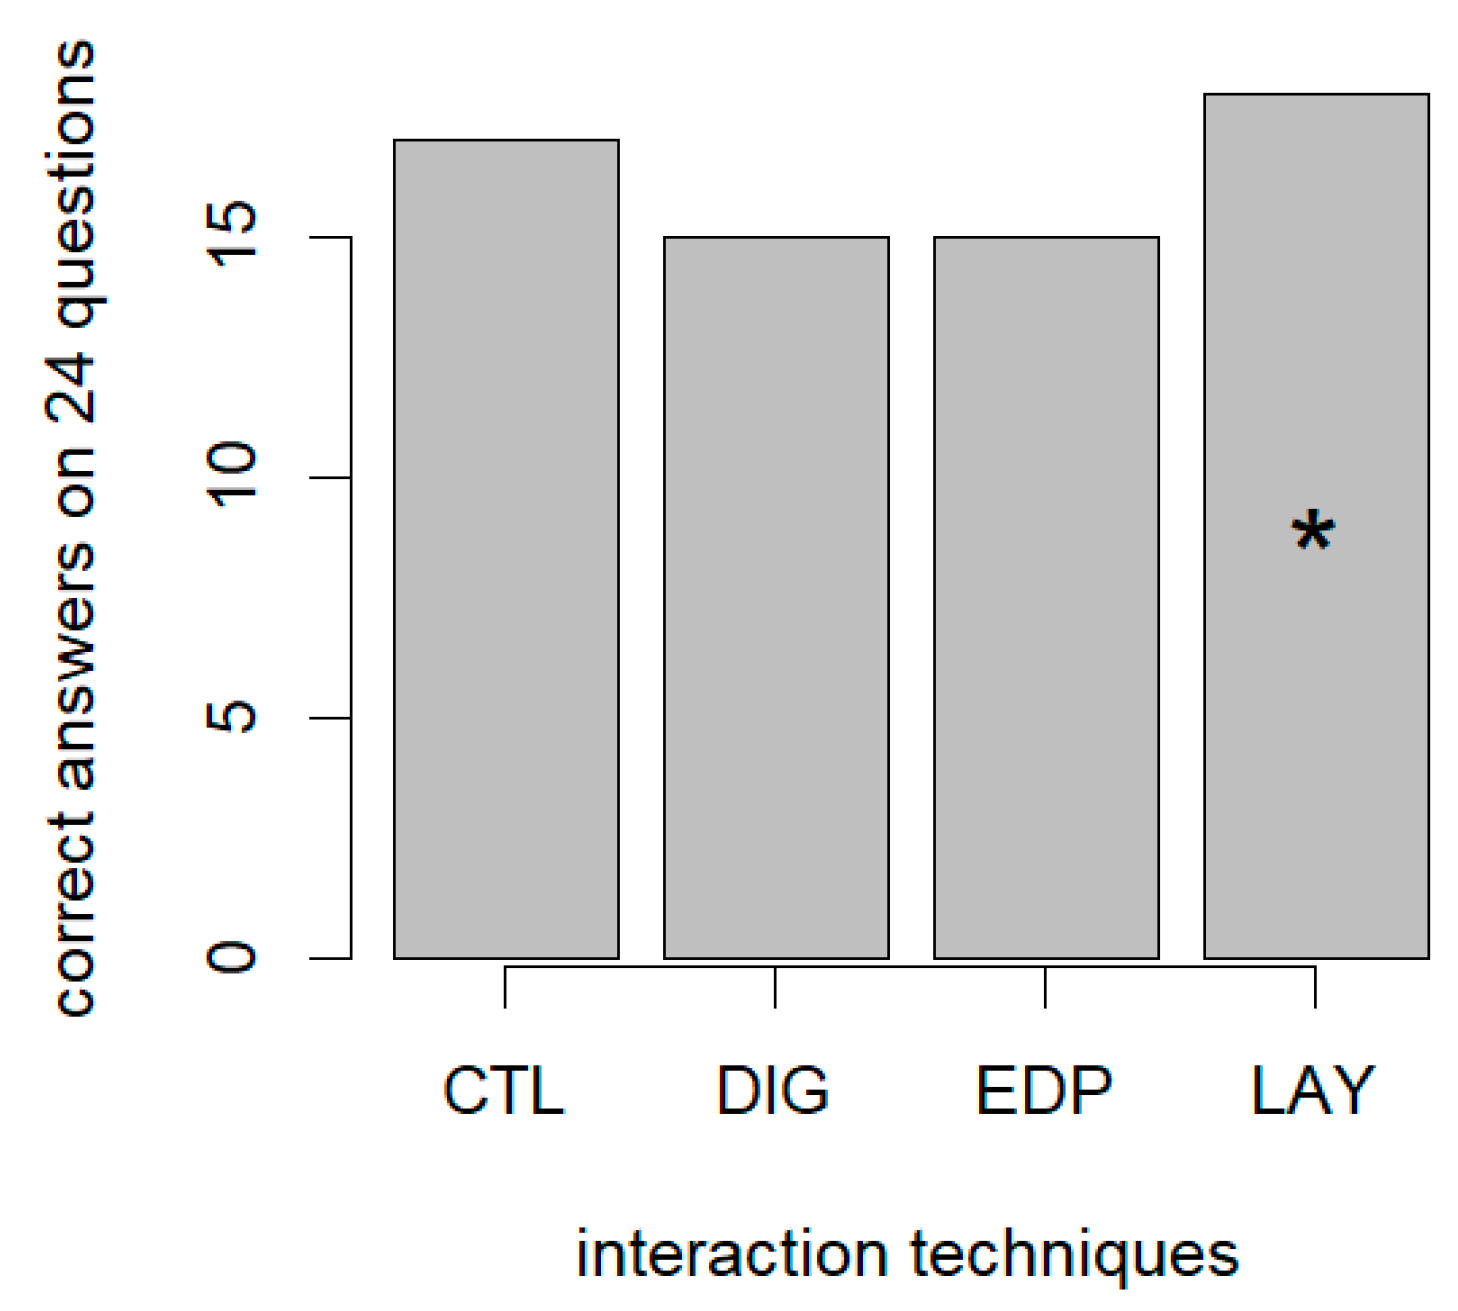
Concerning the effectiveness to execute the tasks, none of the analysis revealed any significant difference between interaction techniques. The only observable result concerns the relate task (REL), where the binomial analysis of the right/wrong answers showed that correct answers for LAY (18/24) were significantly different from chance (p < 0.05) with a probability of success of 75% (see Figure 12). This result shows that participants assessed relative distances more precisely when they were exploring the map with the LAY technique. A grid-like representation might therefore be beneficial for acquiring a mental representation of space.

3.1.6. Synthesis for the Online Tasks

In summary, the results for online tasks (see Table 3) show that the Direct Guidance (DIG) technique is quicker than the other techniques, and that the LAY technique is more effective for estimating relative distances (and thus spatial configurations).

3.2. Offline Task

Due to log extraction issues and technical problems with data collection, the results from Participants 1 and 7 were incomplete. Thus, only the results of 10 participants were analyzed (five sighted people with blindfold: P02, P03, P04, P05, and P06; and five blind people: P08, P09, P10, P11, P12, and P13).

3.2.1. Exploration Time Observed before the Offline Task

To compare the times spent to explore the map, a global ANOVA F-test was used since sample distribution was normal (Shapiro–Wilk, W = 0.97, p > 0.05). DIG and EDP, respectively, took 359 and 325 s on average. LAY and CTL, respectively, took 280 and 288 s on average. However no significant differences were found between the techniques (F(3,44) = 1.33, p > 0.05).

3.2.2. Exploration Distance Observed before the Offline Task

We also analyzed the length of the exploratory traces for each interaction technique. This sample of results did not follow a normal distribution (Shapiro–Wilk, W = 0.15: p < 0.01). Here, the two-by-two paired Wilcoxon-test analysis revealed shorter exploration traces (V(9) = 92, p < 0.01) in LAY (Me = 7.7) than in CTL (Me = 16.6) conditions, and shorter traces (V(9) = 81, p < 0.05) in LAY than in DIG (Me = 14.6) conditions. There was no significant difference between EDP and LAY.

3.2.3. Back-and-Forth Strategy

During exploration, we identified how many times back-and-forth strategies [8] appeared. More precisely, we counted one back-and-forth movement when the participant touched element A, then element B, and element A anew. A Kruskal–Wallis test rejected the null hypothesis (H(3) = 12.87, p < 0.01). A two by two paired Wilcoxon test revealed that participants used more back-and-forth strategies in CTL (Me = 12.5) than in LAY (Me = 2) conditions (V(9) = 55, p < 0.01). We also found that participants used more back-and-forth strategies in EDP (Me = 7.5) than in LAY (Me = 2) conditions (V(9) = 49.5, p < 0.05).

3.2.4. Cyclic Strategy

The cyclic strategy consists in touching successively each element of the configuration, and finally returning to the first element. The Kruskal–Wallis test revealed a difference (H(3) = 8.39, p < 0.05) of cyclic strategies between conditions. More precisely, we found that participants use more cyclic strategies in DIG than in LAY condition (V(9) = 21, p < 0.05).

3.2.5. Point of Reference Strategy

The point of reference strategy [10] is a star-like pattern assuming that the participant considered a specific element as a reference in the layout. He is then doing A-B-A-C(-A-D) movements to relate the different elements in the layout. A statistical analysis highlighted that participants used more patterns with two reference points (V(9) = 40, p < 0.05) in CTL (Me = 2) than in LAY (Me = 0), and more patterns with three reference points (V(9) = 34, p < 0.05) in CTL (Me = 3) than in LAY (Me = 0.5).

3.2.6. Visual Status Influence on Observed Exploration Strategies

The only difference between blind and blindfolded sighted people in our study was that sighted people (Me = 1) used more often (p < 0.05) than blind people (Me = 0) patterns with four reference points.

3.2.7. Reconstruction Similarity

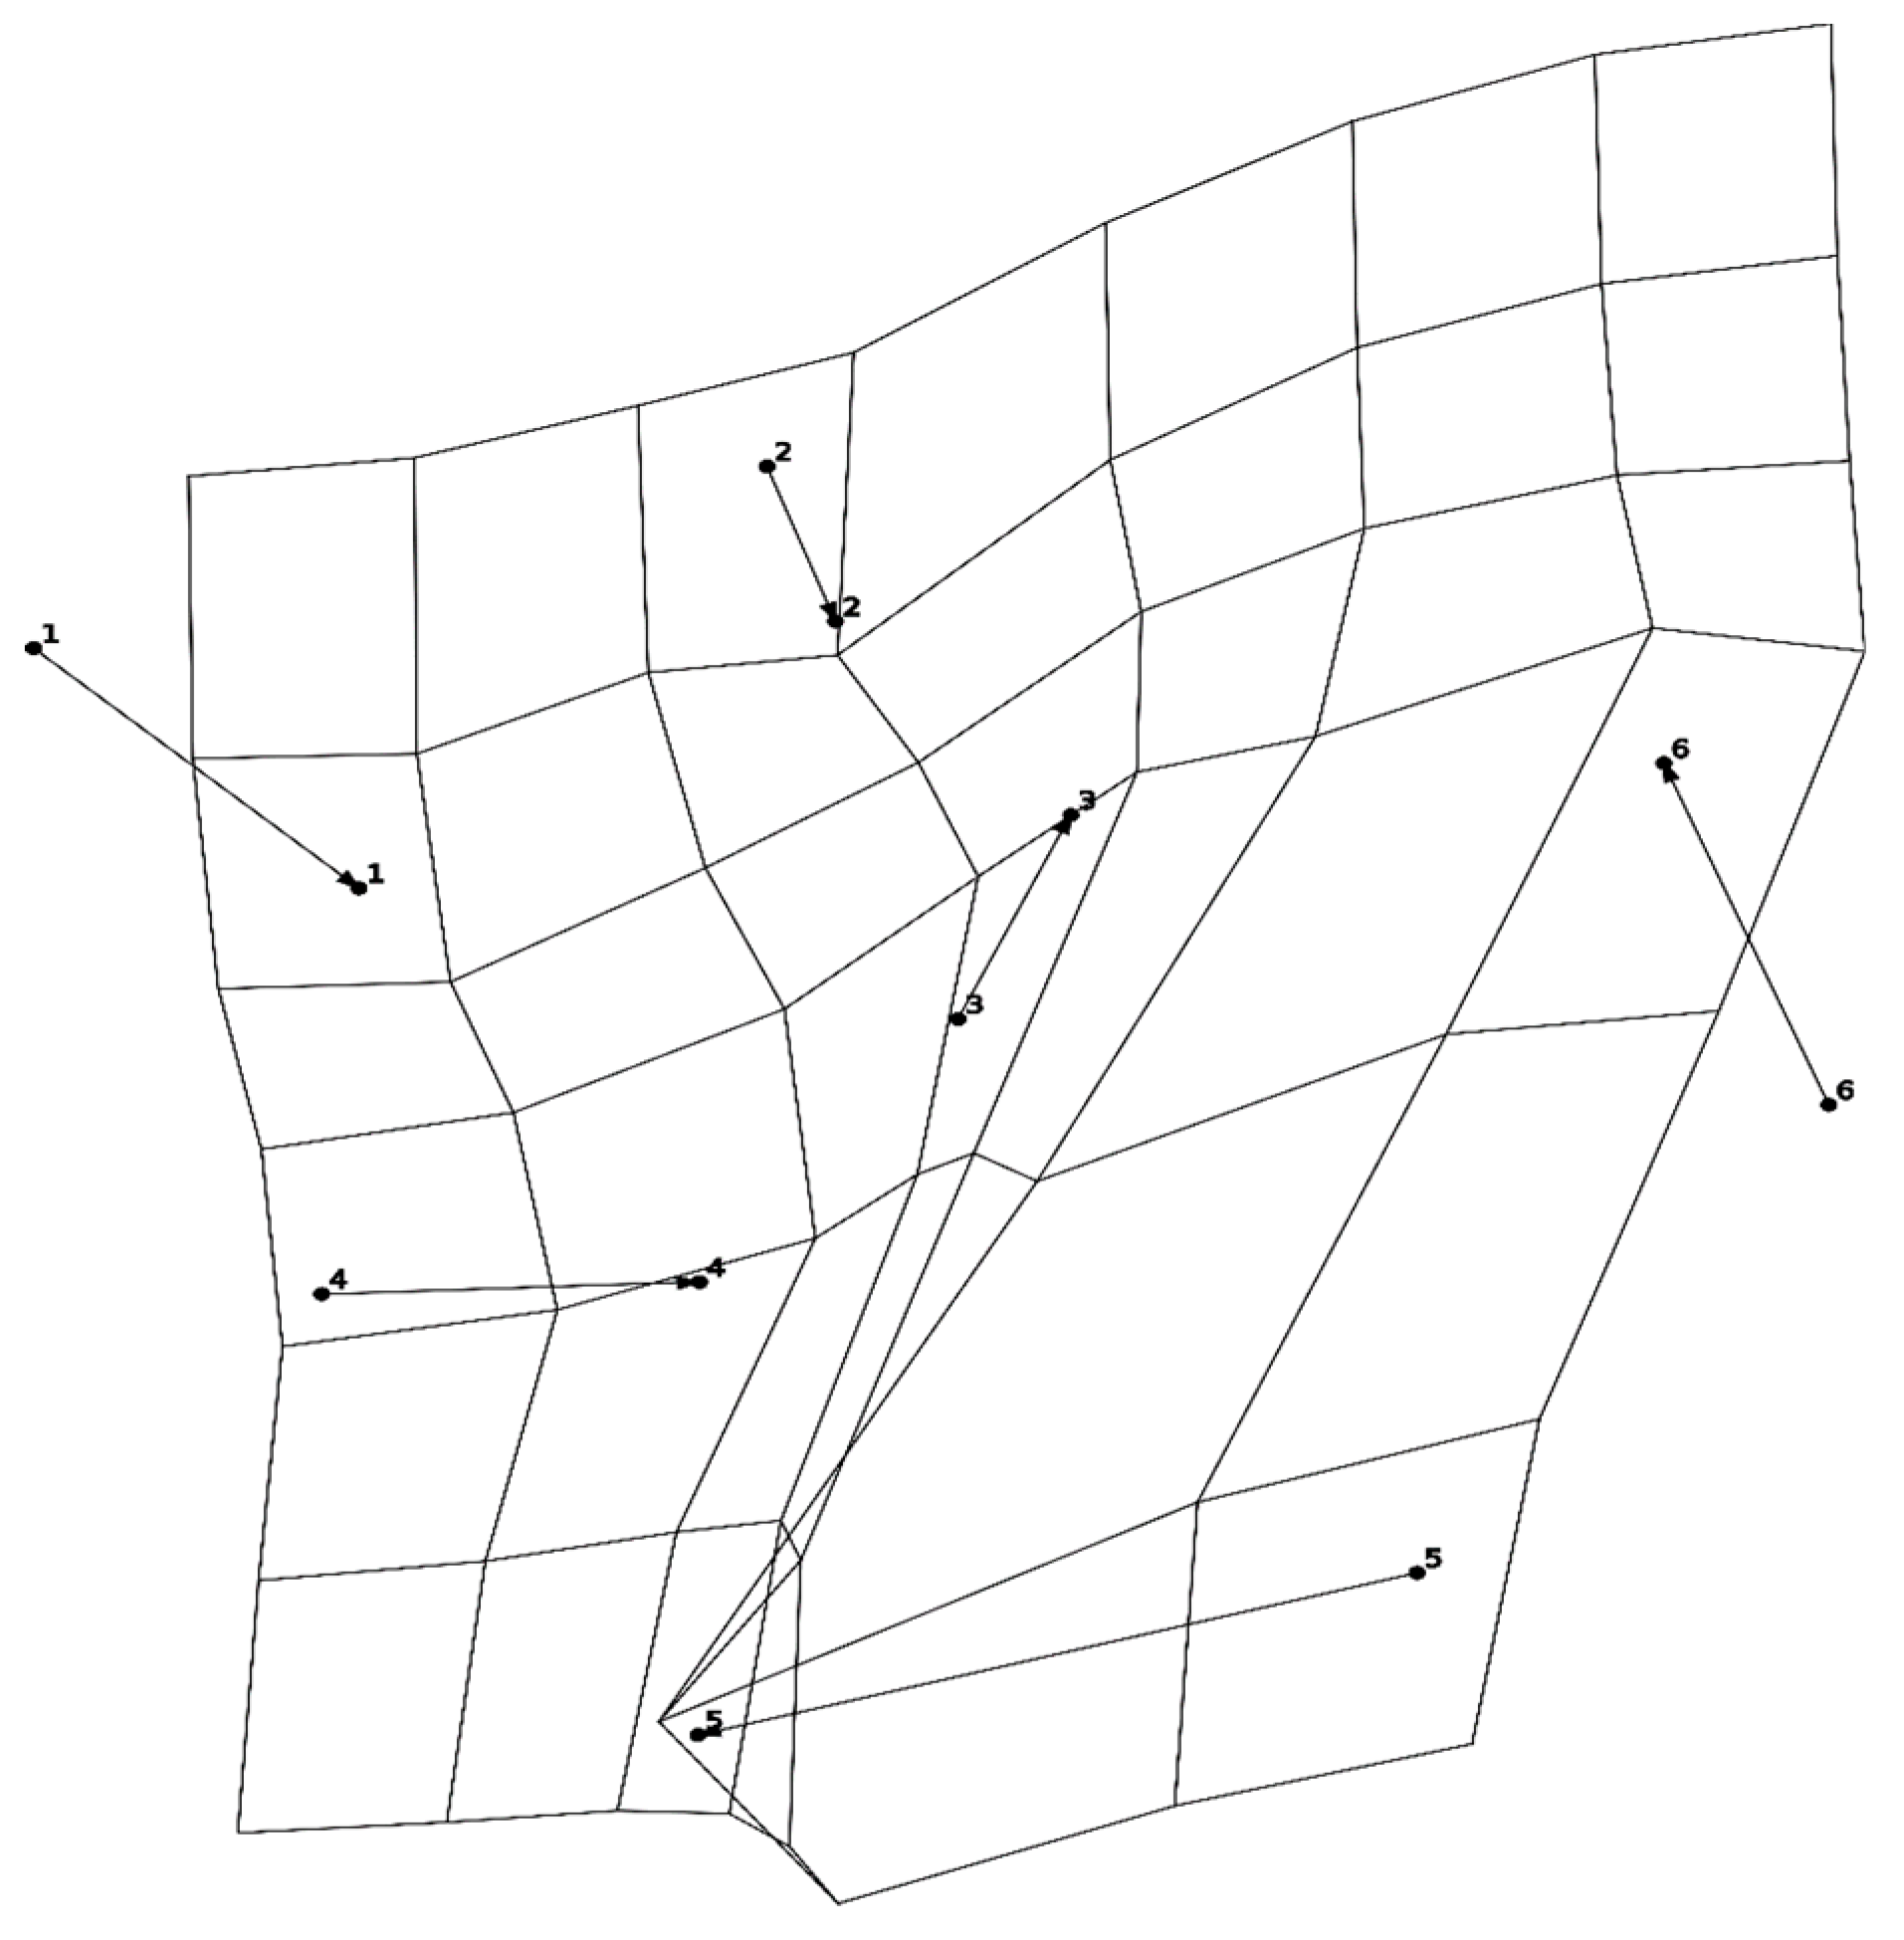
After having explored and memorized the spatial configuration, participants repositioned the six elements on a blank workspace (a tablet in sleep mode, see Figure 7). Using a bi-dimensional regression analysis [27], we assessed the similarity between the initial configuration and the reproduced one (i.e., the mental configuration, see Figure 13). The smaller the value, the bigger the similarity. LAY (Me = 36.5) and DIG (Me = 38.5) obtained the smallest values, whereas the CTL (Me = 63) and EDP (Me = 126.5) values seemed higher. Since the sample of coefficient regressions did not follow a normal distribution (Shapiro–Wilk, W = 0.20, p < 0.01), a Kruskal–Wallis test was performed but did not reveal any significant difference (H(3) = 3.81, p > 0.05) between conditions. Thus, we did not observe any impact of the interaction technique on the correctness of the reconstruction. Figure 13 shows an example of distorted representation of space in the offline reconstruction.

3.2.8. Synthesis for the Offline Task

To summarize the results of the offline task, layout (LAY) and control (CTL) techniques led participants to use fewer explorations strategies than direct guidance (DIG) and edge projection (EDP) techniques. There was no impact of the interaction techniques on reconstruction of maps.

3.3. User Satisfaction

Participants were asked to complete SUS (System Usability Scale) questionnaires after each interaction technique condition [25]. According to Bangor et al. [26], a score above 68 means that the system usability is acceptable. Since responses were not normally distributed (Shapiro–Wilk, W = 0.89, p < 0.05), we compared the medians of the 12 participants for the four interaction techniques. Statistical analysis revealed that the SUS score for DIG was significantly better than any other interaction techniques. More precisely, the Kruskal–Wallis test rejected the null hypothesis (H(3) = 12.87, p < 0.01). The two-by-two paired Wilcoxon test revealed that participants preferred DIG (Me = 92.5) to CTL (Me = 75(V(11) = 80.5, p < 0.01), as well as to LAY (Me = 62.5) condition (V(11) = 73, p < 0.01) and EDP (Me = 60) condition (V(11) = 65, p < 0.01). This clearly shows that satisfaction is higher when using DIG. This result is in accordance with participants’ verbatims. Indeed, most of them said that they found it comfortable to follow the path given by the DIG interaction technique.

4. Discussion

4.1. Discussion about Online Tasks

4.1.1. Response Times

Based on the results of previous studies [19,21], we performed experiments to evaluate the usability of interaction techniques on 10 inch touchscreens. The first result showed that the techniques EDP (similar to “Edge Projection” in [19]) and LAY (similar to “grid” in [21]) did not allow users to find the points of interest more quickly than the control condition (screen reader). However, DIG (similar to “speak and touch” in [19]) was slightly quicker than the control condition. These results suggest that guidance is efficient for finding a specific element on touchscreens. However, the differences were rather small and thus we suggest that, on a small device, users do not struggle too much to find target elements, even without any guidance. However, even if guidance could help to find elements more quickly, the core of the orientation tasks was to perform spatial inferences to estimate orientation between elements and not only to find them.

4.1.2. Spatial Skills

We observed that LAY allowed participants to estimate more correctly the relations of distance between elements. It seems that participants build a better mental representation thanks to the grid used in the LAY technique. However, this result was not consistent with the other online tasks. Three interpretations are possible. First, possibly none of the interaction techniques contributes to improving the construction of mental representations without vision. Different interaction techniques specifically designed to improve direction estimation could be more effective for spatial learning. Second, possibly participants were not familiar enough with these interaction techniques to really take advantage of them. Then, it would be interesting to evaluate these techniques after a longer training. Third, the implementation of the four techniques may not have been optimal. Especially, EDP was not easy to manage due to ambiguous multitouch feedback (i.e., if users touched the screen with more than one finger). Participants could have a more intuitive use of this technique if the audio feedback generated by both fingers was distinct. LAY also led to some difficulties because the vibrations produced by the contacts with the grid and with the elements were slightly confusing. It would thus also be interesting to evaluate an improved implementation of the interaction techniques.

4.2. Discussion about Offline Tasks

All techniques allowed participants to build an accurate mental representation of the map. One of the main goals of the offline session was to identify which interaction technique led to building the most accurate mental representation of a configuration with six elements explored on a 10-inch tablet. Contrary to expectations, the results of the offline experiment did not show any evidence for an effect of the technique on building a mental representation of the map. Indeed, no differences were found between the regression coefficients observed after using each interaction technique. Although the sample of values (4 × 10 values) is not large enough to assess differences, each interaction technique allowed participants to memorize the spatial configurations with good accuracy. Thus, we can conclude that none of these techniques hinder participants to build mental representation. Starting from this observation, interesting findings emerge from the different exploratory patterns that were observed as discussed below.

4.2.1. The Layout Technique Requires Shorter Exploratory Movements

First, considering the length of the exploratory movements, we observed that they were shorter with LAY than CTL and DIG. This result may be explained by the structuration of the workspace thanks to the grid used in the LAY technique. Indeed, as emphasized by Kane et al. [20], blind people organize space in relation to well-known layouts, which help them to better memorize object locations in the workspace. It can therefore be assumed that the participants did not find it necessary to explore the workspace several times to precisely remember the locations of the elements because the grid provided them with an efficient reference. Consistently, a previous study [21] showed that the grid layout helped visually impaired users to selectively explore a complex map. We can then suggest that LAY is “economical” and “efficient”. In other words, by reducing exploration movements, less effort seemed to lead to the same results.

4.2.2. The Layout Technique Requires Less Cognitive Exploratory Strategies

The hypothesis of the grid as an efficient reference is consistent with previous results on tactile exploration strategies [21]. In the current study, participants used less “Back-and-Forth” strategy with LAY than with the other techniques (CTL or EDP). LAY also required using less “Cyclic” strategies than DIG, as well as less “Point of Reference” strategies than CTL. These unexpected results show that LAY allows building equivalent mental representations but involves fewer cognitive strategies. This reinforces the idea of the grid being used as an efficient reference to build a mental representation of a map.

4.2.3. The Layout Technique is not Quicker

The results do not show any evidence that the better mental representation acquired by using LAY allowed participants to be quicker when doing the offline reconstruction. Although LAY and CTL seemed slightly quicker than DIG and EDP, no significant differences appeared. We may consider that reading the list of elements in both DIG and EDP took time. However, it is important to note that knowing the number (DIG and EDP) and the position (EDP) of elements within the configurations helped to pre-build the mental configuration. In the case of more complex maps (with more elements), CTL would probably become more tedious since participants would have no means to know whether they found all elements or not. Thus, they could continue exploring for a very long time just to be sure that they did not miss any element. To sum up the offline experiment, even though it was not confirmed by all observed variables, it appears that LAY is more efficient than the other techniques. Using LAY to explore more complex maps, we may then expect stronger effects on exploration time and spatial learning. This could be tested in a follow-up study.

4.3. Discussion about the Influence of Visual Status on Tactile Exploration and Spatial Memorization

In this study, we compared haptic exploration and spatial memorization by visually impaired and blindfolded sighted people. Previous studies on differences between visually impaired and sighted people regarding the exploration of tactile maps and graphics are contradictory. Thinus-Blanc and Gaunet [24] summarized findings of these previous studies. It has for instance been shown that visually impaired people rely more on kinesthetic cues for memorizing the position of objects after haptic exploration. Moreover, previous studies show that late blind people often outperform blindfolded sighted people regarding haptic exploration, and both groups outperform early blind people. Studies investigating spatial learning and memorization have also found differences between both groups. For example, visually impaired people tend to encode spatial information in an egocentric reference system rather than an allocentric reference system [24,28] Moreover, sighted people often outperform visually impaired people in spatial memorization tasks.
Based on these previous studies, we hypothesized that the four different interaction techniques in our study might result in different performances when used by blind or by blindfolded sighted people. However, we only observed one difference regarding the offline exploration: blind people tend to use simpler patterns with a lower number of reference points (up to three), whereas blindfolded sighted people use more patterns with four reference points. This could support the hypothesis of lower visuo-spatial development in visually impaired people [28]. While we did not find any other differences within the data collected in our study (e.g., in the online task), the lack of clear differences in our study could be explained by a low number of participants. It would therefore be interesting to study these differences in more detail and with a larger sample of participants in the future.

5. Conclusions

The main goal of the current study was to better understand usability and efficiency of three interaction techniques compared to a control condition (screen reader) to explore a map and learn its spatial configuration without vision. In our study, blind and blindfolded participants had to explore spatial configurations on a standard tablet device (10 inch) with audio feedback.
First, participants found most usable the only technique that directly guided their finger to the target: the direct guidance technique (DIG). Indeed, users particularly appreciated that this technique allowed them to gain time and reduce effort to find all the elements of the configuration. This highlights how difficult it is to locate isolated elements on digital maps without tactile feedback. This usability result corroborates the second major finding of this study. The DIG technique has definitely a great potential to help blind people to explore a digital map since it is the quickest interaction technique during online tasks. Here, participants spent less time to locate elements but also to answer questions about spatial relations about the configuration. However, spatial precision of the mental representation was not better. Although we keep in mind that a new implementation of the edge projection technique (EDG) could also lead to an efficient aid, this study confirmed that it is helpful to provide some kind of guidance.
Offline task results did not permit clearly identifying a better interaction technique to build spatial representations. However, exploratory pattern analysis partly showed how interaction techniques have influenced participants’ behavior. Here, the decrease of exploratory activity when using the layout technique (LAY) suggests that users took advantage of the grid structure. Since participants achieved the same quality of mental representation with less exploration, this suggests that the added grid better supports memorizing spatial relationships.
While some prior studies have shown differences in haptic exploration and spatial memorization between visually impaired and blindfolded sighted people, we only observed one difference in our study: blindfolded sighted people used manual exploration patterns with more points of reference than blind people. This could be explained by a lower spatial development level and emphasizes the importance of studying new means to provide blind people with spatial information.
To sum up, this study suggests that interaction techniques for people with visual impairment can be improved by adding guidance for exploration, and a known schema (e.g., a grid layout) for memorization. Thus, letting the blind users switch autonomously between techniques depending on the tasks seems to be a promising direction.

Author Contributions

Conceptualization, all authors; methodology, all authors; software, M.S. and A.S.; validation, C.J.; formal analysis, M.S., A.M.B, C.J. and A.S.; investigation, A.M.B., A.S. and M.S.; resources, B.O. and C.J.; data curation, M.S.; writing—original draft preparation, M.S., A.M.B. and C.J.; writing—review and editing, all authors; visualization, A.M.B. and M.S.; supervision, C.J.; project administration, C.J.; and funding acquisition, C.J.

Funding

This research was funded by AccessiMap ANR-14-CE17-0018.

Acknowledgments

We thank the “Cherchons pour Voir” lab, as well as all participants in our studies and Claude Griet from IJA-CESDV for her help in organizing the experiments. Moreover, we thank Helene Jonin for her work on the preliminary version of the prototype.

Conflicts of Interest

The authors declare no conflict of interest. The funders had no role in the design of the study; in the collection, analyses, or interpretation of data; in the writing of the manuscript, or in the decision to publish the results.

References

  1. WHO. Visual Impairment and Blindness Fact Sheet N° 282; World Health Organization: Geneva, Switzerland, 2018. [Google Scholar]
  2. Froehlich, J.E.; Brock, A.M.; Caspi, A.; Guerreiro, J.; Hara, K.; Kirkham, R.; Schöning, J.; Tannert, B. Grand challenges in accessible maps. Interactions 2019, 26, 78–81. [Google Scholar] [CrossRef]
  3. Gorlewicz, J.L.; Tennison, J.L.; Palani, H.P.; Giudice, N.A. The graphical access challenge for people with visual impairments: Positions and pathways forward. In Interactive Multimedia; Cvetković, D., Ed.; IntechOpen: London, UK, 2018. [Google Scholar]
  4. Tatham, A.F. The design of tactile maps: Theoretical and practical considerations. In Proceedings of International Cartographic Association: Mapping the Nations; International Cartographic Association: Bournemouth, UK, 1991; pp. 157–166. [Google Scholar]
  5. Ungar, S. Cognitive mapping without visual experience. In Cognitive Mapping: Past Present and Future; Kitchin, R., Freundschuh, S., Eds.; Routledge: Oxon, UK, 2000; pp. 221–248. [Google Scholar]
  6. Hampson, P.J.; Daly, C.M. Individual variation in tactile map reading skills: Some guidelines for research. J. Vis. Impair. Blind. 1989, 83, 505–509. [Google Scholar]
  7. Hill, E.W.; Rieser, J.J. How persons with visual impairments explore novel spaces: Strategies of good and poor performers. J. Vis. Impair. Blind. 1993, 87, 8–15. [Google Scholar]
  8. Gaunet, F.; Thinus-Blanc, C. Early-blind subjects’ spatial abilities in the locomotor space: Exploratory strategies and reaction-to-change performance. Perception 1996, 25, 967–981. [Google Scholar] [CrossRef] [PubMed]
  9. Golledge, R.G.; Klatzky, R.L.; Loomis, J.M. Cognitive mapping and wayfinding by adults without vision. In The Construction of Cognitive Maps; Springer: Berlin, Germany, 1996; pp. 215–246. [Google Scholar]
  10. Tellevik, J.M. Influence of spatial exploration patterns on cognitive mapping by blindfolded sighted persons. J. Vis. Impair. Blind. 1992, 86, 221–224. [Google Scholar]
  11. Guerreiro, T.; Montague, K.; Guerreiro, J.; Nunes, R.; Nicolau, H.; Gonçalves, D. Blind people interacting with large touch surfaces: Strategies for one-handed and two-handed exploration. In Proceedings of the 2015 International Conference on Interactive Tabletops & Surfaces, Madeira, Portugal, 15–18 November 2015; ACM: New York, NY, USA, 2015; pp. 25–34. [Google Scholar]
  12. Ducasse, J.; Brock, A.M.; Jouffrais, C. Accessible interactive maps for visually impaired users. In Mobility in Visually Impaired People—Fundamentals and ICT Assistive Technologies; Pissaloux, E., Velasquez, R., Eds.; Springer: Berlin, Germany, 2018; pp. 537–584. [Google Scholar]
  13. Brock, A.M.; Truillet, P.; Oriola, B.; Picard, D.; Jouffrais, C. Interactivity improves usability of geographic maps for visually impaired people. Hum. Comput. Interact. 2015, 30, 156–194. [Google Scholar] [CrossRef]
  14. Simonnet, M.; Vieilledent, S.; Jacobson, R.D.; Tisseau, J. Comparing tactile maps and haptic digital representations of a maritime environment. J. Vis. Impair. Blind. 2011, 105, 222–234. [Google Scholar] [CrossRef]
  15. Giraud, S.; Brock, A.M.; Macé, M.J.M.; Jouffrais, C. Map learning with a 3D printed interactive small-scale model: Improvement of space and text memorization in visually impaired students. Front. Psychol. 2017, 8, 10. [Google Scholar] [CrossRef] [PubMed]
  16. Zeng, L.; Weber, G. ATMap: Annotated tactile maps for the visually impaired. In COST 2102 International Training School, Cognitive Behavioural Systems, LNCS; Springer: Berlin, Germany, 2012; Volume 7403, pp. 290–298. [Google Scholar]
  17. Siegel, A.W.; White, S. The development of spatial representations of large-scale environments. Adv. Child Dev. Behav. 1975, 10, 9–55. [Google Scholar] [PubMed]
  18. New, B.; Pallier, C.; Ferrand, L.; Matos, R. Une base de données lexicales du français contemporain sur internet: LEXIQUE. Annee Psychol. 2001, 101, 447–462. [Google Scholar] [CrossRef]
  19. Kane, S.K.; Morris, M.R.; Perkins, A.Z.; Wigdor, D.; Ladner, R.E.; Wobbrock, J.O. Access overlays: Improving non-visual access to large touch screens for blind users. In Proceedings of the 24th Annual ACM Symposium on User Interface Software and Technology—UIST ‘11; ACM: New York, NY, USA, 2011; pp. 273–282. [Google Scholar]
  20. Kane, S.K.; Wobbrock, J.O.; Ladner, R.E. Usable gestures for blind people: Understanding preference and performance. In Proceedings of the 2011 Annual Conference on Human Factors in Computing systems—CHI ‘11, Vancouver, BC, Canada, 7–12 May 2011; ACM: New York, NY, USA, 2011; pp. 413–422. [Google Scholar]
  21. Bardot, S.; Serrano, M.; Jouffrais, C. From tactile to virtual: Using a smartwatch to improve spatial map exploration for visually impaired users. In Proceedings of the 18th International Conference on Human-Computer Interaction with Mobile Devices and Services—MobileHCI ‘16, Florence, Italy, 6–9 September 2016; ACM: New York, NY, USA, 2016; pp. 100–111. [Google Scholar]
  22. Hegarty, M.; Richardson, A.E.; Montello, D.R.; Lovelace, K.; Subbiah, I. Development of a self-report measure of environmental spatial ability. Intelligence 2002, 30, 425–447. [Google Scholar] [CrossRef] [Green Version]
  23. Albouys-Perrois, J.; Laviole, J.; Briant, C.; Brock, A. Towards a multisensory augmented reality map for blind and low vision people: A participatory design approach. In Proceedings of the CHI’18—CHI Conference on Human Factors in Computing Systems, Montreal, QC, Canada, 21–26 April 2018; ACM: New York, NY, USA, 2018. [Google Scholar]
  24. Thinus-Blanc, C.; Gaunet, F. Representation of space in blind persons: Vision as a spatial sense? Psychol. Bull. 1997, 121, 20–42. [Google Scholar] [CrossRef] [PubMed]
  25. Brooke, J. SUS: A ‘quick and dirty’ usability scale. In Usability Evaluation in Industry; Jordan, P.W., Thomas, B., Weerdmeester, B.A., McClelland, I.L., Eds.; Taylor & Francis: London, UK, 1996; pp. 189–194. [Google Scholar]
  26. Bangor, A.; Kortum, P.T.; Miller, J.T. An empirical evaluation of the system usability scale. Int. J. Hum. Comput. Interact. 2008, 24, 574–594. [Google Scholar] [CrossRef]
  27. Friedman, A.; Kohler, B. Bidimensional regression: Assessing the configural similarity and accuracy of cognitive maps and other two-dimensional data sets. Psychol. Methods 2003, 8, 468–491. [Google Scholar] [CrossRef] [PubMed]
  28. Cattaneo, Z.; Vecchi, T. Blind Vision: The Neuroscience of Visual Impairment; MIT Press: Cambridge, MA, USA, 2011. [Google Scholar]
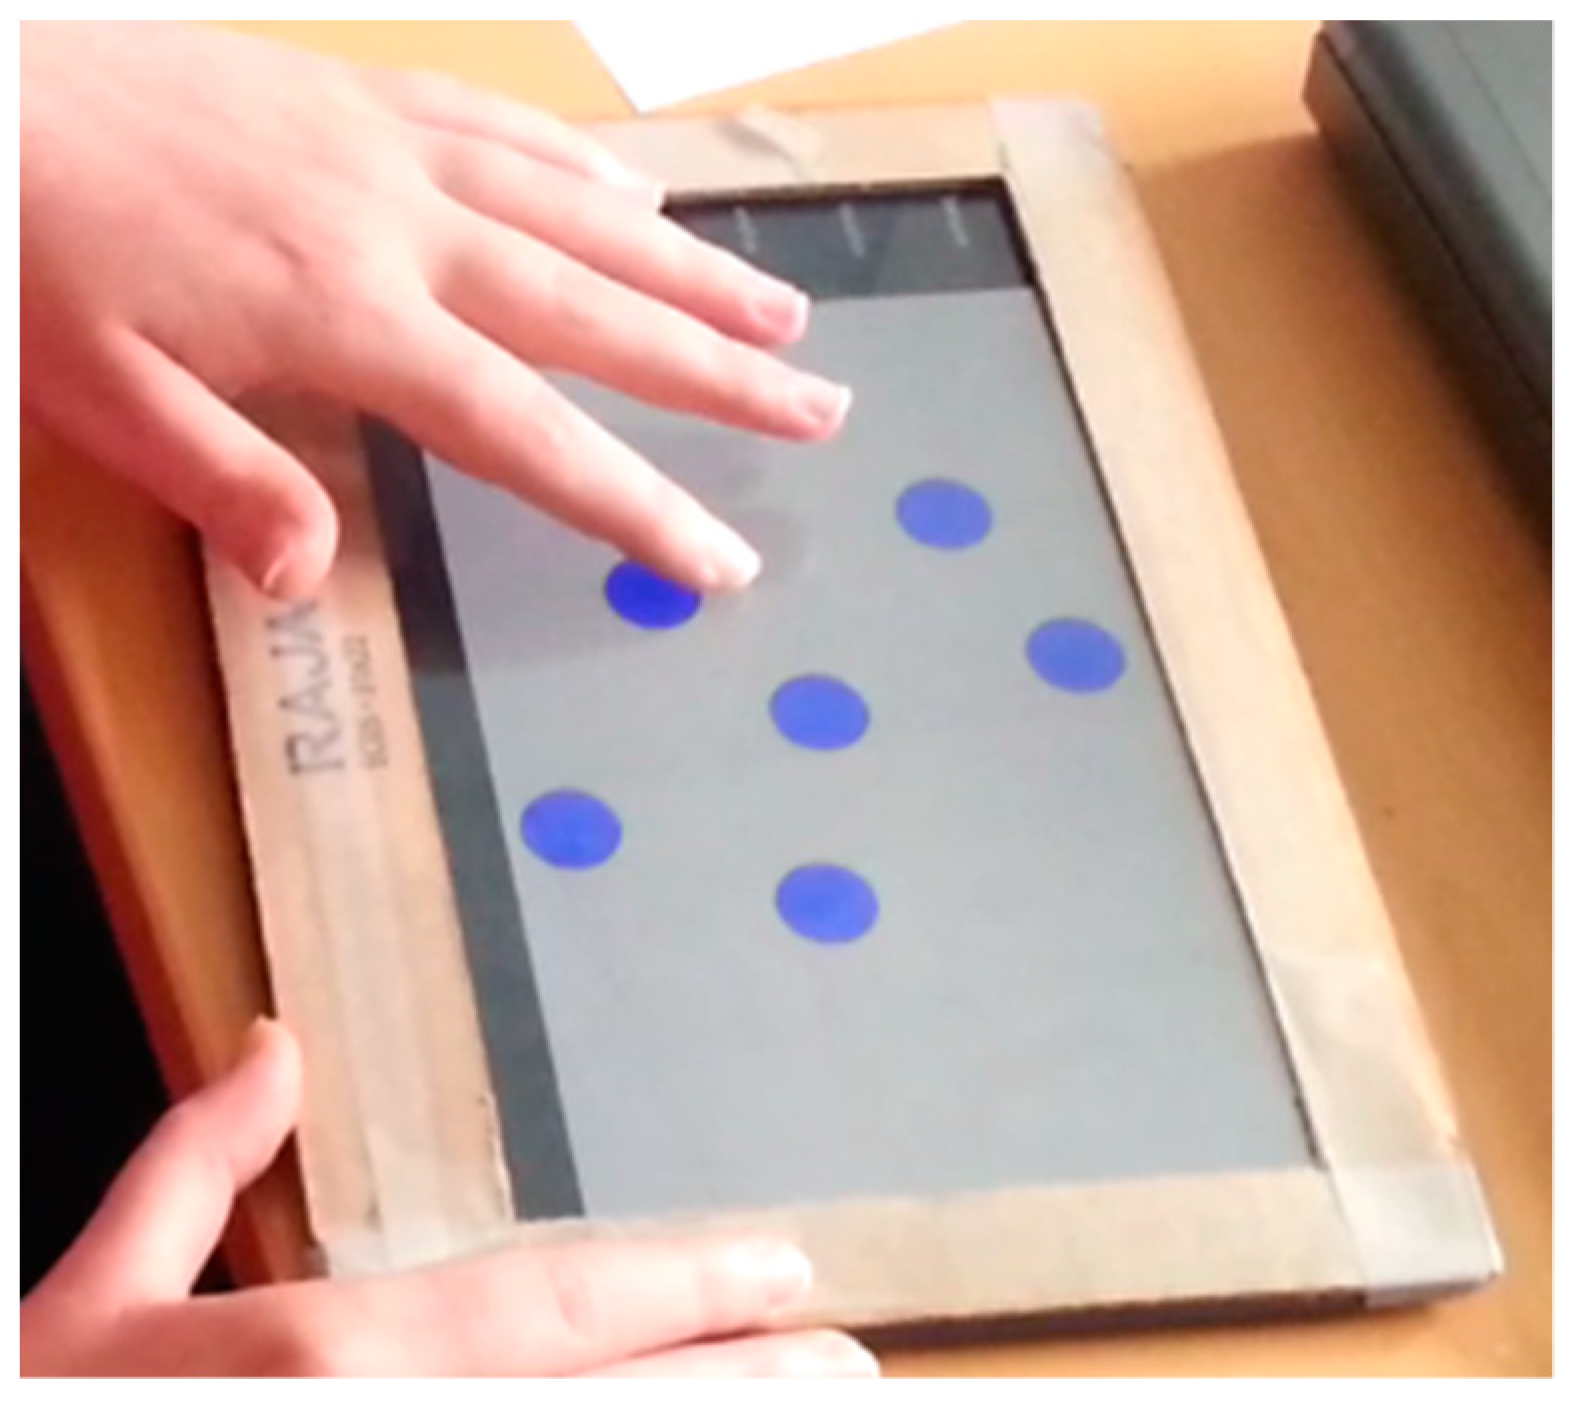
Figure 1. Photograph of the tablet computer. Cardboard served as physical landmark to delimitate the screen space and to protect buttons from unintended touches.
Mti 03 00027 g001
Figure 2. Example of four maps using the same map elements based on a rotation of the configuration. The translation of the names can be found in Table 1.
Mti 03 00027 g002
Figure 3. Schematic description of Direct Guidance Technique.
Mti 03 00027 g003
Figure 4. Schematic description of Edge Projection technique.
Mti 03 00027 g004
Figure 5. Schematic description of the Grid Layout technique.
Mti 03 00027 g005
Figure 6. Experimental plan overview.
Mti 03 00027 g006
Figure 7. Reconstruction of the configuration with stickers on tablet in sleep mode.
Mti 03 00027 g007
Figure 8. Response time for the Location task per interaction technique. DIG is the quickest interaction technique to find an element. (** p < 0.01).
Mti 03 00027 g008
Figure 9. Response times for the Relate task per interaction technique. DIG is the quickest interaction technique to estimate distance relationships between elements. (* p < 0.05, ** p < 0.01).
Mti 03 00027 g009
Figure 10. Orientation task duration per interaction technique. DIG and CTL were quicker than LAY and EDP to estimate direction relationships between elements. (** p < 0.01).
Mti 03 00027 g010
Figure 11. Duration of the relative orientation task with mental rotation per interaction technique. DIG and CTL were quicker than LAY and EDP to estimate direction relationships between elements when performing a mental rotation task. (** p < 0.01).
Mti 03 00027 g011
Figure 12. Number of correct distance estimations per interaction technique.
Mti 03 00027 g012
Figure 13. Example of a distorted representation between the initial and the rebuilt configuration for Participant 11 (B5 in Table 2) after using the edge projection (EDP) technique.
Mti 03 00027 g013
Table 1. List of map elements for the online task.
CategoryName (French)Translation (English)FrequencySyllablesMap Nr
Water AnimalsDauphinDolphin1.7621
MéduseJellyfish0.6622
SardineSardine0.8423
CalmarSquid0.724
BirdsToucanToucan0.0321
FlamandFlamingo0.3922
FauconFalcon4.0723
MoineauSparrow2.9224
MammalsLionLion14.5811
LièvreHare3.3612
CerfDeer6.1713
TigreTiger11.1414
FlowersVioletteViolet0.7721
TulipTulipe1.5322
GentianeGentian0.1423
GlaïeulGladiolus0.0124
VegetablesOignonOnion4.3521
PoivronBell Peppers0.5122
EndiveChicory0.0323
CarotteCarrot2.4524
FruitsBananeBanana6.0921
CeriseCherry2.7522
BrugnonNectarine0.1423
CitronLemon8.124
Table 2. Table of blind participants. Likert scale for braille reading expertise, tactile graphics ease and interactive technology ease: 1 = very little, 5 = very strong.
ParticipantB1B2B3B4B5B6
GenderFFMFMF
Age434161225661
EducationUniversityCollegeHigh SchoolCollegePrimary educationUniversity
ProfessionMusic TeacherSecretaryRetired (formerly piano tuner)SecretaryFurniture makerAdministrative officer
Onset of BlindnessBirthBirthBirthBirth18 years15 years
Braille Reading Expertise544544
Braille HandsTwo sequentialTwo parallelTwo sequentialLeft handLeft handTwo parallel
Tactile Graphics Ease214144
DexterityRightRightRightRightRightRight
PhoneAndroidiPhoneiPhoneButton-basedAndroidButton-based
Screen ReaderNVDA, TalkbackJaws, VoiceOverJaws, VoiceOverJaws, NVDANVDA, Jaws, TalkbackJaws, NVDA
Interactive Technology Ease544444
SBSOD4.334.735.331.865.265.46
Table 3. Online task summary. This table shows the best interaction technique for each task depending on time or performance measurements.
Online Tasks MeasuresLOCRELORIROT
TimeDIGDIGDIGDIG
Distance EstimationNot measuredLAYno diffno diff