1. Introduction
Affective automotive user interfaces show potential for an improvement of driver safety through the detection of performance-influencing states, such as anger, and their mitigation through strategic interaction [
1]. Thanks to recent advancements in psychophysiological computing and new technologies that allow for contactless sensing of human emotions, affective interfaces might soon become feasible in everyday environments [
2]. We see automotive user interfaces as perfect pioneering grounds for user-aware systems, as drivers and passengers are confined in a limited space with high availability of sensors placed in the car interior.
In this work, we take the viability of psychophysiological sensing of emotions as a given prerequisite for affective in-car systems and focus on interaction techniques to mitigate the effects of negative emotional states. Unbridled driver emotions have been shown to contribute to unsafe driving [
3] and are thus a prime use case for adaptive, user-aware interfaces in the car. We present strategies to counteract negative emotional states from related work and evaluate four approaches which we deem promising for an in-car application. Sixty participants experienced these interface concepts and provided us with insights on their effects on driving behavior, physiological data, and user experience. The presented study focusses on the effects of anger and sadness behind the wheel, as these are two extreme affective states a minimum viable product for automotive use will need to be able to take into account [
4]. As core findings, we suggest natural voice interaction with subliminal cues (e.g., light) as suitable modalities for an interaction with positive outcome and recommend a strategic focus on empathy, without patronizing the user. The goal of this work is to help designers of in-car user interfaces to chose the right strategies when reacting to negative driver emotions.
2. Related Work
Previous research has by and large acquired knowledge on the fundamentals of automotive user interfaces and affective computing, which we aggregate in the following section. The presented influencing strategies from related studies are clustered according to their elementary operating principles and modalities, and eventually served as inspiration for the concepts we conceive.
2.1. Automotive User Interfaces
Interaction with in-car user interfaces is usually performed as a secondary task [
5] in addition to the more important, highly safety-critical main task of driving. Automotive UIs are therefore benchmarked towards their effects on distraction, driving performance, and the workload they induce on the driver [
6]. Modern automotive UIs aim for a natural experience with multimodal input channels [
7], they can include persuasive abilities, for example, to inspire economic driving behavior [
8] or discourage speeding [
9], and they can be adaptive to the driver state, e.g., by taking into account the induced cognitive load and adapt the displayed information [
10], or by detecting fatigue through psychophysiological measures and adapting air condition settings to vitalize the driver [
11]. The assessment of emotional states provides another perspective towards adaptive UIs, which constitutes the starting point for this work.
2.2. Emotions on the Road
Emotions occur in every conceivable situation, so naturally also during driving. The affective state of the driver is influenced by environmental (roads, weather), situational (traffic), and interactional factors (conversations, user interfaces) and thus fluctuates continuously [
12]. Especially actions caused by negative emotions, like anger or sadness, have been shown to impair driving performance in a negative way [
3,
13]. In the course of the preceding research, we came to know that drivers experiencing negative emotions would approve a system which would help them to improve their emotional state [
4]. Although this idea has been proposed before, e.g., by Nass et al. [
14], most driver models only take into account cognitive load, distraction, and the physical state of the driver but do not consider emotions and their triggers [
15]. For adaptive, affect-integrated interaction to become reality, the software behind automotive UIs needs to have a more holistic view of the driver which includes their long-term traits and preferences, as well as short-term states, such as emotions [
1,
16].
2.3. Affective Interfaces
Affective states have been shown to bias user actions and cognitive processes [
17], which is why they can have effects on road safety [
1]. In order to understand these emotional states, they are often classified within categories of basic emotions [
17] or on continuous scales with the dimensions arousal and valence [
18]. In the driving context, medium activation is seen as optimal level of arousal [
19], and positive valence is generally desired as a sign of good user experience [
16] (see
Figure 1). The motivation behind affective interfaces is to sense, interpret, and respond appropriately to human emotions [
20] with the aim of positively influencing user behavior, which in the context of driving means a prospective improvement of road safety [
21].
An affective in-car system must, first of all, be aware of the driver’s state [
22], which is comprised, e.g., of physical features, mental workload, fatigue, the level of distraction, and emotions [
16,
23]. Psychophysiological measures like heart rate variability, skin conductance, skin temperature, breathing rate, or EEG can be used to deduce driver states [
24,
25,
26,
27,
28]. At the same time, unobtrusive contactless technologies like audio-visual sensors or eye-tracking might have lower initial hurdles regarding acceptance in cars: a video stream of the driver can be used to extract facial action coding units, which in combination with voice features can inform an emotion detection system [
29,
30], and measures of pupil diameter can be used to assess mental workload [
31]. An in-car environment provides a great starting point for such systems, as users are confined to a limited space and all kinds of sensors are highly common in the interior of a modern car and widely accepted by users.
2.4. Designing Affective In-Car Assistants
Nass et al. were first to investigate an assistant which can adapt to the user’s emotion [
14]. They report fewer accidents, better attention, and higher willingness to communicate when the system’s voice mirrored the driver’s emotion. In a follow-up study, their team also found that negative effects on driving performance from frustrating events can be mitigated through positive voice interaction [
32]. Hoedemaeker and Neerincx present an in-car interface which adapts its informational content based on the detected cognitive load of the driver [
10]. Williams et al. explored another facet of emotional interaction in the car with a social robot, which also had positive effects on driving performance [
33]. We take this aspect of adaptive and social interaction and connect it to an affect-integrated driver model in order to intervene within the driver–vehicle interaction loop [
1,
16,
34].
Figure 1 shows the driver state taxonomy used in many related studies, which defines dangerous states with extreme values of arousal in combination with negative valence (e.g., anger and sadness) and identifies medium arousal and positive valence as optimal driving state. In the following, we outline possible approaches to affective interaction in the car, which we suppose to differ regarding efficiency and acceptance [
8].
2.4.1. Incentivization
A classic behavior regulation strategy working with incentives and punishment, also known as the “carrot and stick” method, has been suggested by Wang et al. [
35]. In their prototype, road users can give direct feedback to other drivers by showing appreciative or disapproving external display contents. On a practical level, however, positive as well as negative reinforcement can have adverse long-term effects on social interactions, and especially the punishment of unwanted behavior is seen as highly undesirable by users [
36].
2.4.2. Distraction
In the automotive domain, distraction from the driving task is generally advised to be avoided. Drivers can, however, be distracted from negative affective states as long as the stimuli do not influence driving safety. Previous work has shown concepts to tackle negative states by changing routing options towards routes with a better view [
33,
37]. Another widespread concept to distract drivers from negative emotions is using adaptive music playback in order to nudge them towards more positive feelings [
38,
39,
40,
41].
2.4.3. Driver State Display
The idea to display the detected driver states within a graphical UI has been evaluated in recent studies, e.g., by Völkel et al. [
42], within the AwareCar project at MIT [
23], and in our own research [
43]. Such a display can keep drivers informed regarding their current capacities and support in-vehicle systems to improve driver performance and safety [
23]. Drivers generally seem open towards continuous driver state displays, provided the criticality of the situation is easily discernible [
42,
43]. If such a system incorporates notifications, the timing needs to be adaptive to the level of receptiveness and the driver’s attentional states [
44]. Williams et al. also suggest to communicate this information to other road users in order to improve driving safety [
33].
2.4.4. Gamification
Several concepts by Schroeter and Steinberger introduced game design aspects to automotive user interfaces [
45,
46,
47]. They use gamification to trigger engaging tasks for distracted drivers, to give them feedback on their driving performance, and to increase situational awareness with proactive markers. The resulting re-engagement and better hedonic qualities of these systems can, however, come accompanied with increased visual distraction [
46].
2.4.5. Affective Symmetry
Systems which mimic empathy by reflecting the detected driver state might possibly be accepted well by users due to similarity attraction theory [
48]. Previous work in the automotive domain has found according indications for visual avatars [
26] as well as voice assistants [
14] and social robots [
33]. Studies report positive effects on emotions and driving performance when the system matches the driver’s state [
14,
21,
33].
2.4.6. Reappraisal
After facing negative emotional events, affective states can be regulated through reappraisal of the experienced situation [
49]. In the context of digital systems, this means a system provides another perspective with a less negative outlook for the user. Harris and Nass have shown evidence for positive effects on emotions and driving performance for reappraisal in frustrating driving situations [
32].
2.4.7. Subliminal Influencing
In contrast to above described explicit strategies, emotions can also be influenced with subliminal cues. Temperature control has been shown to mitigate effects of high arousal [
11,
38] and lighting can also have an influence on affective states [
50]. In particular, blue light is shown in related work to have a calming effect [
51,
52].
2.4.8. Summary
Each of these strategies incorporates a driver–vehicle interaction loop, meaning the system senses driver data, estimates an emotional state, and reacts accordingly [
34]. Different modalities with varying degrees of blatancy are used to influence the driver towards an optimal driving state, which harbours the risk of introducing side effects such as distraction or perceived paternalism [
53]. For a realization of such affective strategies in the car, their potential impact on the driver needs to be assessed, so we can exclude unfit approaches and advance more promising concepts.
2.5. Research Question
Affective automotive user interfaces follow the goal of detecting unsafe driver states and influencing the driver so that they can restore safe driving performance. Based on previous research, we assume an in-car system can influence the emotional driver state through interaction. The outstanding question we answer with this work is whether any strategy or modality is to be preferred in order to improve the driver’s negative emotions.
3. Concept
The wealth of different strategies named above spurred us to consult a specialist focus group with the goal of distilling the most promising approaches for a future concept. Twelve UI/UX researchers of the BMW Group (two designers, three human factors engineers, three psychologists, four computer scientists) took part in a one hour session where we introduced examples from related work we had compiled beforehand and discussed applicable study designs and which emotional states should be chosen as starting points. They also reviewed ethical and practical implications of the introduced strategies.
In summary, incentives and punishment were ruled out as they might have too many possible side effects, and gamification was seen as a fitting approach for automated vehicles but offered too much distracting elements for manual driving. Affective symmetry was discussed in detail as some participants thought it might intensify negative emotions but also likely increase acceptance of the system. Subliminal cues were also evaluated as promising; however, they were seen as harder to assess than explicit stimuli because users might not perceive the influence under certain conditions. In the end, the focus group agreed on four interaction strategies which are to be tested using a within-subject design against a baseline UI which does not offer any influencing factors. We considered two distinct emotional states, Anger and Sadness, as reasonable between-subject groups. Four concepts result from combinations of the discussed strategies and are defined as follows:
3.1. Ambient Light
The strategy
Ambient Light is realized using a controllable LED strip attached to the lower edge of the dashboard, so the light would be perceived in the driver’s peripheral field of view. The subliminal light cue would fade in slowly when activated and the background of the central information display (CID) would also change its color tone. Participants in the group
Anger receive a purple-blue light to calm them down, while users in the group
Sadness see a soft green-yellow light. These color schemes were derived from work on the effects of color on emotions by Valdez and Mehrabian [
51].
3.2. Visual Notification
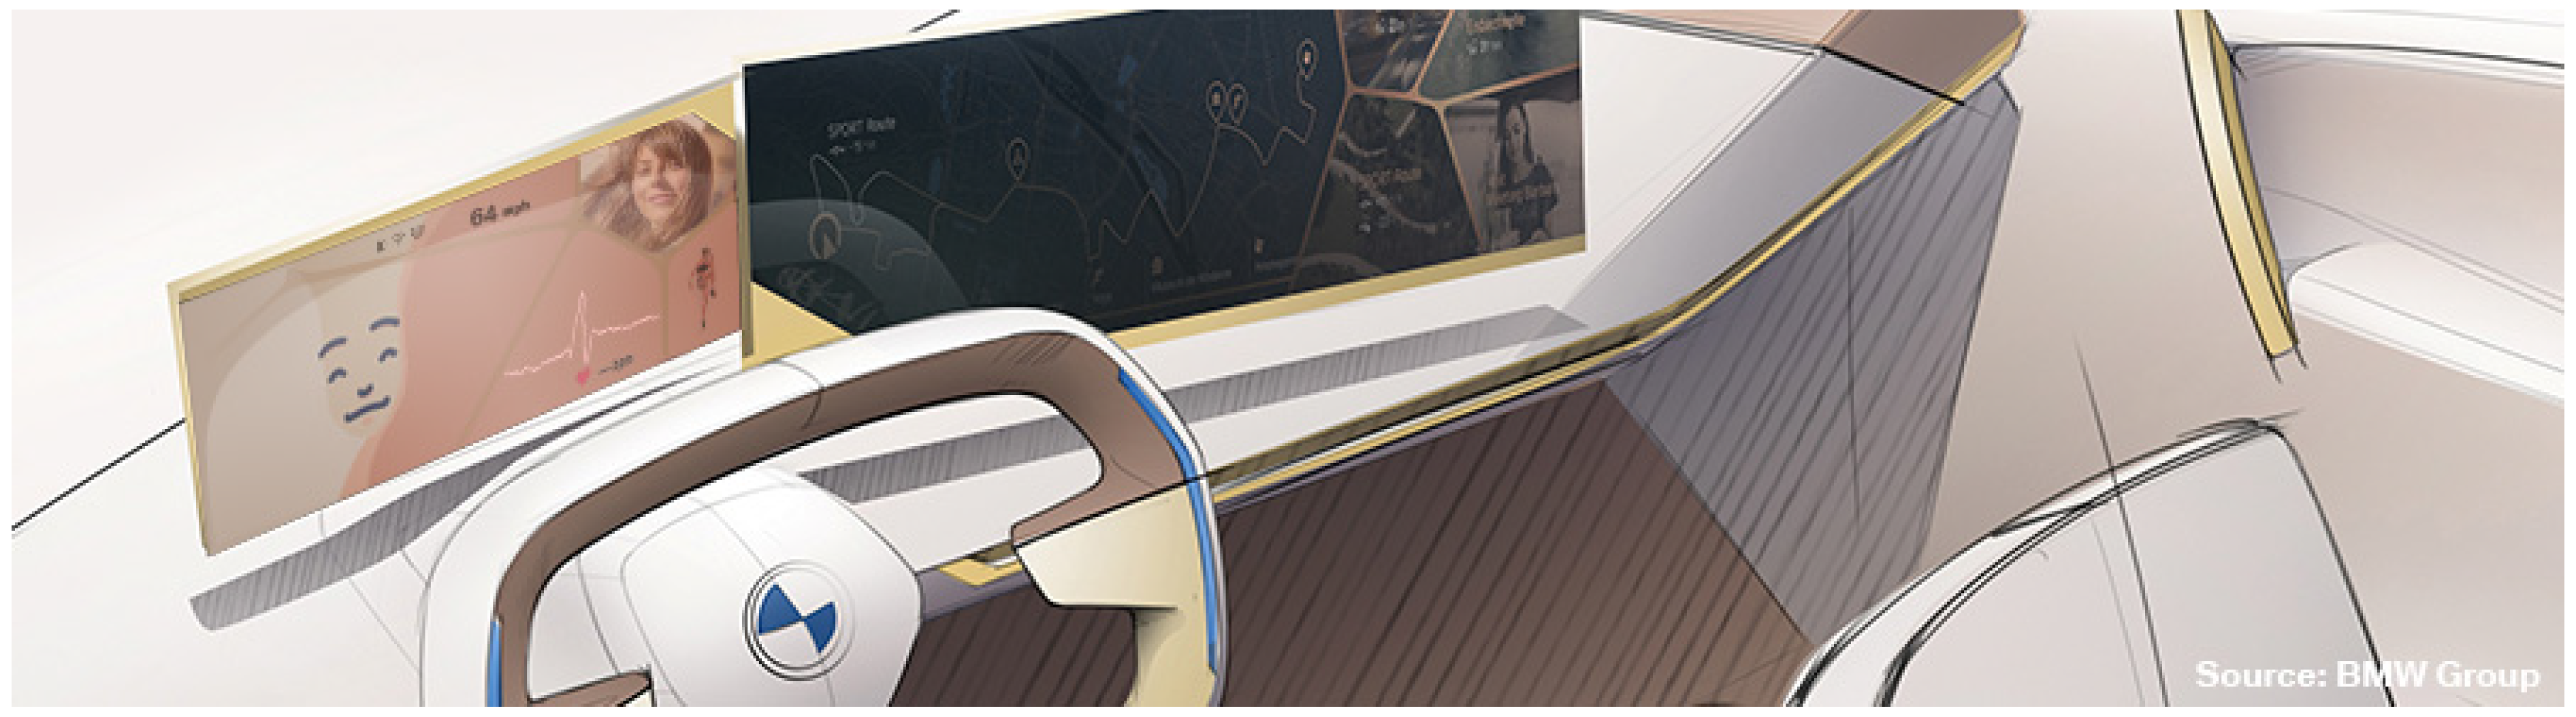
The main idea for this strategy is to give the driver a graphical visualization of their current state without active interaction. After discussing the display of physiological measures, we ultimately decided to abstract these values into a simple emoticon representation (cf.
Figure 2). Detected anger is represented by an angry face and sadness is shown with a sad face. These graphical representations are displayed as full-screen notifications on the CID during the influencing phase of the experiment.
3.3. Voice Assistant
This strategy incorporates a proactive spoken dialog when the user is found to be in a negative affective state. The voice samples were recorded beforehand by a male voice actor. Participants are addressed with the recommendation “I detect that you are distracted. Would you like to listen to some radio to concentrate better?” to which they could answer via speech or touch screen input. If the recommendation is accepted, a sample from a local radio station is played back (short host commentary and an emotionally neutral song).
3.4. Empathic Assistant
This approach is based on the previous strategy but enhanced with empathic interaction. The voice assistant addresses participants in the Anger group with “Hey, are you alright? I can understand that you are a bit angry, sometimes I feel the same way. How about some music to take your mind off things?” and the ones in the Sadness group with the phrase “Hey, are you alright? I can see that you are lost in thought, I feel the same way sometimes. How about some music to cheer you up a bit?”. The played radio sample differed from the one used in strategy Voice Assistant but was also held as emotionally neutral as possible.
4. User Study
We performed a simulator study (n = 60) to investigate whether negative driver emotions can be improved through affective interaction. The primary goal of this study was to identify promising approaches for affective computing in the car and their effects on driving performance, user experience, and workload.
4.1. Hypotheses
We expect positive effects on safety and user experience if a system can influence the driver’s emotional state. We also assume that not all strategies we designed are equally well suited for the driving context. The hypotheses we derived from our research and previous work can be summarized as follows:
Hypothesis 1 (H1)
. Driving performance is impaired by negative emotions, which can be mitigated through interaction [4,14,15]. Hypothesis 2 (H2)
. A decrease in negative emotions results in a change of cognitive load and physiological signals [24,25,26,27,28]. Hypothesis 3 (H3)
. The tested strategies differ regarding their effect on the driver’s emotional state (cf. Section 3). Hypothesis 4 (H4)
. Emotional states differently influence preferences for interaction and their effects on the driver [3,13]. Hypothesis 5 (H5)
. Users prefer subliminal influencing over direct interaction as it is less patronizing [44]. 4.2. Study Design
The study was designed with the goal of comparing the effects of different UI strategies on driver emotions while driving. As independent variables, participants experienced the four strategies introduced above plus a
Baseline interface without interaction. The sequence of strategies was permuted using a
latin square. Subjects were assigned to one of two groups of induced emotions, either
Sadness or
Anger, resulting in a mixed (within-between-subject) design. Emotions were induced using autobiographical recollection. This method requires the participant to think of and write down an experience from their past which had elicited the desired emotion. In order to recall this emotion while driving, participants have to recount the the story aloud, preferably in a setting protecting their privacy. Autobiographical recollection has been identified as the effective emotion elicitation method in previous research [
54,
55].
We collected dependent measures on driving performance, eye glances, the driver’s workload and emotional state, as well as subjective feedback. Driving performance was quantified using the car’s position within the simulation to calculate headway variability and the standard deviation of lane position (SDLP) [
56]. The driver’s workload was assessed after each ride using the driving activity load index (DALI) questionnaire [
57]. Before and after every concept interaction, participants also gave an estimation on the current strength of the induced emotion on a one-item scale. Physiological sensors provided data streams on galvanic skin response (GSR) and heart rate, an eye-tracker recorded the driver’s gaze, and a driver camera allowed the analysis of emotional states from facial expressions. In the end, subjects were asked to rank the experienced strategies according to their general preference, and to explain their feelings towards each strategy in a short unstructured interview.
4.3. Participants
Sixty-three participants aged 22–61 years (M = 31.58, SD = 10.10) took part in the study. After discarding three datasets due to missing or corrupted measures, we take into account n = 60 (42 male, 18 female), of whom 30 participants each experienced induced Anger or Sadness respectively. The majority of participants was familiar with graphical and voice-activated automotive UIs (57), and had never before interacted with a system which considered their emotional state (51).
4.4. Apparatus
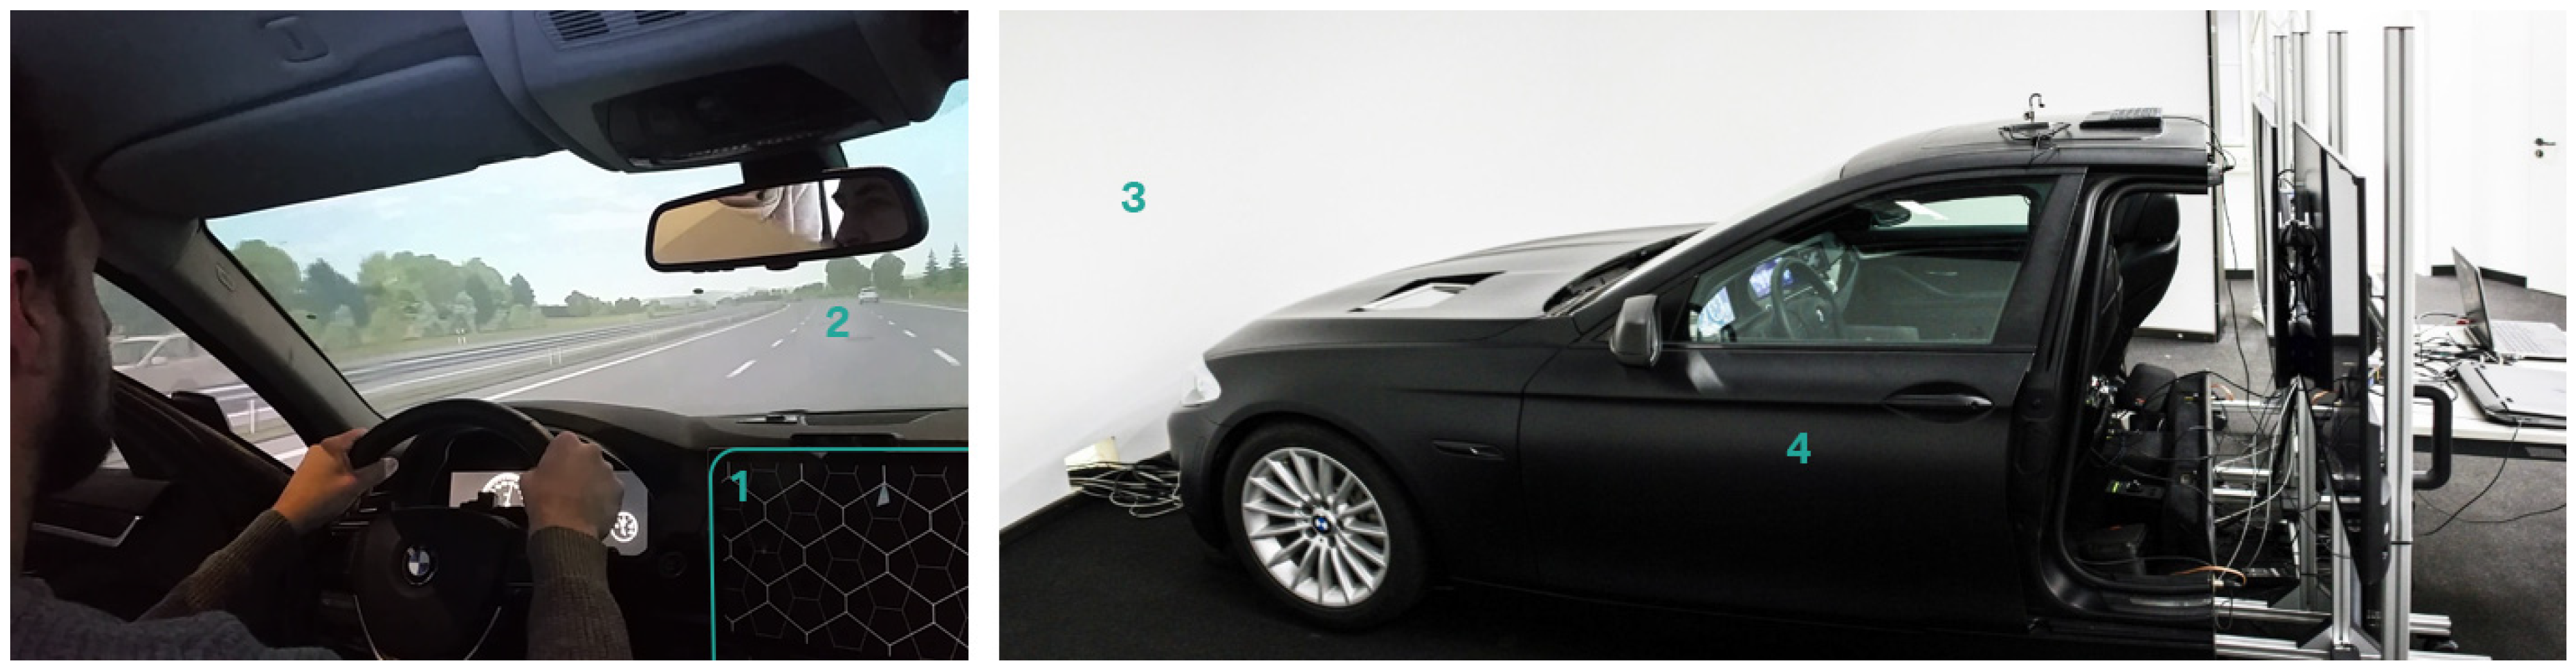
The study was conducted in a high-fidelity driving simulator at the BMW driving simulation center.
Figure 3 shows the basic setup, consisting of a fixed-base BMW 5-series (F10) mockup in front of a curved 180° screen. The driving simulation was realized with BMW’s proprietary simulation software SPIDER [
58] and projected by five high lumen projectors. The visual components of the concepts were presented on a Microsoft Surface tablet situated at the original position of the central information display, the ambient light was realized using a Philips Hue LightStrip attached to the lower edge of the dashboard, and auditory parts were played via the car’s speaker system. The concepts and simulation were controlled from a separated experimenter room with video and audio surveillance and an audio backchannel.
Physiological readings to analyze the emotional state of the driver were collected using the iMotions research platform [
59] in combination with a Shimmer 3 sensor [
60] measuring heart rate and galvanic skin response through adhesive electrodes. An instance of the Emotient FACET software [
61] was also connected to iMotions to detect emotional states from facial expressions and a Tobii X2-60 [
62] served as eye-tracking device.
4.5. Procedure
At the beginning of the experiment, we explained the study goal of comparing affective interfaces and the following procedure. Participants filled out a short questionnaire on demographics and a consent form, during which the experimenter assigned them to an experiment group based on their age and gender. We did this to ensure balanced distributions within the two between groups and the five latin square permutations. Participants then sat down inside the car to adjust the seat and get accustomed to the driving task during a generous familiarization ride. The driving task required participants to follow a white car in moderate highway traffic.
The first part of the emotion elicitation task was again performed outside the car. Participants sat down at a table and wrote down a personal experience that made them feel very sad or angry, depending on the group they belonged to. They were given a time window of 10 minutes to fill their paper and remember every little detail about the experience. Then, they would be outfitted with adhesive electrodes for the physiological sensing and the eye tracker was subsequently calibrated when they were back inside the car.
At the beginning of every ride, participants absolved the second part of the autobiographical recollection task. They recounted the story they wrote down before to themselves for five minutes whilst driving. Their directive was to conjure up the emotional state they were in when they experienced the remembered events. During this elicitation phase, the audio channel to the simulator was disconnected for privacy reasons, but the experimenter could still observe the subject via video. After this, they were asked to rate the intensity of their emotion and after a short free ride they experienced one influencing strategy and another query of their emotional state after some time had passed. This was repeated five times, once for each concept and for the baseline. In the end, participants were asked to rank the strategies according to their personal perception and to justify their decision in a short unstructured interview.
4.6. Limitations
The study was conducted in a driving simulator due to safety reservations. We expect comparable outcomes as in a real driving context [
63]. Participants were employees of the BMW Group; however, we exercised due care with recruiting to avoid a biased user sample.
5. Results
We present the results split by the between-subject groups Anger and Sadness. The within-subject variable Baseline serves as ground truth to compare the effects of each strategy. The statistical information given comes from an analysis of variance if not stated otherwise. Values for direct comparisons were calculated using a t-test.
5.1. Driving Performance
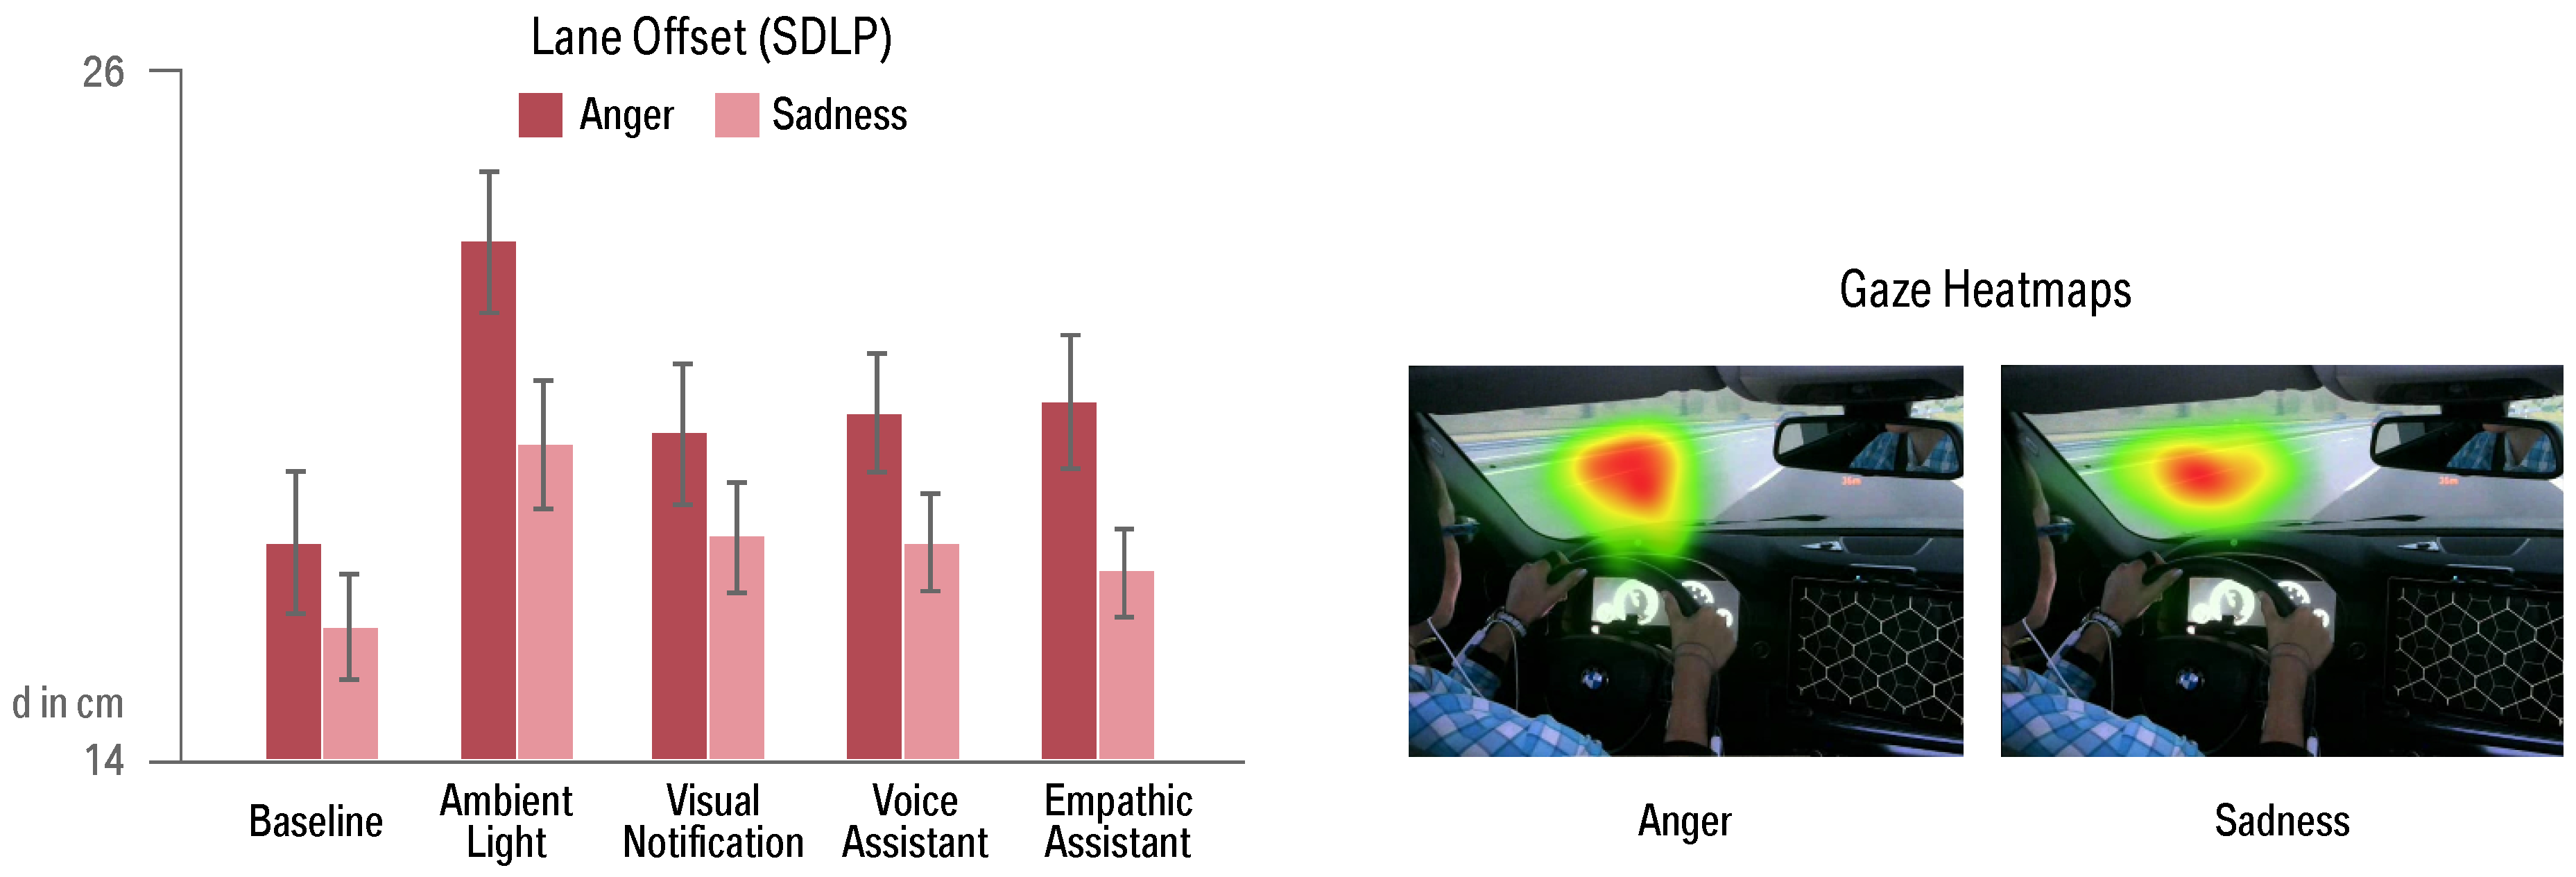
Drivers had to follow a vehicle and keep the distance throughout the ride, which they were generally able to do as headway variability was not notably different between strategies or emotions. The lane offset (SDLP) in contrast shows significant differences between strategies (
) and groups (
,
p < 0.001).
Figure 4 illustrates that drivers in the
Anger group showed higher lateral deflection than drivers with induced
Sadness. Concept
Ambient Light also led to higher lateral deviations compared to
Baseline (
). Deterioration of driving performance is common for interactions with in-vehicle UIs. However, only the maximum SDLP of
m for the strategy
Ambient Light in the
Anger condition is close to the threshold for unsafe straddling of
m as defined by Brookhuis et al. [
6].
5.2. Eye Tracking
Eye-tracking data provides no indication of increased visual activity for any strategy. However, we found that gaze heatmaps of participants in group
Anger showed more agitated gaze behavior than those of participants in group
Sadness. There is also tendency for a more downcast look with angry drivers (see
Figure 4).
5.3. Driver Workload
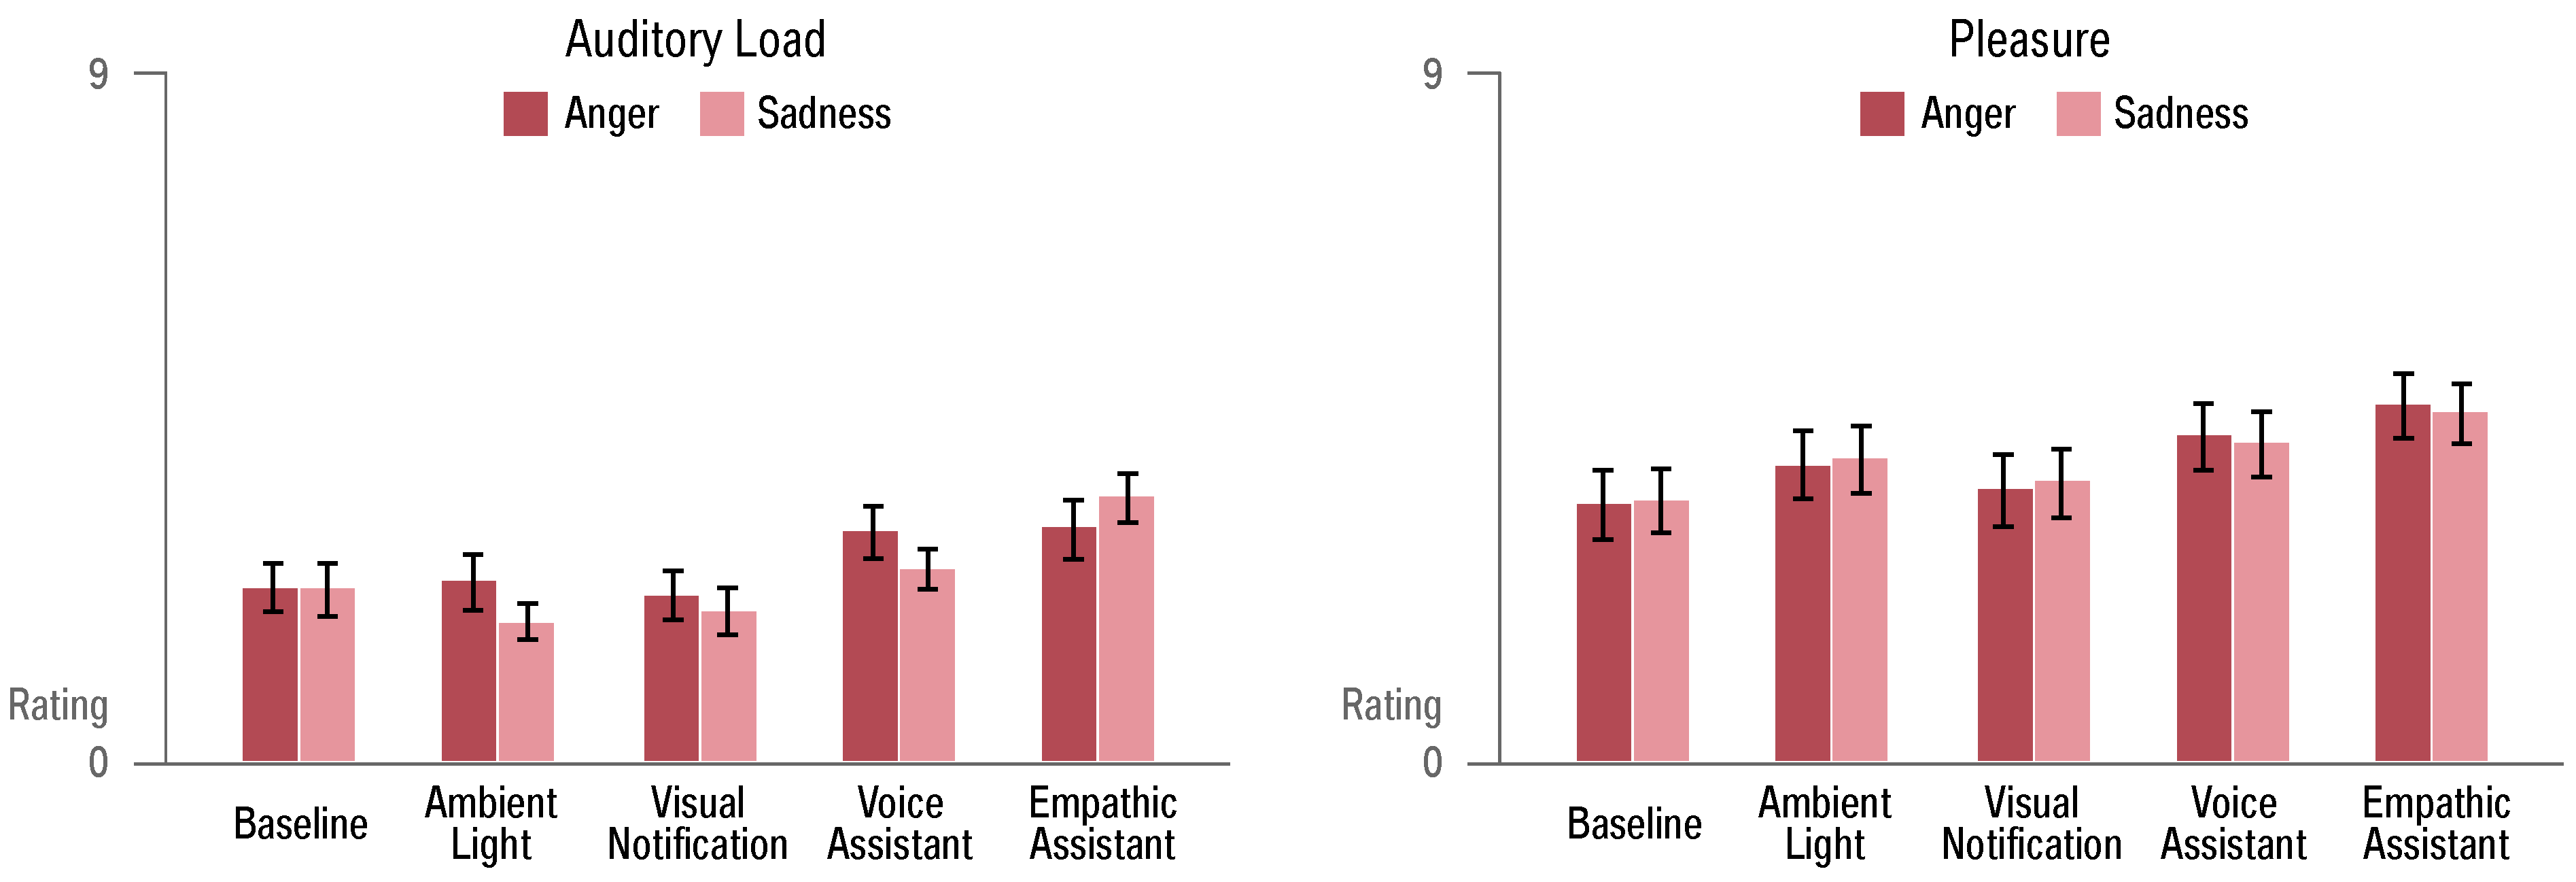
The DALI questionnaire provides self-ratings for driver workload, which showed no differences between groups or strategies for mental and visual workload or induced stress. The mental workload, however, was rather high for all participants with values of for group Anger and for group Sadness (scale 0–9), which might stem from the induced emotional strain they experienced.
Auditory workload shows significant differences between strategies (
,
p < 0.001), with increased values for
Empathic Assistant compared to
Baseline (
p = 0.022) and
Ambient Light (
p = 0.003), as illustrated in
Figure 5. The ratings for pleasure of use show significant differences between strategies (
,
p = 0.045), with only
scoring significantly better than
(
p = 0.044).
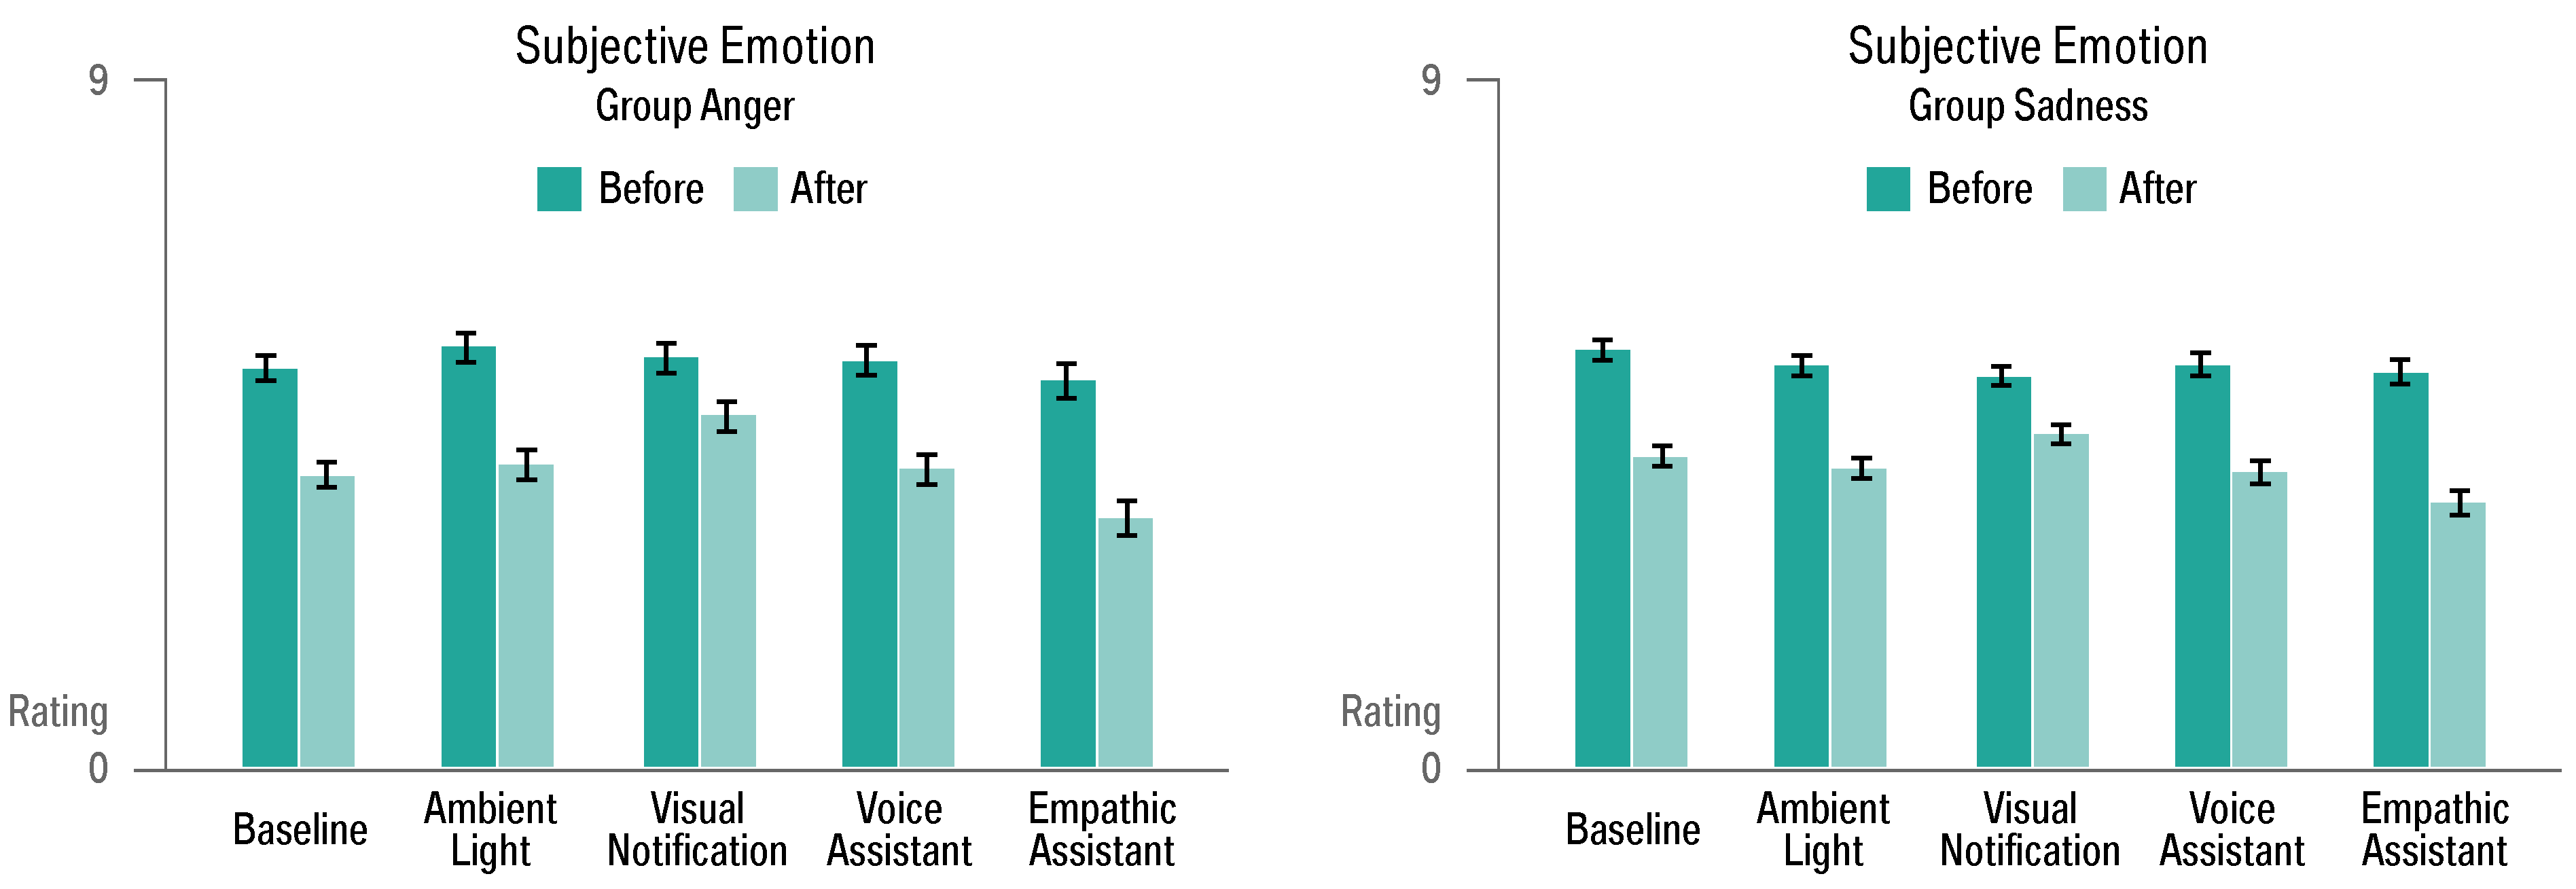
5.4. Emotional Self-Assessment
Drivers rated the intensity of the induced emotional state before and after interacting with each concept. An ANOVA with repeated measures shows differences between measures (
p < 0.001) and interaction effects between strategies (
,
p = 0.019). Statistically non-significant tendencies show that
Visual Notification helped less to reduce sadness and anger than
Baseline, while the
Empathic Assistant led to the highest decrease of negative emotions (see
Figure 6).
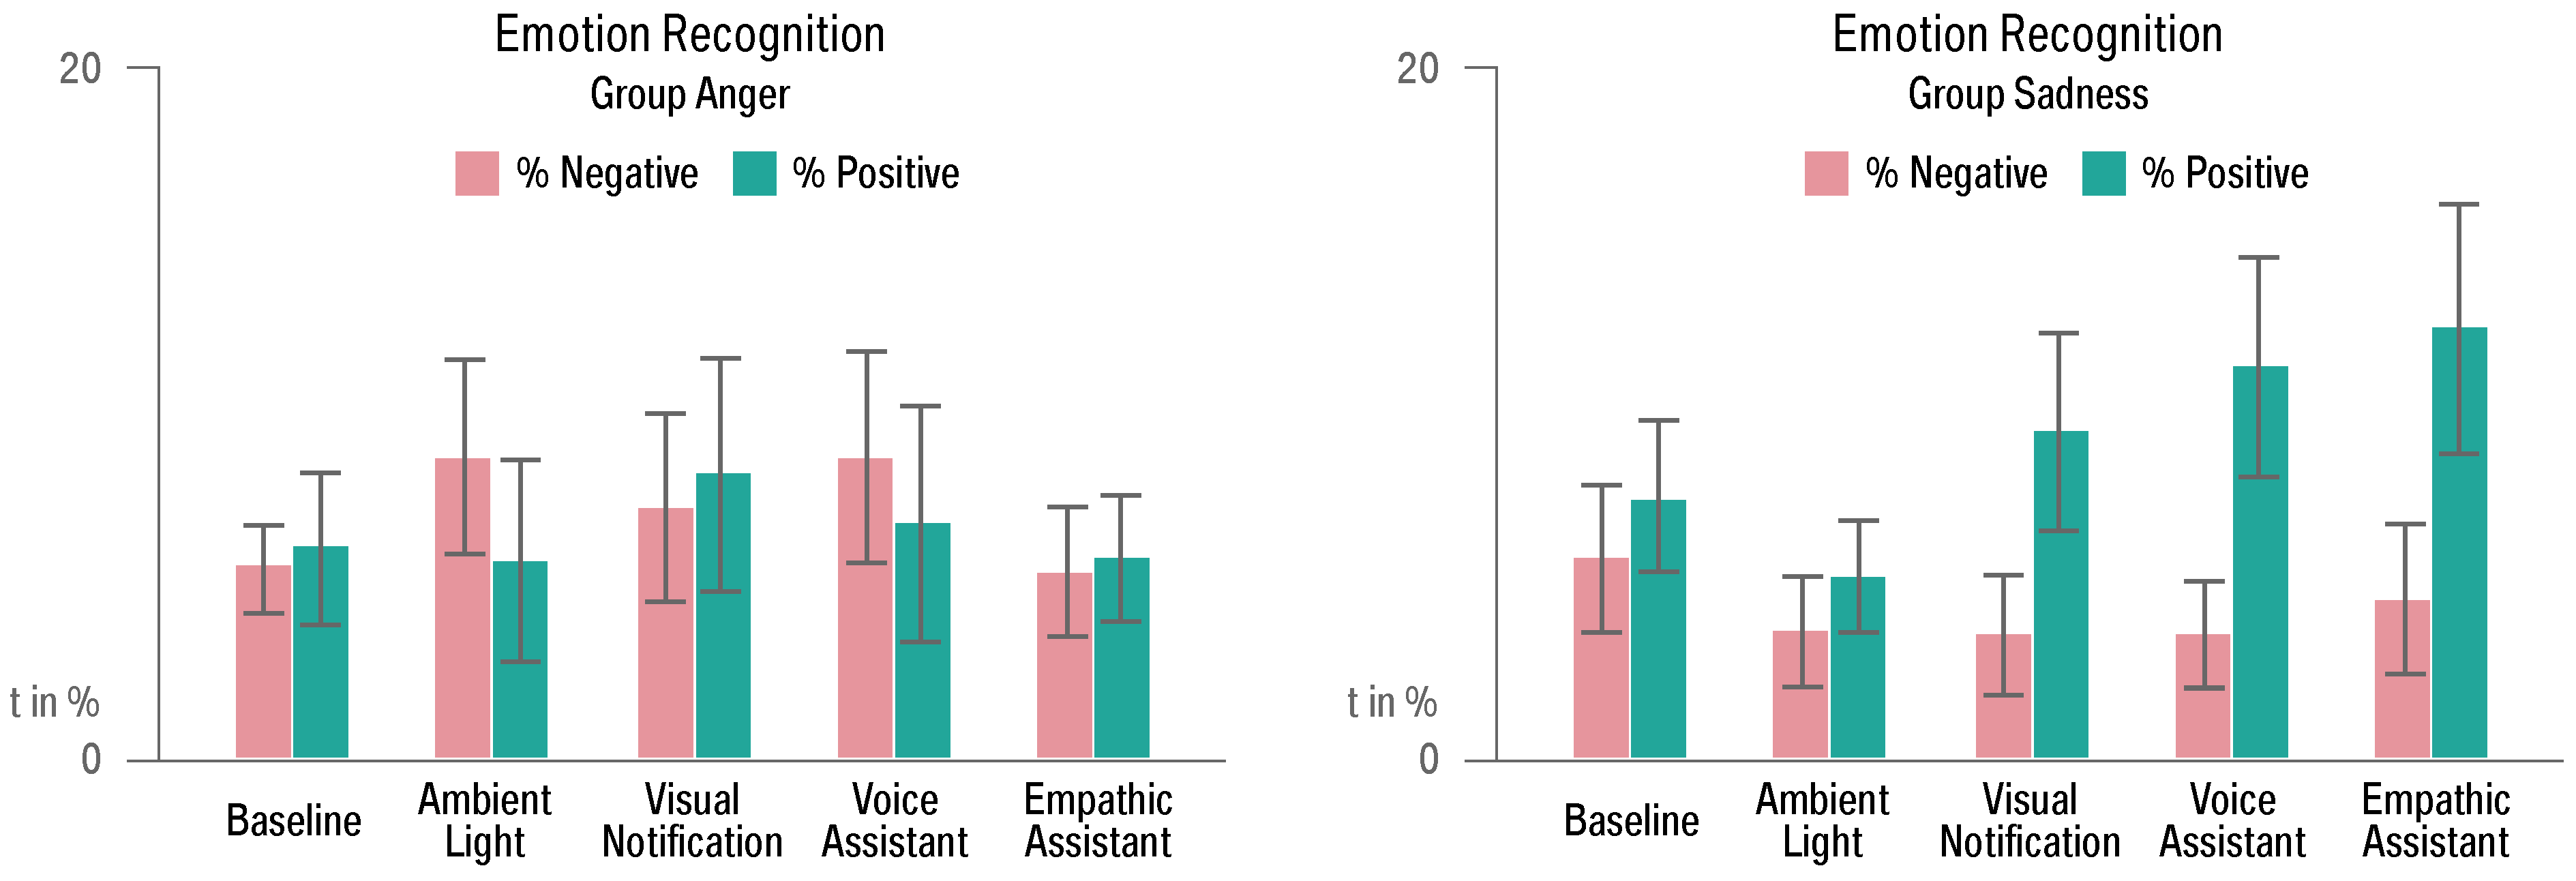
5.5. Emotion Recognition
Emotion recognition from facial expressions was used to analyse the driver’s valence during the ride.
Figure 7 shows that there were no significant differences between strategies for the
Anger group but more negative expressions than among the
Sadness group (
). Participants with induced sadness also showed a high variance for positive valence.
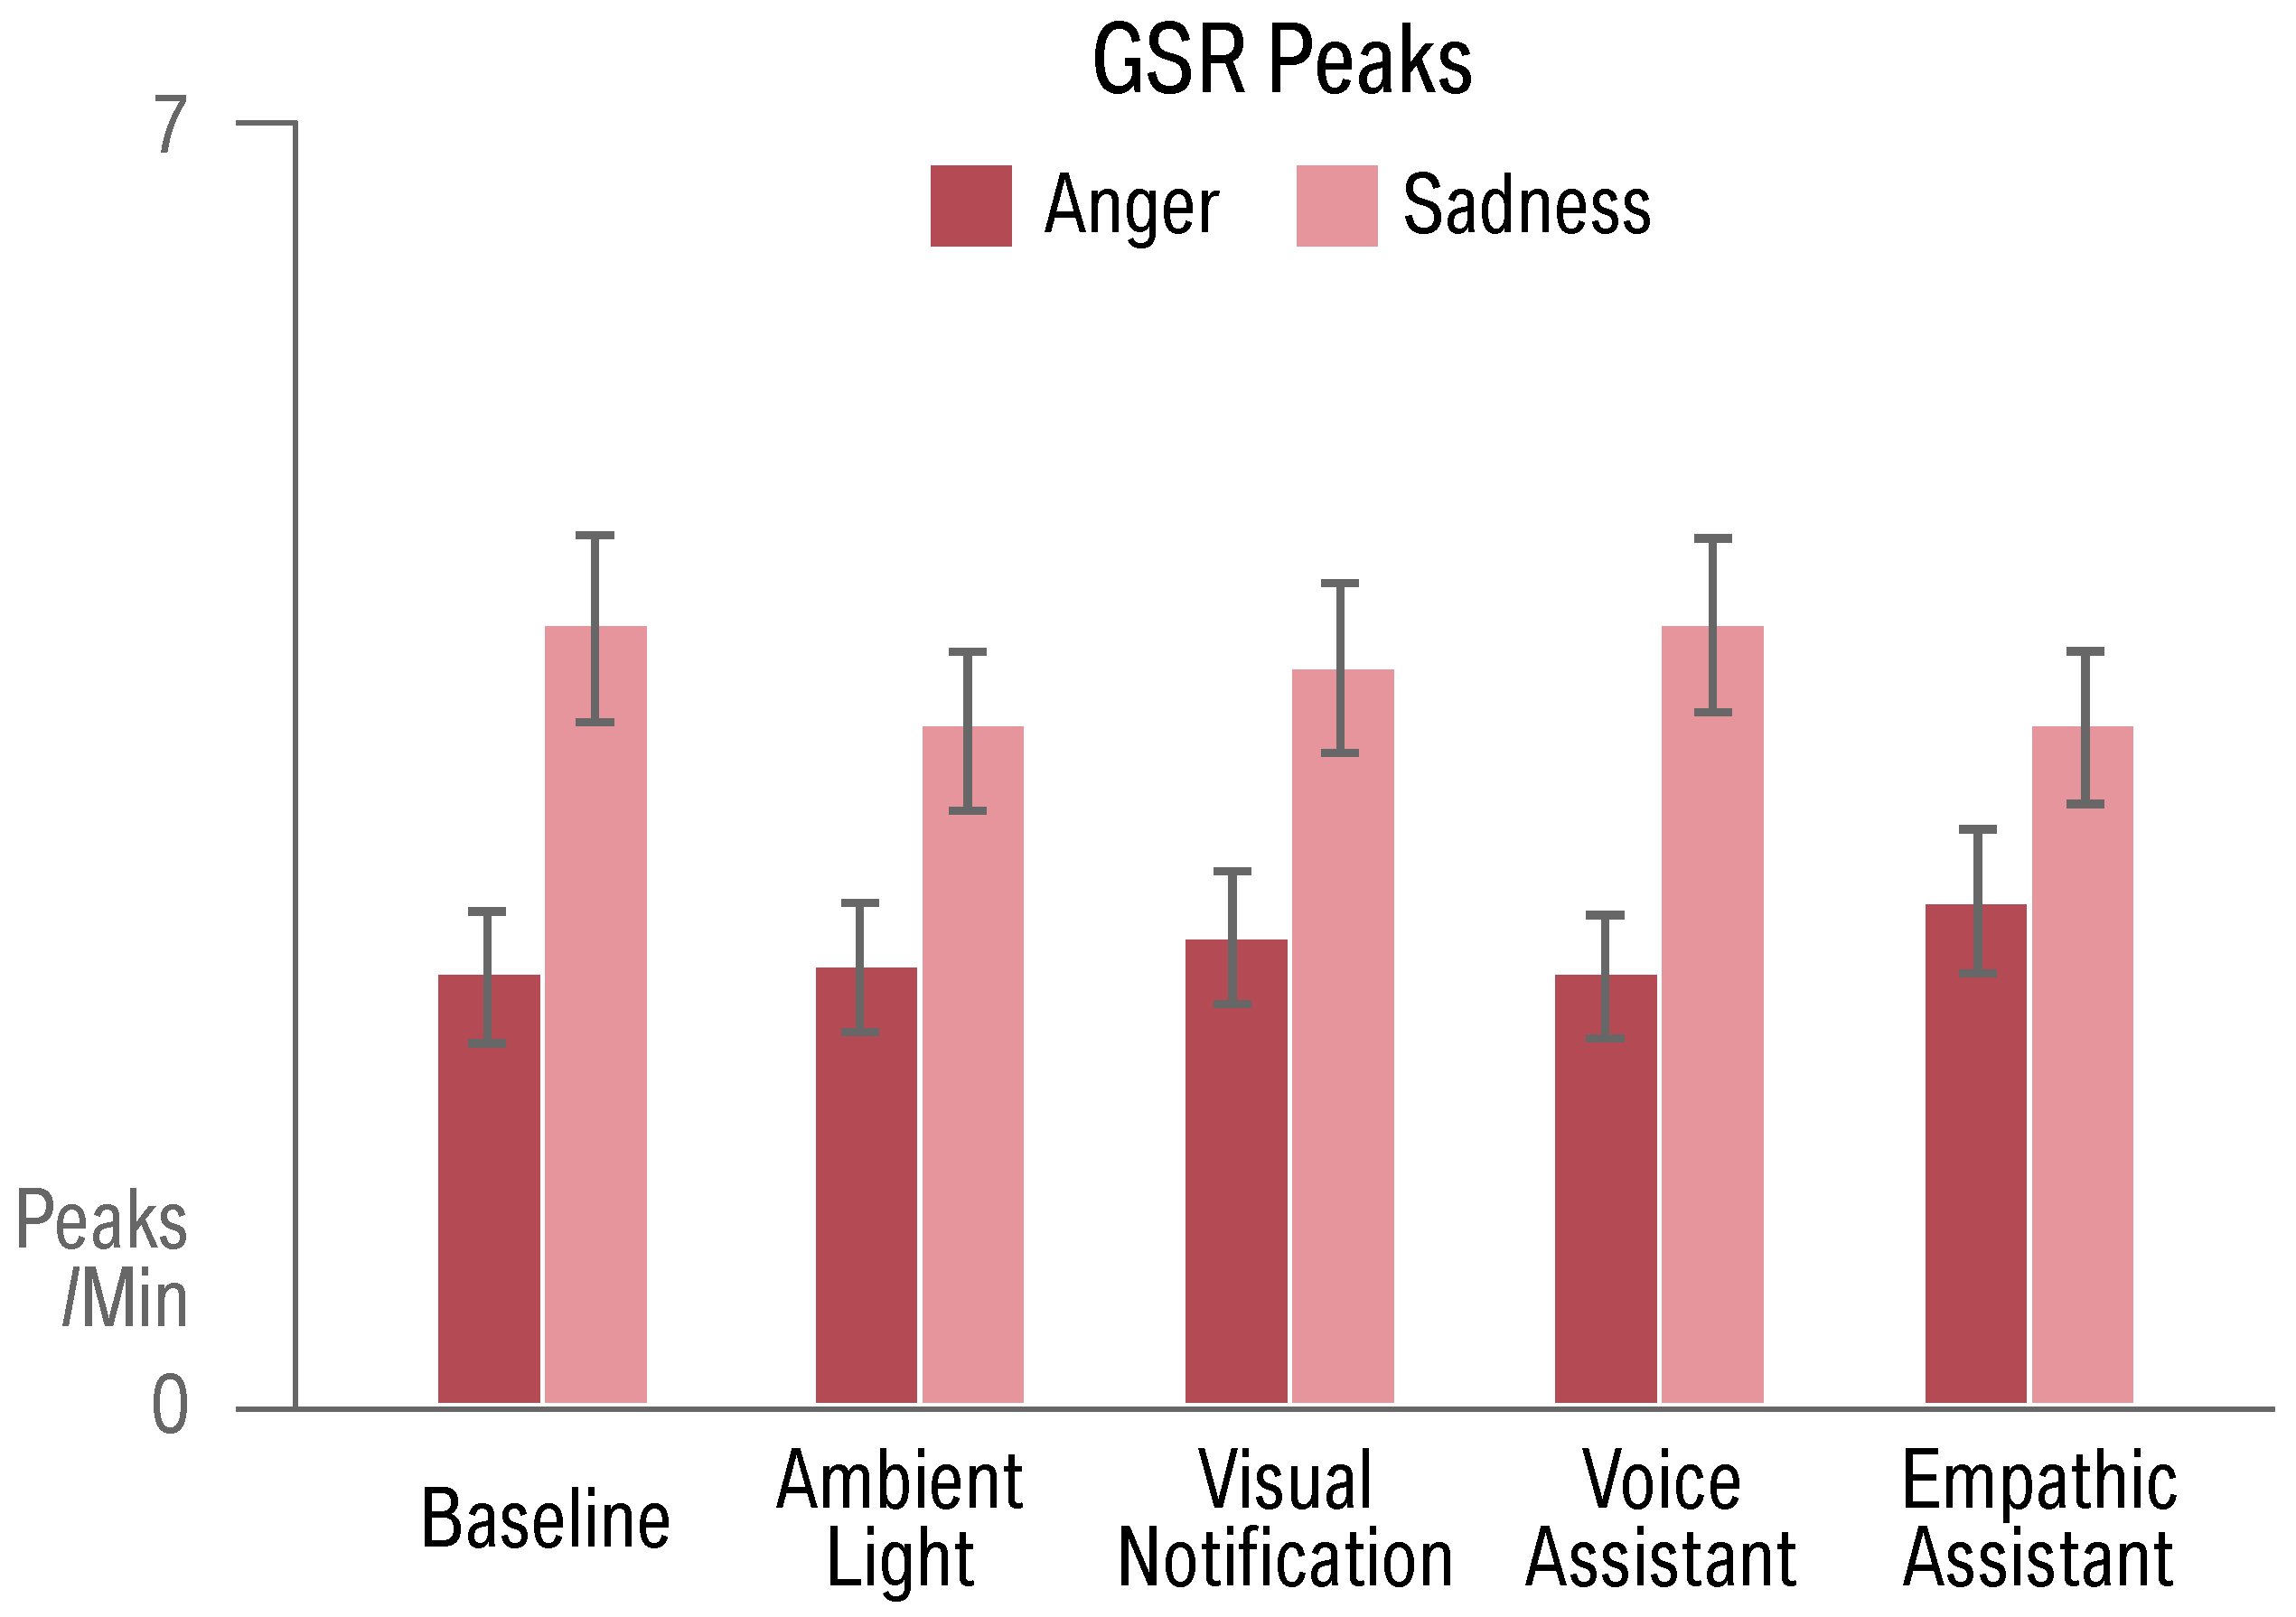
5.6. Physiological Measures
Besides emotion detection through video, we also collected physiological data during the rides. An analysis of galvanic skin response (GSR) peaks per minute shows significant differences between groups (
) but not between strategies (see
Figure 8). Measurements of heart rate provide no differences between strategies or groups.
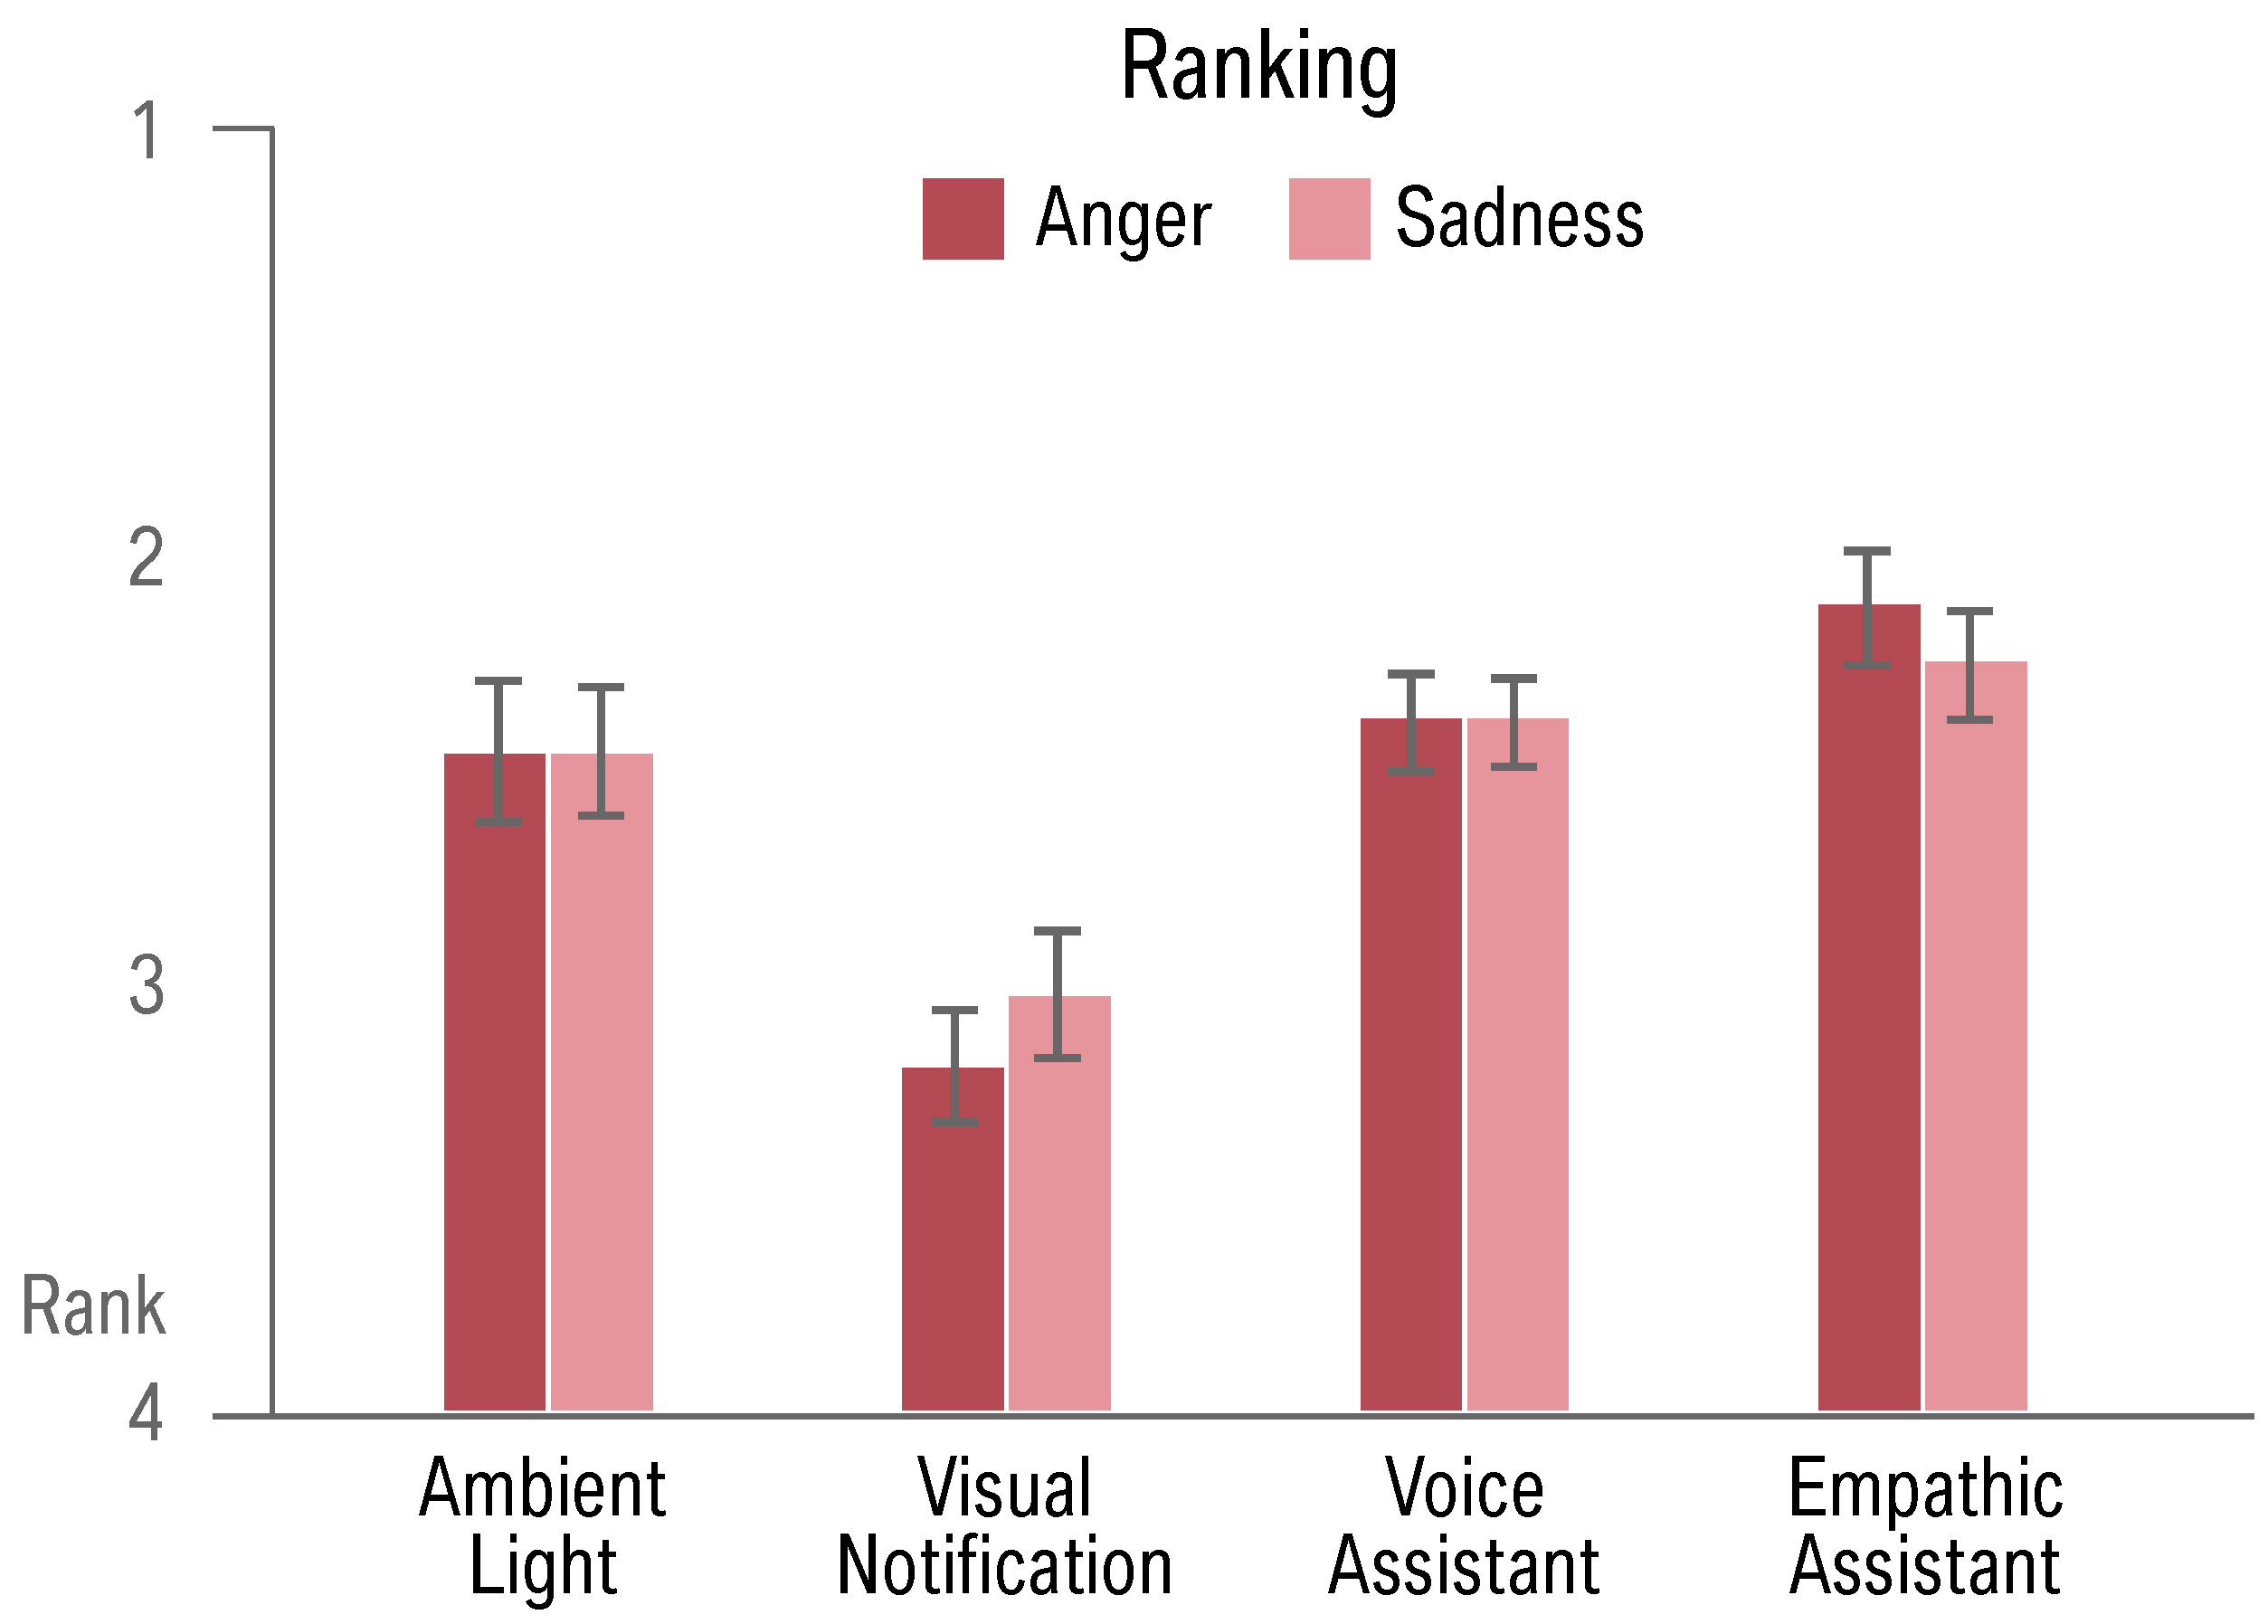
5.7. Subjective Feedback
Participants provided a subjective ranking of the experienced strategies and gave further feedback in a final interview. The ranking (see
Figure 9) shows significant differences between the four strategies (
F(3,9.460) = 17.358,
p < 0.001).
Baseline was excluded as it contains no interaction. There are no differences between emotion groups. In direct comparison, concept
Visual Notification is placed significantly worse than the other concepts (
p < 0.001). In the following, we provide short overviews of the feedback we received for each concept.
5.7.1. Ambient Light
In addition, 17/60 (28.3%) participants state that the light influenced their emotions positively, while 5 (8.3%) say the opposite. One-third perceived the light as disturbing. Many participants suggested that Ambient Light could be used to support one of the more interactive approaches to improve the overall experience.
5.7.2. Visual Notification
The only visual strategy in the test was the most criticized instance, as 26 participants (46.3%) see it as disturbing or stressful. In addition, 17/60 (28.3%) see no use for such a system at all, while 12/60 (20%) could imagine an improved implementation which gives continuous live feedback on the driver state. Other suggestions for improvement involve a way to control the display to mitigate felt paternalism.
5.7.3. Voice Assistant
Feedback by 23/60 participants (31.7%) draws this strategy as second to the Empathic Assistant. However, some (9/60, 15%) prefer the Voice Assistant. Eight participants (13%) find it distracting and seven (11.7%) would have preferred personalized music instead of the radio. Other issues voiced in the feedback were the computer voice and perceived paternalism.
5.7.4. Empathic Assistant
Furthermore, 19/60 participants specifically prefer this strategy over the Voice Assistant, 17 (28.3%) noticed no difference between the two, and 12 (20%) disliked the Empathic Assistant. Nine participants (15%) found this approach distracting, and general feedback also contained comments on the artificial computer voice and perceived paternalism.
6. Discussion
Our results suggest that not all modalities are equally suitable for an interaction with emotionally engaged drivers. We discuss the hypotheses from
Section 4.1 and the most meaningful learnings we draw for future work.
6.1. Effects of Negative Emotions on Driving Performance
Participants in our study had no major problems to complete the primary driving task. SDLP data shows imperfect performance from sad drivers and significantly worse performance in the angry condition. However, no group showed dangerous swerving or accidents. Most influencing strategies did neither improve nor worsen the performance significantly. Only ambient light increased lane exceedance compared to the baseline. The measures of driving performance only show tendencies of negative effects of emotions which were previously found in other work. Our experiment design does not allow the scrutinization of this aspect, as a third group without emotional influences would have been needed. Therefore, we cannot confidently accept the hypothesis that driving performance is impaired by negative emotions and that this can be mitigated through interaction (H1). We assume that driving in real traffic offers more uncertainty and might expose the effects of negative affective states, and with that the efficiency of influencing strategies, more clearly.
6.2. Connections between Workload and Emotional State
We hypothesized that an improvement of the affective state also improves the experienced workload of the driver and affects physiological measures (H2). We cannot completely verify this assumption as the workload was consistent for all strategies, no matter whether they achieved influencing the driver or not. An analysis of physiological signals, however, shows changes for galvanic skin response and facial impressions which support a connection to the emotional state of the driver. We can explain these findings with the theoretical view that emotional state and workload are not directly connected and rather are two parameters to quantify the user’s current state. The concept Empathic Assistant, for example, caused an increase of auditory workload but managed to change physiological measures of affect into a more positive direction. This has implications for the evaluation of affective automotive user interfaces and can also explain why no differences in driving performance could be found although negative emotions were decreased: because the driver’s workload was elevated simultaneously.
6.3. Efficacy of Emotion Influencing Strategies
The initial question motivating this work was whether different strategies to mitigate emotions have different effects on the emotional state of the driver (H3). We can accept this claim as the
Empathic Assistant turns out to be most effective in reducing negative emotions, both for sad and angry drivers. Measures of facial emotions as well as subjective pleasure and the comparison ranking show this strategy as a promising approach towards emotion improvement. Natural interaction has been a trend in automotive interfaces for some time and just as with social robots, a human touch to the interaction seems to allow a closer connection and thus more emotional influence on the driver. Hypothesis 4 assumes that the driver’s emotion is a distinguishing feature for interaction preferences and the efficacy of the system. We cannot see differences regarding preferred interaction methods between the groups. Drivers in the
Sadness group, however, reacted more positively to voice interaction than those in the
Anger group (see
Figure 7).
6.4. Perception of Paternalism
Although paternalism has been named as an issue in interviews, participants did not prefer the subliminal concept Ambient Light over more explicit influences. Concept Visual Notification, however, was assessed as too patronizing and also ranked worse than all other concepts. We conclude that the proactive recommendations in concepts Voice Assistant and Empathic Assistant were not perceived as overly patronizing, although they actively intervened in the driver’s freedom of action. Thus, we dismiss H5, which states that users might prefer subliminal influencing over direct interaction due to perceived paternalism. Subjective feedback suggests using subliminal cues like ambient light in addition to explicit interactions to promote a positive atmosphere in the car.
7. Conclusions and Future Work
One take-away we can derive from the presented results is that a driver state model needs to distinguish between different manifestations of the driver’s current condition. Emotions and workload are distinct phenomena which can have disparate implications on safety and interact with each other. We propose a driver model consisting of a set of long-term traits, like personality or expertise, and short-term traits like emotions, physiology, or cognitive load [
16].
Another key finding we want to emphasize is the efficacy of speech-based interfaces, invigorating the momentary trend of natural user interfaces and the “speech-first” movement within the automotive industry. Our concept Empathic Assistant might be a viable starting point for empathically enhanced voice assistants in the car. Subliminal methods like ambient light can be used to improve the overall atmosphere in the interior; however, potential distractions caused by the visual stimulus have to be controlled.
Our interpretation of a driver state display was not accepted by participants, which extends our understanding of continuous driver state displays insofar as negative representations might have to be avoided. If the UI gives feedback on the emotional state of the driver, it should do so in a more abstract way, giving the driver more control on interpretation and reaction. Participants also found fault with a perceived paternalism which most likely contributed to their aversion towards the Visual Notification concept, which needs to be prevented in future implementations.
Upcoming questions for affective in-car interfaces should focus on open questions like when to trigger interactions and whether proactive system behavior is subject to limitations regarding distraction or social acceptance. The underlying classification algorithms will be needed to adapt to user reactance and include more data points than currently envisioned. Can driving behavior, street conditions, the type of journey, or the company within the vehicle be decisive for a better driver model? How can we interact with groups of people and which social problems arise for affective interaction in a multi-user environment? In addition, how will these systems perform over time? We expect exciting research in this young field which might not come without disappointments and surprises, but we are sure that this research contributes to the big picture of driver safety.
Author Contributions
Conceptualization, methodology, M.B., J.S., B.P. and F.A.; software, validation, investigation, formal analysis, writing—original draft preparation, visualization, M.B. and J.S.; writing—review and editing, supervision, F.A.
Funding
This research received no external funding.
Conflicts of Interest
The authors declare no conflict of interest.
References
- Jeon, M. Towards affect-integrated driving behaviour research. Theor. Issues Ergon. Sci. 2015, 16, 553–585. [Google Scholar] [CrossRef]
- Eyben, F.; Wöllmer, M.; Poitschke, T.; Schuller, B.; Blaschke, C.; Färber, B.; Nguyen-Thien, N. Emotion on the Road—Necessity, Acceptance, and Feasibility of Affective Computing in the Car. Adv. Hum.-Comput. Interact. 2010, 2010, 1–17. [Google Scholar] [CrossRef]
- Jeon, M. Don’t Cry While You’re Driving: Sad Driving is as Bad as Angry Driving. Int. J. Hum.-Comput. Interact. 2016, 32, 777–790. [Google Scholar] [CrossRef]
- Braun, M.; Pfleging, B.; Alt, F. A Survey to Understand Emotional Situations on the Road and What They Mean for Affective Automotive UIs. Multimodal Technol. Interact. 2018, 2, 75. [Google Scholar] [CrossRef]
- Pfleging, B.; Schmidt, A. (Non-) Driving-Related Activities in the Car: Defining Driver Activities for Manual and Automated Driving. In Proceedings of the Workshop on Experiencing Autonomous Vehicles: Crossing the Boundaries between a Drive and a Ride at CHI’15, Seoul, Korea, 18–23 April 2015. [Google Scholar]
- Brookhuis, K.A.; Waard, D.D.; Fairclough, S.H. Criteria for Driver Impairment. Ergonomics 2003, 46, 433–445. [Google Scholar] [CrossRef] [PubMed]
- Roider, F.; Rümelin, S.; Pfleging, B.; Gross, T. The Effects of Situational Demands on Gaze, Speech and Gesture Input in the Vehicle. In Proceedings of the 9th International Conference on Automotive User Interfaces and Interactive Vehicular Applications—AutomotiveUI, Oldenburg, Germany, 24–27 September 2017; ACM: New York, NY, USA, 2017. [Google Scholar]
- Meschtscherjakov, A.; Wilfinger, D.; Scherndl, T.; Tscheligi, M. Acceptance of Future Persuasive In-car Interfaces Towards a More Economic Driving Behaviour. In Proceedings of the 1st International Conference on Automotive User Interfaces and Interactive Vehicular Applications, Essen, Germany, 21–22 September 2009; ACM: New York, NY, USA, 2009; pp. 81–88. [Google Scholar] [CrossRef]
- Kumar, M.; Kim, T. Dynamic Speedometer: Dashboard Redesign to Discourage Drivers from Speeding. In Proceedings of the CHI ’05 Extended Abstracts on Human Factors in Computing Systems, Portland, OR, USA, 2–7 April 2005. [Google Scholar]
- Hoedemaeker, M.; Neerincx, M. Attuning In-Car User Interfaces to the Momentary Cognitive Load. In Foundations of Augmented Cognition; Springer: Berlin/Heidelberg, Germany, 2007; pp. 286–293. [Google Scholar]
- Schmidt, E.; Bullinger, A.C. Mitigating passive fatigue during monotonous drives with thermal stimuli: Insights into the effect of different stimulation durations. Accid. Anal. Prev. 2017. [Google Scholar] [CrossRef] [PubMed]
- Steyer, R.; Ferring, D.; Schmitt, M.J. States and traits in psychological assessment. Eur. J. Psychol. Assess. 1992, 8, 79–98. [Google Scholar]
- Jeon, M.; Yim, J.B.; Walker, B.N. An angry driver is not the same as a fearful driver. In Proceedings of the 3rd International Conference on Automotive User Interfaces and Interactive Vehicular Applications— AutomotiveUI, Salzburg, Austria, 30 November–2 December 2011; ACM: New York, NY, USA, 2011. [Google Scholar]
- Nass, C.; Jonsson, I.M.; Harris, H.; Reaves, B.; Endo, J.; Brave, S.; Takayama, L. Improving Automotive Safety by Pairing Driver Emotion and Car Voice Emotion. In Proceedings of the CHI ’05 Extended Abstracts on Human Factors in Computing Systems, Portland, OR, USA, 2–7 April 2005; ACM: New York, NY, USA, 2005; pp. 1973–1976. [Google Scholar] [CrossRef]
- Jeon, M. Emotions in Driving. In Emotions and Affect in Human Factors and Human-Computer Interaction; Elsevier: Amsterdam, The Netherlands, 2017; pp. 437–474. [Google Scholar]
- Braun, M.; Alt, F. Affective Assistans: A Matter of States and Traits. In Proceedings of the CHI Conference on Human Factors in Computing Systems Extended Abstracts, Glasgow, UK, 4–9 May 2019; ACM: New York, NY, USA, 2019. [Google Scholar]
- Ekman, P.; Davidson, R. The Nature of Emotion: Fundamental Questions; Oxford University Press: New York, NY, USA, 1994. [Google Scholar]
- Russell, J. A Circumplex Model of Affect. J. Personal. Soc. Psychol. 1980, 39, 1161–1178. [Google Scholar] [CrossRef]
- Yerkes, R.M.; Dodson, J.D. The relation of strength of stimulus to rapidity of habit-formation. J. Comp. Neurol. Psychol. 1908, 18, 459–482. [Google Scholar] [CrossRef]
- McDuff, D.; Czerwinski, M. Designing emotionally sentient agents. Commun. ACM 2018, 61, 74–83. [Google Scholar] [CrossRef]
- Hsieh, L.; Seaman, S.; Young, R. Effect of Emotional Speech Tone on Driving from Lab to Road: FMRI and ERP Studies. In Proceedings of the 2nd International Conference on Automotive User Interfaces and Interactive Vehicular Applications, Pittsburgh, PA, USA, 11–12 November 2010; ACM: New York, NY, USA, 2010; pp. 22–28. [Google Scholar] [CrossRef]
- Islinger, T.; Köhler, T.; Wolff, C. Human modeling in a driver analyzing context. In Proceedings of the 3rd International Conference on Automotive User Interfaces and Interactive Vehicular Applications— AutomotiveUI, Salzburg, Austria, 30 November–2 December 2011; ACM: New York, NY, USA, 2011. [Google Scholar]
- Coughlin, J.F.; Reimer, B.; Mehler, B. Monitoring, managing, and motivating driver safety and well-being. IEEE Pervasive Comput. 2011, 10, 14–21. [Google Scholar] [CrossRef]
- Schmidt, E.; Decke, R.; Rasshofer, R. Correlation between subjective driver state measures and psychophysiological and vehicular data in simulated driving. In Proceedings of the 2016 IEEE Intelligent Vehicles Symposium (IV), Gothenburg, Sweden, 19–22 June 2016. [Google Scholar]
- Schmidt, E.; Ochs, J.; Decke, R.; Bullinger, A.C. Evaluating Drivers’ States in Sleepiness Countermeasures Experiments Using Physiological and Eye Data–Hybrid Logistic and Linear Regression Model. In Proceedings of the 9th International Driving Symposium on Human Factors in Driver Assessment, Training, and Vehicle Design: Driving Assessment 2017, Manchester, VT, USA, 26–29 June 2017. [Google Scholar] [CrossRef]
- Nasoz, F.; Ozyer, O.; Lisetti, C.L.; Finkelstein, N. Multimodal Affective Driver Interfaces for Future Cars. In Proceedings of the Tenth ACM International Conference on Multimedia, Juan-les-Pins, France, 1–6 December 2002; ACM: New York, NY, USA, 2002; pp. 319–322. [Google Scholar] [CrossRef]
- Fairclough, S.H. Fundamentals of physiological computing. Interact. Comput. 2009, 21, 133–145. [Google Scholar] [CrossRef]
- Hassib, M.; Khamis, M.; Schneegass, S.; Shirazi, A.S.; Alt, F. Investigating User Needs for Bio-sensing and Affective Wearables. In Proceedings of the 2016 CHI Conference Extended Abstracts on Human Factors in Computing Systems, San Jose, CA, USA, 7–12 May 2016; ACM: New York, NY, USA, 2016; pp. 1415–1422. [Google Scholar] [CrossRef]
- Velusamy, S.; Kannan, H.; Anand, B.; Sharma, A.; Navathe, B. A method to infer emotions from facial Action Units. In Proceedings of the 2011 IEEE International Conference on Acoustics, Speech and Signal Processing (ICASSP), Prague, Czech Republic, 22–27 May 2011. [Google Scholar]
- Hoch, S.; Althoff, F.; McGlaun, G.; Rigoll, G. Bimodal Fusion of Emotional Data in an Automotive Environment. In Proceedings of the IEEE International Conference on Acoustics, Speech, and Signal Processing, Philadelphia, PA, USA, 23 March 2005. [Google Scholar]
- Pfleging, B.; Fekety, D.K.; Schmidt, A.; Kun, A.L. A Model Relating Pupil Diameter to Mental Workload and Lighting Conditions. In Proceedings of the 2016 CHI Conference on Human Factors in Computing Systems—CHI ’16, San Jose, CA, USA, 7–12 May 2016. [Google Scholar]
- Harris, H.; Nass, C. Emotion Regulation for Frustrating Driving Contexts. In Proceedings of the SIGCHI Conference on Human Factors in Computing Systems, Vancouver, BC, Canada, 7–12 May 2011; ACM: New York, NY, USA, 2011; pp. 749–752. [Google Scholar] [CrossRef]
- Williams, K.; Flores, J.A.; Peters, J. Affective Robot Influence on Driver Adherence to Safety, Cognitive Load Reduction and Sociability. In Proceedings of the 6th International Conference on Automotive User Interfaces and Interactive Vehicular Applications, Seattle, WA, USA, 17–19 September 2014; ACM: New York, NY, USA, 2014; pp. 25:1–25:8. [Google Scholar]
- Riener, A.; Jeon, M.; Alvarez, I.; Frison, A.K. Driver in the Loop: Best Practices in Automotive Sensing and Feedback Mechanisms. In Automotive User Interfaces; Springer International Publishing: Berlin, Germany, 2017; pp. 295–323. [Google Scholar]
- Wang, C.; Terken, J.; Hu, J.; Rauterberg, M. “Likes” and “Dislikes” on the Road: A Social Feedback System for Improving Driving Behavior. In Proceedings of the 8th International Conference on Automotive User Interfaces and Interactive Vehicular Applications, Ann Arbor, MI, USA, 24–26 October 2016; ACM: New York, NY, USA, 2016; pp. 43–50. [Google Scholar] [CrossRef]
- Perone, M. Negative effects of positive reinforcement. Behav. Anal. 2003, 26, 1–14. [Google Scholar] [CrossRef] [PubMed]
- Pfleging, B.; Schneegass, S.; Meschtscherjakov, A.; Tscheligi, M. Experience Maps: Experience-Enhanced Routes for Car Navigation. In Proceedings of the 6th International Conference on Automotive User Interfaces and Interactive Vehicular Applications, Seattle, WA, USA, 17–19 September 2014; ACM: New York, NY, USA, 2014; pp. 1–6. [Google Scholar] [CrossRef]
- Hernandez, J.; McDuff, D.; Benavides, X.; Amores, J.; Maes, P.; Picard, R. AutoEmotive: Bringing Empathy to the Driving Experience to Manage Stress. In Proceedings of the 2014 Companion Publication on Designing Interactive Systems—DIS Companion ’14, Vancouver, BC, Canada, 21–25 June 2014. [Google Scholar]
- FakhrHosseini, M.; Jeon, M. The Effects of Various Music on Angry Drivers’ Subjective, Behavioral, and Physiological States. In Proceedings of the 8th International Conference on Automotive User Interfaces and Interactive Vehicular Applications, Ann Arbor, MI, USA, 24–26 October 2016; ACM: New York, NY, USA, 2016; pp. 191–196. [Google Scholar] [CrossRef]
- Fakhrhosseini, S.M.; Landry, S.; Tan, Y.Y.; Bhattarai, S.; Jeon, M. If You’Re Angry, Turn the Music on: Music Can Mitigate Anger Effects on Driving Performance. In Proceedings of the 6th International Conference on Automotive User Interfaces and Interactive Vehicular Applications, Seattle, WA, USA, 17–19 September 2014; ACM: New York, NY, USA, 2014; pp. 18:1–18:7. [Google Scholar] [CrossRef]
- Zhu, Y.; Wang, Y.; Li, G.; Guo, X. Recognizing and Releasing Drivers’ Negative Emotions by Using Music: Evidence from Driver Anger. In Proceedings of the 8th International Conference on Automotive User Interfaces and Interactive Vehicular Applications, Ann Arbor, MI, USA, 24–26 October 2016; ACM: New York, NY, USA, 2016; pp. 173–178. [Google Scholar] [CrossRef]
- Völkel, S.T.; Graefe, J.; Schödel, R.; Häuslschmid, R.; Stachl, C.; Au, Q.; Hussmann, H. I Drive My Car and My States Drive Me: Visualizing Driver’s Emotional and Physical States. In Proceedings of the 10th International Conference on Automotive User Interfaces and Interactive Vehicular Applications, Toronto, ON, Canada, 23–25 September 2018; ACM: New York, NY, USA, 2018; pp. 198–203. [Google Scholar] [CrossRef]
- Braun, M.; Chadowitz, R.; Alt, F. User Experience of Driver State Visualizations: A Look at Demographics and Personalities. In Proceedings of the Human-Computer Interaction—INTERACT 2019, Paphos, Cyprus, 2–6 September 2019; Springer International Publishing: Cham, Switzerland, 2019. [Google Scholar]
- Czerwinski, M.; Gilad-Bachrach, R.; Iqbal, S.; Mark, G. Challenges for Designing Notifications for Affective Computing Systems. In Proceedings of the 2016 ACM International Joint Conference on Pervasive and Ubiquitous Computing: Adjunct, Heidelberg, Germany, 12–16 September 2016; ACM: New York, NY, USA, 2016; pp. 1554–1559. [Google Scholar] [CrossRef]
- Schroeter, R.; Steinberger, F. Pokémon DRIVE: Towards Increased Situational Awareness in Semi-automated Driving. In Proceedings of the 28th Australian Conference on Computer-Human Interaction—OzCHI ’16, Launceston, Australia, 29 November–2 December 2016. [Google Scholar]
- Steinberger, F.; Proppe, P.; Schroeter, R.; Alt, F. CoastMaster: An Ambient Speedometer to Gamify Safe Driving. In Proceedings of the 8th International Conference on Automotive User Interfaces and Interactive Vehicular Applications—Automotive’UI 16, Ann Arbor, MI, USA, 24–26 October 2016. [Google Scholar]
- Steinberger, F.; Schroeter, R.; Foth, M.; Johnson, D. Designing Gamified Applications that Make Safe Driving More Engaging. In Proceedings of the 2017 CHI Conference on Human Factors in Computing Systems—CHI ’17, Denver, CO, USA, 6–11 May 2017. [Google Scholar]
- Byrne, D.; Griffitt, W. Similarity and awareness of similarity of personality characteristics as determinants of attraction. J. Exp. Res. Pers. 1969, 3, 179–186. [Google Scholar]
- Nezlek, J.B.; Kuppens, P. Regulating Positive and Negative Emotions in Daily Life. J. Personal. 2008, 76, 561–580. [Google Scholar] [CrossRef]
- Canazei, M.; Weiss, E. The influence of light on mood and emotion. In Handbook of Psychology of Emotions: Recent Theoretical Perspectives and Novel Empirical Findings; Nova Science Publishers: Hauppauge, NY, USA, 2013; Volume 1, pp. 297–306. [Google Scholar]
- Valdez, P.; Mehrabian, A. Effects of color on emotions. J. Exp. Psychol. Gen. 1994, 123, 394–409. [Google Scholar] [CrossRef] [PubMed]
- Spiridon, E.; Fairclough, S. The Effects of Ambient Blue Light on Anger Levels: Applications in the Design of Unmanned Aircraft GCS. Int. J. Unmanned Syst. Eng. 2017, 5, 53–69. [Google Scholar]
- Spiekermann, S.; Pallas, F. Technology paternalism—Wider implications of ubiquitous computing. Poiesis Praxis 2006, 4, 6–18. [Google Scholar] [CrossRef]
- Baker, R.C.; Guttfreund, D.O. The effects of written autobiographical recollection induction procedures on mood. J. Clin. Psychol. 1993, 49, 563–568. [Google Scholar] [CrossRef]
- Braun, M.; Weiser, S.; Pfleging, B.; Alt, F. A Comparison of Emotion Elicitation Methods for Affective Driving Studies. In Proceedings of the 10th International Conference on Automotive User Interfaces and Interactive Vehicular Applications, Toronto, ON, Canada, 23–25 September 2018; ACM: New York, NY, USA, 2018; pp. 77–81. [Google Scholar] [CrossRef]
- Green, P. Standard Definitions for Driving Measures and Statistics: Overview and Status of Recommended Practice J2944. In Proceedings of the 5th International Conference on Automotive User Interfaces and Interactive Vehicular Applications, Eindhoven, The Netherlands, 28–30 October 2013; ACM: New York, NY, USA, 2013; pp. 184–191. [Google Scholar] [CrossRef]
- Pauzie, A. A method to assess the driver mental workload: The driving activity load index (DALI). IET Intell. Transp. Syst. 2008, 2, 315–322. [Google Scholar] [CrossRef]
- Strobl, M.H. SPIDER—The innovative software framework of the BMW driving simulation. VDI-Berichte 2003, 1, 303–320. [Google Scholar]
- iMotions: Biometric Research Simplified. Available online: http://www.imotions.com (accessed on 23 January 2018).
- Shimmer3 GSR, ECG, EMG & Respiration Sensors. Available online: http://www.imotions.com/shimmer3-gsr (accessed on 23 January 2018).
- Emotient Module: Facial Expression Emotion Analysis. Available online: http://www.imotions.com/emotient (accessed on 23 January 2018).
- Tobii X2-60 Eye Tracker. Available online: http://www.imotions.com/tobii-x2-60 (accessed on 23 January 2018).
- Wang, Y.; Mehler, B.; Reimer, B.; Lammers, V.; D’Ambrosio, L.A.; Coughlin, J.F. The validity of driving simulation for assessing differences between in-vehicle informational interfaces: A comparison with field testing. Ergonomics 2010, 53, 404–420. [Google Scholar] [CrossRef] [PubMed]
© 2019 by the authors. Licensee MDPI, Basel, Switzerland. This article is an open access article distributed under the terms and conditions of the Creative Commons Attribution (CC BY) license (http://creativecommons.org/licenses/by/4.0/).


