Abstract
The development of automated driving will profit from an agreed-upon methodology to evaluate human–machine interfaces. The present study examines the role of feedback on interaction performance provided directly to participants when interacting with driving automation (i.e., perceived ease of use). In addition, the development of ratings itself over time and use case specificity were examined. In a driving simulator study, N = 55 participants completed several transitions between Society of Automotive Engineers (SAE) level 0, level 2, and level 3 automated driving. One half of the participants received feedback on their interaction performance immediately after each use case, while the other half did not. As expected, the results revealed that participants judged the interactions to become easier over time. However, a use case specificity was present, as transitions to L0 did not show effects over time. The role of feedback also depended on the respective use case. We observed more conservative evaluations when feedback was provided than when it was not. The present study supports the application of perceived ease of use as a diagnostic measure in interaction with automated driving. Evaluations of interfaces can benefit from supporting feedback to obtain more conservative results.
1. Introduction
Level 3 (L3) Automated Driving Systems (ADS) are about to enter the consumer market while Level 2 (L2) automation is already commercially available. According to the Society of Automotive Engineers (SAE), L2 driving automation [1] is defined as a combined lateral and longitudinal vehicle guidance function where the driver is responsible for supervising correct system functioning. With the step to L3 ADS, the human driver’s role shifts from that of supervisor to the fallback performer if the ADS exceeds its operational design domain (ODD). This change of responsibility increases the need for method development for automated driving since existing research methodologies (see e.g., [2]) for human–machine interfaces (HMI) cannot be simply transferred to higher levels of automation. Therefore, research and development of ADS HMI evaluation needs to examine existing methods and bring forth novel methods [3]. The present work contributes to method validation and development for automated driving by investigating the role of experience formation and use case specificity on diagnostic measures in HMI evaluation. Furthermore, the study examines the effect of feedback on operator success or failure when interacting with driving automation.
1.1. Validation and Development of Methodology
The evaluation of HMIs has a long tradition in the automotive context. In manual driving (SAE L0), the evaluation focused on the distraction potential of In-Vehicle Information Systems (IVIS). Thus, the central goal here is the assessment of visual workload associated with the IVIS (see e.g., [2,4]) While standardized test protocols and best practice approaches have been established for driver distraction, the change of the driver’s role from manual driver to supervisor in L2 and fallback performer in L3 automation makes the application of these methods impossible. In automated driving, a variety of theoretical constructs related to the safe driver-vehicle-interaction such as trust [5,6], controllability [7], mode awareness [8], or usability [9] could be used as criteria. Research has shown that these pose challenges to the design and evaluation of automated vehicle HMIs. For an outline of evaluation methods for automated vehicle HMIs see Naujoks et al. [10].
One further step towards ADS method validation concerns the investigation of dependent measures for a usability assessment [9]. In principle, both self-report data and behavioral observations can be used to assess the quality of an HMI for automated driving. First research efforts on the quality criteria of summative evaluations [11] brought forth empirical evidence for applying questionnaires when it comes to assessing satisfaction [12]. Forster et al. [13] have found evidence that summative evaluations of automated vehicle HMIs remain on a constant level over time. They also found that summative evaluations are closely tied to interaction performance in first system encounters. However, research on the suitability of diagnostic tools [11] for usability evaluation in this context is scarce. Diagnostic instruments seek to identify shortcomings and provide interface developers with recommendations for redesign. They capture the user’s state at a given time of measurement in a specific use case. Additionally, they indicate whether specific system functions work as intended or whether these are overly demanding for users.
One such measure is perceived ease of use (PEOU, [14]), which can be operationalized as a single item measure. PEOU has indeed been frequently used in automated vehicle research (e.g., [15,16,17,18,19,20,21,22,23]). The technology acceptance model [14] incorporates external factors (e.g., training), which directly influence PEOU. Consequently, ease of use should increase with more system experience. A study by Karahanna and Straub [24] on acceptance of e-mail systems, however, contradicts the assumption that training affects PEOU. Due to contradictory evidence, the present study investigates the effect of repeated exposure to an automated driving HMI on PEOU. Transitions from L0 to automated driving mode (e.g., L2, L3) are expected to show a strong effect over time. In contrast, user-initiated transitions to L0 should not show a comparable effect, since learning about the interaction has already occurred during the activation. Therefore, one aim of the present work is to investigate diagnostic measures (i.e., PEOU) regarding the influence of (1) repeated interaction and (2) use case specificity.
1.2. Judgment Calibration
Moreover, the present study examined the role of feedback about interaction performance on diagnostic self-report measures. The coupling of ADAS and driving automation increases the complexity of these systems. As a consequence, users face high demands when operating these for the first time [13,25]. Simultaneously, all users of ADS must be considered as novices when facing such an emerging technology [26]. Support for this assumption comes from studies on system understanding and mental models of driving automation [25,27]. The understanding of system and HMI functionality tends to be quite inaccurate before and after only one brief system exposure [25]. These two conditions—high system complexity and an inaccurate mental model as a novice user—pose a threat to the validity of diagnostic measures in automated driving development. If users of driving automation systems are not aware that their interaction did not follow the designer’s intent [28], they might consider it as easy to use. In contrast, from a designer’s perspective they had not shown error-free interaction. One example might be that users who try to activate an L3 ADS erroneously activate L2 driving automation. Without sufficient understanding of the HMI, they might still assume a successful interaction and report high ease of use. Users’ judgments thus might not align with what happened in reality. This happens frequently when observing attitude-behavior dissociations [29]. Dissociations between attitude and behavior have been reported in workload research [30]. While behavioral parameters of workload (e.g., pupil diameter) show high workload, under certain circumstances participants report low workload. Similar observations have been reported for attitudinal and behavioral parameters in usability studies [9,31].
Calibration research assumes that varying conditions under which judgments are made lead to different fits of these with the operator’s actual performance [32]. Such calibration effects are closely linked to self-regulatory mechanisms [33]. Self-reported judgments depend on feedback loops that provide necessary information about the status of one’s knowledge and strategies. The present work draws on the question and the effects of anchoring mechanisms from which judgments are made. More than four decades ago, Tversky and Kahnemann [34] have investigated humans’ judgments under uncertainty. They showed that people tend to estimate their performance in accordance to an initial value. However, driving automation users cannot have a realistic initial value of interaction performance besides their self-observation of time on task. Hence, their reported ease of use might be biased. Interacting with a system where only button presses while driving are necessary could seem comparably effortless. Even major problems from a designer’s perspective might not be obvious to the users thus biasing their initial estimation towards a positive value. From that, we assume that novice users do not exactly know whether and/or how well their interaction proceeded in accordance with the HMI designer’s intent. Calibrating effects for ease of use judgments should therefore be present when users are provided with information about their performance.
Calibrating users’ judgments in the automation domain up to now has mainly been investigated for trust in automation [35,36]. By investigating calibration for ease of use judgments, this work expands existing evidence of calibration in automated driving. It is important to mention that there is a close link between trust in automation and ease of use as suggested by Lee and See [37]. This also points towards investigations of calibrating ease of use judgments. With the present study, we aim to find out about different manifestations of PEOU judgments under different conditions regarding feedback loops (i.e., additional feedback vs. no feedback). If presented with feedback, users should be able to recognize whether and to what degree a trial was error-free or not and consequently adapt their PEOU ratings.
1.3. Objective and Hypotheses
From prior research and the considerations outlined above, the present work aims at an examination of ease of use judgments in automated driving. It shall be noted here that the present work focuses on the circumstances that might influence ease of use judgment. It shall provide researchers and practitioners with methodological insights into how such diagnostic measurements might manifest depending on study design. This work does explicitly not try to establish a method that researchers have to apply in future research settings. On the contrary, its goal is to provide a set of methodological possibilities (e.g., repetition, use cases, feedback) for research settings that lead to different outcomes of this dependent measure. Depending on each specific study purpose, researchers can draw from the present work for study design when it comes to ease of use judgments. The following hypotheses are derived:
Hypothesis 1.
Perceived ease of use increases over time.
Hypothesis 2.
Perceived ease of use shows use case specific patterns.
Hypothesis 3.
There is a calibrating effect of feedback on perceived ease of use. By providing feedback, perceived ease of use decreases.
2. Materials and Methods
2.1. Driving Simulation
The study was conducted in a high-fidelity moving-base driving simulator (see Figure 1a). The integrated vehicle’s console contained all the necessary instrumentation and was identical to a BMW 5 series with automatic transmission (see Figure 1b). Seven 1080p projectors provided a 240° horizontal × 45° vertical frontal field of view. One LCD screen positioned behind the back inside the vehicle mockup seats and two outside projections with the same specifications served as rear view. The motion system consisted of a hydraulic Hexapod with six degrees of freedom, capable of up to 7 m/s2 transitional acceleration and 4.9 m/s2 continuous acceleration. The Surrogate Reference Task [38] was displayed on a 12.3” tablet mounted at the center stack console.
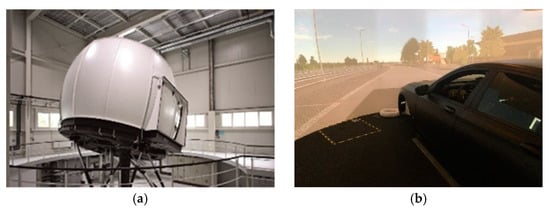
Figure 1.
Moving-base driving simulator from the outside (a) and inside mockup used in the current study (b).
2.2. Driving Automation and Human–Machine Interface
As soon as the driver activated the respective function, it carried out longitudinal and lateral vehicle guidance. The graphical HMI in the instrument cluster showed the vehicle and its surroundings in both L2 and L3 automated driving. It resembled a combination of adaptive cruise control and additional steering assistance [39]. Additionally, a light strip coronal on the steering wheel was colored in blue during active L3 automation. Only limited segments were colored in green for active L2 automation. The present HMI constitutes a representative solution for an ADS due to the conceptual similarity to solutions in prior research (see e.g., [15,40]). The L2 and L3 vehicle surroundings differed in (1) their informational content (i.e., higher level of detail in L3: visibility of adjacent lanes and vehicles) and (2) their perspective (i.e., larger field of view in L3). An activated L2 automation was colored in green while an activated L3 automation was colored in blue. The system functions could be activated with a button on the left side of the steering wheel for both levels of automation. The input device included three more buttons (e.g., set speed). A rocker switch served for the adjustment of cruising speed. Activation of the L2 driving automation was possible without any restrictions. For the L3 ADS, however, there were several activation barriers [1]. These were (1) availability of the ADS, (2) velocity below 130 km/h and (3) lane keeping within a certain lateral margin. To complete a transition from L0 to L3, drivers had to ensure that current speed was at 130 km/h or lower, keep the vehicle central in the current lane and check whether the ADS was available or not. The availability was indicated through an icon on the left side of the instrument cluster. The icon was the same as the L3 ADS button on the steering wheel. There was no auditory indication for a successful control transition.
2.3. Design and Procedure
The study employed a 2 × 5 mixed within-between design. The within-subject factor “time of measurement” had five levels from the first to the fifth block of use cases. The between-subjects factor “feedback” had two levels where participants either received the experimenter’s rating of interaction quality after each use case (condition “additional feedback”, n = 27) or not (condition “no feedback”, n = 28). Participants were randomly assigned to the between-subjects factor.
The present approach employed a five-point rating scale for user feedback. Table 1 outlines the experimenter rating that was reported to participants. Possible errors during interaction led to an increase in the experimenter rating indicating poorer performance. As there were 5 buttons on the input element plus an additional rocker switch, each erroneous input that did not result in the required control transition was counted as an error (see also [13]). Furthermore, there was the possibility to push the correct button (e.g., L3 ADS) without the transition being executed by the system if availability was not given. Such interactions were also counted as errors. Moreover, strong lane deviations due to extensive correction of erroneous inputs and glance allocation away from the road towards the in-vehicle HMI led to assignments of category four (i.e., massive errors). The experimenter rated interactions immediately after each use case. Prior to the experimental procedure, the five categories had been adapted specifically to each use case. Thus, the generic categories led to specific descriptions of behavior for each category and use case (see description above). For simplification purposes, Table 1 only provides the generic descriptions. A possibility for an error in UC2 (L0 to L2) is the following scenario:

Table 1.
Experimenter rating with label and description.
The driver erroneously pushes the L3 ADS button. Receiving information from the visual HMI that the L3 ADS was not available, he/she repeats the input. Noticing that this operating path cannot be correct, he/she tries pushing other buttons. Due to high visual workload he/she drifts from the central lane position towards the adjacent lane and has to steer back to the initial lane. Shifting back to the control transition he/she pushes the correct operating element and eventually the HMI indicates active L2 automation.
Prior to the drive, the experimenter outlined the procedure and explained that participants would encounter two automated systems (i.e., L2, L3). The subsequent experimental drive included five blocks of six interactions each between the driver and the driving automation. After each block, participants completed the block inquiry. Participants started operational actions for the respective use case upon request given by the experimenter. A use case lasted up to 60 s. After successful completion, the experimenter waited for 20 more seconds before conducting the use case specific inquiry where PEOU ratings were collected. Subsequent to the UC specific inquiry the experimenter waited at least another 30 s before proceeding to the next UC. The experimental drive on a three-lane highway with low to medium traffic density lasted approximately 60 min. There were no external factors such as a slow car ahead or a highway intersection that could have served as an indicator for an upcoming control transition. During transitions of control there was a small number of vehicles on the road with an average of 150 km/h on the center lane and an average of 180 km/h on the left lane. Vehicles on the right lane drove with an average of 130 km/h.
2.4. Use Cases
The present experiment included driver-initiated transitions between L0, L2, and L3 automated driving [41]. These six resulting use cases with the transition type, automation level at use case initiation, target automation level and use case numbering are shown in Table 2. The motivations for such transitions by users are (1) activating higher automation levels to be relieved of parts of the driving or supervising task (UCs 1, 4, 3), (2) driving themselves for the pleasure of driving (UCs 2, 6) and (3) choosing a higher speed or deactivating certain functionalities [41]. To counteract potential sequential effects, participants were randomly assigned to one of six possible block sequences that were created using a Latin square. Each block consisted of six interactions. To standardize the instructions, we recorded samples for each use case that were triggered by the experimenter. To operationalize system availability, use cases with a transition to L3 (i.e., UC1 and UC4) additionally included a 10-s delay between the experimenter’s instruction and the availability of the L3 ADS. Within this 10-s window, the L3 ADS could not be activated.
Table 2.
Overview of use cases for one experimental block.
2.5. Dependent Variables
The dependent variable was PEOU. Having completed the respective UC and having received feedback on the interaction (or not), participants reported difficulty on a 7-point Likert scale from 1 (“very easy”) via 4 (“neither nor”) to 7 (“very difficult”). The item read “How easy or difficult was the last use case?”. Time on task was used as a manipulation check since it represents an indicator of the “big three” interaction measures [42] and has revealed positive results regarding applicability in human–automation interaction [13]. Time on task was assessed as the time from the onset of the experimenter instruction until the use case was solved. A use case was counted as successfully solved if the target system state (i.e., L0, L2, L3) was active for at least five seconds without unintended deactivations or interruptions. Wickens et al. [42] describe the role of feedback as a form of training. Thus, ease of use might rather be facilitated by differences in interaction performance than by feedback itself. To control for potential influences of differences in interaction behavior that impact PEOU, we additionally investigated the main and interaction effects of feedback on time on task.
2.6. Sample
A total of N = 59 participants took part in the driving simulation experiment. N = 2 drop-outs occurred due to simulator sickness and n = 2 incomplete data sets were recorded. This left N = 55 (14 female, 41 male) participants for data analysis. The mean age of the final sample was 31.64 years (SD = 9.97, MAX = 62, MIN = 20). All participants were BMW Group employees, held a German driver’s license and had normal or corrected to normal vision.
3. Results
3.1. Manipulation Check: Time on Task
Mauchly’s test of sphericity revealed statistically significant effects for all factors (see Table 3). Therefore, degrees of freedom were adjusted after Greenhouse–Geisser. The manipulation check applied a 2 × 5 × 6 (feedback × time of measurement x use case) mixed within-between ANOVA. Inferential results for time on task (see Table 4) showed significant main effects for time of measurement and use case. These results indicate that participants’ performance improved over time and differed between use cases. The UC difference lies in the nature of the UC design. While the transition from L0 to L2 could be completed within 5–10 s after repeated exposure (see UC3 and UC5 in Figure 2), transitions to L3 lasted between 15 and 20 s. There is a 10-s window where the ADS was not available and therefore shorter time on task was not possible (see section Use Cases). The significant interaction between use case and time of measurement points towards different demands in the use cases. While there was no performance improvements in transitions to L0 (i.e., UC2, UC6), the interaction performance improved for transitions between levels of automation. There was no significant main or interaction effect of feedback present. The manipulation check thus supports the assumption that the experimental manipulation did not directly affect the interaction performance. Figure 2 shows the results of time on task for the use cases by time of measurement and feedback condition. The plots show that in single interactions such as UC1 block 1 and UC 3 block 1 there was a tendency towards differences in interaction performance between the two feedback conditions.
Table 3.
Mauchly-test statistics of sphericity assumption for time on task.
Table 4.
Inferential statistics (i.e., F, df1, df2, p, ηp2—value) of time on task.
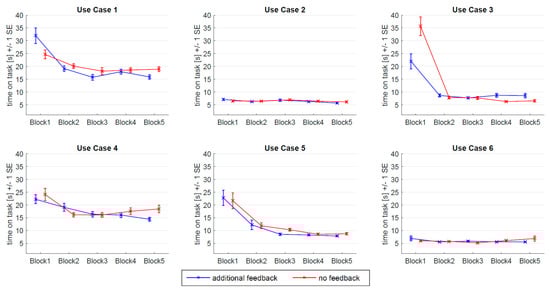
Figure 2.
Means and standard errors for time on task in the 6 use cases by time of measurement (x-axis) and feedback condition (blue: additional feedback; red: no feedback).
3.2. Perceived Ease of Use
Figure 3 shows descriptive statistics (i.e., M, SE) of perceived ease of use in the six use cases by time of measurement and experimental feedback condition. Prior to inferential statistics, factors with repeated measures (i.e., time of measurement, use case) were tested for sphericity. The results showed statistically significant effects for both main factors and the interaction (see Table 5). Therefore, degrees of freedom were adjusted after Greenhouse–Geisser. A 2 × 5 × 6 (feedback × time of measurement × use case) mixed within-between ANOVA was conducted for perceived ease of use. Inferential statistics revealed two significant main effects for time of measurement and use case. There was no main effect of feedback. The main effects indicate that perceived ease of use depends on specific transitions of control as well as on the number of times that participants had completed the use case. In addition, there were two significant two-way interactions between use case and feedback as well as between time of measurement and use case. The test statistics are reported in Table 6. With two significant two-way interactions, the significant main effects cannot be interpreted. The significant interaction between use case and feedback indicates that there is an effect of feedback on perceived ease of use ratings which depends on the respective use case. The transitions to L0 showed ratings on a very high level overall, with only small variation and no difference between the two experimental conditions. These use cases are perceived as effortless from the first time of measurement. Furthermore, UCs 1, 4, and 5 exhibited a tendency towards decreased ease of use ratings in the feedback condition. This result means that when participants received feedback on their interaction performance, their ratings became more conservative in terms of lower ease of use. In contrast, UC3 led to higher self-reported ease of use in the feedback condition. Thus, participants who received feedback about their interaction quality tended to rate the interaction as more effortless compared to the group with no feedback. The interaction between time of measurement and use case indicates that perceived ease of use depends on the time of measurement, which is in turn different between the use cases. While ease of use ratings increased towards higher ratings with rising experience in UCs 1, 3, 4, and 5, this trend over time was not apparent in transitions to L0 (UC2, UC6). The transitions to L2 automation (i.e., UC3, UC5) showed a steep increase in ease of use ratings from the first to the second time of measurement while a more gradual increase was observed for transitions to L3 automation (i.e., UC1, UC4).
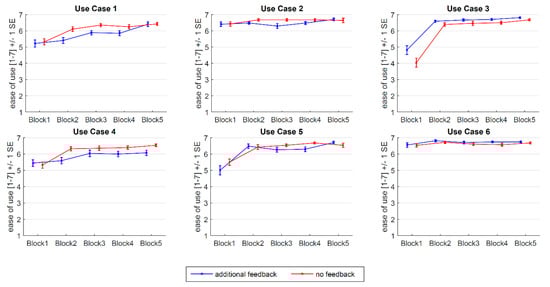
Figure 3.
Means and standard errors for difficulty ratings in the 6 use cases by time of measurement (x-axis) and feedback condition (blue: additional feedback; red: no feedback).
Table 5.
Mauchly-test statistics of sphericity assumption for perceived ease of use.
Table 6.
Inferential statistics (i.e., F, df1, df2, p, ηp2 -value) of perceived ease of use.
4. Discussion
The present study examined the effect of operator performance feedback on PEOU in the context of automated driving. In a driving simulator study, N = 55 participants completed several transitions between levels of driving automation. One part of the participants received standardized feedback on their performance while the other part did not. To find out about the effects of time of measurement, use case and feedback, participants answered a single-item question on PEOU after having successfully completed each use case. The results revealed that feedback facilitates PEOU in a use case specific manner. Transitions to L0 were considered as very easy independently from the experimental conditions. In contrast, transitions between automation levels were affected by the feedback condition. This indicates that there is a calibrating effect of feedback for diagnostic measures. The following section discusses and explains the results found above and derives implications regarding time of measurement, use case and the provision of feedback.
4.1. Effect of Feedback on Interaction Performance
The results did not show an effect of feedback on actual interaction performance operationalized through the time on task. This result is not in line with considerations about training effects through feedback by Wickens et al. [42]. One possible explanation is that the feedback in this study was provided after the interaction and not concurrently. The temporal course of interaction and subsequent feedback makes it impossible for participants to be able to connect the feedback with actual operating behavior. Furthermore, the experimenter only provided generic category names and did not specifically report why the respective rating was assigned. Therefore, participants could not directly infer which issues in interaction were still present and adapt their behavior accordingly. Only if a participant could not solve a use case and the experimenter had to explain the correct operating path (i.e., category 5, see Table 1) did participants receive specific instructions. From the independence of the interaction performance from feedback, we conclude that there is a direct link between feedback and diagnostic measures. Thus, valid conclusions for the analysis of the main and interaction effects of feedback on perceived ease of use can be drawn.
4.2. Change Over Time and UC Specificity
The significant main and interaction effect of time of measurement (see Table 6 and Figure 3) corroborates considerations of the technology acceptance model that repeated interaction increases ease of use [14]. Thus, hypothesis 1 is confirmed. The present results do not support observations by Karahanna and Straub [24], who did not find an effect of training on PEOU. Especially first contacts (i.e., Block 1) showed a trend towards the “difficult” end of the scale, while subsequent ratings aligned towards the upper end (i.e., “easy”). User studies on novel technologies in general and on automated driving in particular often investigate short term usage only. In an applied setting on automated vehicle HMIs, Frison et al. [21] report close to average ease of use ratings. However, with experimental drives lasting only 10 min, subsequent improvements in ease of use might be possible. In contrast, a study by Large et al. [23] deliberately trained participants until they assumed competence in operating the interface. Thus, the authors ensured that differences between conceptual approaches are not only present at initial operations but also hold true for more skilled users.
In general, a trend towards the “very easy” end of the 7-point Likert scale could be observed and it seems that a ceiling effect was present here. This was especially evident for transitions to L0 (i.e., UC2, UC6), where no change over time was evident (see Figure 3). This result supports the considerations on use case specificity of learning effects [43] and confirms hypothesis 2. As a consequence, only a small diagnostic benefit can be drawn from use cases with driver-initiated transitions to L0. This suggests that future studies investigating human–automation interaction for do not need to consider these use cases closely but should rather focus on transitions towards levels of automation. When researchers aim at finding issues in operating an ADS, driver-initiated transitions to different levels of driving automation can bring diagnostic benefit.
4.3. Calibrating Effects of Feedback
The present study’s aim was to show that different judgments arise when the performance feedback loop is closed. The present results did not show a main effect of feedback on PEOU. However, in interaction with use case, there was a significant effect on PEOU (see Table 6). These results highlight the use case specificity (see [43]) that was also apparent for the time of measurement factor. It means that there is an effect of feedback on the calibration of PEOU in a sense that participants provided more conservative ratings when they receive feedback compared to when they do not receive any feedback. This effect, however, depends on the specific transition and is not apparent in transitions to L0, where a ceiling effect was present in both groups. To be more specific, UC1, UC4, and UC5 tended to lead to more conservative PEOU ratings in the feedback condition. In the light of the manipulation check of actual interaction performance, differences in PEOU between feedback conditions are limited to certain interactions (see e.g., UC3 block 1, Figure 2). Thus, the result of higher PEOU judgments observed in UC3 with additional feedback cannot be interpreted insofar as the feedback itself led to this observation, but it is rather due to the interaction performance. Besides these restrictions, the significant interaction effect between performance feedback and use case highlights the calibrating role of feedback for self-reported diagnostic measures. Hypothesis 3 is thus partly confirmed. Feedback influenced PEOU such that participants gave more conservative judgments tending towards the “difficult” end of the scale and the ceiling effect was mitigated. These results support prior considerations on the calibrating role of feedback. However, in comparison to calibrating effects of feedback on trust in automation (e.g., [35,36]) the influence is not as pervasive in the present study. The observation of feedback influencing ease of use is also in accordance with the trust model by Lee and See [37] which proclaims a link between the attitudes of trust and ease of use.
In an applied context of HMI testing in user studies, there are many examples reporting high ease of use (see e.g., [15,20,22]) even in first contacts. These results certainly give an important insight into participants’ subjective evaluation, namely that they perceive interaction as considerably effortless. However, the interpretation of these observations needs to carefully incorporate the notion that potentially more conservative estimates might have been present if users had known about potential errors.
To novice users [26], the interface design might seem comparably simple including buttons on a steering wheel and a display in the instrument cluster. However, automated vehicle HMIs are considerably complex and it is likely that users cannot recognize this at the first glance. Therefore, only scratching the surface with their interaction might seem simple if one is not aware of system limitations and ODD restrictions. Errors in interaction with the automated vehicle’s interface might thus not be integrated into a larger picture of system states, HMI displays and traffic conditions. This might consequentially lead to judgments that are on the one hand subjectively true for the user but on the other hand seem unreasonable to the HMI designer. By providing feedback that there actually was an error (e.g., category 3, see Table 1), users are more likely to recognize the degree of deviation from error-free interaction. The degree of uncertainty about interaction performance decreases due to feedback [34] and an anchor for realistic judgments is provided.
Overall, absolute judgments in the feedback conditions were still recorded with a considerable alignment towards the upper end of the PEOU scale. The present HMI solution in essence contained two buttons and a graphical interface in the instrument cluster. Therefore, with more available levels of driving automation and ADAS (e.g., Adaptive Cruise Control, Speed Limiter), PEOU ratings are expected to shift towards the lower end of the PEOU continuum. The present work supports considerations about the validity of self-report measures on the use case level [9]. The obtained results indicate that study designs of automated vehicle HMIs can benefit from feedback on operator performance if researchers aim at a more conservative and/or realistic evaluation of human–machine interfaces.
In regard to methodology development and standardization in the driving automation domain, this work contributes insofar as it outlines an additional possible procedure. Despite following the human-centered design approach for HMI design, system functionality might still lead to considerably complex interfaces. Especially in these instances, such a procedure could be applied. As outlined before, users struggle with giving confident estimates as long as they are uncertain about their actions and the HMI’s conceptualization. It might also be possible operationalize feedback differently than the present experimenter rating on a scale from one to five. If users could not solve the use case by themselves, the experimenter explained the correct operating path. Such explanations about users’ actions including information about one or multiple errors during operational inputs could as well be provided independent from the rating category.
4.4. Limitations and Future Research
This study comes with limitations and opportunities for future research. The experiment only included a restricted number of use cases from the catalogue by Naujoks et al. [41] as well as automation levels. Future HMI concepts for automated driving may also incorporate L1 (both lateral and longitudinal) functionality as well as customizable solutions for specifying automation functionality (e.g., setting speed, lateral offset).
Future conceptual approaches might consider providing feedback via different modalities. Conceivable approaches are displaying performance through a visual display or auditory tones. Thus, feedback on operator performance could be embedded within the existing HMI concept. Furthermore, the use cases were restricted to driver-initiated control transitions and left out system-initiated transitions such as take-over requests (for an overview see e.g., [44]).
Concerning feedback, future research is necessary to find out about these effects under circumstances where PEOU ratings are more distributed across the applied scale. Since a ceiling effect occurred in the present study, the effect of feedback on more scale-centered ratings is yet to be investigated. In addition, a wider range of dependent variables such as usefulness [14] or single-items on perceived usability [45] might be influenced by feedback and should be investigated for this effect.
The present research specifically examined the effect of operator feedback for the calibration of ease of use judgments. This marks a first step going beyond calibrating effects in automation trust. However, there remain important research areas such as mode awareness [8] or mental models [27] where the role of feedback remains unknown.
4.5. Conclusions
The present study provides three core findings. First, the observation that PEOU changes over time implies that initial measurements give the most conservative estimate of an HMI’s ease of use. Concerning repeated exposure, we conclude that only limited diagnostic insights can be drawn from trained users (e.g., after 5th repetition of UC). However, the subsequent tendency towards the upper end shows that repeated measurements are necessary to also make statements about an HMI’s ease of use when more experienced users are regarded. The repeated measure approach also bears the advantage to make estimations about the magnitude of learning from the first to the second contact.
Second, the use case specificity indicates that transitions to an automated mode are of higher importance than transitions to manual. These use cases seem to put higher demands on the users in terms of HMI operation and understanding thereof. To derive a more comprehensive image of an automated vehicle HMI, transitions to automated mode should be completed twice within an HMI evaluation. Concerning use case specificity, we conclude that simple interaction scenarios (e.g., UC2, UC6) do not provide substantial insights into issues of HMI design. In contrast, activation of driving automation systems and changes between levels of driving automation provide more valuable directions for future development.
Eventually, researchers and practitioners should acknowledge that users’ perception can differ from what the experimenter actually observes during the interaction. In the present case, we observed this as a dependency of PEOU on the information about performance (i.e., feedback versus no feedback). The present study does not raise the claim that one approach is superior compared to the other. It rather points out that researcher will obtain different results when applying one or the other method. If one does not provide feedback, he/she leaves users with judgments under uncertainty [34] thus potentially leading to stronger ceiling effects. Furthermore, the discrepancy between actual performance and self-reported ease of use might be larger giving a more heterogeneous picture of the automated vehicle’s HMI. In comparison, calibrated judgments provide a more homogeneous picture when it comes to relating behavioral and self-report measures [9,31]. While on the one hand, this bears the possibility to better infer behavior from self-report data and vice versa, on the other hand a metric that is influenced by feedback might be diluted and does not reflect future users’ unswayed attitude towards the system and its HMI. Here, it is important to mention that the present work does not suggest that by providing feedback, the necessity to collect behavioral measures (e.g., time on task, error rate, gaze metrics) becomes obsolete. On the contrary, we explicitly demand researchers to investigate human-automation interaction by means of both sources of data to derive a holistic conclusion. This work, however, points out that the link between behavior and attitude might be moderated by self-regulatory processes [33]. If one observes such ceiling effects in self-reports when evaluating emerging technologies, these might be counteracted through closing the feedback gap.
User studies usually do not include additional provision of feedback as this procedure requires a highly-trained and fast rater that is well-informed about the HMI. It is therefore debatable whether to include such a procedure into user studies. Another possibility to make participants more sensitive to HMI operation is user education. Here, information on correct and incorrect operational actions is provided before rather than after interaction as in the present study. Therefore, the present study supports the existence of calibrating effects on PEOU when closing attitude-behavior feedback loops ex post. This feedback loop might also be closed ex ante by means of educating users of driving automation technology so that they could classify their operational behavior within a larger set of interaction behavior possibilities. There are already first efforts towards developing and testing user education approaches for automated driving [46,47,48]. These procedures should be investigated closely in regard to calibration effects and can be implemented efficiently into study designs.
Author Contributions
Conceptualization, Y.F., S.H., F.N. and J.K.; methodology, Y.F., S.H. and F.N.; formal analysis, Y.F.; data curation, Y.F.; writing—original draft preparation, Y.F.; writing—review and editing, Y.F., S.H., F.N. and J.K. visualization, Y.F.; supervision, S.H., J.K. and A.K.
Funding
This research received no external funding.
Acknowledgments
The authors would like to thank Katja Mayr and Johanna Artmann for their support in study preparation and data collection during their internships. Portions of the data on time on task reported here have previously been published in Forster et al. [13].
Conflicts of Interest
The authors declare no conflict of interest.
References
- SAE. Taxonomy and Definitions for Terms Related to On-Road Motor Vehicle Automated Driving Systems; SAE International: Warrendale, PE, USA, 2018. [Google Scholar]
- AAM. Statement of Principles, Criteria and Verification Procedures on Driver Interactions with Advanced In-Vehicle Information and Communication Systems; Alliance of Automobile Manufactures: Washington, DC, USA, 2006. [Google Scholar]
- Kun, A.L. Human-Machine Interaction for Vehicles: Review and Outlook. FNT Hum. Comput. Interact. 2017, 11, 201–293. [Google Scholar] [CrossRef]
- NHTSA. Visual-Manual NHTSA Driver Distraction Guidelines for In-Vehicle Electronic Devices; National Highway Traffic Safety Administration (NHTSA), Department of Transportation (DOT): Washington, DC, USA, 2012.
- Hergeth, S.; Lorenz, L.; Vilimek, R.; Krems, J.F. Keep your scanners peeled: Gaze behavior as a measure of automation trust during highly automated driving. Hum. Factors 2016, 58, 509–519. [Google Scholar] [CrossRef] [PubMed]
- Forster, Y.; Naujoks, F.; Neukum, A. Increasing anthropomorphism and trust in automated driving functions by adding speech output. In Proceedings of the 2017 IEEE Intelligent Vehicles Symposium, Redondo Beach, CA, USA, 11–14 June 2017. [Google Scholar]
- Naujoks, F.; Mai, C.; Neukum, A. The effect of urgency take-over requests during highly automated driving under distraction conditions. Adv. Hum. Asp. Transp. 2014, 7, 431. [Google Scholar]
- Feldhütter, A.; Segler, C.; Bengler, K. Does Shifting Between Conditionally and Partially Automated Driving Lead to a Loss of Mode Awareness? In Proceedings of the International Conference on Applied Human Factors and Ergonomics, Los Angeles, CA, USA, 17–21 July 2017. [Google Scholar]
- Forster, Y.; Hergeth, S.; Naujoks, F.; Krems, J.F. How Usability can Save the Day. Methodological Considerations for Making Automated Driving a Success Story. In Proceedings of the 10th International Conference on Automotive User Interfaces and Interactive Vehicular Applications, Toronto, ON, Canada, 23–25 September 2018. [Google Scholar]
- Naujoks, F.; Hergeth, S.; Wiedemann, K.; Schoemig, N.; Forster, Y.; Keinath, A. Test Procedure for Evaluating the Human-Machine-Interface of Vehicles with Automated Driving. Traffic Injury Prev. 2019, in press. [Google Scholar]
- Sweeney, M.; Maguire, M.; Shackel, B. Evaluating user-computer interaction: A framework. Int. J. Man. Mach. Stud. 1993, 38, 689–711. [Google Scholar] [CrossRef]
- Forster, Y.; Hergeth, S.; Naujoks, F.; Krems, J.F.; Keinath, A. Self-Report Measures for the Evaluation of Human-Machine Interfaces in Automated Driving. 2018; Subimtted and under Review. [Google Scholar]
- Forster, Y.; Hergeth, S.; Naujoks, F.; Beggiato, M.; Krems, J.F.; Keinath, A. Learning to Use Automation: Behavioral Changes in Interaction with Automated Driving Systems. Transp. Res. Part F Traffic Psychol. Behav. 2019, 62, 599–614. [Google Scholar] [CrossRef]
- Davis, F.D. Perceived Usefulness, Perceived Ease of Use, and User Acceptance of Information Technology. MIS Q. 1989, 13, 319. [Google Scholar] [CrossRef]
- Forster, Y.; Naujoks, F.; Neukum, A. Your Turn or My Turn? Design of a Human-Machine Interface for Conditional Automation. In Proceedings of the 8th International Conference on Automotive User Interfaces and Interactive Vehicular Applications, Ann Arbor, MI, USA, 24–26 October 2016; pp. 253–260. [Google Scholar]
- Rahman, M.M.; Lesch, M.F.; Horrey, W.J.; Strawderman, L. Assessing the utility of TAM, TPB, and UTAUT for advanced driver assistance systems. Accid. Anal. Prev. 2017, 108, 361–373. [Google Scholar] [CrossRef]
- Nordhoff, S.; de Winter, J.; Madigan, R.; Merat, N.; Arem, B.; Happee, R. User acceptance of automated shuttles in Berlin-Schöneberg: A questionnaire study. Transp. Res. Part F Traffic Psychol. Behav. 2018, 58, 843–854. [Google Scholar] [CrossRef]
- Rödel, C.; Stadler, S.; Meschtscherjakov, A.; Tscheligi, M. Towards Autonomous Cars: The Effect of Autonomy Levels on Acceptance and User Experience. In Proceedings of the 6th International Conference on Automotive User Interfaces and Interactive Vehicular Applications, Seattle, WA, USA, 17–19 September 2014. [Google Scholar]
- Payre, W.; Cestac, J.; Delhomme, P. Intention to use a fully automated car. Attitudes and a priori acceptability. Transp. Res. Part F Traffic Psychol. Behav. 2014, 27, 252–263. [Google Scholar] [CrossRef]
- Wintersberger, P.; Riener, A.; Schartmüller, C.; Frison, A.-K.; Weigl, K. Let Me Finish before I Take Over: Towards Attention Aware Device Integration in Highly Automated Vehicles. In Proceedings of the 10th International Conference on Automotive User Interfaces and Interactive Vehicular Applications, Toronto, ON, Canada, 23–25 September 2018; pp. 53–65. [Google Scholar]
- Frison, A.-K.; Wintersberger, P.; Riener, A.; Schartmüller, C. Driving Hotzenplotz: A Hybrid Interface for Vehicle Control Aiming to Maximize Pleasure in Highway Driving. In Proceedings of the 9th International Conference on Automotive User Interfaces and Interactive Vehicular Applications, Oldenburg, Germany, 24–27 September 2017; pp. 236–244. [Google Scholar]
- Guo, C.; Sentouh, C.; Popieul, J.-C.; Haué, J.-B. Predictive shared steering control for driver override in automated driving: A simulator study. Transp. Res. Part F Traffic Psychol. Behav. 2019, 61, 326–336. [Google Scholar] [CrossRef]
- Large, D.; Burnett, G.; Crundall, E.; Lawson, G.; Skrypchuk, L. Twist It, Touch It, Push It, Swipe It: Evaluating Secondary Input Devices for Use with an Automotive Touchscreen HMI. In Proceedings of the 8th International Conference on Automotive User Interfaces and Interactive Vehicular Applications, Ann Arbor, MI, USA, 24–26 October 2016; pp. 253–260. [Google Scholar]
- Karahanna, E.; Straub, D.W. The psychological origins of perceived usefulness and ease-of-use. Inf. Manag. 1999, 35, 237–250. [Google Scholar] [CrossRef]
- Forster, Y.; Hergeth, S.; Naujoks, F.; Beggiato, M.; Krems, J.F.; Keinath, A. Learning and Development of Mental Models in Interaction with Driving Automation: A Simulator Study. In Proceedings of the 10th International Driving Symposium on Human Factors in Driver Assessment, Training, and Vehicle Design, Santa Fe, NM, USA, 24–27 June 2019. [Google Scholar]
- Hart, C.A. Self Driving Safety Steps into the Unknown. [Web Blog Post]. Available online: http://www.thedrive.com/tech/26896/self-driving-safety-steps-into-the-unknown (accessed on 14 March 2019).
- Beggiato, M.; Pereira, M.; Petzoldt, T.; Krems, J.F. Learning and development of trust, acceptance and the mental model of ACC. A longitudinal on-road study. Transp. Res. Part F Traffic Psychol. Behav. 2015, 35, 75–84. [Google Scholar] [CrossRef]
- Forster, Y.; Hergeth, S.; Naujoks, F.; Krems, J.F. Unskilled and Unaware: Subpar Users of Automated Driving Systems Make Spurious Decisions. In Proceedings of the 10th International Conference on Automotive User Interfaces and Interactive Vehicular Applications, Toronto, ON, Canada, 23–25 September 2018. [Google Scholar]
- Ajzen, I.; Fishbein, M. Attitude-behavior relations: A theoretical analysis and review of empirical research. Psychol. Bull. 1977, 84, 888. [Google Scholar] [CrossRef]
- Hancock, P.A.; Matthews, G. Workload and Performance: Associations, Insensitivities, and Dissociations. Hum. Factors 2018. [Google Scholar] [CrossRef]
- Nielsen, J.; Levy, J. Measuring Usability: Preference vs. Performance. Commun. ACM 1994, 37, 66–75. [Google Scholar] [CrossRef]
- Bol, L.; Hacker, D.J. Calibration research: Where do we go from here? Front. Psychol. 2012, 3, 229. [Google Scholar] [CrossRef]
- Zimmerman, B.J. Attaining self-regulation: A social cognitive perspective. In Handbook of Self-Regulation; Zimmerman, B.J., Ed.; Elsevier: Amsterdam, The Netherlands, 2000; pp. 13–39. [Google Scholar]
- Tversky, A.; Kahneman, D. Judgment under uncertainty: Heuristics and biases. Science 1974, 185, 1124–1131. [Google Scholar] [CrossRef] [PubMed]
- Seong, Y.; Bisantz, A.M. The impact of cognitive feedback on judgment performance and trust with decision aids. Int. J. Ind. Ergon. 2008, 38, 608–625. [Google Scholar] [CrossRef]
- Helldin, T.; Falkman, G.; Riveiro, M.; Davidsson, S. Presenting system uncertainty in automotive UIs for supporting trust calibration in autonomous driving. In Proceedings of the 5th International Conference on Automotive User Interfaces and Interactive Vehicular Applications, Eindhoven, The Nethderlands, 27–30 October 2013; pp. 210–217. [Google Scholar]
- Lee, J.D.; See, K.A. Trust in automation: Designing for appropriate reliance. Hum. Factors 2004, 46, 50–80. [Google Scholar] [CrossRef] [PubMed]
- ISO. Road Vehicles—Ergonomic Aspects of Transport Information and Control Systems—Calibration Tasks for Methods Which Assess Driver Demand Due to the Use of In-Vehicle Systems; ISO: Geneva, Switzerland, 2012. [Google Scholar]
- Naujoks, F.; Purucker, C.; Neukum, A.; Wolter, S.; Steiger, R. Controllability of Partially Automated Driving functions–Does it matter whether drivers are allowed to take their hands off the steering wheel? Transp. Res. Part F Traffic Psychol. Behav. 2015, 35, 185–198. [Google Scholar] [CrossRef]
- Manca, L.; de Winter, J.C.F.; Happee, R. Visual Displays for Automated Driving: A Survey. In Proceedings of the 7th International Conference on Automotive User Interfaces and Interactive Vehicular Applications, Nottingham, UK, 1–3 September 2015. [Google Scholar]
- Naujoks, F.; Hergeth, S.; Wiedemann, K.; Schoemig, N.; Keinath, A. Use Cases for Assessing, Testing, and Validating the Human Machine Interface of Automated Driving Systems. In Proceedings of the Human Factors and Ergonomics Society Annual Meeting, Philadelphia, PA, USA, 1–5 October 2018. [Google Scholar]
- Wickens, C.D.; Hollands, J.G.; Banbury, S.; Parasuraman, R. Engineering Psychology & Human Performance; Psychology Press: Hove, UK, 2015. [Google Scholar]
- Gagne, R. Learning Outcomes and Their Effects. Useful Categories of Human Performance. Am. Psychol. 1984, 39, 377–385. [Google Scholar] [CrossRef]
- Eriksson, A.; Stanton, N.A. Takeover Time in Highly Automated Vehicles: Noncritical Transitions to and From Manual Control. Hum. Factors 2017, 59, 689–705. [Google Scholar] [CrossRef]
- Lewis, J.R. Psychometric Evaluation of the PSSUQ Using Data from Five Years of Usability Studies. Int. J. Hum. Comput. Interact. 2002, 14, 463–488. [Google Scholar]
- Hergeth, S.; Lorenz, L.; Krems, J.F. Prior familiarization with takeover requests affects drivers’ takeover performance and automation trust. Hum. Factors 2017, 59, 457–470. [Google Scholar] [CrossRef] [PubMed]
- Payre, W.; Cestac, J.; Delhomme, P. Fully automated driving: Impact of trust and practice on manual control recovery. Hum. Factors 2016, 58, 229–241. [Google Scholar] [CrossRef]
- Sportillo, D.; Paljic, A.; Ojeda, L. Get ready for automated driving using Virtual Reality. Accid. Anal. Prev. 2018, 118, 102–113. [Google Scholar] [CrossRef]


© 2019 by the authors. Licensee MDPI, Basel, Switzerland. This article is an open access article distributed under the terms and conditions of the Creative Commons Attribution (CC BY) license (http://creativecommons.org/licenses/by/4.0/).