Article

Catch My Drift: Elevating Situation Awareness for Highly Automated Driving with an Explanatory Windshield Display User Interface †

Chair of Human-Machine Communication, TUM Department of Electrical and Computer Engineering, Technical University of Munich, Arcisstr. 21, 80333 München, Germany
*
Author to whom correspondence should be addressed.
This paper is an extended version of our paper published in Adjunct Proceedings of the 17th IEEE International Symposium on Mixed and Augmented Reality (ISMAR), Munich, Germany, 16–20 October 2018.
Multimodal Technol. Interact. 2018, 2(4), 71; https://doi.org/10.3390/mti2040071
Submission received: 6 August 2018 / Revised: 13 September 2018 / Accepted: 8 October 2018 / Published: 11 October 2018
(This article belongs to the Special Issue Automotive User Interfaces)

Abstract

:
Broad access to automated cars (ACs) that can reliably and unconditionally drive in all environments is still some years away. Urban areas pose a particular challenge to ACs, since even perfectly reliable systems may be forced to execute sudden reactive driving maneuvers in hard-to-predict hazardous situations. This may negatively surprise the driver, possibly causing discomfort, anxiety or loss of trust, which might be a risk for the acceptance of the technology in general. To counter this, we suggest an explanatory windshield display interface with augmented reality (AR) elements to support driver situation awareness (SA). It provides the driver with information about the car’s perceptive capabilities and driving decisions. We created a prototype in a human-centered approach and implemented the interface in a mixed-reality driving simulation. We conducted a user study to assess its influence on driver SA. We collected objective SA scores and self-ratings, both of which yielded a significant improvement with our interface in good (medium effect) and in bad (large effect) visibility conditions. We conclude that explanatory AR interfaces could be a viable measure against unwarranted driver discomfort and loss of trust in critical urban situations by elevating SA.

1. Introduction

The path to fully automated cars (ACs) on a larger scale is still a long one. The European Road Transport Research Advisory Council (ERTRAC) currently expects the step-wise increase of automation in cars to reach full automation around the end of the 2020s [1]. However, there are multiple experts with research experience in the field ranging from one to four decades giving even more conservative estimates [2]. For instance, Shladover shifted his earlier expectations (after 2040) further away, now expecting unconditional full automation not much sooner than in the year 2075 [3]. Nevertheless, practical questions about opportunities and dangers of the technology are already occupying the public, influencing their general acceptance and trust towards Autonomous Driving (AD). Surveys give a divided impression of public opinion. For instance, 56% of U.S. adults state they would not ride an AC [4]. In the UK, one third would probably or definitely not use an AC with another 31% being unsure [5]. Similarly, a third of Germans still cannot imagine using AD [6], although age is a factor with people under 30 (22.2%) being least skeptical as opposed to people over 70 (42.5%). If we consider drivers who are insecure or suffer deteriorating abilities, then AD may become particularly important. Assuming that AD technology will at some point exceed human capabilities in general, all traffic participants should be able to benefit when more people consider using ACs. Potential advantages of AD include, among others, reduced accidents and traffic congestion, reduced consumption and emissions and more efficient parking and car availability. Thus, raising acceptance of AD and trust in the technology should be considered worthwhile.
Since we are still some time away from widely used AD, we should interpret the aforementioned results in consideration of the fact that a majority of people do not have not any experience with AD and that deeper knowledge about its technical backgrounds cannot be assumed for many. Absolute measures of acceptance are thus hard to obtain and to compare with validity. However, increasing acceptance within subjects may be something that is both desirable and easier to track. A possible way to achieve this might be to positively influence the perceived usefulness [7] and perceived safety and anxiety [8]. If we consider the arguably most demanding environment for AD, urban driving, then there is much potential for near-unpredictable hazardous situations. Even a highly reliable AC would be forced to execute sudden and hard braking or steering maneuvers when the need arises. This may easily surprise the driver and cause discomfort, especially in situations that are difficult to grasp quickly. This is particularly problematic in AD where drivers are already prone to reduced SA due to the out-of-the-loop problem [9]. The result of such an experience might be decreased feeling of safety, increased anxiety with ACs and potentially a general loss of trust in the technology.
While this example would concern only people who are already experiencing AD, there are still those who do not even consider trying [4,5,6]. A main obstacle preventing the adoption of ACs is the public trust in the technology [10,11]. If we apply the widely used definition for trust by Mayer et al. [12] to AD, we can describe trust as the willingness to place oneself in a vulnerable position regarding the actions of the AC system, with a positive expectation of an outcome [13] irrespective of the ability to monitor or control the AC. One needs to consider explicit (conscious) influences and implicit attitudes toward automation [14], both of which can influence the actual trust in automation. While overtrust in an AC is mainly an issue in semi-automation cases (where handovers may be required), undertrust can lead to disuse [15] of ACs entirely, making it a problem even for an infallible system. Thus, it would be desirable to correctly calibrate trust to the current system reliability [16,17] even for fully automated systems. However, depending on individual attitude, even an extremely high number of real-world test miles may not be convincing enough for skeptics to reach a level of trust corresponding to an AC’s reliability. Additionally, a single bad experience like described above may result in a loss of trust that makes potential users back away from AD irrevocably. Thus, it seems important to convey the actual capabilities of the AC to the driver and make him aware that such sudden or uncomfortable driving maneuvers are unavoidable, safety-critical and (ideally) performed in much safer ways than human drivers would be able to do. However, how does one convey to the end user what an AC detects and how it makes driving decisions? If it comes to an abrupt maneuver of the car, how can discomfort be prevented?
We argue that explanatory user interfaces (UIs) may become a solution for preventing discomfort in ACs. Providing the driver with situational information to increase driver SA might lead to a better preparation for sudden driving maneuvers. Moreover, drivers might feel a stronger appreciation of the AC’s reaction in the aftermath, which may even cause drivers to gain trust in the AC. We target a use-case (full automation in urban areas) that might still be between one and several decades away if we consider the expert estimates presented in the beginning. Therefore, we also anticipate advanced capabilities of future display systems. Head-up displays (HUDs) with a large field of view (FOV) will introduce extended possibilities for information placement and visualization. Ultimately, the whole windshield may be usable as the UI layer. Such windshield displays (WSDs) will be especially suitable for visualizing AR features. These might be an important measure in building effective explanatory UIs for ACs with the capability to influence driver understanding or trust [18].
The contribution of this article is as follows: we present a suggestion for an explanatory WSD interface with AR elements informing the driver about the AC’s perceptive capabilities and driving decisions. We focus on urban environments with high potential for unpredictable situations possibly discomforting to the driver. We account for this scenario by providing diverse UI elements for typical aspects of urban traffic. We present our WSD UI prototype that was designed in a human-centered approach and implemented as part of a custom mixed-reality (MR) driving simulation. We further present simulated urban driving scenarios we implemented to be experienced by users in automated drives in combination with the WSD UI. We describe and discuss the process and results of a user study conducted to evaluate the impact of the UI on driver SA in critical urban AD scenarios.
This article substantially extends our preliminary work and results on the topic [19,20]. We added new results of the main study, including driver SA self-ratings, a correlation analysis between objective and subjective SA scores and data related to user experience and attitudes. We discuss the implications of the new results and give an extended outlook to future work. We also extended the Introduction and Background on the topics of fully automated driving, trust in automation, models of acceptance and SA and related work on automotive UIs for AD (including semi-automated cars). Development of the prototype, the urban driving situations and the user study are described with additional detail.

2. Background

2.1. Driving Automation Levels, Technology Acceptance and Situation Awareness

Interaction research in the domain of AD has initially been focusing on semi-automated cars. Taking the automation levels of the Society of Automotive Engineers (SAE) as a basis, this still includes scenarios in which the driver may be required to permanently monitor the surroundings (SAE level 2: partial automation [21]) or directly act on a handover request (up to SAE level 3: conditional automation). We are explicitly focusing on those cases in which no interference from the driver is required. SAE level 4 defines a level of high automation in which the AC is capable of performing all functions under certain conditions (e.g., while driving in highway/freeway environments). Level 5 describes full automation and means that the AC can perform all driving unconditionally. For both levels 4 and 5, the driver may still have the option to control the vehicle. The latter, however, is of no importance to the work we present in this article. When we mention AD and ACs in the scope of this work, we are thus referring to SAE level 4–5 automation with no driver interference regarding the actual driving functions of the car, i.e., the driver is basically a passenger in the driver’s seat.
In this work, we assume availability of highly reliable ACs capable of safely handling driving without conditions, i.e., even in urban environments. These are very demanding for ACs due to the unpredictability of events. Narrow spaces, little viewing distance, potentially many moving objects (cars, pedestrians, cyclists, etc.), road signs and non-uniform infrastructure pose a high challenge for the technology. A large survey from 2014 with 5000 responses from 109 countries yielded that one of the main worries of potential users is the reliability of an AC [10]. Text responses from this and two further surveys were evaluated via crowdsourcing later [22]. From about 800 meaningful comments, 23% were classified as negative towards AD and 39% as positive. According to the technology acceptance model (TAM) of Davis [7], the individual attitude towards using a technology depends on two main aspects: the perceived usefulness and the perceived ease of use. While the latter seems negligible in the case of AD (usage is largely a passive action), the former incorporates the reliability of an AC. It can only be useful if it is reliably handling the driving. The model was later extended to TAM2 [23] in which experience was added among other factors. Experience has an influence on the perceived usefulness and ultimately the behavioral intention to use the technology. This is the point at which our suggested UI should add support. Ideally, it would mitigate bad experiences or even convert them into positive ones, which might also increase perceived usefulness. Osswald et al. developed a car technology acceptance model (CTAM) [8] based on the unified theory of acceptance and use of technology (UTAUT) [23] which itself is an extension of previous TAM versions. The CTAM introduces in particular the points anxiety and perceived safety as technology acceptance factors in the automotive domain. With our approach, we also believe to be able to positively influence these factors.
While raising acceptance for AD would be an ideal ultimate outcome of using our suggested explanatory UI, the focus of our evaluation in this work was directed at something that is easier to measure objectively: driver SA. If our suggested UI could generally increase driver SA, then the driver’s understanding of uncomfortable situations should improve. With a highly reliable AC that actually handles every situation well, this should consequentially result in a positive impact on the above-mentioned (C)TAM-influencing factors. We based our considerations for the UI and evaluation on the widely used Endsley model [24,25] of SA. It defines SA formation in three stages:
  • Perception of the data and elements of the environment. In our case, this includes monitoring current car status information and the surrounding traffic situation, including the detection of other traffic participants, road conditions and infrastructure.
  • Comprehension of the meaning and significance of the situation. This would correspond to the driver’s understanding of the current traffic rules (e.g., who has right of way, which road signs apply, etc.) and the situation on the road. This includes interpreting and evaluating the actions of other traffic participants.
  • Projection of future events or actions. In the driving scenario, this includes predicting the behavior of the other traffic participants and also the driving decisions of the vehicle. Drivers need to deduce imminent actions by projecting their knowledge from Stages 1 and 2 into an upcoming time frame. High awareness in this stage should reduce confusion when an AC needs make sudden reactive maneuvers.
Due to the out-of-the-loop problem [9], drivers in ACs are prone to reduced SA when compared to manual driving. This is a main motivation for trying to increase SA by an appropriate UI which makes system knowledge and actions more transparent. High SA in critical driving situations results in experiences that may not only prevent drivers from losing trust but also serve to increase it over time [26]. Exposing skeptical drivers to apparent hazards that are well-managed by the car while they can observe that what the system sees and decides may also lead to reduced anxiety [27], which was also one of the influencing factors on acceptance [8]. It needs to be considered that cognitive and visual distraction may degrade SA of drivers [28]. However, in the scenario of full automation, the situation should be different from manual driving. We are no longer focusing on a driver who simultaneously has to perform well in driving, but who is only required to monitor his surroundings. This is also the reason why we consider general drawbacks of HUD-like displays [29] like focus mismatch to be more negligible. It should be noted that the introduction of a complex explanatory UI may at first seem contradictory to the idea of a stress-free AC driver totally disengaged from the driving task. However, we explicitly target drivers who are not engaging deeply in non-driving activities during the rides. While such drivers might be annoyed or stressed by an explanatory UI, it also makes sense to assume that they already feel comfortable and safe in the AC, trusting its reliability. The primary target group for an explanatory UI as we suggest, however, are skeptics who still refuse ACs or as of yet untrusting adopters who may feel stressed or anxious when experiencing autonomous rides.

2.2. User Interfaces for Automated Cars

The larger part of interaction research for AD has so far been focusing on semi-automated scenarios and take-over requests (TORs), respectively handovers of control between car and driver. Here, the effects of driver distraction, respectively engagement in non-driving tasks before TORs, is a main point of interest, not unlike in automotive UI research for manual cars. In terms of methodology, TOR studies thus often work with performance measurements but also with mental workload evaluations [30,31], relying on established standardized tests like the Rating Scale Mental Effort (RSME) [32], the NASA Task Load Index (NASA-TLX) [33] or its adapted version for automotive studies, the Driving Activity Load Index (DALI) [34]. In a full-automation scenario, however, we need to reconsider which tests are really fitting, depending e.g., on the importance of mental workload and if non-driving tasks are part of an experiment. Large-sample studies [35,36] showed users’ preferences for multi-modal TOR feedback. The most popular options for announcements included, in this order: female voice take-over message, visual warning message, warning light, two warning beeps and vibrations in the seat. Multi-modal TORs were the most preferred in high-urgency situations and auditory TORs in low-urgency situations. For the latter, visual feedback is preferred over vibrotactile feedback. Considering the aim of our work, we assume the visual channel to be of highest importance, as sound and vibrotactile output are somewhat restricted in terms of amount and complexity of conveyed information in a short time.
Filip et al. asked people who were never in contact with AD to rate factors influencing their trust [37]. The most important was reported to be the capability of the car to sense the surroundings. Further relevant factors were the amount of information available to the car and also the learning-curve effectiveness, i.e., the car making judgments on the received information. Among the factors rated least important for influencing trust was feedback (including visual), which seems negative regarding our approach. However, the same questions posed in an expert round yielded feedback as one of the most important components. We believe that system reliability alone will only be helpful as long as users are ready to believe in it (as indicated by technology acceptance factors like perceived usefulness, performance or safety). Apart from very extensive trial runs (test miles) with positive results, explanations for reliance are also important [38]. This may be facilitated by giving visual feedback that actually can convey an AC’s capabilities and its judgments in a comprehensive way. Witnessing the AC handle situations while getting informative feedback might satisfy the user requirements in [37].
One of the simpler approaches to convey system capability is with a visual confidence bar. This indicator can give a single overall rating [39] or sensor-related feedback [37]. A shortcoming is that drivers do not directly learn why confidence may be low in unobvious situations. It is a good solution in semi-automated scenarios because here the driver primarily needs to be prepared for takeover requests. In a full-automation scenario, it might at least allow the driver to brace for sudden reactive maneuvers of the AC. However, it cannot give drivers a deeper comprehension of the current situation and an AC’s reaction, which is what we are trying to achieve in this work. Johns et al. proposed a shared control principle and found that haptic feedback on the wheel can be advantageous to convey low-level trajectory intentions [40]. However, more complex ideas or planned driving maneuvers cannot be communicated in this manner.
With the help of AR, we want to convey to the driver a simplified explanation of what the car is perceiving and how driving decisions are made, thus giving a feedback regarding the “how and why” [41]. Koo et al. determined in a semi-automated scenario that why information is preferred by drivers but both how and why information is needed in critical safety situations. Previous work from Wintersberger et al. [18] has shown that traffic augmentations via sensor data in the driver’s line of sight can result in increased trust and acceptance. A user study was conducted in a rural scenario with the automated car executing overtaking maneuvers on a straight road. Other cars were highlighted via color-coded visual augmentation markers. Häuslschmid et al. conducted an experiment with pre-recorded videos of urban drives which were later experienced by users in the lab with different HUD visualizations [42]. They showed an increase in trust when using a world-in-miniature visualization and an anthropomorphic visualization. In contrast to this approach, we are working with a driving simulation. While this can be a disadvantage in terms of realism, it allows us to stage a multitude of critical driving situations. These would be very difficult to recreate in a real-world scenario. Furthermore, there already are promising results in previous work concerning the external validity of simulated AR interface evaluations in MR environments, e.g., for search tasks [43] and for information-seeking tasks in wide-FOV interfaces [44]. Lastly, our evaluation differs from [42] in that it is not focused on driver trust. Instead, the primary aim of our study was to establish whether our explanatory WSD UI supports driver SA during automated drives in the urban environment. While we included some questionnaire items on aspects of technology acceptance and trust, these are clearly secondary next to the SA evaluations. A detailed study description follows in Section 4.2.

3. Design of the Prototype

In this section, we present our human-centered design approach for the creation of a prototype for the explanatory WSD UI. We then introduce the resulting prototype which has been built as a module of a custom driving simulation that executes in a CAVE-like (Cave Automatic Virtual Environment) [45] MR environment. The WSD UI combines screen-fixed information visualization elements with world-registered AR overlays. The latter benefit from the large visual space available on the windshield and are not as restricted as the discussed previous approaches in terms of information amount and complexity.

3.1. Human-Centered Design Approach

In order to gain insights into user perspectives on an explanatory WSD interface for ACs, we conducted a survey. A total of 51 volunteers (21 females) between 18 and 57 years ( M = 25.57 , S D = 7.16 ) participated, all with a valid driver’s license. Participants were recruited by intercepting pedestrians in an area both commercial and close to two universities. We did not collect participants’ occupations in the survey but inquired beforehand with avoiding obvious imbalances in mind. The sample contained university students (mainly: economics, engineering, architecture), researchers and non-academic adults. We investigated aspects of consumer awareness, interests, expectations and concerns. Participants were instructed to answer the questions under the assumption of owning an AC with high to full automation (SAE levels 4–5 [21]), i.e., with no need for driver intervening. The questionnaire consisted of three main sections (see Supplementary Documents S2) with the first part aimed at collecting the general opinion of a participant towards AD technology. The second part was designed to explore user preferences and priorities regarding possible interface elements on a WSD for ACs. The suggestions were accompanied by conceptual pictures where necessary. In the last section of the survey, participants were asked to give their idea of an ideal interface design with focus on how much information about what should be displayed where. Due to the possible lack of previous knowledge about AD technology and HUDs, respectively, WSDs, the survey was processed on a tablet computer in the presence of the examiner. He ensured that the technological explanations in the survey were thoroughly understood while staying unobtrusive for the actual answering of the questions.
Half of the participants stated they would feel the least safe with an AC in urban areas (47.1% in 50 kph-areas, 3.9% in 30 kph-areas), which is in line with our reasoning to use an urban environment to provoke critical situations. Surprisingly, 29.4% considered freeways least safe with only 15.7% choosing rural roads. We assume that for many people not familiar with the artificial intelligence background of ACs, the suitability of the environment for AD (e.g., predictable driving situations, one-way traffic) is a less important factor compared to the speed limit or average speed on the respective type of road. While urban scenarios are probably more obvious to have unpredictable hazards and situations, the distinction between non-urban environments can be more subtle. Two participants did not give any answer fitting the categories.
Participants had to evaluate 7-point Likert statements targeted at their attitude towards AD in general and towards potential explanatory UIs. The results are shown in Figure 1. Items Q1–Q3 were answered before we introduced the concept of an explanatory UI. Participants had a divided opinion on whether ACs outperform an experienced human driver (Q1) and whether they would trust an AC in good weather (Q2). Only a minority shows trust for ACs driving in bad weather (Q3), i.e., low visibility in fog or rain. Before Q4, we explained the general idea of an explanatory UI for ACs to the participants before showing examples of any specific UI elements. Participants then had to state if such a UI is a necessity for ACs. The majority did not yet see a benefit of such a system (Q4).
We then confronted participants with our suggestions for UI features. Some of them were still on a more conceptual level without yet having a specific visualization in mind. Some were specific enough that we provided drafts to give visual examples. In general, participants were very positive towards world-registered AR elements. We discarded the least popular suggestion Cone of Vision ( M = 3.11 , S D = 1.88 ), which was meant to display sensor ranges and highlight areas currently observed by the car. For all of the following items, more than two thirds of participants (with only negligible differences between items) wanted them to be part of an AC’s UI: augmentation of hazards, current traffic regulations, current environment danger level, explanations for driving behavior, imminent driving trajectories. We also asked participants which conventional car UI interface elements they wanted to keep for an AC. Participants regarded as the most important to remain: construction site and traffic jam warnings (selected by 86.3%), fuel warnings (66.7%) and destination/time-of-arrival information (60.8%). Entertainment features were among the least popular (13.7%), in line with suggestions from previous work [46] that such tasks do not belong to AR/HUD systems.
In the end, participants evaluated the remaining items Q5–Q10 from Figure 1. Most participants stated that the more information provided by the UI, the safer they would feel (Q5). However, they were not willing to sacrifice own FOV for the sake of more information to be displayed (Q7). This indicates that finding a good balance regarding information amount and visual obstruction is of importance. There was a high demand for customizable UIs (Q6), which we deliberately excluded from our own prototype in favor of comparable conditions for the planned user studies. Even though the majority of participants did not feel the need of a display system for an AC at first (Q4), there seemed to be some reconsideration after being introduced to potential features. The participants’ expectation of trust in their vehicle was reported higher when assuming availability of an explanatory UI, both under good and bad weather conditions (Q9/Q10 vs. Q2/Q3). A Wilcoxon–Pratt signed-rank Test shows this difference to be significant for good ( p < 0.001 , Z = 5.03 , g * = 0.93 ) and bad weather ( p < 0.001 , Z = 5.02 , g * = 0.94 ) with a large effect size (determined via Hedges’ g with bias correction and threshold g * 0.8 ). While we expect this result to be influenced to a certain extent by desirability bias, we also believe it indicates how important it is to enlighten potential future end users about AD technology. Explanatory UIs should be able to support this process.

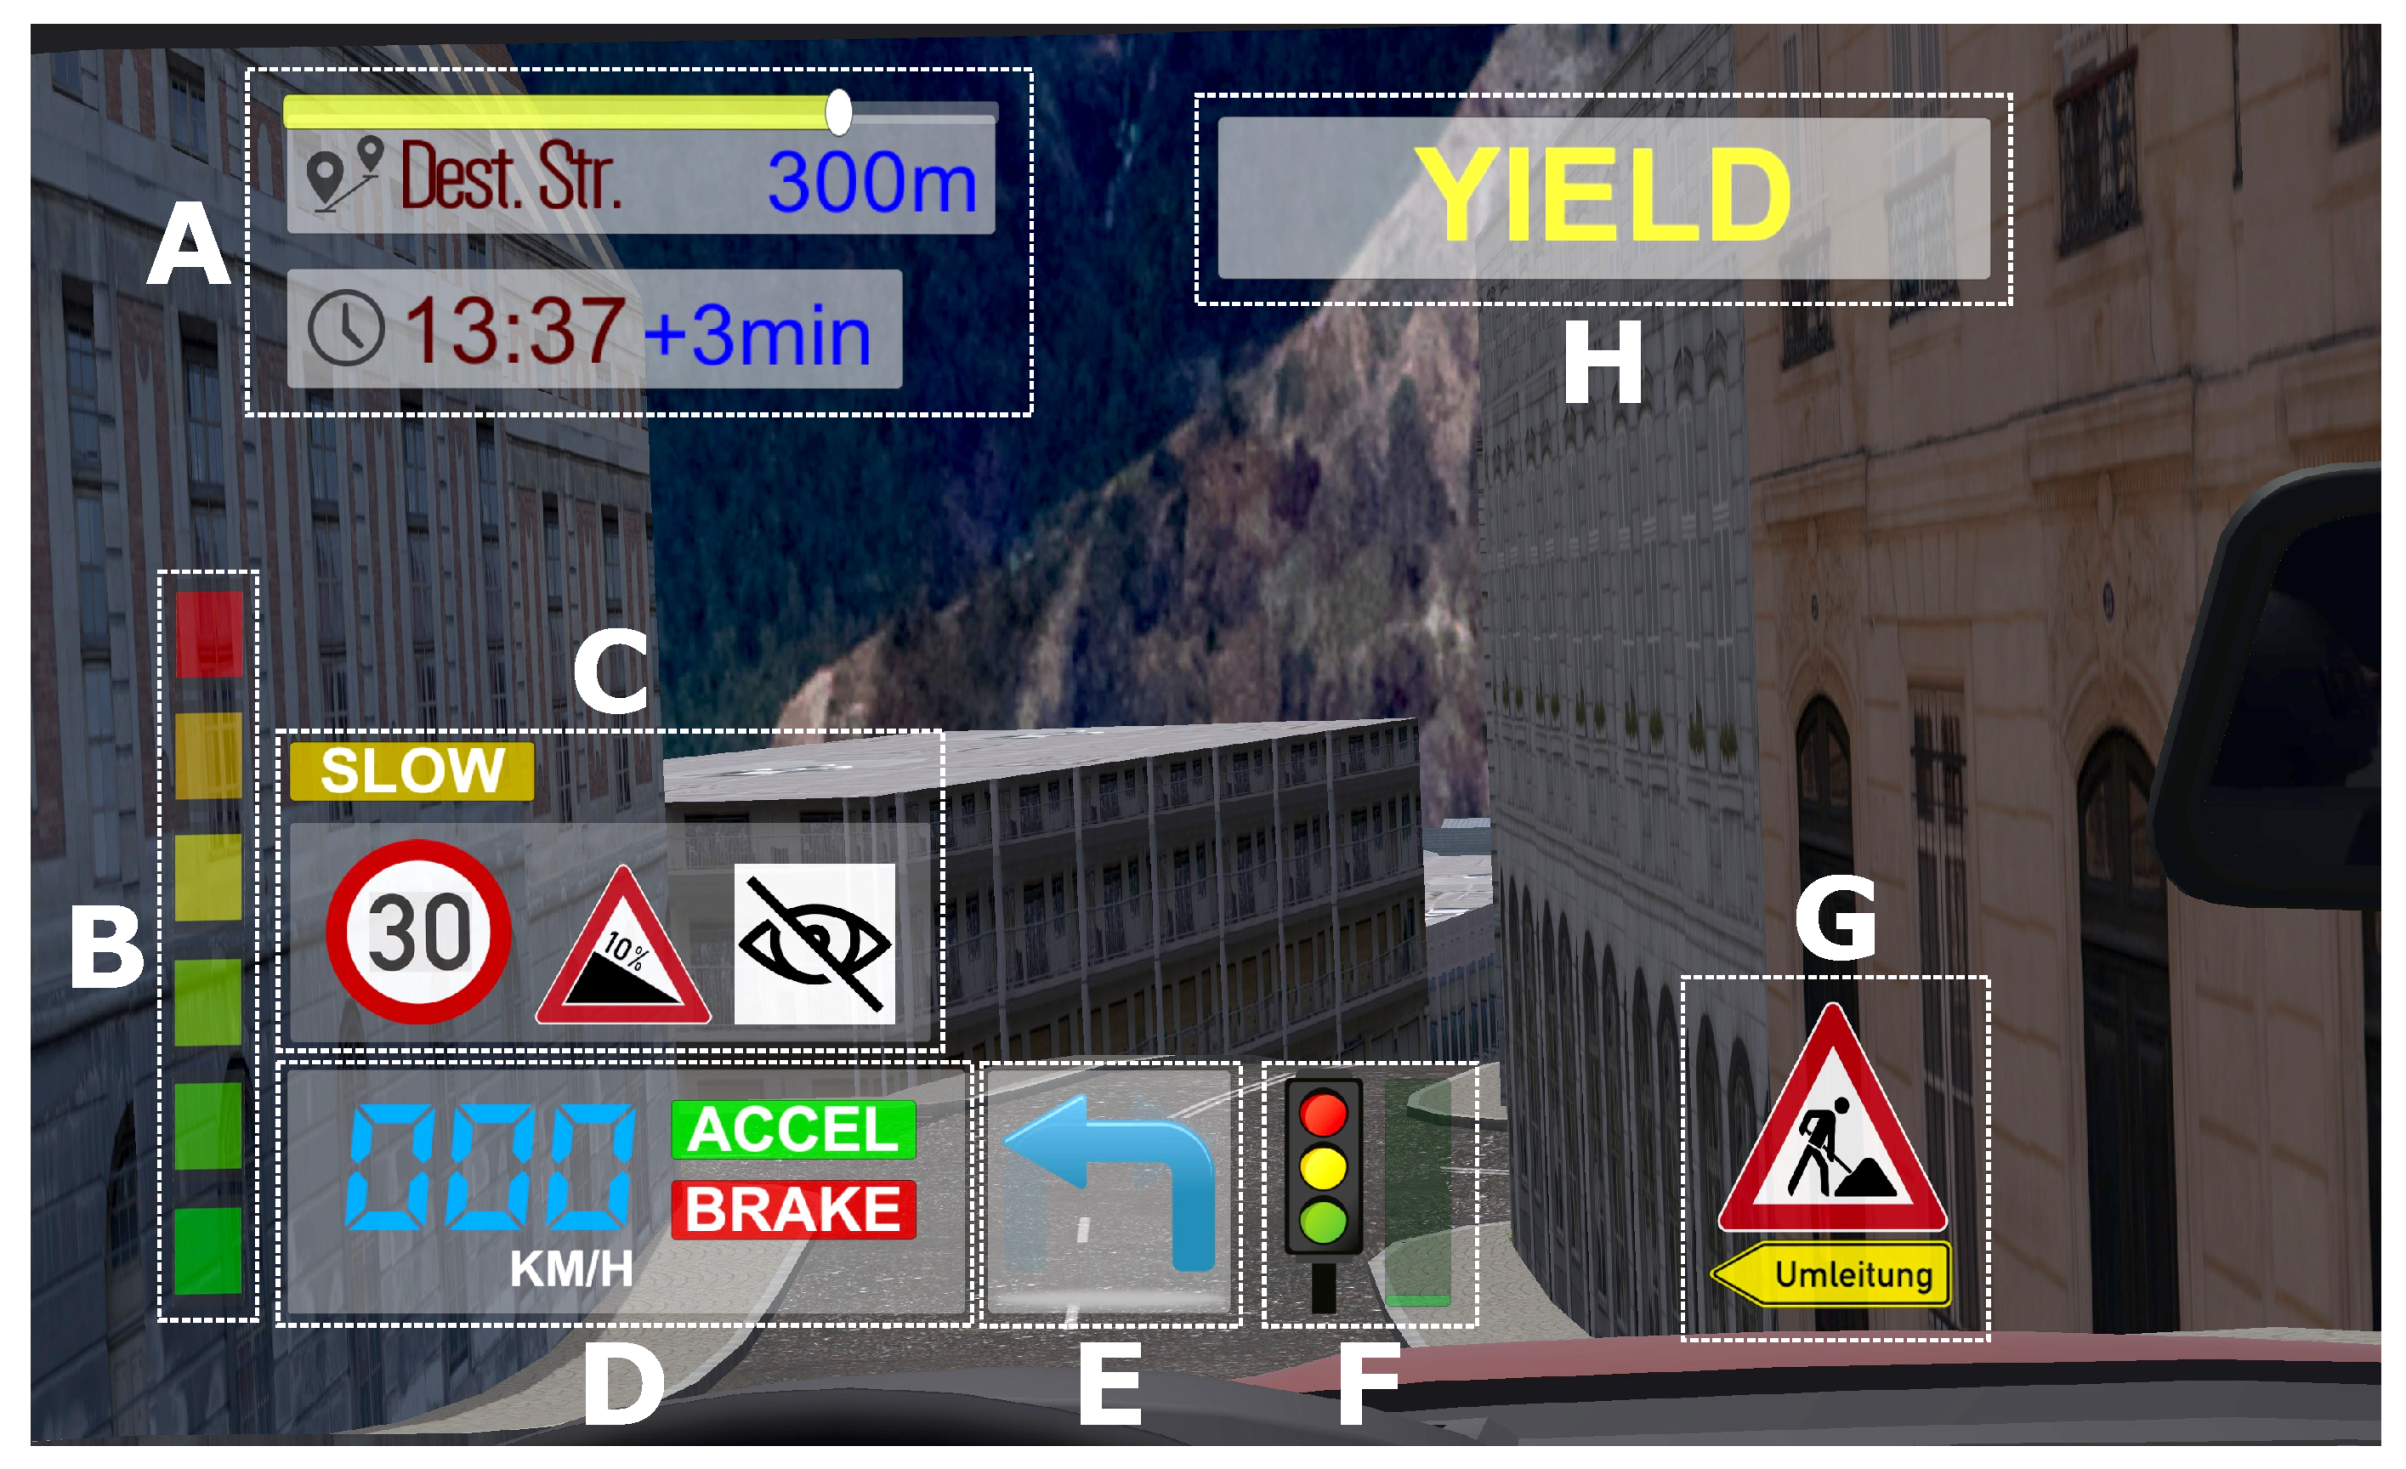
3.2. Prototype of an Explanatory Windshield Display Interface for Automated Cars

With the results of the survey in mind, we implemented a WSD interface prototype for AD in urban areas. We considered recommendations for the placement of information in large-sized HUDs [47] and sickness prevention in self-driving car user interfaces [48]. This simulated WSD presents its information to the driver on a virtual plane two meters in front of the driver’s default position, similar to current HUDs. Our WSD interface consists of two kinds of elements: screen-fixed information visualizations and world-registered augmentations.
Figure 2 shows all screen-fixed elements of the WSD. Note that, in the figure, all UI elements except original road signs were translated to English whereas our original UI as used in the main study is entirely in German to be suited for our participants. Some of them have been introduced as a consequence of the survey results to offer an exhaustive experience, even though they should have no direct bearing on the study tasks (A,B). A larger number of elements also enables us to later evaluate the importance of clear view versus information availability. Other elements display dynamic information and are targeted at giving the driver the possibility to improve SA. These elements become visible only when appropriate (C,E,F,G,H). The meaning and usage of elements are as follows:
A
Trip info panel with destination, remaining distance and time to arrival and progress indicator.
B
Automation confidence bar similar to [37], alerting the driver to the current system reliability level: the more the bar extends upwards, the less predictable the situation for the automation system.
C
Traffic regulations and info panel showing dynamic content depending on the environment and situation, including detected road signs and other factors. Examples shown in Figure 2: 30 kph speed limit; steep grade ahead; impaired visibility; car going slow due to potential hazards.
D
Primary driving panel with speedometer and binary indicators for imminent acceleration or braking.
E
Navigation panel showing the next step in the planned route, i.e., upcoming turns.
F
Traffic light panel showing a remaining time indicator which only becomes visible on approaching lights. It gives the driver a heads-up as to when the drive continues. This feature assumes availability of infrastructure data, e.g., via vehicle-to-infrastructure (V2I) communication.
G
High-priority panel showing rare occurrences when needed. It is briefly blinking on appearance and accompanied by an alert sound to guide driver attention. Examples for content are construction or accident sites, detours and approaching emergency vehicles.
H
Traffic priority panel indicating the right of way for an upcoming intersection. It gives drivers a heads-up as to how the AC will handle an intersection. YIELD is shown on approaching if the AC plans to decelerate and wait. DRIVE is shown when the AC assumes right of way, either already on approaching an intersection or after yielding.
While visual clutter is not a safety issue anymore in an AC without driver intervention, survey feedback revealed that users still preferred to have a somewhat free FOV. Therefore, apart from the primary driving and destination panels, all other elements only show content dynamically when appropriate. All elements are intentionally positioned away from the driver’s central FOV to reduce interference with the world-registered augmentations described further below. As perception deteriorates towards the boundaries of the FOV, inactive (grayed out) elements light up and the (by default hidden) high priority panel briefly blinks to direct driver attention on a change. This is helpful since drivers are likely to miss non-salient warnings, especially in a highly automated scenario [49]. To avoid stressing drivers, however, we visually and temporally limited these attention-guiding measures. While attentional tunneling has been a problem to consider in many automotive UIs, we believe this can to some extent be neglected when the driver’s role is strictly passive.
Table 1 shows our implemented world-registered AR overlays. These implementations resulted from a discussion of the design survey results among the authors and a subsequent informal brainstorming for specific UI element ideas. This internal session was supported by four colleagues (PhD candidates, all with driver’s license) from non-automotive fields in human–machine communication. We agreed to avoid visualizations which are too directly related to technical realization aspects of an AC (like the sensor cone-of-vision idea in the survey) and focus on highlighting objects and traffic regulations which are detected by an AC and relevant for driving decisions.
In the current prototype, these augmentations are not yet simulated to visually appear on the virtual plane of the WSD but are directly displayed on or near the objects they are highlighting in the world space, thus appearing in the depth of the highlighted objects in the stereoscopic simulation environment. We accepted this deviation from a more accurate WSD simulation in favor of faster prototyping. As can be seen from the screenshots and item descriptions, some elements (b,c,e) are superimposed on the road surface (at places that correspond to their intended meaning) while others (a,d) are highlighting static or moving objects in the traffic environment, including other vehicles, pedestrians and certain objects.

4. Methods

To test our proposed WSD interface, we conducted a user study and collected data for evaluation of driver SA. In this section, we first present the urban driving scenarios we implemented as a basis for the study. We then introduce in detail the participants, lab setup, experimental design and procedure of the user study including data collection methods.

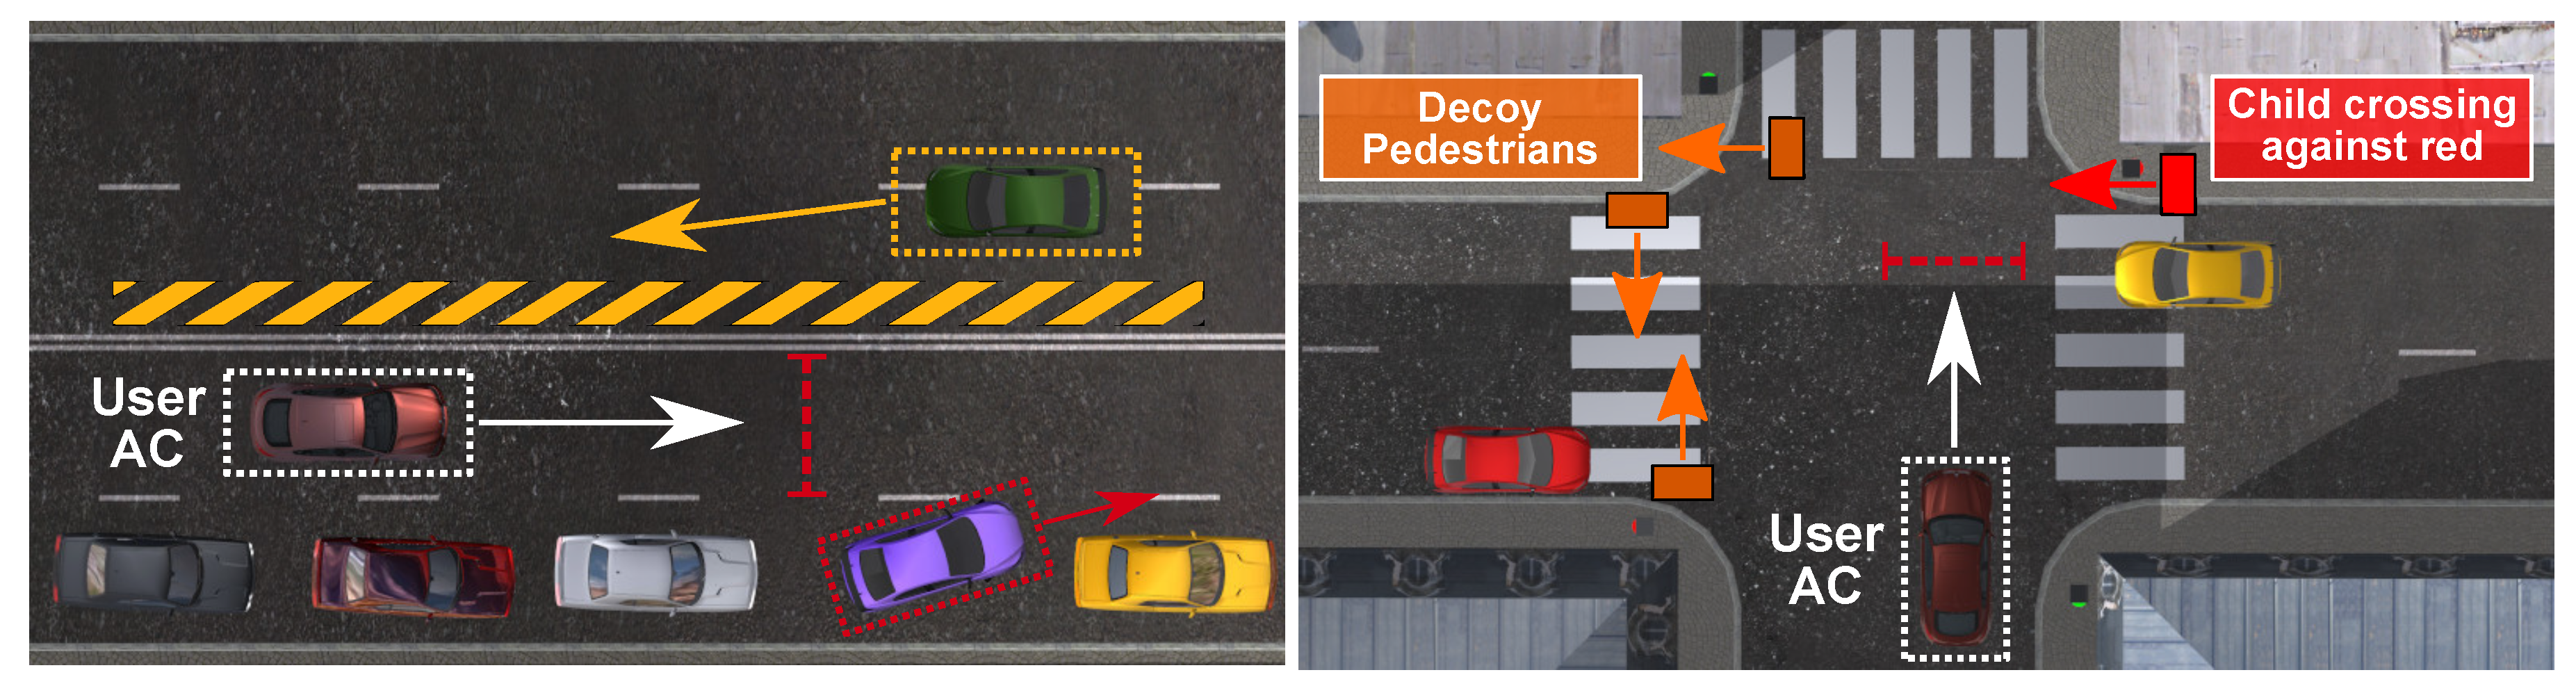
4.1. Urban Driving Situations

To be able to explore the influence of the WSD interface on the actual SA of drivers, we first needed to create suitable scenarios for AD in an urban environment. Our 3D city model has been created via a procedural modeling tool. It features large main and narrow side roads with many three-way and four-way intersections and height differences. Our AD scenarios have been structured into four distinct, exclusive routes within this environment, such that no place is visited twice throughout the routes. This is to keep the driver from anticipating traffic events. In order to create typical urban situations with hazards, additional necessary objects were placed and simulated, including other vehicles (parking or driving), pedestrians (partly with animals) and infrastructure like road signs and traffic lights. The user’s AC travels these routes via fixed waypoints, i.e., the path through the streets but also the specific lanes and turning maneuvers that the AC takes are predefined. All routes are following a predetermined, reproducible timeline, such that movements of the user car as well as all other traffic objects and events occur in always the same fashion and are synchronized between each other. The total driving duration of each route is approximately three minutes. The critical driving situations had to be selected and implemented carefully, considering what will appear where and when in the scene. We targeted such situations that require sudden and potentially incomprehensible reactions from the vehicle. However, it was necessary to carefully design the timings in order to make hazards neither too obvious to miss nor too difficult to recognize for humans. Table 2 shows descriptions of the basics of the driving situations we implemented. Figure 3 gives exemplary visual overviews of two of the situation types described in the table. Additional explanations have been added in the figure, e.g., to clarify driving or walking directions. Boxes replace pedestrians for better visibility.
One to two instances of each situation were placed on the different routes while taking care that the situations remain comparable regarding properties and difficulty. To get a more realistic urban scene, we placed additional non-threat elements (decoys) into every situation, like pedestrians and other traffic (examples visible in Figure 3). We also placed such elements in between the actual hazard situations, so that drivers cannot easily distinguish idle phases from upcoming events. Unusual cases like debris or an accident site were only used once per route. More common situations like objects moving in front of the car were reused in different forms, e.g., a child chasing a football or a dog crossing against the red light. To reduce development effort, pedestrians and dogs were visualized by textured 2D sprites that were merely translated (no walking animations) when crossing a street. All AI cars were instances of a small set of 3D models with some additional variation by applying diverse coloring. They started at predetermined times on predetermined routes to provoke situations. To that end, some of them were intentionally designed to ignore traffic regulations (e.g., speed limit, red lights) or show erratic behavior (e.g., swerving, dangerous overtaking). The order of occurrences between the different situation types from Table 2 was designed to be different between all routes, so that upcoming hazards cannot be anticipated from previous experience on another route.

4.2. User Study

To evaluate our prototype for an explanatory WSD UI, we carried out a user study to collect both subjective and objective data regarding driver SA. Furthermore, we evaluated specific properties of the WSD interface. In this section, we present the details regarding the study, including participants and apparatus, the experimental design, the data collection and the main study procedure.

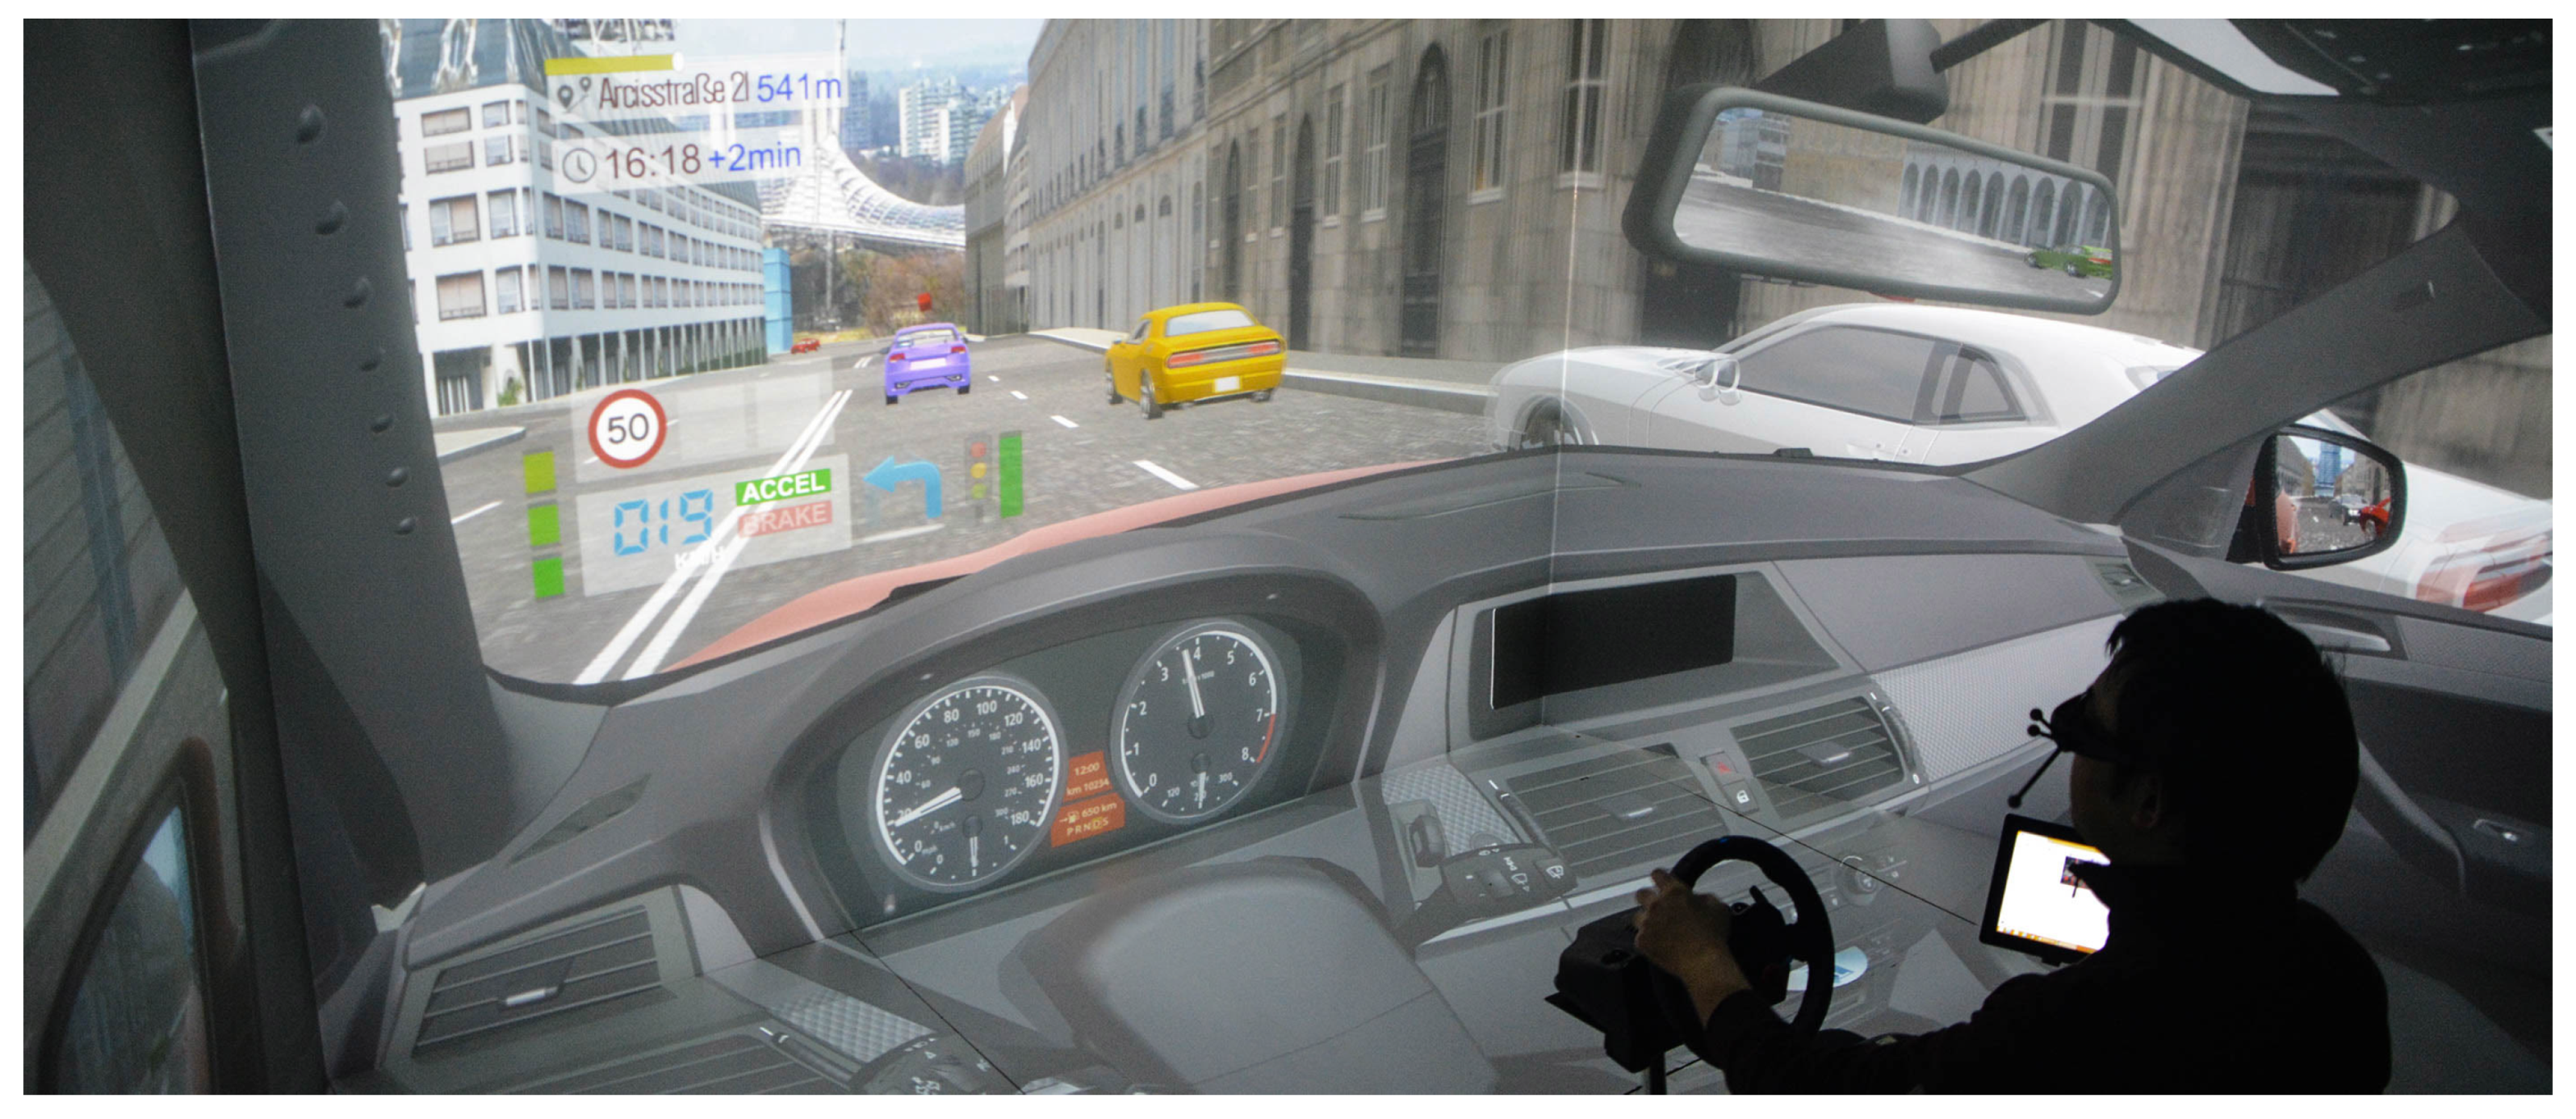
4.2.1. Participants and Apparatus

A total of 32 participants (eight females, 24 males) took part in the study, all with a valid driver’s license and naive to the experiment. Recruitment mainly happened via local social network groups not connected to specific fields or backgrounds. Participants were informed beforehand that there is no financial compensation but that they can make a selection from confectionery items. Excluding one female participant who declined to reveal her age, the participants ranged between 19 and 58 years ( M = 27.0 , S D = 9.69 ). Only three participants stated to have personal experience with HUD systems in passenger cars. Figure 4 shows the basic lab setup: participants were seated in a CAVE-like MR environment with stereoscopic projection, running our driving simulation. A tablet computer was mounted to the side of the driver’s position to comfortably allow filling in the different questionnaires introduced further below. Tracked shutter glasses allowed participants to use head movements to adjust their perspective, e.g., to get a better view into a side street. The steering wheel and pedals did not influence the simulation but were placed for added feeling of presence in the scene. The driver’s seat was immobile, i.e., we did not have a dynamic motion chair or platform.

4.2.2. Experimental Design

We operated with a 2 × 2 within-subjects design for the study. The independent variables were:
  • WSD Interface Status: On (i.e., all elements available) vs. Off (i.e., only basics: A, E and speedometer from D in Figure 2 and none of the world-registered AR elements from Table 1)
  • Visibility (VIS): High (i.e., clear weather) vs. Low (i.e., fog with maximum viewing distance of approximately 50 m; see Table 1 (c) for a visual example)
The resulting four main study conditions were Latin Square-balanced, resulting in four sequences. Combined with the Latin Square-balanced four sequences of our four AD routes, we obtained 16 distinct combinations. Every combination has been executed exactly twice, corresponding to 32 participants. The main hypotheses for our study were as follows:
Hypothesis 1 (H1).
Driver SA with WSD on is significantly greater than with WSD off under both visibility conditions.
Hypothesis 2 (H2).
Deterioration in driver SA from high to low VIS is significantly smaller with WSD on than with WSD off.

4.2.3. Data Collection

Our main focus in the evaluation of this study was the impact of our WSD UI on driver SA. Since we based our work on the Endsley SA model as described in the background section, we applied a custom variant of the Situation Awareness Global Assessment Technique (SAGAT [50]) which uses online freeze probes to collect SA data. We prepared four different SA tests, one for each route. Each contained an individual set of 12–15 SA questions tailored to the driving situations of the respective route. The difference in number is related to the fact that we could not achieve a full balance of driving situations between the different routes (see the Limitations section). There were between one and three questions for each situation (i.e., for one freeze of the simulation), targeting aspects of the three Endsley-levels of SA. For better comprehensibility, some exemplary questions for the different SA levels are given below (see Supplementary Documents S2 for the full tests):
  • Perception:
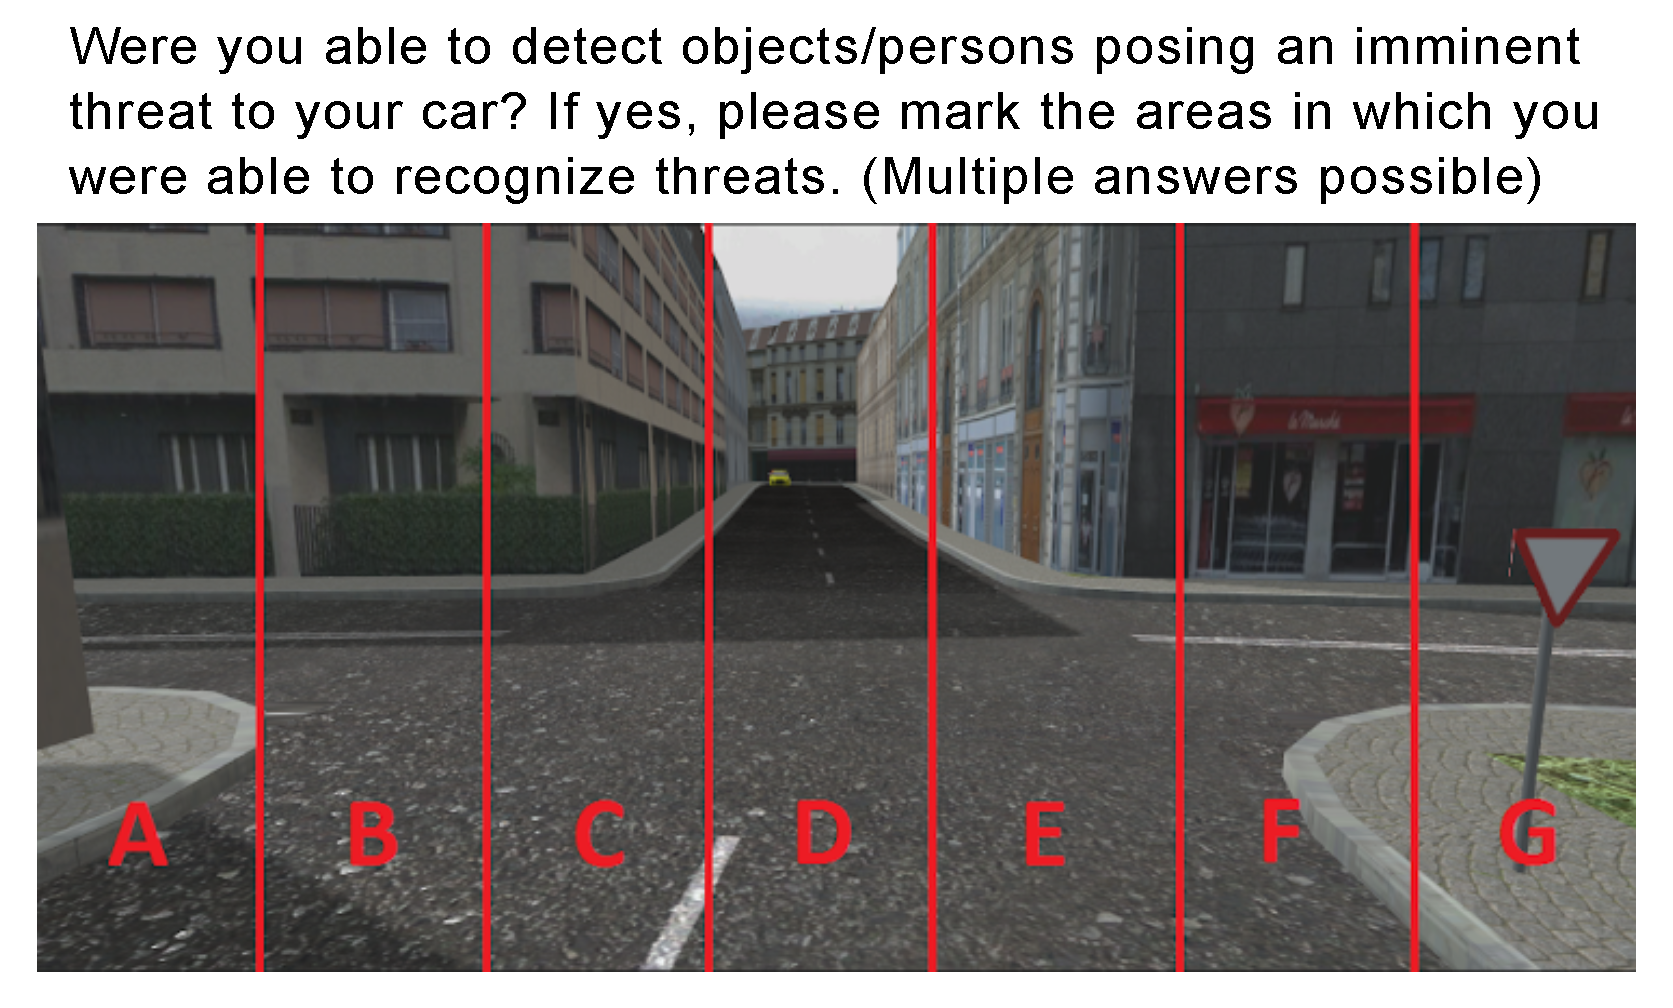
    • How many pedestrians could you recognize in the scene?
    • From which directions are other cars entering the intersection you just reached?
  • Comprehension:
    • Why did your vehicle just decelerate considerably?
    • What is the reason for the unplanned detour your vehicle is taking?
  • Projection:
    • What do you expect your vehicle to do next?
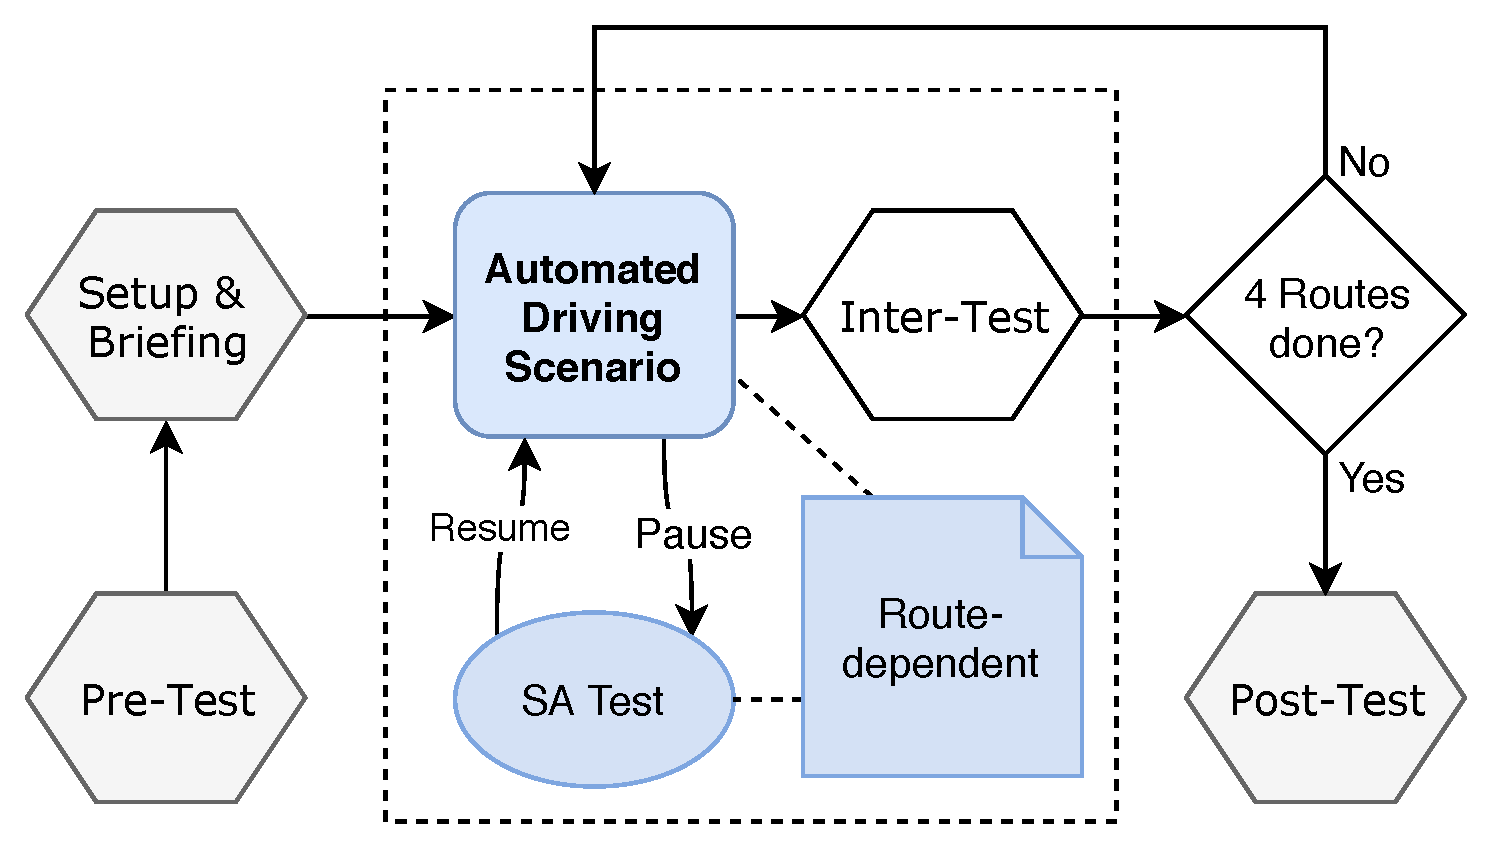
Questions were partly accompanied by a screenshot of the (emptied) scene like in Figure 5. Answer options were provided as single- or multiple-choice lists and, where applicable, complemented by neutral options (“I could not detect threats”, “I am not sure”). We blackened out the simulation image on freezes. However, we had to deviate from SAGAT in that we did not pause at random points, but at predetermined times according to our orchestrated driving situations. We did not impose a fixed time limit for answering the questions on participants, but instructed them to answer to the best of their ability. They were also told to answer based on what they have really seen or recognized and not by guessing or assuming what might have been there. We added a small number (1–2) of control questions per route in idle phases so that participants would not automatically assume there is a hazardous situation even when they did not perceive any. They occurred just like the regular questions at fixed, predetermined freeze probe points identical for each participant. They did not differ in formulation from the examples above, but the neutral answer was the correct answer in these cases.
We additionally obtained subjective user data through several custom questionnaires. While we were influenced by established standardized questionnaires used in the interaction domain like NASA-TLX [33] and the User Experience Questionnaire (UEQ) [51], we refrained from including them directly. Most of their items do not fit very well to our scenario in which the user has a very passive role as an observer and does not directly operate a system. There were three types of questionnaires throughout the study: the pre-test, in which we collected demographic data, information about the participants’ experience with driving and HUD technology and, lastly, knowledge and attitude concerning AD. The inter-test, which supplemented our objective SA scores with a self-rating from the participants. It also included self-ratings for perceived safety, stress and system trust. Finally, the post-test revisited items from the pre-test for a pre-post comparison and also targeted some aspects of user experience (UX) when doing an automated drive with the WSD UI. With the exception of the SA test questions described above, all other questionnaires were consistently using a 7-point Likert scale for subjective ratings, with 1 = full disagreement and 7 = full agreement. Specific questionnaire items are given together with the results in the corresponding section further below.

4.2.4. Procedure

An overview of the study procedure is given in Figure 6. After welcoming a participant with a short general introduction and obtaining consent for the participation and provision of data for evaluation, the pre-test had to be answered. Then, participants were seated in the driving simulation environment for the initial setup and briefing stage that contained the following steps:
  • A calibration of the virtual driver position to the actual head position of the participant. This is to ensure that each participant has a correct perspective with full visibility of all virtual WSD elements and a similar initial view of the virtual scene, independent of body or sitting height.
  • An explanation of the WSD interface elements and their meaning to the participants, both for the screen-registered and world-registered features.
  • A test drive of approximately five minutes in the simulator, allowing participants to get used to the driving simulation, the head-tracking, the urban environment with traffic objects and the virtual WSD. The examiner only proceeded after each WSD UI element had been experienced.
In the main part, participants had to complete the same basic procedure four times. They started to experience an automated drive through one of our four prepared AD routes, each with approximately three-minute duration. During each of these drives, we paused the simulation multiple times and turned the screens to black for the aforementioned SAGAT probes. When the participant had finished the current freeze probe of the SA test, the examiner continued the simulation. After completing each automated drive, participants were required to fill in the inter-test questionnaire, i.e., the SA self-rating items and the UX items for perceived safety, stress and trust. Unlike the SA tests, the inter-test was not route-dependent, i.e., the same items had to be processed after each of the four scenarios and conditions. As an additional positive side-effect of the inter-tests, participants had breaks in between the simulation runs. This is especially desirable for user studies in stereoscopic and head-tracked virtual environments to avoid discomfort and dropouts. Following the fourth and last automated drive and inter-test, the post-test questionnaire finalized the study procedure.

5. Results

In this section, we present the results extracted from the study data. This includes the objective SA scores from the SAGAT-like probes and subjective ratings from the pre-test, inter-test and post-test questionnaires. We also present a correlation analysis between objective and self-rated SA.

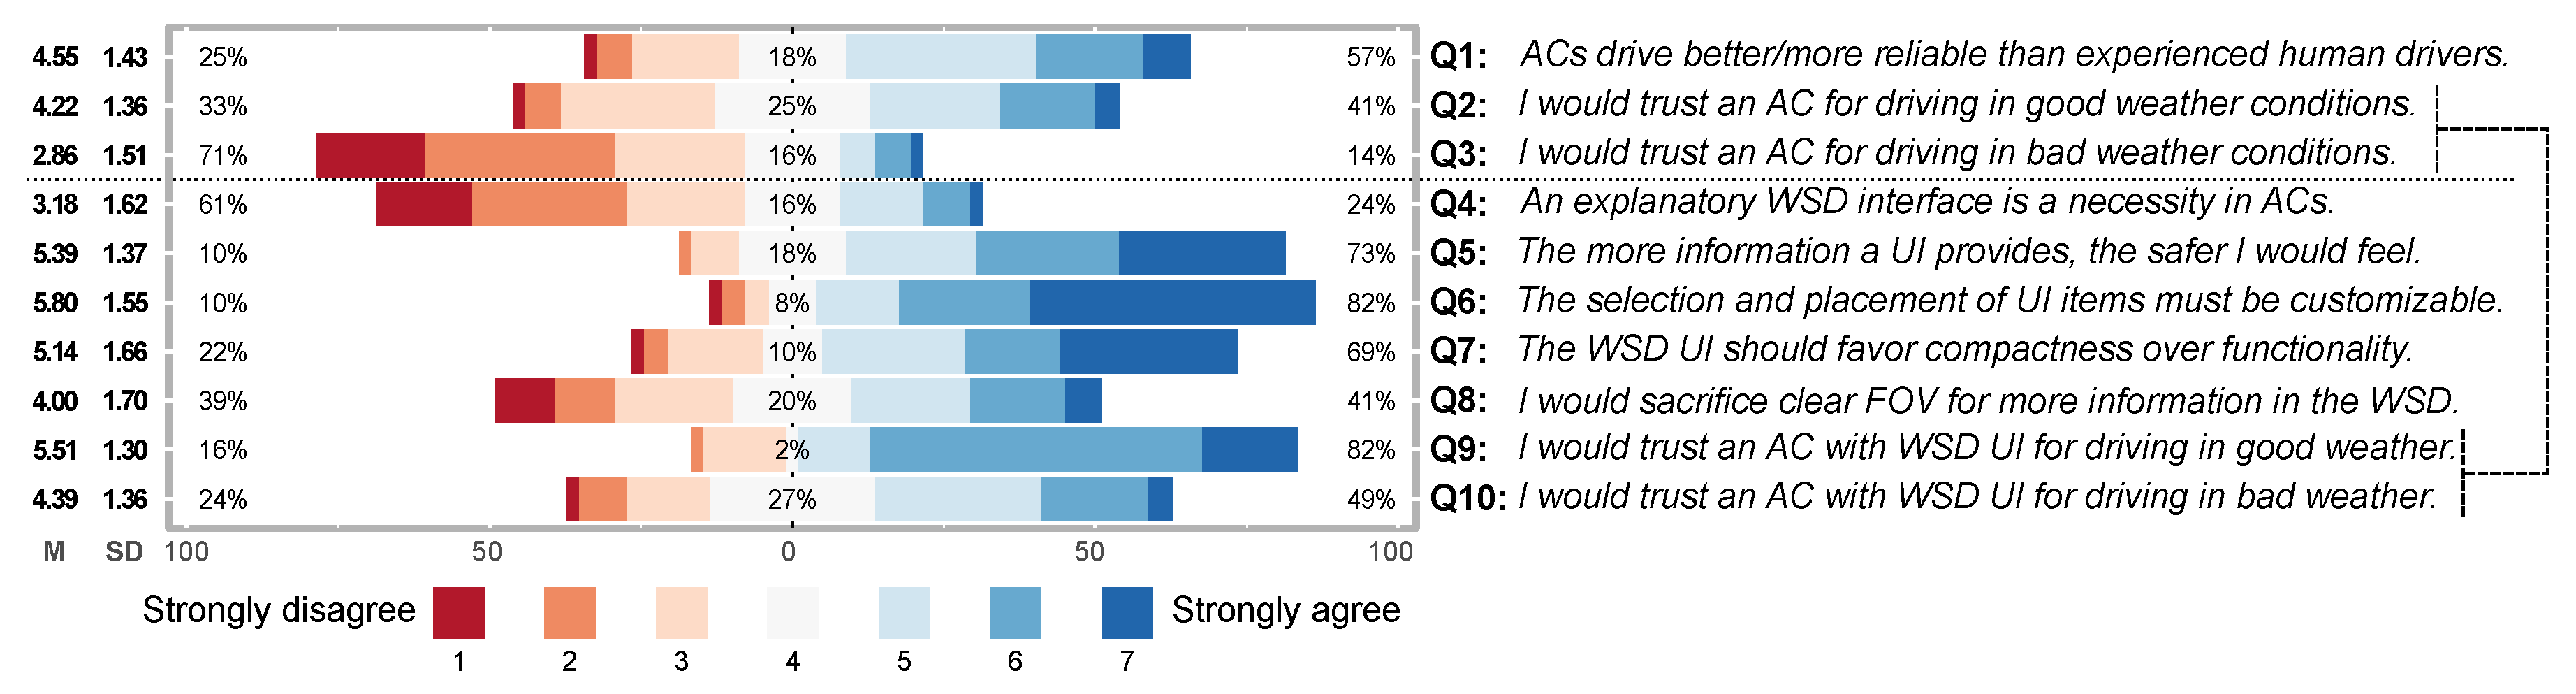
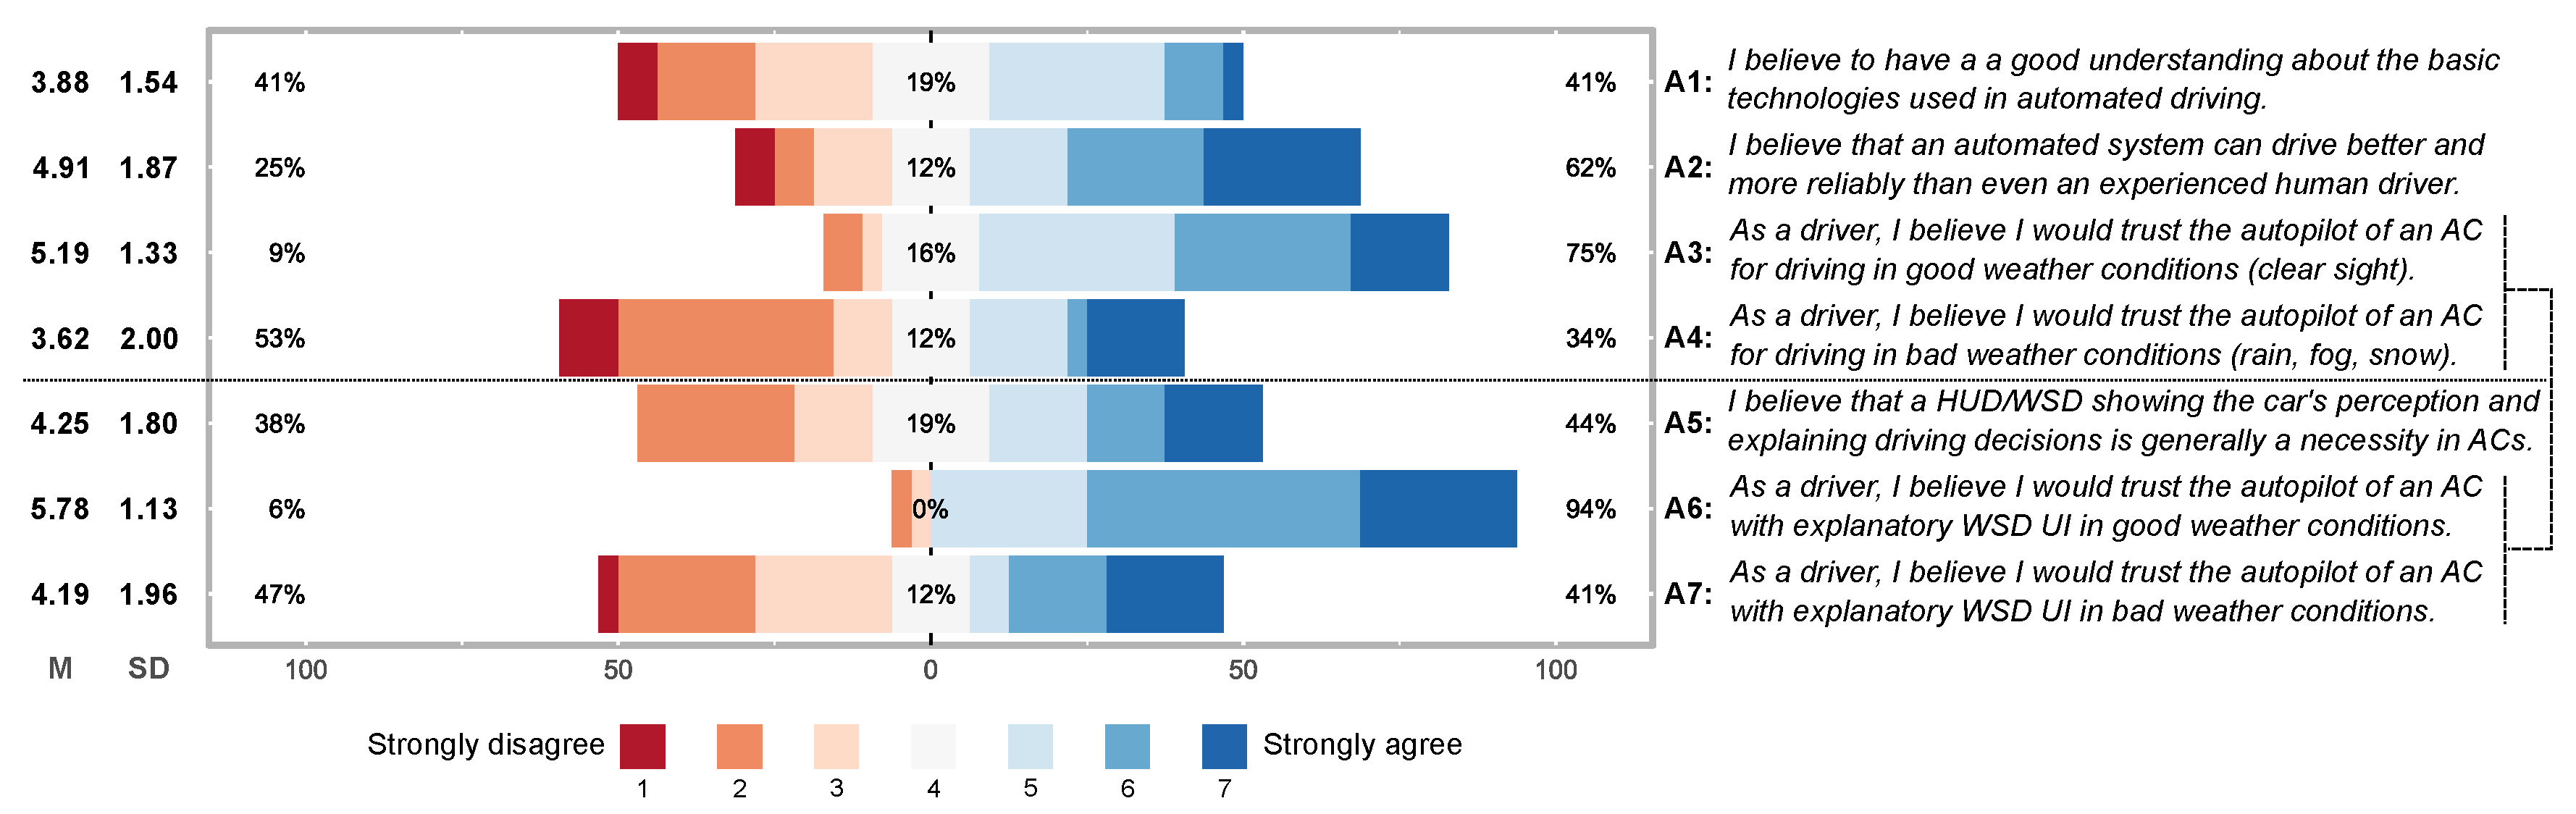
5.1. Pre-Study Opinions

After the general introduction but before the briefing and setup for the main study tasks, we obtained some information about participants’ knowledge and attitude towards AD in general. The items of this pre-test are partially similar to the ones used during the UI design process, but here also serve the purpose of better understanding the post-study results and recognize potential changes resulting from the study. In between the pre-test items, we introduced the idea of a HUD or WSD interface that gives visual information to explain the AC’s driving. Figure 7 shows the results from the questionnaire. Most results are in line with our findings during the UI design process (Figure 1). Notable differences were (significance tested via Mann–Whitney–Wilcoxon tests for independent samples. Effect size (ES) is given by Hedges’ g with bias correction for small samples):
  • A3 vs. Q2: trust in ACs without UI in clear weather ( p = 0.002 , W = 489 , g * = 0.70 , ES: medium),
  • A5 vs. Q4: necessity of an explanatory UI in ACs ( p = 0.010 , W = 545 , g * = 0.62 , ES: medium).
The differences are not significant in the bad weather case without UI (A4 vs. Q3: p = 0.116 ). Looking at participants’ answers after they had been introduced to the explanatory UI concept, the results were much more in line, both for clear weather (A6 vs. Q9: p = 0.502 ) and bad weather (A7 vs. Q10: p = 0.506 ). A possible explanation for the differences might be participants’ initial knowledge about AD technology (which we did not yet inquire in the design process). We also noted in regard to the two differences above that there is a significant difference between genders (m/f) in the study pre-test:
  • A3: M f = 4.38 , S D f = 1.30 , M m = 5.46 , S D m = 1.25 , p = 0.048 , W = 51.5 , g * = 0.79 , ES: medium,
  • A5: M f = 5.38 , S D f = 1.77 , M m = 3.88 , S D m = 1.68 , p = 0.046 , W = 141.5 , g * = 0.81 , ES: large.
This tendency is not at all present in the earlier UI design process questionnaire, where the tests for trust in good weather (Q2: p = 0.666 ) and rated necessity of the UI (Q4: p = 0.830 ) show no significant difference. It should however be noted that the sample size for this comparison is rather small in the study pre-test (eight females out of 32 participants) as opposed to the design questionnaire (21 out of 51).
The differences in trust ratings between conventional ACs (A3 and A4) and ACs with explanatory UI (A6 and A7) are much less evident from the overall distribution in the pre-test (Figure 7) as opposed to design phase results (Figure 1). However, we still found a significant difference both for good weather (A3 vs. A6: p < 0.001 , Z = 3.97 , g * = 0.86 , ES: large) and bad weather (A4 vs. A7: p < 0.001 , Z = 3.85 , g * = 0.81 , ES: large) due to sufficient within-subject differences in this pre-post comparison.

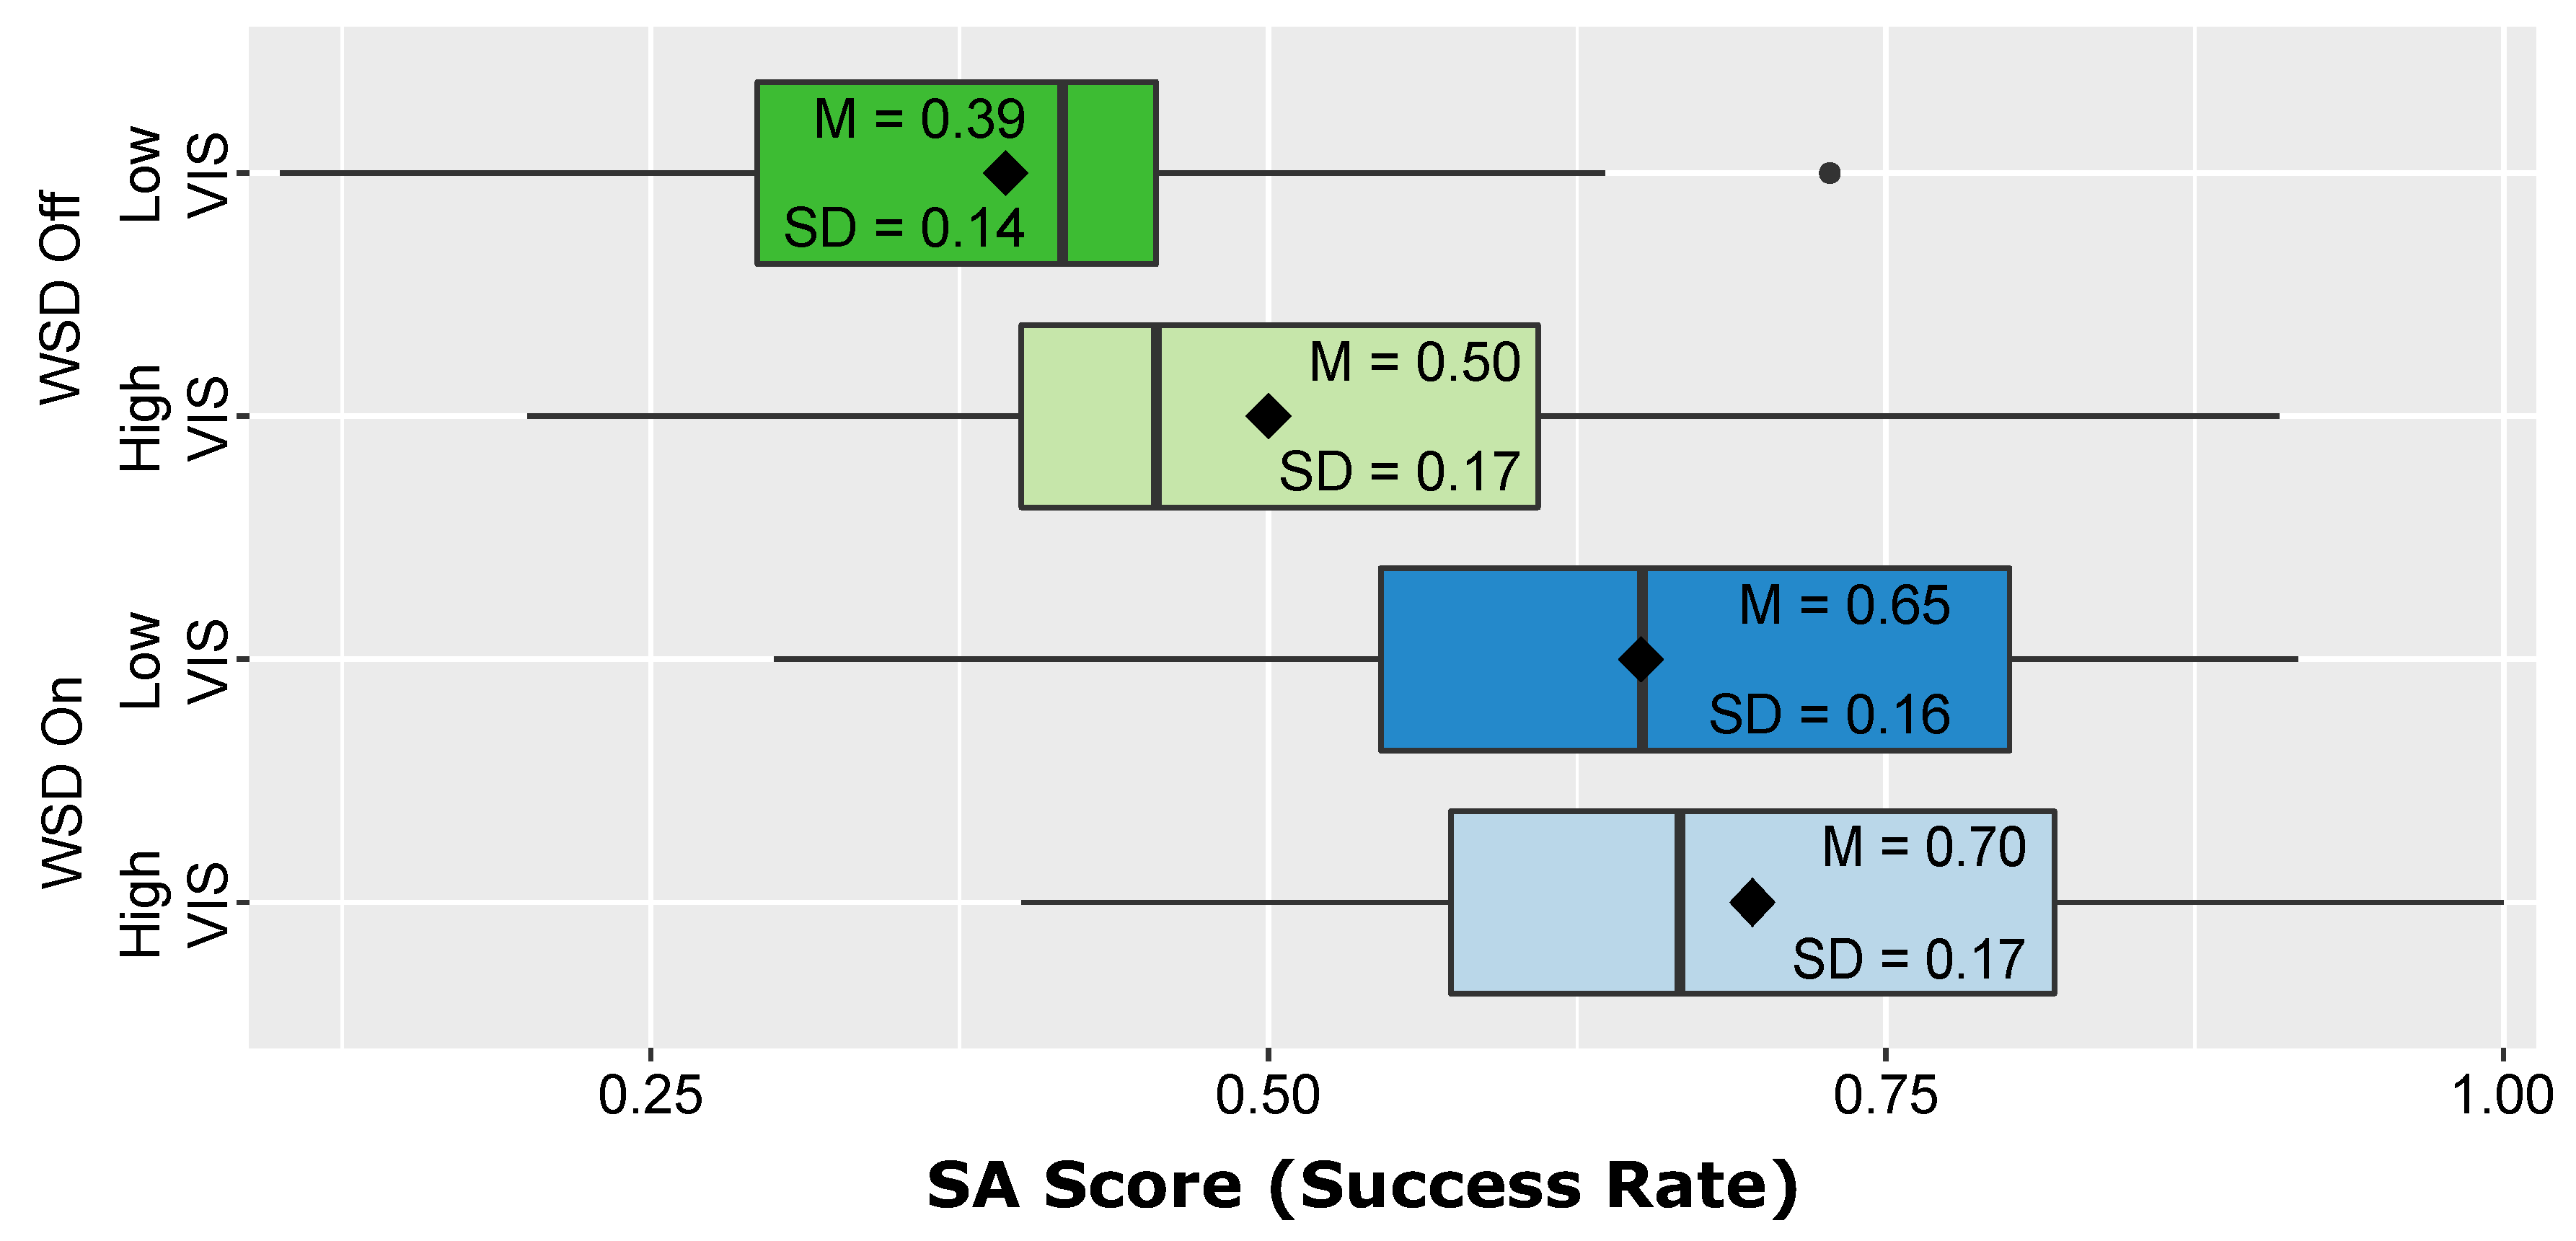
5.2. Driver SA Test Scores

Objective ratings for driver SA were extracted from the SA test items that were collected via the SAGAT-like online freeze probes described in the study section. For each of the four routes, we had to exclude two items on average as they proved to be too obvious or too difficult for all participants (i.e., over 90% of correct resp. wrong answers under every study condition). Questions that were answered partially correctly (e.g., user detected one of two threats) were scored with a factor of 0.5 . For each route, a total score was calculated by the participant’s answers. Due to the slight imbalance of items between routes, the total achievable score differed slightly (10–12). We thus based our comparison on the success rates (ratio of achieved points to total points). For questions that were asking to detect imminent threats, we only added true positives to the score, whereas false positives did not affect the score. The reason was that the understanding of a “threat” turned out to be too subjective and some participants had the tendency to generally regard more objects as threats. While the set of items for each route was targeting all three levels of SA, there were too few items per single category to do reasonable comparisons on the individual levels. We therefore only evaluated the total SA score.
Figure 8 shows the overall SA score results under the different visibility conditions and with/without the WSD interface. At first glance, the distributions seem to indicate possible differences between the WSD conditions (On vs. Off) both under high and low visibility. Comparing the two visibility conditions (High vs. Low), there seems to be almost no difference in SA score when the WSD was enabled, whereas indications are not very clear for the WSD Off data. To test our hypotheses, we applied a Wilcoxon–Pratt signed rank test to these comparisons. We decided to use a non-parametric test since the SA score is a success rate calculated from a very limited amount of reachable score points (10–12, depending on route), which we consider not ideal to fulfill the requirement of continuous data. The results are reported in Table 3. We found significant differences between drives with the WSD interface and no-WSD drives under high visibility with a medium effect size and under low visibility with a large effect size. We thus accept alternative hypothesis H1. Additionally, there was a significant difference between high and low visibility conditions when not using the WSD interface (small effect size). On the other hand, there was no significant difference between both visibility levels under enabled WSD. To examine the implications of this for our second hypothesis, we then analyzed the SA score differences themselves (i.e., how much every participant’s score deteriorated between high and low visibility). The amount of deterioration without WSD UI ( M = 0.10 , S D = 0.22 ) tested against the amount of deterioration with enabled WSD ( M = 0.05 , S D = 0.2 ) did not yield a significant difference ( p = 0.416 , Z = 0.81 , g * = 0.18 ). We thus fail to reject the null hypothesis that there is no difference in SA deterioration (from good to bad visibility) between the WSD conditions and cannot accept H2.

5.3. Driver SA Self-Ratings

Considering the technology acceptance factors discussed in the background section, subjective feeling of SA might be as important as objectively measurable SA scores. We thus evaluated self-ratings for driver SA under the different main study conditions. Participants’ self-assessments were given in the inter-test questionnaires after each of the four study drives. Three items were each targeting one of the three levels of the Endsley SA model [9]:
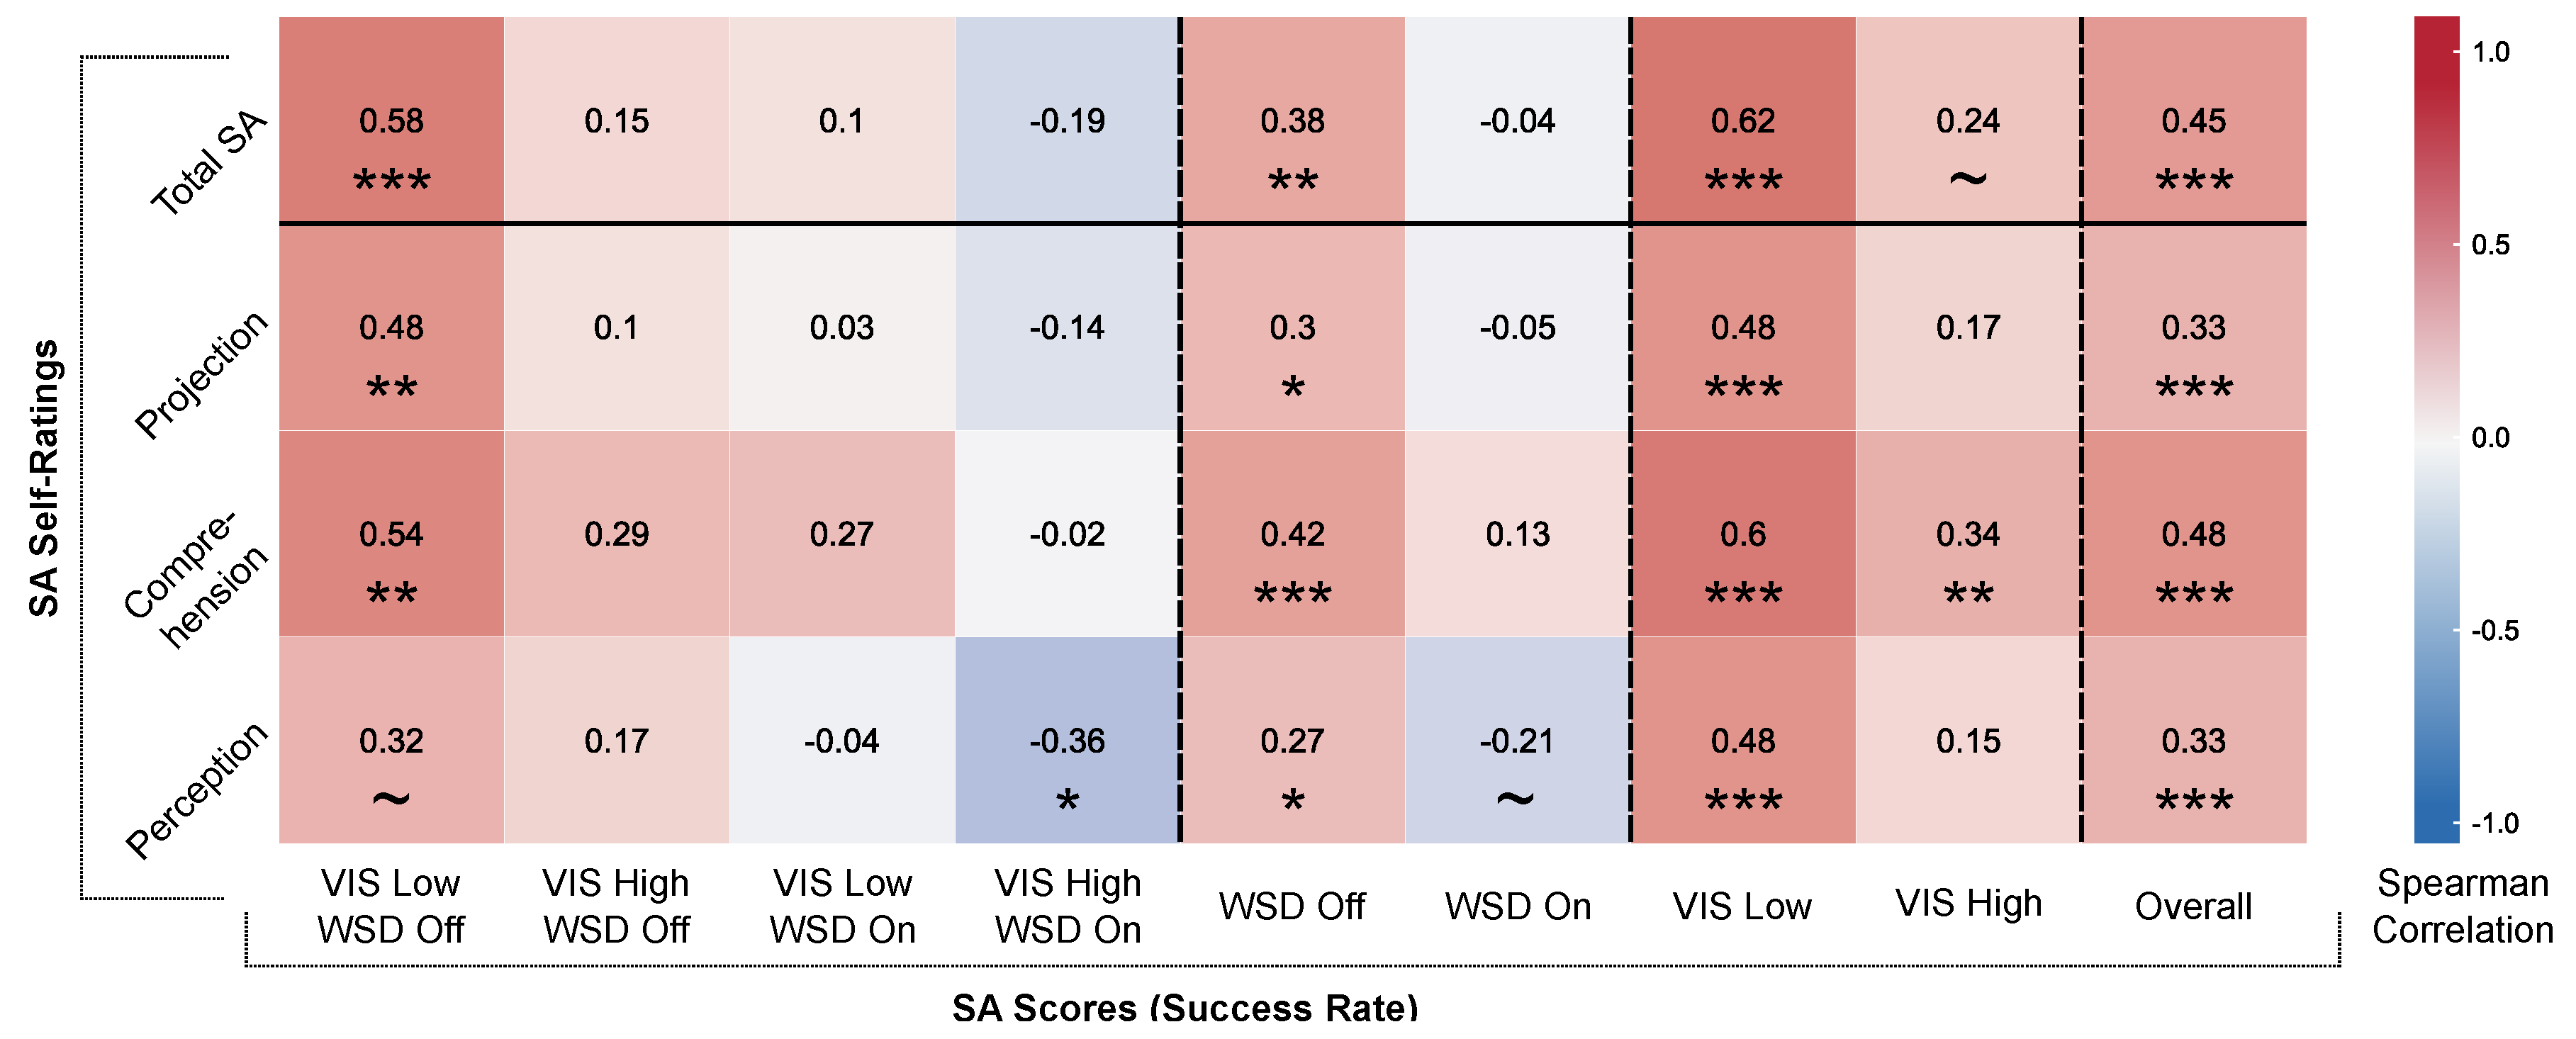
  • Perception: I felt always able to perceive/detect relevant elements and events in the environment.
  • Comprehension: I could always comprehend how my vehicle acted and reacted in traffic situations.
  • Projection: I could always predict how my vehicle was going to behave in traffic situations.
Table 4 shows the summarized data of the self-estimated SA level ratings under the conditions of our two independent variables, including an aggregated total SA score resulting from summarizing the three levels. As can be seen from the upper table section, Wilcoxon–Pratt signed-rank tests showed significant differences for all SA levels (plus total SA) and under both visibility conditions between drives with disabled and enabled WSD interface. Under low visibility, the difference showed a large effect size for all three levels and a very large [53] effect for the accumulated total SA. Under high visibility, the effect was medium-sized for perception and total SA and small-sized (near-medium) for comprehension and projection. The self-ratings thus give us further confirmation to accept alternative hypothesis H1. The lower table section shows that there are significant differences between low and high visibility for all SA levels (plus total SA) when not using the self-driving WSD interface with a small effect for comprehension and medium effects for the other SA levels and total SA. Perception was the only SA level that produced a significant difference in self-ratings under enabled WSD, although with a small-sized effect. Analogous to the objective SA evaluation, we then compared the deterioration from good to bad visibility between WSD Off ( M = 2.41 , S D = 3.79 ) and WSD on ( M = 0.38 , S D = 2.83 ) with self-estimated total SA. Here, we found a significant difference ( p = 0.036 , Z = 2.09 , g * = 0.39 ) with small effect size. While we cannot accept hypothesis H2 on the basis of the objective SA scores, we can accept it under the restriction that there is only a difference between the WSD conditions in the perceived SA deterioration from good to bad visibility.

5.4. Correlation between Scores and Self-Ratings

Besides evaluating both the SA test results from our SAGAT-like freeze probes and the subjective results from the SA self-assessments, we also analyzed the correlation between these two types of SA data. Figure 9 shows a correlation matrix between subjective and objective SA results. The self-ratings (vertical axis) are given separately by the three Endsley SA stages and with the accumulated total SA self-rating. The SA test scores (horizontal axis) are given in multiple representations: separately by main study conditions (columns 1–4), aggregated by WSD condition (5–6), aggregated by VIS condition (7–8) and with a fully aggregated overall score (9). Looking primarily at the correlation results for the total SA self-rating (top row), it can be seen that there are only significant correlations with the SA scores for the aggregated WSD Off (0.38: weak) and VIS Low (0.62: strong) conditions, their combination (0.58: moderate) and the overall SA score (0.45: moderate).
Looking at the separate self-ratings by SA stages, there are a few salient deviations from that result. Self-ratings for comprehension yielded higher correlations with SA scores than the other two stages. In particular, there is a significant (although weak) correlation under VIS High (0.34) for comprehension, but none for the other stages. Additionally, comprehension ratings have a highly significant moderate correlation under WSD Off (0.42), whereas perception (0.27) and projection (0.3) ratings have a significant but weak correlation. Furthermore, there was a significant negative relationship (weak correlation) between perception self-ratings and SA scores under the VIS High & WSD On condition. Lastly, when focusing on the correlations with the overall SA score, we see that there are highly significant correlations for all SA stages. In line with our findings above, comprehension ratings have a stronger correlation (0.48: moderate) than the other two stages’ ratings (0.33: weak).

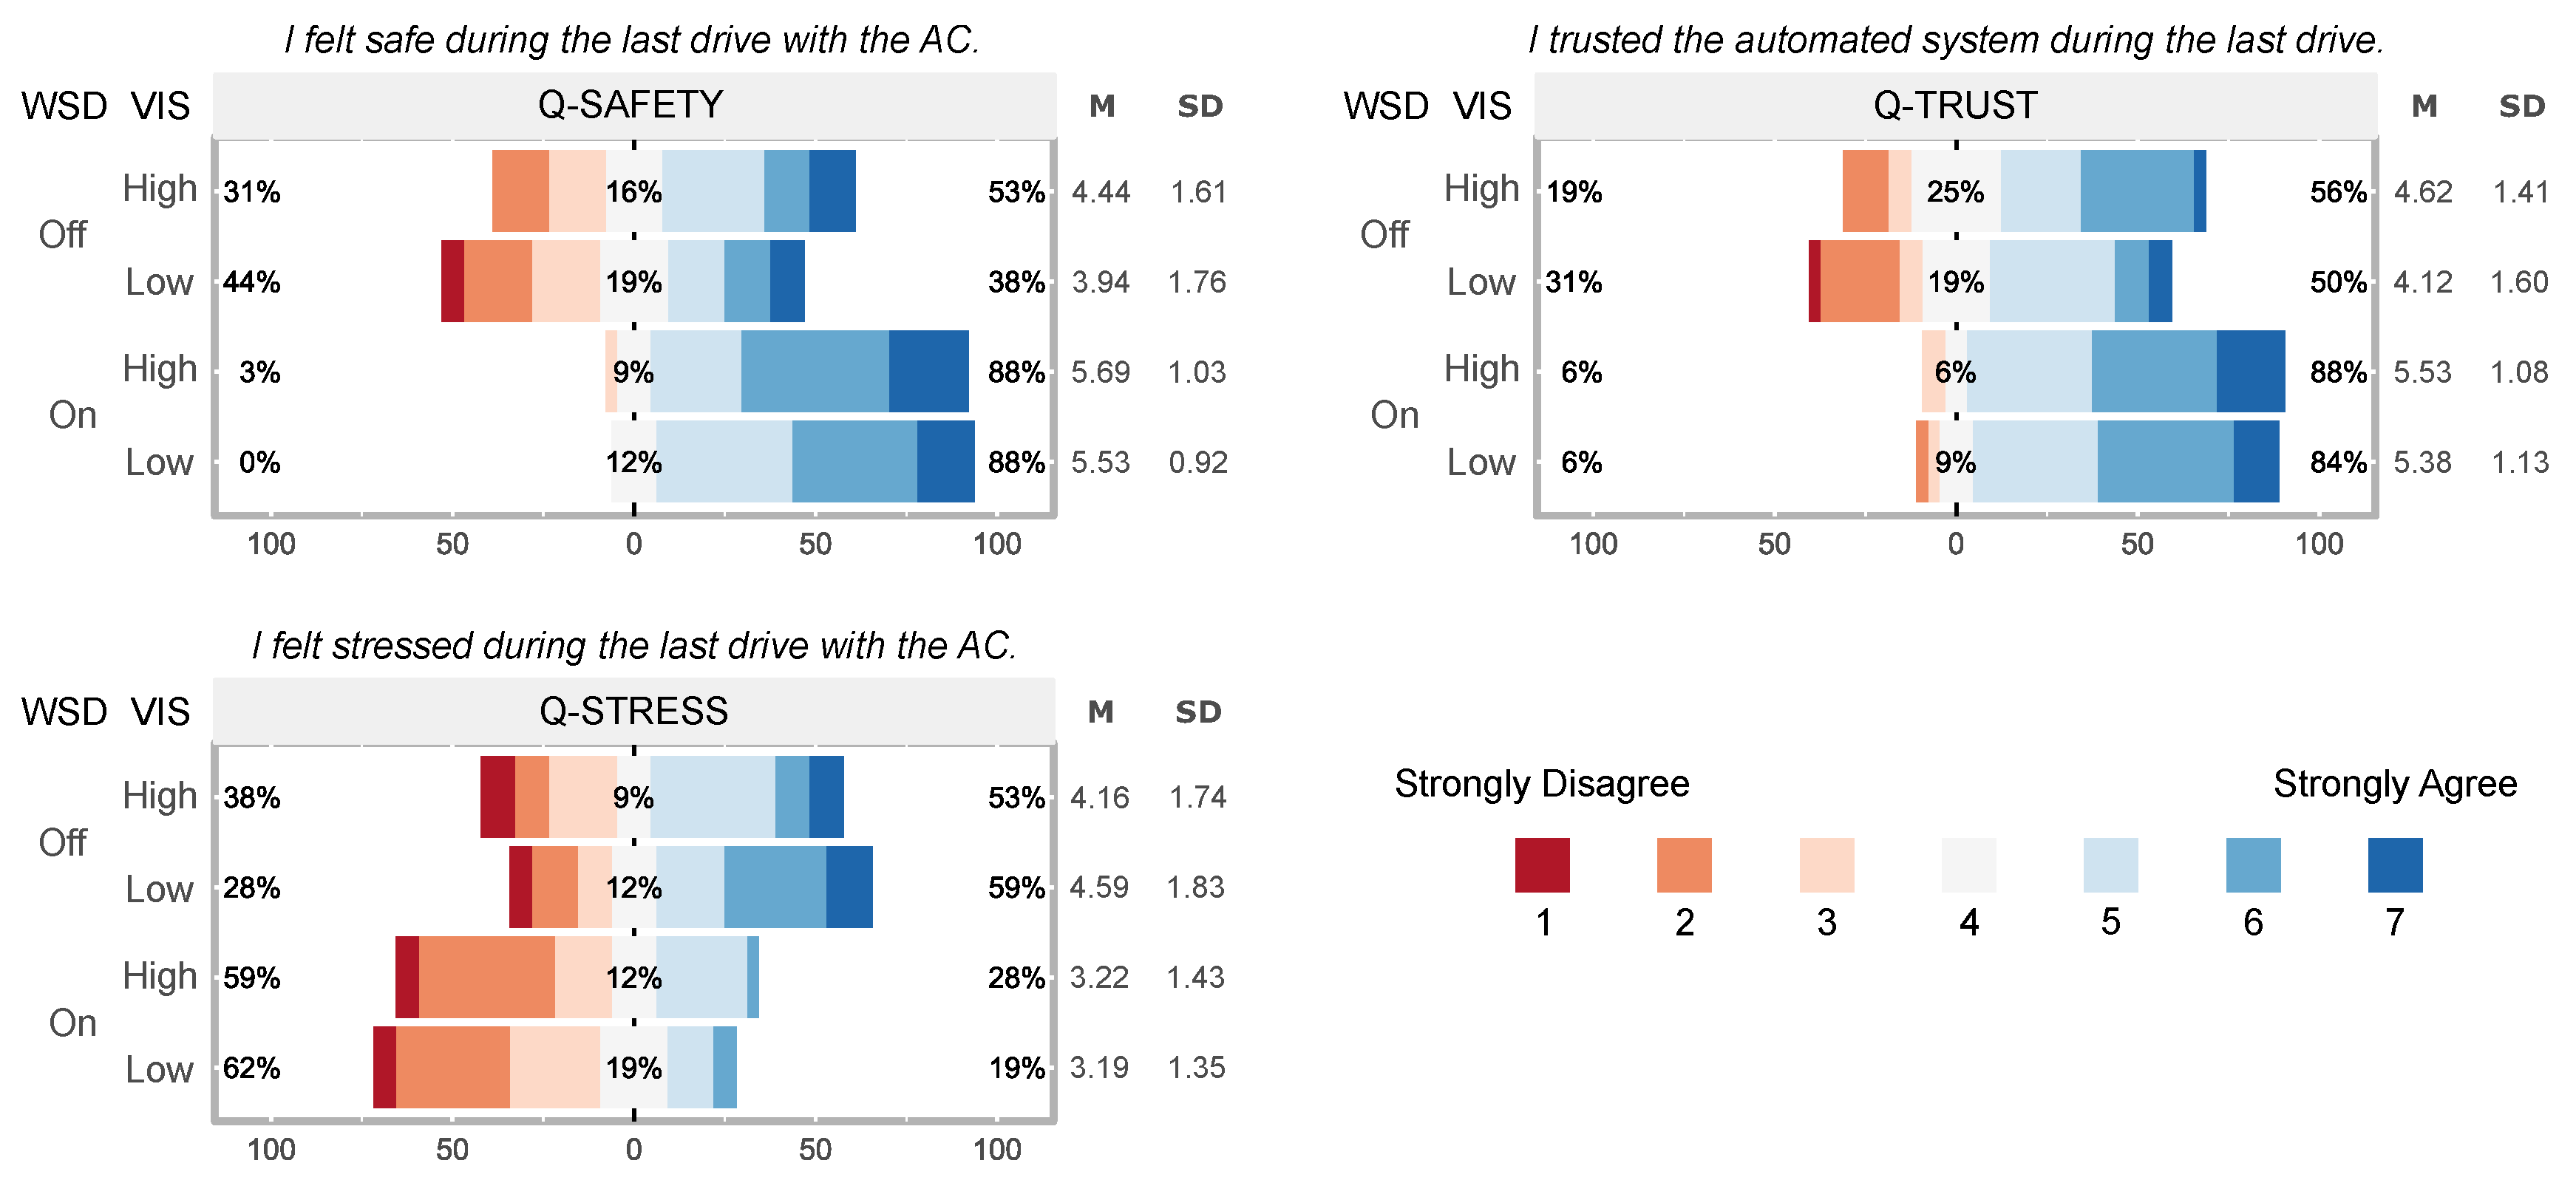
5.5. User Experience Ratings

While the main focus of the study was clearly on driver SA, we also wanted to include some factors influencing technology acceptance or trust. We thus collected additional data in the inter-tests including self-ratings for perceived feelings of safety, stress and trust in the user’s AC. To avoid focusing too much on the properties in the lab environment, participants were advised to picture themselves experiencing the same automated drives and urban traffic situations in a real-world scenario before answering. Figure 10 shows the results for these items. We applied a Wilcoxon–Pratt signed-rank test which yielded significant differences between non-WSD and enabled WSD UI regarding:
  • feeling of safety: under high ( p < 0.001 , Z = 3.75 , g * = 0.73 , ES: medium)
    and under low ( p < 0.001 , Z = 3.84 , g * = 0.82 , ES: large) visibility,
  • feeling of stress: under high ( p = 0.009 , Z = 2.62 , g * = 0.51 , ES: medium)
    and under low ( p = 0.001 , Z = 3.21 , g * = 0.64 , ES: medium) visibility,
  • trust in the car: under high ( p = 0.001 , Z = 3.33 , g * = 0.66 , ES: medium)
    and under low ( p < 0.001 , Z = 4.22 , g * = 0.95 , ES: large) visibility.
The post-test questionnaire served to evaluate further aspects of UX when using the explanatory WSD UI in an AC. Figure 11 shows items of this category. In the first three questions, a final post-trial assessment of the WSD UI was given regarding how much it helped in improving the perception, comprehension and projection. Almost all participants responded positively in this regard (B1–B3). Participants had a very divided opinion about whether the WSD UI actually distracts them from observing the environment by themselves (B4). 22% thought that the elements of the WSD were to some extent impairing their view (B5). 81% of participants stated that they would prefer to drive in an automated car with the WSD interface over conventional interfaces only (B6). An improvement of perceived safety with the WSD UI was believed by a large majority (91%, B7). Three quarters of participants stated it was a comfortable experience driving autonomously with the WSD UI (B8).

6. Discussion

Regarding our main hypotheses, we were able to show a significantly greater SA score (both objective and self-assessed) when using our proposed WSD interface as opposed to having only the basic elements (speed and navigation info). While we anticipated this especially in the low visibility conditions (fog), it was not equally clear that the interface would have enough impact in clear weather. While we can only make safe assessments about the performance in our custom-made driving situations, we hope this is a promising indicator for the usefulness of explanatory UIs in AD in general. Being out-of-the-loop is generally a disadvantage for awareness in automated systems [9] and urban scenarios are prone to provoke data overload and attentional tunneling, all of which negatively impact SA. We tried to recreate these same problems by giving our scenarios enough non-threat objects and potential distractions. We believe that the results indicate that an interface like our WSD UI and in particular the world-registered AR overlays can help in reducing these factors.
We anticipated that, with the WSD UI, the information conveyed to the driver might be enough to retain a driver SA under bad visibility conditions similar to that under clear weather. In line with this assumption, the null hypothesis of zero difference between weather conditions could not be rejected. However, comparing the objective SA differences, we were not able to confirm with significance that deterioration from good to bad visibility was lower with our WSD UI than without it. Despite that, the same test on SA self-ratings yielded a significantly less worsened SA from good to bad visibility. If we consider the technology acceptance factors discussed in the background section like perceived usefulness or perceived safety, we believe that a merely subjective effect of the UI can also be beneficial. This should especially apply when we assume availability of highly reliable AD and over-reliance is no critical issue. Results from the inter-test and post-test questionnaires also seem to support that there is a positive influence on perceived safety, stress, trust, comfort and helpfulness for awareness.
The correlation analysis yielded that the accumulated self-rated SA has a medium-sized correlation with the overall SA scores. This is roughly in line with our expectations since subjective ratings may be prone to under- or over-estimation and further influences like desirability bias or memory bias. Correlations also reveal that self-ratings were generally weakly correlated when WSD was On. This can be an indication for desirability bias or a general tendency of the interface to lead to overestimation. However, as stated above, a merely subjective effect can be a desirable outcome for AD use cases. We consider the self-ratings not as a highly valid replacement of objective scores but as an individual line of evaluation. The correlation analysis further implies that participants judged their comprehension of scenes more realistically than their perception and projection. In particular, perceived perception seems to deviate from SA scores when the WSD UI was used.
So far, we deliberately refrained from providing a multi-modal combination of feedback and did not yet augment the visuals of the explanatory UI with auditory or vibrotactile output. The reason is that we first wanted to establish whether the explanatory UI’s feedback on the visual channel provides the means to support driver SA at all. Since auditory and vibrotactile signals are more restricted concerning the communication of more complex information, we regarded visual as the primary modality for this work. As mentioned in the background, however, existing work especially from the domain of semi-automated driving hints at the importance of multi-modal feedback [35,36]. We believe that auditory and vibrotactile output may play a role in different forms when combined with an explanatory UI. For instance, if we regard the explanatory UI as a permanent feature which only appears situationally, then sound or seat vibrations might be a way to alert the driver that there is now explanatory information available for the current situation. Different priorities for sound, voice or vibrations could indicate for the driver how critical the AC judges the situation to be. Alternatively, these modalities may be used to guide driver attention to certain areas of the WSD UI (and the environment) and give an early hint as to the nature of the current situation, thus allowing a driver to grasp more quickly the potential hazards or challenges that the automated system detected.

6.1. Limitations

Our approach suffers from some limitations. Despite the immersiveness of a head-tracked stereoscopic virtual environment, realistic levels for feelings of anxiety and safety or danger can not be reached in the lab. Consequently, ratings for perceived safety, comfort or trust can be expected to produce generally higher results than a comparable field study. While the critical urban scenarios we focused on are extremely difficult to stage in a real-world setup, a high-fidelity dynamic driving simulator with motion systems may be the best compromise to achieve higher validity. Additionally, it may be possible to incorporate mood induction procedures (MIPs) [54] in a driving study. For instance, the examiner could try to induce anxiety or stress by letting participants write about experiences they vividly remember and are related to such emotions [55]. This may, however, prolong a study procedure considerably, so careful study design is required to prevent undesired influences, e.g., from fatigue.
Despite the lack of dynamic motion, multiple participants stated during the study that they actually felt like sitting on a moving chair, probably due to the virtual chassis lean movements they experienced in our simulation. The effect was possibly perceived stronger due to us operating in a head-tracked environment. This is also the cause for another potential limitation. Even though none of our participants made any extreme body movements exceeding regular upper body leaning, the individual perspectives due to off-center projection can facilitate or complicate perception. For instance, a participant leaning to the left might see an object that is otherwise blocked by the A-pillar. We accepted this drawback in favor of the immersion benefit of a head-tracked environment. We also tried to reduce the implications by our initial perspective calibration described in the study procedure. In future studies, it may be beneficial to additionally evaluate all head movements and try to determine if there is a correlation with performance in certain situations or tasks. It would then be possible to revise such parts and minimize the effect of varying driver head movements. Lastly, it can be expected that visibility of the WSD in reality would depend more strongly on changes of the background (environmental conditions) than in the simulator, introducing an additional influencing factor.
Another problem is the arrangement of the critical urban driving situations. To the best of our knowledge, there are no widely used standard situations that would cover our requirements, i.e., situations that are unforeseeable even for highly reliable automated systems, so that last-minute reactive maneuvers are inevitable. We therefore resorted to implementing custom situations. This brings several disadvantages: adjusting the properties of each scene in a way that allows for conducting well-balanced tasks (SA tests) is difficult. For valid results, the situations must not be too far-fetched or artificial. However, situations that are intuitively easy to comprehend would be irrelevant to our use case. Questions that are not humanly possible to answer correctly without the additional help of our WSD interface would bias the results and lead to unwarranted claims. We tried to keep the balance in each driving situation to get as close to the middle ground as possible. Internal tests during development with a small number of people led to repeated revisions. However, perfectly balanced driving scenarios will require a considerable effort of research in their own right.
Regarding our four distinct autonomously driven routes, we were not able to perfectly balance all types of driving situations equally between the routes. In the ideal case, every route would have the exact same number of each type of driving situation and with exactly the same setup. This would result in an equal amount of SA probe questions and better comparability of success rates. Additionally, situation-dependent evaluations would become possible. However, we partially focused on making each route somewhat unique in the sense that participants would not be able to anticipate certain events by factors like the visible street layout or surrounding pedestrian density. The downside was a small imbalance between the routes. By the amount of samples and counterbalancing, we hope to have made this factor negligible. A similar issue concerns the distribution of SA probe items among the three Endsley SA stages. For each route, the distribution was approximately 50% perception questions and 25% each for comprehension and projection, which means that perception had roughly double the influence on our objective SA scores. If an evaluation of SA test scores for individual stages is desired, there should be more items in general on each route and ideally a balanced distribution. It may be desirable in further studies to forgo the concept of a connected, seamless route in a larger urban environment in favor of isolated driving situation modules. This would facilitate the creation of comparable, homogenous sets of situations that can be combined and customized in different variants. This may be helpful when analyzing different types of situations (and UI elements) in isolation.

7. Conclusions and Future Work

The immediate goal of this work was the support of driver SA in ACs with an explanatory WSD UI with AR elements. We assumed availability of highly reliable ACs for urban environments and WSD technology for visual output. We targeted urban driving situations provoking instant and surprising reactive driving maneuvers from the AC. In a human-centered design approach, we determined general user requirements and evaluated feature suggestions. We then implemented a simulation of an explanatory WSD UI which combines screen-fixed information and world-registered AR elements. A user study was conducted on custom-made urban AD routes containing multiple types of critical situations. SA scores were measured with SAGAT-like online freeze probes and route-specific SA test questions. We additionally collected SA self-ratings and UX-related subjective feedback. We could show that our proposed WSD UI significantly improved driver SA scores and self-assessments. We could also show that SA self-ratings deteriorate significantly less from good to bad visibility with the WSD UI. The same did not apply to SA test scores. Additional questionnaire results showed improvements for perceived safety, stress and trust when driving with the WSD UI.
We conclude that an explanatory WSD UI with AR elements for ACs is a useful tool to increase driver SA in urban environments. It has potential to positively influence acceptance-related factors like perceived safety. AC reliability might be conveyed to end users in a hands-on experience instead of merely presenting test mile statistics. In our opinion, it may be feasible in the future to confront skeptics or doubtful adopters with real-world test drives, using explanatory UIs to reduce reservations. Such an interface could be offered as an unobtrusive optional feature with special focus on the first experiences of potential adopters. It might also serve as a tool for monitoring reliability in shared and public ACs. In terms of UI design, we suggest avoiding extreme visual clutter in accordance with users’ requirements and to put emphasis on temporally visible world-registered augmentations.
Our results encourage us to conduct further work in multiple directions. First, more research can be done on the UI itself. So far, we intentionally focused on the visual channel only to assess our UI elements’ impact in isolation. However, it is to be expected that a final integrated system would rely on multi-modal feedback and thus combine auditory signals and possibly vibrotactile output with an explanatory WSD UI. We discussed in the background section that these channels do not lend themselves to quickly convey complex information, but, together with explanatory visuals, they might provide e.g., reactivation of a distracted driver and immediate guidance to the relevant visual UI elements (and relevant parts of the environment). Additionally, the visual elements themselves need more refinement in future work. The various elements may be assessed repeatedly one-by-one on different types of traffic situations to determine when which elements are really needed and how they might be improved. Furthermore, our UI so far was concentrated on urban situations in a German traffic infrastructure. There may be situations in other contexts that are not yet taken into account. For instance, it is legal in most parts of the USA to turn right on red lights if no road sign to the contrary is given, whereas this is not allowed without special signs in EU countries. For foreign visitors who might be using public/shared ACs, such a driving behavior may seem reckless and uncomfortable.
While we believe that our results on improving driver SA give a good indication that using the system may also enable positive effects on acceptance of AD and trust in ACs, we did not yet examine these far-reaching effects at great depth in this work. Results from our few questionnaire items on perceived safety or trust seem promising, but should be considered with care. We believe that these aspects, being much more subjective than SA, are more influenced by external factors missing in our lab environment (e.g., sense of danger) and thus would be better suited to be evaluated in a future study on trust and acceptance in a high-fidelity environment. One approach may also be to apply strategies for inducing feelings like anxiety or stress [55] as mentioned in the discussion. An ideal yet expensive case may be a field study in a constrained, but realistic traffic environment. While we discussed trust and acceptance to a certain extent in the Introduction and Background, they were not at the core of the study and results presented in this work. A follow-up study on these aspects should thus provide a considerably deeper focus on established models of acceptance and trust.

Supplementary Materials

The following are available online at https://www.mdpi.com/2414-4088/2/4/71/s1, Video S1: Recording of the driving simulation showing the WSD UI in exemplary driving situations, Documents S2: Questionnaires used in the human-centered design phase and in the main user study (pre-test, inter-test, post-test and SA test questionnaires).

Author Contributions

Conceptualization, P.L. and G.R.; Methodology, P.L.; Software, P.L. and T.-Y.L.; Validation, P.L. and G.R.; Formal Analysis, P.L.; Investigation, P.L. and T.-Y.L.; Resources, P.L., T.-Y.L. and G.R.; Writing—Original Draft Preparation, P.L.; Writing—Review and Editing, P.L. and G.R.; Visualization, P.L. and T.-Y.L.; Supervision, G.R.

Funding

This research received no external funding.

Acknowledgments

The authors would like to thank all the participants of the human-centered design process and the main user study.

Conflicts of Interest

The authors declare no conflict of interest.

Abbreviations

The following abbreviations are used in this manuscript:
ACAutomated Cars (here: SAE level 4–5 [21])
ADAutonomous Driving
ARAugmented Reality
CAVECave Automatic Virtual Environment
CTAMCar Technology Acceptance Model
ERTRACEuropean Road Transport Research Advisory Council
ESEffect Size
FOVField of View
HUDHead-Up Display
MIPMood Induction Procedure
MRMixed Reality
NASA-TLXNASA Task Load Index
RSMERating Scale Mental Effort
SASituation Awareness
SAESociety of Automotive Engineers
TAMTechnology Acceptance Model
TORTake-Over Request
UEQUser Experience Questionnaire
UIUser Interface
UTAUTUnified Theory of Acceptance and Use of Technology
UXUser Experience
V2IVehicle to Infrastructure
VISVisibility (here: independent variable in study)
WSDWindshield Display (also used as independent variable in study)

References

  1. ERTRAC Working Group Connectivity and Automated Driving. Automated Driving Roadmap. 2017. Available online: http://www.ertrac.org/uploads/images/ERTRAC_Automated_Driving_2017.pdf (accessed on 5 May 2018).
  2. Kyriakidis, M.; de Winter, J.C.; Stanton, N.; Bellet, T.; van Arem, B.; Brookhuis, K.; Martens, M.H.; Bengler, K.; Andersson, J.; Merat, N.; et al. A human factors perspective on automated driving. Theor. Issues Ergon. Sci. 2017, 1–27. [Google Scholar] [CrossRef]
  3. Shladover, S.E. The Truth about “Self-Driving” Cars. Sci. Am. 2016, 314, 52–57. [Google Scholar] [CrossRef] [PubMed]
  4. Smith, A.; Anderson, M. Automation in Everyday Life. 2017. Available online: http://assets.pewresearch.org/wp-content/uploads/sites/14/2017/10/03151500/PI_2017.10.04_Automation_FINAL.pdf (accessed on 5 May 2018).
  5. UK Autodrive. Public Attitudes Survey, Executive Summary. 2017. Available online: http://www.ukautodrive.com/wp-content/uploads/2017/08/Executive-Summary-FINAL.pdf (accessed on 5 May 2018).
  6. DETECON International GmbH. Autonomes Fahren: Wenn das Lenkrad zur Sonderausstattung wird. 2016. Available online: http://www.detecon.com/sites/default/files/gladbach_-_studie_autonomes_fahren_final.pdf (accessed on 5 May 2018).
  7. Davis, F.D. Perceived Usefulness, Perceived Ease of Use, and User Acceptance of Information Technology. MIS Q. 1989, 13, 319–340. [Google Scholar] [CrossRef]
  8. Osswald, S.; Wurhofer, D.; Trösterer, S.; Beck, E.; Tscheligi, M. Predicting Information Technology Usage in the Car: Towards a Car Technology Acceptance Model. In Proceedings of the 4th International Conference on Automotive User Interfaces and Interactive Vehicular Applications, Portsmouth, NH, USA, 17–19 October 2012; ACM: New York, NY, USA, 2012; pp. 51–58. [Google Scholar]
  9. Endsley, M.R. Design and Evaluation for Situation Awareness Enhancement. Proc. Hum. Factors Soc. Annu. Meet. 1988, 32, 97–101. [Google Scholar] [CrossRef]
  10. Kyriakidis, M.; Happee, R.; de Winter, J. Public opinion on automated driving: Results of an international questionnaire among 5000 respondents. Transp. Res. Part F Traffic Psychol. Behav. 2015, 32, 127–140. [Google Scholar] [CrossRef]
  11. Bansal, P.; Kockelman, K.M.; Singh, A. Assessing public opinions of and interest in new vehicle technologies: An Austin perspective. Transp. Res. Part C Emerg. Technol. 2016, 67, 1–14. [Google Scholar] [CrossRef]
  12. Mayer, R.C.; Davis, J.H.; Schoorman, F.D. An Integrative Model of Organizational Trust. Acad. Manag. Rev. 1995, 20, 709–734. [Google Scholar] [CrossRef]
  13. Kaur, K.; Rampersad, G. Trust in driverless cars: Investigating key factors influencing the adoption of driverless cars. J. Eng. Technol. Manag. 2018, 48, 87–96. [Google Scholar] [CrossRef]
  14. Merritt, S.M.; Heimbaugh, H.; LaChapell, J.; Lee, D. I Trust It, but I Don’t Know Why: Effects of Implicit Attitudes Toward Automation on Trust in an Automated System. Hum. Factors 2013, 55, 520–534. [Google Scholar] [CrossRef] [PubMed]
  15. Parasuraman, R.; Riley, V. Humans and Automation: Use, Misuse, Disuse, Abuse. Hum. Factors 1997, 39, 230–253. [Google Scholar] [CrossRef]
  16. Lee, J.D.; See, K.A. Trust in Automation: Designing for Appropriate Reliance. Hum. Factors 2004, 46, 50–80. [Google Scholar] [CrossRef] [PubMed] [Green Version]
  17. Merritt, S.M.; Lee, D.; Unnerstall, J.L.; Huber, K. Are Well-Calibrated Users Effective Users? Associations Between Calibration of Trust and Performance on an Automation-Aided Task. Hum. Factors 2015, 57, 34–47. [Google Scholar] [CrossRef] [PubMed]
  18. Wintersberger, P.; von Sawitzky, T.; Frison, A.K.; Riener, A. Traffic Augmentation As a Means to Increase Trust in Automated Driving Systems. In Proceedings of the 12th Biannual Conference on Italian SIGCHI Chapter, Cagliari, Italy, 18–20 September 2017; ACM: New York, NY, USA, 2017; pp. 17:1–17:7. [Google Scholar]
  19. Lindemann, P.; Lee, T.Y.; Rigoll, G. An Explanatory Windshield Display Interface with Augmented Reality Elements for Urban Autonomous Driving. In Proceedings of the 2018 IEEE International Symposium on Mixed and Augmented Reality (ISMAR-Adjunct), Munich, Germany, 16–20 October 2018. [Google Scholar]
  20. Lindemann, P.; Lee, T.Y.; Rigoll, G. Supporting Driver Situation Awareness for Autonomous Urban Driving with an Augmented-Reality Windshield Display. In Proceedings of the 2018 IEEE International Symposium on Mixed and Augmented Reality (ISMAR-Adjunct), 2018 International Workshop on Comfort Intelligence with AR for Autonomous Vehicle 2018, Munich, Germany, 16–20 October 2018. [Google Scholar]
  21. SAE International. Taxonomy and Definitions for Terms Related to Driving Automation Systems for On-Road Motor Vehicles. Stand. J3016 2016. [Google Scholar] [CrossRef]
  22. Bazilinskyy, P.; Kyriakidis, M.; de Winter, J. An International Crowdsourcing Study into People’s Statements on Fully Automated Driving. Procedia Manuf. 2015, 3, 2534–2542. [Google Scholar] [CrossRef]
  23. Venkatesh, V.; Davis, F.D. A Theoretical Extension of the Technology Acceptance Model: Four Longitudinal Field Studies. Manag. Sci. 2000, 46, 186–204. [Google Scholar] [CrossRef]
  24. Endsley, M.R. Measurement of Situation Awareness in Dynamic Systems. Hum. Factors 1995, 37, 65–84. [Google Scholar] [CrossRef]
  25. Endsley, M.R. Theoretical underpinnings of situation awareness: a critical review. In Situation Awareness Analysis and Measurement; Endsley, M.R., Garland, D.J., Eds.; Lawrence Erlbaum Associates: Mahwah, NJ, USA, 2000. [Google Scholar]
  26. McKnight, D.; Chervany, N. Trust and distrust definitions: One bite at a time. In Lecture Notes in Computer Science; Springer: Berlin, Germany, 2001; Volume 2246, pp. 27–54. [Google Scholar]
  27. Lee, J.; Kim, N.; Imm, C.; Kim, B.; Yi, K.; Kim, J. A Question of Trust: An Ethnographic Study of Automated Cars on Real Roads. In Proceedings of the 8th International Conference on Automotive User Interfaces and Interactive Vehicular Applications, Ann Arbor, MI, USA, 24–26 October 2016; ACM: New York, NY, USA, 2016; pp. 201–208. [Google Scholar]
  28. Rogers, M.; Zhang, Y.; Kaber, D.; Liang, Y.; Gangakhedkar, S. The Effects of Visual and Cognitive Distraction on Driver Situation Awareness. In Engineering Psychology and Cognitive Ergonomics; Harris, D., Ed.; Springer: Berlin/Heidelberg, Germany, 2011; pp. 186–195. [Google Scholar]
  29. Tufano, D.R. Automotive HUDs: The Overlooked Safety Issues. Hum. Factors 1997, 39, 303–311. [Google Scholar] [CrossRef] [PubMed]
  30. De Winter, J.C.; Happee, R.; Martens, M.H.; Stanton, N.A. Effects of adaptive cruise control and highly automated driving on workload and situation awareness: A review of the empirical evidence. Transp. Res. Part F Traffic Psychol. Behav. 2014, 27, 196–217. [Google Scholar] [CrossRef] [Green Version]
  31. Paxion, J.; Galy, E.; Berthelon, C. Mental workload and driving. Front. Psychol. 2014, 5. [Google Scholar] [CrossRef] [PubMed] [Green Version]
  32. Zijlstra, F. Efficiency in Work Behavior. A Design Approach for Modern Tools. Ph.D. Thesis, Delft University of Technology, Delft, The Netherlands, 1993. [Google Scholar]
  33. Hart, S.G.; Staveland, L.E. Development of NASA-TLX (Task Load Index): Results of empirical and theoretical research. In Advances in Psychology; Elsevier: Amsterdam, The Netherlands, 1988; Volume 52, pp. 139–183. [Google Scholar]
  34. Pauzie, A. A method to assess the driver mental workload: The driving activity load index (DALI). IET Intell. Transp. Syst. 2008, 2, 315–322. [Google Scholar] [CrossRef]
  35. Bazilinskyy, P.; de Winter, J. Auditory interfaces in automated driving: an international survey. PeerJ Comput. Sci. 2015, 1, e13. [Google Scholar] [CrossRef]
  36. Bazilinskyy, P.; Petermeijer, S.; Petrovych, V.; Dodou, D.; de Winter, J. Take-over requests in highly automated driving: A crowdsourcing survey on auditory, vibrotactile, and visual displays. Transp. Res. Part F Traffic Psychol. Behav. 2018, 56, 82–98. [Google Scholar] [CrossRef]
  37. Filip, G.; Meng, X.; Burnett, G.; Harvey, C. Designing and calibrating trust through situational awareness of the vehicle (SAV) feedback. In Proceedings of the IET International Conference on Intelligent and Connected Vehicles (ICV 2016), Chongqing, China, 22–23 September 2016; Institution of Engineering and Technology: Stevenage, UK, 2016; pp. 1–6. [Google Scholar]
  38. Dzindolet, M.T.; Peterson, S.A.; Pomranky, R.A.; Pierce, L.G.; Beck, H.P. The role of trust in automation reliance. Int. J. Hum.-Comput. Stud. 2003, 58, 697–718. [Google Scholar] [CrossRef]
  39. Helldin, T.; Falkman, G.; Riveiro, M.; Davidsson, S. Presenting System Uncertainty in Automotive UIs for Supporting Trust Calibration in Autonomous Driving. In Proceedings of the 5th International Conference on Automotive User Interfaces and Interactive Vehicular Applications, Eindhoven, The Netherlands, 28–30 October 2013; ACM: New York, NY, USA, 2013; pp. 210–217. [Google Scholar]
  40. Johns, M.; Mok, B.; Sirkin, D.M.; Gowda, N.M.; Smith, C.A.; Talamonti, W.J., Jr.; Ju, W. Exploring Shared Control in Automated Driving. In Proceedings of the Eleventh ACM/IEEE International Conference on Human Robot Interaction, Christchurch, New Zealand, 7–10 March 2016; IEEE Press: Piscataway, NJ, USA, 2016; pp. 91–98. [Google Scholar]
  41. Wintersberger, P.; Riener, A. Trust in Technology as a Safety Aspect in Highly Automated Driving. i-com 2016, 15, 297–310. [Google Scholar] [CrossRef]
  42. Häuslschmid, R.; von Bülow, M.; Pfleging, B.; Butz, A. Supporting Trust in Autonomous Driving. In Proceedings of the 22nd International Conference on Intelligent User Interfaces, Limassol, Cyprus, 13–16 March 2017; ACM: New York, NY, USA, 2017; pp. 319–329. [Google Scholar]
  43. Lee, C.; Rincon, G.A.; Meyer, G.; Höllerer, T.; Bowman, D.A. The Effects of Visual Realism on Search Tasks in Mixed Reality Simulation. IEEE Trans. Vis. Comput. Gr. 2013, 19, 547–556. [Google Scholar] [CrossRef] [PubMed] [Green Version]
  44. Ren, D.; Goldschwendt, T.; Chang, Y.; Höllerer, T. Evaluating wide-field-of-view augmented reality with mixed reality simulation. In Proceedings of the 2016 IEEE Virtual Reality (VR), Greenville, SC, USA, 19–23 March 2016; pp. 93–102. [Google Scholar]
  45. Cruz-Neira, C.; Sandin, D.J.; DeFanti, T.A.; Kenyon, R.V.; Hart, J.C. The CAVE: Audio Visual Experience Automatic Virtual Environment. Commun. ACM 1992, 35, 64–72. [Google Scholar] [CrossRef]
  46. Gabbard, J.L.; Fitch, G.M.; Kim, H. Behind the Glass: Driver Challenges and Opportunities for AR Automotive Applications. Proc. IEEE 2014, 102, 124–136. [Google Scholar] [CrossRef]
  47. Häuslschmid, R.; Shou, Y.; O’Donovan, J.; Burnett, G.; Butz, A. First Steps Towards a View Management Concept for Large-sized Head-up Displays with Continuous Depth. In Proceedings of the 8th International Conference on Automotive User Interfaces and Interactive Vehicular Applications, Ann Arbor, MI, USA, 24–26 October 2016; ACM: New York, NY, USA, 2016; pp. 1–8. [Google Scholar]
  48. Diels, C.; Bos, J.E. User Interface Considerations to Prevent Self-driving Carsickness. In Proceedings of the 7th International Conference on Automotive User Interfaces and Interactive Vehicular Applications, Nottingham, UK, 1–3 September 2015; ACM: New York, NY, USA, 2015; pp. 14–19. [Google Scholar]
  49. Lee, J.; McGehee, D.; Brown, T.; Nakamoto, J. Driver sensitivity to brake pulse duration and magnitude. Ergonomics 2007, 50, 828–836. [Google Scholar] [CrossRef] [PubMed]
  50. Endsley, M.R. Direct measurement of situation awareness: Validity and use of SAGAT. Situat. Aware. Anal. Meas. 2000, 10, 147–173. [Google Scholar]
  51. Laugwitz, B.; Held, T.; Schrepp, M. Construction and Evaluation of a User Experience Questionnaire. In HCI and Usability for Education and Work; Holzinger, A., Ed.; Springer: Berlin/Heidelberg, Germany, 2008; pp. 63–76. [Google Scholar]
  52. Cohen, J. Statistical Power Analysis for the Behavioral Sciences, 2nd ed.; Lawrence Erlbaum Associates: Hillsdale, NJ, USA, 1988. [Google Scholar]
  53. Rosenthal, J.A. Qualitative Descriptors of Strength of Association and Effect Size. J. Soc. Serv. Res. 1996, 21, 37–59. [Google Scholar] [CrossRef]
  54. Kučera, D.; Haviger, J. Using Mood Induction Procedures in Psychological Research. Procedia-Soc. Behav. Sci. 2012, 69, 31–40. [Google Scholar] [CrossRef]
  55. Jeon, M.; Yim, J.B.; Walker, B.N. An Angry Driver is Not the Same As a Fearful Driver: Effects of Specific Negative Emotions on Risk Perception, Driving Performance, and Workload. In Proceedings of the 3rd International Conference on Automotive User Interfaces and Interactive Vehicular Applications, Salzburg, Austria, 30 November–2 December 2011; ACM: New York, NY, USA, 2011; pp. 137–142. [Google Scholar]
Figure 1. Selected questionnaire items in our human-centered design approach. After item Q3, participants were introduced to the concept of an explanatory windshield display user interface. The dashed line marks related items that allow comparison before and after users knew the UI concept.
Mti 02 00071 g001
Figure 2. All screen-fixed elements of the WSD interface. Dynamic elements are showing example content not necessarily applying to the depicted driving scene, best viewed in color.
Mti 02 00071 g002
Figure 3. Top-down view on exemplary driving situations from Table 2. (Left) a standing traffic hazard with one car pulling out late from a parking spot in front of the approaching AC, forcing it into full braking; (Right) an imminent head-on collision case with a child emerging from cover to cross the road. Decoys provide additional stimuli for a more realistic scene, best viewed in color.
Mti 02 00071 g003
Figure 4. The basic study setup of our driving simulation in the MR environment. The driver is seated in front of the (ineffective) steering wheel. Rendered in 2D for better visibility, best viewed in color.
Mti 02 00071 g004
Figure 5. Example question of one of the four SA test questionnaires. Participants had to answer during a SAGAT-like freeze probe.
Mti 02 00071 g005
Figure 6. The study process: each participant completed the cycle of automated driving scenario and inter-test four times in a balanced scheme, thus experiencing each of the routes and main conditions.
Mti 02 00071 g006
Figure 7. Results from the pre-test opinions given before the detailed briefing about the main study tasks. Participants were (textually and visually) introduced to the concept of explanatory UIs after A4. The dashed line marks items that allow pre-post comparison regarding introduction of the UI concept.
Mti 02 00071 g007
Figure 8. Results for the objective SA scores collected with the SAGAT-like freeze probes. Score numbers correspond to success rates regarding the SA test questions.
Mti 02 00071 g008
Figure 9. Matrix showing correlations between SA self-ratings and our SAGAT-like SA tests. Cells are labeled and color-coded with Spearman’s rank correlation coefficient values. Significant correlations are indicated as follows: ***: p < 0.001 , **: p < 0.01 , *: p < 0.05 , ~ : p < 0.1 .
Mti 02 00071 g009
Figure 10. Subjective results from the inter-test questionnaire regarding feelings of safety, stress and trust under the different main conditions. Participants were encouraged to envision a comparable real-world experience of their last simulated lab drive before answering.
Mti 02 00071 g010
Figure 11. Results for the post-test questionnaire items (statements shortened in figure), which targeted general opinions and user experience regarding the WSD UI after executing all of the study tasks.
Mti 02 00071 g011
Table 1. An overview of the implemented AR elements with example visualizations and descriptions for each type or use case. For better visibility, screen-fixed elements are hidden, best viewed in color.
Visual ExampleAR Element Description
Mti 02 00071 i001(a) Threat and warning markers
Colored object outlines warning drivers of potential hazards on or beside the road. Warnings for possible threats are given as yellow markers. Direct threats in the vehicle’s path are marked in red. In case of an imminent threat, other display elements are temporarily hidden to guide attention to the position of the hazard.
Mti 02 00071 i002(b) Oncoming traffic indicators
Superimposed on the road when the automated car approaches an intersection. Red arrows indicate from where oncoming traffic is detected. Their current distance is roughly indicated by the amount of arrowheads (up to 3). It allows drivers to notice approaching cars without leaning or head-turning.
Mti 02 00071 i003(c) Brake and stopping bar
A stopping bar is superimposed on the road whenever it comes to a situation in which the vehicle must brake hard due to unforeseen circumstances. It indicates where the car is expected to stop completely. It may reassure drivers by giving a point of reference for safe stopping but could also facilitate grasping the cause of the situation.
Mti 02 00071 i004(d) Moving object markers
Rotating cubic markers are overlayed above moving objects when relevant to driving decisions. For example, dangerous drivers ignoring the right of way may be highlighted by a red cube. Yellow is used for unusual behavior (e.g., in picture (c) above). A car classified as safe (e.g., yielding) might be marked in green to reassure the driver.
Mti 02 00071 i005(e) Road sign overlay
Yield, priority or stop road signs in front of intersections are superimposed on a large scale onto the road surface. For the yield/stop signs, the position of the overlay also marks where the car may need to stop. Priority signs might reassure drivers in cases where the automated car is not waiting to yield.
Table 2. The implemented urban driving situations. Some occur multiple times per route in different locations with certain variations as described in the table.
Basic Situation DescriptionProperties and Variations
Cross-traffic in intersectionsSpeed violations by other cars, obstructed view
Oncoming traffic (intersections & straights)Dangerous overtaking by other cars, obstructed view
Rule-ignoring trafficCars ignoring priority or traffic lights
Standing traffic hazardsCar pulling out of parking spot, obstructed pedestrians
Unplanned detoursConstruction site, accident site
Imminent head-on collisionCrossing children or dogs, thrown balls
Forced brakingUnusual preceding car behavior, obstacles
Debris on roadFallen road signs, balls, car parts
Table 3. Results of the Wilcoxon–Pratt signed-rank tests for SA scores, grouped by visibility conditions (VIS) and windshield display conditions (WSD). Effect size (ES) is given as Hedges’ g with bias correction (g * ) and interpreted with Cohen’s thresholds ( 0.2 , 0.5 , 0.8 ) [52].
VISHighLowHighLowHighLow
WSDOnOffOnOffOnOff
Mean0.700.500.650.390.700.650.500.39
SD0.170.170.160.140.170.160.170.14
p<0.001<0.0010.1720.022
Z3.534.551.372.29
g*0.741.130.210.43
ESMediumLargeSmallSmall
Table 4. Results of the Wilcoxon–Pratt signed-rank tests for SA self-ratings. Results are grouped by Endsley’s SA levels. Total SA score equals the sum of all three self-ratings with offset correction of 2 . The upper section compares trials with and without WSD interface; the lower section compares runs with bad and good visibility levels. Effect size (ES) is given as Hedges’ g with bias correction for small samples (g * ) and interpreted with thresholds ( 0.2 , 0.5 , 0.8 , 1.3 ) of Cohen and Rosenthal [52,53].
n = 32PerceptionComprehensionProjectionTotal SA (1–19)
VISHighLowHighLowHighLowHighLow
OnOffOnOffOnOffOnOffOnOffOnOffOnOffOnOff
Mean5.254.164.753.255.534.505.563.784.974.035.063.2513.7510.6913.388.28
SD1.161.391.081.441.161.591.241.521.231.511.131.462.993.872.803.64
p0.001<0.0010.007<0.0010.008<0.0010.002<0.001
Z3.234.732.694.402.634.223.124.89
g * 0.541.240.491.100.481.030.591.49
ESMediumLargeSmallLargeSmallLargeMediumVery Large
WSDOnOffOnOffOnOffOnOff
VISHighLowHighLowHighLowHighLowHighLowHighLowHighLowHighLow
p0.0220.0040.8450.0160.5210.0060.3900.002
Z2.292.860.202.410.642.740.863.04
g * 0.380.530.020.460.080.530.130.61
ESSmallMediumTrivialSmallTrivialMediumTrivialMedium

