Article

Takeover Requests in Highly Automated Truck Driving: How Do the Amount and Type of Additional Information Influence the Driver–Automation Interaction?

1
Chair of Automotive Technology, Technical University of Munich, Garching b., 85748 München, Gremany
2
MAN Truck & Bus AG, 80995 München, Germany
*
Author to whom correspondence should be addressed.
Multimodal Technol. Interact. 2018, 2(4), 68; https://doi.org/10.3390/mti2040068
Submission received: 1 August 2018 / Revised: 10 September 2018 / Accepted: 28 September 2018 / Published: 4 October 2018
(This article belongs to the Special Issue Automotive User Interfaces)

Abstract

:
Vehicle automation is linked to various benefits, such as increase in fuel and transport efficiency as well as increase in driving comfort. However, automation also comes with a variety of possible downsides, e.g., loss of situational awareness, loss of skills, and inappropriate trust levels regarding system functionality. Drawbacks differ at different automation levels. As highly automated driving (HAD, level 3) requires the driver to take over the driving task in critical situations within a limited period of time, the need for an appropriate human–machine interface (HMI) arises. To foster adequate and efficient human–machine interaction, this contribution presents a user-centered, iterative approach for HMI evaluation of highly automated truck driving. For HMI evaluation, a driving simulator study [n = 32] using a dynamic truck driving simulator was conducted to let users experience the HMI in a semi-real driving context. Participants rated three HMI concepts, differing in their informational content for HAD regarding acceptance, workload, user experience, and controllability. Results showed that all three HMI concepts achieved good to very good results in these measures. Overall, HMI concepts offering more information to the driver about the HAD system showed significantly higher ratings, depicting the positive effect of additional information on the driver–automation interaction.

1. Introduction

The introduction of vehicle automation is linked to various benefits, such as increase in overall safety, increase in fuel and transport efficiency, and reduction in road congestion [1]. Vehicle automation is not limited to the automotive domain in terms of passenger cars. Fleet managers might also profit, especially regarding higher fuel efficiency and therefore a reduction in overall emissions and incurred costs. In highly automated driving (HAD), the driver does not have to monitor the system anymore [2]. Instead, the system will prompt a takeover request if it is not able to handle the current traffic situation. The driver is able to engage in other non-driving-related tasks. In the domain of truck driving, truck drivers are supposed to engage in vocational tasks, such as completing delivery documents or engaging in vocational training [3,4,5].
Vehicle automation also comes with a variety of possible downsides. In HAD, the driver is excluded from the driver vehicle control loop. A phenomenon known as out-of-the-loop-unfamiliarity (OOFTLU) may occur, leaving: “[…] operators of automated systems handicapped in their ability to take over manual operations in the event of automation failure” [6]. A loss of skills and situational awareness, as well as a shift from active to passive information processing, are just a few factors negatively influencing the driver’s ability to take over the driving task again. Another psychological phenomenon closely related to HAD is inappropriate trust ratings about the system’s capabilities and limitations, with drivers either mistrusting or overtrusting the automated system [7,8]. Incomplete and incorrect mental models about the HAD system further negatively influence the driver–automation interaction [8,9,10].
Research has already engaged in the investigation of ideal takeover times [11,12,13,14,15,16]. Results show that takeover times depend on various aspects, such as the overall driver state (fatigue, drowsiness, vigilance [17,18,19]), the prevailing traffic situation (complexity, traffic density [16,20,21]) as well as engagement in, and characteristics of, non-driving-related tasks [13,22]. Interruptability of non-driving-related tasks is furthermore influenced by the amount of physical effort that is necessary to turn away from the secondary task [23]. Findings from literature regarding the execution of non-driving-related tasks vary. While some studies have reported negative effects of non-driving-related tasks before an occurring takeover situation [15,20,24], others have reported positive effects of non-driving-related tasks on the takeover performance [25]. Gold et al. [15] noted that most results from literature were derived from controlled experiments, only varying in a limited number of independent variables and excluding possible combinatory effects. Hence, Gold et al. [15] proposed a quantitative approach for modeling the takeover performance of level 3 automated vehicles. Results suggested that the prevailing time budget, traffic density, and learning effects affected takeover performance the most. Non-driving-related tasks and driver age seemed to have less influence on takeover performance [15].
So far, most research in the area of HAD has been conducted on passenger cars. The profession of truck driving cannot be easily compared with regular car driving [26]. Driving hours are longer, and the overall pressure on drivers is higher due to a general shortage of drivers and time constraints (e.g., just-in-time delivery) [27,28]. Therefore, conducted research might be taken as a first insight but cannot be transferred to the domain of truck driving.
Research on HAD in passenger cars has investigated the ideal human–machine interface (HMI) strategy. Providing feedback to the driver about the systems intentions and objectives is one of the most important factors when it comes to HMI design for automated driving [10,29]. Stockert et al. [30] and Beller et al. [31] took a closer look at how additional information in the form of system uncertainty information (ACC) influenced the driver–automation interaction. Study results showed that the inclusion of system uncertainty information positively enhanced the interaction in terms of trust and acceptance. Körber et al. [32] evaluated whether providing an additional explanation for a takeover request in automated driving influenced trust in automation and acceptance. Results revealed that an additional explanation for a takeover request did not influence trust or acceptance but increased the perceived understanding of the system. Creating a deeper understanding about the automated systems capabilities and limitations by adding more detailed information might enable a higher controllability on behalf of the driver when it comes to takeover situations. Controllability is defined as the “likelihood that the driver can cope with driving situations including ADAS (Advanced Driver Assistance Systems)-assisted driving, system limits, and system failures” ([33], p.5).
In a larger scope of expert workshops and user studies, Richardson et al. [3,26,34] developed an HMI strategy for highly automated truck driving following the user-centered design process DIN EN ISO 9241-210 [35]. The approach consisted of four phases and incorporated the understanding and specification of context of use, specification of user requirements, creation and development of design solutions, and product evaluation. All four steps followed an iterative approach, meaning that every phase was passed through several times until the ideal solution that fit user needs and requirements was found. All phases could be addressed individually with different qualitative and quantitative approaches (e.g., expert or user evaluation). Richardson et al. [3] collected specific context information for HMI design for HAD with an online questionnaire and a semi-structured interview with truck drivers and fleet managers [3]. Specific user requirements were gathered using focus groups and a driving simulator study with users [26]. Based on the context information and specific user requirements found, scribbles, paper prototypes, and video prototypes were built and iteratively evaluated with experts [3,34]. Richardson et al. [34] reported a multimodal HMI concept that incorporated several elements, such as a LED bar below the windshield, a head-up display (HUD), an instrument cluster (IC), augmented reality (AR) elements in the front screen, and a combined central information (CID) and entertainment display.
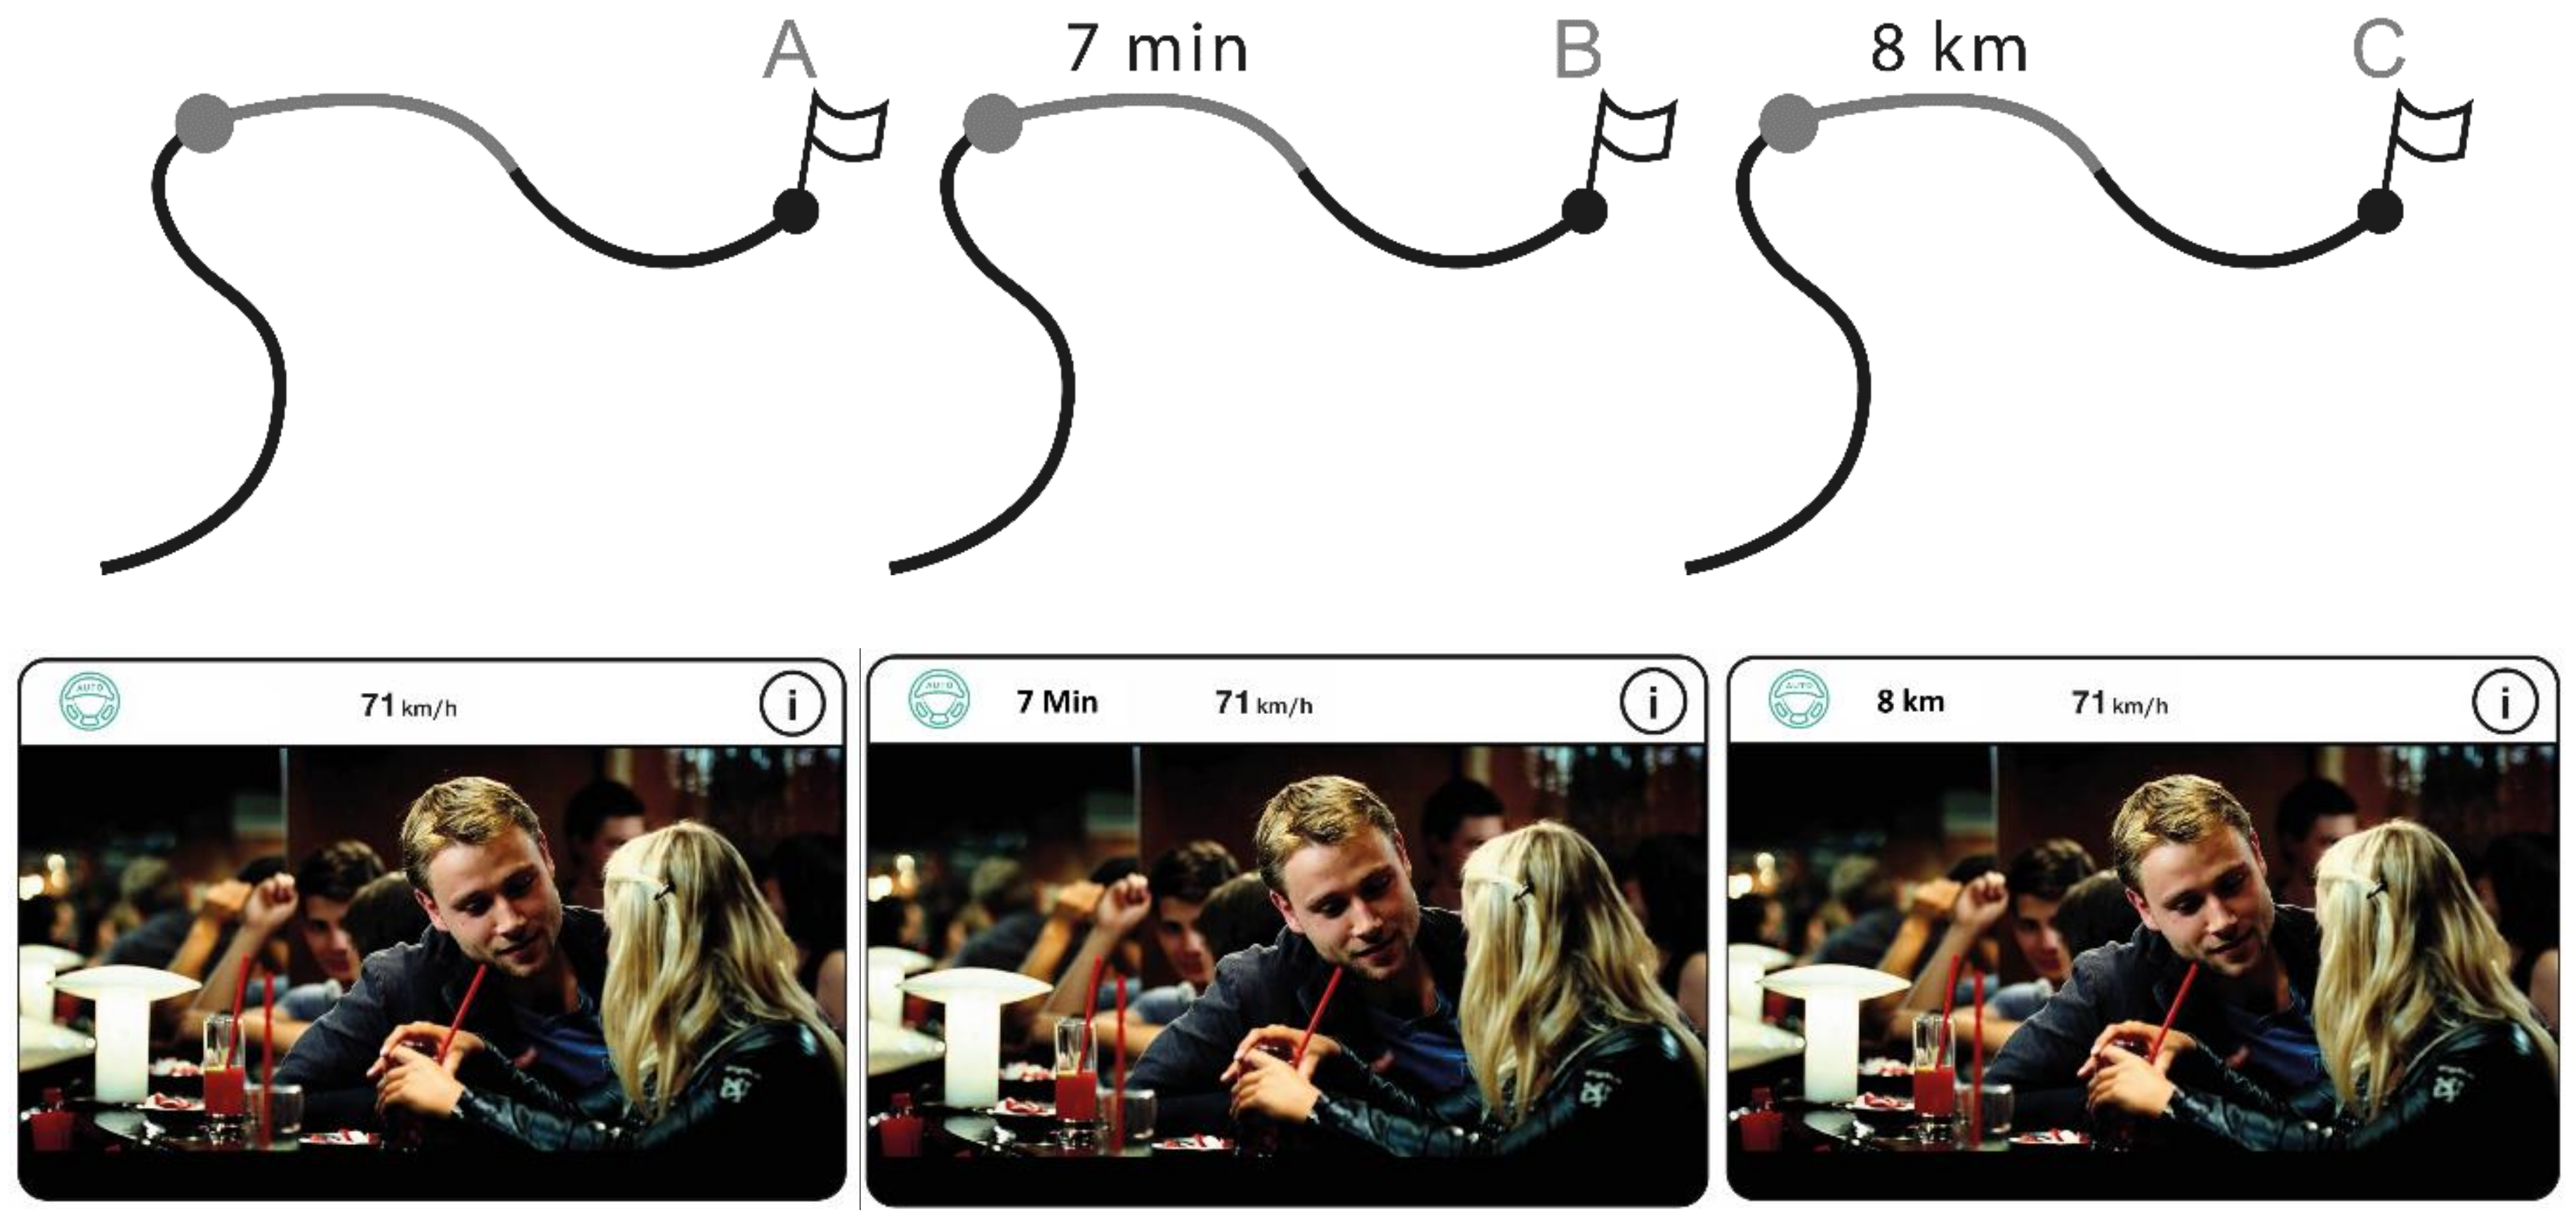
In the last expert evaluation conducted [34], the question of whether information about the remaining time until a takeover occurs should or should not be presented could not be answered. Furthermore, experts were not sure which presentational format (time- or distance-based) should be used to communicate the remaining time (e.g., “Please take over in 10 s” vs. “Please take over in 220 m”).

2. Research Questions

The aim of this contribution was the explorative evaluation of a suitable HMI for highly automated truck driving. In order to investigate the ideal HMI concept for highly automated truck driving, a driving simulator study was conducted. Three HMI concepts were exploratively investigated, varying in terms of the amount and the presentational format of information presented to the driver. The first research question related to the informational content of the HMI concept:
Q1: 
Do truck drivers prefer a reduced (no additional information) or detailed (including additional information) HMI takeover depiction for HAD?
To further investigate what kind of presentational format best suits the presentation of additional information for HAD, two different approaches (concept B: time-based, concept C: distance-based) were designed. Research question 2 addressed users’ HMI evaluation:
Q2: 
How do truck drivers evaluate the different HMI concepts (no information, time-based vs. distance-based) in terms of acceptance, workload, user experience, and controllability?

3. Method

For the early-stage evaluation of HMI concepts, driving simulator studies comprise several advantages. Firstly, different traffic situations can be realized and exactly reproduced between participants. Secondly, situations that only occur seldom in reality or pose a threat to participants can be modeled and tested without endangering the participants [36,37].

3.1. Sample

A total of 32 participants participated in the experiment: Two datasets had to be excluded from further analysis due to simulation errors; therefore, 30 participants (29 male, 1 female; truck drivers) at an average age of 47.67 years (SD = 9.37) formed the basis for further analysis. All participants had a valid truck driver’s license, with an average of 24.83 years of driving experience (SD = 8.76). Eleven participants reported of regularly driving 10,000–50,000 km per year; five participants reported driving more than 100,000 km per year, whilst seven reported driving less than 10,000 and another seven participants up to 100,000 km. Calculation of affinity for technology (1 = low; 5 = high) results in a mean value of 4.19 (subscales technology acceptance: mean: 4.09, locus of control: mean: 4.50, technical competence: mean: 3.98) indicated a sample with an overall high affinity for technology.

3.2. HMI Concept

The three HMI concepts tested differed regarding their informational content, varying in terms of depiction of time until a takeover occurs:
  • Concept A: No additional information (“Please take over”)
  • Concept B: Additional information, time-based (“Please take over in 10 s”)
  • Concept C: Additional information, distance-based (“Please take over in 220 m”)
The LED bar (1) was used to depict the prevailing system status of the HAD system. Therefore, the bar changed its color from turquoise (HAD system activated) to orange (prepare for takeover) to red (takeover). The HUD (2) contained relevant navigational information, such as current driving speed and speed limit. The IC (3) was divided into three parts and displayed the current mode of the automated system, a bird’s view of the current traffic situation, relevant navigational information, and planned system maneuvers. Additionally, the reason the automation stopped (e.g., construction site, end of motorway) was depicted to positively enhance participants’ system understanding [32]. AR (4) elements were used to highlight the surrounding relevant vehicles in takeover scenarios. The CID and entertainment display (5) was mounted on the right-hand side of the driver, enabling them to remove the CID from its position and engage in secondary tasks during phases of highly automated driving. To keep the driver informed about ongoing actions while looking away from the actual driving scene, the CID additionally displayed relevant information such as the current system status, current speed driven, and planned maneuvers. An additional info-button was implemented with which the driver was able to get additional information about the current traffic surrounding and navigational information. Furthermore, the HMI provided acoustic support using speech and earcons indicating HAD availability, HAD activation, HAD deactivation, and an upcoming takeover. The additional information for the takeover request was depicted on the IC in the navigation map and in the top bar of the CID (Figure 1).

3.3. Apparatus

A dynamic truck simulator located at the Institute of Automotive Technology of the Technical University of Munich was used in the present study (Figure 2). The driving scene was projected onto a screen covering a 210° viewing range. For the underlying experiment, a HAD control that was able to detect lead vehicles, take over slower preceding vehicles, and identify construction sites was implemented. In the truck driver cabin, a secondary display in the form of a tablet was installed. Participants were asked to read a journal article on the tablet if the HAD system is activated. Participants operated the tablet and the article with their fingers.

3.4. Roadway and Scenario Design

Each test drive consisted of a two-lane highway. According to the capabilities and limitations of a HAD system, six different situations were modeled (Figure 3), four of them being critical. Critical situations required a takeover on behalf of the driver (S3–S6). Additionally, two noncritical situations that could be handled by the HAD system itself (S1, S2) were realized. In each of the three test drives, participants encountered every situation once. To allow comparisons between the three consecutive test drives and to prevent sequence effects, the order of the situations was fully randomized between HMI concepts and test drives.
The HAD system was programmed to not be able to identify all situations correctly. Therefore, one sensor failure situation was implemented with a takeover being prompted although no obvious reason was present (e.g., warning when it was not necessary, Figure 3S5). The event in which a hazard was present on the road and the HAD system did not prompt a takeover request did not occur at any time. The takeover strategy (turquoise-orange-red, 60 s vs. turquoise-red, 10 s) varied between the situations. S3 (construction site) and S6 (motorway ending) depict situations that could be foreseen by the automated system due to navigational map information; therefore, a 60 s warning could be prompted. S4 (lane markings missing) and S5 (sensor failure) in turn represent unforeseeable events prompting a 10 s takeover request without an additional preparation phase. In total, participants had to take over four times per test drive.
The HAD system adapted the speed automatically to the prevailing speed signs with a maximum speed of 80 km per hour.

3.5. Experimental Design

For the underlying study, a within-subjects design was chosen. The three different HMI concepts (A, B, and C) constituted the independent variable. The dependent variable comprised four factors—acceptance, workload, user experience, and controllability. Acceptance was assessed using van der Laan’s [38] acceptance questionnaire. The scale assesses system acceptance on two dimensions: a usefulness and an affective satisfying scale. Participants had to rate nine word pairs on a 5-point Likert scale ranging from 2 to +2.
To assess driver workload, the Driving Activity Load Index (DALI) [39] questionnaire was chosen. The questionnaire assesses seven different demands associated with workload, such as visual, auditory, tactile, and temporal demand. Furthermore, efforts of attention, interference between the driving and secondary task, and situational stress are assessed. Participants were asked to rate the statements on a 6-point Likert scale ranging from “low” to “high”.
To gain further insights into the HMI concepts of user experience and general usability, the user experience questionnaire (UEQ) [40] was chosen. The UEQ consists of 26 word pairs rated on a 7-point Likert scale and is able to assess the overall attractiveness, novelty, stimulation, efficiency, reliability, and transparency.
Participants’ experienced controllability was measured using Neukum’s controllability scale [41]. Therefore, participants had to evaluate every occurring situation (takeover as well as manageable situations) in the simulated drive regarding controllability. Participants answered on a 10-point scale further divided into four subscales (0 = did not notice anything; 1–3 = harmless; 4–6 = unpleasant, 7–9 = dangerous; 10 = incontrollable).

3.6. Procedure

After arrival, participants were asked to fill in a consent form and a demographic questionnaire. In addition to gender, age, and annual mileage, participants’ affinity for technology [16] was assessed. In the next step, participants became acquainted with the simulator and a basic description of the HAD system. The description provided was based on the definition of HAD [2]. Every participant was informed about the possibility of automation fallibility. Participants were instructed to keep to the road traffic regulations. In a 5-min training phase, participants learned how to activate the automation (pushing two buttons simultaneously, located on the steering wheel), and how to deactivate it (pushing brake pedal or buttons on steering wheel). In addition, participants were acquainted with the assessment of controllability. After the training phase, the first test drive started. Participants drove manually onto the motorway and were told to activate the automation as soon as possible and to reactivate the automation if a takeover occurred. The test drive ended with participants exiting the motorway manually. After the first drive, participants filled in the questionnaires regarding workload, acceptance, and user experience. Controllability was assessed after each occurring situation during the simulated drive (“How did you experience the driving situation just now?”). At the end of the first test drive, the next test drive started. This procedure was repeated for all three test drives with the different HMI concepts. In the end, participants were able to express their opinion qualitatively in a semi-structured interview (e.g., potential for improvement, general annotations).

4. Results

In the following section, the results for the standardized questionnaires (acceptance, DALI, controllability, and UEQ) are reported. Descriptive and inferential statistics were calculated for each of the factors and items of the questionnaires. Due to the Likert scales of the standardized questionnaires, data acquired was treated as ordinal scales [42,43,44]. Therefore, nonparametric tests (Friedman, Connover’s post-hoc) were chosen for data analysis. All results were reported on an alpha level of 5% (α = 0.05). To get a deeper insight into participants’ takeover reaction and quality, videos and experimental protocols were recorded.

4.1. Acceptance

Participants’ acceptance for all three concepts was assessed using van der Laan’s acceptance scale [38]. The scale further divides acceptance into subscales of usefulness and satisfaction. Participants used a 5-point Likert scale (ranging from −2 to +2) to express their opinion on the three different HMI concepts. Calculation of Cronbach’s alpha for scale reliability statistics showed good to excellent values, with all scoring above >0.8 (Table 1).
Regarding usefulness, participants rated concept B highest with a mean of 1.45 (SD = 0.44), while concept C scored a mean of 1.3 (SD = 0.53). Concept A was rated lowest with a mean of 1.12 (SD = 0.60). In terms of satisfaction, concept B again scored the highest with a mean of 1.48 (SD = 0.51), followed by concept C (mean: 1.41, SD = 0.66) and concept A (mean: 1.13, SD = 0.82) (Table 2). Overall, all concepts evoked good ratings.
Inferential statistics (Friedman test) showed a significant effect in usefulness between the three concepts (p < 0.001). Connover’s post-hoc test (Table 3) revealed a statistically significant effect between concept A and B (p < 0.001) as well as between concept B and C (p = 0.008). Pairwise comparison for concept A and C also revealed statistical significance (p = 0.030).
Statistical analysis for the satisfying scale showed a significant effect (Friedman test, p = 0.018), with a significant effect between concept A and B (post-hoc test, p = 0.007) and for concepts A and C (p = 0.025). Pairwise comparisons for concepts B and C (p = 0.611) did not reveal any statistical significance.
To get a deeper understanding of the relevance of the found results, Spearman’s correlation coefficient (rSP) was calculated pairwise for the three different concept alternatives (Table 4). Effect sizes for usefulness showed strong relevant effects for all three comparisons. Pairwise comparison of the concepts for the satisfying scale ranged between 0.579 (concept A and B) and 0.800 (concept A and C).

4.2. DALI

Participant workload was subjectively assessed using the DALI and recorded after each test drive. Workload was rated on a 6-point Likert scale ranging from 0 to 5 (low to high). In total, seven subscales were used—visual, auditory, tactile, and temporal demand as well as effort of attention, interference between the driving and secondary task, and situational stress. Table 5 shows the mean values and SD for all subscales and HMI concepts.
The calculation of inferential statistics (Friedman test) revealed a significant effect for subscale situational stress (p = 0.025) and interference (p = 0.016). Connover’s post-hoc test for pairwise comparison (Table 6) showed that the main effect for situational stress was located between concepts A and C (p = 0.008) and concept B and C (p = 0.042). Post-hoc comparison of concepts A and B (p = 0.512) did not reach statistical significance. Connover’s post-hoc correlation for subscale interference showed a significant difference between concepts A and B (p = 0.021) and concept B and C (p = 0.006).

4.3. Controllability

Controllability ratings were assessed using a 10-point Likert scale (0 = did not notice anything to 10 = uncontrollable). Participants were asked after each of the six scenarios about how they experienced the situation in terms of controllability. This procedure was repeated for all three test drives and all six occurring scenarios. Descriptive statistics (Table 7) showed that concept C scored the lowest on controllability with a mean of 1.96 (SD = 1.05). This was followed by Concept B with a mean of 2.02 (SD = 1.12) and concept A (mean 2.48, SD = 1.44).
Inferential statistics (Friedman test) revealed a statistically significant effect (p = 0.034) between the concept alternatives. Connover’s post-hoc test further showed a pairwise statistical significance between concept A and B (p = 0.022) and concept A and C (p = 0.022) (Table 8). The calculation of Spearman’s r showed a medium effect for concepts A and B (r = 0.496) and notable effects for concepts A/C (r = 0.715) and B/C (r = 0.669).

4.4. UEQ

Figure 4 shows the descriptive analysis (mean and SD) of all six UEQ subscales for all three concept alternatives. Overall mean values varied between 1.28 (Concept A—dependability) and 2.42 (Concept B—perspicuity), indicating good results. The concepts scored the lowest on subscale stimulation (concept A: mean 1.3; concept B: mean 1.58; concept C: mean 1.6) and efficiency (concept A: mean 1.47; concept B: mean 1.68; concept C: mean 1.79). All three HMI concepts scored the highest on the dimension perspicuity.
The calculation of inferential statistics (Friedman test) revealed significant effects on two subscales, namely efficiency (p = 0.015) and dependability (p < 0.001). Connover’s post-hoc test showed significant effects between concepts A and C regarding efficiency (p = 0.003). A significant effect between concepts A and B (p < 0.001) as well as concepts A and C (p < 0.001) could be found for the subscale dependability (Table 9).

4.5. Takeover Quality

Video recordings and experimental protocols were used to document any occurring problem, error, or accident during the test drives and takeover phases for every participant.
Data showed that in 5.56% (20 of 360) of all driving situations, driving errors in terms of lateral lane deviation occurred. More than half of the errors (11) emerged in the construction site situation (S3), with seven participants crossing the yellow lane markings and four participants colliding with the guardrail. Furthermore, the data showed that driving errors and accidents occurred independently of the HMI concept.

5. Discussion

In this study, the effect of presenting additional information to drivers during highly automated driving was investigated. Furthermore, the influence of the presentational format of information presented (time-based vs. distance-based) was evaluated.
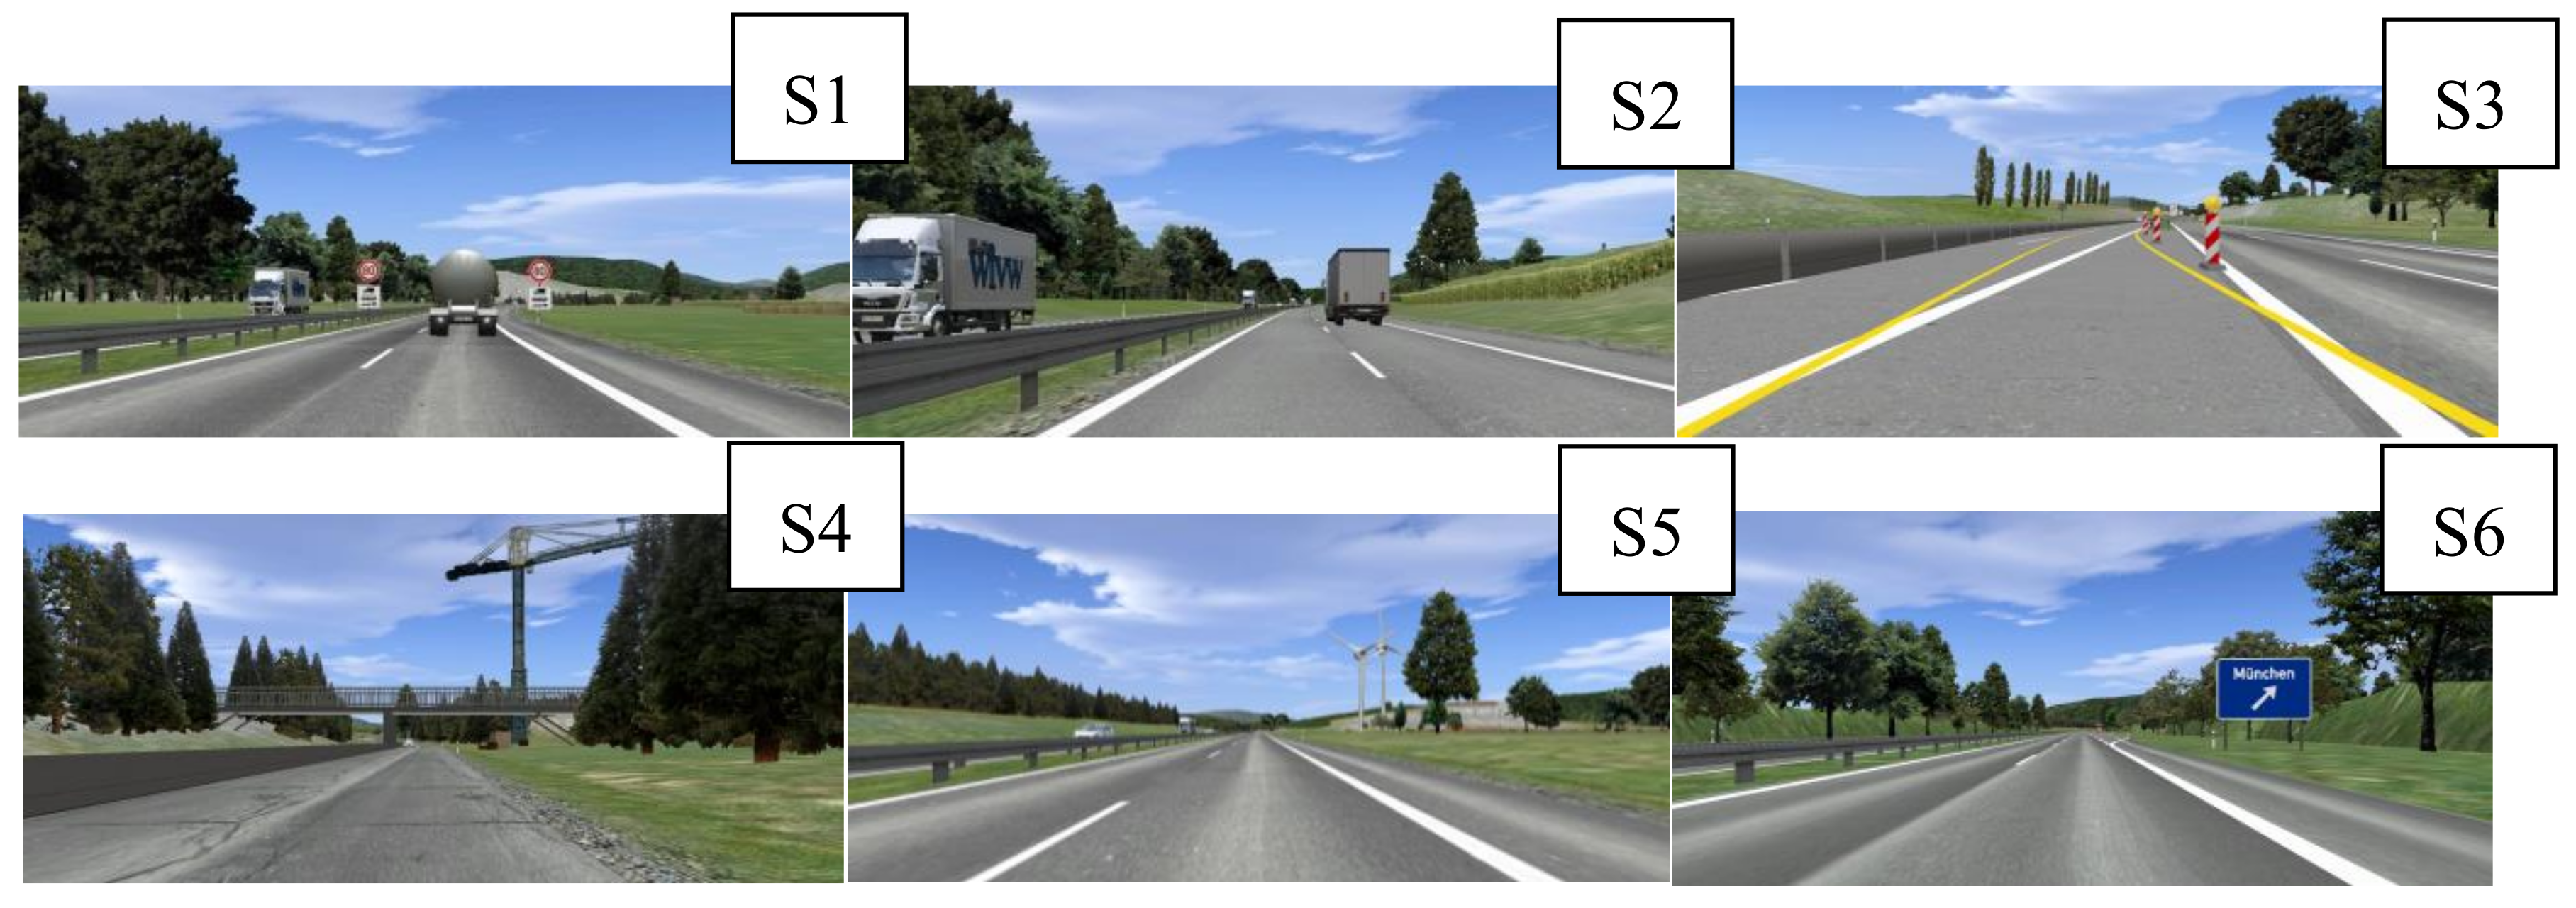
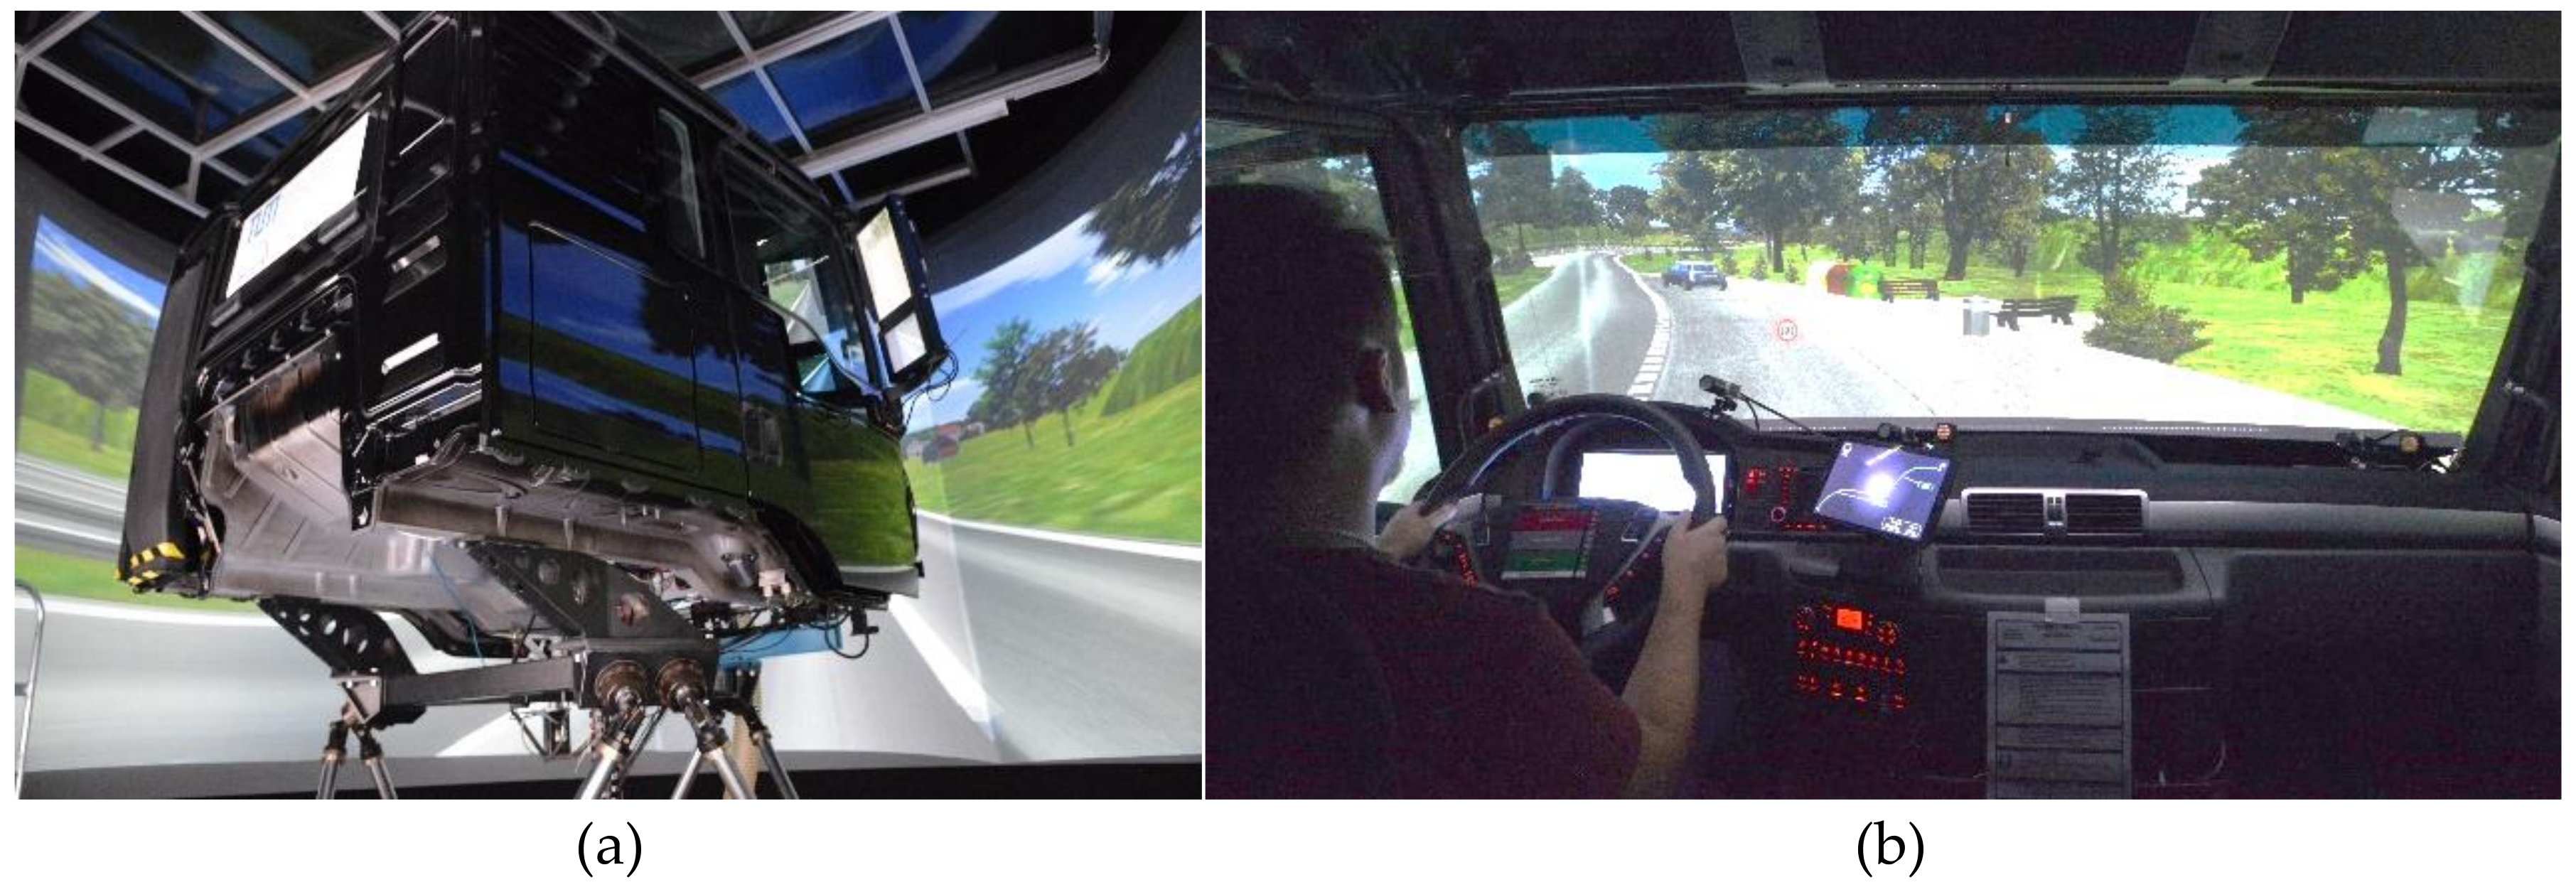
The experimental setup consisted of three consecutive highway drives with a level 3 automated truck, including engagement in a non-driving-related task (reading). The participants encountered six different traffic situations: Situation 1 and 2 were noncritical situations that could be managed by the automated driving system. Situation 3 to 6 represented critical situations that required a takeover by the driver. Due to the abilities of automated systems, a 60 s warning phase could be prompted by the system for situation 3 and 6. Situation 4 and 5 prompted short 10 s takeover phases.
The research questions asked whether the presentation of additional information influenced the driver–automation interaction in terms of an improvement regarding the objective criteria (Q1). Furthermore, the study examined if the presentational format of additional information (time vs. distance-based) affected the interaction (Q2).
Evaluation of acceptance descriptively showed good ratings for all three concepts, indicating that the basic layout of the HMI was useful and satisfying. Descriptive analysis further revealed higher ratings for both subscales usefulness and satisfying for concepts B and C. Inferential statistics could find a significant effect for all pairwise comparisons, with participants favoring concept C. The calculation of effect sizes also showed that relevant effects were prevailing and strongly supported the assumption that concepts offering more information influence the driver–automation interaction in terms of acceptance in a positive way. Results showed that additional information (distance-based) positively influenced the overall perceived usefulness.
Results regarding the satisfying scale showed that participants were more satisfied if additional (time-based or distance-based) information were presented.
These findings were supported by the workload assessment (DALI), showing that the more detailed concepts led to a lower workload in the seven subscales. Descriptively, concept A scored the highest on all workload subscales. In terms of reducing situational stress in HAD, participants rated concept C (distance-based) as creating the least stress. The presentation of additional information positively influenced the completion of non-driving-related tasks, especially in the distance-based presentational format.
Controllability ratings substantiated the findings. All three concept alternatives achieved low controllability ratings. The upper limit of <7 was not reached. Concepts offering additional information reached inferential significance. The calculation of effect sizes showed that additional information (distance-based) was able to positively influence the driver–automation interaction in terms of controllability.
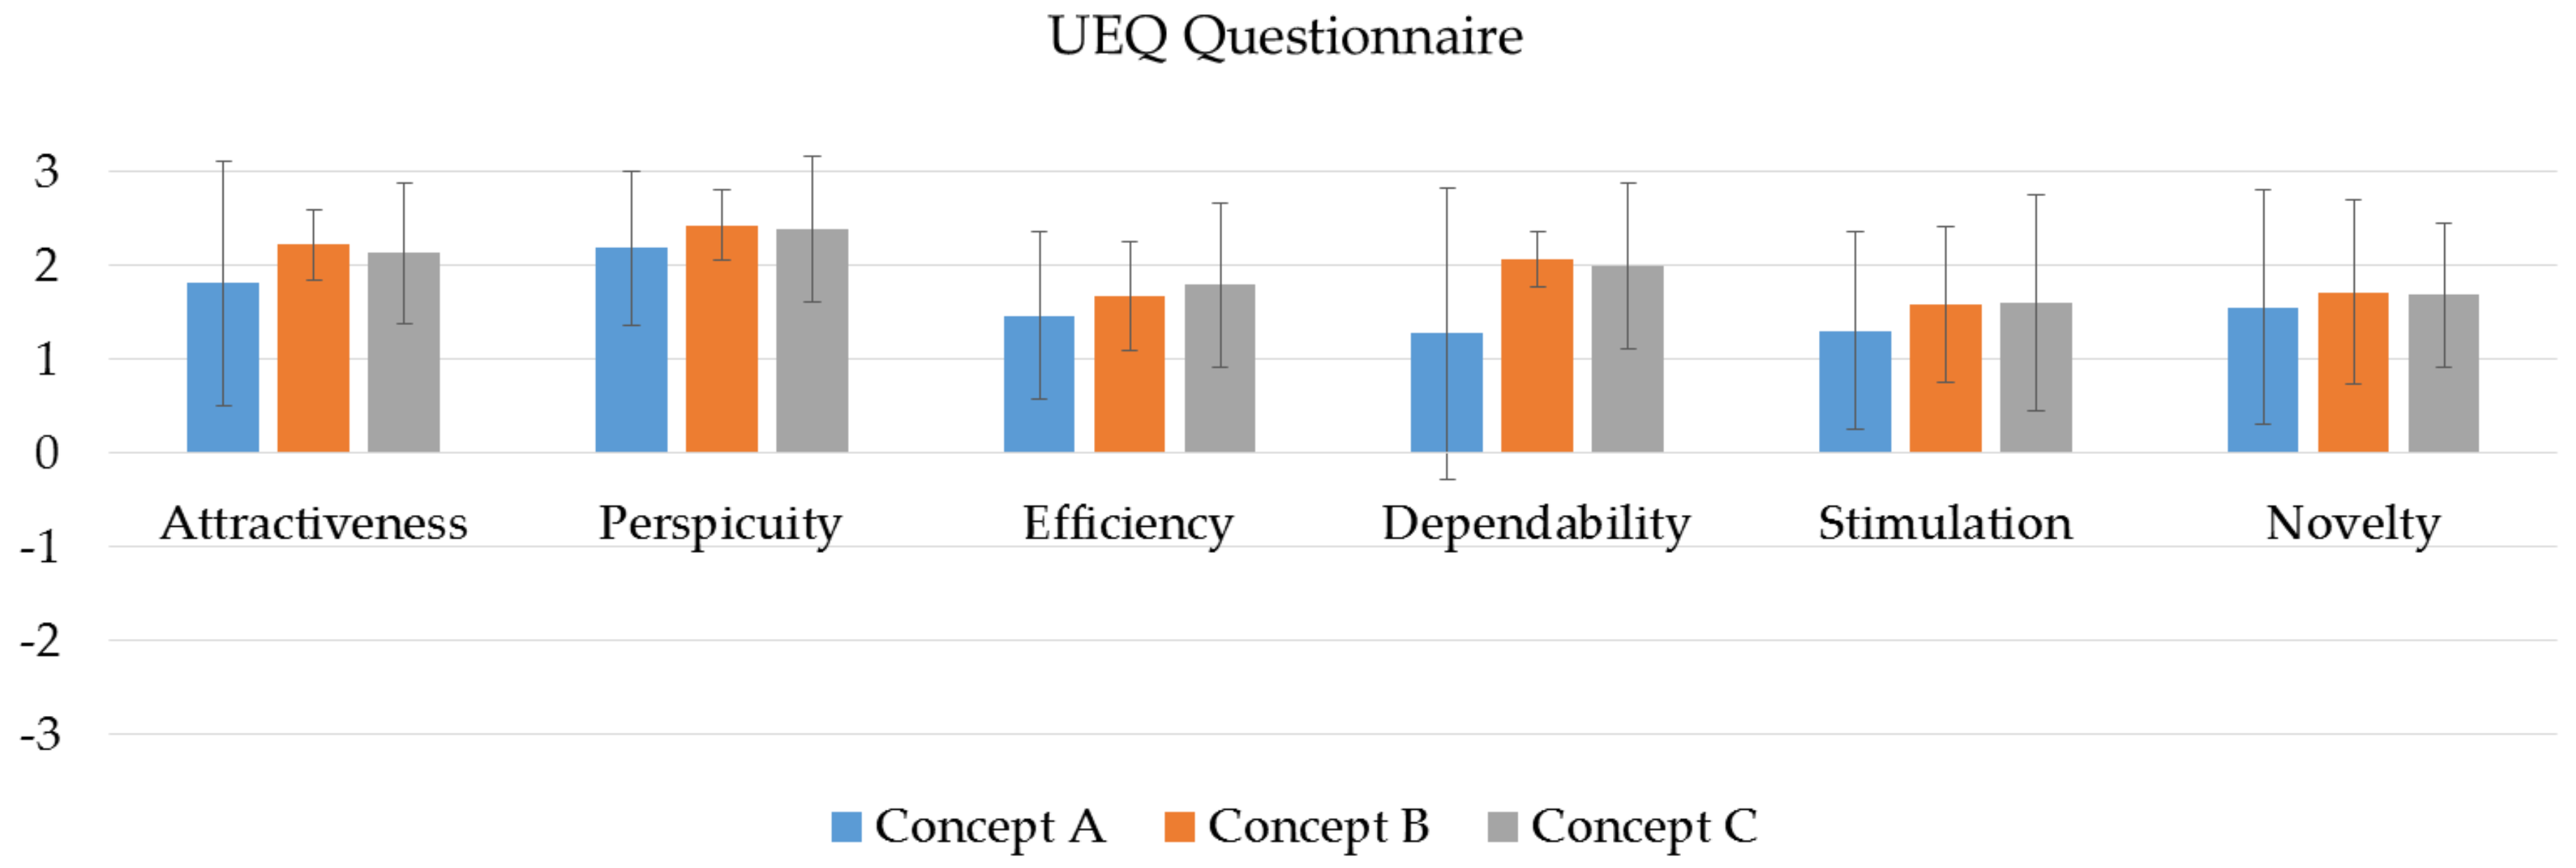
The results obtained from the UEQ showed high ratings for concept B and C for all subscales, with all values being located above 1.5. Concept A, which offered only limited information, descriptively scored below 1.5 for the subscales efficiency, perspicuity, and stimulation. The dimension perspicuity, which enables the driver to understand the system and its actions, evoked high ratings for all three concepts. This led to the conclusion that the basic HMI designed was able to safely apply HAD. Regarding the subscales dependability and efficiency, concept A scored the lowest. The results obtained for concepts B and C showed that additional information was able to positively enhance the system’s dependability and efficiency.
Participants’ qualitative comments reflected the found results, indicating that participants preferred the HMI concept with additional information, with the distance-based concept being favored. This might be due to the fact that professional truck drivers generally spend more time on the road dealing with distance-based information. Thus, truck drivers might be able to better interpret and get more information out of distance-based information compared to car drivers.
Literature in the area of automated truck driving is sparse, and comparisons with research in the area of passenger cars have its limitations. The results of this study nevertheless reflect the trend that HMI concepts for automated driving benefit from additional information, which explains the automated systems behavior in more detail (e.g., system uncertainty [30,31], reason why a takeover occurred [32]). The findings furthermore strengthen the fact that system feedback plays an important role when it comes to system understanding and usability of automated systems.
Some limitations of this study need to be noted. The assessment of affinity for technology revealed high overall technological affinity in the sample size. This might have influenced participants’ acceptance and usability ratings towards a more positive evaluation, thus lowering the potential for generalization. Another limitation relates to the assessment of takeover quality. Due to the scenario design, participants’ takeover reaction was limited to the deactivation of the system, continuing straight ahead on the motorway. Only in situation 3 (construction site) participants had to follow the new yellow lane markings; a lane change was not required. Video recordings and experimental protocols were prepared for each participant for the assessment of takeover quality. Retrospective analysis showed that driving errors and accidents occurred in the construction site scenario independent of the HMI concept driven. Subsequent inquiry revealed vagueness of the simulator steering system. This might have led to inappropriate steering interventions.
Takeover response times were not recorded in this study. The existing literature has already tried to investigate the ideal takeover time and indicated that takeover time depends on various factors. Hence, a 60 and 10 s time frame was chosen for the underlying study. All participants were able to take over the driving task in the proposed time period, tending to take over the driving task immediately after the takeover request had been prompted, irrespective of the remaining time left.
For the calculation of inferential statistics, nonparametric tests were chosen. Due to the conservative alignment of the tests, it might be that not all effects could be found. Therefore, effect sizes were calculated to reveal whether a relevant effect was prevailing. Another limitation lies in the chosen experimental design, with all participants rating all three HMI concepts. Concept alternatives and test drives were fully randomized, but learning processes might still have occurred, influencing participants’ evaluation.

6. Conclusion and Future Work

This contribution presented the design and evaluation of three different HMI concepts for highly automated truck driving, varying in terms of their informational content. Results suggested that the basic HMI design was suitable for HAD and enabled the driver to safely and efficiently take over the driving task if a takeover was prompted by the system. Providing the driver with additional information regarding the upcoming takeover positively enhanced the driver automation interaction.
Further studies should evaluate how the informational needs of truck drivers change over time and whether the positive effect of additional information might be mitigated by increased experience with the HAD system.

Author Contributions

Conceptualization, N.T.R. and L.F.; Data curation, N.T.R.; Formal analysis, L.F. and N.T.R.; Funding acquisition, N.T.R.; Investigation, N.T.R. and L.F.; Methodology, N.T.R. and L.F.; Project administration, N.T.R. and L.F.; Supervision, N.T.R.; Validation, N.T.R. and L.F.; Visualization, L.F.; Writing—original draft, N.T.R.; Writing—review & editing, B.M.

Funding

This research was funded by MAN Truck & Bus AG.

Conflicts of Interest

The authors declare no conflict of interest. Funders had no role in the design of the study; in the collection, analysis, or interpretation of data; in the writing of the manuscript, and in the decision to publish the results.

References

  1. Winner, H.; Hakuli, S.; Wolf, G. Handbuch Fahrerassistenzsysteme; Springer Vieweg: Wiesbaden, Germany, 2015. [Google Scholar]
  2. Gasser, T.M.; Arzt, M.; Ayoubi, M.; Bartels, A.; Bürkle, L.; Eier, J.; Flemisch, F.; Häcker, D.; Hesse, T.; Huber, W.; et al. Rechtsfolgen zunehmender Fahrzeugautomatisierung. Available online: http://bast.opus.hbz-nrw.de/volltexte/2012/587/pdf/F83.pdf (accessed on 1 August 2018).
  3. Richardson, N.; Doubek, F.; Kuhn, K.; Stumpf, A. Assessing truck drivers’ and fleet managers’ opinions towards highly automated driving. In Proceedings of the AHFE 2016 International Conference on Human Factors in Transportation, Bay Lake, FL, USA, 27–31 July 2016; pp. 473–484. [Google Scholar]
  4. Iseland, T.; Johansson, E.; Skoog, S.; Dåderman, A.M. An exploratory study of long-haul truck drivers’ secondary tasks and reasons for performing them. Accid. Anal. Prev. 2018, 117, 154–163. [Google Scholar] [CrossRef] [PubMed]
  5. Trösterer, S.; Meneweger, T.; Meschtscherjakov, A.; Tscheligi, M. Transport companies, truck drivers, and the notion of semi-autonomous trucks: A contextual examination. In Proceedings of the 9th International Conference on Automotive User Interfaces and Interactive Vehicular Applications Adjunct, Oldenburg, Germany, 24–27 September 2017; pp. 201–205. [Google Scholar]
  6. Endsley, M.R.; Kiris, E.O. The out-of-the-loop performance problem and level of control in automation. Hum. Factors 1995, 37, 381–394. [Google Scholar] [CrossRef]
  7. Parasuraman, R.; Riley, V. Humans and automation: Use, misuse, disuse, abuse. Hum. Factors 1997, 39, 230–253. [Google Scholar] [CrossRef]
  8. Lee, J.D.; See, K.A. Trust in automation: Designing for appropriate reliance. Hum. Factors 2004, 46, 50–80. [Google Scholar] [CrossRef] [PubMed]
  9. Beggiato, M.; Pereira, M.; Petzoldt, T.; Krems, J. Learning and development of trust, acceptance and the mental model of ACC. A longitudinal on-road study. Transp. Res. Part F Traffic Psychol. Behav. 2015, 35, 75–84. [Google Scholar]
  10. Endsley, M.R. Automation and Situation Awareness. Available online: http://www.aerohabitat.eu/uploads/media/Automation_and_Situation_Awareness_-_Endsley.pdf (accessed on 1 August 2018).
  11. Gold, C.; Berisha, I.; Bengler, K. Utilization of drivetime-performing non-driving related tasks while driving highly automated. Proc. Hum. Factors Ergon. Soc. Annu. Meet. 2016, 59, 1666–1670. [Google Scholar]
  12. Merat, N.; Jamson, A.H.; Lai, F.C.; Daly, M.; Carsten, O.M. Transition to manual: Driver behaviour when resuming control from a highly automated vehicle. Transp. Res. Part F Traffic Psychol. Behav. 2014, 27, 274–282. [Google Scholar] [CrossRef]
  13. Vogelpohl, T.; Vollrath, M.; Kühn, M.; Hummel, T.; Gehlert, T. Übergabe von Hochautomatisiertem Fahren zu Manueller Steuerung. Available online: https://udv.de/sites/default/files/tx_udvpublications/fobe_39_hochautomfahren.pdf (accessed on 1 August 2018).
  14. Wulf, F.; Rimini-Döring, M.; Arnon, M.; Gauterin, F. Recommendations supporting situation awareness in partially automated driver assistance systems. IEEE trans. Intell. Transp. Syst. 2015, 16, 2290–2296. [Google Scholar] [CrossRef]
  15. Gold, C.; Happee, R.; Bengler, K. Modeling take-over performance in level 3 conditionally automated vehicles. Accid. Anal. Prev. 2018, 116, 3–13. [Google Scholar] [CrossRef] [PubMed]
  16. Gold, C.; Körber, M.; Lechner, D.; Bengler, K. Taking over control from highly automated vehicles in complex traffic situations: the role of traffic density. Hum. Factors 2016, 58, 642–652. [Google Scholar] [CrossRef] [PubMed]
  17. Merat, N.; Jamson, A.H.; Lai, F.C.; Carsten, O. Highly automated driving, secondary task performance, and driver state. Hum. Factors 2012, 54, 762–771. [Google Scholar] [CrossRef] [PubMed]
  18. Schömig, N.; Hargutt, V.; Neukum, A.; Petermann-Stock, I.; Othersen, I. The interaction between highly automated driving and the development of drowsiness. Procedia Manuf. 2015, 3, 6652–6659. [Google Scholar] [CrossRef]
  19. May, J.F.; Baldwin, C.L. Driver fatigue: The importance of identifying causal factors of fatigue when considering detection and countermeasure technologies. Transp. Res. Part F Traffic Psychol. Behav. 2009, 12, 218–224. [Google Scholar] [CrossRef]
  20. Radlmayr, J.; Gold, C.; Lorenz, L.; Farid, M.; Bengler, K. How traffic situations and non-driving related tasks affect the take-over quality in highly automated driving. Proc. Hum. Factors Ergon. Soc. Annu. Meet. 2014, 58, 2063–2067. [Google Scholar] [CrossRef]
  21. Damböck, D.; Farid, M.; Tönert, L.; Bengler, K. Übernahmezeiten Beim Hochautomatisierten Fahren. Available online: http://www.ftm.mw.tum.de/uploads/media/24_Damboeck.pdf (accessed on 1 August 2018).
  22. Petermann-Stock, I.; Hackenberg, L.; Muhr, T.; Mergl, C. Wie lange braucht der Fahrer? Eine Analyse zu Übernahmezeiten aus verschiedenen Nebentätigkeiten während einer hochautomatisierten Staufahrt. In Proceedings of the 6. Tagung Fahrerassistenzsysteme, München, Germany, 28–29 November 2013. [Google Scholar]
  23. Kerschbaum, P.; Lorenz, L.; Bengler, K. Highly automated driving with a decoupled steering wheel. Proc. Hum. Factors Ergon. Soc. Annu. Meet. 2014, 58, 1686–1690. [Google Scholar] [CrossRef]
  24. Zeeb, K.; Buchner, A.; Schrauf, M. What determines the take-over time? An integrated model approach of driver take-over after automated driving. Accid. Anal. Prev. 2015, 78, 212–221. [Google Scholar] [CrossRef] [PubMed]
  25. Neubauer, C.; Matthews, G.; Saxby, D. Fatigue in the automated vehicle: Do games and conversation distract or energize the driver? Proc. Hum. Factors Ergon. Soc. Annu. Meet. 2014, 58, 2053–2057. [Google Scholar] [CrossRef]
  26. Natalie, R. Erfassung und Bewertung des Informationsbedarfs von Lkw-Fahrern während hochautomatisierter Fahrt. In Proceedings of the 9. VDI Tagung: Der Fahrer im 21. Jahrhundert, Düsseldorf, Germany, 21–22 November 2017. [Google Scholar]
  27. Marktbeobachtung Güterverkehr: Auswertung der Arbeitsbedingungen in Güterverkehr und Logistik 2016-I- Fahrerberufe. Available online: https://www.bag.bund.de/SharedDocs/Downloads/DE/Marktbeobachtung/Turnusberichte_Arbeitsbedingungen/Bericht_5E_Fahrerberufe_2016-I.html (accessed on 20 June 2017).
  28. Ellinghaus, D.; Steinbrecher, J. Lkw im Strassenverkehr-Eine Untersuchung ueber die Beziehungen zwischen Lkw-und Pkw-Fahrern. Available online: https://www.bau.uni-siegen.de/subdomains/verkehrsplanung/publikationen/uniroyal/buch27.pdf (accessed on 1 August 2018).
  29. Sarter, N.B.; Woods, D.D.; Billings, C.E. Available online: https://pdfs.semanticscholar.org/f4c7/caebecd0f1b42d1eb8da1061e464fcccae11.pdf (accessed on 1 August 2018).
  30. Stockert, S.; Richardson, N.T.; Lienkamp, M. Driving in an increasingly automated world–approaches to improve the driver-automation interaction. Procedia Manuf. 2015, 3, 2889–2896. [Google Scholar] [CrossRef]
  31. Beller, J.; Heesen, M.; Vollrath, M. Improving the driver–automation interaction: An approach using automation uncertainty. Hum. Factors 2013, 55, 1130–1141. [Google Scholar] [CrossRef] [PubMed]
  32. Körber, M.; Prasch, L.; Bengler, K. Why do I have to drive now? Post hoc explanations of takeover requests. Hum. Factors 2018, 60, 305–323. [Google Scholar] [CrossRef] [PubMed]
  33. Andreas, K.; Markus, N.; Martin, B.; Rainer, W.; Thomas, W. RESPONSE 3: Code of Practice for the Design and Evaluation of ADAS. 2009. Available online: https://www.acea.be/uploads/publications/20090831_Code_of_Practice_ADAS.pdf (accessed on 1 August 2018).
  34. Conceptual Design and Evaluation of A Human Machine Interface for Highly Automated Truck Driving. Available online: https://www.researchgate.net/publication/324949950_Conceptual_Design_and_Evaluation_of_a_Human_Machine_Interface_for_Highly_Automated_Truck_Driving (accessed on 1 August 2018).
  35. Ergonomie der Mensch-System-Interaktion—Teil 210: Prozess zur Gestaltung gebrauchstauglicher interaktiver Systeme. Available online: https://infostore.saiglobal.com/preview/is/en/2010/i.s.eniso9241-210-2010.pdf?sku=1441363 (accessed on 1 August 2018).
  36. Advantages and Disadvantages of Driving Simulators: A Discussion. Available online: https://www.measuringbehavior.org/files/2012/ProceedingsPDF (accessed on 1 August 2018).
  37. Winner, H.; Hakuli, S.; Singer, C. Handbuch Fahrerassistenzsysteme: Grundlagen, Komponenten und Systeme für aktive Sicherheit und Komfort: mit 550 Abbildungen und 45 Tabellen; Springer Vieweg: Wiesbaden, Germany, 2009. [Google Scholar]
  38. Van Der Laan, J.D.; Heino, A.; de Waard, D. A simple procedure for the assessment of acceptance of advanced transport telematics. Transpo. Res. Part C Emerg. Technol. 1997, 5, 1–10. [Google Scholar] [CrossRef]
  39. Pauzié, A. A method to assess the driver mental workload: The driving activity load index (DALI). IET Intell. Transp. SY 2008, 2, 315–322. [Google Scholar] [CrossRef]
  40. Laugwitz, B.; Held, T.; Schrepp, M. Construction and evaluation of a user experience questionnaire. In HCI and Usability for Education and Work. Proceedings of 4th the Symposium of the Workgroup Human-Computer Interaction and Usability Engineering of the Austrian Computer Society, Graz, Austria, 20–21 November 2008; Springer: Berlin/Heidelberg, Germany, 2008. [Google Scholar]
  41. ACC-Stop&Go: Fahrverhalten and Funktionalen Systemgrenzen. Available online: https://www.researchgate.net/publication/242529096_ACC-StopGo_Fahrerverhalten_an_funktionalen_Systemgrenzen (accessed on 1 August 2018).
  42. Murray, J. Likert data: What to use, parametric or non-parametric? Int. J. Bus. Soc. Sci. 2013, 4, 258–264. [Google Scholar]
  43. Jamieson, S. Likert scales: How to (ab) use them. Med. Educ. 2004, 38, 1217–1218. [Google Scholar] [CrossRef] [PubMed]
  44. Field, A.P. Discovering Statistics Using SPSS: (and Sex and Drugs and Rock ‘n’Roll); SAGE: Los Angeles, CA, USA, 2009. [Google Scholar]
Figure 1. Depiction of navigation map in instrument cluster (IC) (top) and central information display (CID) (bottom) for the three different human–machine interface (HMI) concepts.
Mti 02 00068 g001
Figure 2. Depiction of the driver cabin ((a): outside; (b): inside).
Mti 02 00068 g002
Figure 3. SILAB Scenarios (from left to right: S1: following preceding vehicle; S2: taking over slower vehicle; S3: construction site, S4: missing lane marking; S5: sensor failure; S6: motorway ending).
Mti 02 00068 g003
Figure 4. Descriptive analysis of user experience questionnaire (UEQ) depicting all six subscales (attractiveness, perspicuity, efficiency, dependability, stimulation, novelty) for all HMI concept alternatives.
Mti 02 00068 g004
Table 1. Scale reliability analysis for acceptance scales usefulness and satisfying.
ScaleCronbach’s αLower 95% CIUpper 95% CI
Usefulness 0.8610.7760.924
Satisfying 0.9290.8840.961
Table 2. Rated acceptance for usefulness and satisfying scale (mean and (SD) for concept A, B, and C.
ScaleConcept AConcept BConcept C
Usefulness 1.12 (0.61)1.45 (0.44)1.3 (0.53)
Satisfying 1.13 (0.82)1.48 (0.51)1.41 (0.66)
Table 3. Inferential statistics of usefulness scale with Connover’s post-hoc test and Spearman’s r.
ConceptT-StatpSpearman’s rSP
A B4.968<0.001 *0.742
A C2.2270.030 *0.769
B C2.7410.008 *0.868
* significant (p < 0.05).
Table 4. Inferential statistics of satisfying scale with Connover’s post-hoc test and Spearman’s r.
ConceptT-StatpSpearman’s rSP
A B2.8090.007 *0.579
A C2.2980.025 *0.800
B C0.5110.6110.776
* significant (p < 0.05).
Table 5. Experienced workload mean and (SD) for concepts A, B, and C.
DALI ScaleConcept AConcept BConcept C
Effort of attention2.46 (0.29)2.06 (0.25)2.00 (0.28)
Visual demand2.16 (0.27)1.76 (0.24)1.83 (0.28)
Auditory demand1.43 (0.21)1.30 (0.20)1.34 (0.24)
Tactile demand1.37 (0.26)1.33 (0.24)1.20 (0.18)
Temporal demand1.50 (0.25)1.33 (0.26)0.83 (0.18)
Situational stress1.43 (0.27)1.13 (0.22)1.10 (0.25)
Interference1.60 (0.28)1.83 (0.28)1.27 (0.20)
Table 6. Inferential statistics of situational stress and interference scale with Connover’s post-hoc test and Spearman’s r.
SubscaleConceptT-StatpSpearman’s rSP
Situational stressA B0.660 0.5120.533
A C2.7340.008 *0.493
B C2.0740.042 *0.547
InterferenceA B2.3780.021 *0.779
A C0.457 0.6490.687
B C2.8360.006 *0.607
* significant (p < 0.05).
Table 7. Controllability ratings, mean, and (SD) for all six scenarios and concept alternatives.
Concept AConcept BConcept C
Controllability2.48 (1.44)2.02 (1.12)1.96 (1.05)
Table 8. Inferential statistics (Connover’s post-hoc) of controllability with Spearman’s r.
ConceptT-StatpSpearman’s rSP
A B2.3550.022 *0.496
A C2.3550.022 *0.715
B C0.0001.0000.669
* significant (p < 0.05).
Table 9. Inferential statistic of UEQ with Spearman’s r for subscales’ efficiency and dependability.
SubscaleConceptT-StatpSpearman’s rSP
EfficiencyA B1.6610.1020.675
A C3.0840.003 *0.720
B C1.4230.1600.747
DependabilityA B4.910<0.001 *0.667
A C5.086<0.001 *0.578
B C0.1750.8610.762
* significant (p < 0.05).

