1. Introduction
Discussions related to the transportation sector are aimed at achieving targets of sustainability and equity [
1]. In this regard, collective means, i.e., transit or public transportation (PT), are recognized as drivers of economic growth [
2] and social inclusion in terms of easy and accessible displacement of people [
3,
4,
5]. Therefore, it is crucial to identify and implement effective policies that enhance the role of PT as a competitive mode of transport for daily commuting, whether frequent or infrequent. However, this is recognized among the major challenges confronting authorities and stakeholders [
6,
7]. In fact, although it has been demonstrated that some factors are positively correlated with PT use [
8], the modal split is usually skewed in favour of private modes. Focusing on Western countries, the modal preferences are quite comparable. However, it is possible to observe differences between European and non-European contexts, either at the country or city level. Historical and economic reasons [
9,
10,
11] may provide a partial explanation, and some efforts have been made in identifying other factors at the city or national level [
12]. Concerning this latter topic, the notion of mobility culture(s) (MC) has emerged. This concept emphasizes the role of several material and symbolic elements that inform the users’ modal preferences. What arises from previous analyses [
13] is that interplay between these factors and the context-specific peculiarities of the local environment influence user behaviours, thereby impacting and modulating the local modal split.
Based upon these premises, this research aims to investigate and expand the concept of urban MC. In particular, the research is intended to develop the framework related to MC, which is built upon objective (material) and subjective (symbolic) elements and attributes [
13,
14,
15]. In detail, the paper will address the research topic by testing the effects of several factors on the local share of PT, namely the diversity in land use [
8], fare integration [
16], service quality, here accounted as the level of service (LoS) [
17], regularity of service, in terms of generalized clock-face scheduling [
18], and some characteristics of maps designed to represent the transit network [
19,
20]. Geographically weighted regression (GWR) [
21] will be the main technique employed in the research, given the objective to undertake the analysis at the city level. As part of this research, 35 Italian and 35 German cities will be investigated. The choice of two countries characterized by different PT supply [
10], transportation policies [
16,
22,
23] and MC, at least at the country level [
12], is intended to reinforce the results and to corroborate the universality of the proposed approach. The rest of the paper is organized as follows:
Section 2 provides a review of the related works.
Section 3 describes the materials and methods employed in the research, while
Section 4 delves into the results and their discussion. Conclusive remarks are reported in
Section 5.
2. Defining the Concept of MC: A Review
The notion of MC is a multidisciplinary concept with the underlying hypothesis that a number of factors inform, at the local level, users’ preferences towards the transport modes and, consequently, determine the modal split [
24]. Along with the wide range of definitions formulated over the last few decades [
13,
15], as well as the analytical procedures employed to explore MC [
13], it has been demonstrated that the spectrum of factors include material elements, such as objective characteristics of the PT supply and the contextual characteristics of the area where PT operates, regulatory framework and policy-related initiatives, and immaterial components and subjective attitudes, such as symbolic elements, collective norms and informal agreements.
Based on a number of these factors, Klinger et al. [
14] clustered some of the main German cities in relation to their modal predisposition, and the results can be considered beyond the German context. In fact, the proposed framework is worthy of great interest due to the combination of factors related to both the density of population and functions, along with other socio-economic characteristics of demand. The work of Klinger et al. is considerable because it explores the role of several factors that are commonly recognized as associated with PT patronage, thereby establishing a consistent theoretical background for future research efforts, including those aimed at integrating the concept of MC with additional factors. The German area was also investigated by Klinger and Lanzendorf [
25] in their analysis based on surveys about the travel behaviour change experienced after residential relocation, and in Bamber et al. [
26]. While the work of Klinger and Lanzendorf [
25] shed light on the effects on users’ choices of local factors, including those related to the interurban or metropolitan scale, Bamber et al. [
26] found that the predispositions towards cycling in Germany were more influenced by seasonal effects than in the Netherlands, suggesting that MC may be affected also by climatic factors.
A cross-country analysis of metropolitan areas across multiple continents is proposed in Wulfhorst et al. [
27], who identified several clusters related to MC. On the other hand, Goletz et al. [
28] proposed an international comparison, including only four major European cities based on a two-step survey. This research was aimed at analysing intermodality and its potential relation with MC. This latter aspect is of great importance, as the modal share is usually skewed in favour of the individual and unimodal modes, such as private cars [
12,
29,
30], with considerable environmental, social and economic effects. Consequently, it is crucial to analyse whether these trends are related to the transport systems and their characteristics, the urban form or other personal attitudes. With this aim, Mögele and Rau [
31] analysed the externalities of the so-called ‘car-centred MC’, a phenomenon which notably affects some Western countries, from geographic and societal perspectives finding that, in some instances, the car may be considered an inherent peculiarity of local MC.
A number of other studies have focused on elements related to mobility behaviours in urban areas, though they do not specifically mention MC. In Buehler [
32] and Buehler and Pucher [
33], a comparison between German and US modal behaviours is carried out. The analyses comprised several factors, including socio-economic, demographic and geographic-related variables of two countries, characterized by a significant car dependency. In particular, the latter research investigated the role of factors in determining the share of PT usage, finding a similar pattern (i.e., an inverse relation between PT patronage and car ownership, income and population density) and notable differences (i.e., PT is more attractive in Germany than in the US). With regard to the PT, economic aspects, such as the out-of-pocket costs of transport (e.g., fare system and ticket prices), may be considered prominent components, as well as the availability of integrated systems [
34].
Following the introduction of reduced prices or free PT in some contexts, Hahn et al. [
35] found that a decrease in price may be positively associated with a higher predisposition towards PT. On the other hand, PT can also be challenged by emerging modes, such as sharing or free-floating services. Their introduction in urban areas provides citizens affordable alternatives, but on the other hand, they may erode the share of the traditional collective means of transport. In their comprehensive analysis, Groth et al. [
36] found differences in the use of new mobility services at the city and district level, implying that MC may be affected by the underlying socio-economic background and at different spatial resolutions. Widening the gaze, Hunecke et al. [
37] focused on the ecological impact of typical behaviours and their relations with psychological, social, symbolic and infrastructural aspects, finding consistent and noteworthy relations among them. The environmental aspect is also investigated in Gumy et al. [
38], who found that PT usage can be impacted by the awareness of citizens, though to different degrees, in accordance with socio-economic background.
Some suggestions emerged from the review of MC and related factors. Despite the number of formulations, it is hard to find a univocal definition, although the conceptual boundary is clear and widely acknowledged. Consequently, it is possible to extend the domain of MC including additional factors that adhere to the paradigm, adhering to, e.g., the taxonomy proposed in previous research efforts (e.g., [
13] and [
14]). As an additional remark, the predisposition towards collective means of transport should be thoroughly analysed, since PT is a main public asset [
39] that should be adequately preserved and, when possible, enhanced, following the users’ needs and satisfaction [
40,
41]. Given the scope of the research introduced in
Section 1, geographically weighted regression (GWR) was evaluated as a suitable technique, as this method is designed to estimate local coefficients. The implementation of GWR has the potential to yield a more realistic representation of the local effects, thereby facilitating cross-country comparisons that would otherwise be difficult to achieve [
42]. GWR has been previously adopted in research related to PT. Among others, Chiou et al. [
43] focused on PT patronage, finding consistency with the previous research about the factors affecting the predisposition towards collective means of transport. In their analysis on use of taxis and subway services, Gokasar et al. [
44] compared results of GWR and other regression techniques, finding noteworthy results about the different model performances. The local role of variables was pivotal in the analysis of Marques [
45], who investigated petty crime in proximity to bus stops in São Paulo, Brazil, thus shedding light on the contextual effects of several socio-economic characteristics of the neighbourhoods. Regarding this research, to the best of the authors’ knowledge, it is the first attempt to quantify the role of several factors in relation to MC employing a local regression. Nevertheless, the proposed approach also aligns with the previous related research on the necessity for a methodology that can effectively capture the nuances of local peculiarities [
15], while maintaining adequate consistency with the broader context of the test [
43].
3. Materials and Methods
In line with the premises mentioned above—i.e., a comprehensive approach is adequate for quantifying the dimension and the traits of MC [
13,
14,
15]—GWR is considered a more appropriate technique than a global model, as it enables the contextual interpretation of coefficients of explanatory variables. The mathematical formulation of GWR derives from the linear regression, and can be expressed as follows (Equation (1)) [
46]:
where
is the response variable for location
i (
i = 1, 2, …
n),
is the intercept,
is the coefficient related to the explanatory variable
where
is not stationary over the space and conversely corresponds to location
i, while
is the error term representing the uncertainty of the model. Coefficients can be estimated for any location within the study area and represent the main interest of this geostatistical method [
46]. The estimation is performed by weighting observations on their relative location, thus requiring the selection of a spatial weight function and the related bandwidth. With regard to the weighting method, the local estimation is performed using the weighted least square method, where the weight function is the spatial analysis function for different conditions at each data point [
43]. Concerning the selection of the most appropriate bandwidth, when the sample data is large, a constant bandwidth (fixed kernel
) can be employed, while when the sample size is small, a variable bandwidth (adaptive kernel
) has been demonstrated to be more effective [
43]. Once the kernel function has been chosen, coefficients are estimated as follows (Equation (2)) [
46]:
where
is a diagonal matrix specific to location
i, with the
i-th element of the diagonal (
) given by the value of the kernel function for the observation pair
i and
j [
46]. In this research, the response variable was set as the modal share of PT, while the explanatory variables were the factors introduced previously and described in
Section 3.1.1,
Section 3.1.2,
Section 3.1.3 and
Section 3.1.4. Moreover, GWR can be compared with the results of other models [
43], such as multiple linear regression (MLR) [
47,
48], in order to assess its validity against a global model.
3.1. Overview of Data
As introduced, this research is based on an analysis of Italian and German cities. These two countries are characterized by different MCs, at least at the national level [
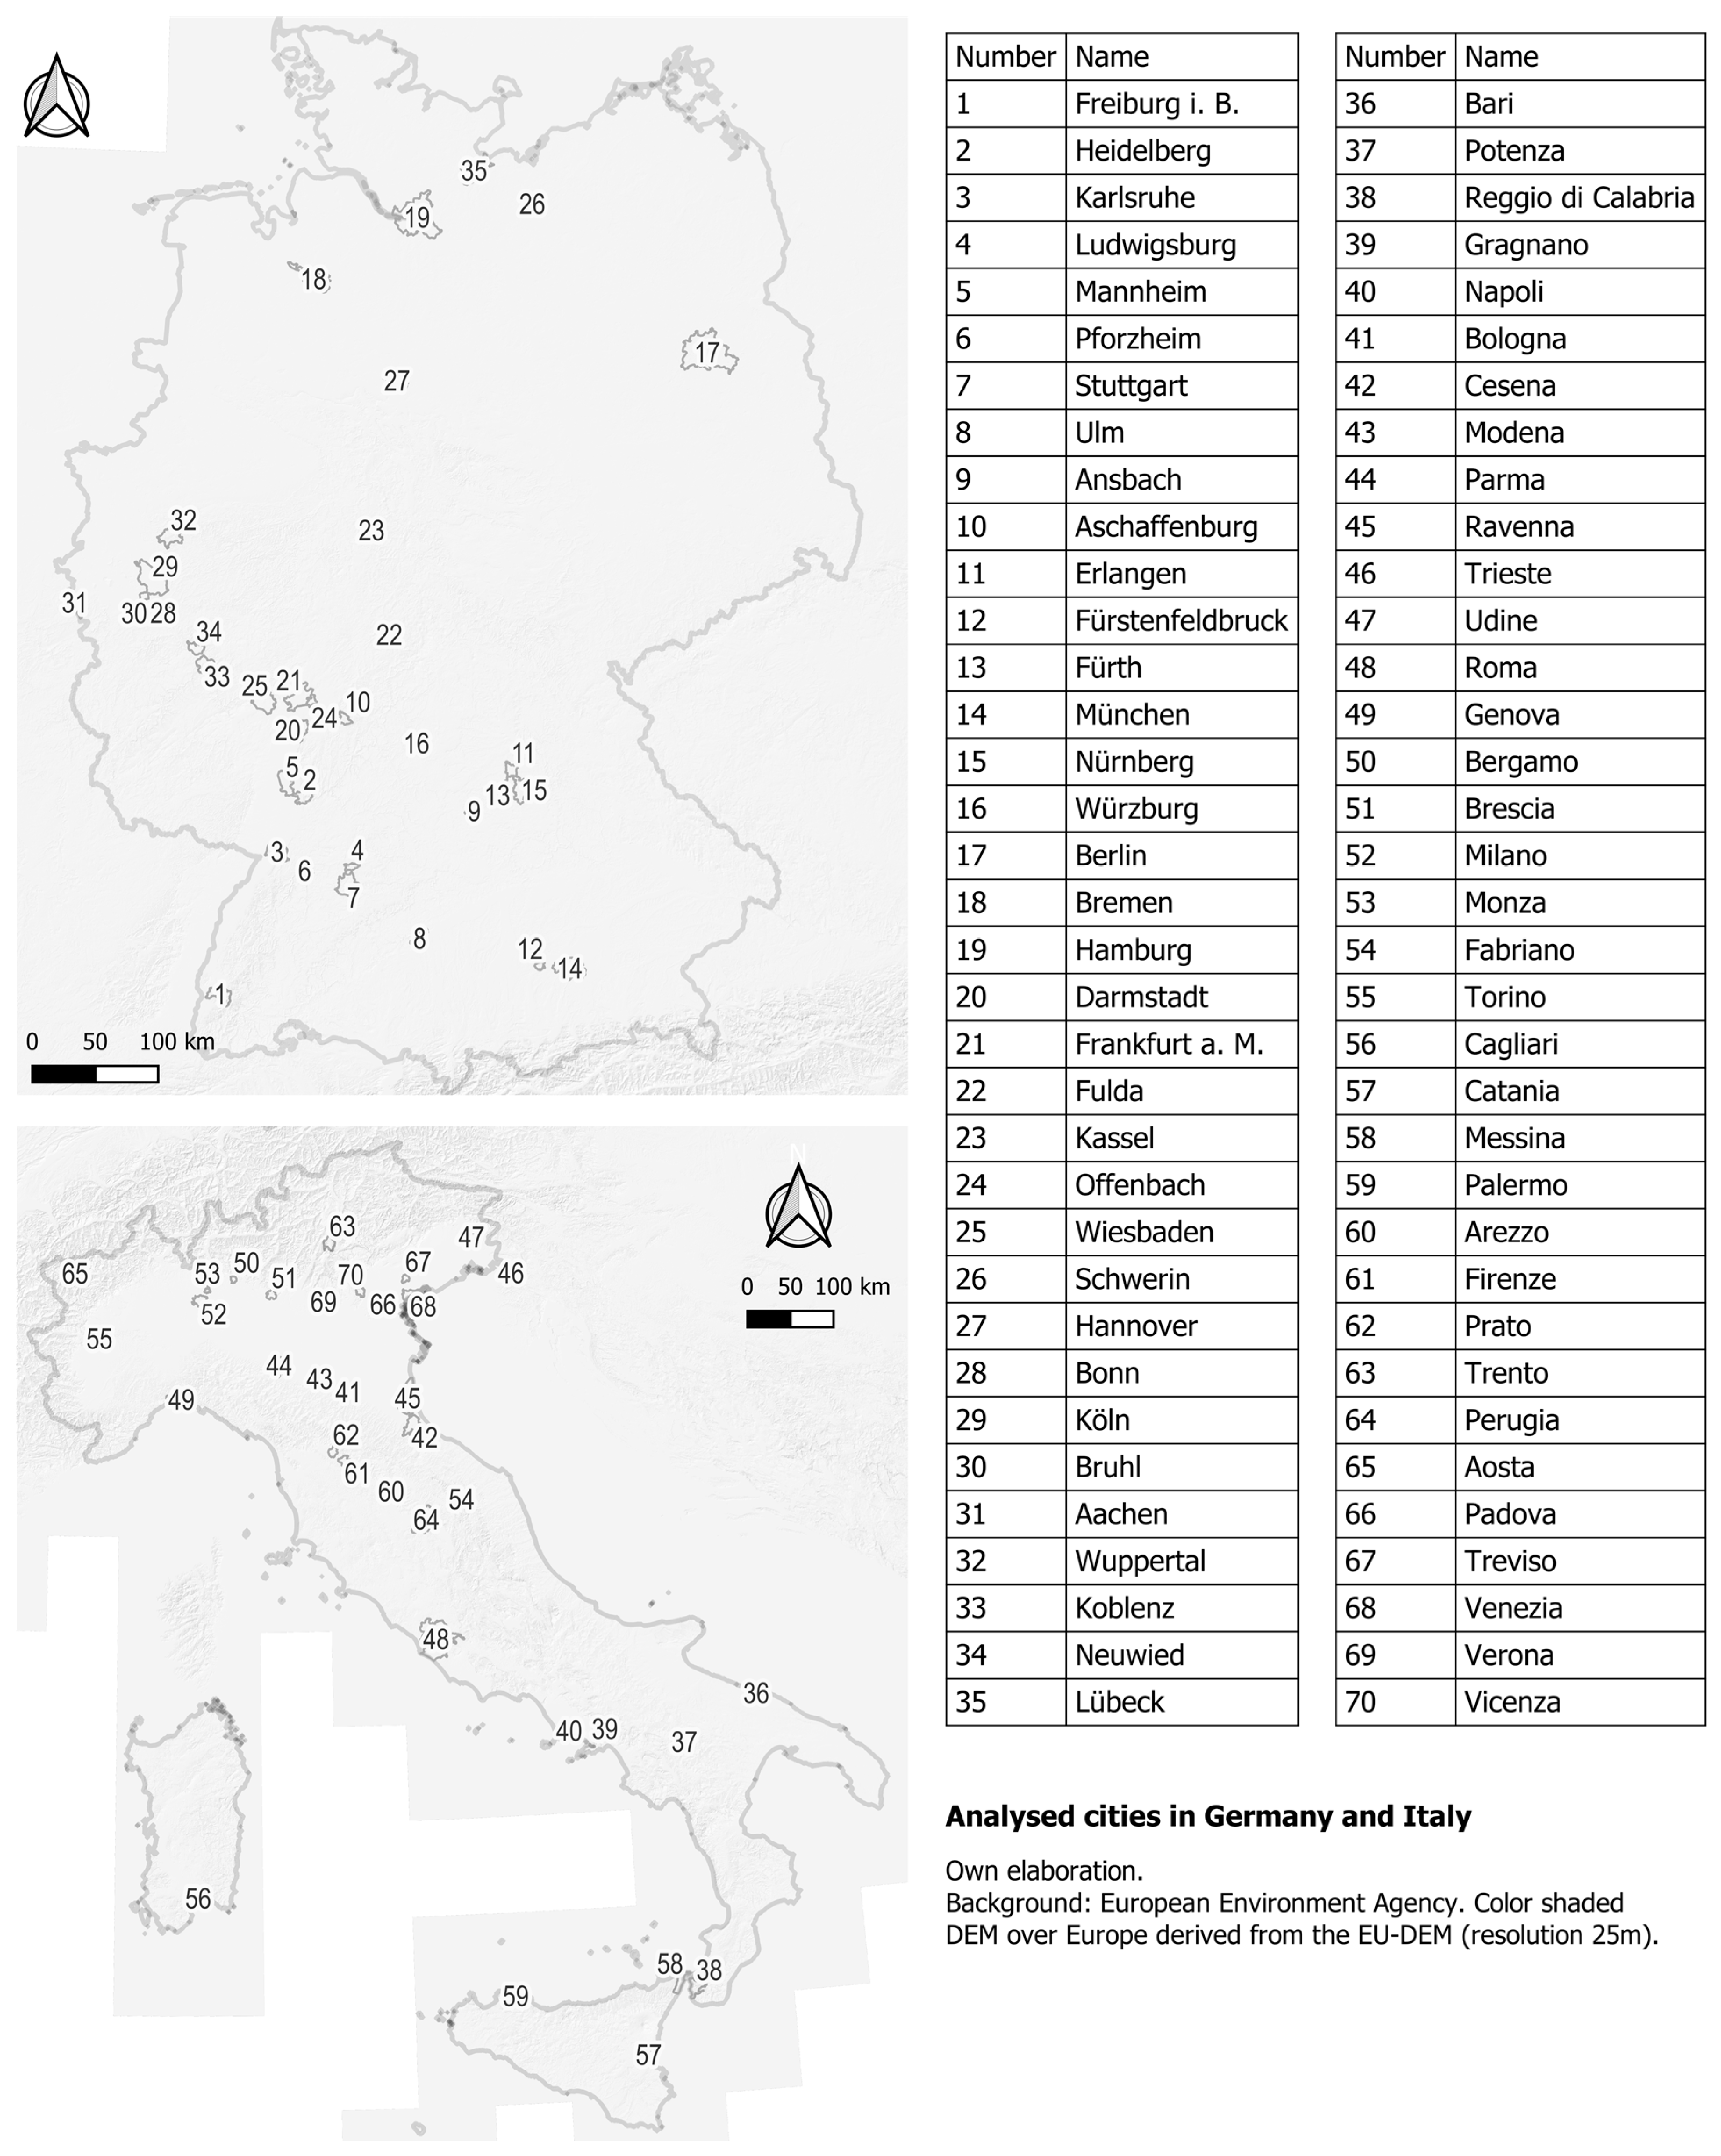
12]; therefore, a more in-depth analysis at the city level is intended to provide additional insights. Despite the dissimilar distribution of population between the two countries, cities have been selected with the objective of ensuring adequate representativeness, contingent on the availability of data pertaining to both the modal share of PT and other factors. The analysed cities are listed and plotted in
Figure 1, while
Appendix A provides additional information (
Table A1 and
Table A2), including the population, the number of lines and the density of stops for each mode of transport.
With regard to the modal share of PT, most of the information related to German cities can be found in [
49], while that related to Italian cities has been extracted from different sources, including national reports [
50,
51] or local documents (e.g., Sustainable Urban Mobility Plans). Regarding the candidate factors, the research tested the effects on the local share of PT of the service quality, accounted as the level of service (LoS), the fare integration, the regularity of service, in terms of generalized clock-face scheduling, the diversity in land use and the characteristics of maps designed to represent the PT network. The following sections briefly describe the factors employed in the analysis, which correspond to most of the dimensions of MC introduced in
Section 2, namely the objective characteristics of PT (LoS;
Section 3.1.1), the regulatory framework and policy-related initiatives (fare integration and clock-face scheduling;
Section 3.1.2), the physical characteristics of the context where PT operates (diversity in land use;
Section 3.1.3) and the symbolic elements (characteristics of maps;
Section 3.1.4). A synthetic overview of variables (only for continuous variables) is reported in
Table 1.
It is worth noting that the selection of factors was informed by the following considerations: the aim of exploring and testing additional variables within the context of MC, revealing their net effects on the users’ predisposition towards PT as introduced in
Section 1; the need for a combination of factors not affected by multicollinearity; and the availability of data for an adequate and straightforward interpretation of results. Regarding multicollinearity, a preliminary analysis, namely a correlation matrix (Pearson
ρ) [
48], reported in
Appendix A (
Table A3), revealed relevant correlations between some of the candidate variables, namely the LoS of each mode, and some other factors, such as the population, the number of lines of each mode and the density of stops. Therefore, while the latter have been excluded, LoS was kept as reasonable proxy of the former. Regarding the constraints related to the availability of data, some related to the characteristics of demand (e.g., travelled distance, commuting time, household income and general satisfaction with the PT service) or characteristics of supply (e.g., reliability of PT modes, average speed and perceived safety or comfort) were not available for all the cities, or outdated. Consequently, it should be noted that the selection of variables was a consequence of methodological considerations, substantiated by technical constraints.
3.1.1. Objective Characteristics of the PT Supply—Level of Service (LoS)
Accounting for the characteristics of PT supply is of particular interest and has been investigated in different contexts [
52,
53], as it corresponds to the quality of the PT service delivered by the transit operator. In general, service quality has been explored in relation to its ability in informing users’ modal predisposition [
54], thereby making PT a feasible alternative if compared to private cars [
55]. This is particularly evident when users can choose between different PT systems and services, which are often integrated [
34], and private modes. In light of the multifaceted nature of service quality, the identification of a synthetic indicator entails a considerable degree of complexity, particularly when updated information is not available or incomplete. In addition, the scale of analysis of this research, i.e., the city level, as well as the absence of some well-known indicators of PT service quality (e.g., punctuality, reliability and cleanliness of vehicles), hindered the implementation of comprehensive and multilayered measures, e.g., the index proposed by De Oña et al. [
56]. Consequently, authors carefully chose level of service (LoS) [
17] as it synthetically provides information related to the PT supply and its usability in terms of frequency. This is also a straightforward indicator, as it may reflect the expected users’ behaviours and when they wait for a vehicle at the stop, as well as their attitude towards the PT, namely, the higher the frequency, the higher the expectable propension to use collective means of transport. As LoS is usually reported with an alphabetic classification, numerical values have been associated to each level, as reported in
Table 2. LoS has been extracted from the General Transit Feed Specification (GTFS) [
57] of PT companies and, when not available, from the website of PT authorities, and then averaged for each line of each PT mode.
In general, four modes have been considered: suburban trains, here intended as the rail-based local systems intended to supply commuters with frequent connections between peripheral cities or neighbourhoods and the main city centres; subway; trams; and buses. This taxonomy represents the traditional hierarchy of PT systems, in relation to their range of service, their capacity and travel speed, which are typically scaled in accordance with technical and functional characteristics [
17,
58]. However, given that rail-based systems are often hard to classify univocally [
59,
60], especially in the German context [
61,
62,
63], some further explanations should be provided. As a methodological assumption, when uncertainties about the proper category of a given rail-based mode arise, the classification criterion is based on the characteristics and the range of service, rather than technical or normative features. This is particularly evident in Germany, where most of the rail-based systems have been preserved since their foundation and are still operative, albeit with different vicissitudes, and some of them have been constantly expanded and technologically updated. Regarding the Italian context, most of the rail-based systems analysed have been built since the 1980s. However, while suburban trains and subway networks were built ex novo, several cities replaced tram networks with trolley or bus networks and then rebuilt them, following a recurrent trend in Western countries. With regard to trams, it has been acknowledged that their introduction is able to significantly change the structure of the transport market in the hosting city. Today, a ‘tram Renaissance’ can be found in numerous countries, including Italy, while in others, e.g., Germany, trams still constitute the backbone of the transit system in several cities [
64].
Therefore, light rail systems, such as the ‘triangular’ line 5 connecting Mannheim, Weinheim and Heidelberg and the ‘tram-train’ [
65] systems (e.g., in Karlsruhe, Kassel and Cagliari), as well as the commuter trains in most Italian cities, are counted as suburban trains, while the German ‘Stadtbahn’ systems (e.g., Frankfurt, Hannover and Stuttgart), the suspended railway ‘Schwebebahn’ in Wuppertal, automated subway networks (e.g., line M1 in Torino, line C in Roma and lines M4 and M5 in Milano) and the cabled people mover ‘Minimetrò’ in Perugia are accounted among the subway systems. Regarding trolleybus networks, they have been considered analogous to bus systems, while rubber tram systems in Padova and Venezia have been considered among the traditional trams.
3.1.2. Regulatory Framework and Policy Initiatives to Enhance the Competitiveness of PT—Fare Integration and Clock-Face Scheduling
Fare integration is a policy-related measure that allows customers to use two or more transport modes by buying a single ticket [
16], regardless of the operator. The introduction of an integrated fare scheme can be applied at a wide scale, such as subnational administrative units and entire regions, or to cities only. Therefore, integrated fares may be applied with different zoning systems [
22]. With regard to clock-face scheduling, or regularity of service, in this research the term is intended as the implementation of a structured timetable, where scheduled departures are planned at fixed and cyclic intervals. Hence, the concept is not related to the reliability of the PT service [
66,
67,
68,
69], which can be considered as the capacity to adhere to the schedules, and therefore is usually a pivotal target for PT agencies and authorities to ensure an adequate competitiveness of service. In contexts where regularity in scheduling is a common practice, most of the modes are scheduled with a regular rhythm and ultimately coordinated, thereby enhancing the modal integration and hence creating an integrated system [
34]. Thus, the introduction of both fare integration and clock-face scheduling is intended to explore whether their operationalization and the coordination of different tariffs and PT modes into a single, integrated system could positively inform PT patronage, thus constituting additional factors within the MC framework. In light of the heterogeneity observed between the two countries and cities with regard to the normative frameworks, as well as to the fare schemes employed, dummy variables were calculated, with cities where a single fare scheme and a regular pattern of schedules are present equalling 1, and 0 elsewhere.
3.1.3. Where PT Operates—Diversity in Land Use
The role of the built environment in transportation and mobility matters has been widely investigated, primarily in terms of the type and the form of the cities [
70], although with few comparative analyses. In this research, an entropy measure, namely the land use mix (LUM) is included among the candidate factors. Indeed, the use of disaggregate indicators, such as the number of employees or working and economic activities, may be inadequate in similar analyses, in case of shortage of homogeneous data. In contrast, as a proxy for land use, LUM provides a synthetic and comprehensive evaluation of the urban form characterizing the analysed city, thus testing whether the mixture of functions settled across the city, such as working places and residential areas, and their relative density, may be considered informing factors of PT usage. This can be considered a relevant premise, given that PT should provide adequate and universal supply across the designated service area [
68]. LUM is calculated as follows (Equation (3)) [
54,
71]:
where
is the proportion of land area devoted to a specific land use
j, and
J is the number of distinct land use categories. It ranges from 0 to 1, where the higher value, the higher the diversity in land use. To calculate it, data related to the land use has been extracted for each city from the OSMLanduse dataset [
72,
73] as a raster file and then manipulated with pertinent algorithms in a GIS environment.
3.1.4. How PT Is Portrayed—Characteristics of Maps Representing PT Networks
Conventionally, the first and most organic representation of a PT network is the map of the London Underground, designed by Henry Beck in 1931 [
74,
75]. Today, most cities around the world provide users with a representation of the PT network [
76] with different levels of schematization [
77]. Maps can be considered a medium conveying static information about travel options, provided by PT agencies and authorities in printed or electronic form. In these terms, the presence of a map can be considered among the symbolic elements of MC, as it is an amenity that can potentially enhance the quality of passengers’ experience [
78,
79]. As a map usually conveys several of information and symbols [
19,
80], it has been acknowledged that designers should ensure usability [
81]. Furthermore, as previously acknowledged by Morrison [
20,
82,
83], it is possible to derive ‘national’ styles of maps, thereby positing that the representation of PT may follow local standards, collective norms and informal conventions. In light of the inherent complexity in operationally and synthetically describing the characteristics of maps, a synthetic index is proposed, and calculated as follows (Equation (4)):
where
represents the number of modes represented by the map, and
is the number of modes supplying the examined city. The proposed ratio is aimed at synthetically representing the complexity of the representation of a PT system, where the higher the ratio, the higher the complexity of representation. In fact, given that users’ knowledge and awareness of PT characteristics may differ in terms of expertise and frequency of use, Grotenhuis et al. [
84] argue that travel information should be effectively provided at each phase of travel, thus reducing the time and the mental effort spent understanding the information conveyed by the medium.
4. Results and Discussion
This section delves into the results. As anticipated in
Section 3, a comparison between a global model, namely MLR, and the local model from GWR is performed [
43]. Regarding MLR, some variables have been log-transformed to avoid non-linear relationships causing a skewed distribution [
47]. The models are compared with the Akaike Information Criterion (AIC), where lower values indicate a better performance [
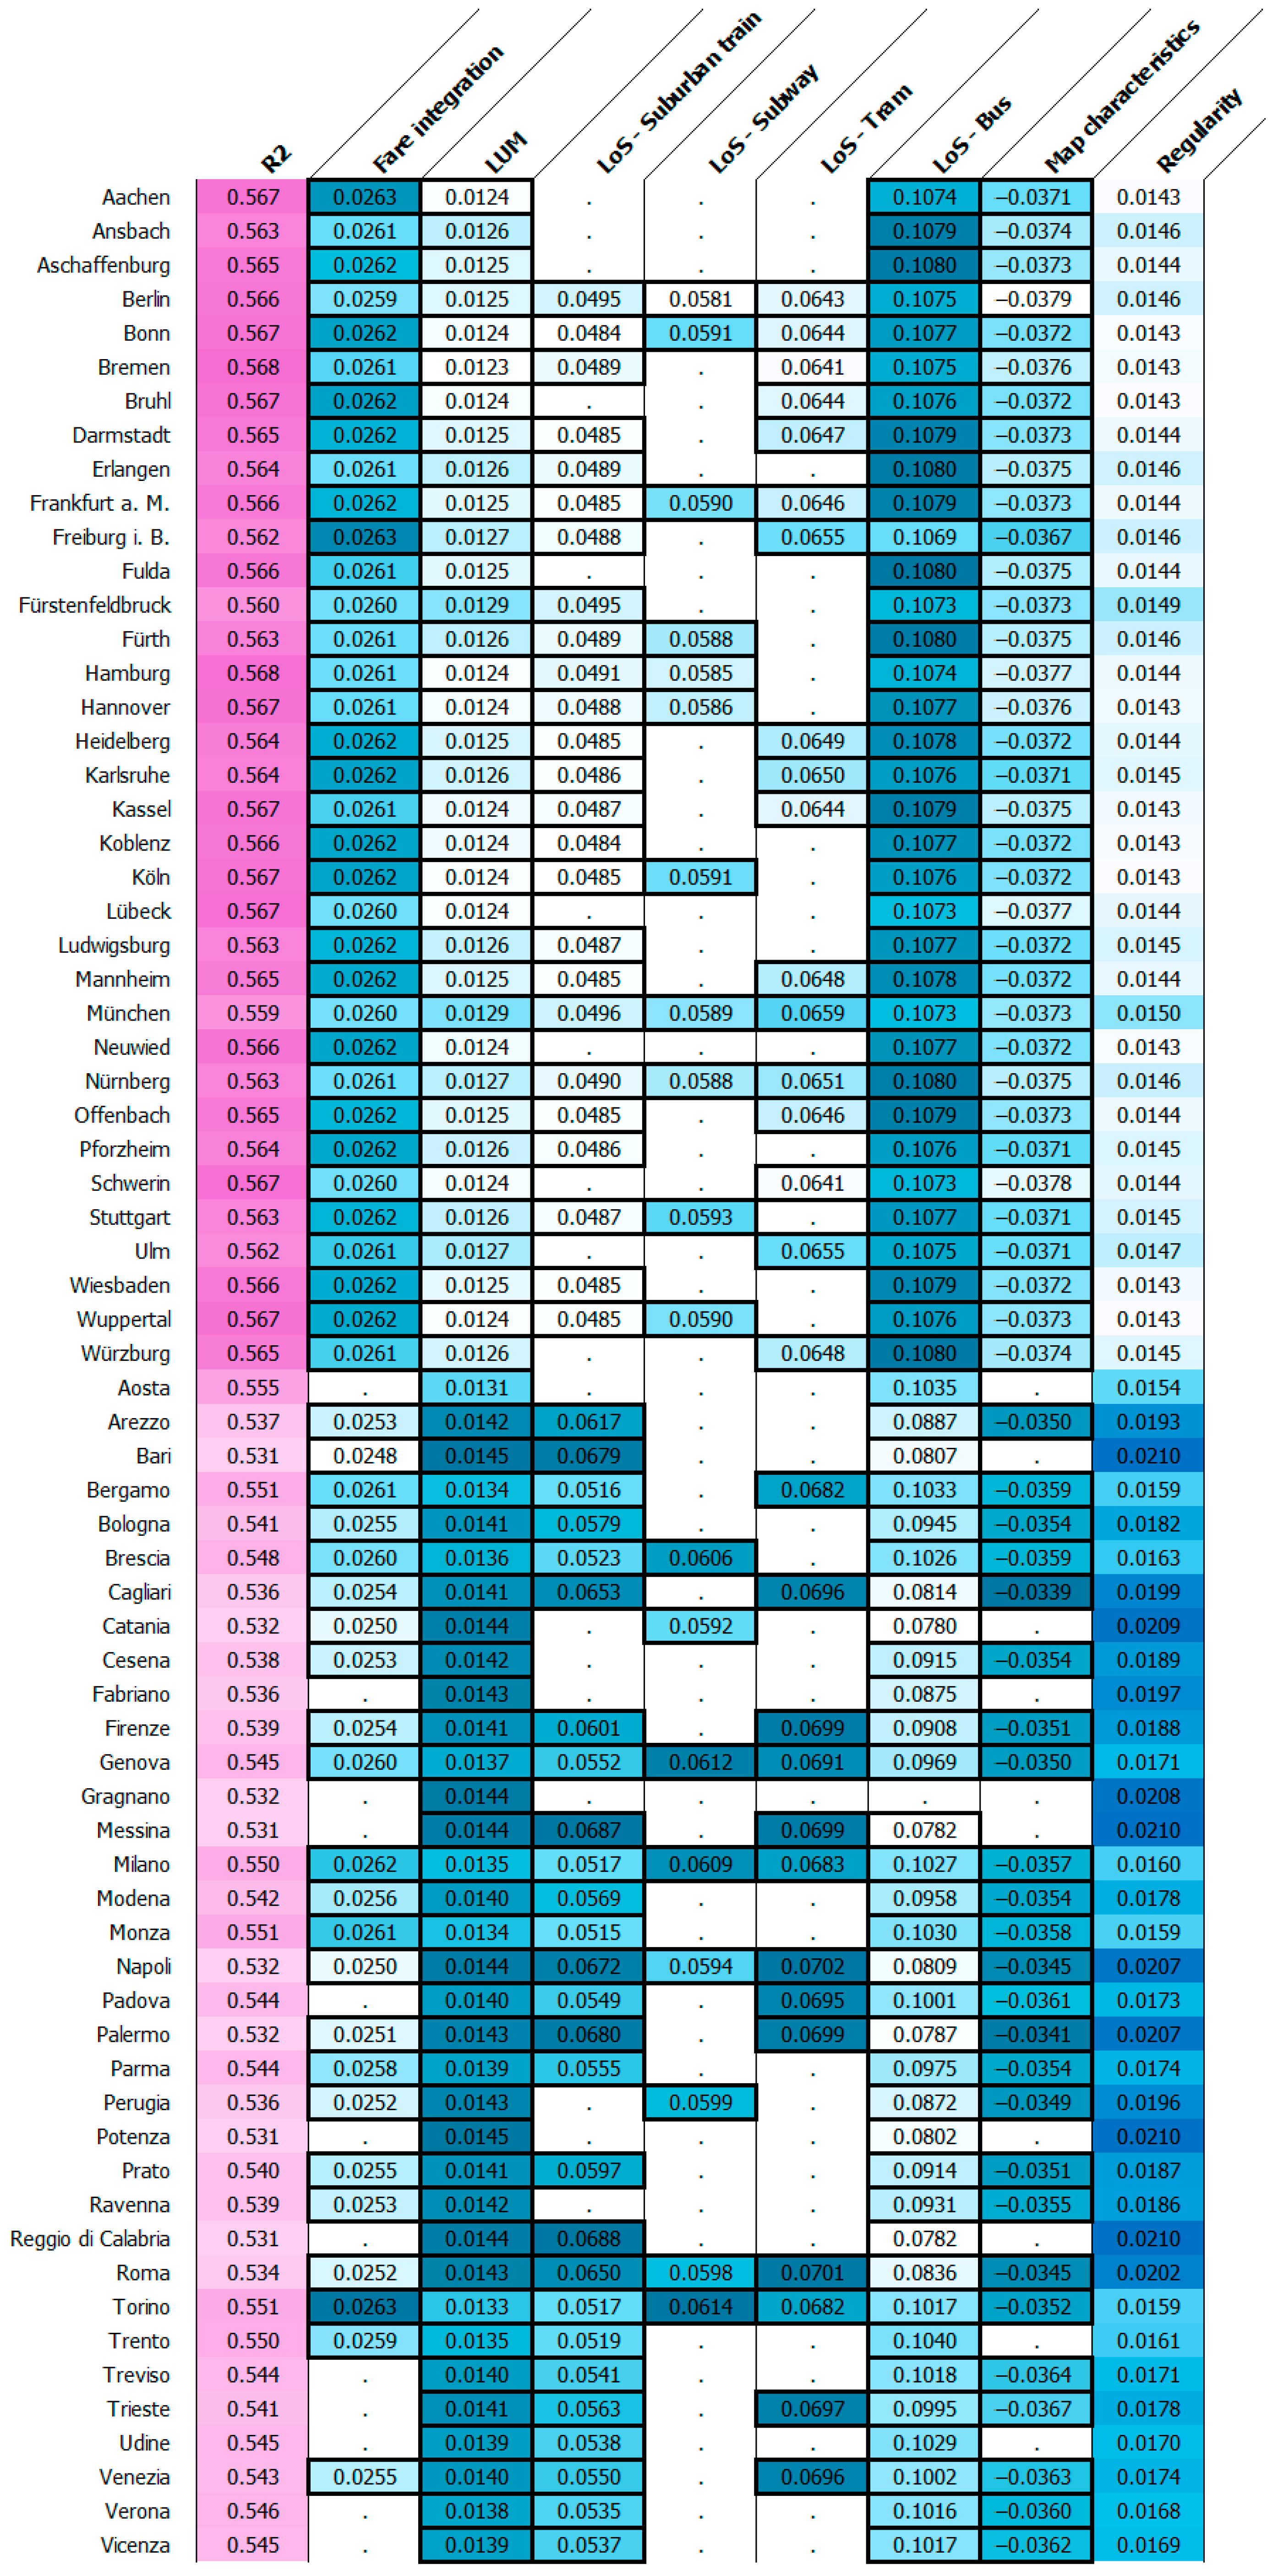
48]. The results of MLR and GWR are reported in
Table 3 and
Table 4. GWR outperforms MLR, thereby confirming the validity of the proposed approach. While MLR provides global estimations, GWR allows local analyses; therefore, coefficients (
β) and the related significance measure (
p-value) have been reported in
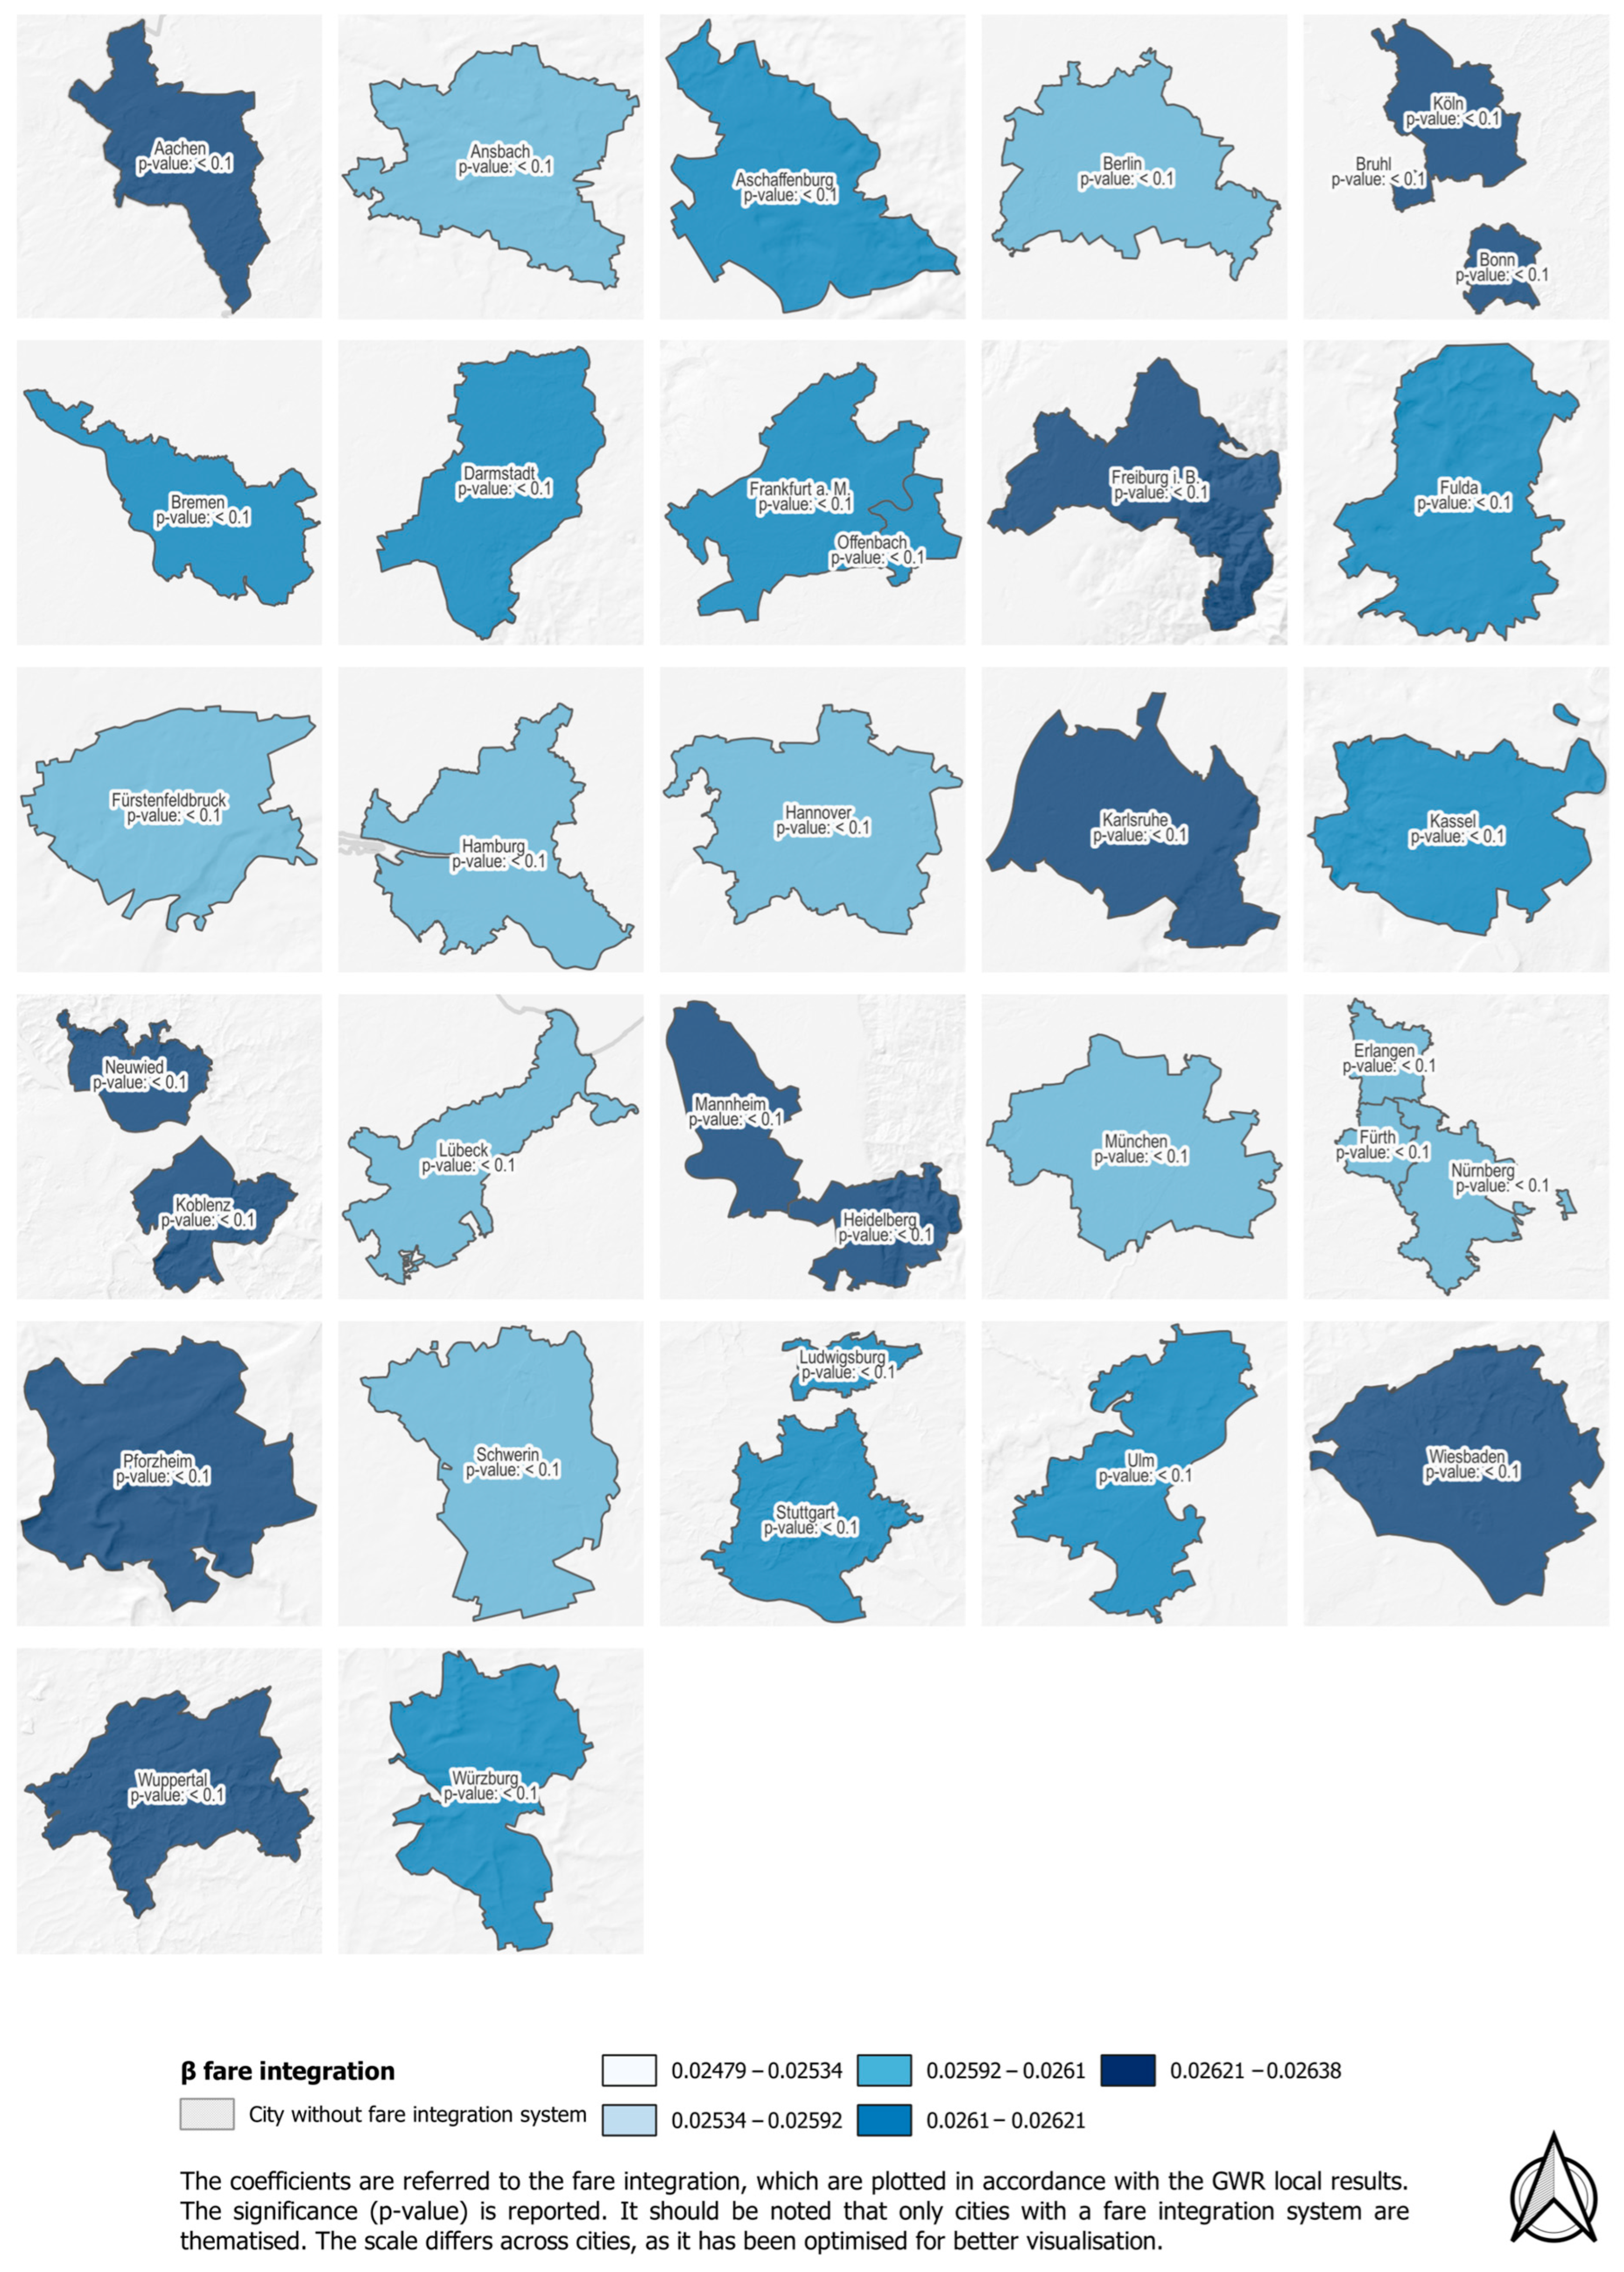
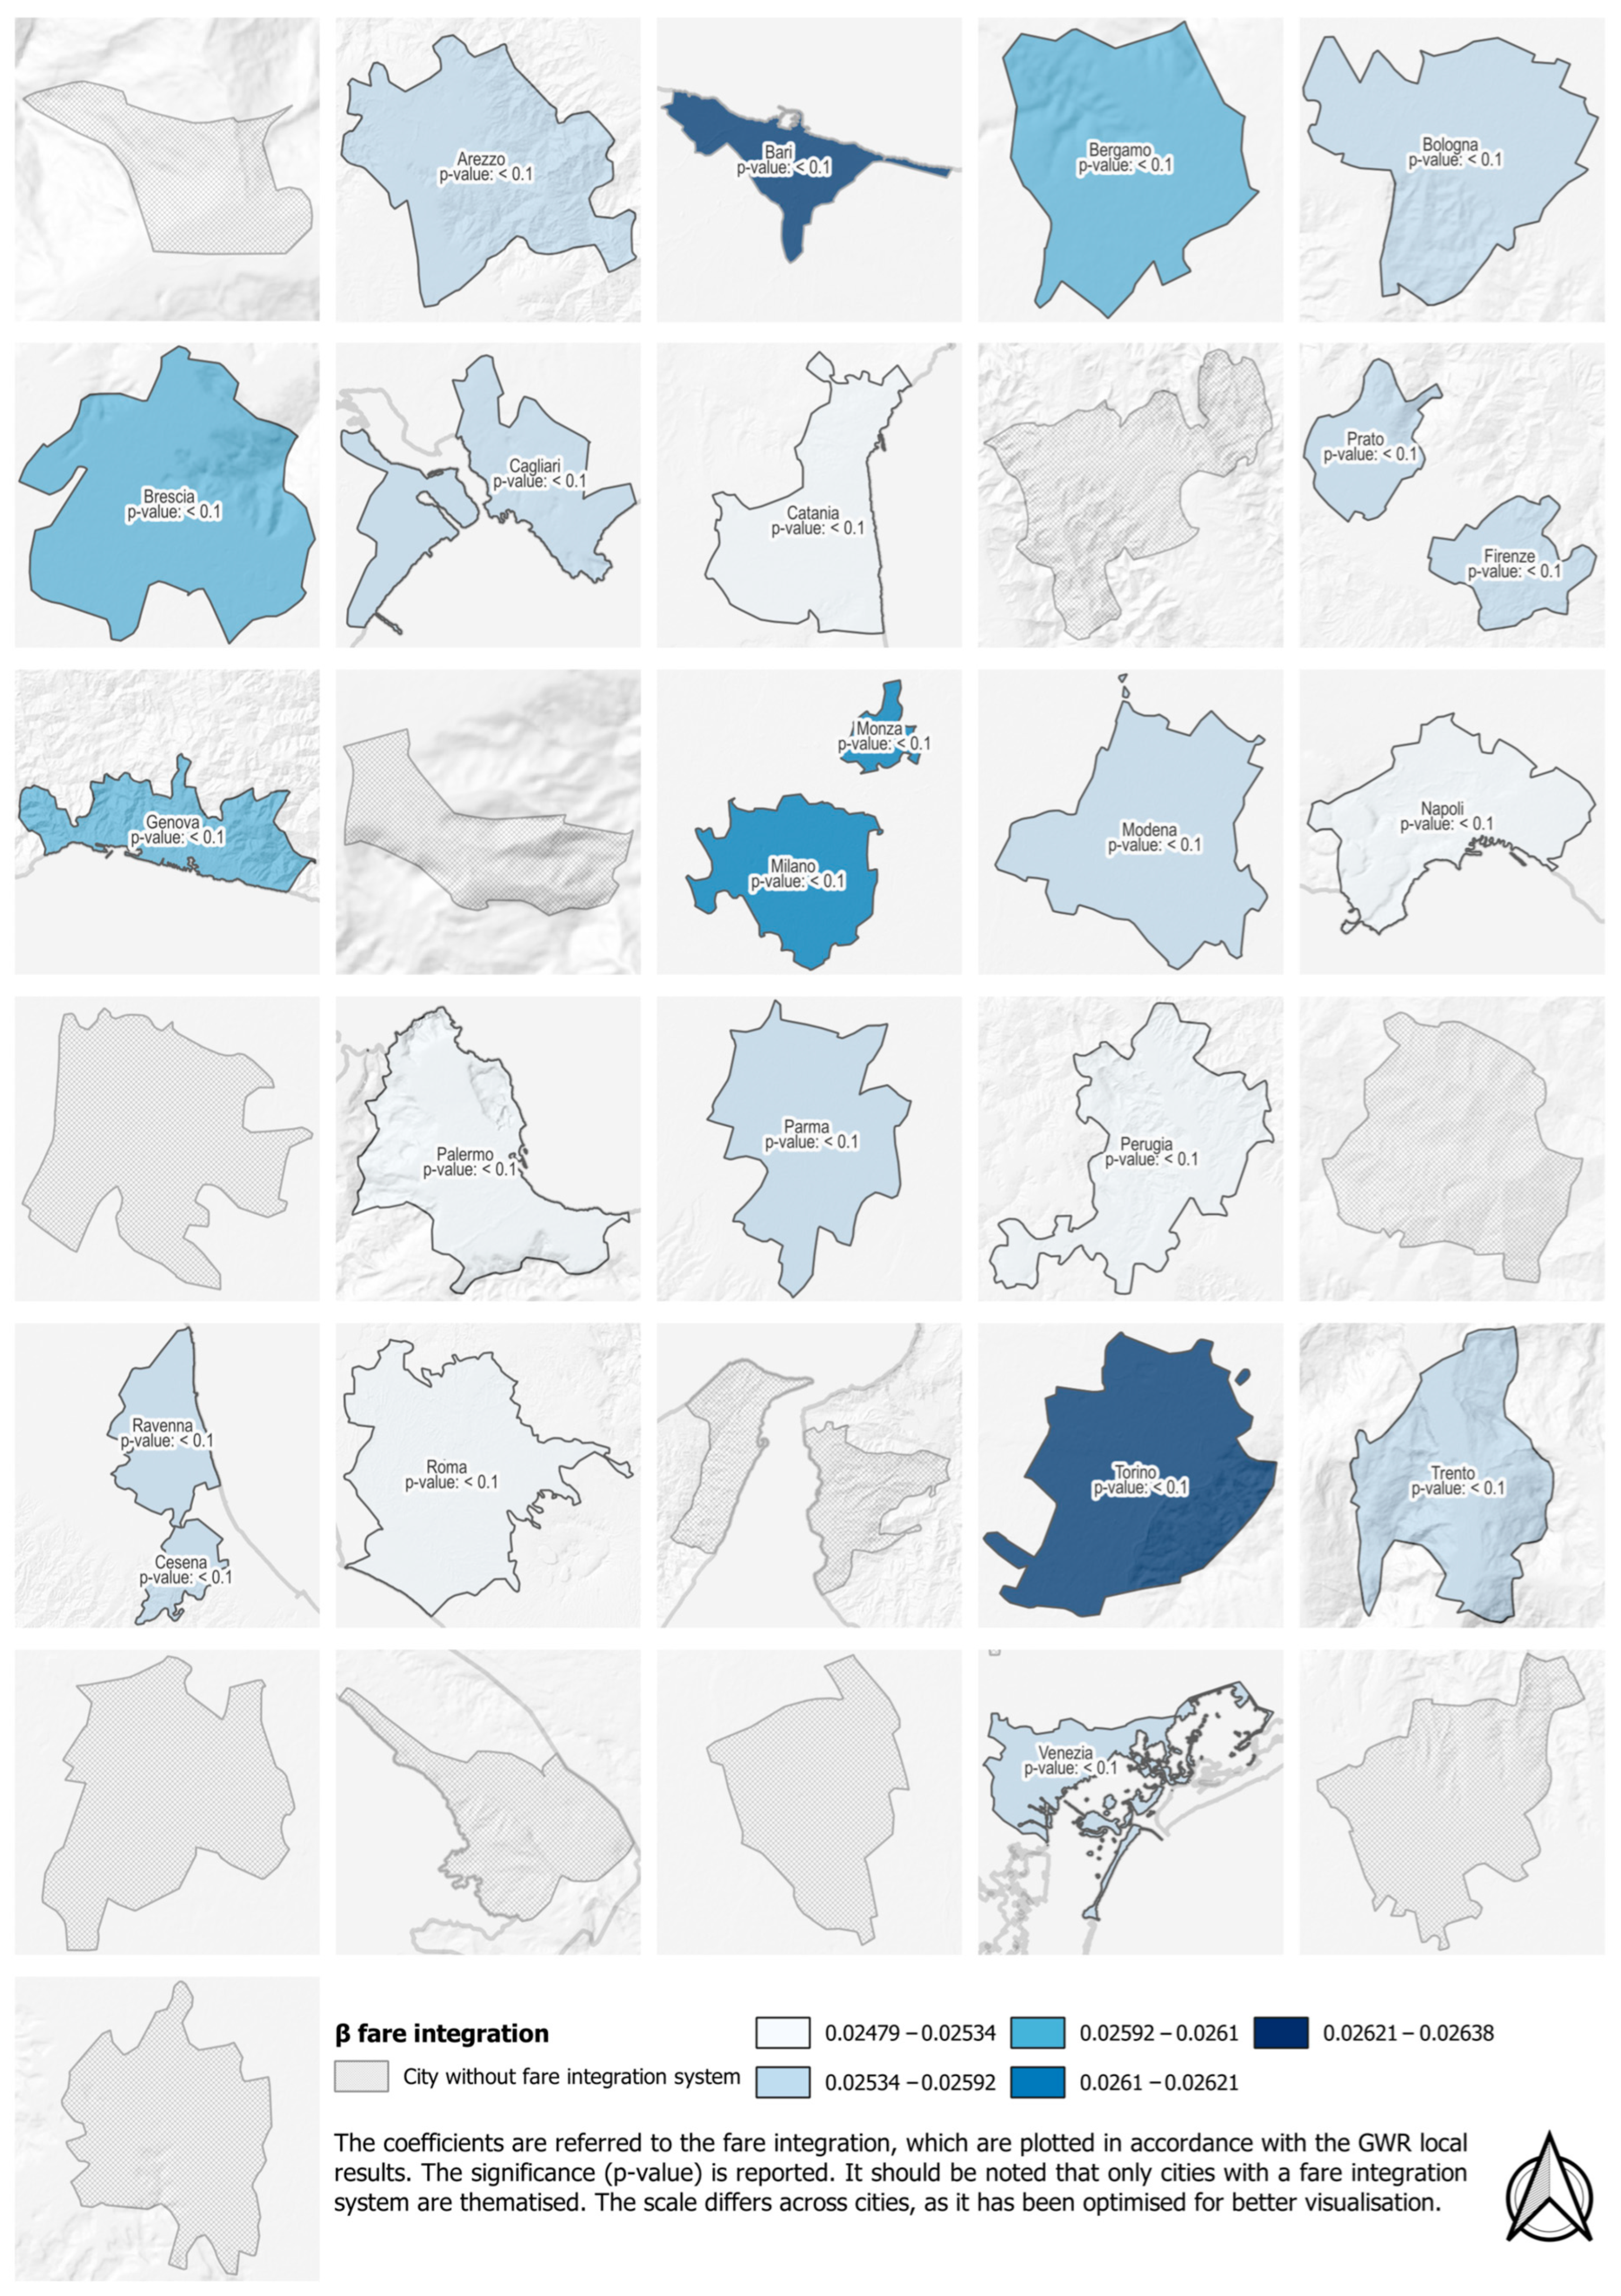
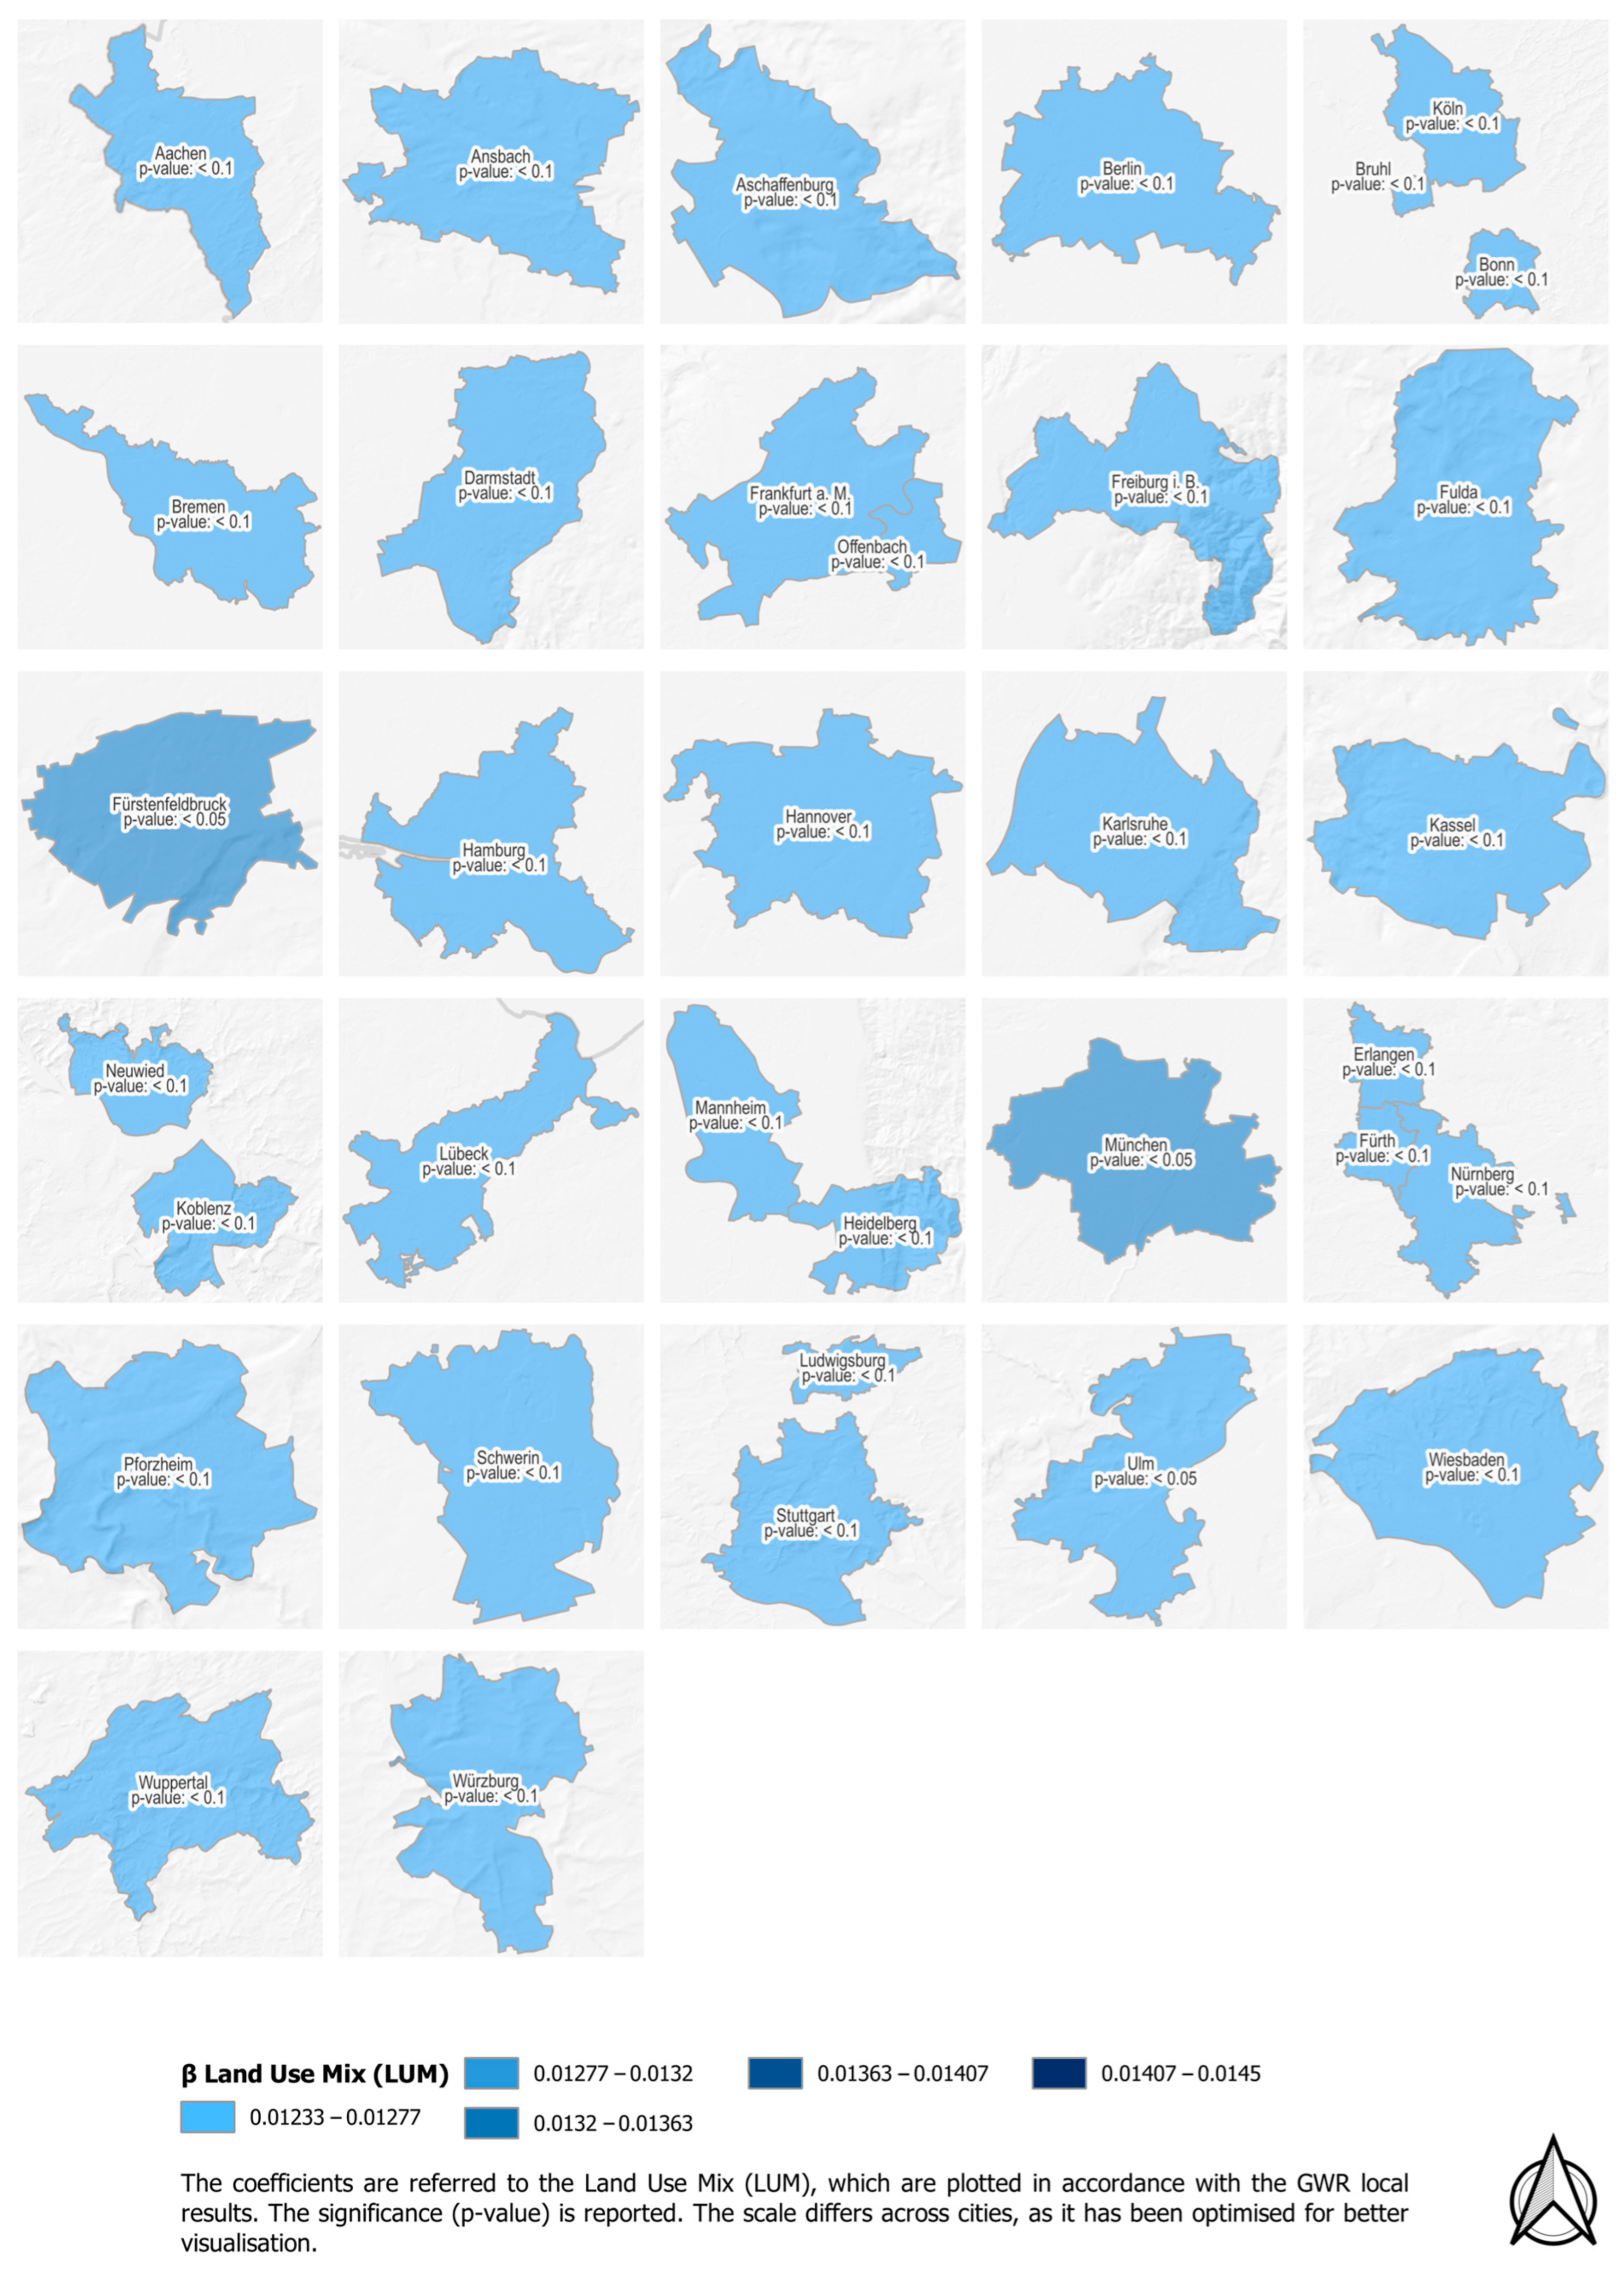
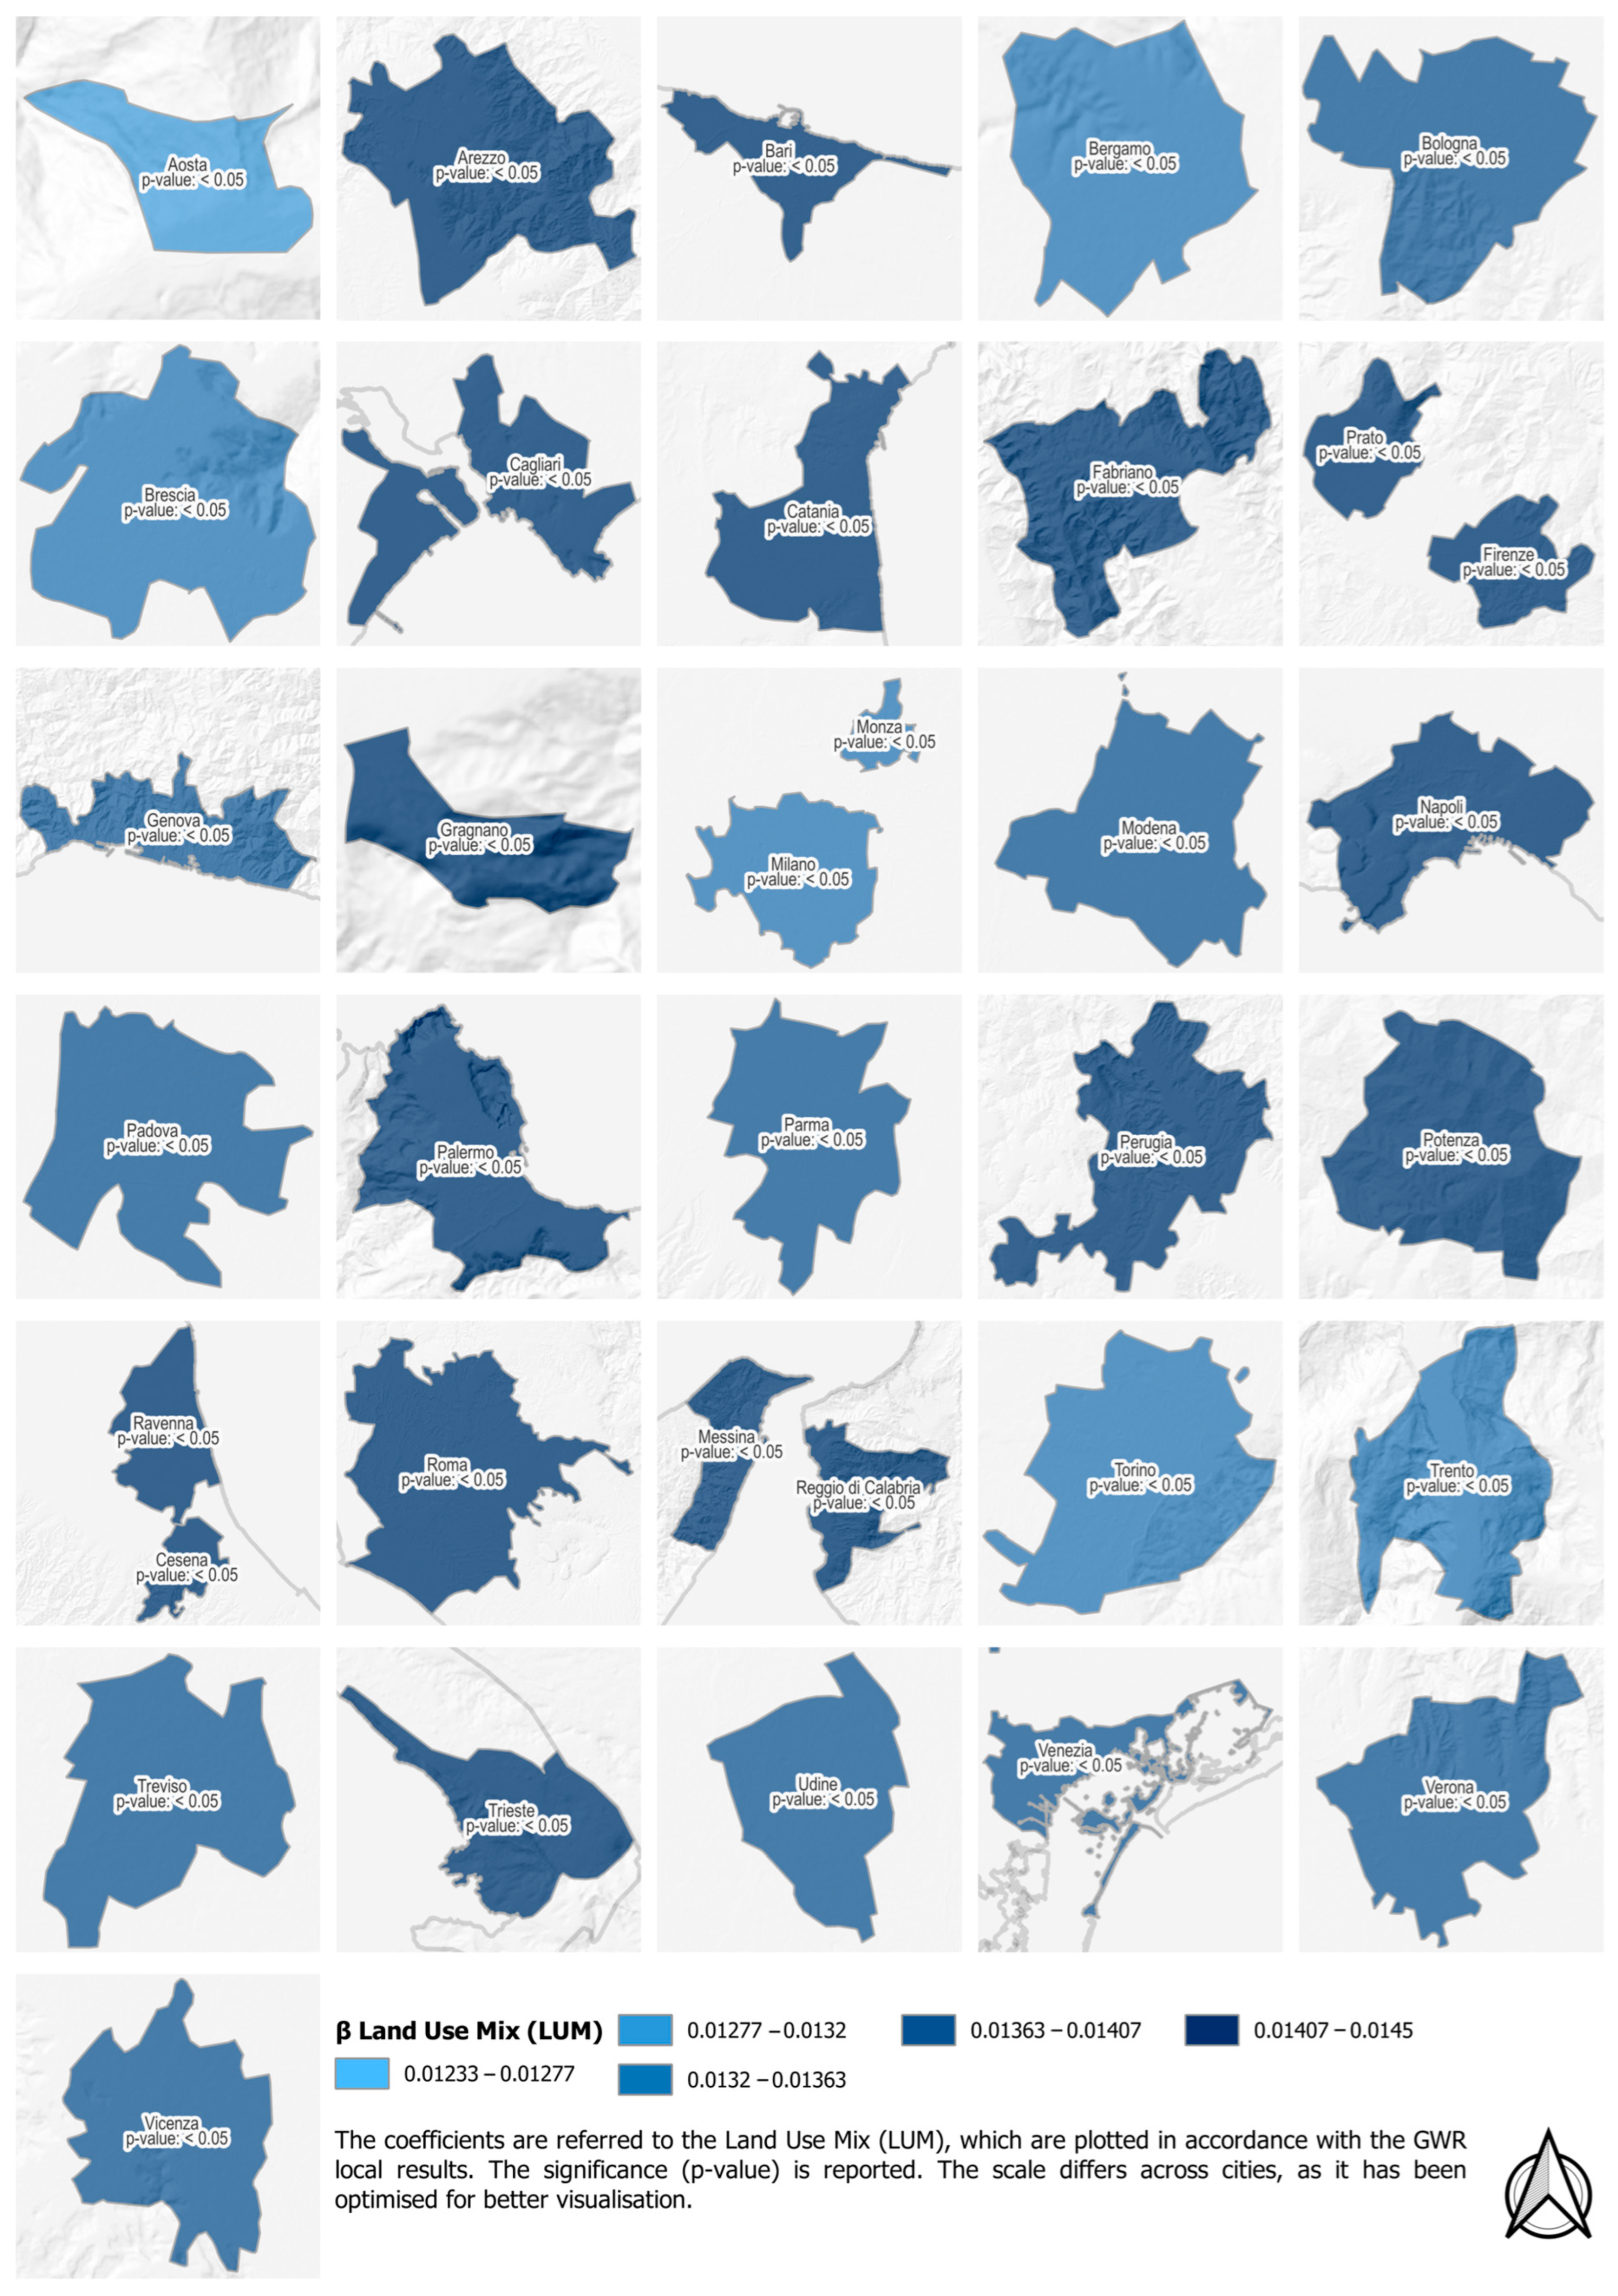
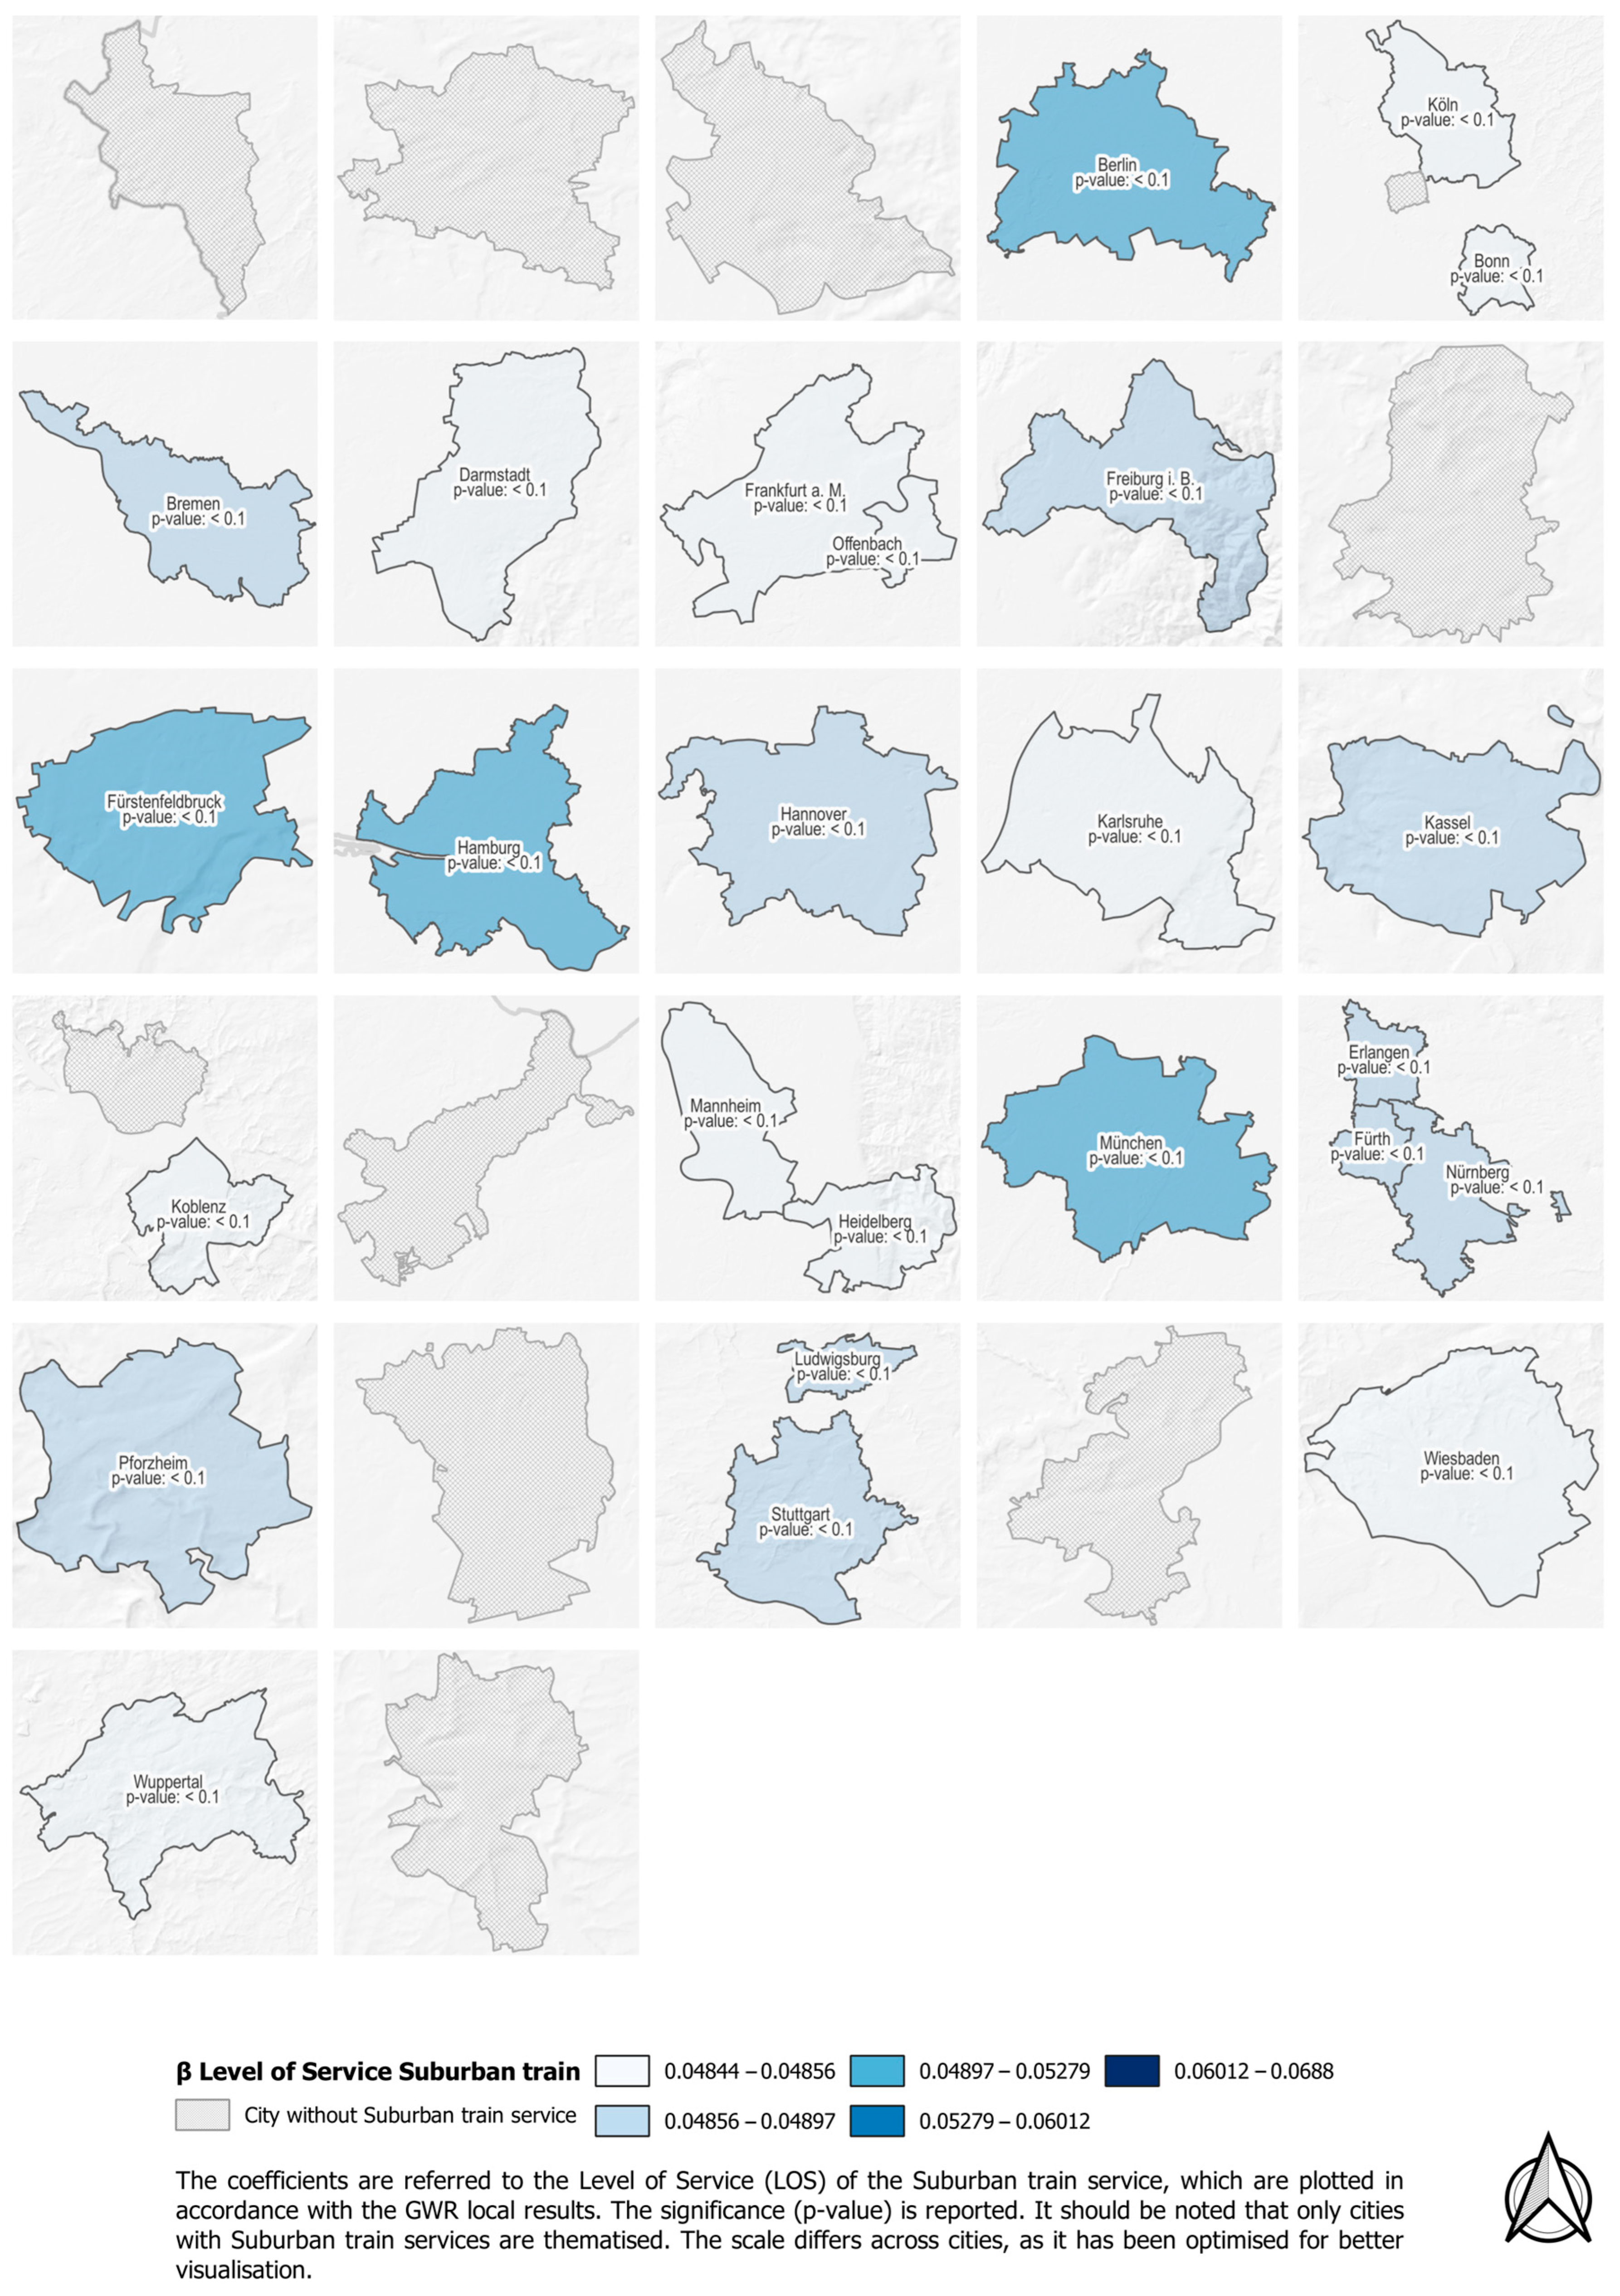
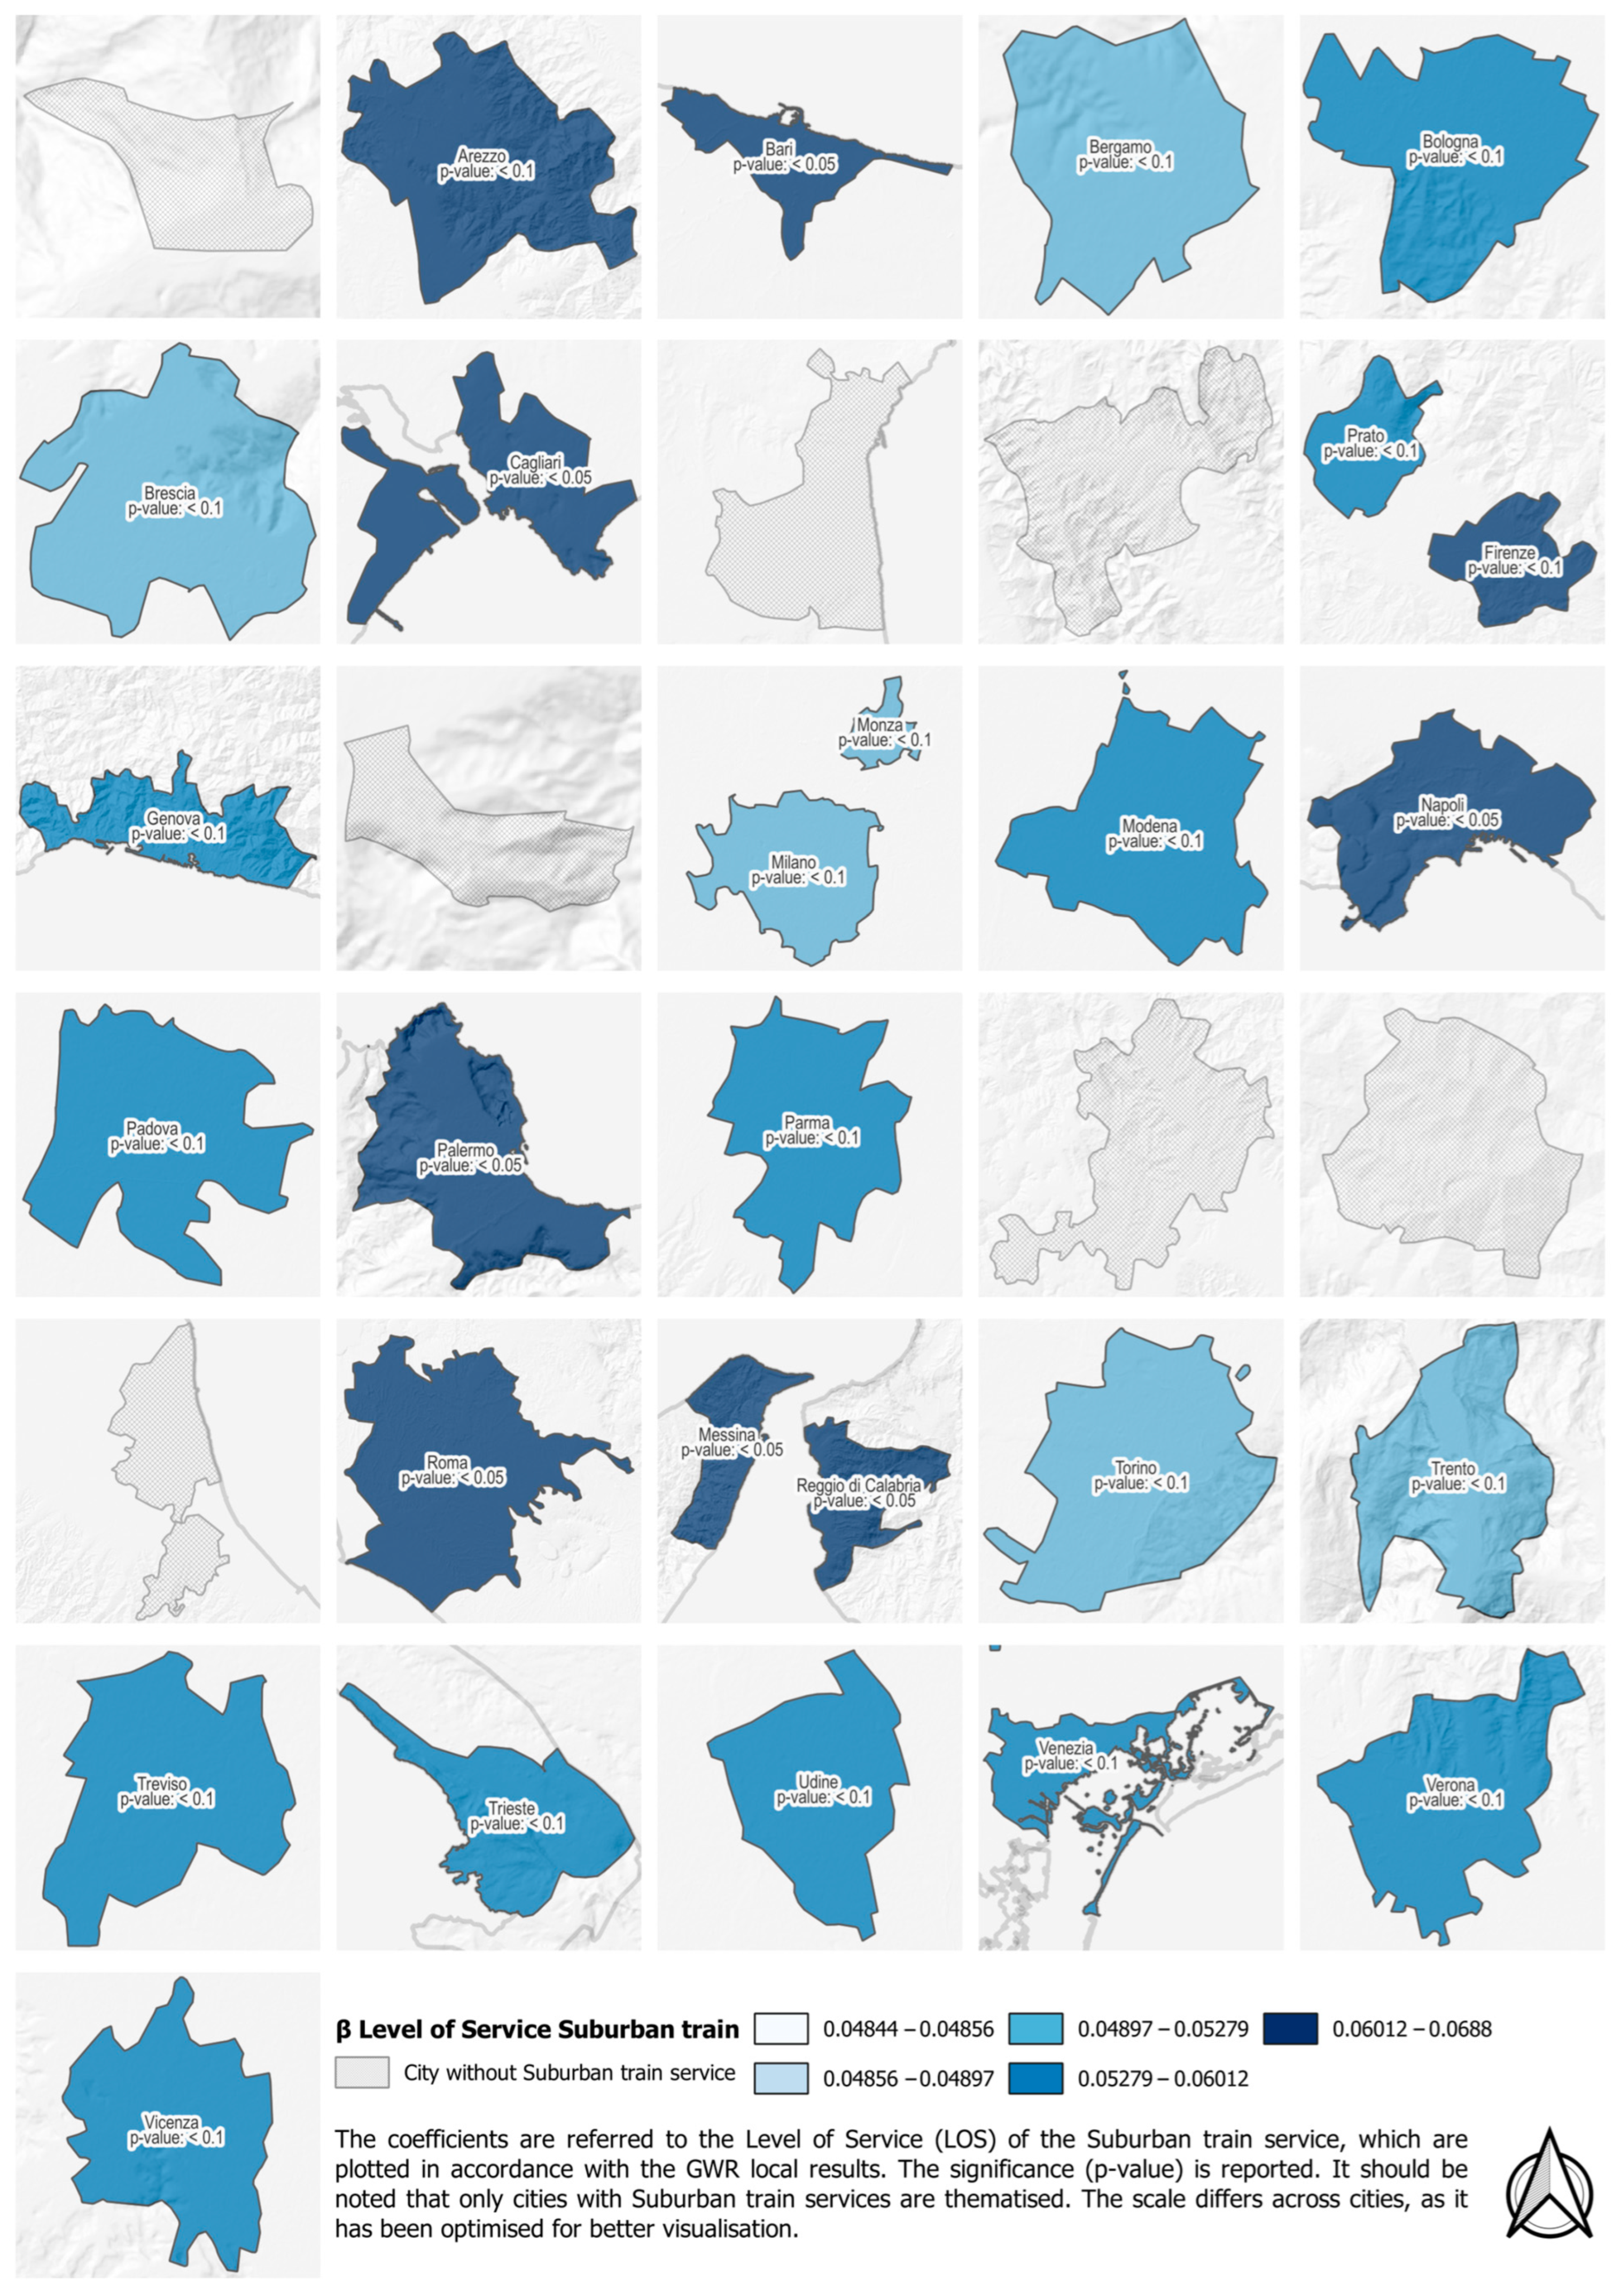
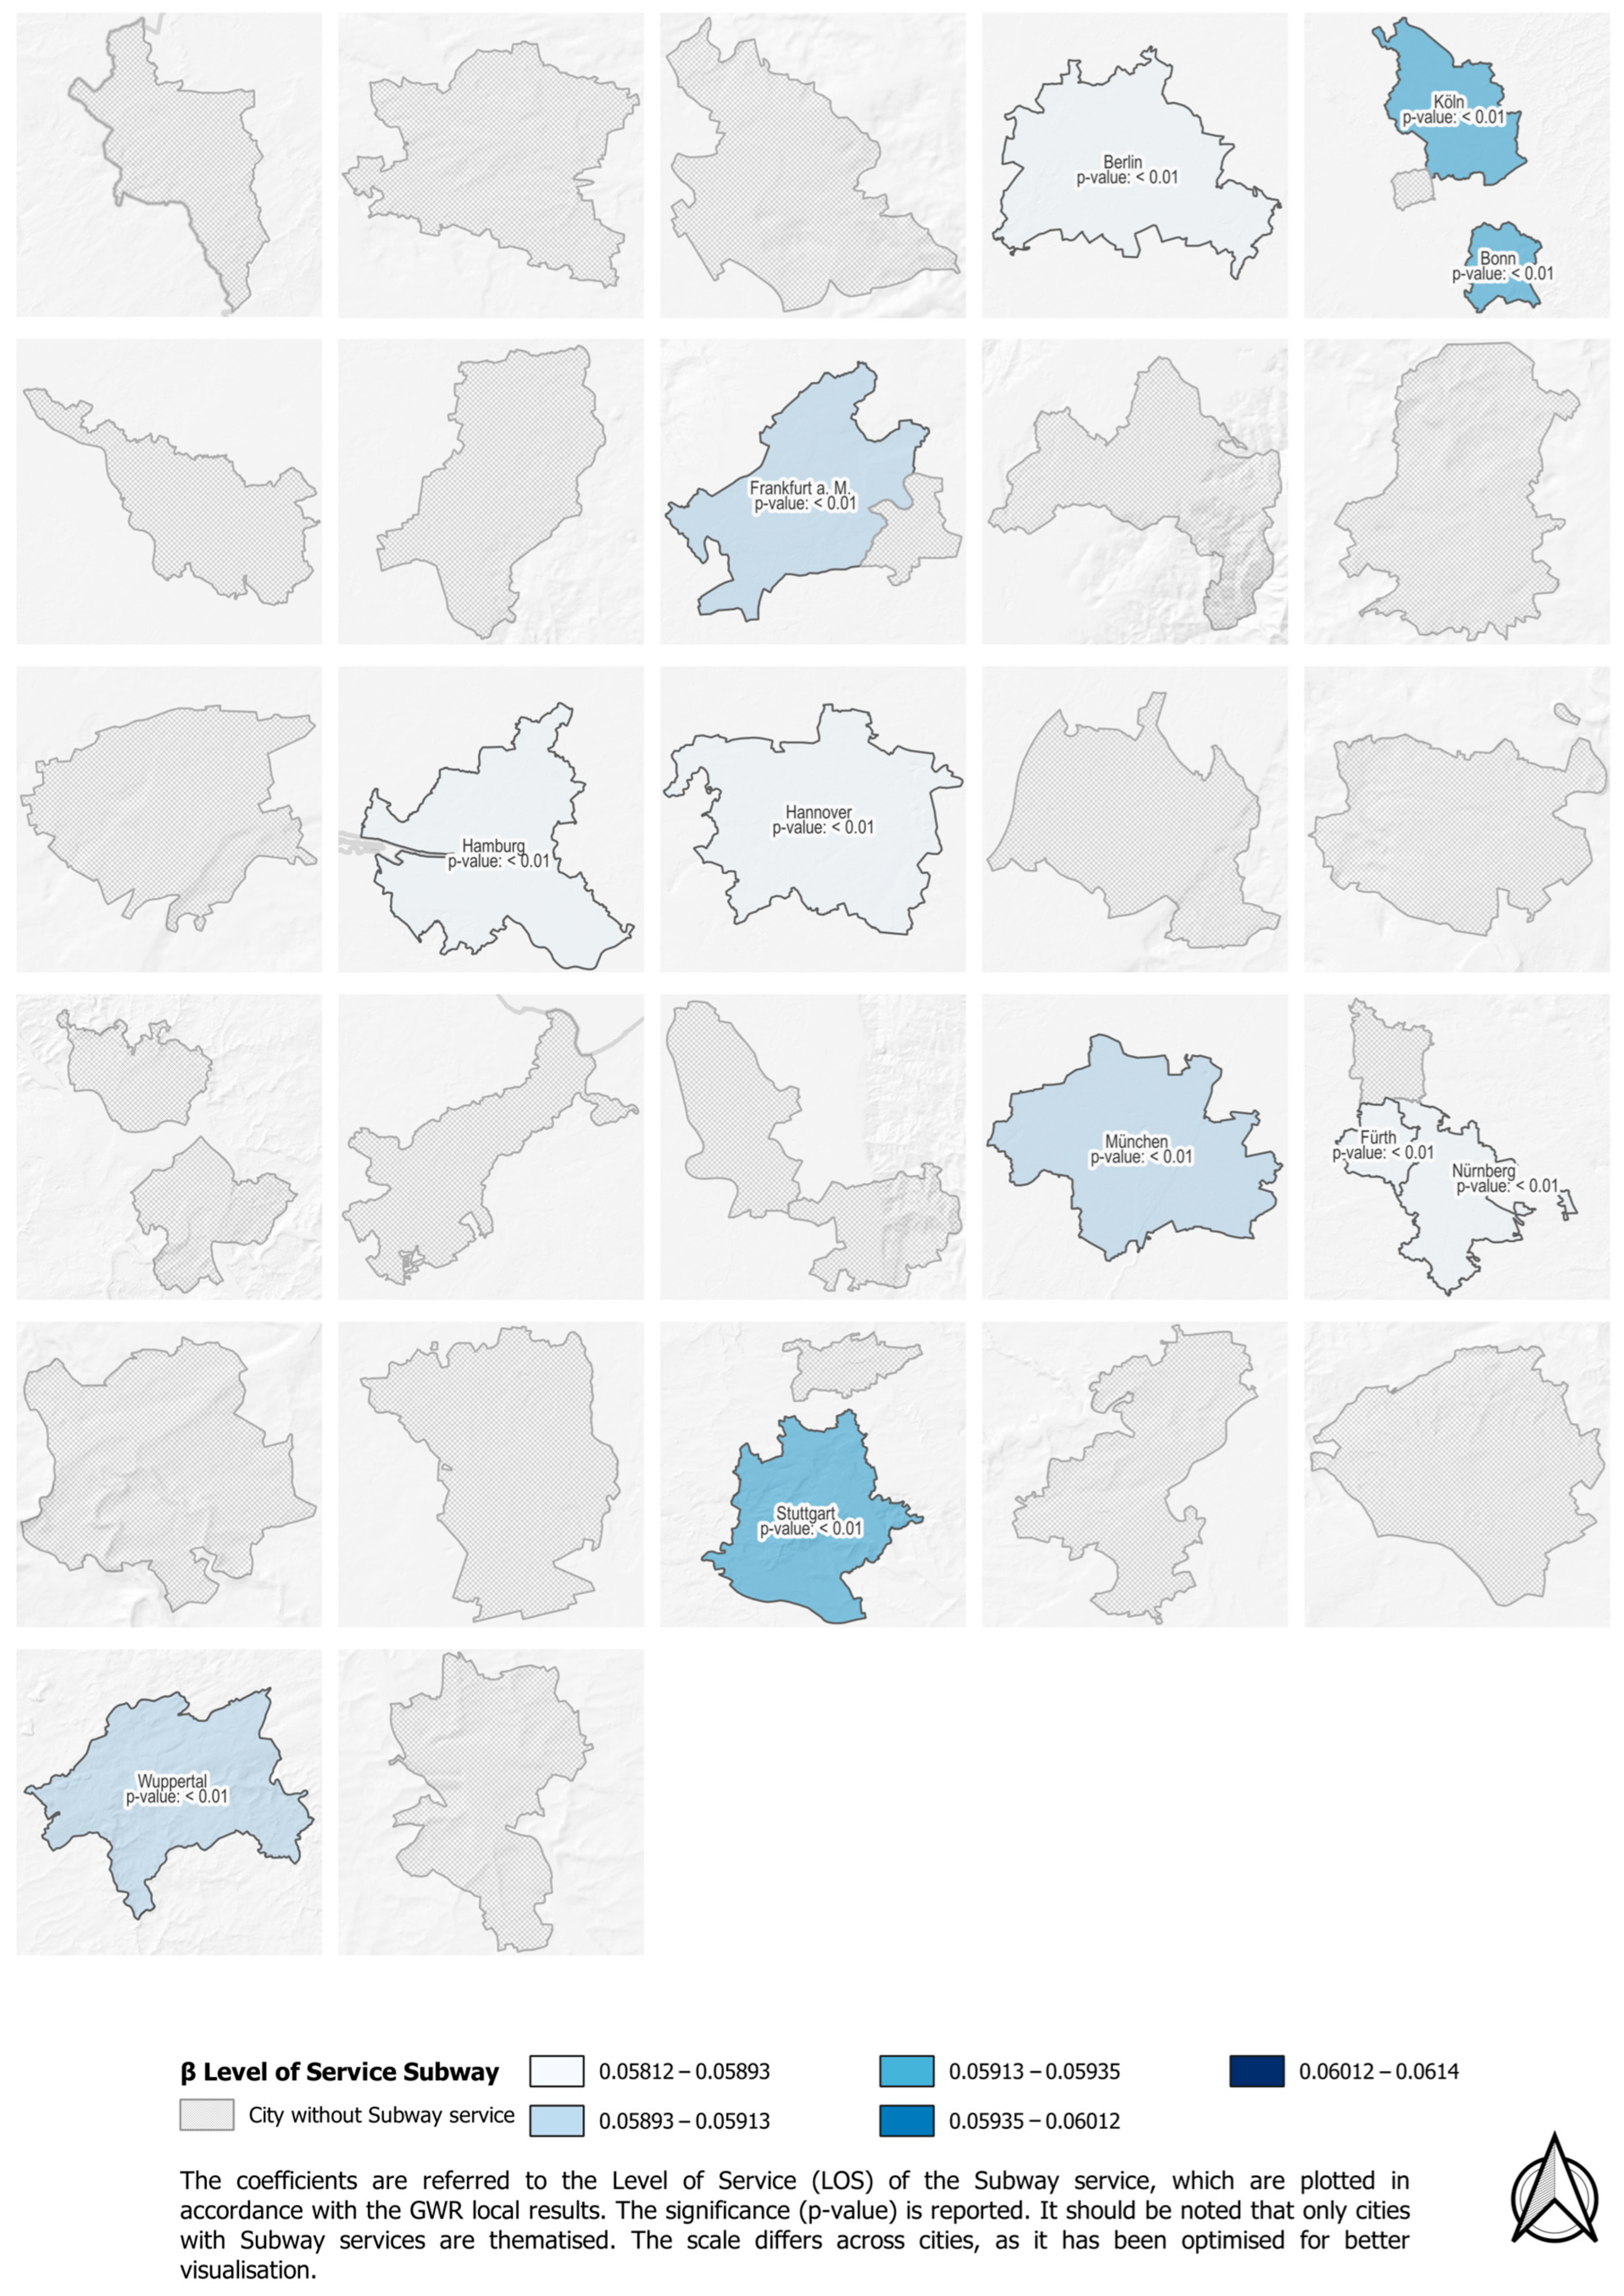
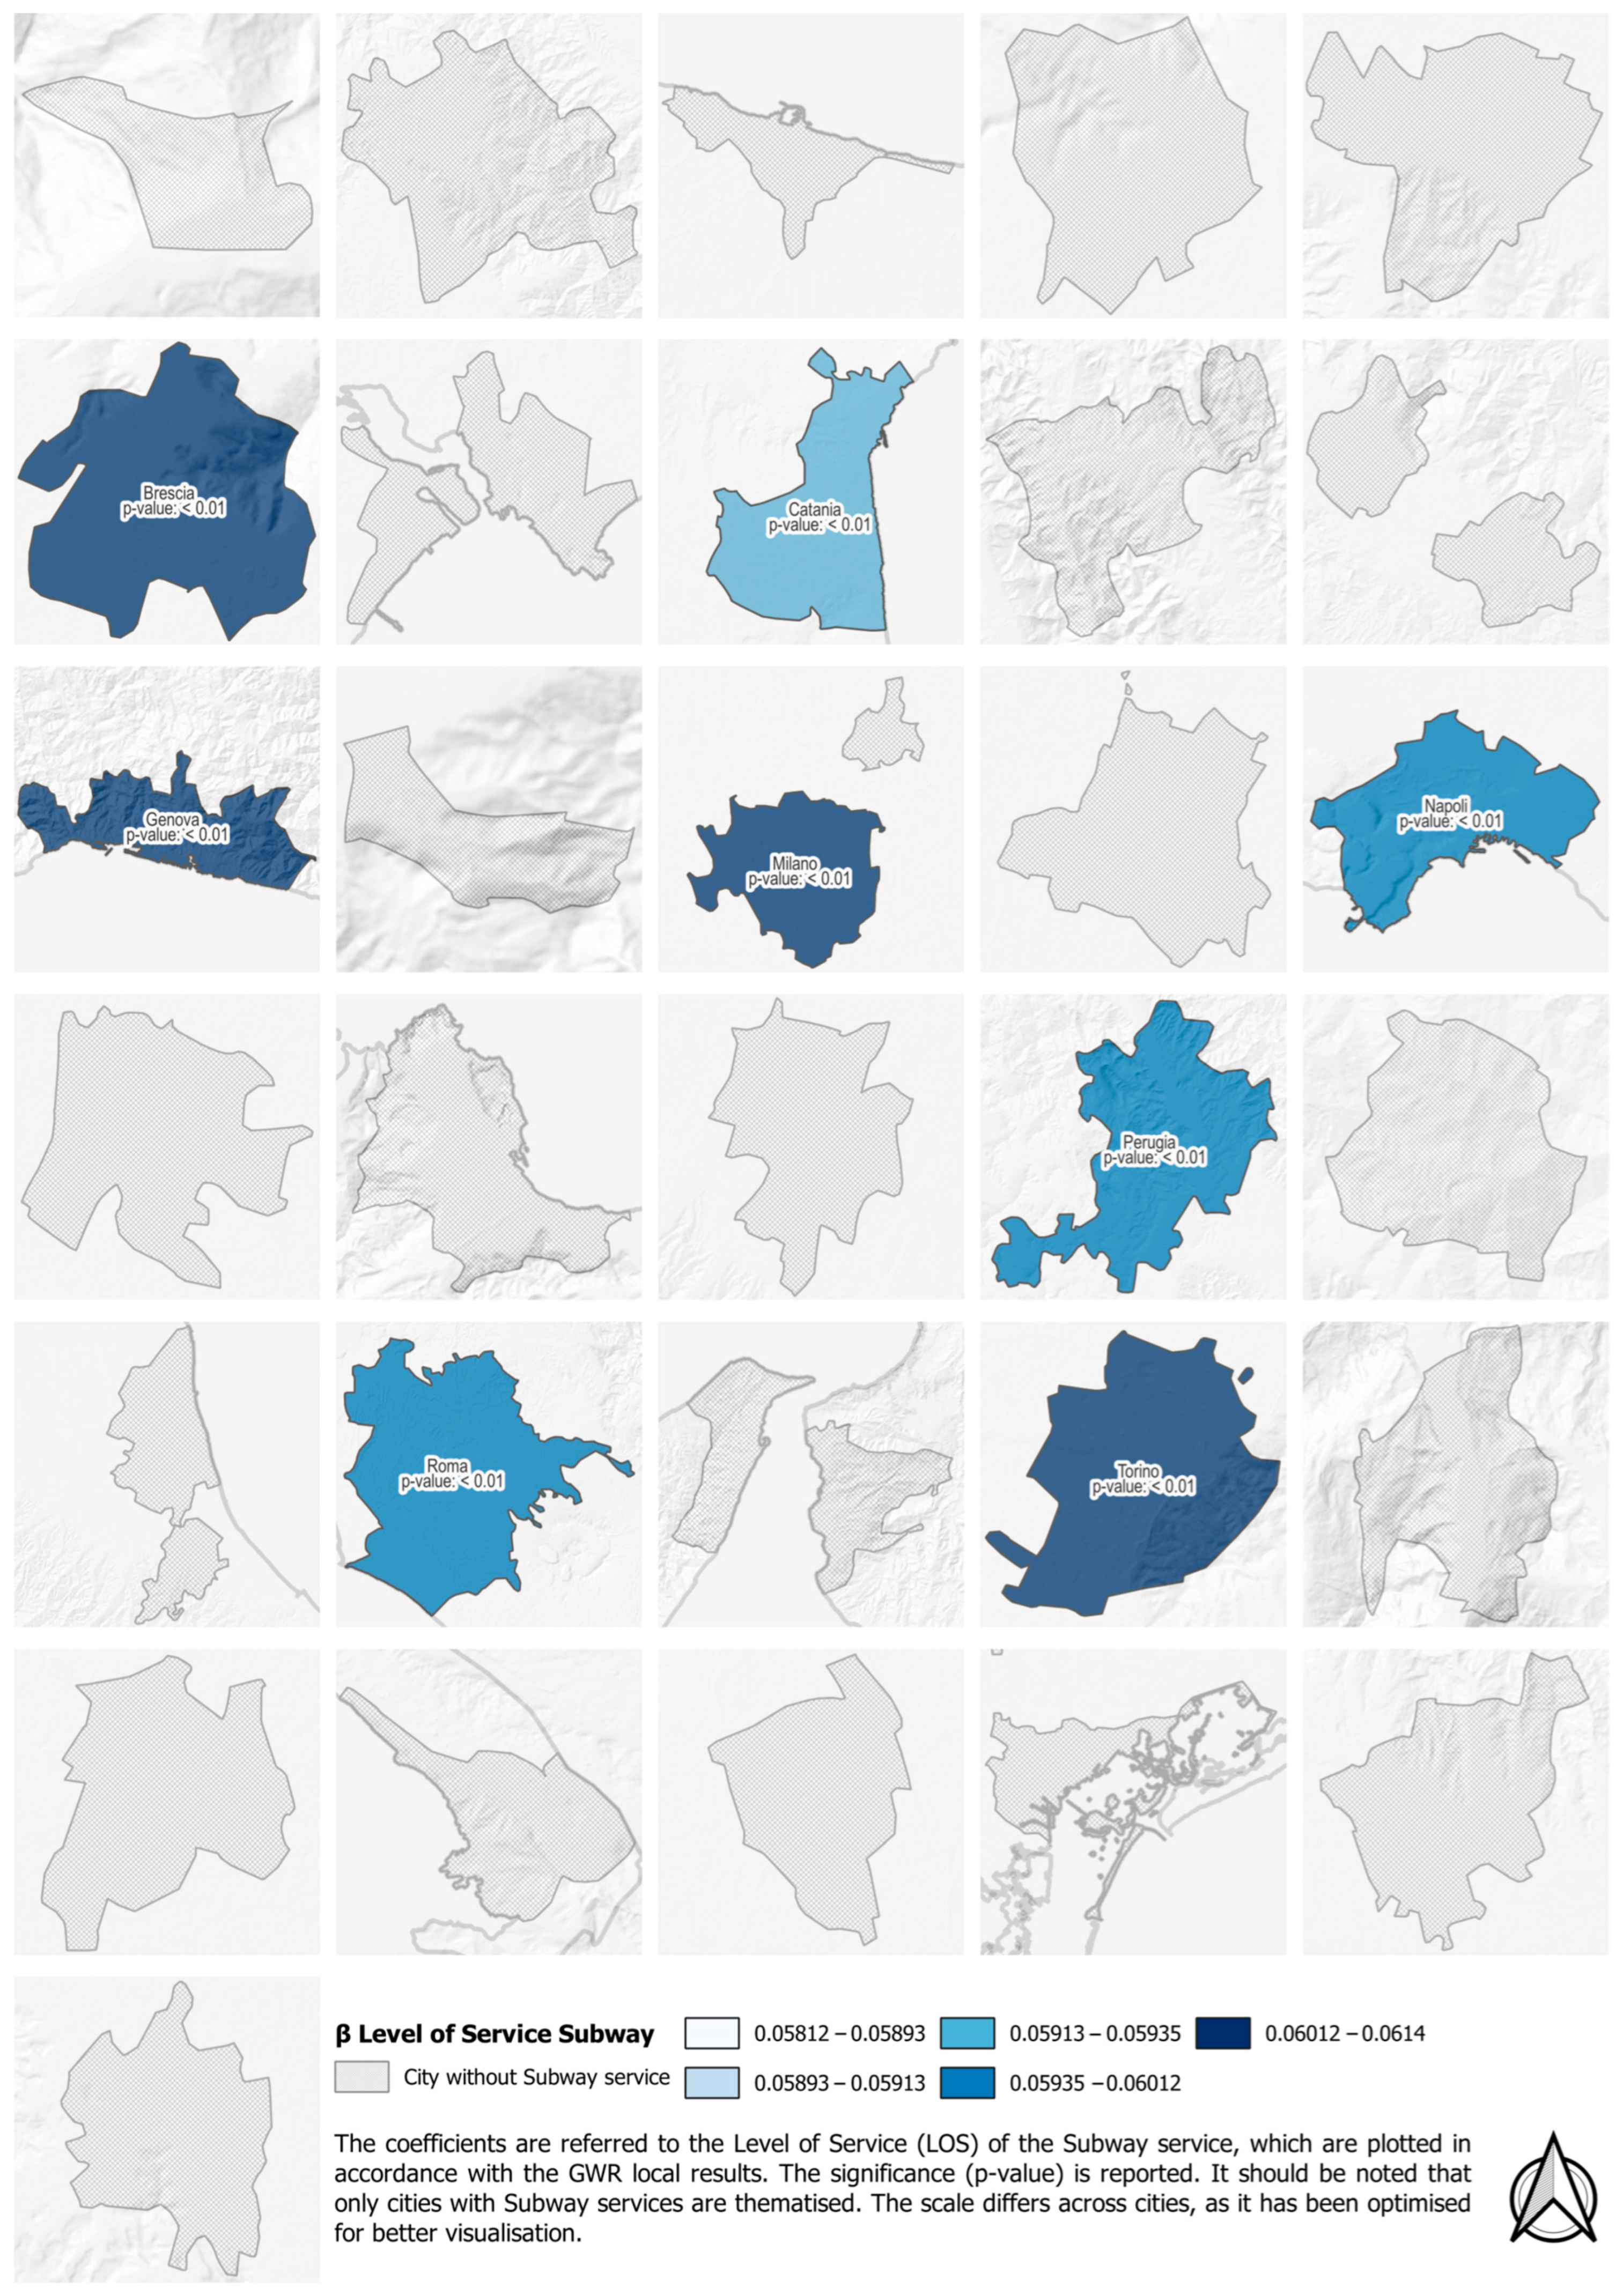
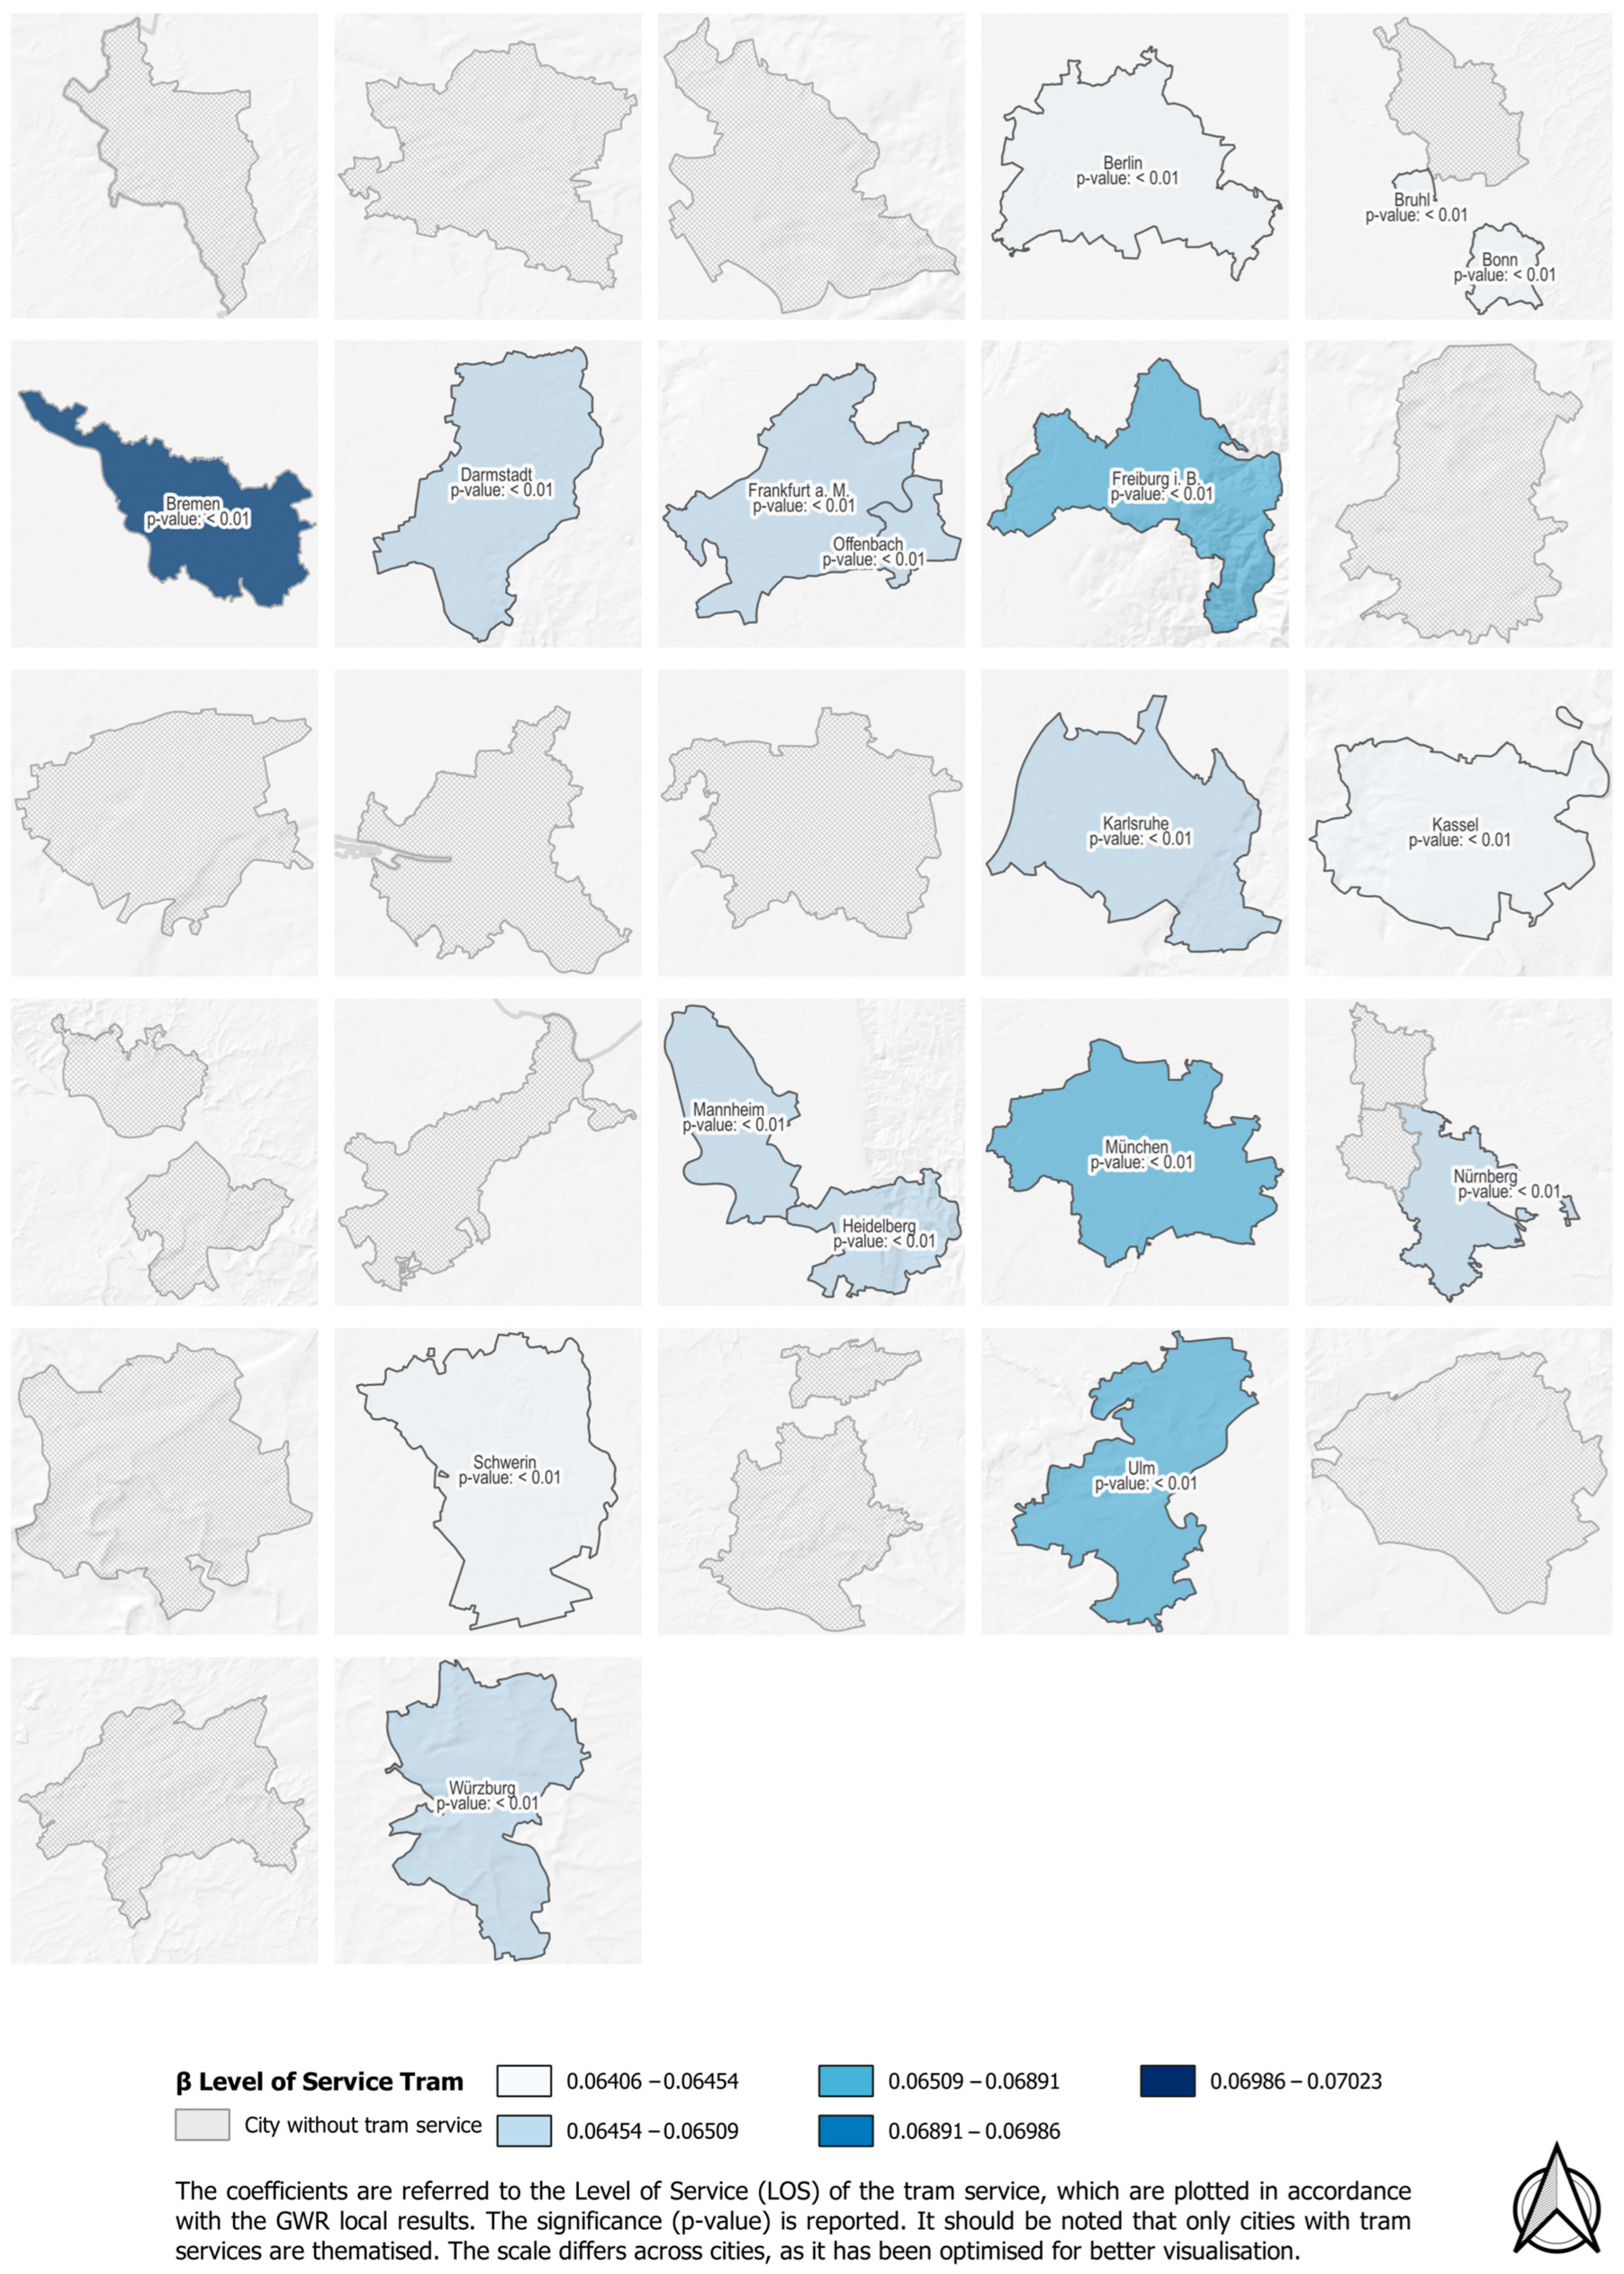
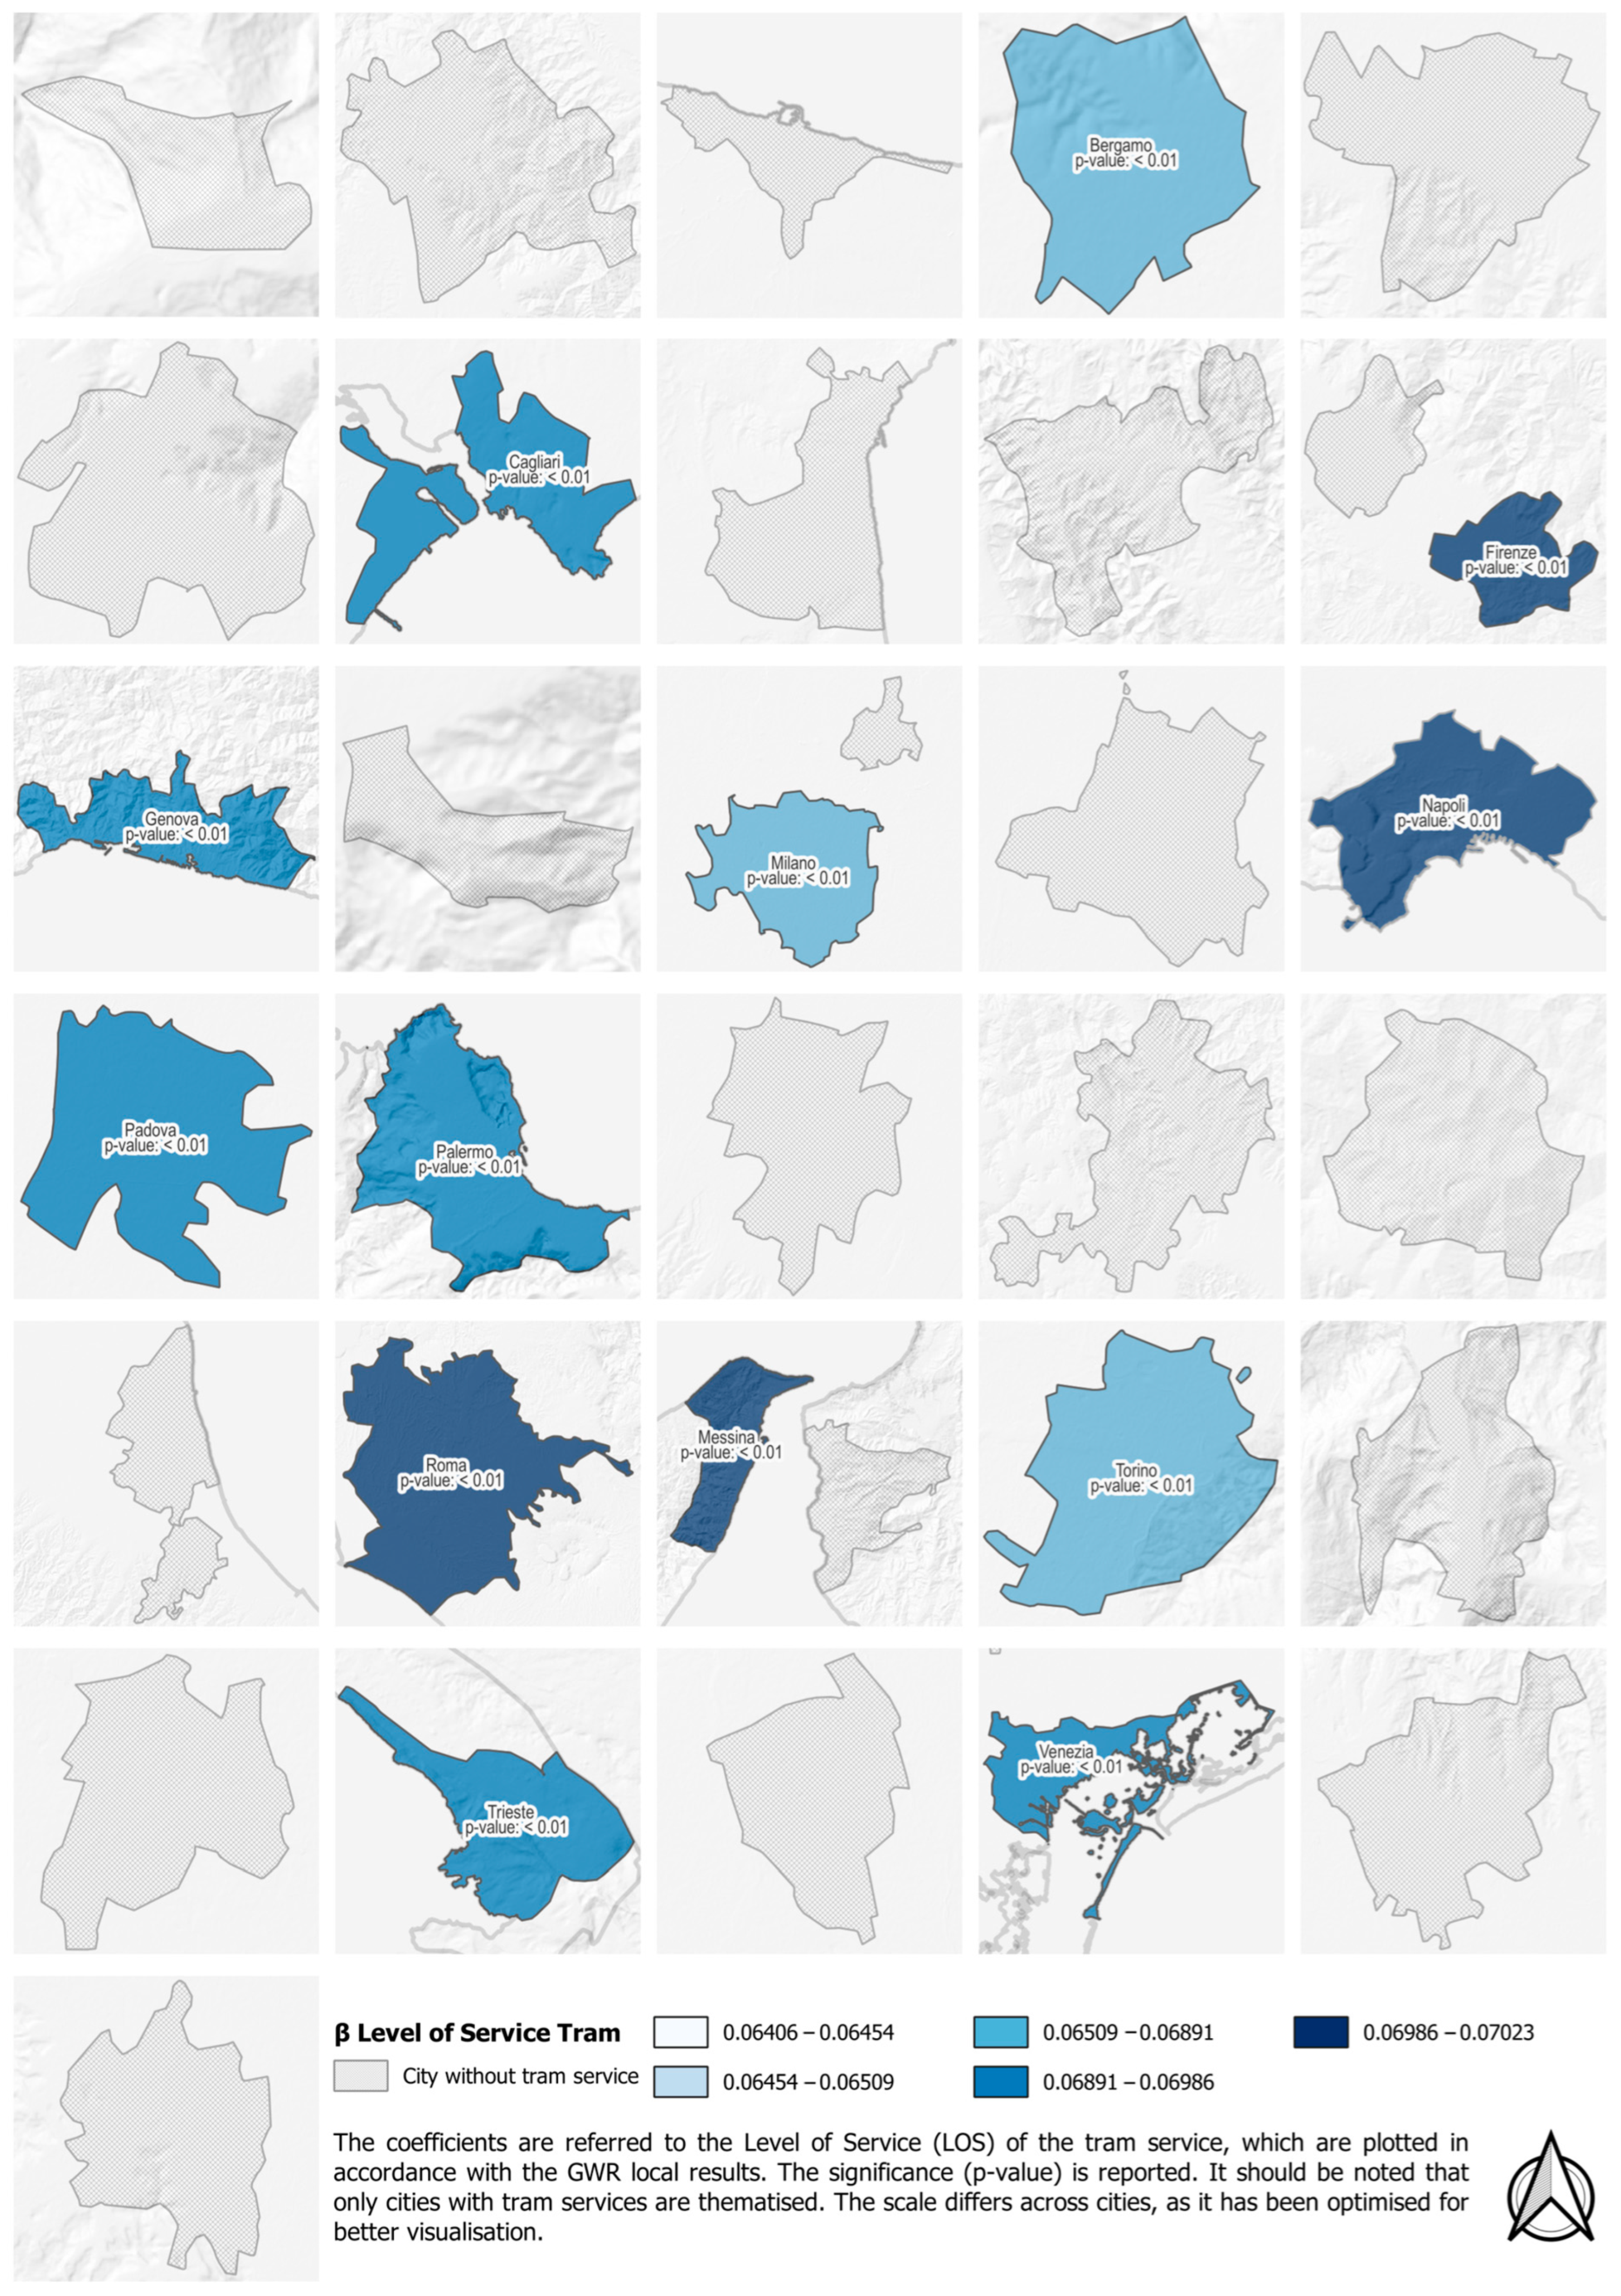
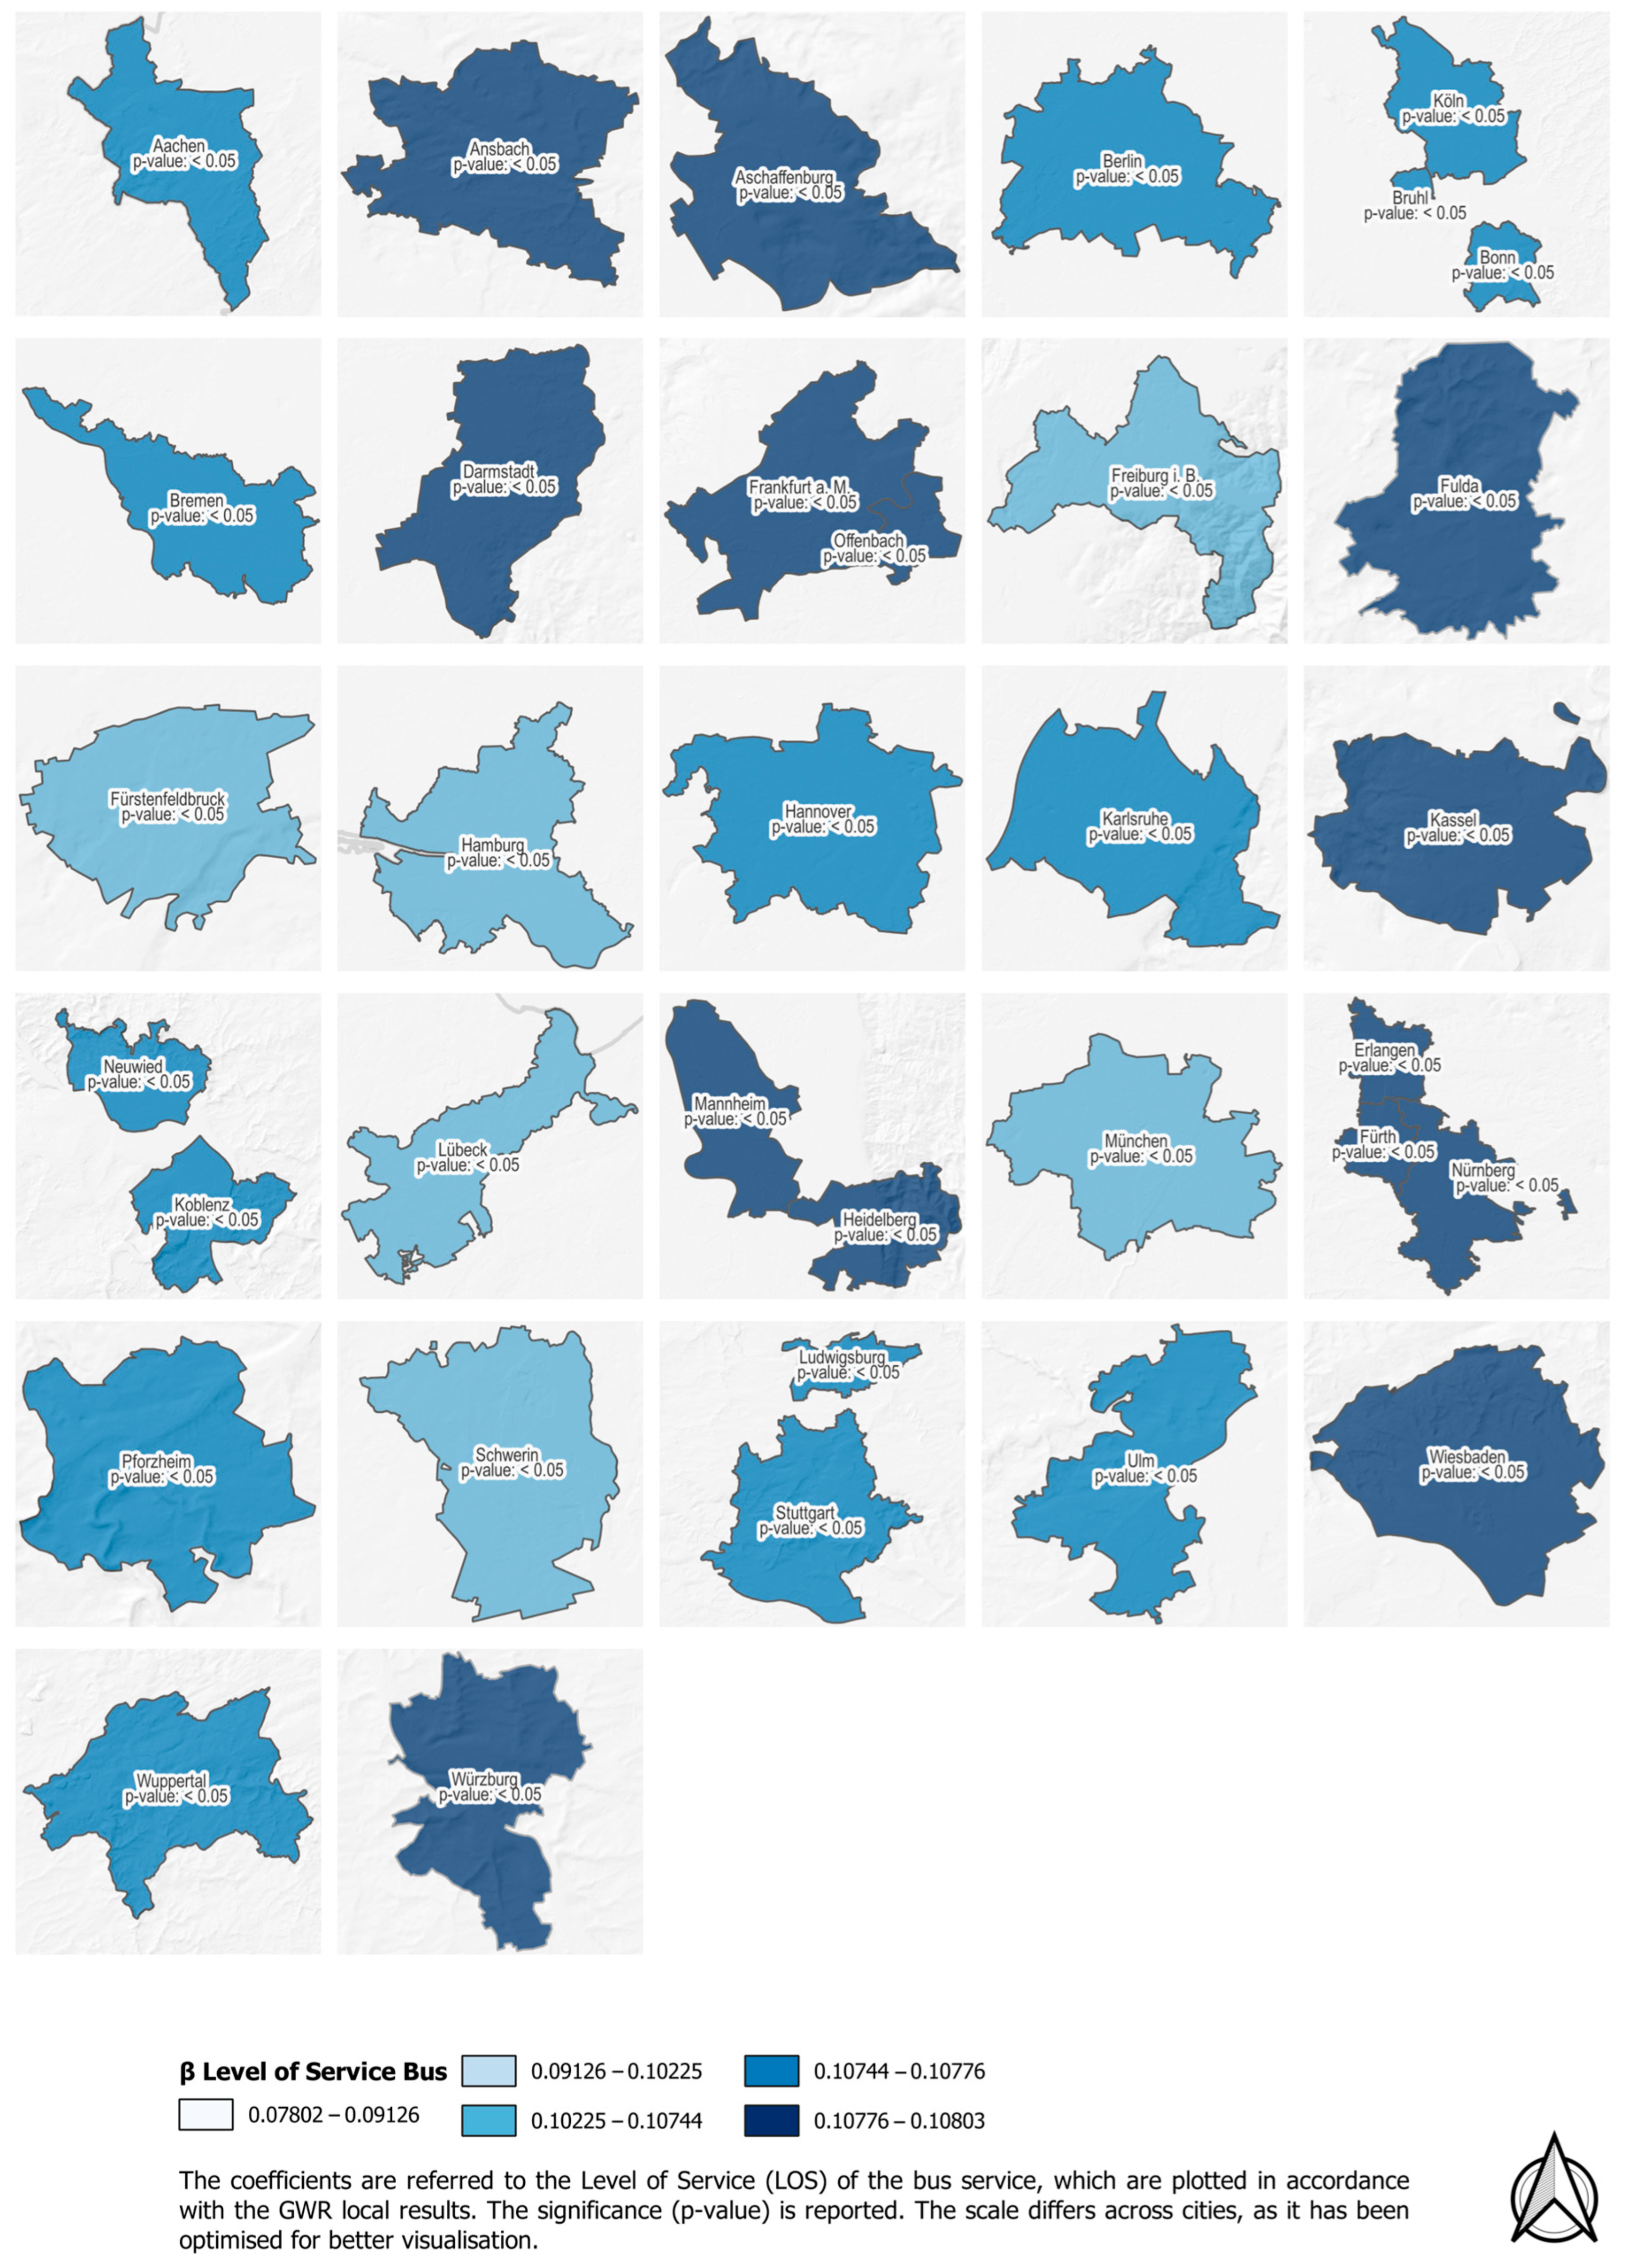
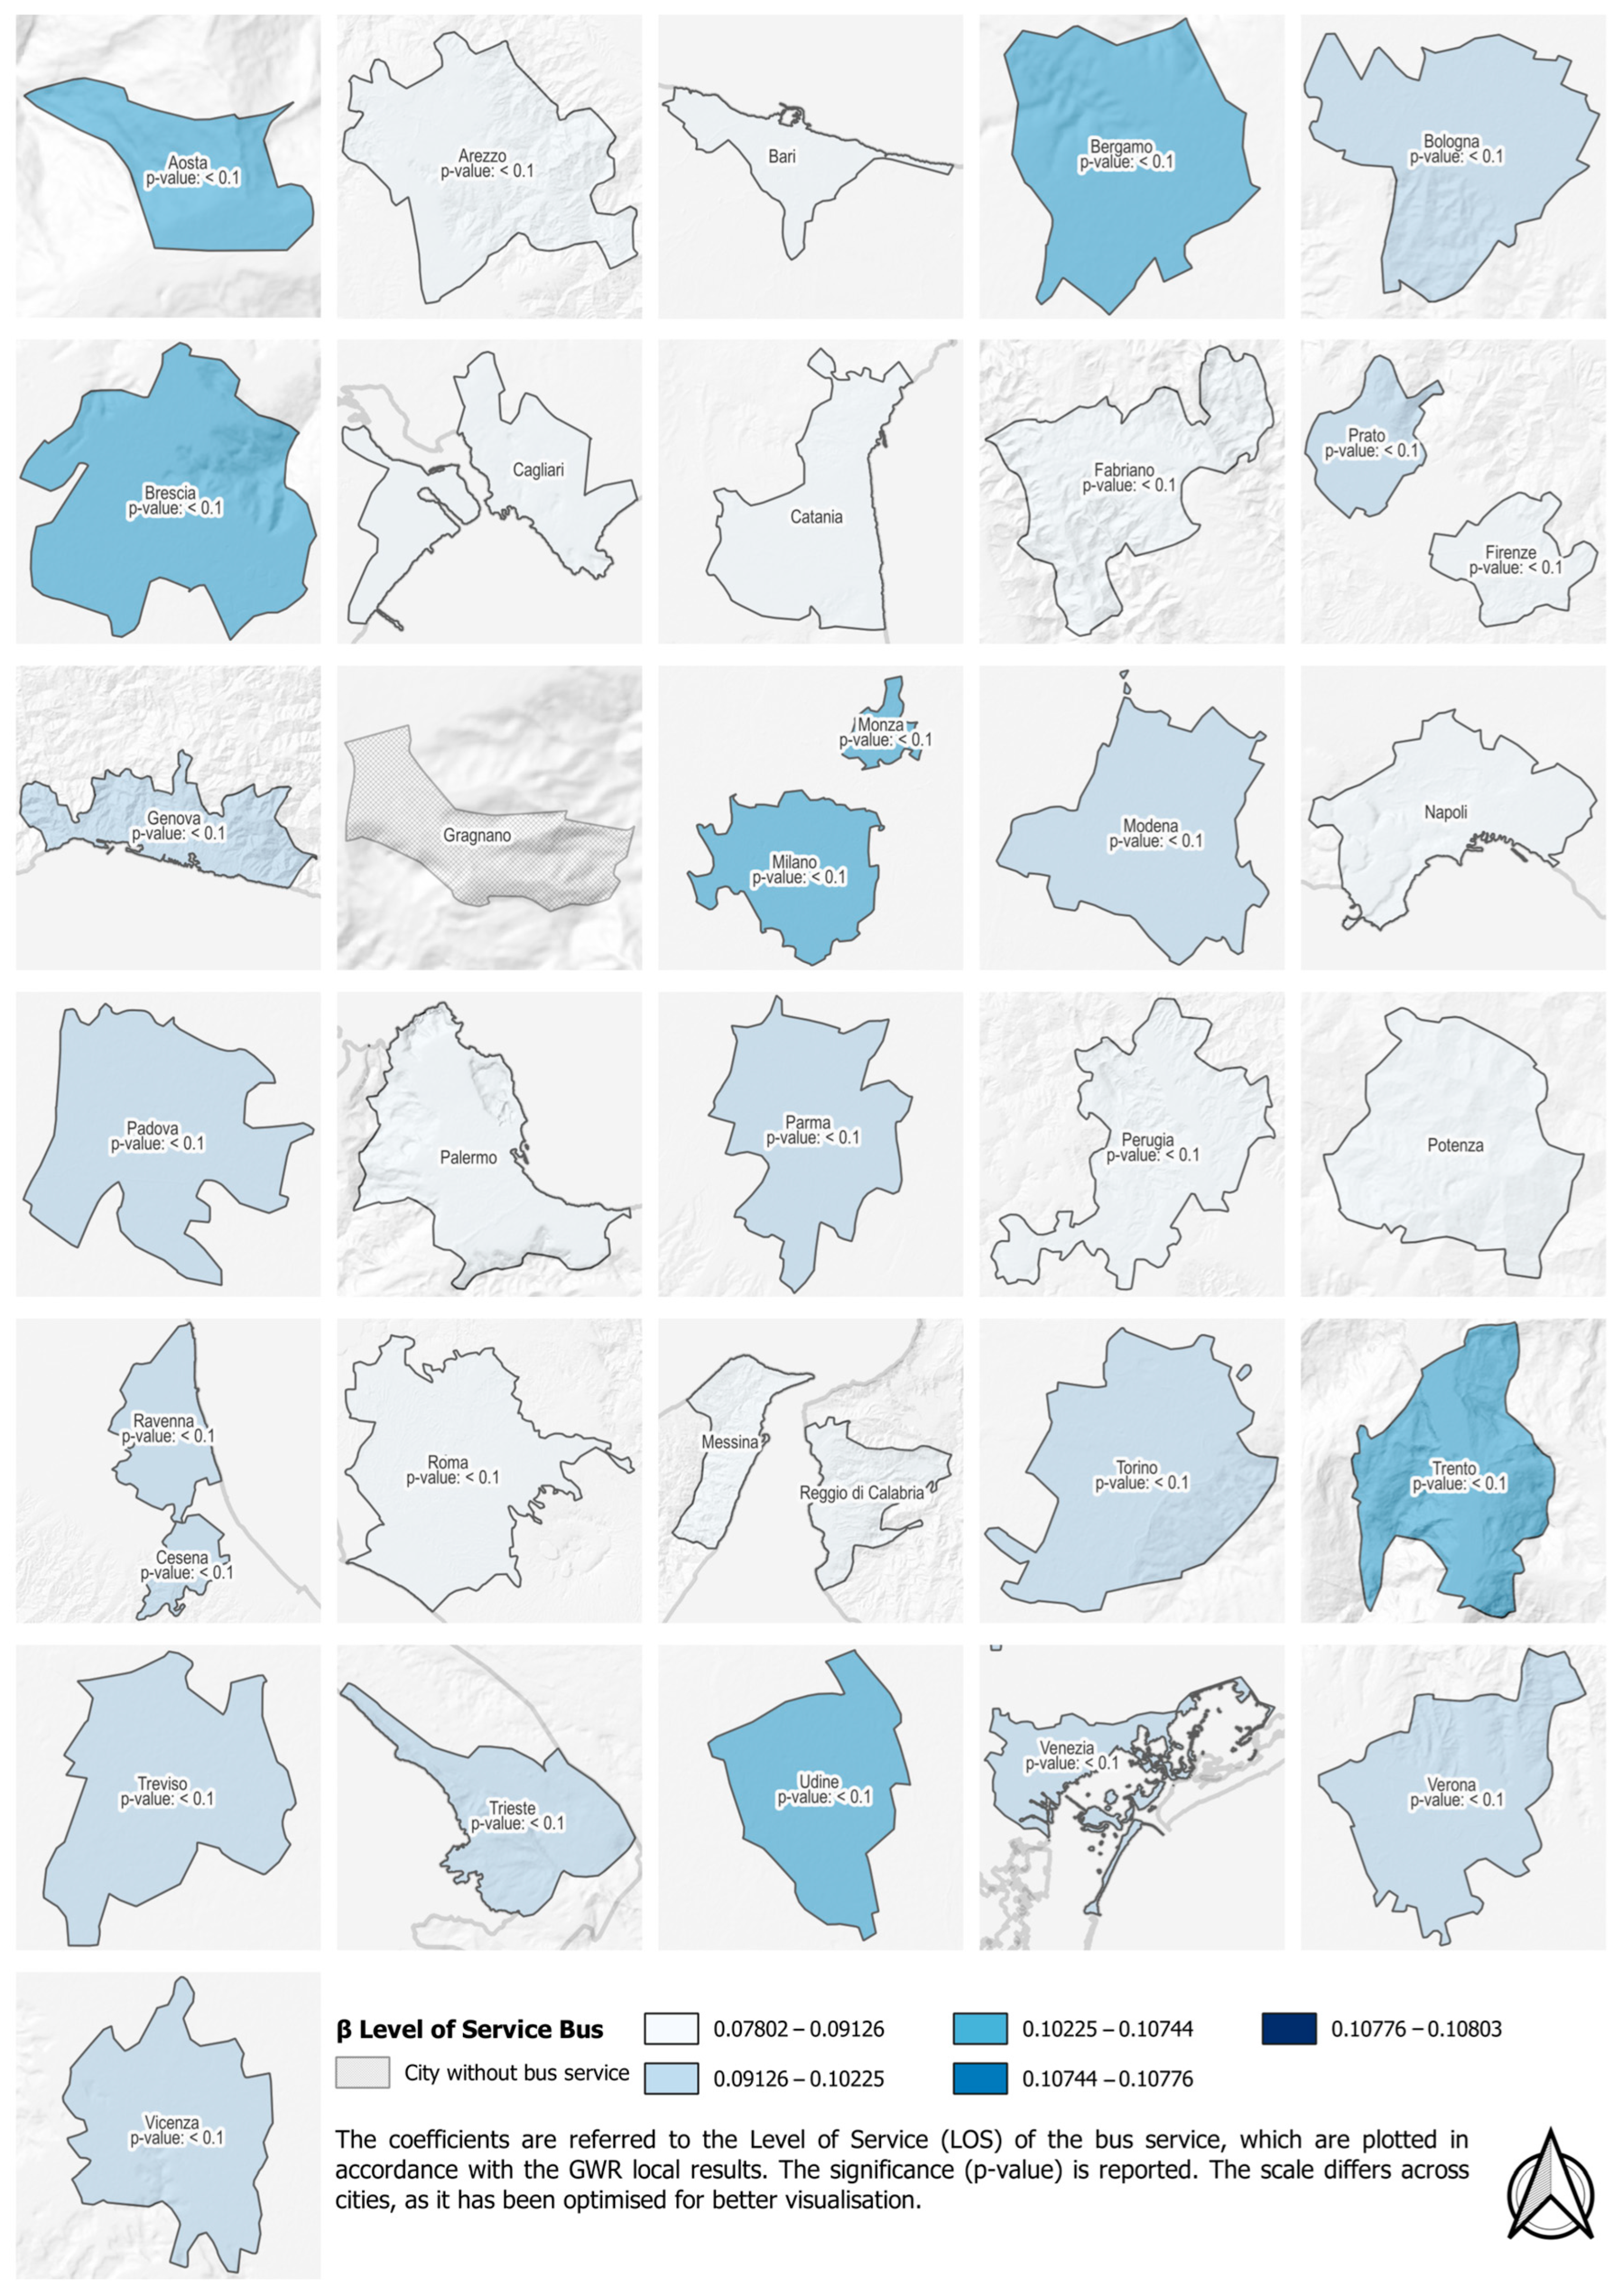
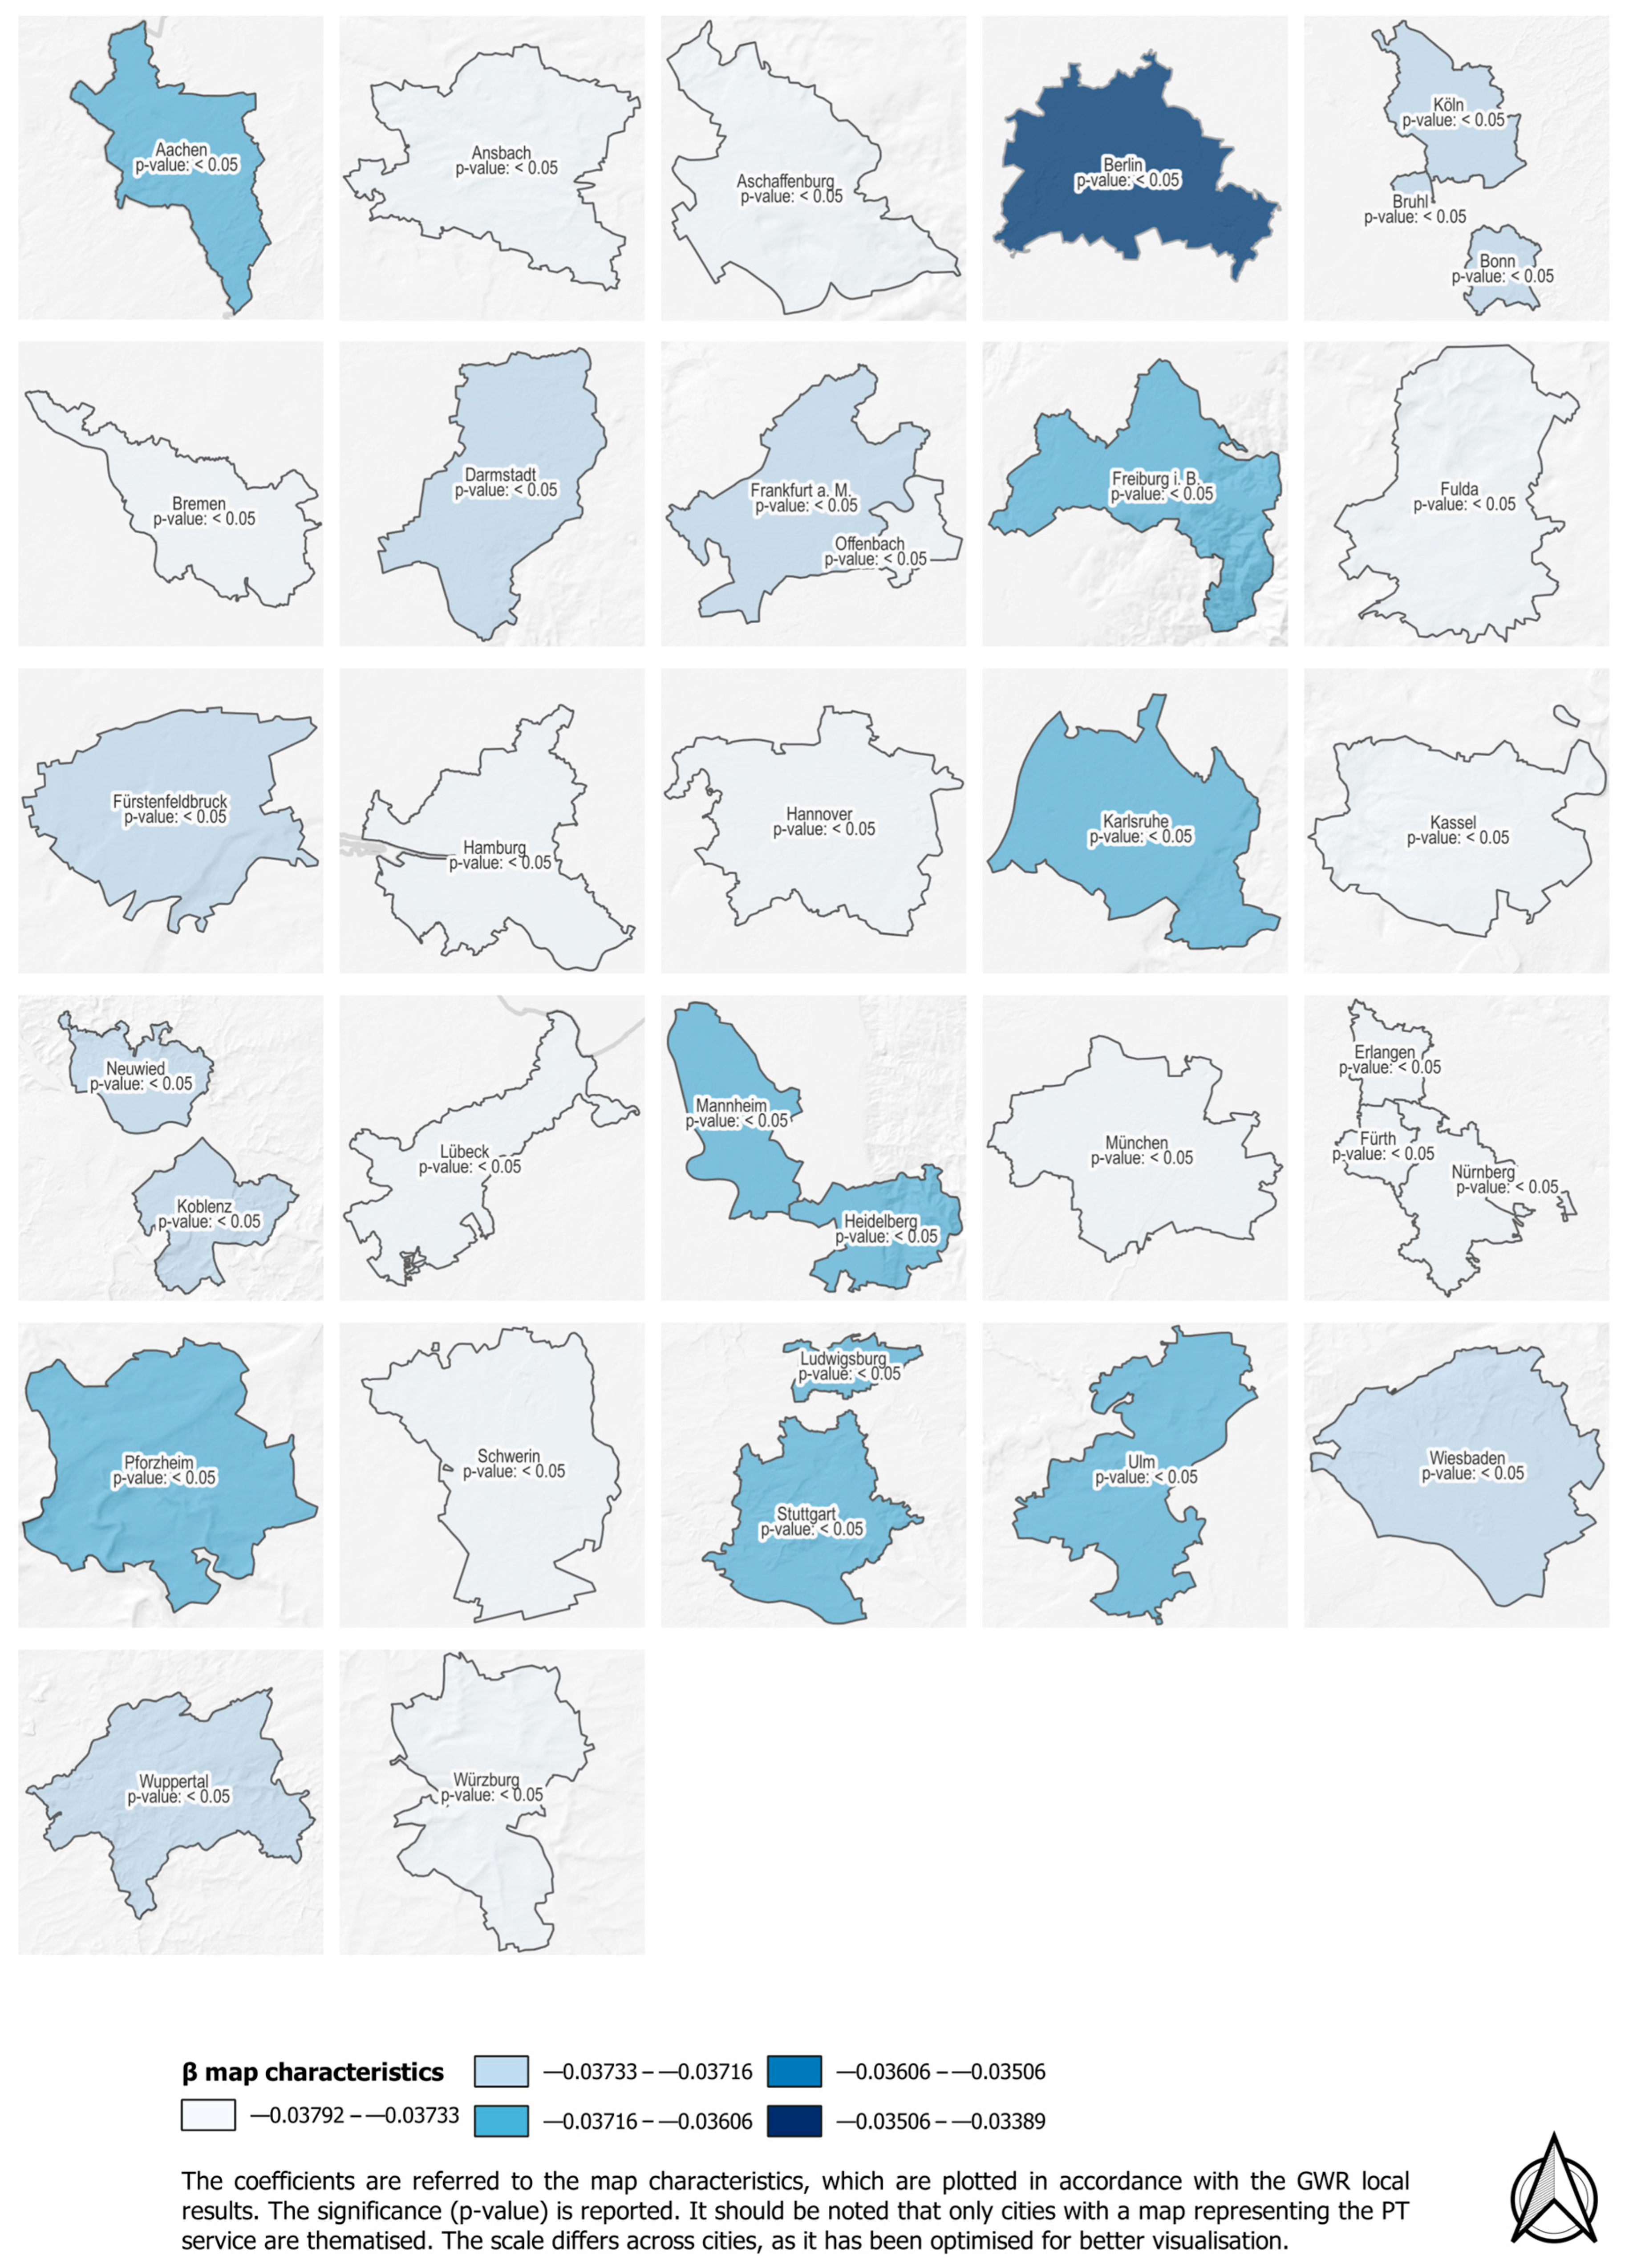
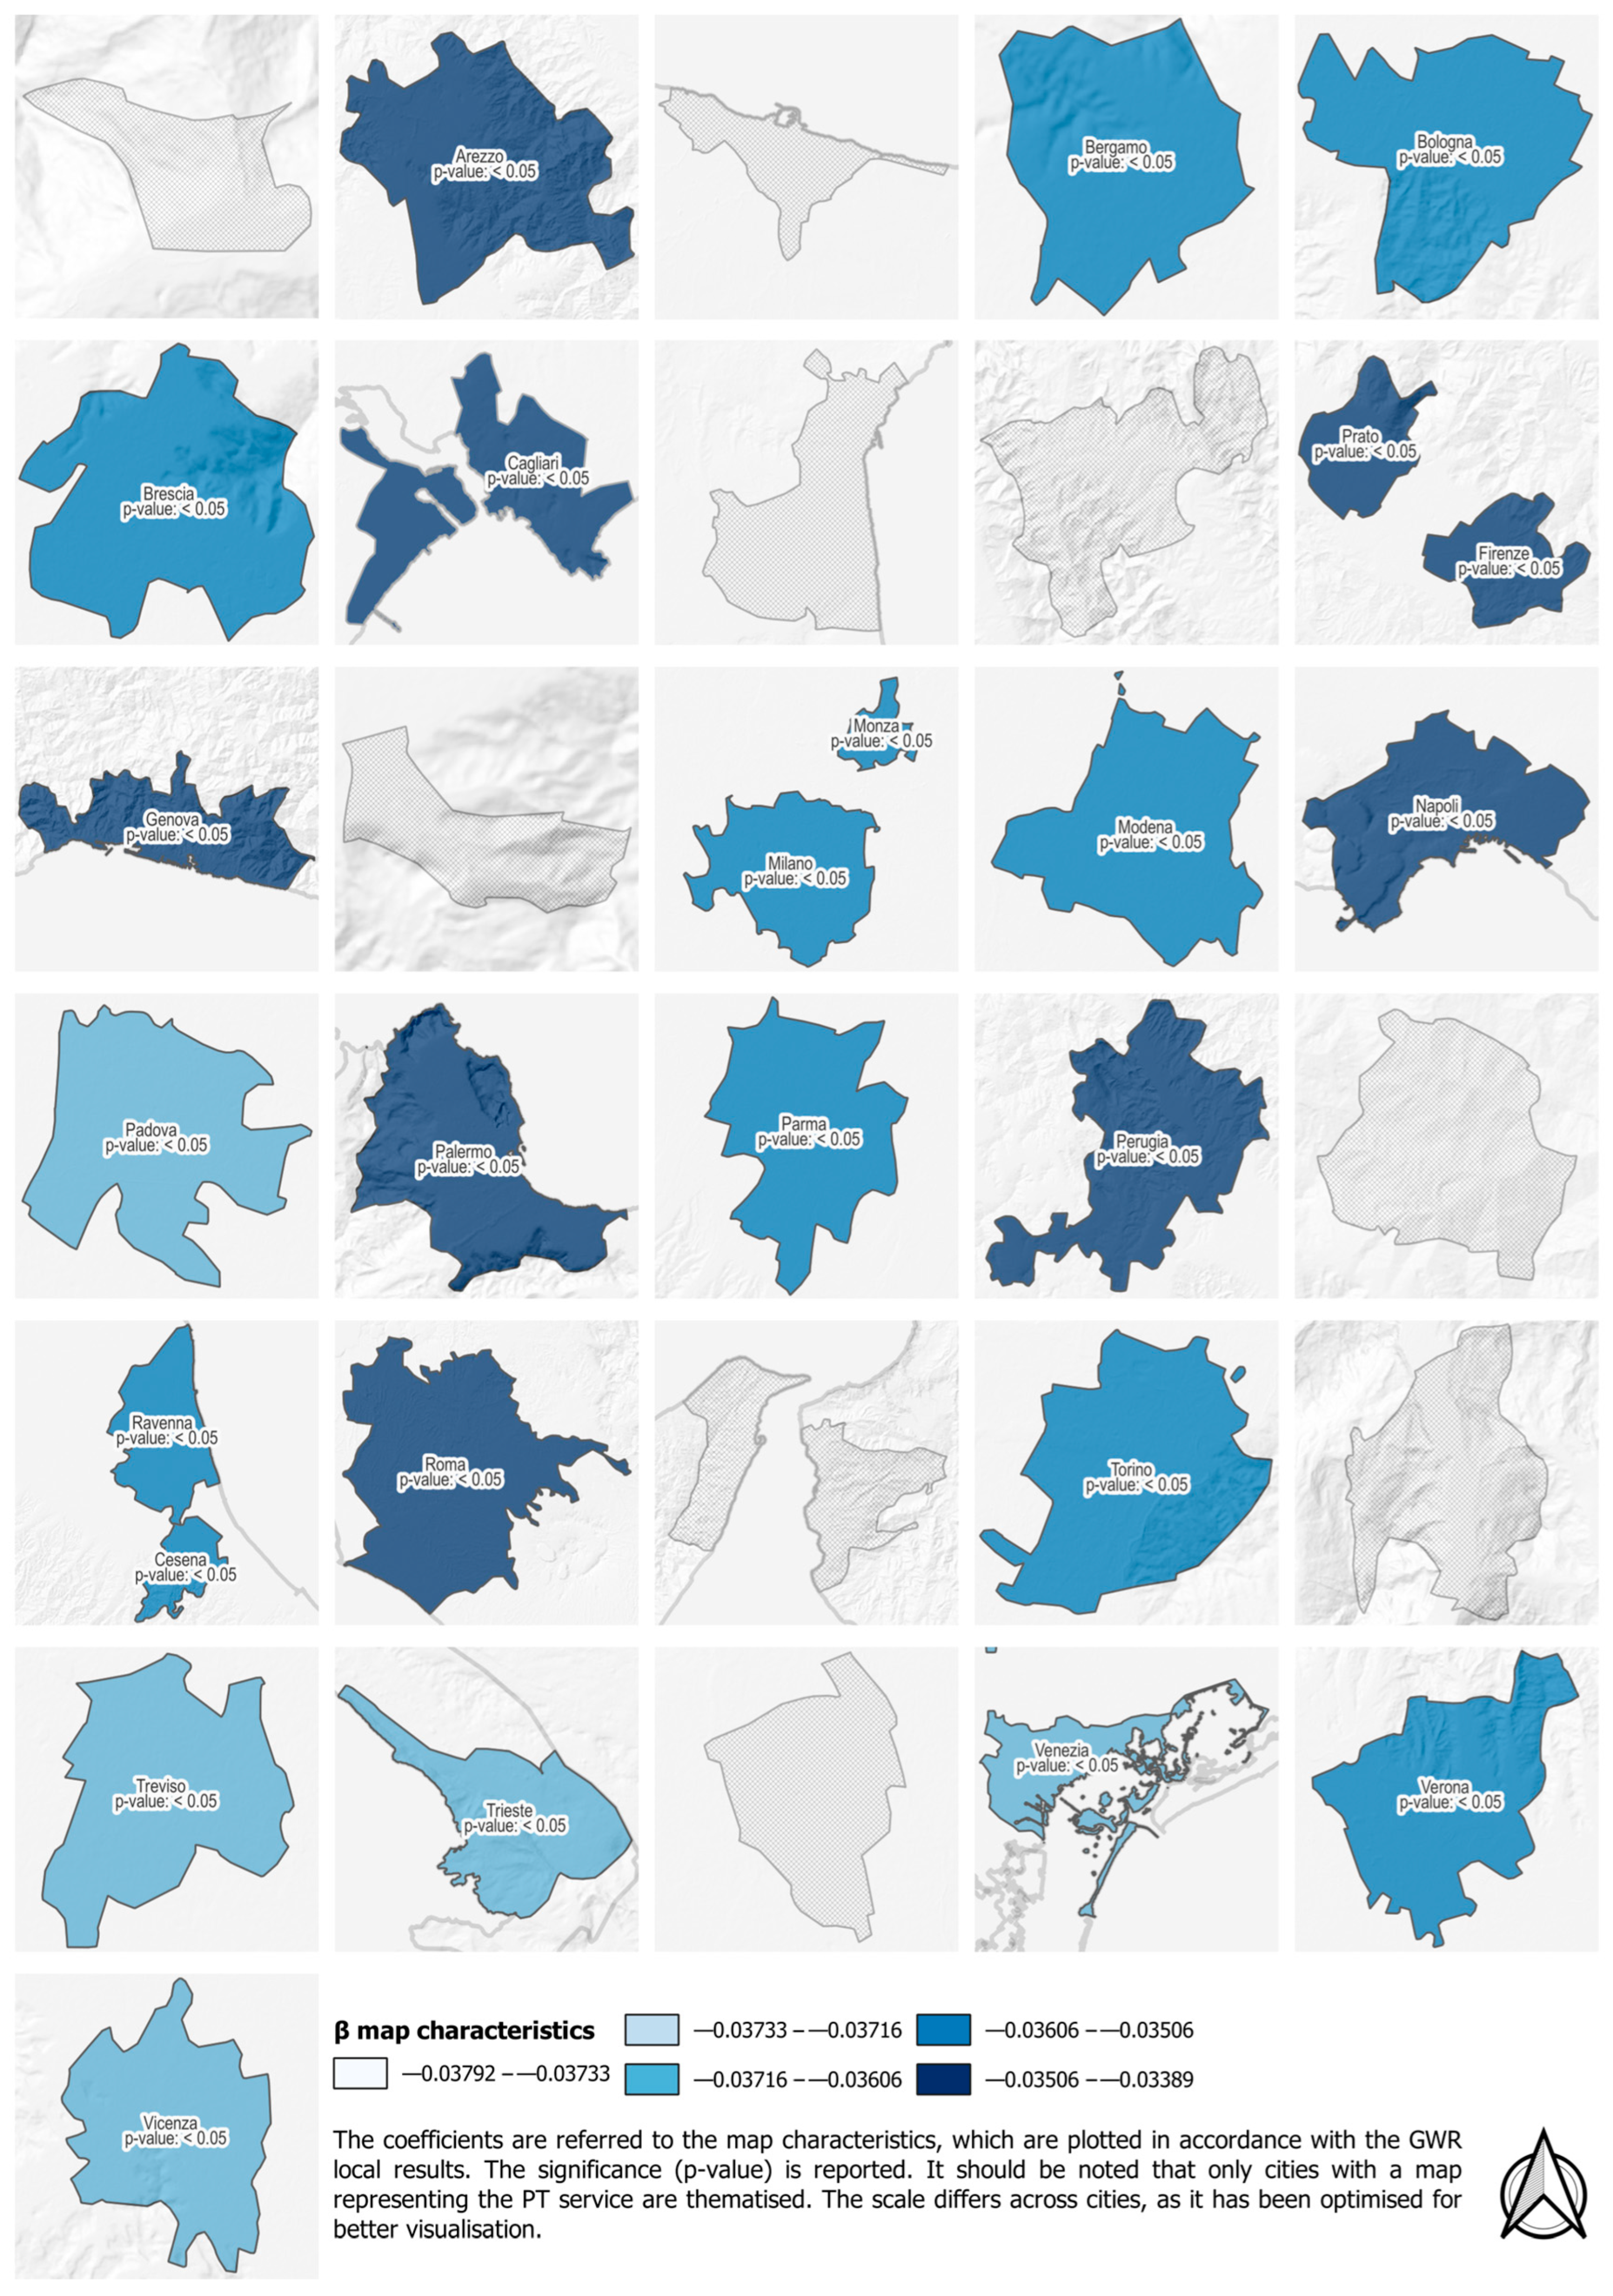
Figure 2. In detail, the heatmap represents the coefficients from GWR, where the darker the colour, the higher the coefficient. The colour ramp is related to each factor. The black outline represents the statistical significance (
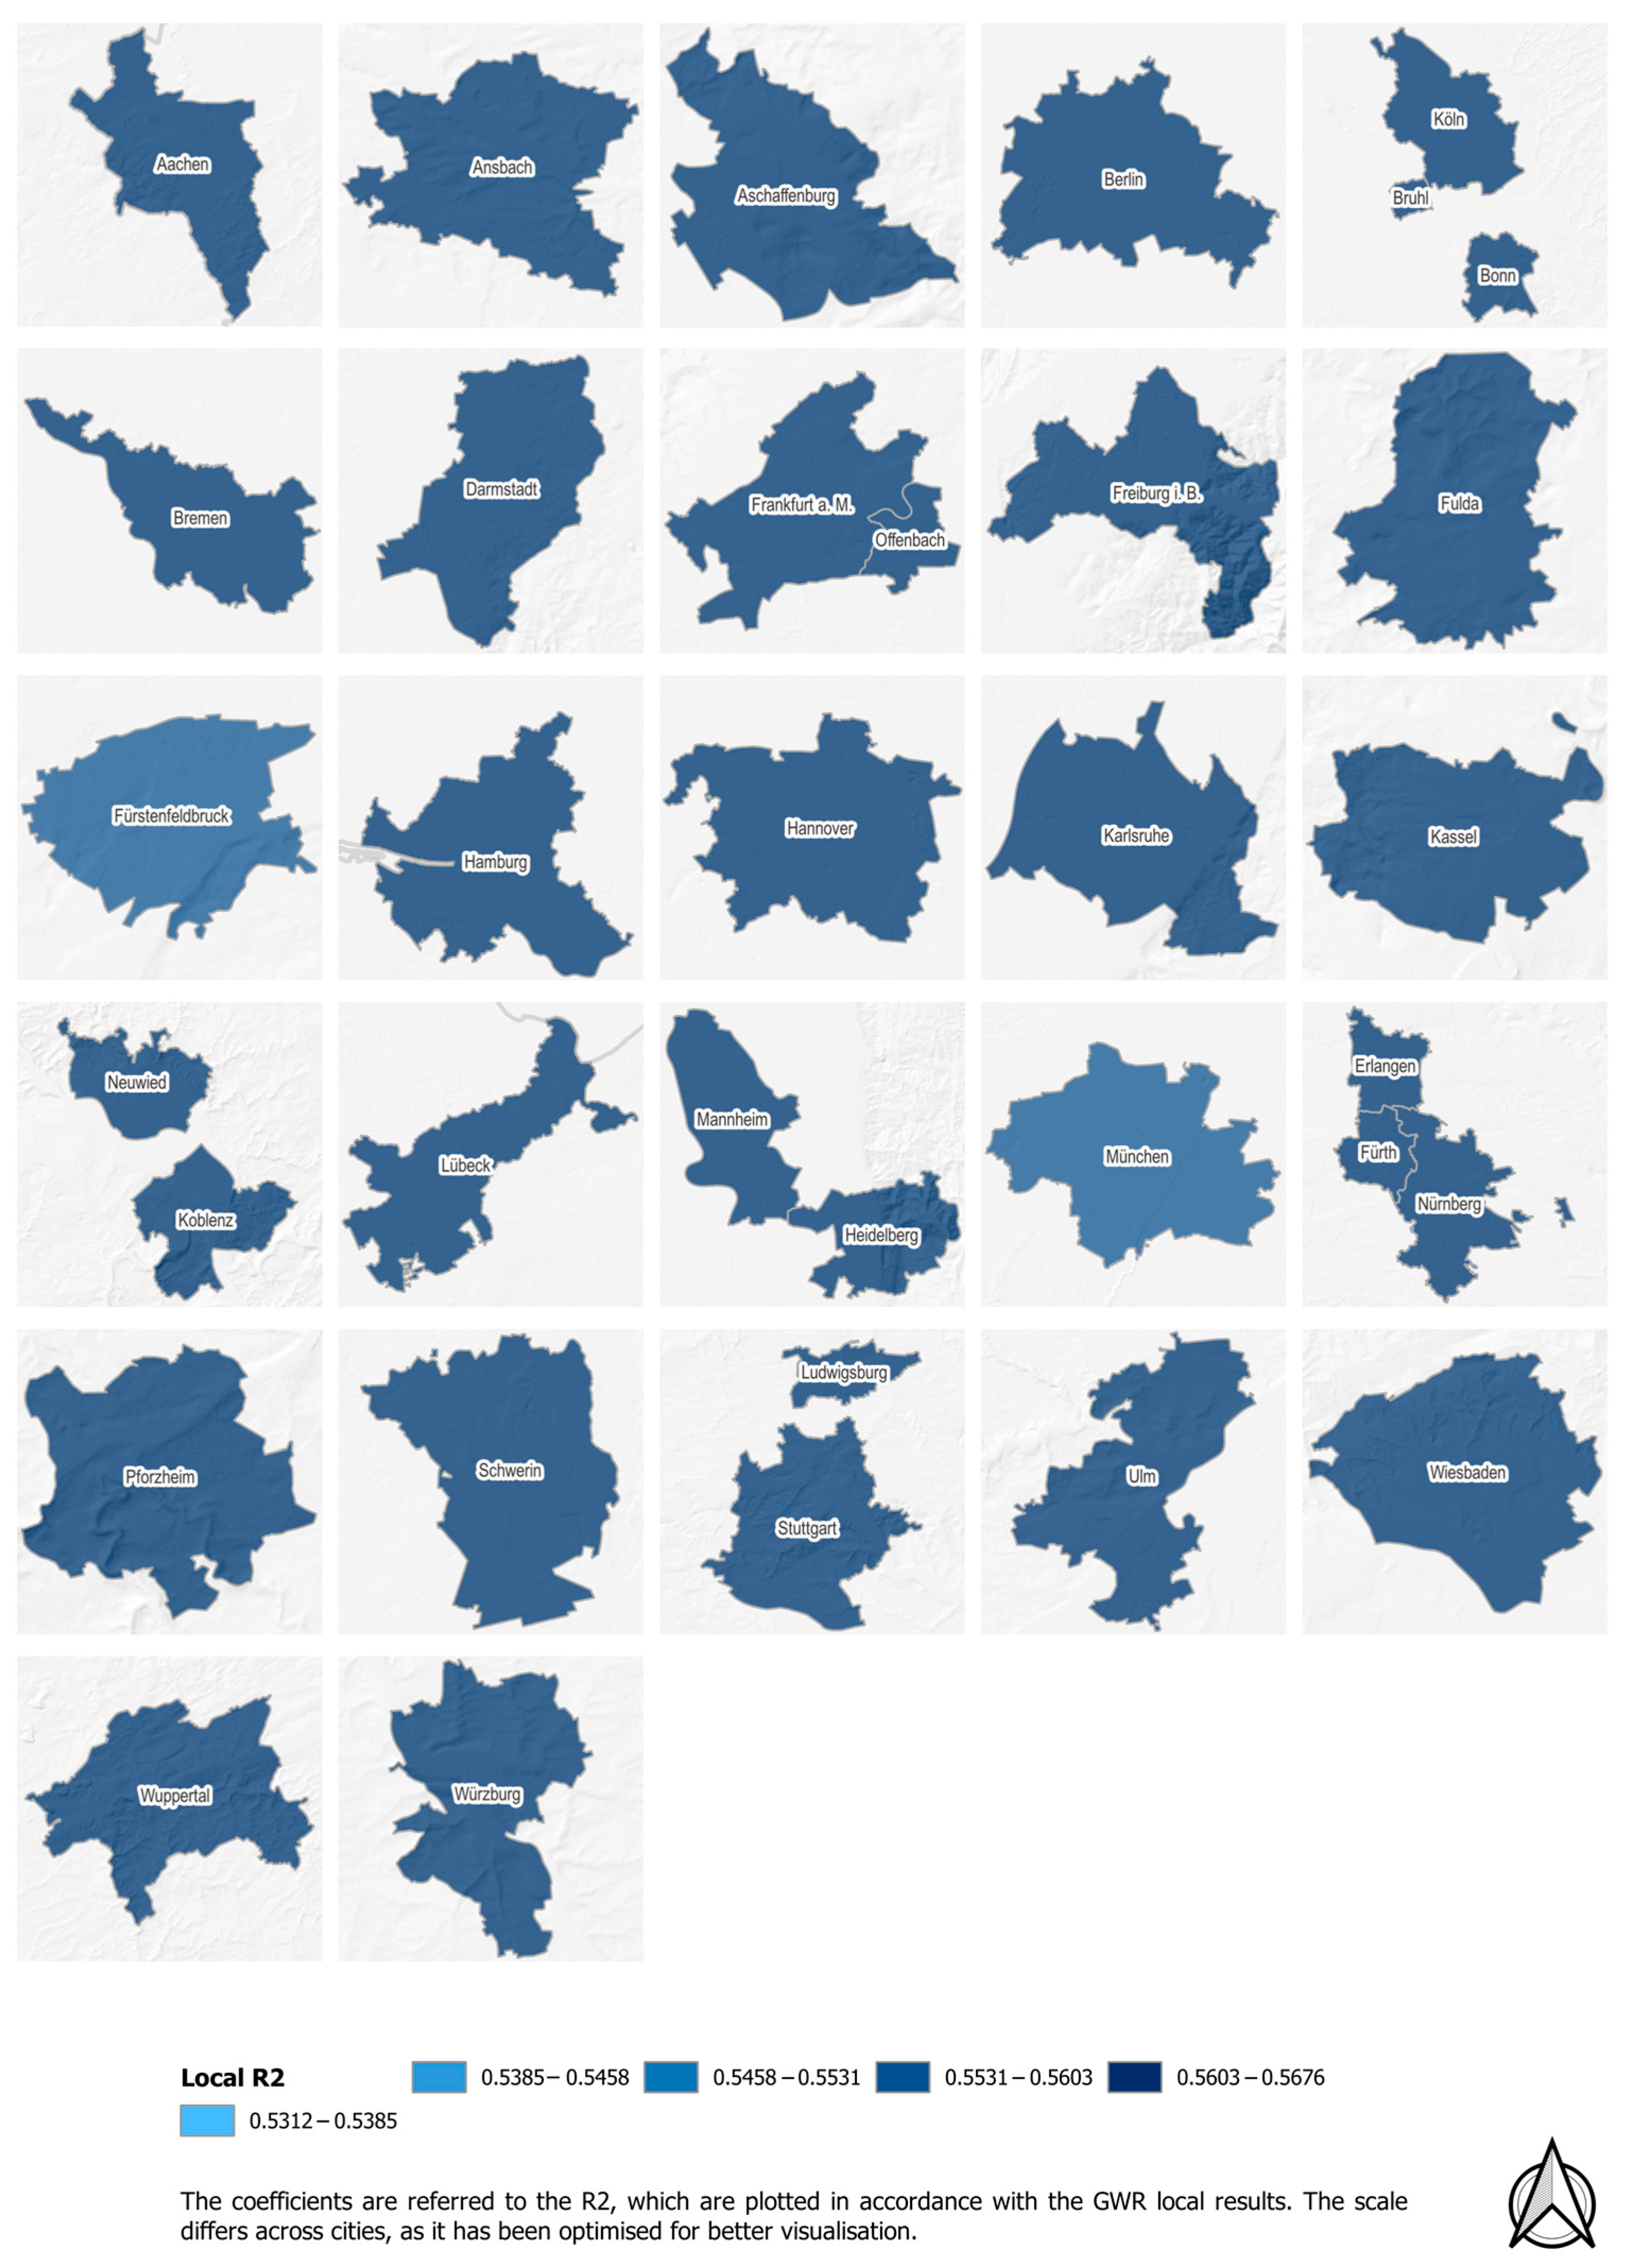
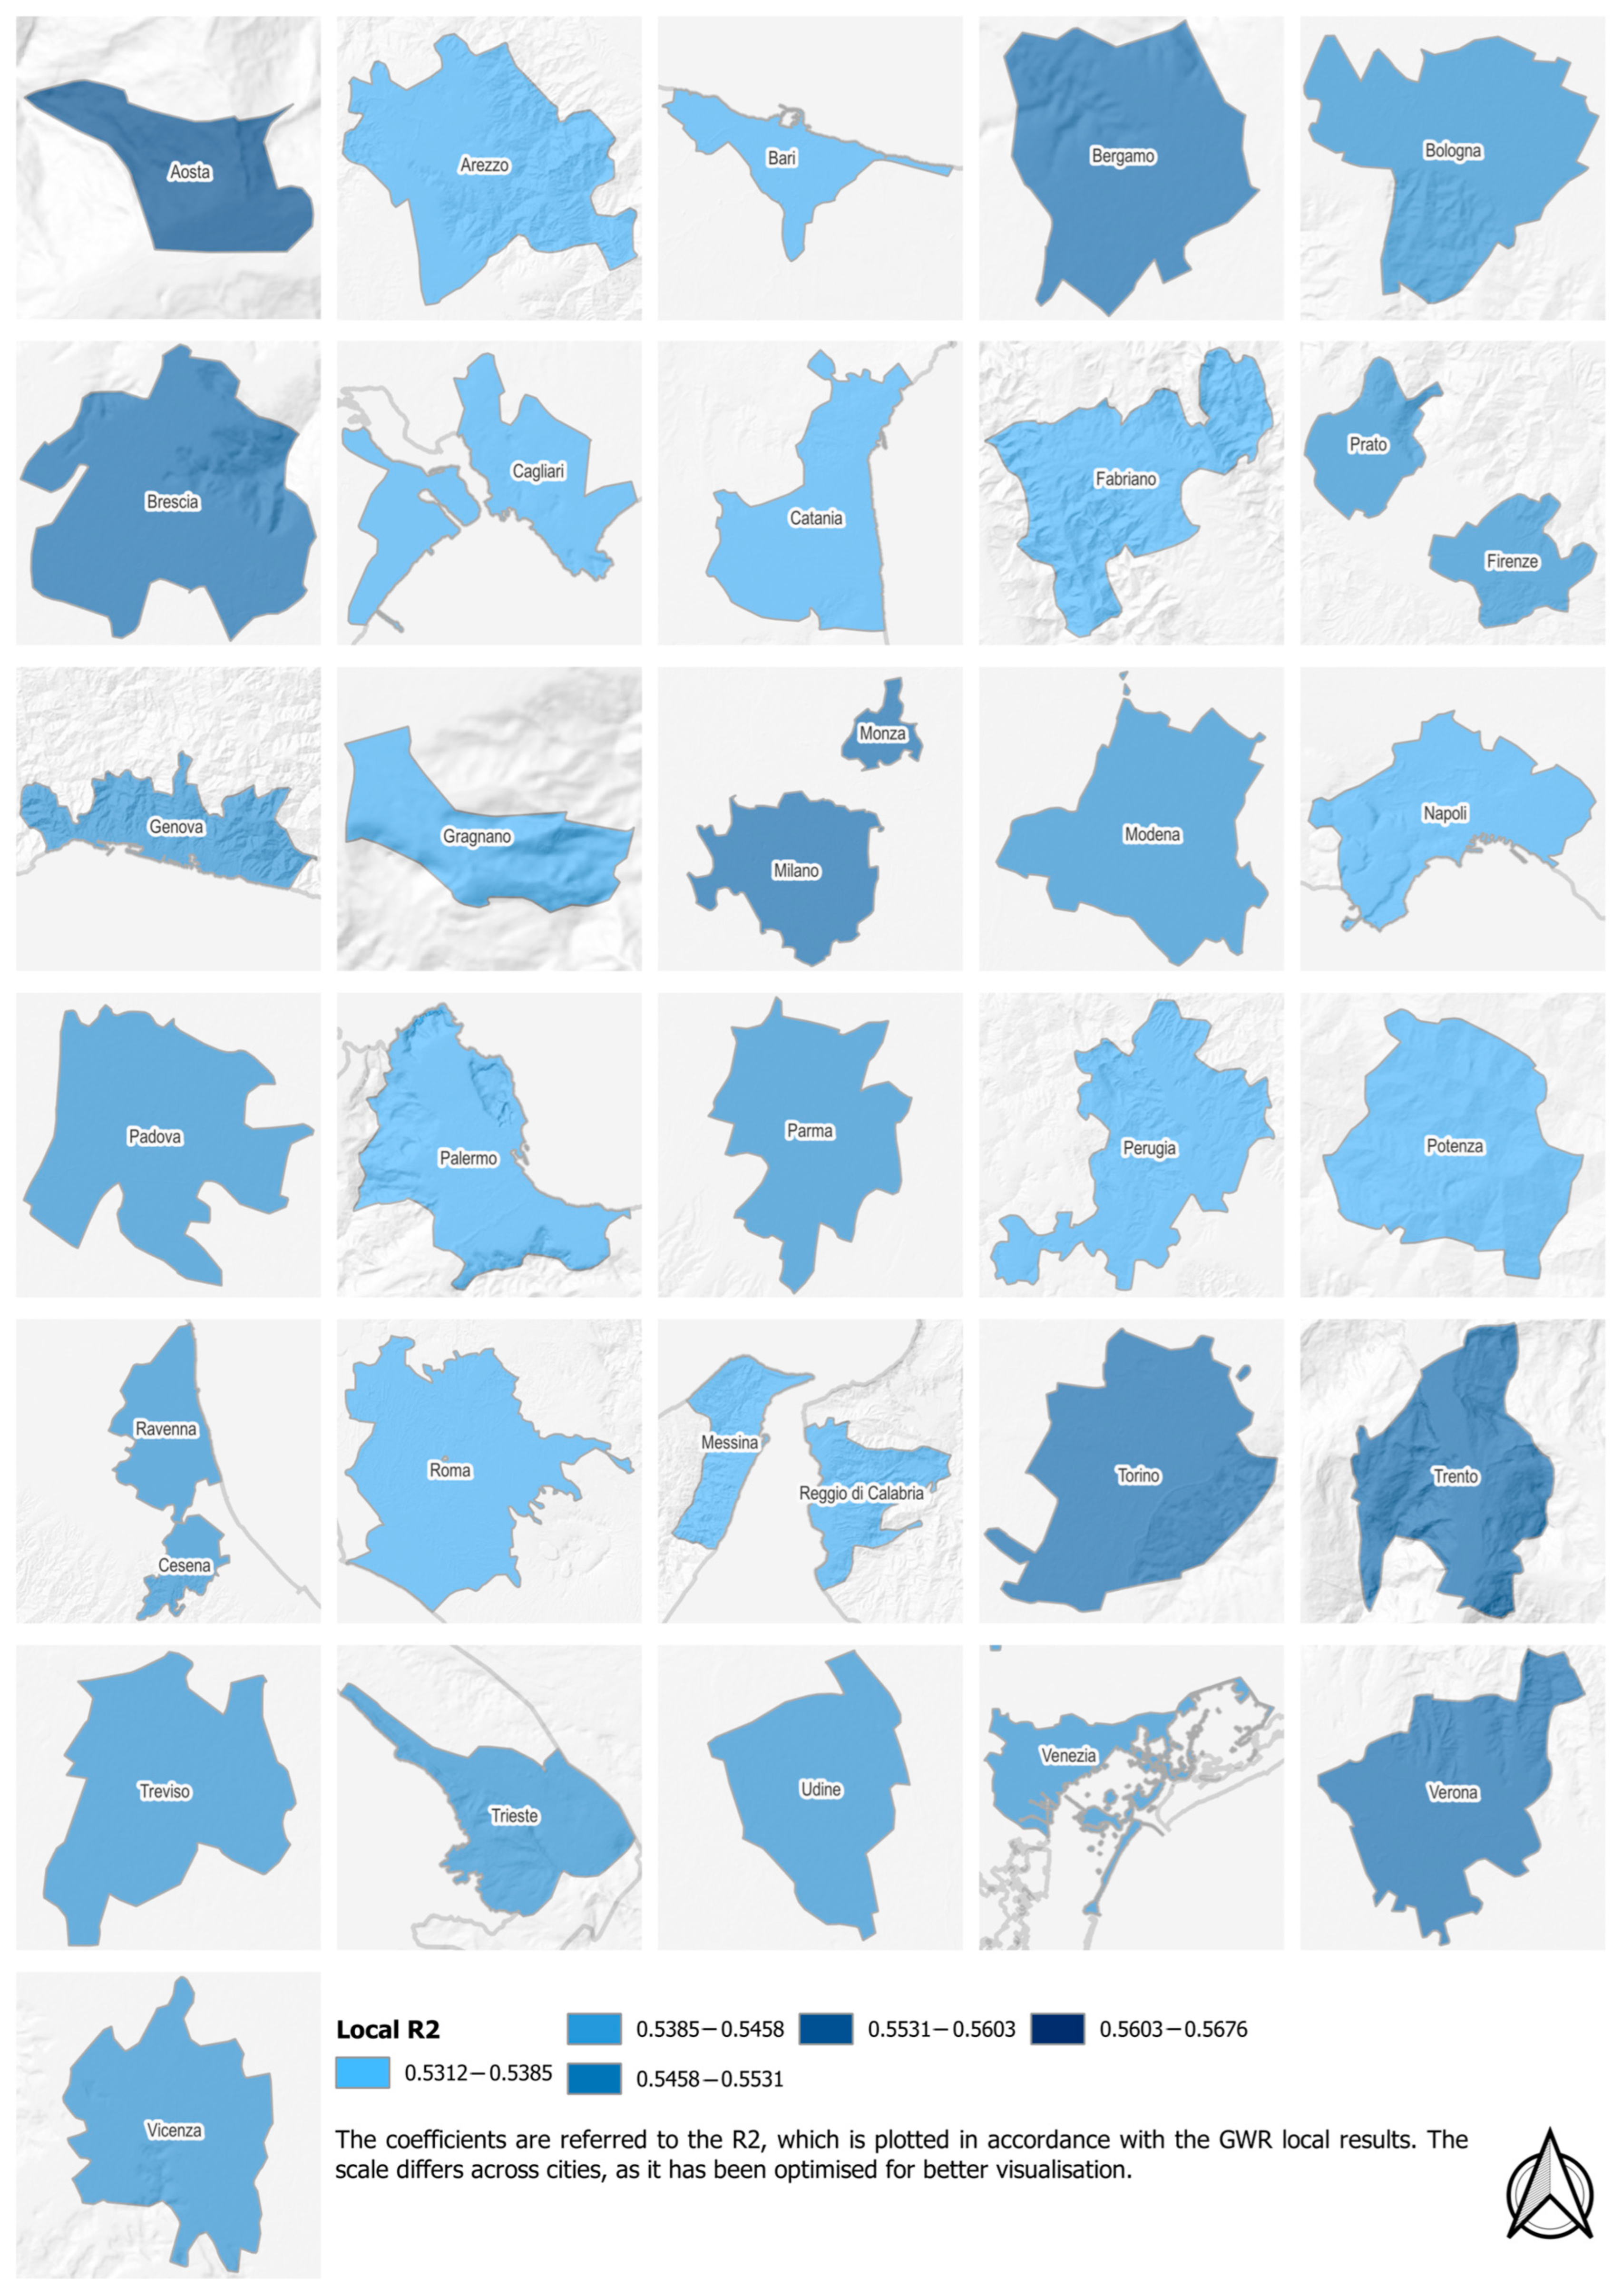
p-value < 0.10 or lower). Cities lacking one or more factors are adequately thematized and represented.
Appendix A provides the single cities plotted in accordance with the results of GWR.
With regard to the LoS, they should be examined together, as the investigated modes can be components of networks with different degrees of integration. Concerning the coefficients, the results of GWR suggest that an increase in the LoS (namely, the reduction in the average waiting time at the stop or station) may substantially increase the share of PT. In general, rail-based modes exhibit higher values in Italian cities, while coefficients related to bus services are higher in Germany. Although this may appear counterintuitive, as rail-based modes are more developed in Germany than in Italy [
10,
85,
86], this is interpreted as an outcome worthy of further attention. Indeed, in cities supplied by dense transit networks, users may have access to multiple alternatives for their trips. In contrast, networks with lower connectivity afford only few reasonable travel alternatives, thereby determining fewer socio-economic opportunities [
87,
88]. In these terms, the LoS related to buses advocates for the allocation of additional resources by public authorities to areas characterized by limited or restricted accessibility, given that inadequate PT provision has the potential to impede accessibility for users, thereby amplifying socio-economic disparities [
68,
89]. It is worth noting that buses are the backbone of several networks in mid-sized or small cities in Germany and Italy, as well as in several major Italian cities, while they are feeders to rail-based modes of transport in the other cases (e.g., Mannheim and Milano). In this latter instance, buses supply neighbourhoods lacking rail-based modes of transport, thereby creating integrated systems. Furthermore, model outcomes may suggest the determinant role of plurality and combination of transit modes in providing effective travel solutions, allowing users to choose between different options. This is also confirmed by the number of rail-based lines and the density of stations of these modes, both of them being higher in German cities (see
Appendix A). Conversely, few Italian cities have dense networks of rail-based modes of transport, while the majority is supplied by single trunk lines covering the most populated neighbourhoods.
With regard to the factors related to fare integration and regularity, the results are worthy of great attention. Remarkably, despite the positive signs of the coefficients being consistent with expectations, none of coefficients of GWR related to the regularity were found to be significant (
p-value > 0.10), confirming the results of MLR, while fare integration was found significant in GWR and non-significant in MLR. The outcomes drive further discussions, as local coefficients in
Figure 2 suggest that this latter characteristic may have a substantial effect in informing the users’ predisposition towards collective means of transport. One potential explanation is the operationalization of the factors in dummy variables, which may have influenced the results. In addition, regularity has been examined predominantly within the framework of interurban rail connections [
90,
91,
92,
93], rather than in urban PT. While railway networks can be regarded as a closed system, the latter is more complex to model due to the presence of several PT modes and external disturbances. Regarding fare integration, all local coefficients > 0, thus indicating that the implementation of an integrated fare system may result in an increase in the share of PT ~2.5%. Nevertheless, results should be considered in a broader perspective, as fare integration is usually a policy related to PT substantiated with different degrees of implementation and at different scales. In several contexts, the degree of commuting and the socio-economic interrelations between adjacent areas are recognized and defined in the form of, e.g., functional urban areas (FUAs) [
94], thus encouraging public authorities to set transport associations that provide integrated transit systems. Pucher and Kurth [
95] reviewed the effects on ridership after the introduction in the 1960s in the Germanophone countries (Germany, Austria and Switzerland) of the so-called ‘Verkehrsverbund’, the German term for transport association. They acknowledged that fare integration plays a pivotal role among other factors, including coordination between services. The success of this policy in these countries is facilitated by coordination among stakeholders [
18,
34] in most of the planning stages [
65,
96] of PT. Conversely, apart from a few previous research efforts [
16], there is a notable lack of comprehensive analyses related to the Italian context. In this regard, while results related to Germany corroborate the previous findings, the spectrum of cities examined provides novel insights about the role of fare integration in Italy.
With regard to LUM, given that this factor belongs to a domain with some previous contributions [
8,
79,
97], the positive sign of all the coefficients confirms the role of mixture in land use in determining the share of PT. On the other hand, as LUM integrates the functions within the city boundaries, the results postulate the importance of the density as a determining factor for an efficient and effective PT service [
70], e.g., impacting on the accessibility of a given city or neighbourhood [
71] and on traffic congestion [
97].
While the previous factors represent material elements of MC, map characteristics can be considered among the symbolic and intangible elements. All the coefficients resulted negative, suggesting that higher complexity in the representation may negatively impact on the modal predisposition towards PT. Widening the gaze, the model outcomes may be corroborated by the users’ own cognitive maps and the distortions in representing the space by a bidimensional medium [
98,
99,
100], especially when it includes several design features [
19,
80]. Indeed, the relationships between the graphic elements on the users’ perception and their effects on the usability of maps have been demonstrated in previous studies, e.g., [
81,
101,
102]. This finding may be interpreted in two ways. Firstly, it emphasizes the necessity for adequate representation of PT, particularly in contexts where the transportation network incorporates multiple modes or companies. Secondly, although further in-depth analyses are required, it may imply that frequent and non-frequent users may perceive the PT characteristics differently. For example, a complex representation may hinder the awareness of intermodal hubs, the number of stops serving a specific destination or neighbourhood or the coverage of the service. Notwithstanding the fact that this concern may be partially addressed by web navigation services and platforms, which facilitate the creation of customized origin–destination travel solutions for users, the inadequate representation of the PT supply persists as an unresolved challenge for agencies and authorities. Furthermore, as the analysed cities are supplied by transit differently, additional considerations are proposed. In particular, the interaction between maps and modal share may be influenced by the number of available collective modal options, e.g., in cities with a single operative PT mode (e.g., Aachen, Fulda, Lübeck, Arezzo, Potenza and Ravenna). Conversely, results related to the ‘multimodal’ cities are insightful, as they suggest that simpler representations of transit services may positively impact on the share of PT. These considerations are also worthy of great attention for graphic designers, as transit maps should guarantee adequate usability [
103,
104,
105]. In addition, users’ feedback after planning a trip based on these representations of the PT network has been found correlated with the characteristics of the maps [
106,
107,
108].
5. Conclusions
The objective of this research was to enhance the comprehension of urban mobility culture (MC) and its impact on the users’ predisposition toward public transportation (PT). The primary novelty of this research was to extend the MC framework by incorporating additional factors, namely fare integration, level of service (LoS) of collective modes, regularity of schedules and the configuration of PT network maps, and testing the land use mix (LUM) as measure of the spatial context where the local PT service operates. These factors were then analysed through geographically weighted regression (GWR), facilitating a more detailed examination of the local effects. This constituted an additional original contribution, given that the majority of the previous analyses on MC were undertaken at a global level, thereby hindering the acquisition of nuanced and context-related results. As part of this research, an analysis of 70 cities equally distributed between Germany and Italy was undertaken. According to the findings, LUM, LoS, fare integration and the characteristics of transit representations are significantly associated with the modal share of PT, though to different degrees, suggesting that they can be considered among the factors contributing to MC. Conversely, regularity was found not to be significant.
The results may drive to several conclusions related to MC that underlyingly inform users’ behaviours. Once the existence of relationships between a consistent transit system and the share of PT has been acknowledged, the appropriate casual relation should be determined. This may be considered a ‘chicken-and-egg’ problem of transportation research [
109,
110], i.e., whether certain local preconditions to collective modes influence the development of a dense transit system, or conversely whether the enhancement of a transit system informs users’ preferences toward collective modes. What can be postulated from the results is that the implementation of an integrated fare system, the densification and diversification of function in urban areas and frequent services, along with a simplified representation of the PT network, may play an essential role in establishing the awareness of PT as an affordable modal alternative. As consequence, the framework of MC can be extended by including additional factors, where the local peculiarities have been demonstrated to have a role in defining the predisposition of users towards PT. Factors are related to both material (i.e., the structure of the fare system and the quality of supply) and symbolic or intangible elements (i.e., an effective communicative policy, which can be materialized with the PT representations). With this latter regard, the selected factors can be easily tested in other contexts, as they represent some common feature of PT characteristics.
The abovementioned conclusions have been drawn based on the selected case studies, namely the sample of cities in Germany and Italy. Nevertheless, the proposed methodology, namely the use of GWR rather than MLR, the selection of factors and the outcomes of results are worthy of great attention and are aimed at providing insights at broader scale. While acknowledging the findings, the authors have identified some limitations to be addressed in forthcoming research. Firstly, the number of the analysed cities should be further developed. To this end, the introduction of additional eastern German and southern Italian cities may offer additional insights. Moreover, and in a broader perspective, the introduction of other cities from European or non-European countries may reinforce the generality of the results, thereby consolidating the derived insights. Furthermore, setting functional urban areas as the spatial reference rather than the cities at municipal level, as proposed by [
111], has the potential to enrich the depth of results. This is because commuting is a stable phenomenon, at least over the medium term [
112], meaning that users tend to select their preferred mode with adequate foresight. Following what has been discussed above, as a conclusive and general remark regarding regularity in scheduling, the results suggest that further research efforts may provide additional insights. Among others, the authors mention additional focuses on, e.g., more comprehensive measures able to capture the nuanced contextual characteristics, or the interaction between it and the other factors related to multimodality. This latter consideration is aligned with the underlying hypothesis that an integrated system positively informs users’ predisposition towards PT [
34].